DiDo Comparison - TNO...
42
Van Mourik Broekmanweg 6 2628 XE Delft P.O. Box 49 2600 AA Delft The Netherlands www.tno.nl T +31 88 866 30 00 F +31 88 866 30 10 TNO report TNO 2015 R11109 SRP Energy Transition – DiDo comparison with other energy models Date 23 January 2015 Author(s) Jasper Donker Tanneke Ouboter Copy no No. of copies Number of pages 42 (incl. appendices) Number of appendices Sponsor Project name SRP Energietransitie Project number 060.14452 All rights reserved. No part of this publication may be reproduced and/or published by print, photoprint, microfilm or any other means without the previous written consent of TNO. In case this report was drafted on instructions, the rights and obligations of contracting parties are subject to either the General Terms and Conditions for commissions to TNO, or the relevant agreement concluded between the contracting parties. Submitting the report for inspection to parties who have a direct interest is permitted. © 2015 TNO
Transcript of DiDo Comparison - TNO...
Van Mourik Broekmanweg 6 2628 XE Delft P.O. Box 49 2600 AA Delft The Netherlands www.tno.nl T +31 88 866 30 00 F +31 88 866 30 10
TNO report TNO 2015 R11109
SRP Energy Transition – DiDo comparison with other energy models
Date 23 January 2015 Author(s) Jasper Donker
Tanneke Ouboter
Copy no No. of copies Number of pages 42 (incl. appendices) Number of appendices Sponsor Project name SRP Energietransitie Project number 060.14452 All rights reserved. No part of this publication may be reproduced and/or published by print, photoprint, microfilm or any other means without the previous written consent of TNO. In case this report was drafted on instructions, the rights and obligations of contracting parties are subject to either the General Terms and Conditions for commissions to TNO, or the relevant agreement concluded between the contracting parties. Submitting the report for inspection to parties who have a direct interest is permitted. © 2015 TNO

TNO report | TNO 2015 R11109
SRP Energy Transition – DiDo comparison with other energy models TNO 2015 R11109
2 / 42
Contents
1 Introduction ...................................... ........................................................................ 3
1 Selection of models ............................... .................................................................. 4
1.1 Criteria ....................................................................................................................... 4
2 Models ............................................ .......................................................................... 5
2.1 Classification .............................................................................................................. 5
2.2 Description of models ................................................................................................ 6
3 Comparing models .................................. .............................................................. 21
3.1 Description of dimensions: ...................................................................................... 21
3.2 Dynamic versus static model ................................................................................... 22
3.3 Supply and/or demand driven & flexibility options ................................................... 23
3.4 Level of optimization ................................................................................................ 25
3.5 Time resolution and time horizon ............................................................................ 26
3.6 Level of decision ...................................................................................................... 28
3.7 Pricing ...................................................................................................................... 29
3.8 Backcasting versus forecasting ............................................................................... 30
3.9 Grid balancing .......................................................................................................... 31
3.10 Modelling physical infrastructure ............................................................................. 32
4 Comparing energy models with DiDo.................. ................................................ 34
4.1 DiDo and TNO models............................................................................................. 34
4.2 DiDo and ‘well known’ models ................................................................................. 34
5 Conclusion ........................................ ..................................................................... 36
5.1 Observations & questions ........................................................................................ 36
6 Further readings .................................. .................................................................. 37
6.1 Literature overview .................................................................................................. 37
6.2 ATEsT ...................................................................................................................... 37
6.3 Initiative Netbeheer NL/Edinet ................................................................................. 37
6.4 DiDo ......................................................................................................................... 37
7 Bibliography ...................................... ..................................................................... 38

TNO report | TNO 2015 R11109
SRP Energy Transition – DiDo comparison with other energy models TNO 2015 R11109
3 / 42
1 Introduction
In this report results are shown on the relation between the ambition of the DiDo model (Dynamisch Integraal Duurzaamheids Ontwikkelmodel owned by TNO) and existing energy (transition) models with a similar scope. The aim of this study is to check whether the ambition of DiDo model could already be fulfilled by other existing energy models or to identify the gap in between. Therefore, an overview is given for a selected group of relevant energy models together with their general descriptions. The models are compared on certain self-defined criteria based on the TNO vision, and a comparison with the DiDo model is made.
Although the desire of TNO is to have an objective, comprehensive overview of all energy transition models with various perspectives, visions and goals, this report is different because it is mainly written from the perspective and vision of DiDO. Models are compared on a limited set of criteria which exactly matches the DiDO ambition. This report could be seen as a starting point for further and broader research on energy transition models in collaboration with partners with different perspectives and visions on modelling the energy system in transition.
TNO has the ambition to build a tool that simulates energy transition paths dynamically in order to give more insight in the complex relationships that determine the evolution of multi-commodity energy systems in transition. Therefore TNO is working on a model which comprises a top-down energy system model, which is mostly based on the principle of ‘General Equilibrium (GE), combined with regional bottom-up models, which are mostly based on ‘Agent-Based-Modelling’. While most other models only simulate a begin and final situation, this energy transition model DiDo (Dynamisch Integraal Duurzaamheids Ontwikkelmodel) focuses on the dynamic decisions that are made in between, fed by macro-economic behavior. Insights are thereby obtained from the gradually transition of the energy system given a regulatory regime and exogenous scenarios. TNO and its model state(s) that the end situation is a function of the decisions made in each time step along the way. Disclaimer This study is not comprehensive regarding the selected models and criteria, but will either show some similarities and distinctions between DiDo and some closely related models. More relevant models and selecting criteria will exist of which the researcher are unaware, or did not taken into account. This report is based upon literature, model descriptions and manuals and online available presentation material. No interviews were involved although discussions with partners did lead to new insights.
.

TNO report | TNO 2015 R11109
SRP Energy Transition – DiDo comparison with other energy models TNO 2015 R11109
4 / 42
1 Selection of models
1.1 Criteria
The selected models that are taken into account in this ‘state of the art’ model overview, are chosen in such a way that they contribute to the energy transition, and provide, to some extent, statements about the change in sustainability, security of supply and affordability of the energy system. To make this more concrete, we have specified five criteria which are defined below, and each of the models we will consider in this report will at least meet all of these criteria. Change of the energy mix The energy mix, considered within the models, shows a difference between the current situation and a certain endpoint. Models should incorporate changes like the allocation of different energy sources or the geographical distribution of production entities. There could be, for example, an increase in the amount of energy from renewable sources within the energy mix, of which a part could be produced locally by citizen and companies. Impact on the entire energy system The changes within the energy mix, supply sources, which are considered within the models will show the impact on the of the entire energy system (e.g. influence on different type of stakeholders, different commodities, etc). This should be measured by factors as cost, sustainability, or security of supply. So the considered models does not focus on one part of the system (e.g. improving one technology) but considers the effect on the entire energy system. Geographical scope: from neighborhoods and wider Although the energy transition will influence single households, for example by providing the possibility to become producer as well, the models considered are at the level of neighborhoods and larger. Public regulated networks Related to the previous aspects, models are considered that include (physical) networks which focus on (the connection to) public regulated networks. Among others, because only networks that are coupled to regional, national or global markets can more directly be measured on impact of the entire system. Maturity The models we consider have been used within more than only one company and more than only one study. This means that models considered have the potential to become the standard within their particular application domain. DiDo itself is excluded from this criteria.
TNO report | TNO 2015 R11109
SRP Energy Transition – DiDo comparison with other energy models TNO 2015 R11109
5 / 42
2 Models
2.1 Classification
Although the selected models do meet the criteria as mentioned earlier, they still vary significantly from each other. To structure the models, various classes are distinguished and are tagged to the models. Classes: #Simulation, #Scenario, #GENequilibrium, #PARequili brium, #top-down, #bottom-up, #operation optimization, #investm ent optimization, #demand response Simulation : A simulation tool simulates the operation of a given energy-system to supply a given set of energy demands. Typically, a simulation tool is operated in hourly time steps over a one-year time-period. Scenario : A scenario tool usually combines a series of years into a long-term scenario. Typically, scenario tools function in time steps of 1 year and combine such annual results into a scenario of typically 20–50 years. Equilibrium: An equilibrium tool seeks to explain the behaviour of supply, demand, and prices in a whole economy or part of an economy (general or partial) with multiple markets. It is often assumed that agents are price takers and that equilibrium can be identified.
• General Equilibrium: Takes into consideration the whole economy and seeks a set of prices that results in an overall equilibrium. This means that feedback loops are included.
• Partly Equilibrium: Only takes a part of the market into consideration to
attain an equilibrium. In partly equilibrium models the clearance of the market of a product is reached independently from prices and quantities of other markets. This means these models do not include feedback loops or demand response mechanisms.
Top-down: From the aggregate to the detail level a top-down tool is a macroeconomic tool that is disaggregated further into sectors, commodities. It considers general macroeconomic dynamics to determine growth in energy prices and demands. Typically, top-down tools are also general equilibrium tools. Bottom-up: From the detail to the aggregate level a bottom-up tool identifies and analyses the specific energy technologies and thereby identifies investment options and alternatives. The overall picture is given by aggregating these sector data. Operation optimization: Optimizes the operation of a given energy-system. Typically, operation optimization tools are also simulation tools (see simulation) optimizing the operation of a given system.

TNO report | TNO 2015 R11109
SRP Energy Transition – DiDo comparison with other energy models TNO 2015 R11109
6 / 42
Investment optimization: O ptimizes the investments in an energy-system. Typically, optimization tools are also scenario tools (see scenario) optimizing investments in new energy stations and technologies. Demand response: Changes in electric usage by end-use customers compared with their normal consumption patterns in response to changes in the price of electricity over time.
2.2 Description of models
2.2.1 E3ME: #scenario, #GENequilibrium, #top-down The Energy Environment Economy Macro Economic Model (E3ME) is an equilibrium model developed by the Cambridge Econometrics. In comparison to general equilibrium models, E3models like the E3ME try to determine behavioral factors on empirical basis instead of assuming optimal behavior. The model is demand-driven and covers 53 global regions. It is mostly used for short, medium and long-term assessments about the impact of an input shock through a scenario-based analysis. The current model is top-down but developments for a detailed bottom-up engineering-based energy demand model are planned.
Figure 1: E3ME as an E3 model, source: E3ME Technical Manual
The model consist of three loops per region and an additional interdependency between the sector. An equilibrium is reached in annually time steps.

TNO report | TNO 2015 R11109
SRP Energy Transition – DiDo comparison with other energy models TNO 2015 R11109
7 / 42
Figure 2: E3ME feedback loops, source: E3ME Technical Manual,
2.2.2 E4Cast: # PARequilibrium, #scenario This model is used by the Australian Bureau of Agricultural and Resource Economics (ABARE) to predict long-term future scenarios within the Australian energy system. These scenarios include energy production, consumption and trade. Renewables as commodity are included. Annual time steps are taken up to a maximum of 30 years. National figures are produced by summing up user-defined regions. The model is a partial equilibrium framework focusing on domestic energy use and supply.
Figure 3: Overview E4cast, source: Australian Energy projections to 2034-35 Bureau of Resources and Energy Economics (2011).

TNO report | TNO 2015 R11109
SRP Energy Transition – DiDo comparison with other energy models TNO 2015 R11109
8 / 42
2.2.3 EnergyPlan: #scenario, #simulation, #bottom-up, #operation optimization, #investment optimization This model, owned by University of Aalborg in Denmark, has the aim to design a national or regional energy strategy by simulating the whole energy system. This is a deterministic input-output model which optimizes a given energy system by identifying the least-cost solution of the system, assuming an business market where all plant operators seek to optimize their business-economic profit, i.e. market price of selling must be higher than the marginal cost. This optimization is based on deterministic annual electricity price time series. Market prices are determined per hour as result from electricity supply and demand assuming market equilibrium. There is a feedback loop from the macro market prices on energy consumption and production and vice versa. The model is bottom-up in the sense that it calculates an hourly electricity balance, but also hourly balances the district heating, cooling, hydrogen, geothermal and natural gas. All these prices of the different sub-systems influence the price of the entire system.
Figure 4: Overview Energyplan. Source: Advanced Energy Systems Analysis Computer Model. Version 11.4. June 2014
2.2.4 Energy Transition Model (ETM): #scenario, #bottom-up, #simulation The Energy Transition Model of Quintel Intelligence is an online open source model, which aims to give insight in the effects of changes in supply and demand in future energy scenarios based on facts and physical relations. These facts include, for example, predicted annual demand curves with hourly resolution, number of installed wind turbines, solar panels, price settings and production capacity for installed dispatchables and ‘volatiles’. This ETM tool aims to facilitate and stimulate factual debate and energy education. It is explicitly not meant to include fixed optimizing and forecasting mechanisms since providing full transparency is important for education purposes. It is an interactive tool where users could change

TNO report | TNO 2015 R11109
SRP Energy Transition – DiDo comparison with other energy models TNO 2015 R11109
9 / 42
input settings in order to play and retrieve new insights about the future energy system. This model is demand driven, in the sense that it calculates how much primary energy is required to meet the final consumption. Electricity generation and demand could be matched automatically by the ‘Merit Order’ functionality. In case this functionality is not used, the user has to match supply and demand manually. When producers (gas plant, coals plant, wind turbines etc.) are built there are two options: in case the ‘Merit Order’ module is turned off the model assumes that these producers are operating regardless of the actual need for electricity but are based on the full-load hours as follow from national statistics for the start-year. Using the Merit Order, full-load hours are calculated dynamically, based on hourly load profiles. If the production exceeds the annual demand for electricity, the surplus is exported. There is no explicit macro-economic model and built-in feedback.
2.2.5 Flexiquest: #simulation, #scenario, #bottom-up, #demand response The Flexiquest model, developed by TNO in collaboration with 5 Dutch partners (producers, network operators and consumers), gives insight in the feasibility of the system to adapt the future energy demand as much as possible on the future energy supply, using different energy scenarios where solar and wind power share a larger proportion of the future energy mix. In particular, the ability to adapt to the price volatility on the imbalance market is considered, which has an important role within the Dutch electricity system to maintain the system balance. Based on available global buffer capacity, smart consumers acting on imbalance prices, (given certain price limits) and the energy mix, the potential cost savings for each of the actors is calculated. This dynamic consumption pattern influences the imbalance prices and vice versa, which yields a feedback loop. Moreover, the influence on the physical infrastructure is considered.
Figure 5: Overview Flexiquest. Source: Flexiquest, TNO (2013)
TNO report | TNO 2015 R11109
SRP Energy Transition – DiDo comparison with other energy models TNO 2015 R11109
10 / 42
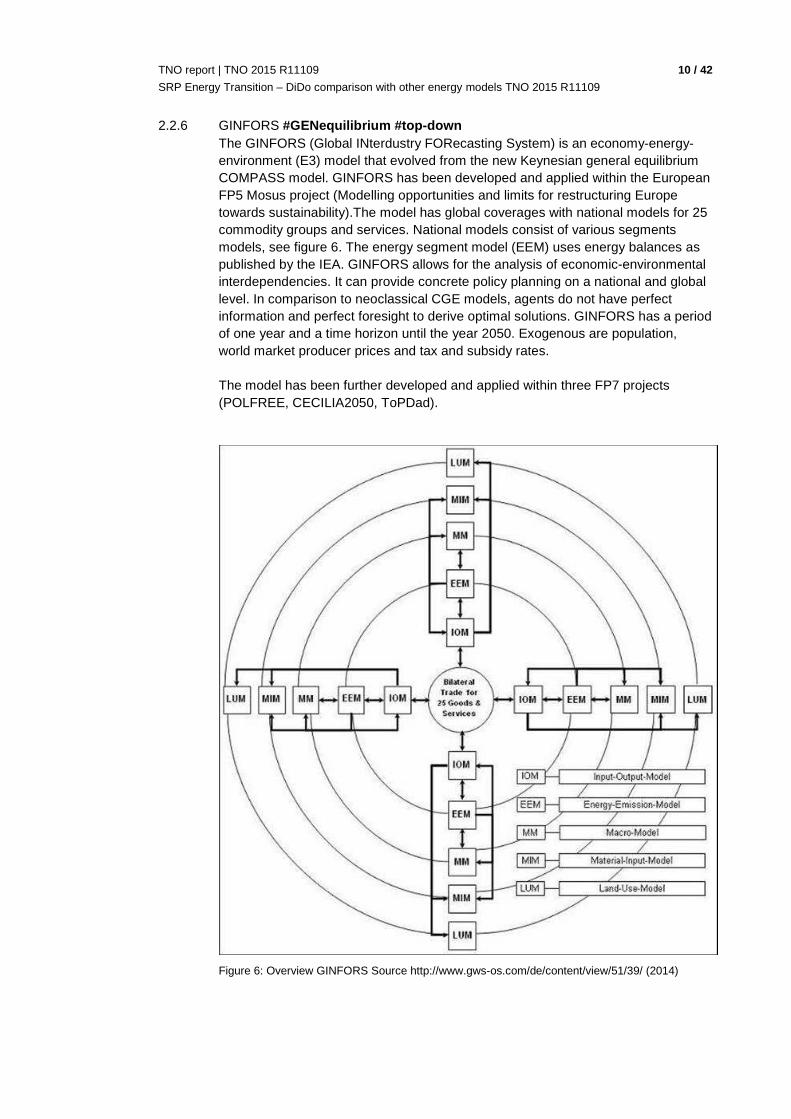
2.2.6 GINFORS #GENequilibrium #top-down The GINFORS (Global INterdustry FORecasting System) is an economy-energy-environment (E3) model that evolved from the new Keynesian general equilibrium COMPASS model. GINFORS has been developed and applied within the European FP5 Mosus project (Modelling opportunities and limits for restructuring Europe towards sustainability).The model has global coverages with national models for 25 commodity groups and services. National models consist of various segments models, see figure 6. The energy segment model (EEM) uses energy balances as published by the IEA. GINFORS allows for the analysis of economic-environmental interdependencies. It can provide concrete policy planning on a national and global level. In comparison to neoclassical CGE models, agents do not have perfect information and perfect foresight to derive optimal solutions. GINFORS has a period of one year and a time horizon until the year 2050. Exogenous are population, world market producer prices and tax and subsidy rates. The model has been further developed and applied within three FP7 projects (POLFREE, CECILIA2050, ToPDad).
Figure 6: Overview GINFORS Source http://www.gws-os.com/de/content/view/51/39/ (2014)

TNO report | TNO 2015 R11109
SRP Energy Transition – DiDo comparison with other energy models TNO 2015 R11109
11 / 42
2.2.7 LEAP: #simulation, #scenario, #top-down, #bottom-up, #investment optimization LEAP is developed at the Stockholm Environment Institute and is widely used for long-range policy energy scenario analysis. LEAP is intended as a medium to long-term modelling tool, based on a historical database of Energy demand from different sectors (see figure below), energy conversion, energy transmission and energy balance data from IAE. Most of its calculations are on an annual time step and could be extended for a number of years. The newest form of LEAP includes optimization; least-cost optimization of electric system capacity expansion and dispatch, under various constraints as limits of CO2 or local air pollution. LEAP supports a wide range of different modelling methodologies, from bottom-up, different end-use accounting techniques, to top-down macro-economic modelling.
Figure 7 : Overview LEAP model. Source: Energy Environmental Challenge Symposium, Vancouver (2011)
2.2.8 LOENA: #scenario, #simulation #bottom-up Developed by TNO this “Local Energy Assessment Instrument” provides insights in in the various options of local (municipal) energy supply. If focuses on financial-economic and strategic aspects which can be used to set up a vision about an efficient Smart Energy System. Information about demand from building types, installations and energy consumption are needed as input, as well as information about energy providing technologies/sources. In return, the model provides the user with information about return of investments, energy usages and the percentage of renewables and self-sufficiency.

TNO report | TNO 2015 R11109
SRP Energy Transition – DiDo comparison with other energy models TNO 2015 R11109
12 / 42
Figure 8: Overview LOENA model. Source: TNO (2013) - Beoordelingsinstrument Duurzame Lokale Energievoorziening 0 71.
2.2.9 NEMS: #scenario, #GENequilibrium, #bottom-up #top-down The National Energy Modeling System (NEMS) is an economic and energy model created at the US Deparment of Energy. The model analyses the energy system within different growth and policy scenarios. It models a general equilibrium between the domestic economy (GDP, disposable personal income, industrial output, housing starts, employment and interest rates) and the energy system (energy consumption, prices, capacity and expansion decision). Scenarios that are used as input are assumptions, for example, about future world energy supply and demand, demographics and technical choices. The output are projections about the production, consumption, conversion, import and pricing of energy on regional and national level. Included are the potential impact of new energy production, conversion and consumption technologies, the impact of increased use of renewable energy sources and the potential savings due to increased efficiency of energy use. The model consists of a bottom-up energy model and top-down economic part. The model is used for the Annual Energy Outlook of the Energy Information Agency (EIA).

TNO report | TNO 2015 R11109
SRP Energy Transition – DiDo comparison with other energy models TNO 2015 R11109
13 / 42
Figure 9: Overview National Energy Modeling System. Source: U.S. Energy Information Administration. Office of Energy Analysis
2.2.10 OPERA: #scenario, #simulation, #bottom-up, #investment optimization, #operation optimization (future plans: #demand response) OPERA is an integrated optimization energy system model of ECN (Energy research Centre of the Netherlands). OPERA optimizes the best possible sustainable configuration (i.e. mix of energy technologies) of the energy system at minimum cost for society that satisfies energy system restrictions like net balancing, and CO2 emission reduction targets. The optimization model uses LP (Linear Programming) to minimize the costs of the system for a specific year in the future. The physical infrastructure is simulated for the electricity network, natural gas network and the hydrogen network, and several storage and conversion technologies are included. OPERA is demand-driven and explicitly deals with matching the supply and demand on hourly base.

TNO report | TNO 2015 R11109
SRP Energy Transition – DiDo comparison with other energy models TNO 2015 R11109
14 / 42
Figure 10: Overview OPERA. Spurce: ECN & DNV-GL(2014) Exploring the role for power-to-gas in the future Dutch energy system.
2.2.11 PLEXOS: #simulation, #operation optimization, #bottom-up ‘PLEXOS integrated energy market modelling’ is a simulation and optimization tool owned by DNV KEMA that optimizes the OPEX of the total energy system as function of the marginal cost function of the different production entities. It provides an integrated approach from long-term expansion planning to spot and real-time markets (energy, fuel, heat, thermal, hydro markets). The intra-hour interval optimization is based on detailed 5 minutes production and transmission studies. The model also intends to measure the impact on the physical infrastructure (e.g. congestion management, outage planning).
2.2.12 POLES: #scenario, #PARequilibrium, #top-down, #bottom-up, The Prospective Outlook on Long-term Energy Systems (POLES) is a partial equilibrium model developed in the early 90s by the Institute of Energy Policy and Economics (IEPE) and used and further developed extensively by the European Union. It provides world energy scenarios (demand, supply, trade, prices), inter-technology substitution over time and C02 emissions constraints and trading. It is not an explicit macro-economic model as it does not provide the total impact on society nor include result from the evolution of the energy system. The model has a yearly recursive simulation process in which a market equilibrium is reached by matching the energy supply and demand for 32 countries and 18 world regions. The model consists of a bottom-up energy demand module and a top-down econometric module. The model takes new and renewables technologies into account.

TNO report | TNO 2015 R11109
SRP Energy Transition – DiDo comparison with other energy models TNO 2015 R11109
15 / 42
Figure 11: Overview POLES Model. Source: enerdata.net
2.2.13 POWERMATCHER: #simulation, #bottom-up, #operation optimization, #demand response Powermatcher is a coordination mechanism, designed to integrate numerous small electricity consuming and presuming devices in the operation of the electricity infrastructure. It integrates a large amount of renewable energy and at the same time avoids overload situations locally in the designed agents electricity distribution network. Powermatcher simulates dynamic pricing, based on demand response management in order to use the flexibility potential in electricity grids to minimize grid reinforcements and strengthen the balancing power. The balancing market is simulated on the short (minutes), medium (hours), and long (days, months, years) timescales, including Balancing Responsible Parties (BRPs).
2.2.14 PRIMES: #scenario #PARequilibrium #bottom-up PRIMES is a modular system developed and maintained for the Directorate-General for Energy (DG TREN) and Transport by the National Technical University of Athens. It is a partial equilibrium model that simulates simultaneous market equilibriums by focusing only on the energy sector and does not influence other sectors. The various sub models consist of several demand sectors which include detailed electricity, CHP, gas, biomass and renewable models. These modular separate modules are agent-based, making decentralized, separate decisions. Macro-economic variables, international energy prices, policies and technical characteristics need to be included. The model is used to develop scenarios and forecasts with annually periods until 2050. It projects full detailed EUROSTAT energy balance sheets which includes for example national energy demands, costs, prices and generation. It is used for the DG TREN Energy Outlook for the EU.

TNO report | TNO 2015 R11109
SRP Energy Transition – DiDo comparison with other energy models TNO 2015 R11109
16 / 42
PRIMES includes national and multinational level but lacks representation at a level below that of countries.
Figure 12: Overview PRIMES Source: E3Lab
2.2.15 RESGEN: #scenario, #top-down The RESGEN module of RAINS-Asia (roughly) estimates future energy supply and consumption levels for policy relevant questions, based on a wide variety of different socio-economic (e.g. population growth, GDP growth) and technological assumptions (e.g. transmission and distribution losses, electricity generation fuel mix). It calculates energy scenarios for the year 1990-2020 and answers questions like what are the effects of changes in the population or economic growth on the energy consumption. Electricity generation is the only supply component analyzed in detail, because it plays the largest role in air pollution emissions.

TNO report | TNO 2015 R11109
SRP Energy Transition – DiDo comparison with other energy models TNO 2015 R11109
17 / 42
Figure 13: RESGEN Flow Chart
2.2.16 SAGE: #scenario, #PARequilibrium, #investment optimization The System for the Analysis of Global Energy Market (SAGE) has been developed from the basis of the MARKAL model by the U.S. Department of Energy. It includes behavioral elements in the model’s partial equilibrium paradigm that MARKAL was lacking. It does not hold the assumption of perfect competition, as well as foresighted knowledge of the future by economic agents and pure profit maximizing of all agents. The model provides forecast about the least-cost supply option for the set of regions that are integrated. As well, projections of the regions and total world primarily energy consumption by primary energy type (including renewable sources) are provided. The model focuses on large consumers. Analysis are done on a 5 year period basis.
2.2.17 TIMES/MARKAL: #scenario, # PARequilibrium, #investment optimization #top-down, #bottom-up TIMES (The Integrated MARKAL-EFOM System) is the evolution of the MARKAL model family which has been developed in the late 1970s at Brookhaven National Lab. It has been adopted by the International Energy Agency (IEA) and U.S. Department of Energy and Energy. It is used as basis for the System for the Analysis of Global Energy Market (SAGE) model as discussed above. Nowadays, the MARKAL model, in various variants, is used in approximately 40 countries. The TIMES model combines a partly equilibrium with annual time steps with technology rich bottom-up Reference Energy Module (RES) generator. It has a large database that contains the structure and attributes to model an energy system. Various region-specific energy systems can be developed and included. TIMES is used for "the exploration of possible energy futures based on contrasted

TNO report | TNO 2015 R11109
SRP Energy Transition – DiDo comparison with other energy models TNO 2015 R11109
18 / 42
scenarios” (Loulou et al., 2005)1. It projects the least-cost energy system, optimized according to a number of user constraints.
Figure 14: Schematic overviews of TIMES/MARKAL RES (Reference Energy Module). Source: Remme et al., 2001.
Other MARKAL versions:
Version Type of model
Short Description
MARKAL LP Standard model: Exogenous energy demand
MARKAL – MACRO
NLP Coupling to macro-economic model, energy demand endogenous.
MARKAL-MICRO
NLP Coupling to micro-economic model, energy demand endogenous, responsive to price changes.
MARKAL-ED (MED)
LP As MICRO but with step-wise linear representation of demand function.
MARKAL with multiple regions
NLP Linkages of multiple country specific MARKAL-MED and MARKAL-MACRO including trade of emission permits.
MARKAL with uncertanties
LP Beside energy flow (electricity, heat) flows with material and recycling of materials can be modeled in the RES.
MARKAL with material flow
SP Stochastic Programming. Only with standard model. With uncertainties.
MARKAL -ETL
MIP Endogenous technology learning based on learning-by-doing curve. Specific cost decrease as function of cumulative expericence
Source: Energy/Environmental Modeling with the MARKAL Family of Models. (2003)
1 Loulou, R., Remne, U., Kanudia, A., Lehtila, A., Goldstein, G., 2005. Documentation for the TIMES Model - PART I 1–78.

TNO report | TNO 2015 R11109
SRP Energy Transition – DiDo comparison with other energy models TNO 2015 R11109
19 / 42
2.2.18 VESTA: #scenario, #bottom-up Developed by CE Delft and ObjectVision and commissioned by PBL (Plan Bureau Leefomgeving), this model provides policy information about energy supply in the build environment. It provides information about energy consumption and CO2 emission of the build environment and the greenhouse sector for the period 2010-2050. It focuses on heat demand within regional development in yearly timeframes. To each building type a certain energy demand is assigned by the user, as well as the supply of local energy production like heat pumps and solar cells. The use of other heat sources, which are dependent on a distribution grid, is modelled based upon the profitability from an investor perspective. Next to that, the effects of various measures (building and regional level) on energy consumption, CO2 emission and financial aspects can be modelled. Different scenarios with respect to construction and demolition of building types, energy information (demand, prices, CO2) and detailed geographical are needed as input.
Figure 15: Overview VESTA. Source: Functioneel ontwerp Vesta 2.0, PBL
2.2.19 WEM: #scenario, #PARequilibrium, #top-down The World Energy Model is a technology-rich partial equilibrium model that is developed at the International Energy Agency and used since 1993 yearly in development of the World Energy Outlook scenarios. Through input of alternative scenarios, the effects of policy actions and technological changes can be assessed as well as global energy prospects and environmental impact of energy use. The

TNO report | TNO 2015 R11109
SRP Energy Transition – DiDo comparison with other energy models TNO 2015 R11109
20 / 42
model has a year by year iteration by which the demand is not modelled at a disaggregated end-use level but at the sectorial level.
Figure 16: World Energy Model overview, Source: IEA
TNO report | TNO 2015 R11109
SRP Energy Transition – DiDo comparison with other energy models TNO 2015 R11109
21 / 42
3 Comparing models
In this chapter we will compare the different models that are described in chapter 2, based on several dimensions. These dimensions are chosen such that they provide a good reflection of the different building blocks of a so-called ‘energy transition model’. The main reason to specify ‘these building blocks’ is to give an idea on which dimensions DiDo is comparable or different than the other energy models and how DiDo is distinguished from the state-of-the-art. From TNOs perspective, these building blocks are essential model elements in order to get insight in the gradual transition of the energy system. By including these building blocks, DiDo aims to understand the technical, financial and human interaction within the context of the energy system.
3.1 Description of dimensions:
Dynamic versus static model (learning/feedback comp onent) In contrast to a static model, the input of a dynamic model will be updated according to model output obtained at previous time steps. In other words, the model learns from its previous outcomes. Different feedback loops are possible if the model consists of different modules. Supply and/or driven & operational flexibility opti ons The traditional economic value chain for energy is demand driven, which means that the energy production is matched to the predicted demand curves. On the other hand, if more sustainable (volatile) energy supply enters the system, and is offered at profitable prices, these prices could drive the customers to change their demand pattern based on the amount of energy supply. The degree to which flexibility options are considered in the models are taken into account within this dimension. For example, can storage and conversion techniques be included in the model? Level of Optimization Optimization on system level – macro: This type of tools could optimize the cost (e.g. investments), sustainability (e.g. C02 emissions) etc. on the energy-system level. This means that there is often one objective function formulated from a central perspective, and not so many iterations (e.g. in years) are involved to compute the optimal state of the system. Typically, optimization tools are also scenario tools (see 2.1) which optimize investments in new energy technologies. Optimization on operational level – micro: For micro optimization models multiple objective functions are formulated for different entities within the system. These entities (or agents) could take operational decisions (e.g. selling buying/energy, activating flexibility) which will be evaluated on a frequent base (e.g. minutes/days). The operations of the total system will emerge from individual actor behaviour. Optimization on investment level – micro: For this type of tools different entities of the system could take investment decisions on the strategic level (investment in hardware). The costs of the total system will emerge from individual actor behaviour. Or no optimization: For these type of models there is no automatic optimization process involved.
TNO report | TNO 2015 R11109
SRP Energy Transition – DiDo comparison with other energy models TNO 2015 R11109
22 / 42
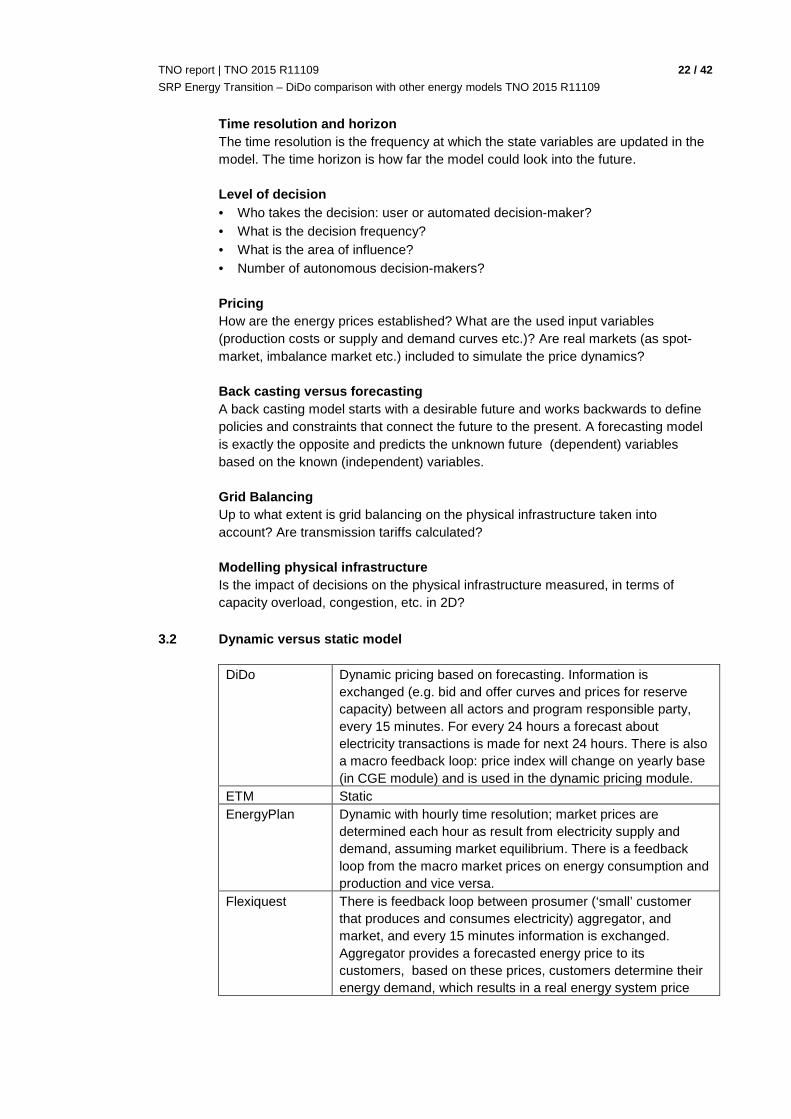
Time resolution and horizon The time resolution is the frequency at which the state variables are updated in the model. The time horizon is how far the model could look into the future. Level of decision • Who takes the decision: user or automated decision-maker? • What is the decision frequency? • What is the area of influence? • Number of autonomous decision-makers?
Pricing How are the energy prices established? What are the used input variables (production costs or supply and demand curves etc.)? Are real markets (as spot-market, imbalance market etc.) included to simulate the price dynamics? Back casting versus forecasting A back casting model starts with a desirable future and works backwards to define policies and constraints that connect the future to the present. A forecasting model is exactly the opposite and predicts the unknown future (dependent) variables based on the known (independent) variables. Grid Balancing Up to what extent is grid balancing on the physical infrastructure taken into account? Are transmission tariffs calculated? Modelling physical infrastructure Is the impact of decisions on the physical infrastructure measured, in terms of capacity overload, congestion, etc. in 2D?
3.2 Dynamic versus static model
DiDo Dynamic pricing based on forecasting. Information is exchanged (e.g. bid and offer curves and prices for reserve capacity) between all actors and program responsible party, every 15 minutes. For every 24 hours a forecast about electricity transactions is made for next 24 hours. There is also a macro feedback loop: price index will change on yearly base (in CGE module) and is used in the dynamic pricing module.
ETM Static EnergyPlan Dynamic with hourly time resolution; market prices are
determined each hour as result from electricity supply and demand, assuming market equilibrium. There is a feedback loop from the macro market prices on energy consumption and production and vice versa.
Flexiquest There is feedback loop between prosumer (‘small’ customer that produces and consumes electricity) aggregator, and market, and every 15 minutes information is exchanged. Aggregator provides a forecasted energy price to its customers, based on these prices, customers determine their energy demand, which results in a real energy system price

TNO report | TNO 2015 R11109
SRP Energy Transition – DiDo comparison with other energy models TNO 2015 R11109
23 / 42
and energy costs for each individual consumer. There is no feedback between the pricing module and the physical infrastructure module.
LEAP Static Loena Static OPERA Static Plexos Partly dynamic. Intra-hour interval cost optimization.
Constraints (regarding emission limits, fuel limits, etc.) are evaluated at longer time intervals (weekly, monthly) and are feedback to the hourly base optimization. Security assessment is done on yearly base.
Powermatcher Dynamic pricing. Simulated by an agent based model, clustered in a logical tree. The root of the tree is the central agent (auctioneer agent) that handles the price forming by searching for the equilibrium price. The leaves of the tree are the device agents which try to operate the process associated with the device in an economically optimum. The device agents sell and buy energy on electronic market and communicating with auctioneer agent by sending latest bids and prices. This communication is all on the timescale of minutes.
Resgen Static E3ME Dynamic, year-by-year iterative process by which a non-linear
(two-way) feedback between the economy, energy demand/supply, material consumption and environmental emissions is developed.
E4Cast Dynamic. The model makes use of annual time-steps GINFORS Dynamic. The model makes use of annual time-steps. POLES Dynamic pricing. The model uses four typical daily load
demand curves in a year with two-hours steps. A merit order is used that is based on the marginal cost of the generation mix. The resulting market equilibrium prices drive the demand and supply per energy commodity. There is a yearly feedback loop including expected energy demand.
PRIMES Static. The model projects future energy balances, investment costs, prices and emissions per country in timeframes of five-years.
SAGE Static TIMES/MARKAL Static. No feedback loop included VESTA Static WEM Dynamic. The model uses a year-by-year iteration where for
each year a dynamic assessment of the previously described static cost-resource curves is developed.
3.3 Supply and/or demand driven & flexibility optio ns
DiDo Currently, DiDo is demand driven. There are different flexibility options included. On the operational level: ramping up and down, storage, conversion, closure of intermittency. Demand curves are only changed yearly (macro-economic model). In a future version of DiDo, actors could also trade directly on spot-market (not only via PRP) and demand will meet the supply via

TNO report | TNO 2015 R11109
SRP Energy Transition – DiDo comparison with other energy models TNO 2015 R11109
24 / 42
the price. ETM Demand driven. The performance indicator ‘levelized cost’ is
used to compare the technologies; which refers to the amount of useful energy delivered to a consumer (power, heat or gas). The storage and conversion technologies are only permitted to convert excess electricity, where market prices of excess electricity obtained by storage/conversion technologies are assumed to be 0.
EnergyPlan Includes flexibility options as: import/export, energy conversion units such as electrolysers, biogas and gasification plants as well as hydrogenation units, storage of different resources (electricity- batteries, PHES, etc, gas, thermal, hydrogen storage, and CAES). Demand response options are not considered.
Flexiquest Main flexibility option of Flexiquest are demand response measures: end-consumers could delay their demand, or decrease/increase their demand depending on the market prices (i.e. imbalance market).
LEAP No flexibility options are included. Loena Flexibility options are defined per user: decreasing or
postponing demand, and individual storage options. OPERA Includes different conversion technologies (P2G, hydrogen,
fuel biomass) and storage technologies (large underground gas storage).
Plexos Includes trans-border transport capacities, but influence of storage and demand response is not included in the current version, but taken into account for future work.
Powermatcher Includes different flexibility options such as: reducing ramping steepness of power plants (ramp-up vs. ramp-down rate), demand response, distributed generation and future options for electricity storage
Resgen Demand driven. No real flexibility options are included. E3ME Demand driven. The model assumes that supply adjusts to
meet demand, but at a level that is likely to be below maximum capacity. Flexibility options seem not to be included.
E4Cast Equilibrium. Demand response options are not considered GINFORS Equilibrium. Balanced influence of supply and demand on the
solution of the model. Demand response options are not considered although price elasticity seems to be included in the pricing strategy.
POLES Equilibrium. Demand elasticities on energy prices are included. However, storage and conversion are not included so operational flexibility is limited.
PRIMES Market Equilibrium. Some flexibility options are included but it is unclear to which extend they respond to energy prices.
SAGE Equilibrium. The model assumes that each agent in the model is not willing or able to exactly maximize its surplus, because it faces uncertain costs and prices or it has other behaviour than maximizing profits.
TIMES/MARKAL Equilibrium. Demand side includes exogenous assumptions about the demand drivers and elasticities. Supply consists of

TNO report | TNO 2015 R11109
SRP Energy Transition – DiDo comparison with other energy models TNO 2015 R11109
25 / 42
multi-stepped supply curves. By optimizing the total surplus (consumers and producers) a partial equilibrium solutions is reached. The first MARKAL standard model was supply driven and did not include any demand response.
VESTA Demand driven. The model focuses entirely on determining the energy demand within the build environment in various scenarios. The model itself does not optimize but options are available to reduce (heat)demand side as well as for example though isolation.
WEM Equilibrium
3.4 Level of optimization
DiDo Operational optimization and investment optimization. In DiDo, optimization is done on micro level: through a bottom-up optimization of the individual agents’ utility functions (individual costs etc.), total system cost, CO2 abatement realized (and other KPIs) will emerge from individual actor behaviour. Agents could take operational decisions (e.g. selling buying/energy, activating flexibility) on daily base. On a monthly/half yearly base the agents could also take strategic decisions to invest in new hardware for example.
ETM No optimization. User could decide to vary the input variables in order to result in a desirable outcome.
EnergyPlan System optimization. EnergyPlan is an input-output model which optimizes a given energy system by identifying the least-cost solution of the system, assuming a business market where all plant operators seek to optimize their business-economic profit, under the constraint that the market price of selling must be higher than the marginal cost. In case of electricity storage systems EnergyPlan has a special focus on business modelling of CAES (Compressed Air Energy Storage) plants. The objective is to maximize the possible net operational income of a year given specified assumptions (in terms of capacity and efficiency of the storage technology, compressor operational costs and taxes, the gas price etc.).
Flexiquest Operational optimization. Through a bottom-up optimization of the individual agents’ utility functions (individual costs etc.). Customers (agents) could choose their optimal price limits. Flexiquest does not optimize the total system cost, it only quantifies the value of the flexibility of a particular group of customers.
LEAP System optimization. Least cost optimization of electric system capacity expansion and dispatch, under various constraints such as limits of CO2 or local air pollution.
Loena No automatic optimization: user could decide to vary the energy mix, storage facilities and other flexibility options.
OPERA System optimization. OPERA optimizes the best possible (sustainable) configuration (i.e. mix of energy technology) of the energy system at minimum cost for society that satisfies energy system restrictions (e.g. net balancing, CO2 emission

TNO report | TNO 2015 R11109
SRP Energy Transition – DiDo comparison with other energy models TNO 2015 R11109
26 / 42
reduction targets). The optimization model uses LP (Linear Programming) to minimize the cost of the system for a specific year in the future.
Plexos System optimization. PLEXOS is a MIP-based (Mixed integer programming optimization) simulation and optimization software. This model optimizes the OPEX of the total energy system as function of the marginal cost function of the different production entities
Powermatcher No. All actors provide their demand profile to a central engine which determines the global market price, based on the received information (i.e. resource allocation problem). Although this will give the optimal solution regarding the matching problem, there is no real optimization algorithm involved.
Resgen No optimization. E3ME No. Econometric models like E3ME do not assume optimal
behavior, but try to determine behavioral factors on an empirical basis by interrogate historical data sets. This means that E3ME allows for the possibility of unused capital and labor resources that may be utilized under the right policy conditions.
E4Cast No optimization. GINFORS No optimization. POLES No optimization, it assumes like al CGE models that all
resources are fully utilised PRIMES No optimization. SAGE No optimization. The model assumes that each agent in the
model is not willing or able to exactly maximize its surplus, because it faces uncertain cost and prices or it has other behaviour than maximizing profits.
TIMES/MARKAL System optimization. The MARKAL standard model is about optimizing cost: cost minimization.
VESTA No optimization, the model does not optimize itself but provides the user possibilities to manual find optimal situations.
WEM No optimization.
3.5 Time resolution and time horizon
DiDo Dynamic pricing based on forecasting on 15 minutes time scale. The price index will change on yearly base (in CGE module). Time horizon is 10 to 30 years.
ETM ETM contains two scenarios: the start scenario and the ‘future scenario’ (which could be in any year in the future). So actually there are two time steps involved. The scenario of 'present' is fixed to the 2012 values. The future scenario evaluates the choices the users makes (e.g. CO2 emission) based on ‘Merit Orde’r calculation on hourly basis,compared to the start scenario of 2012.
EnergyPlan Balance market prices are computed every hour. Since the fluctuations of spot market prices in future hours and days are not known for a whole year, operational strategies are difficult to measure for more than one year in the future. However,

TNO report | TNO 2015 R11109
SRP Energy Transition – DiDo comparison with other energy models TNO 2015 R11109
27 / 42
EnergyPlan includes a Practical historical strategy, in which decisions on buying and selling electricity are based on the knowledge of the average price over some historical and future period and Practical prognose strategy, in which buying and selling electricity are based on the average price of the coming hours, e.g., 24 hours. Such a strategy requires the presence of good price prognoses.
Flexiquest The model uses time steps of 15 minutes. Different scenarios are considered: a historical scenario based on Tennet data from January 2010 up to July 2012 and future scenario based on predictions about the energy mix, storage capabilities, number of ‘flexible‘ consumers. Input are imbalance market prices based on Tennet data from 2011 and output are different load profiles (normal, day/night/ flexible) per time step (simulated for one year?).
LEAP LEAP is intended as a medium to long-term modeling tool. Most of its calculations occur on an annual time-step, and the time horizon can extend for an unlimited number of years
Loena Loena measures the energy system on cost and sustainability for two different scenarios: present and future scenario (10 or 15 years). So no state updates per time steps are simulated.
OPERA The different energy system balances are modeled per hour. Instead of modelling every hour, based on historical hourly data on all relevant supply and demand patterns (i.e. wind and solar profiles, heat and electricity demand profiles), time slice algorithms smartly combine those hours of the year that are (most) similar, and take into account the sequence of a particular hour relative to the daily peak in demand. This way, model simulations can capture the different energy system balances throughout the year, while not putting to heavy requirements upon computing power capacity.
Plexos Plexos computes the load flows on short time scale, 15 minutes, (optimal dispatch), combined with a resource allocation optimization on medium time scale (hydro optimization, fuel contracts), and capacity expansion on longer time scale of years (transmission and generation expansion).
Powermatcher The communication between agents and aggregators on selling and buying electricity is on the timescale of minutes. Powermatcher could simulate the electricity system for one year or longer.
Resgen The year 1990 was chosen as the Base Year. Time intervals of ten years are used in the analysis, extending through the year 2020
E3ME Short annual and medium term model, using annual iterations. E4Cast Time horizon to a maximum of 30 years, using annual time
steps. GINFORS GINFORS uses annually time steps and a time horizon until
the year 2050 POLES Long-term up to 2050, with annual time steps PRIMES 1990-2050 by five years periods. The PRIMES model is a long-
term model setting projections for the period 1990-2050. Each
TNO report | TNO 2015 R11109
SRP Energy Transition – DiDo comparison with other energy models TNO 2015 R11109
28 / 42
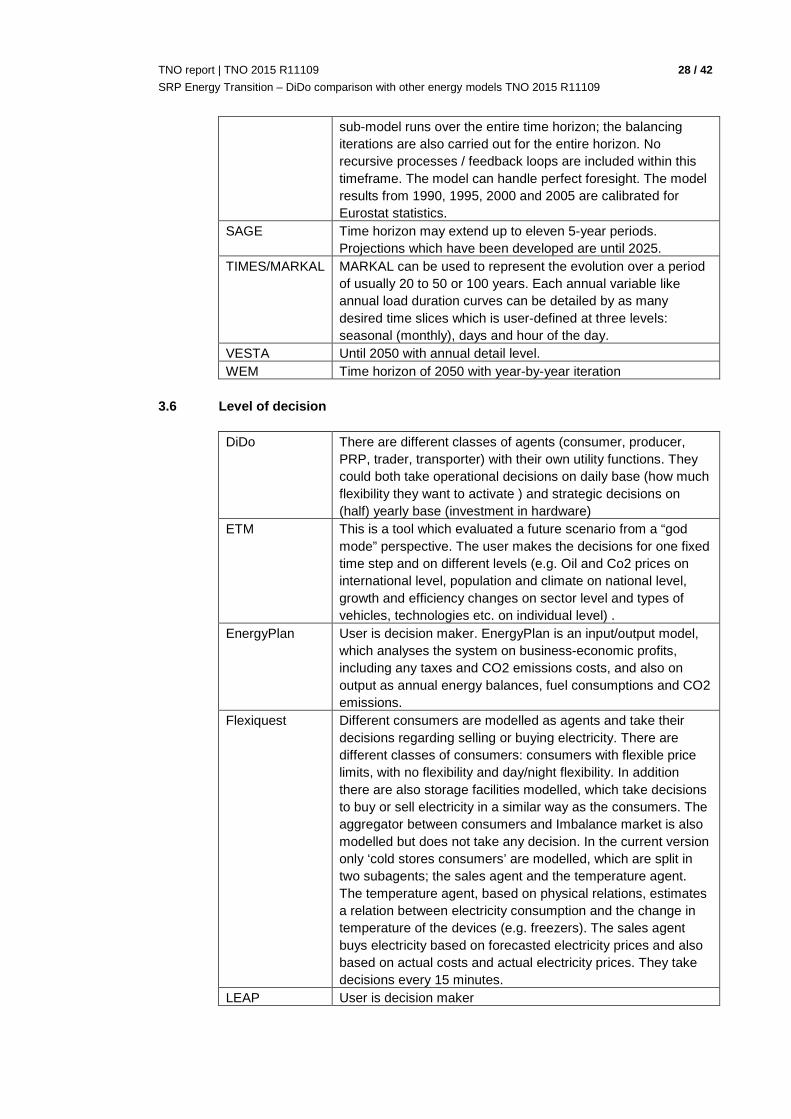
sub-model runs over the entire time horizon; the balancing iterations are also carried out for the entire horizon. No recursive processes / feedback loops are included within this timeframe. The model can handle perfect foresight. The model results from 1990, 1995, 2000 and 2005 are calibrated for Eurostat statistics.
SAGE Time horizon may extend up to eleven 5-year periods. Projections which have been developed are until 2025.
TIMES/MARKAL MARKAL can be used to represent the evolution over a period of usually 20 to 50 or 100 years. Each annual variable like annual load duration curves can be detailed by as many desired time slices which is user-defined at three levels: seasonal (monthly), days and hour of the day.
VESTA Until 2050 with annual detail level. WEM Time horizon of 2050 with year-by-year iteration
3.6 Level of decision
DiDo There are different classes of agents (consumer, producer, PRP, trader, transporter) with their own utility functions. They could both take operational decisions on daily base (how much flexibility they want to activate ) and strategic decisions on (half) yearly base (investment in hardware)
ETM This is a tool which evaluated a future scenario from a “god mode” perspective. The user makes the decisions for one fixed time step and on different levels (e.g. Oil and Co2 prices on international level, population and climate on national level, growth and efficiency changes on sector level and types of vehicles, technologies etc. on individual level) .
EnergyPlan User is decision maker. EnergyPlan is an input/output model, which analyses the system on business-economic profits, including any taxes and CO2 emissions costs, and also on output as annual energy balances, fuel consumptions and CO2 emissions.
Flexiquest Different consumers are modelled as agents and take their decisions regarding selling or buying electricity. There are different classes of consumers: consumers with flexible price limits, with no flexibility and day/night flexibility. In addition there are also storage facilities modelled, which take decisions to buy or sell electricity in a similar way as the consumers. The aggregator between consumers and Imbalance market is also modelled but does not take any decision. In the current version only ‘cold stores consumers’ are modelled, which are split in two subagents; the sales agent and the temperature agent. The temperature agent, based on physical relations, estimates a relation between electricity consumption and the change in temperature of the devices (e.g. freezers). The sales agent buys electricity based on forecasted electricity prices and also based on actual costs and actual electricity prices. They take decisions every 15 minutes.
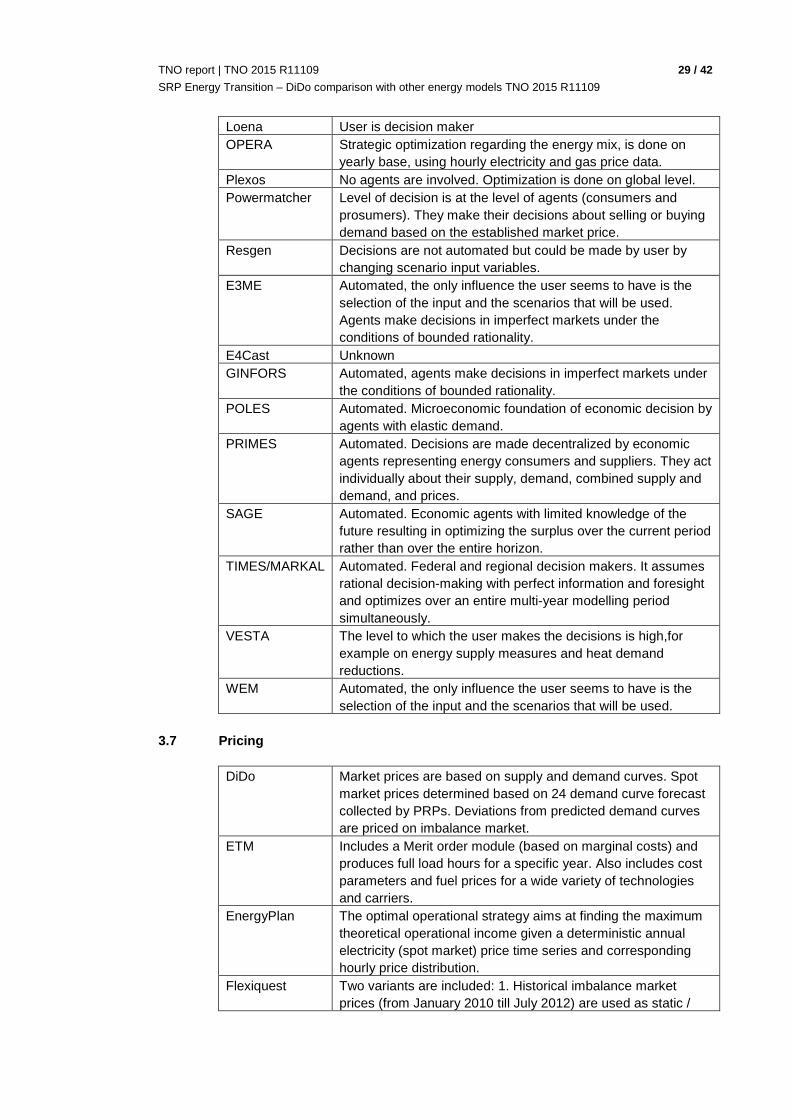
LEAP User is decision maker
TNO report | TNO 2015 R11109
SRP Energy Transition – DiDo comparison with other energy models TNO 2015 R11109
29 / 42
Loena User is decision maker OPERA Strategic optimization regarding the energy mix, is done on
yearly base, using hourly electricity and gas price data. Plexos No agents are involved. Optimization is done on global level. Powermatcher Level of decision is at the level of agents (consumers and
prosumers). They make their decisions about selling or buying demand based on the established market price.
Resgen Decisions are not automated but could be made by user by changing scenario input variables.
E3ME Automated, the only influence the user seems to have is the selection of the input and the scenarios that will be used. Agents make decisions in imperfect markets under the conditions of bounded rationality.
E4Cast Unknown GINFORS Automated, agents make decisions in imperfect markets under
the conditions of bounded rationality. POLES Automated. Microeconomic foundation of economic decision by
agents with elastic demand. PRIMES Automated. Decisions are made decentralized by economic
agents representing energy consumers and suppliers. They act individually about their supply, demand, combined supply and demand, and prices.
SAGE Automated. Economic agents with limited knowledge of the future resulting in optimizing the surplus over the current period rather than over the entire horizon.
TIMES/MARKAL Automated. Federal and regional decision makers. It assumes rational decision-making with perfect information and foresight and optimizes over an entire multi-year modelling period simultaneously.
VESTA The level to which the user makes the decisions is high,for example on energy supply measures and heat demand reductions.
WEM Automated, the only influence the user seems to have is the selection of the input and the scenarios that will be used.
3.7 Pricing
DiDo Market prices are based on supply and demand curves. Spot market prices determined based on 24 demand curve forecast collected by PRPs. Deviations from predicted demand curves are priced on imbalance market.
ETM Includes a Merit order module (based on marginal costs) and produces full load hours for a specific year. Also includes cost parameters and fuel prices for a wide variety of technologies and carriers.
EnergyPlan The optimal operational strategy aims at finding the maximum theoretical operational income given a deterministic annual electricity (spot market) price time series and corresponding hourly price distribution.
Flexiquest Two variants are included: 1. Historical imbalance market prices (from January 2010 till July 2012) are used as static /

TNO report | TNO 2015 R11109
SRP Energy Transition – DiDo comparison with other energy models TNO 2015 R11109
30 / 42
realistic input variables for consumers, in order to compute the value of their flexibility. In this variant, the behaviour of consumers does not have any effect on the imbalance prices. 2. Simulating the imbalance prices dynamically, based on formulas with estimated coefficients based on Tennet data from 2011. The energy demand of the prior periods serves as input to compute new market prices for the next time step.
LEAP Based on costs, no markets are included Loena Based on costs, no markets are included OPERA OPERA is based on expected marginal prices for electricity
and natural gas. No real markets are included. Plexos Based on cost price, not on market price. Powermatcher The central agent determines the market price (based on
demand and supply) using information about all demand profiles. If an agent deviates from his demand profile he needs to buy or sell the additional electricity on the spot market.
Resgen Cost-based. E3ME Unclear E4Cast Unknown GINFORS Prices are determined due to the mark-up hypothesis and not
determined on long run competitive pricing procedures. However, the model is not demand side driven but includes both demand and supply elements and specific price elasticities. Prices are changed in a manually iterative process until the reduction target is reached.
POLES Market prices. Load curves are met by a generations mix given by a merit order that is based on the marginal cost of operation, maintenance and annualized capital costs.
PRIMES Market equilibrium, by which the convergence towards an equilibrium is based on a recursive process.
SAGE Cost price. The model distinguishes in case of electricity six prices, one for each time-slice (Winter, Summer, Intermediate during day and night). The commodity price in the model is equal to the marginal value of the commodity for the system as a whole.
TIMES/MARKAL The MARKAL-MED module provides demand and supply curves resulting in an equilibrium. It is unclear to which extend this can be used in the TIMES/MARKAL module.
VESTA Pricing is not included. Energy prices are an input variable. WEM Makes use of demand curves and a merit order.
3.8 Backcasting versus forecasting
DiDo Forecasting. Based on demand curves, technical specifications of devices, exogenous time series of oil prices, CO2 emission costs, taxes, etc., output on longer time scale is calculated in terms of energy production mix, total consumption profiles, index prices, effects on total economy.
ETM Backcasting. The user could create a future scenario or use an existing future scenario to measure the impact on e.g. CO2 reduction, costs, percentage renewable energy, by making

TNO report | TNO 2015 R11109
SRP Energy Transition – DiDo comparison with other energy models TNO 2015 R11109
31 / 42
choices in the energy mix and conversion technologies etc EnergyPlan Backcasting. Based on different regulation strategies,
EnergyPlan calculates the required electricity and heat production.
Flexiquest Forecasting. Based on input variables the effect on imbalance prices and value of flexibility is computed for some period in the future.
LEAP Backcasting. LEAP examines how a society might try to meet its development goals in the energy sector.
Loena Backcasting. Only two scenarios are analysed. OPERA Backcasting: In this study, the OPERA model simulations
combine a baseline scenario (represented by a technology portfolio based on the complete energy balances of the Netherlands as reported in MONIT) with three different target levels for GHG emissions: 110, 70, and 30 Mton in order to represent three different target years, where the 30 Mton target level corresponds with a 2050 setting.
Plexos Forecasting. Integrated optimization of dispatch and capacity using input data as load data, CO2 prices and emissions, network constraint, etc.
Powermatcher Forecasting. Based on exogenous variables such as demand profiles (for wind or comsumers), the system will compute the matching of supply and demand.
Resgen Backcasting E3ME The E3model can be used for forecasting although it is
commonly used for evaluating the impacts of an input shock through scenario-based analysis.
E4Cast Forecasting GINFORS Forecasting POLES Forecasting PRIMES Forecasting SAGE Unclear TIMES/MARKAL Unclear VESTA Backcasting WEM Unclear
3.9 Grid balancing
DiDo On regional level, system balance is simulated. On national level, system balance on regional level is extrapolated.
ETM The Merit Order module explicitly matches supply and demand on the scale of the whole region on hourly basis. Necessary extra investments in the network are calculated accordingly.
EnergyPlan EnergyPlan computes hourly balances of electricity grid, but also heat, gas, hydrogen grid, using the different production, conversion and storage technologies.
Flexiquest Matching of demand and supply: flexibility options such as demand response and storage options are deployed using imbalance market prices.
LEAP No

TNO report | TNO 2015 R11109
SRP Energy Transition – DiDo comparison with other energy models TNO 2015 R11109
32 / 42
Loena No OPERA OPERA explicitly deals with needs to achieve a match between
supply and demand at any moment (hours), as a constraint for system optimization.
Plexos No balancing market and frequency control is included. Powermatcher Powermatcher computes the matching between supply and
demand, without taking the infrastructure into account. Resgen No E3ME No E4Cast No GINFORS No POLES No PRIMES No SAGE No TIMES/MARKAL Unclear VESTA No WEM No
3.10 Modelling physical infrastructure
DiDo Transport grid plus DSOs are included. A lack of capacity does not result in operational actions but instead, on the strategic level, the DSO got triggered to invest in more capacity.
ETM Not in 2D, but a simplified description of the electricity network is included and used to calculate possible network-extension costs and losses.
EnergyPlan No Flexiquest No LEAP No Loena No OPERA Electricity network, natural gas network, and hydrogen network
of the Netherlands are considered. For electricity the high, medium and low voltage are included, (1D), transformers, centralized and decentralized supply, large and small scale storage entities. For the gas network, different pressure levels are modelled, including connectors. However, the model for gas network is simpler since they expect to be the capacity of gas network to be sufficient and gas demand will expected to show a stagnant or declining trend.
Plexos Includes congestion management and outage planning. No detailed network modelling or AC load flow analysis. To some extent it models DC power flow analyses.
Powermatcher No Resgen No E3ME No E4Cast No GINFORS No POLES No PRIMES No SAGE No

TNO report | TNO 2015 R11109
SRP Energy Transition – DiDo comparison with other energy models TNO 2015 R11109
33 / 42
TIMES/MARKAL Yes. The MARKAL family does have a module that covers the physical infrastructure.
VESTA No WEM No

TNO report | TNO 2015 R11109
SRP Energy Transition – DiDo comparison with other energy models TNO 2015 R11109
34 / 42
4 Comparing energy models with DiDo
The comparison of DiDo with the models described above provides insights which we will visualize in this chapter. The figures below show which of the existing models cover the same building blocks as DiDo and to which degree.
4.1 DiDo and TNO models
Various models that are discussed earlier in this report are (co)-developed by TNO. To which extend are these models comparable to the aim of DiDo? Below, in figure 17, a visualization is shown of the comparison between DiDo and the TNO models discussed in this report. Each of these TNO models have certain aspects in common with DiDo, but not always to the same degree. For example, Powermatcher includes aspects about decisions making which are strongly related to what DiDo is aiming. However, the degree to which the physical infrastructure is included, the limited time horizon and the lack of a macro-economic integration are aspects which are not fully covered by Powermatcher. Regarding the consensus of the models for the specific building blocks we have made a weighting in three scaling classes:
Table 1. Model scaling definition :consensus with DiDo on the different building blocks
Scale Weighting Poor 0 Medium 5 Good 10
Figure 17: Comparison DiDo and TNO models. Source TNO 2014
4.2 DiDo and ‘well known’ models
A comparison of DiDo with some ‘well known’ models as discussed in this report, is shown in figure 18, for the same criteria as in figure 17. Plexos seems to be most comparable to DiDo in aspects like physical infrastructure, time horizon and market pricing. However, Plexos is distinctive in terms of dynamic feedback, time

TNO report | TNO 2015 R11109
SRP Energy Transition – DiDo comparison with other energy models TNO 2015 R11109
35 / 42
resolution, decision making frequency and level of optimization. Instead of a decision making process on micro level, Plexos strives for macro optimization. PRIMES and TIMES/MARKAL are interesting because they combine various modules making them hybrid models that combine macro/top-down and micro/bottom up approaches. Nonetheless, they lack aspects like physical infrastructure and flexibility options and abilities in other aspects. For figure 18, the same scaling is used as for figure 17.
Figure 18: Comparison DiDo and well known models. Source TNO 2014

TNO report | TNO 2015 R11109
SRP Energy Transition – DiDo comparison with other energy models TNO 2015 R11109
36 / 42
5 Conclusion
Each of the models that are included in this report have some specific elements and possibilities that fits the perspective and aim of the energy transition model DiDo. However, we conclude based on this research, there does not exist one model which integrates all the building blocks as defined in this report. The challenge is to how to combine all the different building blocks in order to give answers on the relevant questions related to the energy transition. DiDo is working on setting-up the fundament to combine all the important building blocks. The following list highlights the important aspects: • Actors/agents with heterogeneous preferences. • Multi-commodity (gas, electricity, heat) including conversion. • Operational decision behavior: 15 minutes price feedback. • Long-term investment behavior (e.g. hardware) partly based on macro-
economic feedback. However, on the aspect ‘optimization macro’, DiDo provides no possibilities because the aim of DiDo is the opposite, namely a bottom-up optimization on micro level, where answers on system level (e.g. total cost, Co2 emissions, etc) will emerge from individual actor behavior. This perspective, by which the end situation is a function of the individual decisions made in each time step, is an important aspect of DiDo, which we have not seen in other models.
5.1 Observations & questions
During this research various observations have been made and questions arose, which could be used for further research. • Hybrid models that combine the strengths of macro/top-down and micro/bottom
up approaches are mentioned as the new way to present answers for old and future challenges within energy modelling. However, insights in the coupling, challenges and prospects of these approaches remains unclear.
• Some models include a dynamic pricing mechanism based on demand and supply elements. However, it remains unclear which markets are simulated and what the time-frame is.
• Most models included gas, electricity, heat and conversion methods. To which extend and on which level a multi-commodity approach is taken remains unclear. As example: do actors match their demand for heat and electricity simultaneously based on electricity and heat prices in case of a heat pump?
TNO report | TNO 2015 R11109
SRP Energy Transition – DiDo comparison with other energy models TNO 2015 R11109
37 / 42
6 Further readings
As mentioned earlier this study is not comprehensive in the sense that it does not take into account all models and criteria. The aim of this study is check whether the ambition of DiDo model could already be fulfilled by other existing energy models. Other studies have focused more on examining various energy models in a broader perspective. Below some of these studies and initiatives are mentioned.
6.1 Literature overview
The paper of Connolly et al. (2010) reviews 37 energy tools, resulting in an interesting overview and starting point for further information. The analysis has been done in collaboration with the tool developers or recommended points of contact. Bhattacharyya (2010) provides a comparative overview of ten energy models, resulting in more insights in possible categories and criteria. .
6.2 ATEsT
As part of the 7th Framework Programme for Research and Technological Development the European Commission has support the ATEsT (Analysing Transition Planning and Systemic Energy Planning Tools for the implementation of the Energy Technology Information System) project. The project aimed to provide a ‘toolbox’ containing the methodologies, procedures and models required to support the decision making process for planning the development and roll-out of low carbon technologies and their supporting infrastructure. Part of this project has been an inventory and examining of 86 models and tools. http://www.cres.gr/atest/Publications.htm
6.3 Initiative Netbeheer NL/Edinet
Edinet is a small distribution system operator in the Netherlands who recently started an initiative for an inventory of energy models. This initiative is supported by Netbeheer Nederland Taakgroep Duurzaamheid en Innovatie. Involved are: Alliander, HanzeHogeSchool, Thales, Enexis, Stedin, DNV-GL, Quintel, Gasunie, D-Cision, ECN and TNO.
6.4 DiDo
The DiDo model is described in different internal reports. The CGE (ThreeME)) and agent based (EDGaR) components are described separately. An overall description of the DiDO model is made as well. All aspects are work in progress.

TNO report | TNO 2015 R11109
SRP Energy Transition – DiDo comparison with other energy models TNO 2015 R11109
38 / 42
7 Bibliography
General
Bhattacharyya, S. C., & Timilsina, G. R. (2010). A review of energy system models. International Journal of Energy Sector Management, 4(4), 494–518. doi:10.1108/17506221011092742
Connolly, D., Lund, H., Mathiesen, B. V., & Leahy, M. (2010). A review of computer tools for analysing the integration of renewable energy into various energy systems. Applied Energy, 87(4), 1059–1082. doi:10.1016/j.apenergy.2009.09.026
Connolly, D. (2012). Energy Tools for Analysing the Integration of Renewable Energy Terminology (presentation). Aalborg Universitet. Aalborg. Denmark. Retrieved from: http://www.energyplanning.aau.dk/PhD/ConnollyModel.pdf
Hedenus, Fredrik, Johansson, Daniel, & Lindgren, Kristian. 2013. A Critical Assessment of Energy-economy-climate Models for Policy Analysis. Journal of Applied Economics and Business Research, 3(2), 118{132.
Mai, T.; Logan, J.; Blair, N.; Sullivan, P.; Bazilian, M. (2013). RE-ASSUME: A Decision Maker's Guide to Evaluating Energy Scenarios, Modeling, and Assumptions. 73 pp.; NREL Report No. TP-6A20-58493.
Messner, S., & Schrattenholzer, L. (2000). MESSAGE–MACRO: linking an energy supply model with a macroeconomic module and solving it iteratively. Energy, 25(3), 267–282. doi:10.1016/S0360-5442(99)00063-8
Salas, P. (2013). Literature Review of Energy-Economics Models , Regarding Technological Change and Uncertainty (working paper). Cambridge Centre for Climate Change Mitigation Research. Cambridge, United Kingdom.
Technische Universiteit Eindhoven (2009) Transitie Roadmap Energie Infrastructuur in Nederland (TREIN-1). Eindhoven. Netherlands. Retrieved from: http://www.rvo.nl/sites/default/files/bijlagen/Eindrapport_TREIN-1.pdf
Vinícius, M., Xavier, E., Bassi, A. M., Souza, C. M. De, Pereira, W., Filho, B., … Nunes, F. (2013). Energy scenarios for the Minas Gerais State in Brazil : an integrated modeling exercise using System Dynamics, (n.d.), 1–13.
Zeng, Y., Cai, Y., Huang, G., & Dai, J. (2011). A Review on Optimization Modeling of Energy Systems Planning and GHG Emission Mitigation under Uncertainty. Energies, 4(12), 1624–1656. doi:10.3390/en4101624
DiDo :
TNO (2015). DiDo : a next generation energy transition model for multi-commodity energy systems connected to public grids. (unpublished) Delft. Netherlands.
TNO report | TNO 2015 R11109
SRP Energy Transition – DiDo comparison with other energy models TNO 2015 R11109
39 / 42
TNO (2015). Software Design Specification for an Agent-Based Model of Regional, Coupled Gas-Electricity-Heat Energy Systems. (unpublished). Utrecht. Netherlands.
TNO (2015). DiDo: description of the economic module. (unpublished). Delft. Netherlands.
E3ME:
Cambridge Econometrics,. (2014). E3ME Technical Manual , Version 6.0. Covent Garden, Cambridge.
Cambridge Econometrics,. (2005). E3ME 4: an Energy-Environment-Economy Model for Europe, A Non-Technical Description.Covent Garden, Cambridge.
ESPREME EU (2004). Joint overview report and comparison of available methods and models for macroeconomic assessment, WP08_D07. (n.d.).
E4Cast
Syed, A., & Penney, K. (2011). Australian energy projections to 2034-35. Bureau of Resources and Energy Economics, Canberra.
Syed, A., Wilson, R., Sandu, S., Cuevas-Cubria, C., Clarke, A. (2007) Australian Energy national and state projections to 2029-30, Abare research report 07.24. Abare Economics, Canberra.
EnergyPlan
Lund, H. (2014). EnergyPLAN Advanced Energy Systems Analysis Compter Model, Documentation Version 11.4. Aalborg University. Denmark. Downloaded from: http://www.energyplan.eu/
ETM-QUINTEL
https://github.com/quintel/documentation
Flexiquest
Hoeve, M., Marban, B., Verdouw, D., & Weij, W. van der. (2013) Flexiquest- Modelbeschrijving. TNO. Delft
GINFORS
Lutz, C (n.d.) The GINFORS Model in the MOSUS Project: Model Description and Baseline Projection (n.d.).
Meyer, B., & Lutz, C.(2007). The GINFORS Model Model Overview and Evaluation (n.d.)
Meyer, B. (2011). Macroeconomic modelling of sustainable development and the links between the economy and the environment. GWS. Osnabrück.

TNO report | TNO 2015 R11109
SRP Energy Transition – DiDo comparison with other energy models TNO 2015 R11109
40 / 42
Meyer, M., Distelkamp, M., Ahlert, G., & Meyer, B. (2013). Macroeconomic Modelling of the Global Economy-Energy-Environment Nexus – an Overview of Recent Advancements of the Dynamic Simulation Model GINFORS., 49(541).
LEAP
Stockholm Environment Institute (SEI) (2006) - Data requirements for Energy Planning and Mitigation Assessment
SEI (2011) - Quick Start Guide for user optimization in LEAP
LOENA
TNO (2013) - Beoordelingsinstrument Duurzame Lokale Energievoorziening 0 71. (n.d.).
NEMS
AIE (2009) - The National Energy System Model : An Overview 2009. Report #:DOE/EIA-0581(2009)
OPERA
ECN (2014) OPERA-Opties-21Maart2014. (n.d.).
ECN (2014) OPERA-Technology-factsheet-empty. (n.d.).
Daniëls, B., & Seebregts, A. (2014). Exploring the role for power-to-gas in the future Dutch energy system. ECN & DNV-GL (n.d.). Retrieved from: http://www.energeia.nl/docs/P2G_ECN_2014.pdf
PLEXOS
EnergyExemplar (n.d.). Overview of PLEXOS (n.d.)
Niria, K. (2013). Simulatie van het EU-wijde elektriciteitsysteem Modellering van de elektriciteitsmarkt en de hierin gebruikte elektriciteitsinfrastructuur, Presentation KEMA. Utrecht.
POLES
Kitous, A. (2006). POLES Model Prospective Outlook on Long-term Energy Systems- A World Energy Model. Enerdata Services. (n.d.).
LEPII-EPE, Enerdata (2009). Energy Scenarios, Technology Development and Climate Policy Analysis with the POLES Modelling System. (n.d.)
Powermatcher
Kok, K., Roossien, B., Macdougall, P., & Pruissen, O. Van. (2012). Dynamic Pricing by Scalable Energy Management Systems - Field Experiences and Simulation Results using PowerMatcher. (n.d).

TNO report | TNO 2015 R11109
SRP Energy Transition – DiDo comparison with other energy models TNO 2015 R11109
41 / 42
Kok, K., (2013). The Powermatcher: Smart Coordination for the Smart Electricity Grid (dissertation). Vrije Universiteit Amsterdam. Amsterdam.
MacDougall, P., Warmer, C., & Kok, K. (2011). Mitigation of wind power fluctuations by intelligent response of demand and distributed generation. 2011 2nd IEEE PES International Conference and Exhibition on Innovative Smart Grid Technologies, 1–6. doi:10.1109/ISGTEurope.2011.6162790
PRIMES
E3MLAB (2007). Overview of PRIMES Model (presentation) (n.d.) retrieved from http://user.iiasa.ac.at/~benzing/Post%20Kick%20Off/Powerpoint%20Presentations/Presentations%20PDFs/Kouvaritakis-PRIMES.pdf
E3MLAB (2011). PRIMES Model Presentation for Peer Review – Part 1 (presentation), Brussels. Retrieved from: http://www.e3mlab.ntua.gr/e3mlab/PRIMES%20Manual/Peer_Review_Part_1_2_3.pdf
Capros (n.d.) Primes Energy System Model (presentation). E3MLab National Technical University of Athens. Retrieved from: http://www.e3mlab.ntua.gr.
Capros, A., Mantzos, L., Tasios, N., De Vita, N., Kouvaritakis, N. (2010) EU Energy trends to 2030 - update 2009. Publication Office of the European Union, Luxembourg.
Möst, D., & Keles, D. (2009). A survey of stochastic modelling approaches for liberalised electricity markets. European Journal of Operational Research.
RESGEN
Green, C., Legler, J., Sarkar, A., & Foell, W. (1995). AN ASSESSMENT MODEL FOR AIR POLLUTION IN ASIA Chapter 3 Energy Module. (n.d.)
SAGE
US DOE. (2003). Model Documentation Report : System for the Analysis of Global Energy Markets Volume 1 Model Documentation. Office of Integrated Analysis and Forecasting Energy Information Administration US Department of Energy. Washington, DC.
TIMES/MARKAL
EPA, U. S., (n.d.). Energy Modeling with MARKAL.(n.d.)
Loulou, R., Goldstein, G., & Noble, K. (2004). Documentation for the MARKAL Family of Models, (n.d.). Retrieved from: http://www.iea-etsap.org/web/MrklDoc-I_StdMARKAL.pdf
Seebregts, A. J., Goldstein, G. A., & Smekens, K. (n.d.). Energy / Environmental Modeling with the MARKAL Family of Models. Energy Research Centre of the Netherlands (ECN). Petten, The Netherlands.
Krook-riekkola, A. (n.d.). Challenges in Top-down and Bottom-up Soft Linking : The Case of EMEC and TIMES-Sweden (n.d.)

TNO report | TNO 2015 R11109
SRP Energy Transition – DiDo comparison with other energy models TNO 2015 R11109
42 / 42
VESTA
TNO (2012) Conceptrapportage wp2. TNO. Utrecht.
WEM
IEA (2011). WORLD ENERGY MODEL – METHODOLOGY AND ASSUMPTIONS Contents. (n.d.) Retrieved from: http://www.iea.org/media/weowebsite/energymodel/WEM_Methodology_WEO2011.pdf
IEA (2013). WORLD ENERGY MODEL – DOCUMENTATION 2013 VERSION (n.d.) Retrieved from: http://www.worldenergyoutlook.org/media/weowebsite/2013/WEM_Documentation_WEO2013.pdf
Roques, F., & Waisman, H. (2009). Integrated Modelling of Economic-Energy-Environment Scenarios - The Impact of China and India’s Economic Growth on Energy Use and CO2 Emissions, (15).