Did you write the quantitative part of your research correctly?? Quantitative aspects of your...
16
QUANTITATIVE DATA ANALYSIS ARE YOU READY FOR IT? Titbits of RESEARCH METHODS 11 point checklist… Workshop Venue: College of Business, UUM Malaysia Facilitator: Pranav Kumar, PhD 28 May, 2015 PhD Training Series 1
-
Upload
pranav-kumar -
Category
Business
-
view
163 -
download
0
Transcript of Did you write the quantitative part of your research correctly?? Quantitative aspects of your...

QUANTITATIVE DATA ANALYSIS ARE YOU READY FOR IT?
Titbits of RESEARCH METHODS
11 point checklist…
Workshop Venue: College of Business, UUM Malaysia
Facilitator: Pranav Kumar, PhD
28 May, 2015
PhD Training Series
1

1. Language of Problem Statement and Literature Review
• Ensure you covered quantitative wordings like relationships, influences, antecedents, etc.
• Ensure you covered plenty of quantitative literature; of course read and cover qualitative studies also
• Ensure you presented adequate citations from quantitative studies for the theoretical gaps while streamlining your variables
2

2. Research Questions
• Ensure you have said you want to study relationships, influences, antecedents & consequences, predictions, etc.
• For mixed method, ensure you put some questions for qualitative aspect and some for quantitative aspect retaining the prime research objectives in mind; or else, justify otherwise
3

3. Research Framework
• Ensure that you chose appropriate number of variables with literature support (don’t do mere variable hunting)
• Ensure to have a parsimonious model so that your dependent variables would promisingly bring adequate variance (neither very low, nor extremely high hinting at dubiousness of data)
• Positioning of moderating/mediating variables must be line with theory/past literature or at least possess good common sense
4

• More number of variables would lead to having a complex model in statistical sense
• Support the variables and their directions of respective relationships with established theories/models; justify otherwise
5

4. Did you choose a soft or a hard theory / model? Justify …
6
So choosing this one??
Image courtesy: web sources/book
Theory of Planned Behavior

Or this one ??
7
Image courtesy: web sources/book
Model of Buyer Behavior
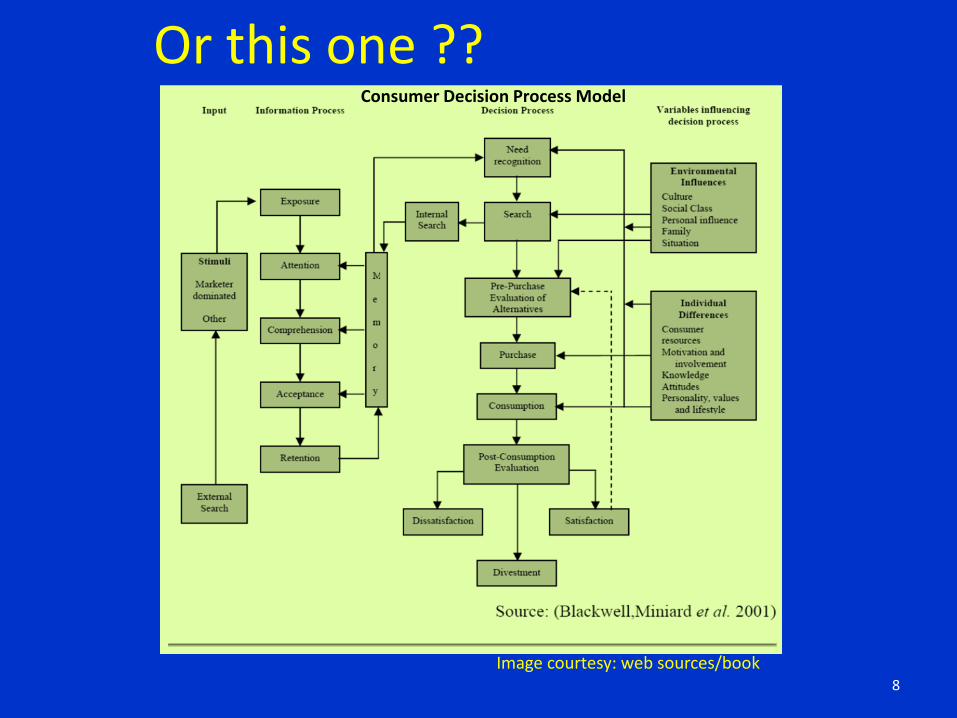
Or this one ??
8
Image courtesy: web sources/book
Consumer Decision Process Model

How about this one ??
9
THE ANSWER IS: Support with the theory/model that brings maximum PARSIMONY to your FRAMEWORK; Gain idea from meta analyses; You are okay if you justified it adequately !!
Image courtesy: web sources/book
Theory of Reasoned Action

5. Writing Hypothesis
• Which style/option you used out of many?
e.g. • There is a relationship between X and Y. • There is an influence of X on Y. • There is a positive/negative influence of X on Y. • Higher the X, the greater/lower will be the Y. and so on…..
WHICH ONE FITS THE BEST FOR YOUR STUDY? DID YOU
CHOOSE RATIONALLY? FOLLOW THE RULE OF COMMON SENSE IN LINE WITH PAST LITERATURE.
10

6. Hypothesis is 1-tailed or 2-tailed?
• If it is clear that X influences Y positively or negatively, then write it so keeping it 1-tailed.
e.g. Strike has a negative influence on firm’s productivity. • If it is not clear that some variable X can influence
another variable Y positively or negatively, or if there exists both possibilities, keep it 2-tailed. In this case, write the hypothesis without using the term positively/negatively.
• If you didn’t take into consideration 1-tailed or 2-tailed issues, you will have difficulty in explaining the results and also while estimating significance results.
11

7. Instrument
• Did you use interval scale (shown below) or scale of a higher order ?
They enable powerful statistical calculations; strongly suggested by Zikmund and Babin (2010)
12

8. Reflective/Formative Indicators
• Did you word your items appropriately?
• Your items are forming the construct or they reflect the construct? – E.g. I like to…… ; I prefer to…..,etc. usually exhibit
reflective indicators.
– It is my favorite……; Malaysia offers wonderful….,etc. usually exhibit formative indicators.
• These two require two different statistical treatment. PLS is needed for estimating formative indicators.
13

9. While Collecting Data
• Did you keep the early and late responses in separate folders? Separate folders for different cities….and so on….?
• Did you enter them systematically so that you can identify where are they after entering the whole data set?
It will help you in estimating response bias, city-wise comparisons, etc.
14

10. Why to use PLS Structural Equation Modeling (PLS-SEM) ?
15
• Simultaneous consideration of all equations • Ability to handle measurement errors • Ability to estimate complex models • Potential to treat reflective and formative
measures • Used for theory development • It is in line with the modern trends
LIMITATION: MANY MAJOR JOURNALS STILL PREFER MAXIMUM LIKELIHOOD METHOD (easily possible in AMOS, etc.)

11. The Output You Need in brief from the Data Analysis: Are you familiar with these?
16 Thanks…..