Dibbets, Bakker, Jolles - 2006 - Functional MRI of task...
31
1 Functional MRI of task switching in children with Specific Language Impairment (SLI) Pauline Dibbets*, Katja Bakker, & Jellemer Jolles University of Maastricht Dr Tanslaan 10 Psychiatry & Neuropsychology P.O. box 616 6200 MD Maastricht The Netherlands T: +31 (0)43 388 40 90 F: +31 (0)43 388 40 92 E: P. [email protected] * Corresponding author
Transcript of Dibbets, Bakker, Jolles - 2006 - Functional MRI of task...

1
Functional MRI of task switching in children with
Specific Language Impairment (SLI)
Pauline Dibbets*, Katja Bakker, & Jellemer Jolles
University of Maastricht
Dr Tanslaan 10
Psychiatry & Neuropsychology
P.O. box 616
6200 MD Maastricht
The Netherlands
T: +31 (0)43 388 40 90
F: +31 (0)43 388 40 92
E: P. [email protected]
* Corresponding author

2
Abstract
The objective of this study was to examine executive functioning in children with Specific
Language Impairment (SLI) using functional MRI. Six children with SLI and seven control
children participated in this study and received a task-switching paradigm. No specific deficit
in executive control was observed at the behavioural level in children with SLI. However, the
neuroimaging data did show remarkable differences between the SLI and control children.
The children with SLI recruited frontal and cingulate areas, normally associated with
executive control, even when the task did not require them in the children without SLI. This
might indicate that the task was more demanding for the SLI group and that compensatory
mechanisms were engaged for successful task performance.

3
Introduction
Specific Language Impairment (SLI) is characterized by a deficit in the production or
comprehension of language despite normal cognitive development and educational
opportunities (Ahmed, Lombardino, & Leonard, 2001). The most described and commonly
known problems are language related and include phonological problems, problems with
language morphology, and difficulty with sentence structures (Joanisse & Seidenberg, 1998).
SLI is more frequently observed in boys than in girls and the prevalence is around 7 percent
(Leonard, 1998).
Two different types of hypotheses have attempted to explain SLI. The first hypothesis
presumes that people with SLI suffer from a deficit or delay that is specific to the language
domain, particularly to grammar. A competing view posits that SLI is caused by a non-
linguistic processing deficit (see for an overview Ullman & Pierpont, 2005). More and more
evidence supports the latter view. The problems that children with SLI encounter, are not
merely restricted to the language domain. Several studies have indicated that, compared to
chronological-age peers, children with SLI have a limited working memory capacity (Marton
& Schwartz, 2003; Weismer, Evans, & Hesketh, 1999), attention problems (Niemi,
Gunderson, Leppaesaari, & Hugdahl, 2003), motor skill problems, and temporal processing
deficits (Ullman & Pierpont, 2005). Although one can argue that most of the tasks used in
these studies involve a strong language component, the results do imply a more general deficit
in executive control. This executive control is said to encompass several inter-related
processes, such as, planning, mental flexibility, attentional control, and utilization of feedback
and is mainly put into effect during tasks or situations that are novel, complex, or induce a
conflict situation (see for an overview of definitions, Anderson, 1998; Zelazo, Muller, Frye, &
Marcovitch, 2003). Executive control is strongly associated with frontal-lobe activation
(Duncan & Owen, 2000; Koechlin, Ody, & Kouneiher, 2003).

4
Structural brain anomalies, measured with magnetic resonance imaging (MRI), in children
with SLI have been reported in a number of studies (see for an overview Ullman & Pierpont,
2005). Regional anomalies have been found in language-related areas such as, a decrease in
the volume of the left pars triangularis, which is part of Broca’s area (Gauger, Lombardino, &
Leonard, 1997), a decrease in the volume of the left posterior perisylvian region (Jernigan,
Hesselink, Sowell, & Tallal, 1991), and children with SLI are less likely to have a leftward
asymmetry of the planum temporale, a part of Wernicke’s area (Bishop, 2000; Plante,
Swisher, Vance, & Rapcsak, 1991). However, anomalies have also been found in areas related
to executive control. Jernigan and colleagues report that children with language impairment
have an increased asymmetry in prefrontal areas such as the orbitofrontal, dorsolateral , and
medial frontal cortex (1991). That is, in normal controls the frontal areas mentioned are
symmetrical, while in the children with language problems the left hemisphere is reduced
relative to the right. Kabani and colleagues report cortical atrophy in the anterior regions of
the frontal cortex in adults with SLI (1997). Especially, these brain areas are associated with
executive control functions as response inhibition (Fassbender et al., 2004; Tamm, Menon, &
Reiss, 2002) , utilization of feedback (Hornak et al., 2004), and switching between rules and
tasks (DiGirolamo et al., 2001). Thus, the anomalies found in these frontal regions support the
notion that SLI is a more general, executive control, deficit.
In comparison to studies on structural brain differences, only a limited amount of studies
have examined brain activity in children with SLI. (review Hugdahl et al., 2004; Ullman &
Pierpont, 2005). To our knowledge, only four studies have examined brain activity in subjects
with SLI during task performance. In one study brain activity was examined by SPECT (Lou,
Henriksen, & Bruhn, 1984), in the second study with PET (Vargha-Khadem et al., 1998), and
in the remaining two studies functional MRI (fMRI) was used (Liegeois et al., 2003)
(Hugdahl et al., 2004). In each of these studies the subjects had to perform a language task,

5
respectively, object naming, word repetition, verb generation, and passive listening to
language stimuli. However, none of these studies has examined the relation between SLI,
brain activation, and executive control. Therefore, the main aim of the present study was to
examine brain activation in children with SLI during the performance of an executive control
task.
The task used for this study is based on the task-switching paradigm (Dibbets & Jolles, in
press). This paradigm is held to be appropriate for the exploration of executive control and
involves the performance of two relatively easy cognitive tasks (Monsell, 1996; Rogers &
Monsell, 1995). The task-switching paradigm has also proved to be a sensitive tool for
examining developmental differences in executive control {Cepeda, 2001 #25} and for
detecting executive dysfunctioning {e.g., \ Cepeda, 2000 #26}. In the ‘nonswitch’, or
‘repeated’ condition, the participant is repeatedly presented one of the two tasks (e.g., AAAA
or BBBB). In the other condition, the ‘switch’ condition, the participant switches from one
task to the other (e.g., ABBAAB). Performance is usually slower and less accurate in the
switch than in the nonswitch condition. These so-called switch costs are thought to reflect a
stronger engagement of executive processes during the switch condition, like the inhibition of
the irrelevant task set, switching to the relevant task set, and the maintenance and
manipulation of two different mental task sets in working memory. A deficit in executive
control can be expressed as a stronger impairment in the switch than in the nonswitch
condition, leading to an enlargement of the switch costs.
Several fMRI studies have examined task switching-related activation in adults (e.g.,
DiGirolamo et al., 2001; Dove, Pollmann, Schubert, Wiggins, & von Cramon, 2000; Ruge et
al., 2005; Rushworth, Hadland, Paus, & Sipila, 2002). Additional activation during the switch
condition was mainly observed in dorsolateral and medial frontal areas, the presupplementary

6
motor area, and parietal areas. Exactly these dorsolateral and medial frontal areas show an
atypical asymmetry in children with SLI.
The present study was conducted for two main reasons. First, to seek further evidence for
an executive control deficit in children with SLI using a task-switching paradigm. Second, to
explore differences in (frontal) brain activation between children with and without SLI during
the performance of the task-switching paradigm.
Materials and Methods
Subjects
Six children with SLI and seven age-matched control children took part in this study. In order
to reduce errors due to developmental differences between boys and girls, only boys were
eligible for the study. All subjects were right-handed. The mean age of each group was 6
years and 10 months (sd SLI: 8.4 months; sd control: 6.3 months). The socioeconomical
background, with respect to family composition, education level, employment status, and age
of the parents, was highly similar in both groups. The children with SLI were recruited from a
special school for children with speech- and language disorders, the control children from
local primary schools. Parents provided written informed consent for participation of the
children. The diagnosis of SLI was made by a team of professionals, including linguists,
psychologists, speech therapists and audiologists using standard, neuropsychological, tests.
The children with SLI performed at least two standard deviations below average on language
tests, with normal nonverbal performance (mean IQ = 94.3, sd = 5.2). All children with SLI
had both expressive and receptive language problems, with the expressive problems
dominating. Children with a history of neurological disease, trauma, psychiatric problems,
developmental disorders (other than SLI), contraindication for fMRI, or an IQ < 85 were

7
excluded from participation. All children received a small present and a snapshot of their
anatomical brain scan for participation.
Neuropsychological tests
Four language tests and two nonverbal tests were administered for two main reasons. First, to
objectively confirm the nature of the language problems in the children with SLI and to assess
that they are specific for SLI and not present in the control children. Second, to detect a
possible discrepancy in verbal and nonverbal test performance in the SLI group. The language
tests assessed were: Phonological processing, Speeded naming, Sentence repetition, and
Repetition of nonsense words. During the last two tasks, the children had to repeat sentences
or nonwords that were read aloud by the experimenter. The phonological processing test was
divided in two parts. In the first part, phonemes of words were read aloud and the child had to
select an image that depicted a word containing that particular phoneme. For example,
selecting a picture of a shoo after hearing the phoneme ‘sh’. In the second part, the child had
to substitute phonemes. For example, say ‘live’ but replace ‘l’ by ‘g’. The correct answer in
this case would be ‘give’. During the speeded naming test, children had to indicate as fast and
accurate as possible the size, colour, and shape of geometrical figures presented on a sheet.
All these tests stemmed from the NEPSY (A Developmental Neuropsychological Assessment;
(Korkman, Kirk, & Kemp, 1998). This combination of subtests can be used to detect
developmental language problems in children (Korkman et al., 1998). The two nonverbal tests
were Hand movements from the K-ABC, Kaufman Assessment Battery for Children
(Kaufman & Kaufman, 1983), and Block Design from the WISC-R, Wechsler Intelligence
Scale for Children-Revised, (Wechsler, 1974).
Functional MRI test

8
The stimuli were presented on a screen and viewed via a mirror mounted on the head coil.
The software used was programmed in E-prime (Psychology Software Tools,
http://www.pstnet.com/).
The task-switching paradigm used, was the Switch Task for Children (STC) which was
developed at our department (see for a detailed description, Dibbets & Jolles, in press). The
STC is presented as an adventure game and does not require reading skills, which makes it
suitable for young children and children with SLI. The task consists of two similar, yet
conflicting, tasks: the “day-task” and the “night-task”. During the day-task, an orange house
and a blue house with a white cat in between them were presented against a daytime sky. The
position of the houses, left and right, varied across trials. The child could select one of the two
houses by pressing the accompanying button. Selecting the orange house, correct response,
resulted in finding a treasure chest. Selecting the blue house was punished by marking this
house with a pink cross sign. The absence of a response was neither rewarded nor punished.
During the night-task the houses and cat were presented against a night time sky and selection
of the blue house was rewarded while selection of the orange house was punished. The total
duration of each trial was 6500 ms (2 TRs) and both response accuracy and response time,
RT, were recorded. During the scan session two different conditions were presented: the
switch condition and the nonswitch condition (block design). In the nonswitch condition, one
task was repeatedly presented for 8 trials (e.g., day-day-day-day… or night-night-night-
night…). In the switch condition, 8 trials of the day- and night-task were randomly mixed and
presented at a ratio of 1 to 1 (day-night-night-day…). A signal screen indicated whether only
the day-task, only the night-task, or a mix of both tasks would be presented for the next 8
trials. A total of eight 8-trial blocks were presented with alternating nonswitch and switch
conditions. The onset of each block was synchronized with the scanner and the time between
two blocks was at least 6 seconds. During the scan session, the white cat on the screen

9
changed colour to keep the participant motivated and to give an indication of the remaining
test time. The task started and ended with a passive resting state (each 15 TRs) in which no
response was required. The STC was practiced in a simulation scanner about two weeks prior
to the actual scan session.
fMRI scanning
The children were scanned using a 1.5T MRI scanner (Philips Gyroscan ACS-NT, Eindhoven,
The Netherlands) with a Synergy head coil. Head fixation was accomplished by a foam
padding. Functional images were based on a T2* weighted gradient echo sequence with the
following parameters: flip angle = 90º, TE = 48 ms, TR = 3250 ms, field of view = 224 x 96 x
224, imaging matrix = 128 x 128, slice thickness = 3 mm, slice gap = 0 mm. Scanning
orientation was axial and slice order was interleaved. A total of 200 images for all slices was
collected. For each subject a sagittal T1-weighted anatomical image was acquired at the
beginning of the session (140 slices, imaging matrix = 256 x 256, slice thickness = 1 mm, no
gap).
Behavioural data analysis
Neuropsychological test data were transformed to standard z-scores. Dependent measures of
the STC were the total number of errors, including omitted responses, and the mean response
time in each condition (switch and nonswitch). Only correct responses were used for
calculating the mean response time. Switch costs were calculated by subtracting the mean RT
in the nonswitch condition from the mean RT in the switch condition (RT costs) and by
subtracting the total number of errors in the nonswitch condition from the total number errors
in the switch condition (error costs). Both the behavioural and neuropsychological test data
were analysed using parametric tests (analysis of variance [ANOVA], and GLM with repeated

10
measures). In each analyses group, SLI versus control, functioned as a between-subjects
factor. Bonferroni tests were used to adjust the significance level when multiple or pair wise
comparisons were made. The rejection criterion was p < .05.
Image analysis
The functional MRI data were statistically analysed using Brainvoyager QX 1.3 software
package (www.brainvoyager.de). Preprocessing procedures consisted of 3D motion
correction, slice scan time correction, spatial Gaussian smoothing (4 mm), and temporal
filtering (Highpass filter: 3 and linear trend removal). For each individual, functional and
anatomical images were spatially coregistered and transformed into standard Talairach space
(Talairach & Tournoux, 1988). Although this transformation is based on an adult brain,
several studies have indicated that this transformation can also be applied on functional MRI
data of children (Burgund et al., 2002; Kang, Burgund, Lugar, Petersen, & Schlaggar, 2003).
The loci of activation found, were checked by comparing them to the individual anatomical
images. Two children with SLI were not included in the data analysis, one because of
movement artefacts and one child due to fear for the scanner. Thus the fMRI-data of 4
children with SLI and 7 control children were analysed. To reduce the risk of false-positive
findings, a minimal cluster size of 50 pixels was taken.
The differences between the switch and nonswitch condition in each group were evaluated
using a GLM taking the hemodynamic response function and resting state activation into
account. Group differences were analysed using a random effects GLM with separate subject
predictors. Within group corrections were made by setting q(FDR) < .05. For all
neuroimaging analyses the minimum absolute t-value was set at 4.00.
Results

11
Neuropsychological data
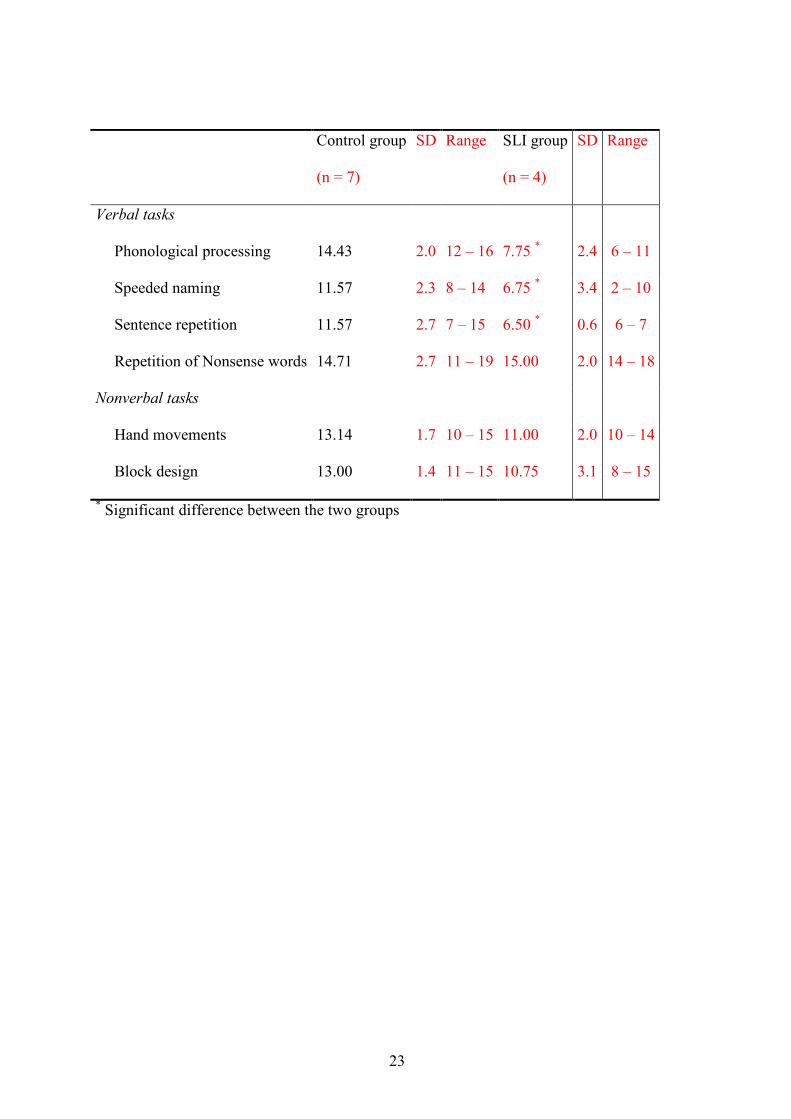
Table 1 summarizes the data of the neuropsychological tests. As expected, had the children
with SLI more problems with the following language-related tasks: Phonological processing,
Speeded naming, and Sentence repetition, Fs(1, 10) > 8.01, Ps < .05. No differences were
found on Repetition of nonsense words, F < 1, and on the nonverbal tasks, Hand movements
and Block design, Fs(1, 10) < 3.65.
Insert Table 1 about here
The Switch Task for Children (STC)
Figure 1 displays the total number of errors (upper panel) and mean RTs (lower panel) for
each group on the STC. On average, the children with SLI made more errors, F(1, 9) = 7.12, P
< .05, and responded slower, F(1, 9) = 8.52, P < .05, than the children without SLI.
Furthermore, both groups were slower in the switch than on the nonswitch condition, F(1, 9)
= 26.75, P < .005. The observed difference in errors between the switch and nonswitch
condition failed to reach significance, F(1, 9) = 3.80, P = .08. No group x condition
interactions were obtained, Fs < 1, and no difference in switch costs, both error costs and RT
costs, was observed between the two groups Fs <1.
Insert Figure 1 about here
Neuroimaging

12
Four planned statistical comparisons were performed, 2 within-group analyses and 2 between-
group analyses for each condition, nonswitch and switch.
Within group: [Switch – Nonswitch]
Control group:. The comparison of the switch condition versus the nonswitch condition
should reflect the neural correlates of additional cognitive processes related to task switching.
A full listing of loci, Talairach coordinates, cluster size, t-values, and anatomical areas is
given in Table 2a. The most prominent activations in the control group were found in right
temporal areas, left and right frontal areas, in the left postcentral gyrus, the left parietal lobe,
and in the left hippocampus (see Figure 2a).
SLI group. Additional activation during performance of the switch condition was found in
three areas: Left superior and medial temporal gyrus and right angular gyrus (see Table 2b
and Figure 2b).
Insert Table 2 about here
Insert Figure 2 about here
Between groups: [SLI – Control]
Nonswitch condition: Table 3a summarizes the differences in activation between the SLI and
control group during performance of the nonswitch condition. In all cases, the SLI group
showed an increase in activation compared to the control group. This increased activation
was, among others, observed in the left and right frontal areas and in the left superior parietal
lobe.
13
Switch condition: Differences in activation between the SLI and control in the switch
condition are summarized in Table 3a. As was the case in the nonswitch condition, children
with SLI exhibited an increase in brain activation relative to the children without SLI. This
increase was mainly observed in the left and right frontal areas, temporal lobe, and in the
cingulate regions.
Insert Table 3 about here
Discussion
This study was performed for two main reasons. First, to detect a possible executive deficit in
children with specific language impairment, SLI, by using a task-switching paradigm.
Second, to explore differences in brain activity between normal control children and children
with SLI during the performance of this paradigm. To this end a modified switching task, the
Switch Task for Children (STC), was presented in an fMRI-environment.
The neuropsychological data indicated that, as can be expected, the children with SLI had
more problems with the language-related tasks, but not with the nonverbal tasks. Unlike other
authors, we do not find a difference between the two groups on the Repetition of nonsense
words (e.g., Gray, 2003; Marton & Schwartz, 2003). A possible explanation can be found in
the task used. The Repetition of nonsense words seems to be a relatively easy task, the mean
z-score of both groups, 14.7, lies well above the average z-score of 10. The other language
tasks in this study, demanded a large input from working memory capacity, whereas in the
Repetition of nonsense words at most 5 syllables needed to be reproduced. However, the
exact reason for not finding a difference between the groups on this task is not clear.

14
The behavioural data of the STC are in line with other task-switching studies in children
and adults (Allport, Styles, & Hsieh, 1994; Jutta Kray, Eber, & Lindenberger, 2004; J. Kray &
Lindenberger, 2000). That is, the children responded slower in the switch than in the
nonswitch condition, reflecting a stronger engagement of executive processes during the
switch condition. However, no specific deficit in executive control was observed for the SLI
group. The switch costs, defined as the difference in performance between the switch and
nonswitch condition, did not differ between the control and SLI group. The mean RT costs for
the control and SLI groups were 317 ms and 352 ms, respectively; the corresponding error
costs were 1.6 and 0.8. Enlarging the power by using the simulation scan data, leading to 6
children with SLI and 7 control children, did not change the switch costs results, Fs < 1. The
only group difference obtained in the STC, was a general slowing and a higher overall error
rate for the SLI group. This general slowing in children with SLI has been reported before and
is ascribed to a global limitation in processing capacity (e.g., Windsor & Hwang, 1999).
Altogether, the behavioural data of the STC do not provide evidence for a specific executive
control deficit in children with SLI, but point in the direction of a more general information
processing deficit, for example a slower or more limited capacity of information processing.
In contrast to the behavioural data, the fMRI [switch – nonswitch] contrast does reveal a
different pattern in the control and SLI group. In the control group, additional activity during
the switch condition was mainly observed in the right temporal areas, left and right frontal
areas, the left parietal lobe, and in the left hippocampus. This activation pattern strongly
corresponds with patterns observed during a similar task-switching paradigm in adults
(e.g.,DiGirolamo et al., 2001; Dreher & Grafman, 2003; Dreher, Koechlin, Ali, & Grafman,
2002), and adds therefore, to the literature on switch-related brain activity. The [switch –
nonswitch] contrast in the children with SLI revealed a completely different pattern.
Additional activation during the switch condition was observed in the left superior and medial

15
temporal gyrus, and in the right intraparietal sulcus, but not in the frontal brain areas.
Although, only the data of four children were analysed, the contrast of each of the children
revealed this pattern. Subtracting the nonswitch from the switch activity, using the
nontransformed data, revealed in each child more activity in right temporal and parietal areas,
but no additional frontal activation was observed. The additional activation in the right
parietal area during switching has been observed before in task-switching studies
(DiGirolamo et al., 2001; Dreher & Grafman, 2003; Dreher et al., 2002), however left medial
and superior temporal activation have, to our knowledge, not been associated with task
switching. Instead, involvement of these areas is normally associated with language
operations and memory retrieval (see for an overview, Cabeza & Nyberg, 2000; Ullman,
2004). A possible explanation for the additional temporal activation in children with SLI is
that, they encounter more problems with the verbalization of the rules during task
performance (e.g., during the day the treasure is hidden in the orange house) or that they have
more problems with the access or retrieval of the task-related information.
From the between-group analyses it can be deduced that the SLI group shows more
elaborate brain activation during performance of the STC, in both the nonswitch and the
switch condition. Additional activation during the nonswitch condition was found in left and
right frontal areas and in the left superior parietal lobe. During the switch condition, the
children with SLI displayed more activation in left and right frontal areas, the temporal lobe,
and in cingulate areas. The additional frontal and parietal activation during the nonswitch
condition is normally associated with executive control functions, such as used during task
switching. This activation can also explain the lack of switch-related frontal activation in the
SLI group. During both the switch and nonswitch condition frontal areas were activated,
resulting in an absence of activity in the [switch – nonswitch] contrast.
16
To our knowledge, only one other study reports the absence of frontal activation during
task switching (DiGirolamo et al., 2001). In this study, the switch versus nonswitch contrast
revealed frontal activity in young adults, but not in older subjects. Like in our study, the lack
of activation can be explained by the presence of frontal activation during the nonswitch
condition. A possible explanation is that older adults compensate for decreased cognitive
abilities by recruiting a variety of frontal areas (Cabeza, 2002). This compensational view can
also be applied to the current study. The findings do suggest that the task was more
demanding for the children with SLI. Recruitment of additional frontal and cingulate areas
might signal the increased effort for successful task performance in children with SLI.
The present study has a number of limitations. First of all, the number of participants in this
study is small. Although, the individual results do match the group data, the statistical power
is limited, restricting the ability to generalize the results. Second, a block design rather than an
event-related design was used. The latter design has a number of advantages, such as the
ability to exclude incorrect trials and the option to examine the effect of negative feedback. In
addition, it enables to separate the actual task switching effects from working memory load
effects. In the present study, these effects are mixed. An event-related design makes it
possible to compare the switch trials within the switch condition, that is a day trial after a
night trial or vice versa (ABA), with the nonswitch trials, a repetition of day or night trials
(AA or BB), while the memory load remains identical. The only disadvantage of an event-
related design is the relatively large number of trials needed. For the present study a block
design was used in order to minimize the task duration during scanning. Furthermore, a pilot
study indicated that presenting the Switch Task for Children in an event-related fashion
resulted in many errors with some children not mastering the task at all. In the future, it would
be interesting to develop a task that enables to further explore brain activity related to
executive control in children with SLI using an event-related design.

17
One last topic mentioned is that of the clinical relevance of the present study. If children
with SLI indeed have a more general information processing deficit, more comprehensive
intervention programs than the traditional language therapy are needed. An early
identification of such problems can help to further develop new remediation and intervention
methods. It is relevant in this respect that the present findings show involvement of prefrontal
structures which are known to be involved in executive control but also in the effective use of
strategies. It is thus probable that training interventions directed at more effective ‘coping
mechanisms’ and compensation for the deficient information processing may provide new
avenues for neuropsychological rehabilitation of the condition.
In conclusion, the data from the current experiment add to the view that SLI is not
restricted to problems in the language domain. The major finding of the present study is the
discrepancy found between the behavioural and neuroimaging data. A deficit in executive
control was not directly observed at the behavioural level, but the neuroimaging data do show
remarkable differences between the SLI and control group. These findings stress the
importance of the utilization of fMRI in cognitive research. The children with SLI recruited
frontal and cingulate areas, normally associated with executive control, even when the task
did not require them in the children without SLI. This might indicate that the task was more
demanding for the SLI group and that compensatory mechanisms were engaged for successful
task performance.

18

19
References
Ahmed, S. T., Lombardino, L. J., & Leonard, C. M. (2001). Specific language impairment: Definitions, causal mechanisms and neurobiological factors. Journal of Medical
Speech Language Pathology, 9(1), 1-15. Allport, D. A., Styles, E. A., & Hsieh, S. (1994). Shifting intentional set: Exploring the
dynamic control of tasks. In C. Umilta & M. Moscovitch (Eds.), Attention and
performance 15: Conscious and nonconscious information processing. Attention and
performance series. (pp. 421-452). Cambridge, MA, US: The MIT Press. Anderson, V. (1998). Assessing executive functions in children: biological, psychological,
and developmental considerations. Neuropsychological Rehabilitation, 8(3), 319-349. Bishop, D. V. (2000). How does the brain learn language? Insights from the study of children
with and without language impairment. Dev Med Child Neurol, 42(2), 133-142. Burgund, E. D., Kang, H. C., Kelly, J. E., Buckner, R. L., Snyder, A. Z., Petersen, S. E., et al.
(2002). The feasibility of a common stereotactic space for children and adults in fMRI studies of development. Neuroimage, 17(1), 184-200.
Cabeza, R. (2002). Hemispheric asymmetry reduction in older adults: the HAROLD model. Psychol Aging, 17(1), 85-100.
Cabeza, R., & Nyberg, L. (2000). Imaging cognition II: An empirical review of 275 PET and fMRI studies. J Cogn Neurosci, 12(1), 1-47.
Dibbets, P., & Jolles, J. (in press). The Switch Task for Children: measuring mental flexibility in young children. Cognitive Development.
DiGirolamo, G. J., Kramer, A. F., Barad, V., Cepeda, N. J., Weissman, D. H., Milham, M. P., et al. (2001). General and task-specific frontal lobe recruitment in older adults during executive processes: a fMRI investigation of task-switching. Neuroreport, 12(9), 2065-2071.
Dove, A., Pollmann, S., Schubert, T., Wiggins, C. J., & von Cramon, D. Y. (2000). Prefrontal cortex activation in task switching: an event-related fMRI study. Brain Res Cogn
Brain Res, 9(1), 103-109. Dreher, J. C., & Grafman, J. (2003). Dissociating the roles of the rostral anterior cingulate and
the lateral prefrontal cortices in performing two tasks simultaneously or successively. Cereb Cortex, 13(4), 329-339.
Dreher, J. C., Koechlin, E., Ali, S. O., & Grafman, J. (2002). The roles of timing and task order during task switching. Neuroimage, 17(1), 95-109.
Duncan, J., & Owen, A. M. (2000). Common regions of the human frontal lobe recruited by diverse cognitive demands. Trends Neurosci, 23(10), 475-483.
Fassbender, C., Murphy, K., Foxe, J. J., Wylie, G. R., Javitt, D. C., Robertson, I. H., et al. (2004). A topography of executive functions and their interactions revealed by functional magnetic resonance imaging. Brain Res Cogn Brain Res, 20(2), 132-143.
Gauger, L. M., Lombardino, L. J., & Leonard, C. M. (1997). Brain morphology in children with specific language impairment. J Speech Lang Hear Res, 40(6), 1272-1284.
Gray, S. (2003). Diagnostic accuracy and test-retest reliability of nonword repetition and digit span tasks administered to preschool children with specific language impairment. JCommun Disord, 36(2), 129-151.
Hornak, J., O'Doherty, J., Bramham, J., Rolls, E. T., Morris, R. G., Bullock, P. R., et al. (2004). Reward-related reversal learning after surgical excisions in orbito-frontal or dorsolateral prefrontal cortex in humans. J Cogn Neurosci, 16(3), 463-478.
Hugdahl, K., Gundersen, H., Brekke, C., Thomsen, T., Rimol, L. M., Ersland, L., et al. (2004). FMRI brain activation in a finnish family with specific language impairment compared with a normal control group. J Speech Lang Hear Res, 47(1), 162-172.

20
Jernigan, T. L., Hesselink, J. R., Sowell, E., & Tallal, P. A. (1991). Cerebral structure on magnetic resonance imaging in language- and learning-impaired children. Arch
Neurol, 48(5), 539-545. Joanisse, M. F., & Seidenberg, M. S. (1998). Specific language impairment a deficit in
grammar of processing? Trends in Cognitive Neurosciences, 7(2), 240-247. Kabani, N. J., MacDonald, D., Evans, A., & Gopnik, M. (1997). Neuroanatomical correlates
of familial language impairment: A preliminary report. Journal of Neurolinguistics,
10(2-3), 203-214. Kang, H. C., Burgund, E. D., Lugar, H. M., Petersen, S. E., & Schlaggar, B. L. (2003).
Comparison of functional activation foci in children and adults using a common stereotactic space. Neuroimage, 19(1), 16-28.
Kaufman, A. S., & Kaufman, N. L. (1983). K-ABC: Kaufman Assessment Battery for
Children. Circle Pines MN: American Guidance Service. Koechlin, E., Ody, C., & Kouneiher, F. (2003). The architecture of cognitive control in the
human prefrontal cortex. Science, 302(5648), 1181-1185. Korkman, M., Kirk, U., & Kemp, S. (1998). NEPSY: a developmental neuropsychological
assessment. San Antonio, TX: Psychological Corporation. Kray, J., Eber, J., & Lindenberger, U. (2004). Age differences in executive functioning across
the lifespan: The role of verbalization in task preparation. Acta Psychologica, 115(2-3), 143-165.
Kray, J., & Lindenberger, U. (2000). Adult age differences in task switching. Psychol Aging,
15(1), 126-147. Liegeois, F., Baldeweg, T., Connelly, A., Gadian, D. G., Mishkin, M., & Vargha-Khadem, F.
(2003). Language fMRI abnormalities associated with FOXP2 gene mutation. Nat
Neurosci, 6(11), 1230-1237. Lou, H. C., Henriksen, L., & Bruhn, P. (1984). Focal cerebral hypoperfusion in children with
dysphasia and/or attention deficit disorder. Archives of Neurology, 41(8), 825-829. Marton, K., & Schwartz, R. G. (2003). Working Memory Capacity and Language Processes
in Children with Specific Language Impairment. Journal of Speech, Language, and
Hearing Research, 46(5), 1138-1153. Monsell, S. (1996). Control of mental processes. In V. Bruce (Ed.), Unsolved mysteries of the
mind: Tutorial essays in cognition. (pp. 93-148). Oxford, England: Erlbaum (Uk) Taylor & Francis, Publ.
Niemi, J., Gunderson, H., Leppaesaari, T., & Hugdahl, K. (2003). Speech lateralization and attention/executive functions in a Finnish family with specific language impairment (SLI). Journal of Clinical and Experimental Neuropsychology, 25(4), 457-464.
Plante, E., Swisher, L., Vance, R., & Rapcsak, S. (1991). MRI findings in boys with specific language impairment. Brain Lang, 41(1), 52-66.
Rogers, R. D., & Monsell, S. (1995). Costs of a predictible switch between simple cognitive tasks. Journal of Experimental Psychology: General, 124(2), 207-231.
Ruge, H., Brass, M., Koch, I., Rubin, O., Meiran, N., & von Cramon, D. Y. (2005). Advance preparation and stimulus-induced interference in cued task switching: further insights from BOLD fMRI. Neuropsychologia, 43(3), 340-355.
Rushworth, M. F., Hadland, K. A., Paus, T., & Sipila, P. K. (2002). Role of the human medial frontal cortex in task switching: a combined fMRI and TMS study. J Neurophysiol,
87(5), 2577-2592. Talairach, J., & Tournoux, P. (1988). Co-planar stereotaxic atlas of the human brain. New
York: Thieme. Tamm, L., Menon, V., & Reiss, A. L. (2002). Maturation of brain function associated with
response inhibition. J Am Acad Child Adolesc Psychiatry, 41(10), 1231-1238.

21
Ullman, M. T. (2004). Contributions of memory circuits to language: the declarative/procedural model. Cognition, 92(1-2), 231-270.
Ullman, M. T., & Pierpont, E. I. (2005). Specific language impairment is not specific to language: the procedural deficit hypothesis. Cortex, 41(3), 399-433.
Vargha-Khadem, F., Watkins, K. E., Price, C. J., Ashburner, J., Alcock, K. J., Connelly, A., et al. (1998). Neural basis of an inherited speech and language disorder. Proc Natl Acad
Sci U S A, 95(21), 12695-12700. Wechsler, D. (1974). Manual for the Wechsler Intelligence Scale for Children-Revised. New
York: Psychological Corporation. Weismer, S. E., Evans, J., & Hesketh, L. J. (1999). An examination of verbal working
memory capacity in children with specific language impairment. J Speech Lang Hear
Res, 42(5), 1249-1260. Windsor, J., & Hwang, M. (1999). Testing the generalized slowing hypothesis in specific
language impairment. J Speech Lang Hear Res, 42(5), 1205-1218. Zelazo, P. D., Muller, U., Frye, D., & Marcovitch, S. (2003). The development of executive
function: Cognitive complexity and control--revised. Monographs of the Society for
Research in Child Development, 68(3), 93-119.
22
Table captions.
Table 1. Mean standardized results, SD, and range on the neuropsychological tasks
Table 2a. Loci showing greater activation during the switch condition in the control group.
Table 2b. Loci showing greater activation during the switch condition in the SLI group.
Table 3a. Loci showing different activation in children with and without SLI in the nonswitch
condition.
Table 3b. Loci showing different activation in children with and without SLI in the switch
condition.
Figure captions.
Figure 1. Total number of errors (top panel) and mean response times (bottom panel) in the
switch and nonswitch condition for each group.
Figure 2a. Additional activity during the switch condition in the control group. For
coordinates, cluster size, t-values, and locations see Table 2a.
Figure 2b. Additional activity during the switch condition in the SLI group. For coordinates,
cluster size, t-values, and locations see Table 2b.
23
Control group
(n = 7)
SD Range SLI group
(n = 4)
SD Range
Verbal tasks
Phonological processing 14.43 2.0 12 – 16 7.75 * 2.4 6 – 11
Speeded naming 11.57 2.3 8 – 14 6.75 * 3.4 2 – 10
Sentence repetition 11.57 2.7 7 – 15 6.50 * 0.6 6 – 7
Repetition of Nonsense words 14.71 2.7 11 – 19 15.00 2.0 14 – 18
Nonverbal tasks
Hand movements 13.14 1.7 10 – 15 11.00 2.0 10 – 14
Block design 13.00 1.4 11 – 15 10.75 3.1 8 – 15
* Significant difference between the two groups

24
Talairach coordinates
x y z Cluster size t value Location Brodmann
areas
Frame
figure 2a
Left and right frontal areas
22 41 -1 90 4.72 Right superior frontal gyrus 10/11 C
-21 -1 51 56 4.44 Left superior frontal gyrus 6 B
-38 54 9 215 4.76 Left medial frontal gyrus 46 D
-24 53 7 132 4.58 Left medial frontal gyrus 10 D
-25 -28 70 171 5.04 Left postcentral gyrus 4 A
-54 -8 13 139 4.42 Left postcentral gyrus 48 E
Right temporal areas
53 -13 4 64 4.38 Right superior temporal gyrus 48 D
51 -12 -14 422 4.62 Right medial temporal gyrus 20 G
64 -41 -1 102 4.53 Right medial temporal gyrus 21 C
63 -30 -18 712 5.40 Right inferior temporal gyrus 20 G
54 -66 1 112 4.16 Right inferior temporal gyrus 37 C
Other areasF
-29 -26 -9 113 4.37 Left hippocampus F
-47 -38 49 67 4.12 Left inferior parietal lobe 40 B
Table 2a

25
Talairach coordinates
x y z Cluster size t value Location Brodmann
areas
Frame
figure 2b
Left temporal areas
-43 -38 19 113 4.32 Left superior temporal gyrus 41 B
-37 -2 -17 83 4.20 Left medial temporal gyrus 21 C
Other areas
32 -43 37 60 4.27 Right intraparietal sulcus 40 A
Table 2b

26
Talairach coordinates
x y z Cluster size t value Location BA
Left and right frontal areas
27 58 -5 148 4.52 Right superior orbitofrontal lobe 11
-3 31 53 101 4.35 Left superior medial frontal lobe 8
-50 11 34 124 4.34 Left precentral gyrus 44
-39 -7 18 115 4.29 Left rolandic operculum 48
Other areas
-26 -71 51 73 4.33 Left superior parietal lobe 7
-28 -7 11 50 4.55 Left putamen
-30 -92 -1 163 4.55 Left medial occipital lobe 18
14 -94 19 55 4.55 Right superior occipital lobe 17
Table 3a

27
Talairach coordinates
x y z Cluster size t value Location BA
Left and right frontal areas
21 17 -15 92 4.35 Right inferior orbitofrontal lobe 11
-18 36 -14 90 4.81 Left medial orbitofrontal lobe 11
18 63 5 98 4.25 Right superior frontal lobe 10
21 31 28 98 4.58 Right superior frontal lobe 9
27 63 10 69 4.25 Right superior frontal lobe 10
12 68 13 114 4.33 Right medial frontal lobe 10
29 50 4 55 4.25 Right medial frontal lobe 10
-12 44 21 246 4.42 Left medial frontal lobe 10
-42 28 32 58 4.98 Left medial frontal lobe 44
47 26 28 136 4.45 Right inferior frontal lobe 44
-51 16 7 93 4.43 Left frontal inferior operculum 48
32 -16 46 113 4.38 Right precentral gyrus 6
-50 5 26 124 4.33 Left precentral gyrus 6
52 6 34 598 4.51 Right postcentral gyrus 4
47 -20 33 128 4.47 Right postcentral gyrus 3
-56 -1 18 124 4.45 Left postcentral gyrus 48
10 14 49 85 4.43 Right SMA 6
Left and right temporal areas
56 -42 16 50 5.47 Right superior temporal lobe 42
-54 -34 -2 99 4.82 Left medial temporal lobe 21
Other areas

28
-20 -63 50 181 4.41 Left superior parietal lobe 7
-9 -29 33 222 4.54 Left cingulum (mid) 32
-11 28 25 50 4.34 Left cingulum (anterior) 32
12 15 34 133 4.44 Right cingulum (mid) 32
16 48 13 80 4.40 Right cingulum (anterior) 32
33 -25 13 156 4.68 Right Heschl gyrus 48
31 -17 17 91 4.39 Right insula 48
-19 18 1 352 5.30 Left putamen
21 8 -1 104 5.07 Right putamen
16 9 16 238 4.67 Right caudate nucleus
-19 -80 38 196 5.12 Left superior occipital lobe 19
18 -82 38 81 4.29 Right superior occipital lobe 19
Table 3b

29
NO SLI SLI
0
1
2
3
4
5
Nonswitch
Switch
Group
Totalnumberoferrors
NO SLI SLI
0
500
1000
1500
2000
2500
Group
RTinms

30
Figure 2a: No SLI
A B D
E F G
C

31
A B C
Figure 2b: SLI