Diatom-based TP and TN inference models and based TP and TN Inference Models and... · UNCORRECTED...
15
UNCORRECTED PROOF Diatom-based TP and TN inference models and indices for monitoring nutrient enrichment of New Jersey streams Karin C. Ponader a, * , Donald F. Charles a , Thomas J. Belton b a Patrick Center for Environmental Research, The Academy of Natural Sciences, 1900 Benjamin Franklin Parkway, Philadelphia, PA 19103, USA b New Jersey Department of Environmental Protection, Science and Research, 401 East State Street, PO Box 409, Trenton, NJ 08625, USA Received 22 May 2005; received in revised form 1 October 2005; accepted 24 October 2005 Abstract We evaluated the potential for using diatoms to assess and monitor nutrient enrichment in New Jersey streams and rivers, and propose inference models and indices for regulatory purposes. We assessed the relationship between benthic diatom and water chemistry samples (n = 101) collected from 45 sites in 3 ecoregions: Northern Piedmont, Northeastern Highlands and Ridge and Valley. Diatom assemblages were dominated by pollution-tolerant taxa. Multivariate analysis showed that nutrient concentra- tions explained significant proportions of the variation in diatom species composition. Weighted-averaging partial least square (WA-PLS) total phosphorus (TP) and total nitrogen (TN) inference models (n = 91) showed good predictive ability (TP model: r 2 apparent ¼ 0:87; r 2 boot ¼ 0:72; RMSE boot = 0.23 log 10 mgL 1 TP; TN model: r 2 apparent ¼ 0:88; r 2 boot ¼ 0:58; RMSE boot = 0.23 log 10 mgL 1 TN). Diatom TP and TN indices were created to simplify presentation of results for the general public by rescaling the inferred TP and TN values from 0 to 100. The obtained index scores were assigned to nutrient impairment categories for regulatory assessment purposes. # 2005 Elsevier Ltd. All rights reserved. Keywords: Diatoms; Nutrients; Inference model; Index; Streams; USA 1. Introduction New Jersey (NJ) is the most densely populated state in the US, with 2937 persons km 2 (US Census Bureau, 2002). Rivers and streams receive high nutrient loadings coming from a variety of urban, residential and agricultural sources (USGS, 2001). Almost half of the 2179 river miles recently assessed This article is also available online at: www.elsevier.com/locate/ecolind Ecological Indicators xxx (2005) xxx–xxx 1 2 3 4 5 6 7 8 9 10 11 12 13 14 15 16 17 18 19 20 21 22 23 24 25 26 27 28 29 30 29 30 31 32 33 34 35 36 * Corresponding author. Tel.: +1 215 405 5077; fax: +1 215 299 1079. E-mail addresses: [email protected] (K.C. Ponader), [email protected] (D.F. Charles), [email protected] (T.J. Belton). 1470-160X/$ – see front matter # 2005 Elsevier Ltd. All rights reserved. doi:10.1016/j.ecolind.2005.10.003 ECOIND 205 1–15
Transcript of Diatom-based TP and TN inference models and based TP and TN Inference Models and... · UNCORRECTED...

1
2
3
4
5
6
7
8
9
10
111213
14
15
16
17
18
19
20
21
22
23
24
25
26
27
28
29
30
This article is also available online at:www.elsevier.com/locate/ecolind
Ecological Indicators xxx (2005) xxx–xxx
OO
F
Diatom-based TP and TN inference models and
indices for monitoring nutrient enrichment
of New Jersey streams
Karin C. Ponader a,*, Donald F. Charles a, Thomas J. Belton b
a Patrick Center for Environmental Research, The Academy of Natural Sciences,
1900 Benjamin Franklin Parkway, Philadelphia, PA 19103, USAb New Jersey Department of Environmental Protection, Science and Research,
401 East State Street, PO Box 409, Trenton, NJ 08625, USA
Received 22 May 2005; received in revised form 1 October 2005; accepted 24 October 2005
R AbstractCTE
D PWe evaluated the potential for using diatoms to assess and monitor nutrient enrichment in New Jersey streams and rivers, and
propose inference models and indices for regulatory purposes. We assessed the relationship between benthic diatom and water
chemistry samples (n = 101) collected from 45 sites in 3 ecoregions: Northern Piedmont, Northeastern Highlands and Ridge and
Valley. Diatom assemblages were dominated by pollution-tolerant taxa. Multivariate analysis showed that nutrient concentra-
tions explained significant proportions of the variation in diatom species composition. Weighted-averaging partial least square
(WA-PLS) total phosphorus (TP) and total nitrogen (TN) inference models (n = 91) showed good predictive ability (TP model:
r2apparent ¼ 0:87; r2boot ¼ 0:72; RMSEboot = 0.23 log10 mg L�1 TP; TN model: r2apparent ¼ 0:88; r2boot ¼ 0:58; RMSEboot = 0.23
log10 mg L�1 TN). Diatom TP and TN indices were created to simplify presentation of results for the general public by rescaling
the inferred TP and TN values from 0 to 100. The obtained index scores were assigned to nutrient impairment categories for
regulatory assessment purposes.
# 2005 Elsevier Ltd. All rights reserved.
Keywords: Diatoms; Nutrients; Inference model; Index; Streams; USA
UN
CO
RR
E
29
30
31
32
33
34
35
36
* Corresponding author. Tel.: +1 215 405 5077;
fax: +1 215 299 1079.
E-mail addresses: [email protected] (K.C. Ponader),
[email protected] (D.F. Charles),
[email protected] (T.J. Belton).
1470-160X/$ – see front matter # 2005 Elsevier Ltd. All rights reserved
doi:10.1016/j.ecolind.2005.10.003
1. Introduction
New Jersey (NJ) is the most densely populated state
in the US, with 2937 persons km�2 (US Census
Bureau, 2002). Rivers and streams receive high
nutrient loadings coming from a variety of urban,
residential and agricultural sources (USGS, 2001).
Almost half of the 2179 river miles recently assessed
.
ECOIND 205 1–15

R
K.C. Ponader et al. / Ecological Indicators xxx (2005) xxx–xxx2
36
37
38
39
40
41
42
43
44
45
46
47
48
49
50
51
52
53
54
55
56
57
58
59
60
61
62
63
64
65
66
67
68
69
70
71
72
73
74
75
76
77
78
79
80
81
82
83
84
84
85
86
87
88
89
90
91
92
93
94
95
96
97
98
99
100
101
102
103
104
105
106
107
108
109
110
111
112
113
114
115
116
117
118
119
120
121
122
123
124
125
126
127
128
CO
R
by the NJ Department of Environmental Protection
(NJDEP) did not meet standards of less than
0.1 mg L�1 TP (NJDEP, 2003). These nutrient lo-
adings and resulting algal growth can render waters
unsuitable for NJs’ designated uses, such as potable
water supply, recreational use, fisheries, and aquatic
life (NJDEP, 2001).
Monitoring of nutrient levels in rivers and
streams is problematic because of periodic and
diffuse input from non-point sources (Cattaneo and
Prairie, 1995; Chetelat and Pick, 2001). Benthic
diatom species composition responds directly to
nutrients (Pan and Lowe, 1994; Pan et al., 1996;
Stevenson and Pan, 1999), and can be a more stable
indicator of trophic state than measurements of
nutrient concentrations or algal biomass (USEPA,
2000b).
The goal of this study was to develop robust
diatom-based tools to monitor and assess nitrogen and
phosphorus concentrations and periphyton responses
in NJ streams and rivers. It was therefore important
that these tools: (a) accurately characterize nutrient
concentrations, (b) be consistent with NJ nutrient cri-
teria categories, (c) be practical for routine monitor-
ing, and (d) could be used in conjunction with other NJ
bioindicators.
We chose weighted averaging (WA) inference
modeling (ter Braak and Juggins, 1993) as our
approach because it is the most accurate method for
quantifying species response to nutrients (Hall and
Smol, 1992; Dixit and Smol, 1994; Reavie et al.,
1995; Pan et al., 1996; Winter and Duthie, 2000;
Bennion et al., 2001; Bradshaw and Anderson, 2001;
Soininen and Niemela, 2002). We used the nutrient
concentrations inferred from the models in two ways.
First, we used the inferred values as estimates of the
nutrient concentrations prevailing at the site during
the time the algal assemblages were developing.
Second, we rescaled the inferred concentrations from
0 to 100 to create diatom TP and TN indices to
provide a management tool that is easily inter-
pretable and partitioned into categories of protection
for critical designated uses under the Clean Water
Act (U.S. Code, 2002), and that are similar to
existing Trophic Diatom Indices (TDI’s) (Descy and
Coste, 1990; Schiefele and Schreiner, 1991; Kelly
and Whitton, 1995; Coring et al., 1999; Rott et al.,
2003).
UN
EC
TED
PR
OO
F
2. Methods
2.1. Study sites
This studywas conducted in northern and centralNJ,
USA, in the Northern Piedmont, the Northeastern
Highlands and the Ridge and Valley ecoregions
(Omernik, 1987, 1995) (Fig. 1). Land-use in the
Piedmont is primarily urban and agriculture, whereas in
the Highlands and the Ridge and Valley it is pre-
dominantly forest and agriculture (USEPA, 2000d).
Because of the approach we used to develop algal
indicators of anthropogenic nutrient enrichment, it
was important to select study sites with relatively
similar natural environmental conditions (e.g. geol-
ogy, geomorphology), but with a wide range of
nutrient concentrations. We based our selection of
sites on chemistry data available from the NJDEP and
US Geological Survey (USGS) monitoring networks.
All selected sites were part of an Ambient Biomo-
nitoring Network (AMNET) (NJDEP, 2000), and
reflected a range of known biological impairments
based on macroinvertebrate data collected between
1992 and 1999 (NJDEP, 1993b, 1999). All sites
selected were first to sixth order wadeable rivers and
streams. We sampled 45 AMNET sites: 12 in the
Highlands, 5 in the Ridge and Valley and 28 in the
Piedmont (Fig. 1). Physical characteristics, water
chemistry and other site information are summarized
in Table 1. Detailed site information, including site
name and location, and physical and water chemistry
data are available at http://www.diatom.acnatsci.org/
autecology/.
2.2. Field and laboratory procedures
Samples of epilithic diatoms were collected from
August through October 2000–2002. The sampling
area at each site was divided into three sections, so that
within-site variability could be assessed. For each
section, we estimated the percent of each substrate
type (boulder, cobble, gravel, sand, silt, bedrock) to
the nearest percent using habitat assessment protocols
adapted from Barbour et al. (1999). We categorized
flow velocity as slow, moderate, or fast and measured
light conditions (percent open canopy cover) using a
spherical densiometer. One quantitative composite
biomass sample was collected from three rocks per
ECOIND 205 1–15

R
PR
OO
F
K.C. Ponader et al. / Ecological Indicators xxx (2005) xxx–xxx 3
128
129
130
131
132
133
134
135
136
137
138
139
140
141
142
143
144
145
146
147
148
149
150
151
151
152
153
154
155
156
157
158
159
160
161
162
163
164
165
166
167
168
169
170
171
172
173
174
Fig. 1. Geographic location of study sites and ecoregions.
CO
R
section for measurement of chlorophyll a (chl a) and
ash-free dry mass (AFDM). Rock surfaces were
sampled using the ‘top-rock scrape method’ (Moulton
et al., 2002).
Water chemistry samples were collected at the time
of algal sampling. One unfiltered and one filtered
sample (250 mL each) were taken for nutrient
analysis. Filtering was done using a plastic syringe
with an attached filtration device using a 0.7 mm
Whatman glass microfiber filter. In addition, one
unfiltered 500 mL samplewas collected for analysis of
major anions and cations. Laboratory analysis of
dissolved nitrate + nitrite (NO3 + NO2, here referred
to as NO3-N), total Kjeldahl nitrogen (TKN),
dissolved ammonia (NH3-N), orthophosphate (O-P),
total phosphorus (TP), chloride (Cl�), total alkalinity,
total hardness, and conductivity was performed by the
Patrick Center for Environmental Research (PCER)
Geochemistry Section under the direction of Dr. D.
Velinsky following USGS methods (Fishman, 1993).
Total nitrogen (TN) was calculated from a combina-
tion of TKN and NO3 + NO2. During 2000 and 2001,
samples for TKN analysis were collected by NJDEP
UN
EC
TEDand USGS. During 2003, TKN samples were collected
at the time of algal sampling and analyzed by PCER.
Chl a and AFDM samples were analyzed by PCER
using standard methods (APHA et al., 1995) and
USEPAmethod 445 (USEPA, 1992). Additional water
chemistry data for water quality monitoring stations
were provided by NJDEP and USGS staff. In 2002, we
measured conductivity and pH in the field using a
portable meter (Oakton pH/CON 10 Multiparameter
Meter). All other chemistry and land-use data (percent
land-use type per watershed) were provided by the
NJDEP.We used water chemistry data for samples that
were collected closest to the time of algal sampling.
Diatom samples were collected from natural rock
substrates using techniques consistent with those used
in the USGS NAWQA program (Moulton et al., 2002)
and those recommended by the USEPA (Barbour et al.,
1999). A composite diatom sample was created by
randomly selecting four to five rocks of ca. 5 cm
diameter from mid-stream. Diatoms were removed
from the rocks by scraping and brushing. Diatoms were
cleaned, permanently mounted on microscope slides,
and counted following USGS NAWQA protocols
ECOIND 205 1–15

UNCORRECTED PROOF
K.C
.P
on
ad
eret
al./E
colo
gica
lIn
dica
tors
xxx(2
00
5)
xxx–xxx
4
ECOIN
D205
1–15
Table 1
Water chemistry parameters and physical site characteristics of all 45 sampling sites by ecoregion
Parameter Northern Piedmont Highlands Ridge and Valley All ecoregions combined
Mean Median Minimum Maximum Mean Median Minimum Maximum Mean Median Minimum Maximum Mean Median Minimum Maximum
NO3-N (mg L�1) 1719 1307 232 5525 1013 441 22 7992 178 198 10 361 1524 1155 10 7992
TN (mg L�1) 2241 1856 362 6200 1272 818 247 8547 416 538 170 577 1987 1653 170 8547
O-P (mg L�1) 98 60 4 663 28 13 2 146 5 4 2 10 81 41 2 663
TP (mg L�1) 127 75 12 731 41 32 6 177 15 14 8 29 107 62 6 731
NH3-N (mg L�1) 47 24 3 177 12 5 2 52 4 4 2 7 39 23 2 177
Chl a (mg m�2) 124 85 3 1115 60 70 7 132 73 42 15 248 111 81 3 1115
AFDM (g m�2) 25 17 4 153 10 9 4 17 14 7 5 39 22 13 4 153
Hard (mg L�1) 102 90 45 280 100 107 25 240 157 136 46 306 105 90 25 306
Alk (mg L�1) 69 64 20 186 66 64 7 182 109 90 30 236 70 64 7 236
DO (mg L�1) 7.5 8.0 2.8 11.3 8.5 9.0 4.9 11.3 7.4 8.8 2.8 10.0 7.7 8.2 2.8 11.3
pH 7.6 7.6 6.5 9.0 7.6 7.7 6.8 8.2 7.9 7.8 7.7 8.1 7.6 7.6 6.5 9.0
Cond (mS cm�1) 341 285 93 983 253 244 51 663 369 291 121 741 327 282 51 983
Cl� (mg L�1) 50.0 42.7 2.8 240.0 27.5 21.4 3.6 69.0 21.5 17.3 1.4 55.8 44.8 37.5 1.4 240.0
BASIN (km2) 190 62 1 1962 45 31 5 190 139 76 10 417 163 56 1 1962
URB (%) 47 45 6 92 22 21 4 60 8 8 2 14 41 32 2 92
AG (%) 14 15 0 56 12 11 0 21 13 11 0 29 14 11 0 56
FOR (%) 29 23 3 93 51 51 20 76 64 70 30 86 34 33 3 93
Open (%) 48 31 1 100 27 20 1 77 53 53 29 75 45 31 1 100
BRBD (%) 9 5 0 51 28 13 0 72 36 30 10 60 13 7 0 72
CBGR (%) 60 65 0 95 48 50 28 70 46 50 30 60 57 60 0 95
SDSTCL (%) 31 27 0 100 23 27 0 55 18 20 10 30 29 26 0 100
AvgW (m) 14.1 9.0 2.8 50.0 6.8 8.0 2.0 10.0 6.8 8.0 2.0 12.5 12.5 8.5 2.0 50.0
SecL (m) 47.8 40.0 5.0 125.0 30.6 30.0 15.0 40.0 26.0 20.0 20.0 40.0 43.8 40.0 5.0 125.0
Flow (estimate) 1.9 2.0 1.0 3.0 1.8 2.0 1.0 2.5 1.7 1.5 1.5 2.0 1.9 2.0 1.0 3.0
NO3-N: dissolved nitrate + nitrite; TN: total nitrogen; O–P: orthophosphate; TP: total phosphorus; NH3-N: dissolved ammonia; Chl a: chlorophyll a; AFDM: ash free dry mass; Hard: total
hardness; Alk: total alkalinity; DO: dissolved oxygen; Cond: conductivity; Cl�: chloride; BASIN: basin size; URB: % urban land-use; AG: % agriculture land-use; FOR: % forest land-use;
Open: % open canopy cover; BRBD: % bedrock and boulder; CBGR: % cobble and gravel; SDSTCL: % sand silt and clay; AvgW: average stream width; SecL: section length; Flow: flow
estimate, mean per section (1 = slow, 2 = medium, 3 = fast).

R
K.C. Ponader et al. / Ecological Indicators xxx (2005) xxx–xxx 5
174
175
176
177
178
179
180
181
182
183
184
185
186
187
188
189
190
191
192
193
194
195
196
197
198
199
200
201
202
203
204
205
206
207
208
209
210
211
212
213
214
215
216
217
218
219
219
220
221
222
223
224
225
226
227
228
229
230
231
232
233
234
235
236
237
238
239
240
241
242
243
244
245
246
247
248
249
250
251
252
253
254
255
256
257
258
259
260
261
262
263
264
265
266
267
CO
R
(Charles et al., 2002). Per slide, 600 valves were
identified to lowest taxonomic level and their relative
abundance was recorded.
2.3. Numerical analysis
2.3.1. Dataset and data transformations
The complete dataset used in the analysis contained
101 samples from 45 sites: 45 samples were
‘independent’ samples, e.g. they were collected from
section 1 of the respective sites; another 45 samples
were ‘multiple samples’, e.g. samples collected from
sections 2 and 3 of the respective sites. Eleven samples
were ‘repeat samples’, e.g. samples from sites that had
been sampled once in 2000, and which were revisited
during the summers of 2001 and/or 2002 to provide a
2–3-year record of species composition for compar-
ison. Multiple and repeat samples were collected to
capture a bigger range of within-site as well as among-
year variability. Of the total 101 samples, 5 were
collected in the Ridge and Valley, 15 were collected in
the Highlands and 81 were collected in the Piedmont
physiographic provinces. The sites for which multiple
and repeat samples were taken were distributed evenly
along the measured TP and TN gradients and therefore
the inclusion of these additional samples did not skew
the dataset to either end of the nutrient range. Diatom
taxa were included in the analysis if their abundance
was �0.5% in at least two samples. All relative
abundance data were square-root transformed. The
water chemistry and physical parameters included in
the ordinations are listed in Table 1. Three substrate
categories were formed by combining the percentages
of two or three substrate types: % bedrock and boulder
(BRBD), % cobble and gravel (CBGR), and % sand
silt and clay (SDSTCL). Environmental variables
were transformed to reduce skewed distributions: all
water chemistry variables, except pH, were log10-
transformed; all data expressed in percentages (land-
use, substrate, and open canopy cover) were square-
root transformed.
2.3.2. Ordinations
Principal components analysis (PCA) was per-
formed to detect major gradients and principal
patterns of variation within the environmental vari-
ables (ter Braak and Prentice, 1988). The environ-
mental variables were centered and standardized. In
UN
EC
TED
PR
OO
F
the same PCA, ‘‘outliers’’ or ‘‘rogues’’ were defined as
samples with extreme sample scores on any of the first
four axes of the PCA of the environmental data (Birks
et al., 1990). Extreme sample scores were defined as
scores falling above the 95% confidence interval of all
sample score means (Winter and Duthie, 2000).
Detrended correspondence analysis (DCA) with
detrending by 26 segments and down-weighting of
rare taxa was used to examine patterns in the diatom
data, and to determine the maximum amount of
variation within the species composition data (ter
Braak, 1995). We used the gradient length of the main
DCA ordination axes to determine whether linear or
unimodal techniques were to be applied for modeling
the relationship between diatoms and environmental
variables (ter Braak and Prentice, 1988). Furthermore,
DCAwas used to determine outliers, e.g. samples that
showed extreme sample scores on any of the first four
axes of the DCA of the species data (Birks et al.,
1990). Outliers were screened using the same criteria
as applied in PCA. All samples determined as outliers
by PCA and DCAwere excluded from all subsequent
ordinations and from the development of calibration
models.
A series of correspondence analyses (CA) and
canonical correspondence analyses (CCAs) with
down-weighting of rare taxa was performed, in order
to determine the variables that independently
explained a significant amount of variation in diatom
species composition (ter Braak, 1995). First, a CAwas
run with passive environmental variables to determine
the strength of the correlations among all 24
environmental variables and all 131 species, as well
as to identify variables that were intercorrelated, based
on weighted correlations and variance inflation factors
(VIFs). Variables with VIFs > 5 indicated strong co-
linearity among environmental variables and were
removed from all subsequent analyses. The data from
the remaining 13 variables and all sites were included
in a CCA analysis with forward selection in order to
identify the minimal number of variables that
explained the largest amount of variation in the
diatom species data. Unrestricted Monte Carlo
permutation tests (999 permutations) were used to
assess the statistical significance of each forward
selected variable (P < 0.05). As a last step, to assess
the strength of the relationship between diatom
species composition and the forward selected vari-
ECOIND 205 1–15
R
P
K.C. Ponader et al. / Ecological Indicators xxx (2005) xxx–xxx6
267
268
269
270
271
272
273
274
275
276
277
278
279
280
281
282
283
284
285
286
287
288
289
290
291
292
293
294
295
296
297
298
299
300
301
302
303
304
305
306
307
308
309
310
311
312
313
313
314
315
316
317
318
319
320
321
322
323
324
325
326
327
328
329
330
331
332
333
334
335
336
337
338
339
340
341
342
343
344
345
346
347
348
349
350
351
352
353
354
355
CO
R
ables, we ran CCAs constrained to one variable at a
time. A high ratio between the first (constrained)
eigenvalue and the second (unconstrained) eigenvalue
(e.g. l1/l2 > 0.5) indicated strong influence of these
variables on diatom species composition, and justified
development of inference models (Bigler and Hall,
2002; Winter and Duthie, 2000). All ordinations were
produced using Canoco for Windows, version 4.5 (ter
Braak and Smilauer, 2002).
2.3.3. Species optima and tolerances, and
inference models
Weighted averaging (WA) regression and calibra-
tion techniques were used to calculate diatom species
optima and tolerances as well as to develop and test
diatom inference models for TP and TN. The models
were developed using the program C2, version 1.3
(Juggins, 2003). Several models were constructed,
based on WA inverse and classical deshrinking (Birks
et al., 1990) and on weighted-averaging partial least
square regression (WA-PLS) (ter Braak and Juggins,
1993). Model error estimation was performed by
bootstrapping with 1000 cycles (Birks, 1995). We
selected the best inference model (e.g. the ‘minimal
adequate model’ sensu Birks, 1998), based on a
combination of the following characteristics: (a) the
highest prediction accuracy, e.g. the lowest root mean
square error of prediction (RMSEP) based on cross-
validation; (b) the highest coefficient of determination
(r2) between observed and inferred values, and (c) the
minimum number of WA-PLS components (Birks,
1995).
2.3.4. Index development
We created diatom TP and TN indices based on
values inferred for each diatom sample using the two-
and three-component WA-PLS models (n = 91). Index
values were calculated by multiplying the inferred
nutrient values (log10) obtained for each sample by a
constant that converted them to a scale from 0 to 100
(TP index = 33.33 � inferred log10 TP); TN index =
50 � (inferred log10 TN-2). The 0–100 scales corre-
spond to log10 TP from 1 to 1000 mg L�1 and log10 TN
from 100 to 10,000 mg L�1. The ranges for both
parameters were set slightly above the maximum and
below the minimum values in our dataset.
We divided the 0–100 scale into trophic state
categories ranging from 1 (low) to 3 (high) for TN, and
UN
RO
OF
from 1 (low) to 4 (very high) for TP, with respect to the
range of values in the calibration dataset. The category
boundaries are those suggested by Wetzel (2001) for
trophic classification of temperate streams, based on
the biomass–nutrient relationships established in
Dodds et al. (1998). The four TP categories esta-
blished were (1) less than 0.025 mg L�1 TP, (2) 0.025–
0.075 mg L�1 TP, (3) 0.075–0.1 mg L�1 TP, and (4)
above 0.1 mg L�1 TP. These correspond to the
following log10 TP values: (1) less than 1.4, (2)
1.4–1.9, (3) 1.9–2.0, and (4) above 2.0, and to the
index scores of (1) 0–47, (2) 47–63, (3) 63–67, and (4)
above 67. The lower boundary of category 4
(0.1 mg L�1 TP) is also the nutrient criteria for NJ.
Because the TN gradient was shorter, we established
only three categories for TN, from 1 (low) to 3 (high).
The final TN categories established were (1) less than
0.7 mg L�1 TN, (2) 0.7–1.5 mg L�1 TN, and (3) above
1.5 mg L�1 TN. These correspond to the following
log10 TN values: (1) less than 2.8, (2) 2.8–3.2, and (3)
above 3.2, and to the index scores of (1) less than 42,
(2) 42–59, and (3) above 59.
EC
TED
3. Results
3.1. Diatom species composition
In all, 399 diatom taxa were identified. Of these,
131 taxa were included in the data analysis. The 10
most abundant species, determined by high abun-
dances and high effective numbers of occurrences
based on Hill’s N2 (Hill, 1973), had high TP and TN
WA-optima (Table 2). Pollution-tolerant taxa domi-
nated.
3.2. Environmental gradients and species
distributions
We identified two major gradients in the environ-
mental data, based on PCA. The first PCA axis (30.6%
variance explained) reflected a chemical gradient
driven by all inorganic nutrients measured, % urban
land-use, conductivity and chloride. The second axis
(16.7% variance explained) revealed a physical
gradient influenced by average river width and basin
size, % open canopy cover, and % sand, silt, and clay
substrates. In the DCA of diatom data, the eigenvalues
ECOIND 205 1–15

UN
CO
RR
EC
TED
PR
OO
F
K.C. Ponader et al. / Ecological Indicators xxx (2005) xxx–xxx 7
ECOIND 205 1–15
Table 2
Species apparent optima and tolerances estimated by WA
Taxon name Hill’s N2 TP (mg L�1) TN (mg L�1)
Optima Tolerance Optima Tolerance
Achnanthidium rivulare Potapova and Ponader 27 25.26 2.62 956.27 2.72
Navicula antonii Lange-Bertalot 15 30.19 2.12 919.77 1.75
Cocconeis placentula var. euglypta (Ehrenberg) Cleve 14 30.51 2.49 834.31 2.41
Nitzschia fonticola Grunow 16 30.86 2.64 915.29 2.28
A. minutissimum (Kutzing) Czarnecki 48 32.54 2.62 1016.46 2.47
Encyonema minutum (Hilse) Mann 25 35.05 2.33 1040.66 2.13
N. cryptocephala Kutzing 21 37.25 2.52 1241.02 2.65
N. cryptotenella Lange-Bertalot 44 38.84 2.35 1155.82 2.16
Cymbella tumida (Brebisson ex Kutzing) Van Heurck 13 39.79 2.60 890.14 2.13
C. pediculus Ehrenberg 26 40.30 2.72 1097.97 2.67
N. decussis Østrup 18 42.34 2.23 1073.77 2.21
Diatoma vulgaris Bory 23 43.49 2.17 1216.35 1.85
Nitzschia archibaldii Lange-Bertalot 16 43.53 2.91 1152.74 2.16
Nitzschia linearis (Agardh ex W. Smith) W. Smith 11 43.53 2.25 926.96 2.25
Amphora inariensis Krammer 11 45.14 2.41 1255.19 2.22
N. tripunctata (O.F. Muller) Bory 27 45.84 2.50 1266.25 2.09
Reimeria sinuata (Gregory) Kociolek and Stoermer 49 47.31 2.24 1279.38 2.04
Gomphonema minutum (Agardh) Agardh 24 47.99 2.39 1322.18 1.98
Synedra ulna Ehrenberg 27 48.13 2.13 1263.80 1.73
N. capitatoradiata Germain 25 50.34 2.17 1274.71 1.91
Nitzschia liebethruthii Rabenhorst 35 51.73 2.50 1498.79 2.12
Nitzschia recta Hantz. ex Rabenhorst 17 51.97 2.62 1980.48 2.22
Planothidium lanceolatum (Brebisson ex Kutzing) L.-B. 49 52.22 2.14 1472.86 2.09
G. parvulum (Kutzing) Kutzing 53 52.68 2.32 1331.37 2.04
Amphora pediculus (Kutzing) Grunow 42 54.09 2.08 1448.77 1.80
Achnanthes subhudsonis var. kraeuselii Cholnoky 34 55.43 3.14 1472.55 2.28
N. perminuta Grunow 27 56.02 2.11 1639.34 1.71
Melosira varians Agardh 51 58.49 2.25 1538.05 1.83
Caloneis bacillum (Grunow) Cleve 40 59.36 2.53 1554.71 2.12
N. germainii Wallace 42 60.50 2.06 1488.02 1.68
Mayamaea atomus (Kutzing) Lange-Bertalot 22 60.67 1.66 1601.95 1.46
Nitzschia dissipata (Kutzing) Grunow 31 62.56 2.42 1606.46 1.85
C. placentula var. lineata (Ehrenberg) Van Heurck 48 63.29 2.24 1602.54 1.78
P. frequentissimum (Lange-Bertalot) Lange-Bertalot 56 63.92 2.25 1641.01 2.03
Staurosirella pinnata (Ehrenberg) Williams et Round 18 64.25 3.47 1323.58 2.57
Rhoicosphenia abbreviata (Agardh) Lange-Bertalot 70 64.46 2.36 1569.24 1.96
Achnanthes conspicua Mayer 35 67.18 1.77 1842.85 1.64
N. erifuga Lange-Bertalot 10 68.02 2.22 1527.64 1.78
Frustulia vulgaris (Thwaites) De Toni 11 68.15 2.09 1438.53 1.65
N. canalis Patrick 21 69.13 2.50 2094.02 1.87
Nitzschia palea (Kutzing) W. Smith 53 69.92 2.34 1720.68 1.81
N. rostellata Kutzing 27 71.52 1.82 1779.18 1.56
N. minima Grunow 67 71.86 2.21 1626.86 1.86
N. symmetrica Patrick 46 72.39 2.21 1613.84 1.74
Gyrosigma acuminatum (Kutzing) Rabenhorst 13 72.67 2.39 1404.91 1.76
Cyclotella meneghiniana Kutzing 33 73.71 2.74 1491.94 1.89
N. gregaria Donkin 58 74.07 2.23 1764.09 1.78
N. subminuscula (Manguin) 33 74.07 1.98 1621.92 1.54
N. lanceolata (Agardh) Ehrenberg 45 74.94 2.27 1934.33 1.71
N. capitata Ehrenberg 11 75.12 2.22 1560.52 1.70
Nitzschia amphibia Grunow 60 75.42 2.06 1841.20 1.80
Fragilaria vaucheriae (Kutzing) Petersen 17 75.56 3.02 1704.39 2.05

OO
F
K.C. Ponader et al. / Ecological Indicators xxx (2005) xxx–xxx8
355
356
357
358
359
360
361
362
363
363
364
365
366
367
368
369
Table 2 (Continued )
Taxon name Hill’s N2 TP (mg L�1) TN (mg L�1)
Optima Tolerance Optima Tolerance
Nitzschia inconspicua Grunow 56 75.84 1.87 1830.04 1.60
Nitzschia capitellata Hustedt 20 76.30 1.89 2194.22 1.62
A. exiguum (Grunow) Czarnecki 17 76.53 2.18 1883.52 1.80
Bacillaria paradoxa Gmelin 18 77.08 2.30 2457.93 1.75
N. ruttnerii var. capitata Hustedt 23 78.85 1.89 1901.91 1.63
N. agrestis Hustedt 13 81.02 2.15 1866.16 1.69
Staurosira construens (Ehrenberg) Williams et Round 11 82.34 2.93 1586.97 2.66
Cyclotella pseudostelligera Hustedt 21 85.75 2.50 2077.26 1.76
Sellaphora seminulum (Grunow) Mann 55 88.40 2.11 1835.86 1.72
S. pupula (Kutzing) Meresckowsky 24 88.91 2.21 1941.51 1.63
G. kobayasii Kociolek and Kingston 39 90.67 2.58 1785.54 1.80
N. ingenua Hustedt 12 91.75 1.78 1773.62 1.30
N. recens Lange-Bertalot 21 101.10 2.28 1742.53 1.56
Aulacoseira granulata (Ehrenberg) Simonsen 10 124.04 3.13 2628.27 1.80
Cyclotella atomus Hustedt 11 155.60 2.18 2070.28 1.51
Luticola goeppertiana (Bleisch) Mann 13 163.02 2.15 2564.25 1.40
Only species with effective numbers of occurrence (Hill’s N2) > 10 are shown. Species are sorted by increasing TP optima.
of the first two axes were l1 = 0.3 and l2 = 0.17,
accounting for 20.1% of the variance in the species
data (Fig. 2). The gradient lengths of the first two DCA
axes of 2.7 and 1.8 standard deviation (S.D.) units
indicated that either linear or unimodal species
response models would be effective (ter Braak and
Prentice, 1988). As the gradient length of the first
DCA axis was above two S.D., we chose to use
UN
CO
RR
370
371
372
373
374
375
376
377
378
379
380
381
382
383
384
385
386
387
388
389
390
Fig. 2. Detrended correspondence analysis (DCA) biplot showing
samples and passive environmental variables. Horizontal
axis = DCA axis 1; vertical axis = DCA axis 2. Ecoregions in which
sites are located are indicated by specific symbols. Circles: Northern
Piedmont; squares: Highlands; diamonds: Valley and Ridge. Abbre-
viations used for environmental variables can be found in Table 1.
EC
TED
PRtechniques based on assumptions of unimodal species
distribution (ter Braak, 1995).
3.3. Data screening
Ten samples were identified as outliers, based on
PCA and DCA, and were removed from CCA analysis
and inference model development. Five of these
samples were from three sites, and were determined to
be outliers because of their high sample score means
on the PCA axes. All three sites had high conductivity
values (595–983 mS cm�1) and a high percentage of
sand, silt, and clay sediments. The nutrient values for
two of these sites were high (TP: 0.69 and
0.73 mg L�1; TN: 5.4 and 6.1 mg L�1). Although it
was important to keep samples with high nutrient
concentrations in the dataset, the extreme values of
conductivity were considered to be a potential
problem for the development of nutrient inference
models. Eight samples from six sites were identified as
outliers because of their high sample score means on
the DCA axes (Fig. 2). Because all six sites had low
nutrient concentrations, and it was important that sites
in the calibration dataset have a wide nutrient gradient,
we decided to exclude only the five samples from the
two sites with the lowest pHs (6.5 and 6.7) in the
dataset. In addition, one site had a high % of sand
substrate. Despite the fact that both sites represented
the low end of the phosphorus gradient, we decided to
ECOIND 205 1–15

R
K.C. Ponader et al. / Ecological Indicators xxx (2005) xxx–xxx 9
390
391
392
393
394
395
396
397
398
399
400
401
402
403
404
405
406
407
408
409
410
411
412
413
414
415
416
417
418
419
420
421
422
423
424
425
426
427
428
429
430
431
432
433
434
435
436
436
437
438
439
440
441
442
443
444
445
446
447
448
449
450
451
452
453
454
455
456
457
458
459
460
461
462
463
464
465
466
467
468
469
470
471
472
473
474
475
476
477
478
479
480
CO
R
exclude them from further model development to
avoid the influence of a strong pH and alkalinity
gradient. Data analyses were performed using the
reduced dataset of 91 samples, that excluded the 10
outlier samples.
3.4. Relationships between diatom assemblages
and environmental variables
We used CA to determine the environmental
variables explaining most of the variation in diatom
species composition, and especially the importance of
nutrients as compared with other environmental
characteristics. In a CA including all 24 environmental
variables as passive variables and diatom data for 91
sites, 21.8% of the total variance of the diatom data
was explained by CA axis 1 (l1 = 0.27) and CA axis 2
(l2 = 0.19). The species-environment correlations
were high for both, axis 1 (r = 0.90) and axis 2
(r = 0.91), accounting for 35.1% of the variance in the
species–environment relationships. This indicates a
strong correlation between the 24 environmental
variables and the 131 species included in the complete
CA. Nevertheless, strong weighted correlations and
relatively high variance inflation factors (VIFs > 5)
indicated strong co-linearity among several environ-
mental variables. Consequently, we omitted the
following 11 variables from further analysis: O-P,
NO3-N, NH3-N, average river width, reach length, %
urban land-use, % open canopy cover, % cobble and
gravel, AFDM, hardness, and conductivity. Because
TN and NO3-N, as well as TP and O-P, were highly
correlated, only one of the two variables, respectively,
could be selected. Because TP and TN are more
important with respect to management purposes, we
chose to eliminate the variables O-P and NO3-N. CCA
with forward selection that excluded these variables,
and included only 13 variables in total, identified 5
environmental variables that significantly (P < 0.05)
explained the variance in diatom species composition.
These were TP, TN, basin size, % forested land-use,
and % bedrock and boulder. The first two axes
explained 14.7% of the total variance in the diatom
data. Species–environment correlations of CCA axes
were high for axis 1 (r = 0.88) and for axis 2 (r = 0.85)
and accounted for 72.4% of the variance in the
species–environment relationships. The correlations
between TP and TN and the first ordination axis were
UN
EC
TED
PR
OO
F
strong (r = �0.72 and �0.61). In comparison with the
CA that included all 23 variables, species–environ-
ment correlations on the first two axes were only
slightly lower, but explained most of the variance in
the species–environment relationship.
CCAs constrained to one variable at a time were
run on the remaining five variables to assess the
strength of their relationship with diatom species
composition, and to determine which variables had a
sufficiently strong relationship with diatom assem-
blages to justify development of inference models. Of
the five variables, TP had the highest l1/l2 ratio
(0.78), capturing 7.2% of the variation in the species
data. TN had a l1/l2 ratio of 0.54, capturing 5.6% of
the variation in species data. This confirmed that
both variables had significant influence on the diatom
assemblages and that development of inference mo-
dels for both variables was justified.
3.5. Species WA-optima and tolerances
TP and TN WA species optima were calculated
using the reduced dataset (n = 91). The results are
presented for the species with effective numbers
of occurrences (Hill’s N2) > 10 (Table 2). Species
apparent WA TP optima ranged from 13 to 163
mg L�1. Weighted-average TN optima ranged from
362 to 4412 mg L�1. Taxa with high and low TP op-
tima had values comparable to those calculated in
other studies conducted in eastern North America
(Winter and Duthie, 2000; Potapova et al., 2004).
3.6. Inference models
Models to infer TP and TN (log10 mg L�1) were
developed and tested using WA and WA-PLS. The
models were run on the n = 91 calibration set, which
included 131 taxa. In order to test if the inclusion of
multiple and repeat samples biased the model
performance, we developed additional TP and TN
WA-PLS models using the dataset with independent
samples only (n = 40). This dataset was obtained after
deleting 5 of the same outliers as in the models above,
reducing the set of 45 ‘independent’ samples to 40
samples, including only 128 taxa.
Table 3 shows performance measures for all
inference models. The best TP model was a two-
component WA-PLS model using the n = 91 dataset,
ECOIND 205 1–15

RE
CTE
D P
RO
OF
K.C. Ponader et al. / Ecological Indicators xxx (2005) xxx–xxx10
480
481
482
483
484
485
486
487
488
489
490
491
492
493
494
495
496
497
498
499
500
501
502
503
504
505
506
507
508
509
510
511
512
513
513
Fig. 3. Plots of WA-PLS inference model showing (A) diatom-
inferred log10 TP values vs. observed log10 TP values, and (B)
residuals vs. observed log10 TP values. The diagonal line is a 1:1
line. The solid line shows a LOESS scatter plot smoother (span =
0.45). The diatom TP index score is shown for comparison.
Table 3
Performance of weighted-averaging (WA) and weighted-averaging partial least squares (WA-PLS) regression and calibration models developed
for the n = 91 sample datasets including multiple and repeat samples and the n = 40 sample datasets including independent samples only
n Method Variable r2 ðr2bootÞ RMSE (RMSEPboot) Mean biasboot Max biasboot
91 WA-inv.desh. TP 0.70 (0.61) 0.22 (0.26) �0.009 0.57
91 WA-inv.desh. TN 0.63 (0.47) 0.19 (0.24) �0.010 0.66
91 WA-class.desh. TP 0.70 (0.61) 0.26 (0.28) �0.012 0.47
91 WA-class.desh. TN 0.63 (0.48) 0.24 (0.26) �0.014 0.64
91 WA-PLS-2 components TP 0.87 (0.72) 0.15 (0.23) �0.010 0.4591 WA-PLS-3 components TN 0.88 (0.58) 0.11 (0.23) �0.015 0.6640 WA-PLS-3 components TP 0.96 (0.69) 0.08 (0.28) �0.030 0.65
40 WA-PLS-1 component TN 0.71 (0.50) 0.19 (0.27) �0.015 0.81
All TP and TN units are in log10 mg L�1. WA-inv.desh.: WA-inverse deshrinking; WA-class.desh.: WA-classical deshrinking. The r2 and RMSE
in parentheses were derived from bootstrapping; n = number of samples included in model. Models with best performance are highlighted in
bold.
CO
Rshowing the highest r2boot (0.72) and the lowest
RMSEboot (0.23 log10 mg L�1 TP). For TN, a three-
component model using the n = 91 dataset showed best
performance, with an r2boot of 0.58 and an RMSEboot of
0.23 log10 mg L�1 TN. The TP gradient included in this
model was 6–458 mg L�1 and the TN range was 170–
8547 mg L�1. When comparing the WA-PLS models
(n = 91), the difference between apparent and boot-
strapped r2 was less (0.87–0.72) for TP than for TN
(0.88–0.58) (Table 3 and Figs. 3A and 4A). The
residuals plot (Fig. 3B) shows that the TP model using
WA-PLS (n = 91) tends to underestimate TP values
above 100 mg L�1. A similar trend is shown in the TN
model using WA-PLS (n = 91), where the difference
between bootstrapped versus inferred values is higher
above 3000 mg L�1 TN (Fig. 4A and B). Generally,
Figs. 3 and 4 show that the TN data have a less even
distribution along the nutrient gradient than the TPdata.
The performance of the best TP and TN WA-PLS
models using the independent samples only (n = 40) are
slightly lower (TP model: r2boot ¼ 0:69; RMSEboo-
t = 0.28 log10 mg L�1 TP; TN model: r2boot ¼ 0:50;RMSEboot = 0.27 log10 mg L
�1 TN) than compared
with the best models (n = 91) that include multiple and
replicate samples (Table 3). Nevertheless, because the
model performance does not significantly decrease
when excluding the multiple and replicate samples, we
believe that inclusion of these samples in the dataset
providesmodels that aremore robust. It includes spatial
and temporal variability of the diatom species com-
position at these sites, which increases the reliability of
the inferred value, when the model is applied to similar
sites.
UN
ECOIND 205 1–15

RE
CTE
D P
RO
OF
K.C. Ponader et al. / Ecological Indicators xxx (2005) xxx–xxx 11
513
514
515
516
517
518
519
520
521
522
523
524
525
526
527
528
529
530
530
531
532
533
534
535
536
537
Fig. 5. Plots of inferred bootstrapped versus observed TP and TN
and the assignment of the two diatom index scores: (A) the diatom
TP index and (B) the diatom TN index to the corresponding nutrient
categories. Shaded rectangles correspond to the water chemistry
categories established for TP and TN. TP categories are: (1)<0.025
mg L�1 TP, (2) 0.025–0.075 mg L�1 TP, (3) 0.075–0.1 mg L�1 TP,
(4) >0.1 mg L�1 TP; TN categories are: (1) <0.7 mg L�1 TN, (2)
0.7–1.5 mg L�1 TN, (3) >1.5 mg L�1 TN.
Fig. 4. Plots of WA-PLS inference model showing (A) diatom-
inferred log10 TN values vs. observed log10 TN values, and (B)
residuals vs. observed log10 TN values. The diagonal line is a 1:1
line. The solid line shows a LOESS scatter plot smoother
(span = 0.45). The diatom TN index score is shown for comparison.
CO
R
3.7. Diatom TP and TN indices
We evaluated how accurately the index values,
calculated using bootstrapped inferred nutrient con-
centrations, could be assigned to the nutrient
categories based on the TP and TN values measured
at each site (Fig. 5A and B). The Diatom TP Index
correctly assigned the majority (63%) of the samples.
The TP categories 1 and 3 had the highest proportion
of samples correctly assigned, whereas categories 2
and 4 had the highest proportion of samples assigned
to a neighboring category. The Diatom TN Index
correctly assigned the majority (68%) of the samples
to the correct categories, and placed 32% of the
samples into neighboring categories. The Diatom TN
index correctly assigned the highest proportion of
samples to TN category 1. The indices showed least
accuracy placing samples in the TP categories 2 and 4
UN
and in the TN categories 2 and 3, which are the
categories with the highest number of samples.
4. Discussion
4.1. Environmental factors influencing diatom
assemblages
Multivariate analyses showed that nutrient con-
centrations (TP and TN) are important in explaining
ECOIND 205 1–15

R
K.C. Ponader et al. / Ecological Indicators xxx (2005) xxx–xxx12
537
538
539
540
541
542
543
544
545
546
547
548
549
550
551
552
553
554
555
556
557
558
559
560
561
562
563
564
565
566
567
568
569
570
571
572
573
574
575
576
577
578
579
580
581
582
583
583
584
585
586
587
588
589
590
591
592
593
594
595
596
597
598
599
600
601
602
603
604
605
606
607
608
609
610
611
612
613
614
615
616
617
618
619
620
621
622
623
624
625
626
627
628
629
630
631
CO
R
variation in diatom assemblage composition, more so
than in other regional studies (Pan et al., 1996; Winter
and Duthie, 2000). Our analysis shows that TP and TN
were strongly correlated with the first CCA axis
(r = �0.72 and �0.61). The results of CCAs con-
strained to TN and TP, respectively, showed a strong
relationship between TN, TP, and diatom assemblages
with high l1/l2 ratios of 0.78 for TP and 0.54 for TN.
Other regional studies present lower l1/l2 ratios for
TP (0.21) and TN (0.32) (Winter and Duthie, 2000),
ratios comparable to the ones presented in this study
are recorded for TP (l1/l2 = 0.81) from Finland
(Soininen and Niemela, 2002). This high ratio reflects
the relatively even distribution of nutrient concentra-
tions measured in the streams in this study, and the
narrow range in other factors usually influencing
diatom distributions such as pH and conductivity.
4.2. Diatoms as nutrient indicators-inference
model performance
Compared to similar studies conducted using one-
time chemistry measurements to develop benthic
diatom nutrient indicators for streams in eastern North
America (Pan et al., 1996; Winter and Duthie, 2000;
Potapova et al., 2004), the TP and TNWA-PLSmodels
presented here (n = 91) show high apparent and
bootstrapped r2 and low apparent and bootstrapped
RMSE.
We took two steps to maximize the performance of
our models. First, site selection was restricted to three
ecoregions in New Jerseywith a rather limited range in
water chemistry and geology. Sites were selected
based on knowledge of their chemistry to avoid wide
ranges of pH, alkalinity and conductivity that might
complicate development of nutrient inference models.
Second, we tried to capture a wide range of con-
centration along the nutrient gradients. This dataset
included a TP range of 6–458 mg L�1 (n = 91), and the
range in TN was 170–8547 mg L�1. The nutrient
gradients included in all models were relatively large,
and the model error is low when compared to other
studies based on comparable or shorter nutrient
gradients (Pan et al., 1996; Potapova et al., 2004).
The dataset presented in Winter and Duthie (2000)
included a shorter TP gradient (5–215 mg L�1) and
a wide TN gradient, with a range of relatively
higher values (1000–16,290 mg L�1), but the models
UN
EC
TED
PR
OO
F
show higher RMSEs when using one-time chemistry
measurements.
There are other factors that might affect the
performances of our models. These include the
influence of temporal variability in nutrient concen-
trations in streams (Cattaneo and Prairie, 1995; Pan
et al., 1996) and the indirect influence of nutrients on
diatom species composition through increasing com-
petition with non-diatom species (e.g. Cladophora sp.)
(Winter and Duthie, 2000).
Despite the relatively wide ranges in TP and TN
captured in our models, model performance could
certainly be improved by adding samples to the
dataset. Fig. 4A and B shows that fewer numbers of
samples at the low and the high total phosphorus range
cause the TP model to be less reliable towards both
ends of the gradient. This ‘‘edge-effect’’ (Hall and
Smol, 1999) occurs with models developed on
samples with an uneven distribution along the TP
gradient (Reavie et al., 1995; Soininen and Niemela,
2002), and causes the WA estimates of species optima
to be biased. Despite the rather wide range of TP
included in our dataset, the majority of samples fell
below concentrations of 100 mg L�1 TP. This might
explain why the model is less reliable at concentra-
tions of >100 mg L�1. Another explanation may be
that above higher concentrations of TP (e.g. con-
centrations of>100 mg L�1) smaller changes occur in
the diatom species composition and that therefore the
species response to higher TP concentrations is
weaker (Reavie et al., 1995; Pan et al., 1996).
Addition of more samples toward the ends of the
gradients might help improve the TP model perfor-
mance, although significant improvement is more
likely at the lower nutrient range of the model; our
results show that diatom assemblages respond less
strongly to TP values over 100 mg L�1.
A similar trend is shown for the TN model, where
model performance decreases at the higher end of the
gradient (Fig. 4A and B). The average TN in the
Piedmont (2241 mg L�1) and the combined dataset
(1987 mg L�1) (Table 1) is low compared to the
average TN (4940 mg L�1) in the EPA Northern
Piedmont aggregate nutrient ecoregion (USEPA,
2000c), or compared to similar studies where nitrogen
inference models have been developed (Winter and
Duthie, 2000). The model therefore is built mainly
on sites with moderate nitrogen concentrations, and
ECOIND 205 1–15
RE
K.C. Ponader et al. / Ecological Indicators xxx (2005) xxx–xxx 13
631
632
633
634
635
636
637
638
639
640
641
642
643
644
645
646
647
648
649
650
651
652
653
654
655
656
657
658
659
660
661
662
663
664
665
666
667
668
669
670
671
672
673
674
675
676
677
677
678
679
680
681
682
683
684
685
686
687
688
689
690
691
692
693
694
695
696
697
698
699
700
701
702
703
704
705
706
707
708
709
710
711
712
713
714
715
716
717
718
COR
underrepresents sites with low and high nitrogen. This
explains the decrease of the TN model performance,
especially at the higher end of the gradient. To im-
prove the TN model performance, it would be
important to add samples to both ends of the nitrogen
gradient, but especially to the higher end.
In general, our TP and TN inference models have
relatively high predictive power and showed reliable
results (e.g. inferred nutrient concentrations) when
tested using bootstrapping, and especially when
compared to existing nutrient models. When applying
the models to samples in any of the three ecoregions of
NJ, it is important to select sites with water chemistry
values that are within the ranges included in the model
calibration set, especially for pH, conductivity,
hardness and alkalinity (Table 1).
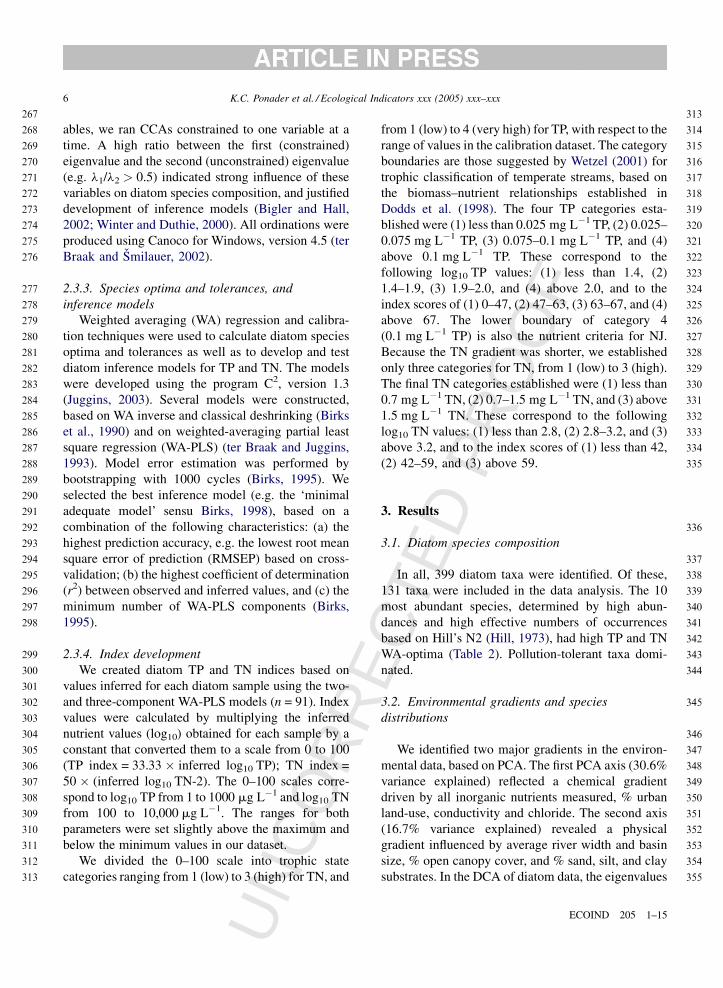
4.3. Use of diatom inference models and trophic
indices for management purposes
Our results show that diatom WA-PLS models can
reliably infer late summer nutrient concentrations in
NJ rivers. The good performance of the models
presented here confirms the conclusion of another
study conducted in the Northern Piedmont ecoregion,
that models based on WA-equations provide the best
predictions when used to model regional diatom–
nutrient responses (Potapova et al., 2004).
The diatom TP and TN indices, which are rescaled
inferred nutrient values, are meant to provide a
management tool for regulators. Because of their
presentation on a scale from 1 to 100, these indices
have the practical advantage of being more compar-
able than inferred nutrient values to indices commonly
used by the state, e.g. the Fish IBI (Karr, 1981), the
macroinvertebrate index and the habitat assessment
index (NJDEP, 1993a, 2000). They are similar to
commonly used diatom indices, such as trophic
diatom indices (TDIs), with the main difference that
the indices presented here are based on WA-PLS
inference models. When tested, the diatom TP and TN
indices assigned the samples to the correct water
chemistry category in the majority of cases. Because
the boundaries between the categories assigned are
based on correlations between nutrients and high algal
biomass (Dodds et al., 1998; Wetzel, 2001), the
categories not only reflect nutrient concentrations
but at the same time are estimates of impairment
UN
D P
RO
OF
associated with high biomass (i.e. rendering the waters
unsuitable for designated uses). The assignment of
samples to nutrient categories may therefore provide
NJDEP with a practical tool for regulatory assess-
ments of eutrphication.
In addition to the categories, there are other useful
reference points for evaluating inferred nutrient
concentrations, which could serve as a basis for
alternative category boundaries. Several studies
conducted on large- and small-scale datasets on
streams in the US, including high proportions of
eastern US streams, confirm that levels of TP above
0.05 mg L�1 and TN above 0.47 mg L�1 lead to mean
benthic chl a values of >50 mg m�2 (Dodds and
Welch, 2000; Dodds et al., 2002). We showed
previously that TP values above 0.05 mg L�1 and
NO3-N values above 0.2 mg L�1 can lead to nuisance
algal biomass (chl a > 100 mg m�2) (Ponader and
Charles, 2003). The establishment of category
boundaries could be refined through more extensive
exploration of relationships between nutrients and
biomass. Therefore, both the inference models and the
diatom TP and TN indices present reliable and useful
tools for monitoring nutrients and can be applied in a
regulatory context. Further improvement of the
inference models could be achieved by adding more
samples to the model calibration dataset, especially at
the both ends of the nutrient gradients.
CTUncited references
USEPA (1998, 2000a).
E
Acknowledgements
This project was supported by the New Jersey
Department of Environmental Protection, Division of
Science, Research and Technology, Trenton, NJ. We
thank Diane Winter, Mike Hoffmann and Erin Hagan
for their work in the field and in the laboratory and
Kathleen Sprouffske for her help with data manage-
ment. Marina Potapova and Eduardo Morales helped
with taxonomic identification. We also thank the
anonymous reviewers for their comments on the
manuscript.
ECOIND 205 1–15
R
K.C. Ponader et al. / Ecological Indicators xxx (2005) xxx–xxx14
718
719
720
721
722
723
724
725
726
727
728
729
730
731
732
733
734
735
736
737
738
739
740
741
742
743
744
745
746
747
748
749
750
751
752
753
754
755
756
757
758
759
760
761
762
763
764
765
766
767
768
769
770
771
772
773
774
774
775
776
777
778
779
780
781
782
783
784
785
786
787
788
789
790
791
792
793
794
795
796
797
798
799
800
801
802
803
804
805
806
807
808
809
810
811
812
813
814
815
816
817
818
819
820
821
822
823
824
825
826
827
828
829
830
831
CO
R
References
American Public Health Association (APHA), American Water
Works Association (AWWA), Water Environment Federation
(WEF), 1995. Standard Methods for the Examination of Water
and Wastewater, 19th ed. American Public Health Association,
Washington, DC.
Barbour, M.T., Gerritsen, J., Snyder, B.D., Stribling, J.B., 1999.
Rapid Bioassessment Protocols for Use in Streams and Wade-
able Rivers: Periphyton, Benthic Macroinvertebrates, and Fish,
EPA 841-B-99-002, 2nd ed. US Environmental Protection
Agency, Office of Water, Washington, DC.
Bennion, H., Appleby, P.G., Phillips, G.L., 2001. Reconstructing
nutrient histories in the Norfolk Broads: implications for the
application of diatom-phosphorus transfer functions to shallow
lake management. J. Paleolimnol. 26, 181–204.
Bigler, C., Hall, R.I., 2002. Diatoms as indicators of climatic and
limnological change in Swedish Lapland: a 100-lake calibration
set and its validation for paleoecological reconstructions. J.
Paleolimnol. 27, 97–115.
Birks, H.J.B., 1995. Quantitative paleoenvironmental reconstruc-
tions. In: Maddy, D., Brew, J.S. (Eds.), Statistical Modelling of
Quarternary Science Data. Technical Guide 5. Quarternary
Research Association, Cambridge, pp. 161–254.
Birks, H.J.B., 1998. Numerical tools in paleolimnology—progress,
potentialities and problems. J. Paleolimnol. 20, 307–332.
Birks, H.J.B., Line, J.M., Juggins, S., Stevenson, A.C., ter Braak,
C.J.F., 1990. Diatoms and pH reconstructions. Philos. Trans. R.
Soc. London B 327, 263–278.
Bradshaw, E.G., Anderson, N.J., 2001. Validation of a diatom-
phosphorus calibration set for Sweden. Freshw. Biol. 46,
1035–1048.
Cattaneo, A., Prairie, Y.T., 1995. Temporal variability in the che-
mical characteristics along the Riviere de l’Achigan: how many
samples are necessary to describe stream chemistry. Can. J. Fish.
Aquat. Sci. 52, 828–835.
Charles, D.F., Knowles, C., Davis, R., 2002. Protocols for the
analysis of algal samples collected as part of the U.S. Geological
Survey National Water-Quality Assessment Program. Patrick
Center for Environmental Research Report No. 02-06, The
Academy of Natural Sciences, Philadelphia. http://www.diato-
m.acnatsci.org/nawq.
Chetelat, J., Pick, F.R., 2001. Temporal variability of water
chemistry in flowing waters of the northeastern United States:
does river size matter? J. N. Am. Benthol. Soc. 20, 331–
346.
Coring, E., Schneider, S., Hamm, A., Hofmann, G., 1999. Durchge-
hendes Trophiesystem auf der Grundlage der Trophieindikation
mit Kieselalgen.-DVWK Mitteilungen Nr. 6/1999. Deutscher
Verband fur Wasserwirtschaft und Kulturbau e.V, Bonn.
Descy, J.-P., Coste. M., 1990. Utilisation des diatomees benthiques
pour l’evaluation de la qualite des eaux courantes. Rapport Final,
EEC Contract No. B-71-23. Universite Namur. CEMAGREF,
Bordeaux.
Dixit, S.S., Smol, J.P., 1994. Diatoms and indicators in the environ-
mental monitoring and assessment program-surface waters
(EMAP-SW). Environ. Monit. Assess. 31, 275–306.
UN
EC
TED
PR
OO
F
Dodds, W.K., Welch, E.B., 2000. Establishing nutrient criteria in
streams. J. N. Am. Benthol. Soc. 19, 186–196.
Dodds, W.K., Jones, J.R., Welch, E.B., 1998. Suggested classifica-
tion of stream trophic state: distributions of temperate stream
types by chlorophyll, total nitrogen and phosphorus. Water Res.
32, 1455–1462.
Dodds, W.K., Smith, V.H., Lohman, K., 2002. Nitrogen and phos-
phorus relationships on benthic algal biomass in temperate
streams. Can. J. Fish. Aquat. Sci. 59, 865–874.
Fishman, M.J., 1993. Methods of analysis by the U.S. Geological
Survey National Water Quality Laboratory-determination of
inorganic and organic constituents in the water and fluvial
sediments. U.S. Geological Survey Open-File Report 93-
125.
Hall, R.I., Smol, J.P., 1992. A weighted-averaging regression and
calibration model for inferring total phosphorus concentration
from diatoms in British Columbia (Canada) lakes. Freshw. Biol.
27, 417–434.
Hall, R.I., Smol, J.P., 1999. Diatoms as indicators of lake eutrophi-
cation. In: Stoermer, E.F., Smol, J.P. (Eds.), The Diatoms:
Applications for the Environmental and Earth Sciences. Cam-
bridge University Press, Cambridge, UK, pp. 128–168.
Hill, M., 1973. Diversity and evenness: a unifying notation and its
consequences. Ecology 54, 427–432.
Juggins, S., 2003. C2 User Guide. Software for Ecological and
Paleoecological Data Analysis and Visualization. University of
Newcastle, Newcastle upon Tyne, UK, 69 pp.
Karr, J.R., 1981. Assessment of biotic integrity using fish commu-
nities. Fisheries 6, 21–27.
Kelly, M.G., Whitton, B.A., 1995. The trophic diatom index. A new
index for monitoring eutrophication in rivers. J. Appl. Phycol. 7,
433–444.
Moulton, S.R., Kennen, J.G., Goldstein, R.M., Hambrook, J.A.,
2002. Revised protocols for sampling algal, invertebrate and fish
communities as part of the National Water-Quality Assessment
Program. Open-File Report 02-150. US Geological Survey,
Reston, VA, 75 pp.
New Jersey Department of Environmental Protection (NJDEP),
1993a. The Establishment of Ecoregion Biological Reference
Sites for New Jersey Streams-1989–1993 Benthic Macroinver-
tebrate Data. New Jersey Department of Environmental Protec-
tion, Water Monitoring & Standards, Bureau of Freshwater and
Biological Monitoring, Trenton, NJ.
New Jersey Department of Environmental Protection (NJDEP),
1993b. Ambient Biomonitoring Network (AMNET) Benthic
Macroinvertebrate Data: North East Drainage Basin (Arthur
Kill, Passaic, Hackensack, and Wallkill River). New Jersey
Department of Environmental Protection, Water Monitoring
& Standards, Bureau of Freshwater and Biological Monitoring,
Trenton, NJ.
New Jersey Department of Environmental Protection (NJDEP),
1999. Ambient Biomonitoring Network (AMNET) Benthic
Macroinvertebrate Data: North East Drainage Basin (Arthur
Kill, Passaic, Hackensack, and Wallkill River). New Jersey
Department of Environmental Protection, Water Monitoring
& Standards, Bureau of Freshwater and Biological Monitoring,
Trenton, NJ.
ECOIND 205 1–15

R
K.C. Ponader et al. / Ecological Indicators xxx (2005) xxx–xxx 15
831832
833
834
835
836
837
838
839
840
841
842
843
844
845
846
847
848
849
850
851
852
853
854
855
856
857
858
859
860
861
862
863
864
865
866
867
868
869
870
871
872
873
874
875
876
877
878
879
880
881
882
883
884
885
886
886
887
888
889
890
891
892
893
894
895
896
897
898
899
900
901
902
903
904
905
906
907
908
909
910
911
912
913
914
915
916
917
918
919
920
921
922
923
924
925
926
927
928
929
930
931
932
933
934
935
936
937
938
939
940
941941
OR
New Jersey Department of Environmental Protection (NJDEP),
2000. Water Quality Monitoring Networks 2000. New Jersey
Department of Environmental Protection, Division ofWatershed
Management, Trenton, NJ.
New Jersey Department of Environmental Protection (NJDEP),
2001. Surface water quality standards, New Jersey Adminis-
trative Code (NJAC 7:9B). New Jersey Department of Environ-
mental Protection, Trenton, NJ, 129 pp.
New Jersey Department of Environmental Protection (NJDEP),
2003. New Jersey 2002 Integrated Water Quality Monitoring
and Assessment Report [305(B) and 303(D)]. New Jersey
Department of Environmental Protection, Water Assessment
Team, Trenton, NJ, 259 pp. http://www.state.nj.us/dep/wmm/
sgwqt/wat/integratedlist/integratedlist.htm.
Omernik, J.M., 1987. Ecoregions of the conterminous United States.
Map (scale 1:7,500,000) Ann. Assoc. Am. Geograph. 77, 118–
125.
Omernik, J.M., 1995. Ecoregions. A spatial framework for environ-
mental management. In: Davis, W.S., Simon, T.P. (Eds.),
Biology Assessment and Criteria: Tools for Water Resource
Planning and DecisionMaking. Lewis, Boca Raton, FL, pp. 49–
62.
Pan, Y., Lowe, R.L., 1994. Independent and interactive effects of
nutrients on benthic algae community structure. Hydrobiologia
291, 201–209.
Pan, Y., Stevenson, R.J., Hill, B.H., Herlihy, A.T., Collins, G.B.,
1996. Using diatoms as indicators of ecological conditions in
lotic systems: a regional assessment. J. N. Am. Benthol. Soc. 15,
481–495.
Ponader, K.C., Charles, D.F., 2003. Understanding the relationship
between natural conditions and loadings on eutrophication: algal
indicators of eutrophication for New Jersey streams. Final
Report Year 2. Report No. 03-04. PCER, ANSP, Philadelphia,
PA, 80 pp.
Potapova, M., Charles, D.F., Ponader, K.C., Winter, D.M., 2004.
Quantifying species indicator values for trophic diatom indices:
a comparison of approaches. Hydrobiologia 517, 25–41.
Reavie, E.D., Hall, R.I., Smol, J.P., 1995. An expanded weighted-
averaging model for inferring past total phosphorus concentra-
tions from diatom assemblages in eutrophic British Columbia
(Canada) lakes. J. Paleolimnol. 14, 49–67.
Rott, E., Pipp, E., Pfister, P., 2003. Diatom methods developed for
river quality assessment in Austria and a cross-check against
numerical trophic indication methods used in Europe. Arch.
Hydrobiol. Algol. Stud. 110 (Suppl. 149), 91–115.
Schiefele, S., Schreiner, C., 1991. Use of diatoms for monitoring
nutrient enrichment, acidification and impact of salt in rivers in
Germany and Austria. In: Whitton, B.A., Rott, E., Friedrich, G.
(Eds.), Use of Algae for Monitoring Rivers I. Institut fur
Botanik, Universitat Innsbruck, pp. 103–110.
Soininen, J., Niemela, P., 2002. Inferring the phosphorus levels of
rivers from benthic diatoms using weighted averaging. Arch.
Hydrobiol. 154, 1–18.
Stevenson, R.J., Pan, Y., 1999. Assessing environmental conditions
in rivers and streams with diatoms. In: Stoermer, E.F., Smol, J.P.
UN
C
ECTE
D P
RO
OF
(Eds.), The Diatoms: Applications for the Environmental and
Earth Sciences. Cambridge University Press, Cambridge, UK,
pp. 11–40.
ter Braak, C.J.F., 1995. Ordination. In: Jongman, R.H.G., ter Braak,
C.J.F.,van Tongeren, O.F.R. (Eds.),Data Analysis in Community
and Landscape Ecology. Cambridge University Press, Cam-
bridge, UK, pp. 91–169.
ter Braak, C.J.F., Juggins, S., 1993. Weighted averaging partial least
squares regression (WA-PLS): an improved method for recon-
structing environmental variables from species assemblages.
Hydrobiolgia 269/270, 485–502.
ter Braak, C.J.F., Prentice, I.C., 1988. A theory of gradient analysis.
Adv. Ecol. Res. 18, 221–317.
ter Braak, C.J.F., Smilauer, P., 2002. CANOCO reference manual
and CanoDraw for Windows. User’s guide: software for Cano-
nical community ordination. Version 4.5. Microcoputer Power,
Ithaca, NY.
US Census Bureau, 2002. http://www.census.gov/.
U.S. Code, 2002. Federal Water Pollution Control Act. Title 33,
§1251 et seq.
US Environmental Protection Agency (USEPA), 1992. Methods for
the Determination of Chemical Substances in Marine and
Estuarine Environmental Samples, EPA-600-R-92-121. Office
of Research and Development, United States Environmental
Protection Agency, Washington, DC.
US Environmental Protection Agency (USEPA), 1998. National
Strategy for the Development of Regional Nutrient Criteria,
EPA 822-R-98-002. United States Environmental Protection
Agency, Office of Water, Washington, DC.
US Environmental Protection Agency (USEPA), 2000a. National
Water Quality Inventory Report to Congress (305(b) report),
EPA-841-R-02-001. United States Environmental Protection
Agency, Office of Water, Washington, DC.
US Environmental Protection Agency (USEPA), 2000b. Nutrient
Criteria Technical Guidance Manual: Rivers and Streams, EPA-
822-B-00-002. United States Environmental Protection Agency,
Office of Water, Washington, DC.
US Environmental Protection Agency (USEPA), 2000c. Ambient
Water Quality Criteria Recommendations: Rivers and Streams
in Nutrient Ecoregion IX, EPA-822-B-00-019. United States
Environmental Protection Agency, Office of Water, Washing-
ton, DC.
US Environmental Protection Agency (USEPA), 2000d. Ambient
Water Quality Criteria Recommendations: Rivers and Streams
in Nutrient Ecoregion XI, EPA-822-B-00-020. United States
Environmental Protection Agency, Office of Water, Washing-
ton, DC.
US Geological Survey (USGS), 2001. Water resources data New
Jersey Water Year 2001, vol. 3, USGS Water Quality data.
Water-Data Report NJ-01-3, West Trenton, NJ.
Wetzel, R.G., 2001. Limnology. Lake and River Ecosystems, 3rd ed.
Academic Press, San Diego, CA, 1006 pp.
Winter, J.G., Duthie, H.C., 2000. Epilithic diatoms as indicators of
stream total N and total P concentration. J. N. Am. Benthol. Soc.
19, 32–49.
ECOIND 205 1–15