Diane Bryant - s21.q4cdn.com · PDF fileDiane Bryant Executive Vice President & General...
19
Transcript of Diane Bryant - s21.q4cdn.com · PDF fileDiane Bryant Executive Vice President & General...


Diane BryantExecutive Vice President & General Manager
Data Center Group

3
DisclosuresStatements in this presentation that refer to Business Outlook, forecast, future plans and expectations are forward-
looking statements that involve a number of risks and uncertainties. Words such as "anticipates," "expects," "intends,"
"goals," "plans," "believes," "seeks," "estimates," "continues," "may," "will," “would,” "should," “could,” and variations of
such words and similar expressions are intended to identify such forward-looking statements. Statements that refer to
or are based on projections, uncertain events or assumptions also identify forward-looking statements. Such
statements are based on management's expectations as of February 9, 2017 and involve many risks and uncertainties
that could cause actual results to differ materially from those expressed or implied in these forward-looking
statements. Important factors that could cause actual results to differ materially from the company's expectations are
set in Intel's earnings release dated January 26, 2017, which is included as an exhibit to Intel’s Form 8-K furnished to
the SEC on such date. Additional information regarding these and other factors that could affect Intel's results is
included in Intel's SEC filings, including the company's most recent reports on Forms 10-K and 10-Q. Copies of Intel's
Form 10-K, 10-Q and 8-K reports may be obtained by visiting our Investor Relations website at www.intc.com or the
SEC's website at www.sec.gov.

4
Key Messages
Near term:period of enterprise transformation
Well positioned for long term growth with an unparalleled array of assets
Growth drivers remain:move to cloud computing, network transformation, growth of data analytics

5
WHAT’S INTHE BOX?
WHAT ISTHE BOX?
WHO BOUGHTTHE BOX?
Data Center TaxonomyCloud Service Provider Comms Service ProviderEnterprise & Government
NetworkServer Storage
FPGAs SSDsChipsets intel®Omni-Path
Fabric
CPUs NetworkASICs
Ethernet SiliconPhotonics
intel® 3D XPoint™
DIMMs

6
WHAT’S INTHE BOX?
WHAT ISTHE BOX?
WHO BOUGHTTHE BOX?
Data Center TaxonomyCloud Service Provider Comms Service ProviderEnterprise & Government
NetworkServer Storage
FPGAs SSDsChipsetsCPUs NetworkASICs
Ethernet SiliconPhotonics
-3%YOY
+24%YOY
+19%YOY
2016 Actual
+8%YOY
intel®Omni-Path
Fabric
intel® 3D XPoint™
DIMMs
7
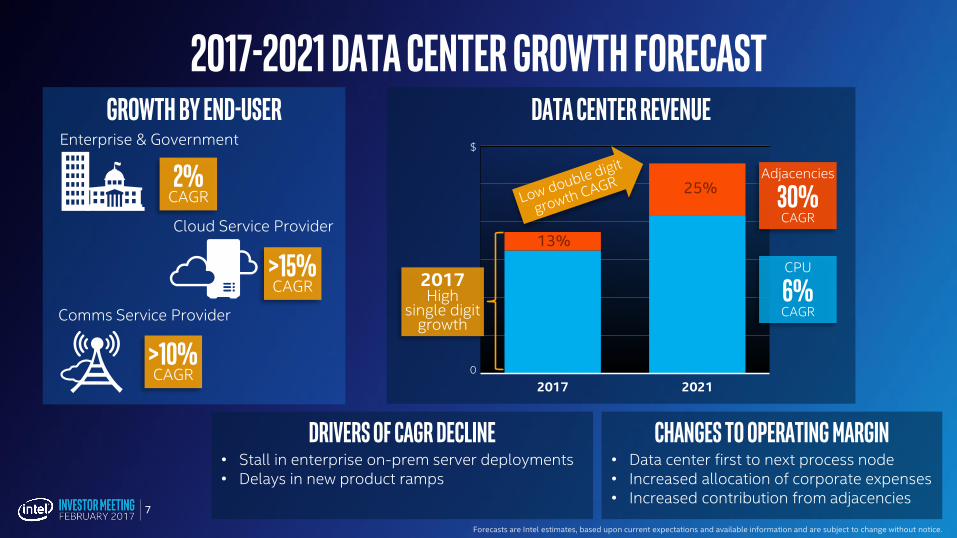
Drivers of CAGR Decline• Stall in enterprise on-prem server deployments• Delays in new product ramps
2017-2021 Data Center Growth ForecastData Center Revenue
2017 2021
$
0
Adjacencies
30%CAGR
CPU
6%CAGR
Growth by End-UserEnterprise & Government
2%CAGR
Cloud Service Provider
>15%CAGR
Comms Service Provider
>10%CAGR
Changes to Operating Margin• Data center first to next process node• Increased allocation of corporate expenses• Increased contribution from adjacencies
13%
25%
2017High
single digitgrowth

8
Enterprise going through transformation
2016 Deployment Location by WorkloadEnterprise Workload location Trends
Workload Attributes
• Performance
• Security
• Integration complexity
• Data size
Business Needs
• Time to deployment
• Compliance/regulatory
• Geographic reach
• SLAs
Ecosystem
• Maturity of SaaS offerings
• Viability of alternate services
• Availability of resellers / system integrators with private cloud expertise
2013 2014 2015 2016 2017 2018 2019 2020 2021
On-Prem Public Cloud
14%
86%
35%
65%
%
0
Workload LocationConsiderations
Enterprise & Government
Collaborative Infrastructure Business Process
Analytics Model/Sim
On-Prem Public CloudUnits
0
66%
33%44% 23%
4%
34%
67%56%
77%96%
+15%YOY
+8%YOY

9
Hybrid cloud Drives Enterprise stabilization
Private Cloud Growing as % of New Deployments
2013 2014 2015 2016
Units
19%0
+25%CAGR
Privatecloud
Trad.on-prem
-5%CAGR
Server forecastAssuming server contraction through the planning horizon
Enabling Hybrid Cloud
Azure Stack
Coming 2H’2017
Server Box

10
Double-Digit Growth* Assumes Enterprise Server decline
High
2017 2021
$
0
Enterprise Server
-1%CAGR
Data Center
DoubleDigit
Growth
Mid
2017 2021
EnterpriseServer
-5%CAGR
$
0
Data Center
DoubleDigit
Growth
Low
2017 2021
EnterpriseServer
-7%CAGR
$
0
Data Center
DoubleDigit
Growth
Server Box
Forecasts are Intel estimates, based upon current expectations and available information and are subject to change without notice.
3 enterprise server CPU scenarios
* Refers to revenue growth.

11
Cloud Service Provider Dynamics2/3 of the Cloud is TAM Expansion
Enterprise Conversion
34%
Consumer52%
Business
New Usages
14%
2016
Business Cloud delivers higher value services2016
Business Cloud
11% ASP Premiumvs. Consumer Cloud
Cloud Service Provider
Enterprise VS. Cloud Service ProviderServer CPU ASP Gap Narrowing
+10%CAGR
0
+6%CAGR
EnterpriseCloud ServiceProviders (All)
Cloud ServiceProviders (Business)
2013 2016
$ASP

12
Comms Service Provider MomentumHigh bandwidthWireless
Broadband
Ultra low latencyReal-timeControl
Low energy, low bandwidthIOTSensors
Ultra high bandwidthVideoStreaming
Cloud EnabledLegacy 5G Ready
Move to IA
Comms Service Provider
Intel Momentum
#1in Wireless Access Infrastructure
Based on existing designs and 2016 wins deploying over the next 4 years as 5G ramps
Autonomous driving
Last mile connectivity
Smart factories
HD movies

13
Winning the Network
Network ASP2016 Network Silicon Revenue MSS
$19.3B opportunity in 2017*
2013 2014 2015 2016
Xeon ASP
$ASP
0
NetASP
SOCASP
Network Box
Other
Intel
Broadcom
HiSilicon
Qualcomm (NXP)
TI
Global Foundry
Xilinx
CaviumMarvell
OEM Si
DCG+
PSG
$18.6B TAM
2016 Growth 10X the Market Segment

14
Artificial Intelligence Opportunity
AI
40%
Classic Machine Learning Deep Learning
60%
2016 Servers
7%
97%
IA1%
IA+GPGPU
2%
Other
91% 7%
IA2%
IA+GPGPU
Other
AI is the fastest growing data center workload

15
Intel® Nervana™ Portfolio
Most widely deployed machine learning solution
High performance, classic machine
learning
LAKECREST
Best in class neural network performance
Programmable,low-latency
inference
Artificial Intelligence Plan
Bringing the HPC Strategy to AITop 500 % FLOPs
Jun'10 Nov '12 Nov '16
35%
5%
60%
93%
7% 16%
20%
64%
Nvidia intro Xeon Phi intro November ‘16
Nvidia* Intel® Xeon Phi™ Xeon
%
0
COMING 2017
KNIGHTS MILLCOMING 2017
SKYLAKE
COMING 2017
LAKE CRESTSDVS SHIPPING TODAY
BROADWELL + ARRIA 10

16
Addressing the Full Data Center OpportunityData Center Silicon TAM
2016 2021
Server + SBS logic silicon Network logic silicon Ethernet & Fabric Silicon Photonics Memory
$65B
$46B
$
0
2016 MSS
36%

17
Data Center Silicon TAM
Addressing the Full Data Center Opportunity
2016 2021
Server + SBS logic silicon Network logic silicon
Ethernet & Fabric Silicon Photonics
Memory
$65B
$46B
$
0
Intel® Omni-Path Fabric
2016 2021
42%Intel MSS
~$1.1B
0
$
High Performance Fabric SAMIntel® Silicon Photonics
SAM
2016 2021
9%Intel MSS
~$1.8B
0
$
3D XPOINT™ DIMMsSAM
2021
~$8B
0
$
2016 MSS
36% Rack Scale DesignNext transformation in
application delivery
Architecting the Intel portfolio to deliver 2X the performance
at the lowest TCO

18
Summary
Delivering low double digit data center growth;Reducing dependency on Enterprise server CPU
Well positioned for long term growth with an unparalleled array of assets andunique integration capabilities
Growth drivers remain:move to cloud computing, network transformation,
growth of data analytics
Growth by End-UserEnterprise & Government
2%CAGR
Cloud Service Provider
>15%CAGR
Comms Service Provider
>10%CAGR
2017-2021