Diamond Insight Report - De Beers · PDF file— Diamond jewellery retail 24 —...
90
-
Upload
hoangxuyen -
Category
Documents
-
view
216 -
download
1
Transcript of Diamond Insight Report - De Beers · PDF file— Diamond jewellery retail 24 —...

TA B L E O F C O N T E N T SFOREWORD 1
EXECUTIVE SUMMARY 6
01 | DIAMOND INDUSTRY OUTLOOK 13
02 | THE DIAMOND INDUSTRY VALUE CHAIN — Global consumer demand 20
— Diamond jewellery retail 24
— Cutting and polishing 32
— Rough diamond sales and distribution 38
— Rough diamond production 42
— Diamond exploration 46
03 | IN FOCUS — Changing consumer preferences and the growth 52
of brands in the United States and China — The miracle of production 66
— Safeguarding the industry through technology 74
GLOSSARY 81


1
As the diamond industry evolves to respond to recent
consumer trends and macro-economic realities,
there are new – and sometimes surprising – answers
to perennial questions. What is the outlook for
diamonds? What are the trends to watch? What do
those involved in the industry – from exploration
to retail – need to do to ensure continued and
sustainable success?
De Beers, as the world’s leading diamond company,
is uniquely placed to shed light on these questions.
For decades, we have undertaken extensive primary
research in the main diamond markets and across the
whole value chain. Since the turn of the millennium,
our consumer research programme has surveyed
some 800,000 consumers worldwide. The global
trade research commissioned by us reaches out to
thousands of industry participants every year.
We aspire to play a leading role in helping all those
with an interest in the industry understand how and
why it is evolving. For the first time, we have brought
together our wealth of proprietary data and insight
into a single report that provides our perspective on
the global diamond industry in 2013/14 and beyond.
This Insight Report is the first in an annual series,
designed to add depth and detail to other industry
information sources and to your understanding of
this multi-faceted industry.
The world of diamonds remains fascinating,
challenging and precious. We hope you enjoy
finding out more.
PHILIPPE MELLIER CEO, DE BEERS GROUP
F O R E W O R D


3
DISCLAIMERThis report has been prepared by the De Beers Group (De Beers) and
comprises the written materials concerning De Beers and the wider
diamond industry. All references to ‘De Beers’ in this report refer to the
De Beers Group, unless otherwise stated.
This report has been compiled by De Beers and/or its affiliates from sources
believed to be reliable, but no representation or warranty, express or implied,
is made as to its accuracy, completeness or correctness. All opinions and
estimates contained in this report are judgements as of the date of this
report, are subject to change without notice and are provided in good faith
but without legal responsibility.
This report should not be construed as business advice and the insights are
not to be used as the basis for investment or business decisions of any kind
without your own research and validation.
This report is for information purposes only. The information contained in
this report may be based on internal data, or data sourced from, or provided
by, third parties or publicly available sources. As such, it may include the
disclosures and/or views of those third parties, which may not necessarily
correspond to the views held by De Beers.
De Beers does not offer any representation or warranty as to the accuracy
or completeness of this report and no reliance should be placed on the
information disclosed for any purpose. Nothing in this report should be
interpreted to mean that De Beers or the diamond industry (as the case may
be) will necessarily perform in accordance with the analysis or data contained
in this report. All written or oral forward-looking statements attributable
to De Beers or persons acting on its behalf are qualified in their entirety by
these cautionary statements.
To the full extent permitted by law, neither De Beers nor any of its affiliates,
nor any other person, accepts any liability whatsoever for any direct or
consequential loss arising from any use of this report or the information
contained herein.
This report includes forward-looking statements. All statements other than
statements of historical facts included in this report, including, without
limitation, those regarding De Beers’ future expectations and/or future
expectations in respect of the diamond industry, are forward-looking
statements. By their nature, such forward-looking statements involve known
and unknown risks, uncertainties and other factors which may cause the
actual results, performance or achievements of diamond markets, or industry
results, to be materially different from any future results, performance or
achievements expressed or implied by such forward-looking statements.
Such forward-looking statements are based on numerous assumptions
made by De Beers in respect of the present and future business strategies
and the wider environment of the diamond industry. Important factors that
could cause actual results, performance or achievements to differ materially
from those in the forward-looking statements include, among others,
levels of actual production during any period, levels of global demand and
commodity market prices, mineral resource exploration and development
capabilities, recovery rates and other operational capabilities, the availability
of mining and processing equipment, the ability to produce and transport
products profitably, the impact of foreign currency exchange rates on
market prices and operating costs, the availability of sufficient credit, the
effects of inflation, political uncertainty and economic conditions in relevant
areas of the world, the actions of competitors, activities by governmental
authorities such as changes in taxation or safety, health, environmental or
other types of regulation in the countries relevant to the diamond industry,
conflicts over land and resource ownership rights and other such risk factors.
Forward-looking statements should, therefore, be construed in light of such
risk factors and undue reliance should not be placed on forward-looking
statements. These forward-looking statements speak only as of the date of
this report. De Beers expressly disclaims any obligation or undertaking to
release publicly any updates or revisions to any forward-looking statement
contained herein to reflect any change in De Beers’ expectations with regard
thereto or any change in the events, conditions or circumstances on which
any such statement is based.
Forward-looking statements

4
D O W N S T R E A M
T H E J O U R N E Y O F A D I A M O N D
G L O B A L C O N S U M E R
D E M A N D
D I A M O N D J E W E L L E R Y
R E TA I L

5
M I D S T R E A M
U P S T R E A M
C U T T I N G , P O L I S H I N G A N D
J E W E L L E R Y M A N U FA C T U R I N G
R O U G H D I A M O N D S A L E S A N D
D I S T R I B U T I O N
D I A M O N D E X P L O R AT I O N
R O U G H D I A M O N D
P R O D U C T I O N

6
This report aims to provide an annual perspective
on the global diamond industry, drawing on The
De Beers Group of Companies’ extensive proprietary
data and insight as well as other industry sources.
The report is divided into three sections: Section 1
provides an outlook for the global diamond industry;
Section 2 describes the 2013 performance and key
trends to watch in each part of the diamond industry
value chain; and Section 3 highlights three ‘In Focus’
areas of particular importance to the industry. This
year’s report focuses on the changing consumer
preferences in the world’s largest and fastest-growing
diamond jewellery markets, the US and China; on
how technology is helping to safeguard the industry;
and on the miracle of production, showcasing
challenges and innovation in rough diamond mining.
SECTION 1: DIAMOND INDUSTRY OUTLOOKIn contrast with precious metals and other natural
resources industries, which rely on multiple sources
of demand, the diamond industry derives practically
all its value from consumers’ demand for diamond
jewellery. The outlook for the industry is thus
intrinsically linked to consumer demand. Even under
scenarios of volatile or weaker global economic
growth, demand for diamonds is expected to
show positive real growth in the next decade.
Positive demand growth for diamonds will almost
certainly outstrip growth in carat production, given
the lack of major new discoveries in the last decade
and the projected slowdown in several existing mines.
Across the value chain, companies that are able to
innovate and differentiate themselves will be best
positioned to capture the opportunities created
by this supply demand dynamic.
Relentless focus on two main areas will help the
industry to achieve its full growth potential over
the coming years:
The first is safeguarding and nurturing the diamond
dream – that is, the allure that diamonds have for
consumers, based on their association with romance
and a sense of the eternal, and the fact that they
are seen as a lasting source of value. As always,
changing consumer preferences, competition from
other luxury categories, and – among other risks
– the potential confusion caused by undisclosed
synthetics all pose challenges for the entire industry.
The second is for companies across the whole value
chain to innovate and differentiate, to take full
advantage of opportunities created by the expected
growth in demand.
E X E C U T I V E S U M M A R Y

7

8
With these priorities in mind, three areas of
investment are likely to be particularly important:
1. Investment in branding, marketing and raised
retail standards will help ensure that consumers,
particularly among new generations and new
markets, do not drift away from the diamond
jewellery category in favour of competing
categories, such as travel, coloured stones,
electronic accessories or designer fashion.
2. Investment in production to drive innovation and
productivity in diamond supply. Diamonds have
always been a rare and precious resource, and as
mining moves deeper into the earth and towards
more remote locations, the extraction process is
now becoming increasingly complex, remote and
more costly.
3. Investment in technology will continue to be a
key differentiator across the value chain, while
also safeguarding consumers against the risk
of undisclosed treatments and synthetics, which
could undermine the long-term credibility of
the industry.
Lack of investment in these areas could hamper
growth for the industry as a whole.
The industry’s overall supply and demand dynamics
should generate value-creating business opportunities
that will enable such investments. However, scale and
differentiation will be increasingly important factors
for future success, across all parts of the value chain.
The industry is likely to continue to consolidate and
integrate (including through vertical integration).
It is also expected to continue professionalising,
modernising and becoming more transparent in the
years to come – to the benefit of all those involved
with this precious resource, from the geologist
seeking the next big find to the bride wearing her
diamond wedding ring.
SECTION 2: THE DIAMOND INDUSTRY VALUE CHAIN Consumer demand for diamonds has shown positive
nominal US dollar (USD) growth in the last five years,
with compound annual growth in diamond value just
under five per cent from 2008 to 2013. In this period,
growth was driven mainly by the emerging economies
of China and India, as well as the US, since 2010, while
Japan and the main European markets have shown
below average growth trends in this period.
The diamond jewellery retail sector is highly
fragmented worldwide with a variety of business
models serving a wide range of target consumers.
The sector has experienced a range of financial
returns. In developed markets, many jewellery
retailers are failing to cover their cost of capital,
resulting in negative returns and the closure of
chains as well as smaller jewellers.
The recent acquisition of jewellery chain Zale
Corporation by Signet Jewelers, another jewellery
chain, illustrates the potential for consolidation in
the jewellery retail sector.
Overall, retailers in emerging economies have
outperformed their peers in developed economies,
partly because of the recent fast growth of the
middle classes and partly because of the rapid
pace of store openings to supply growing demand
in new geographies.
The online channel is becoming increasingly
important around the globe, although consumers
are going online for different reasons in different
countries. In the US, the internet is becoming
important as a sales channel in its own right: more
than one-tenth of diamond jewellery sales in the
US were made online in 2013. While online is not
yet a significant sales channel in China, the internet
is used by a quarter of acquirers for research
purposes before purchase.
Many specialist fine jewellery retailers such as
Tiffany, Cartier, De Beers Diamond Jewellers and
Chopard continue to invest in product offers and
store modernisation to support the diamond dream.
Another major trend to watch is increasing activity by
global luxury fashion houses such as Dior and Chanel
in the sale of diamond jewellery. These global brands
also support the diamond dream, and are raising
consumer expectations of the store environment,
in new design generation and customer service.
Branded diamonds and branded diamond jewellery
present a growth opportunity for diamond jewellery
retailers in both developed and emerging economies.
Consumers worldwide increasingly prefer branded
products and services. Brands can also be an attractive
financial proposition for retailers because the brand
identity frequently offers differentiation from generic
propositions. The additional revenue that can be
generated from brands should make it possible for
retailers to invest in their store environment and in
promoting their businesses and the category, leading
to a virtuous circle of growth.
Cutting and polishing remains fragmented, with
midstream companies under pressure from a
combination of increasing costs in the upstream, the
availability of credit and price-point requirements
from their retail customers. The financing challenges
are increasingly critical and could intensify over the
coming years, as banks apply more stringent lending
standards to the cutting and polishing industry. One
possible consequence is that some companies may
exit the industry, leading to greater consolidation.
Over time, those firms able to add significant value to
the diamond cutting and polishing process, and those
with transparent corporate and financial structures,
are more likely to be successful.

9
The shift of cutting and polishing operations towards
low-cost centres in India and the Far East is likely to
have reached its peak. Over recent years, producing
countries such as Botswana, South Africa and
Namibia have been striving for increased domestic
beneficiation. However, the development of a long-
term sustainable cutting and polishing industry will
require not only government intervention but also
internationally competitive productivity levels.
Rough diamond sales and distribution channels are
continuing to evolve, as producers experiment with
sales methods to maximise the value of their rough
diamonds. Over the last five years, auctions have grown
in importance and it is possible that, as technology
continues to evolve, this trend will continue. However,
the major rough diamond producers are expected to
continue to rely predominantly on long-term contracts
to sell their production.
Producing countries have been playing a more
important role in the sale and distribution of rough
diamonds. This is driven by national governments’
desire to increase their share of value from the
primary resource. The continuing trend towards
in-country beneficiation of diamonds saw perhaps
its largest milestone yet in 2013, with the move of
De Beers’ Global Sightholder Sales to Botswana, and
the organisation of De Beers’ first ever international
‘Sight’ in Gaborone in November 2013.
Rough diamond production was an estimated 146
million carats in 2013, well below the 2005 peak of
over 176 million carats mined1. Overall diamond
supply is expected to increase moderately in the next
few years, driven by new projects coming on-stream.
By 2020, when many existing mines will begin to
see declining outputs, overall supply will be likely
to plateau and, unless major new discoveries are
made in the coming years, supply can be expected
to decline gradually from 2020.
Diamond production is becoming increasingly
challenging as mining moves towards deeper, less
profitable and more remote sources of diamonds.
This trend is explored further in the ‘In Focus’
chapter, ‘The miracle of production’.
Exploration spend is expected to remain high as
the chase to find the next major source of diamonds
intensifies. Today, most of the diamond exploration
spend takes place in historically underexplored
African countries such as Angola, the Democratic
Republic of Congo (DRC) and Zimbabwe, as well
as the vast swathes of Arctic Siberia and Canada.
Large-scale profitable discoveries will most likely
remain elusive, however. Viable diamond deposits
of any scale are rare and difficult to find, and no
amount of investment in exploration guarantees
the discovery of deposits on which sustainable
mining operations can be built.

10
In reality, exploration spend for diamonds has not
kept pace with that for other natural resources; it is
now at practically half the record levels seen in 2007,
when the industry was spending almost US$1 billion
per year on diamond exploration. This situation is not
expected to change in the near future, as the global
mining industry overall continues to face pressure
on capital expenditure.
SECTION 3: IN FOCUS ‘Changing consumer preferences and the growth of
brands’ looks in detail at how the consumer landscape
is changing in the US and China. Notwithstanding the
market’s vertiginous growth over the last five years,
China still offers a tremendous growth opportunity
for the industry. Penetration of diamond jewellery is
still relatively low and consumers’ desire for diamonds
is high. The situation in the US, a more mature
market for diamonds, is different. Fine jewellery has
grown more slowly than other luxury categories in
recent years. However, there are promising growth
areas in the US too, not least in bridal jewellery and
branded diamonds and diamond jewellery, which
have performed particularly well in recent years.
‘Safeguarding the industry through technology’
describes the vital role played by technology across
the entire diamond value chain. Geologists rely
on technological innovation to help them discover
new, viable sources of diamonds in locations that
are often hard to access and difficult to work in,
such as the Arctic Circle. Mining companies also
look to technological innovation to keep operating
costs as low as possible. Rough diamond producers
are dependent on automated high-speed technology
to sort diamonds. Laboratories and cutting centres
rely on detection equipment to identify undisclosed
synthetics and treatments, which pose a challenge
to consumers’ confidence in diamonds.
‘The miracle of production’ explores the increasing
complexity and cost of mining diamonds. This section
explains what it takes to bring a diamond to the
market in the 21st century, and offers an insight into
the day-to-day realities and costs of diamond mining
at the extremes of the earth.

11
1. Diamond demand will continue to grow in
real value terms, driven by the effect of the US
economic recovery and the continued growth
of emerging markets, especially China.
2. Positive demand growth for diamonds will
almost certainly outstrip growth in production
volume in the medium term. Across the value
chain, organisations that are able to innovate
and differentiate themselves will be best
positioned to capture the opportunities created
by this supply demand dynamic.
3. There will be strong competition from other
luxury categories, and investment will be required
to safeguard and nurture the diamond dream.
4. Brands will become increasingly important –
consumers are seeking them out, and they
give retailers an opportunity to differentiate
themselves from generic propositions.
5. Online is rapidly increasing in importance
as a channel for both research and sales of
diamond jewellery to consumers, and will
continue to do so – though the pattern differs
by geographic market.
6. The midstream will continue to come under
competitive pressure and, as a result, will
professionalise and consolidate; businesses with
scale and/or differentiated strategies will thrive.
7. Beneficiation will continue to be important
for countries and regions where diamonds
are mined.
8. Diamond production will decline slowly after
2020 with low likelihood of large, economically
viable new finds.
9. As supply from existing mines decreases, mining
will become increasingly complex and remote,
and increasingly costly as a result. Investment
in operational innovation will be required to
drive productivity.
10. Technology will remain critically important to
support the whole value chain, including in
safeguarding the diamond dream from the risk
of weakening consumer confidence as a result
of undisclosed synthetics and treatments to
natural diamonds.
THE FUTURE AT A GLANCE

12

13
01D I A M O N D I N D U S T R Y O U T L O O KIn contrast with precious metals and other natural resources industries, which rely on multiple sources of demand, the diamond industry derives practically all its value from consumers’ demand for diamond jewellery. The outlook for the industry is thus intrinsically linked to the strength of consumer desire for diamonds.
Positive demand growth for diamonds will almost
certainly outstrip growth in carat production in the
next 10 years, given the lack of major new discoveries
in the last decade and the projected production
slowdown in several existing mines. Even under
scenarios of volatile or weaker global economic
growth, demand for diamonds is expected to show
positive real growth in the next decade. Across the
value chain, companies that are able to innovate
and differentiate themselves will be best positioned
to capture the opportunities created by this supply
demand dynamic.
A positive supply demand outlook is shared by a
number of external experts. For example, in its
recent publication on the global diamond industry,
McKinsey & Company sets out four potential future
scenarios for the diamond industry2 (see Fig. 1).
In every scenario, demand growth outstrips
production growth. De Beers has undertaken some
modelling of potential rough diamond supply and
demand based on McKinsey’s ‘Diamonds are Forever’
scenario, and the relative supply and demand curves
are shown in Fig. 2. Other industry analysts have
expressed similarly positive views (see Fig. 3).

14
F I G . 1 : F O U R F U T U R E S C E N A R I O S F O R T H E D I A M O N D I N D U S T R Y
1 DIAMONDSARE FOREVER
Consumer demand grows strongly, fuelled by recovery in the US economy and continued above-
average growth in emerging markets, especially China and India. Brands become more important and
increasingly invest in promoting the allure of diamonds. Even with demand in Europe and Japan
softening, the dynamics of supply and demand in this scenario mean that previously uneconomical
mining projects become economically viable, so production is maximised.
2 DEMANDSHOCK
Diamond demand grows more slowly as key consumer markets such as the US, China and India
experience weak growth. Companies lose the incentive to invest heavily in brands, and diamonds lose
some appeal through a lack of investment in promoting the diamond category and consumers moving
away from conspicuous consumption. Production remains stagnant but recycling of diamond jewellery
increases as consumers encounter financial distress.
3 FEAST AND FAMINE
The diamond industry develops in a volatile manner, driven by high levels of global macro-economic
uncertainty. Strong rises in demand are followed by sharp decreases, leading to scattered supply
expansion. Lead-time between the demand and supply cycles implies a wide variation in prices.
Mining companies strive to diversify their mining assets to manage volatility and adapt to the growing
resource nationalism trend. Consumers increasingly move away from diamonds, and brands slow down
their investments.
4 EAST RENEWSGLOBAL GROWTH
The industry enjoys strong growth driven by emerging markets, especially China and India. However,
US growth is only moderate. The consumer base for diamonds widens as the emerging middle class
grows and consumers show a distinct preference for brands. Diamond producers will continue to invest
in developing new supply projects.
McKinsey recently published a report, 'Perspectives on the Diamond Industry'. Building on four key uncertainties, the macro-
economic outlook, future consolidation in the value chain, consumer attitudes to diamonds, and the supply of rough
diamonds, the report identified four future scenarios for the global diamond industry.
Source: McKinsey & Company, ‘Perspectives on the Diamond Industry’, September 2014
Source: De Beers analysis, McKinsey & Company, ‘Perspectives on the Diamond Industry’, September 2014
F I G . 2 : S U P P LY A N D D E M A N D C U R V E B A S E D O N ‘ D I A M O N D S A R E F O R E V E R ’ S C E N A R I O
Demand forecast value in nominal terms (smoothed)
Production forecast in value at 2013 prices
2025F 2024F 2023F 2022F 2021F 2020F 2019F 2018F 2017F 2016F 2015F 2014F
60
80
100
120
140
160
180
Index base 100 in 2014

15
F I G . 3 : D I A M O N D S U P P LY A N D D E M A N D : P E R S P E C T I V E S F R O M T W O I N D U S T R Y A N A LY S T S
Demand is set to strengthen rapidly, determined by the
recovery of consumer confidence in two key markets:
The US, which represents the largest share of global
jewellery sales. All indicators point to the fact that
the US will remain strong going forward.
China, which will underpin diamond growth in the
medium term, as penetration of diamond jewellery
pieces increases. Jewellery growth in China is
expected to remain robust, with leading retailers
such as Chow Tai Fook reporting 32 per cent higher
retail revenue over the 2014 Chinese New Year.
Production will be increased by a set number of projects
coming online including:
Petra’s proposed expansion of Finsch and Cullinan,
which will lift production from ~3 million carats per
year in 2014 to over 5 million carats per year in 2019.
Grib: 4 million carats per year.
Gahcho Kué: 4 million carats per year by the end of 2017.
Renard: 1.5-2 million carats by the end of 2017.
Diamond demand is expected to expand at a
Compound Annual Growth Rate (CAGR) of 11 per
cent in nominal value between 2013 and 2017,
driven by:
Cyclical recovery in US consumer spend on luxury
goods as economic growth recovers.
Structural demand growth from emerging markets on
the back of higher penetration of diamond jewellery
among a growing middle class.
Global natural supply is expected to increase at an
average rate of 5.2 per cent between 2013 and 2017:
Output in established mines falls as older mines come
to the end of their life or move to underground mining.
Going underground will make it difficult to maintain
existing output levels due to additional haulage time
and the technical challenges that come with
underground mining.
New mines coming online (including Grib, Gahcho Kué,
Bunder, Karponskogo, Star-Orion South and Renard)
represent only 17 million additional carats per year.
Source: Goldman Sachs, ‘Get engaged with Russian diamonds: Initiating as Buy’, 9 December 2013 RBC, ‘Diamond Digest’, 4 March 2014
DIAMOND DEMAND DIAMOND SUPPLY

16
Source: De Beers
F I G . 4 : C O N S U M E R D E M A N D A N D D E B E E R S R O U G H D I A M O N D S A L E S O V E R T I M E ( 1 9 8 0 - 2 0 1 3 )
Nominal De Beers rough diamond sales
US recession years
Asia/Japan financial crisis
Consumer demand (Nominal USD PWP)
20
15
10
5
20
13
20
12
20
11
20
10
20
09
20
08
20
07
20
06
20
05
20
04
20
03
20
02
20
01
20
00
19
99
19
98
19
97
19
96
19
95
19
94
19
93
19
92
19
91
19
90
19
89
19
87
19
86
19
85
19
84
19
88
19
82
19
81
19
80
19
83
0
3
6
USD billion
0
25 9
NOMINAL DE BEERS
ROUGH SALES PWP
However, the positive supply demand outlook can be
expected to be impacted by the cyclical nature of the
industry. It is especially prone to the ‘ripple effect’
caused by de-stocking and re-stocking by midstream
operators to fulfil lower or higher demand. Despite
this, over the past 50 years rough diamond values have
consistently recovered as economic growth rebounds
(see Fig. 4).
THERE ARE TWO KEY ASPECTS TO THE HEALTH OF THE DIAMOND INDUSTRY IN THE NEAR FUTUREThe first is safeguarding and nurturing the diamond
dream – that is, the allure that diamonds have for
consumers, based on their association with romance
and a sense of the eternal, and the fact that they are
seen as a lasting source of value. As always, changing
consumer preferences, competition from other
luxury categories, and – among other risks – the
potential confusion caused by undisclosed synthetics
and treatments all pose challenges for the entire
diamond industry.
The second is innovation and differentiation to take
full advantage of opportunities created by the expected
growth in diamond demand.

17
With these aspects in mind, three areas of investment
are likely to be particularly important for future growth:
1. Investment in branding, marketing and raised
retail standards will help ensure that consumers,
particularly among new generations and new
geographic markets, do not drift away from the
diamond jewellery category in favour of competing
items, be they experience categories such as travel,
electronic accessories or designer fashion.
2. Investment in production to drive innovation and
productivity in diamond supply. Diamonds have
always been a rare and precious resource and, as
mining moves deeper into the earth and towards
more remote locations, the extraction process
is now becoming increasingly complex, remote
and more costly.
3. Investment in technology will continue to be a
key differentiator across the value chain, and
will also safeguard consumers against the risk
of undisclosed synthetics and treatments, which
could undermine the long-term credibility of
the industry.
Lack of investment in these areas will be value
destructive for the industry as a whole.
Overall, supply and demand prospects should
generate value-creating business opportunities
that will enable such investments. However, scale
and differentiation will be increasingly important
factors for future success, across all parts of the value
chain. The industry will continue to consolidate and
integrate (including through vertical integration),
and to professionalise, modernise and enhance its
transparency. This will be critical if it is to stay relevant
and profitable. Companies with scale will be better
positioned to make such changes proactively and
therefore to benefit from the continued growth of
the sector. Niche companies will have to differentiate
further their value propositions.
It is the responsibility of the entire industry, especially
those organisations of scale, to continue to make
these investments and secure the future of the
industry in the face of changes and challenges to
the sector. The ‘In Focus’ section of this Insight
Report discusses these three investment areas: the
changing consumer; the challenges in rough diamond
production; and the imperative of using technology to
safeguard the consumer and the industry overall.

18

19
02T H E D I A M O N D I N D U S T R Y VA L U E C H A I NThis section of the report examines each stage of the diamond value chain in turn, providing a snapshot of how the industry has performed recently and one perspective on what the future may hold.

20
G L O B A L C O N S U M E R D E M A N D
2013 SNAPSHOTGlobal diamond jewellery sales were an estimated
US$79 billion in 2013, growing at over three per
cent in nominal value in 2013 in USD terms vs 2012,
ahead of the compounded annual rate of growth
experienced between 2008 and 2012 (see Fig. 5).
China continues to be the main growth engine
of diamond jewellery demand, but the US also
performed particularly well in 2013.
In terms of polished diamonds contained in diamond
jewellery at cutting centre wholesale value (so called
‘PWP’ or ‘polished wholesale price’), demand
increased by over three per cent from 2012 to 2013,
to reach approximately US$25 billion (see Fig. 6).
The two biggest markets, the US and China, both
grew by more than the global average, with sales of
polished diamonds increasing seven per cent in the
US and 14 per cent in China, measured in USD terms.
In contrast, both India and Japan saw sales fall (by six
per cent in Japan and 10 per cent in India, measured
in USD terms).

21
Source: De Beers
F I G . 5 : D I A M O N D J E W E L L E RY VA L U E , G R O W T H BY G E O G R A P H Y USD billion (nominal)
Note: Gulf includes Saudi Arabia, UAE, Qatar, Kuwait, Oman and Bahrain
40
80
0
60
20
2008 2009
3.4% 3%
US
Japan
Gulf
China
India
Rest of World
2013 2012 2011 2010
2%
1%
18%
6%
1%
4%
2008-2012 CAGR 2012-2013 GROWTH 2008-2013 CAGR
USD LOCAL CURRENCY
-2%
12%
12%
4%
Source: De Beers
F I G . 6 : P O L I S H E D D I A M O N D VA L U E , G R O W T H BY G E O G R A P H Y USD billion (nominal)
Note: Gulf includes Saudi Arabia, UAE, Qatar, Kuwait, Oman and Bahrain
5
10
15
25
30
20
0
Rest of World
2011
India
2013 2009 2012 2010 2008
3.4% 5%
US
Japan
Gulf
China
2%
4%
20%
6%
2%
3%
2008-2012 CAGR 2012-2013 GROWTH 2008-2013 CAGR
USD

22
US consumers account for the largest share of global
polished demand (ie polished diamond content) in
USD terms at approximately 40 per cent, followed by
China/Hong Kong/Macau (approximately 15 per
cent), India (approximately eight per cent), the Gulf
Region3 (approximately eight per cent) and Japan
(approximately six per cent). Consumers in these top
five markets accounted for approximately 77 per cent
of total demand for polished diamonds in USD terms
in 2013.
All main geographic markets consume all types of
polished diamonds. However, with the exception of the
US, which has a more evenly distributed consumption
across all types of polished diamonds, other markets
have particular focus areas of polished diamonds
(see Fig. 7). For example, India consumes mainly
stones under 0.08 carats of all clarities, while China
consumes mainly stones between 0.18 carats and 0.99
carats of medium and high clarity. In recent years,
there has been growing demand for larger and higher
clarity diamonds in both the US and China. This will
probably mean increased competition to secure supply
of the best jewels and, potentially, an increasing shift
in value towards those types of diamonds.
Another characteristic of the diamond jewellery
segment is the seasonality of demand. Different
geographic markets have different shopping seasons,
but Q4 tends to be the main sales season globally,
followed by Q1. Fig. 8 illustrates the main periods of
diamond jewellery acquisition by consumers for the
three largest diamond consumer markets. Of note
is the pronounced seasonality of the US in which a
high proportion of pieces are acquired by consumers
between Thanksgiving and Christmas. Other markets
have slightly less pronounced seasonal patterns.
LOOKING AHEADA detailed view of future consumer trends for the
diamond industry’s most important markets, the US
and China, is provided in the ‘In Focus’ section of this
report: see ‘Changing consumer preferences and the
growth of brands in the United States and China’.
Source: De Beers
F I G . 7 : T Y P E O F P O L I S H E D D I A M O N D S O L D I N M A I N D I A M O N D J E W E L L E R Y M A R K E T S , B Y S I Z E B A N D
Note: Large = 1+ carat, Medium = 0.18-0.99 carat, Small = <0.18 carat
MARKET SPLIT BY VOLUME,Carats
2013 polished diamonds in jewellery sales, per cent
100
80
60
40
20
0
GulfJapanIndiaChinaUS
MARKET SPLIT BY VALUE,USD
100
80
60
40
20
0
GulfJapanIndiaChinaUS
Small
Medium
Large

23
Source: De Beers
F I G . 8 : S E A S O N A L I T Y O F C O N S U M E R D I A M O N D J E W E L L E R Y ( D J ) A C Q U I S I T I O N S BY M A I N M A R K E T
US
30
20
10
0
5
15
25
35
Dec Nov Oct Sep Aug Jul Jun May Apr Mar Feb Jan
China India US
INDIA
CHINA
Engagements Valentine’s Day
Mother’s Day
Wedding season Thanks-giving
Engagements Christmas New Year
Wedding season
Chinese New Year
Diwali/Wedding season
Golden Week
Chinese Valentine’s Day
Golden Week
Monthly distribution of DJ acquisitions, per cent

24
D I A M O N D J E W E L L E R Y R E TA I L
2013 SNAPSHOT Diamond jewellery retail is a highly fragmented
sector with over 200,000 retail doors selling diamond
jewellery worldwide.
The past few years saw a marked contrast between
developed and emerging markets in the performance
of diamond jewellery retailers. In developed markets,
retailers have faced pressures from a weak economic
environment and strong competition from branded
luxury goods and experiential categories, as well
as the low-price models of ecommerce companies.
On the other hand, the growing middle classes and
increasing consumer appetite for diamonds have
allowed retailers in developing markets, together with
the less prevalent ecommerce models, to enjoy higher
margins and return on invested capital, although
these too have started to come under pressure.
25
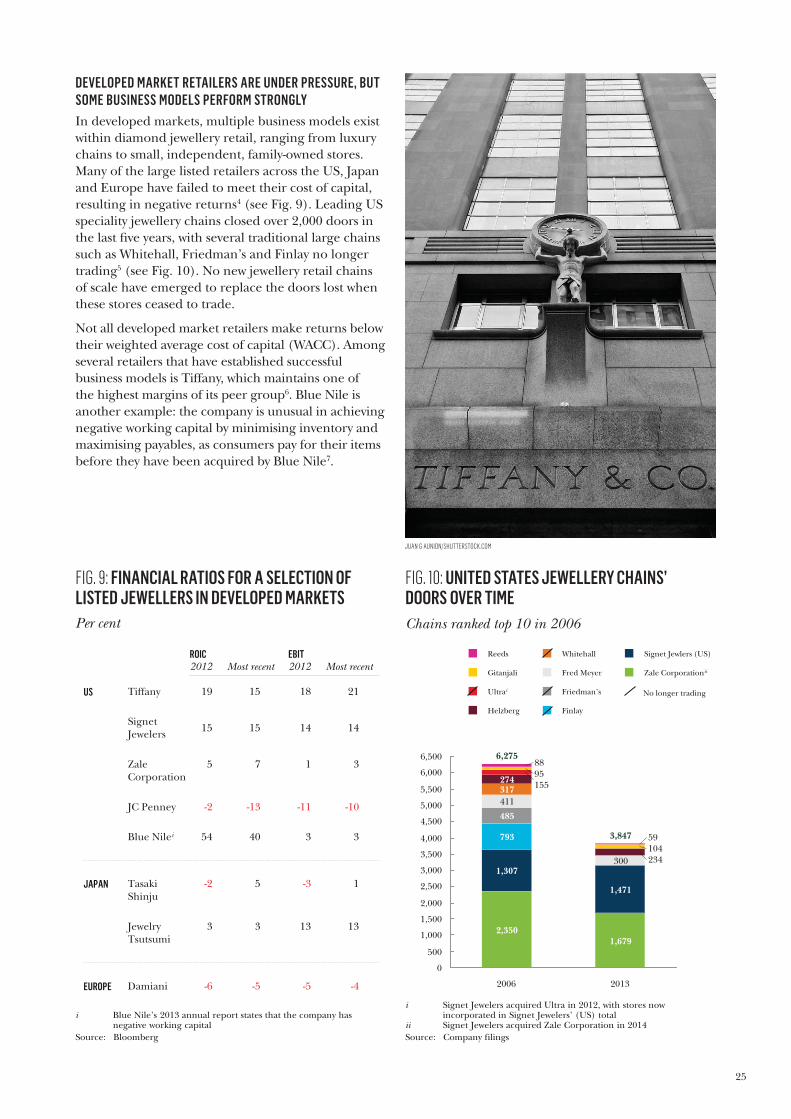
DEVELOPED MARKET RETAILERS ARE UNDER PRESSURE, BUT SOME BUSINESS MODELS PERFORM STRONGLYIn developed markets, multiple business models exist
within diamond jewellery retail, ranging from luxury
chains to small, independent, family-owned stores.
Many of the large listed retailers across the US, Japan
and Europe have failed to meet their cost of capital,
resulting in negative returns4 (see Fig. 9). Leading US
speciality jewellery chains closed over 2,000 doors in
the last fi ve years, with several traditional large chains
such as Whitehall, Friedman’s and Finlay no longer
trading5 (see Fig. 10). No new jewellery retail chains
of scale have emerged to replace the doors lost when
these stores ceased to trade.
Not all developed market retailers make returns below
their weighted average cost of capital (WACC). Among
several retailers that have established successful
business models is Tiffany, which maintains one of
the highest margins of its peer group6. Blue Nile is
another example: the company is unusual in achieving
negative working capital by minimising inventory and
maximising payables, as consumers pay for their items
before they have been acquired by Blue Nile7.
FIG. 9: FINANCIAL RATIOS FOR A SELECTION OF LISTED JEWELLERS IN DEVELOPED MARKETS
Source: Bloomberg
Per cent
i Blue Nile’s 2013 annual report states that the company has negative working capital
ROIC 2012 Most recent
EBIT 2012 Most recent
Signet Jewelers
15 14 15 14
Zale Corporation
7 3 5 1
JC Penney -13 -10 -2 -11
Blue Nilei 40 3 54 3
Jewelry Tsutsumi
3 13 3 13
Tiffany 15 21 19 18 US
Tasaki Shinju
5 1 -2 -3 JAPAN
Damiani -5 -4 -6 -5 EUROPE
FIG. 10: UNITED STATES JEWELLERY CHAINS’ DOORS OVER TIME
Source: Company filings
i Signet Jewelers acquired Ultra in 2012, with stores now incorporated in Signet Jewelers’ (US) total
ii Signet Jewelers acquired Zale Corporation in 2014
4,000
3,500
3,000
2,500
2,000
1,500
1,000
500
0
6,500
6,000
5,500
5,000
4,500
411
317 274
155
95
88
2013
3,847
1,679
1,471
300 234
104
59
2006
6,275
2,350
1,307
793
485
Reeds
Fred Meyer Gitanjali
Helzberg
Signet Jewlers (US)
Friedman’s
Whitehall
Zale Corporationii
Finlay
Ultrai No longer trading
Chains ranked top 10 in 2006

26
ON THE WHOLE, EMERGING MARKET RETAILERS HAVE OUTPERFORMED DEVELOPED MARKETSFor retailers in emerging markets such as China and
India, sales of gold and gold jewellery, normally a
low margin category, represent the majority of their
revenues. However, retailers in these markets selling
diamond jewellery have benefited from structural
factors: growing economies, an increasing base of
consumers with appetite for diamonds and expanding
number of stores selling diamond jewellery. In
China, there is also a benefit from relative sector
consolidation, with multiple jewellery retailers
operating ‘at scale’.
Over the past few years, however, EBIT margins
(which for the major listed developing market
jewellers are similar to those of leading developed
market peers) have come under pressure8 as jewellery
input costs have increased and the pace of expansion
has slowed (see Fig. 11). In addition, gold demand
volatility has also played a role in weakening financial
results. As economic growth decelerates in the next
few years, and competition increases, it is likely that
margin pressures will also build for diamond jewellery
retailers in emerging markets.
THE IMPORTANCE OF ONLINE CHANNELS RISES ACROSS THE WORLDBoth emerging and developed markets saw a rise in
the importance of online channels in 2013. More
than one in six diamond jewellery purchases in
the US were made online in 2013, a growth of over
30 per cent since 2011 (see Fig. 12). Going online
also remains the most popular way for consumers
to research a purchase in the US: almost four in 10
consumers go online for research purposes before
buying, ahead of other touch-points such as jewellery
stores and advertisements (see Fig. 13).
Although online is not yet a significant sales channel
in China, the internet is already used by a quarter
of acquirers for different purposes, such as to learn
about fine jewellery quality and prices, to learn about
brands, and to pre-select designs. The internet is used
more frequently in the diamond purchase process by
single women, half of whom use it, and also by affluent
consumers, about six in 10 of whom research online.
Online, including mobile usage, can be expected to
grow in importance for diamond jewellery retailers
everywhere, be it for research purposes before a
purchase or as a sales channel (pure or hybrid, via
web sales with store pick-up).
FIG. 12: GROWTH OF ONLINE DIAMOND JEWELLERY SALES IN THE UNITED STATES
Source: De Beers
2013
13
18
2011
12
13
2006
5
8
Per cent of value
Per cent of pieces
Share of online acquisitions in total women’s diamond jewellery market
FIG. 11: FINANCIAL RATIOS FOR A SELECTION OF LISTED JEWELLERS IN EMERGING MARKETS
Source: Bloomberg
Chow Sang Sang
7 4 7 7
Luk Fook Holdings
22 12 11 19
Lao Feng Xiang
15 4 5 14
Hengdeli Holdings
8 8 11 10
Thangamayil Jewellery
1 1 5 12
Tribhovandas Bhimji Zaveri
8 7 9 12
ROIC 2012 Most recent
EBIT 2012 Most recent
Chow Tai Fook
14 12 15 13 CHINA
Titan Company
22 10 10 35 INDIA
Per cent

27
FIG. 13: PRE-PURCHASE TOUCH-POINTS FOR DIAMOND JEWELLERY ACQUIRERS IN THEUNITED STATESPer cent of acquisitions in 2013
i Multiple responses allowedii Includes all forms of advertising for a piece of diamond jewellery
or brandiii Refers to DJ acquirers who selected ‘look in magazines to see the
range of options’
11
19
32
34Online
Magazinesiii
Advertisingii
Jewellery stores
% OF PIECESi % OF ACQUIRERSi
12
22
36
38

28

29
Source: De Beers
1 OFFERING A UNIQUE PROPOSITION
Fewer than one per cent of the world’s diamonds are eligible to become a
Forevermark diamond.
Branded diamonds with strong consumer benefits can command a price premium r
over unbranded products, translating into a margin uplift.
Forevermark provides retailers and consumers alike with the total confidence
that their Forevermark diamond is not only natural and untreated but
responsibly sourced.
Retailers can utilise the Forevermark brand in designs tailored to specific markets and
consumer tastes. “I also love the fact that, while Forevermark is a brand in and of itself, we are able to customise the offering and the marketing message to fit our merchandise and image strategies.” – Coleman Clark, B.C Clark Jewelers.
2 INVESTING IN AWARENESS AND DRIVING FOOTFALL AS CONSUMERS SEEK OUT FOREVERMARK STOCKISTS
Launched in China in 2008 and North America in 2011, Forevermark now has over
476 and 402 retail partners in the countries respectively.
The Forevermark brand continues to make gains in brand awareness in the top
diamond jewellery markets: in 2013, prompted awareness in the US reached one third
of consumers, and in China prompted awareness was 44 per cent.
Forevermark recently celebrated its one millionth inscription globally, with 45,000
diamonds inscribed in the US in 2013, a year-on-year increase of 66 per cent.
The Forevermark US Center of My Universe campaign in 2012 and 2013 was
enthusiastically received by both consumers and retailers: “…very pleased with overall traffic that was brought in due to the campaign. Three times better than last year’s.” –Forevermark retailer.
3 ENHANCING THE PURCHASING EXPERIENCEFOR CONSUMERS
Consumer initiatives such as branded in-store diamond viewers enhance the
consumer’s experience, creating a dialogue around the product. “Getting a client involved in viewing the Forevermark icon and inscription number is a must.” – John Borghes,
Marci Jewelers.
FIG. 14: HOW THE FOREVERMARK BRAND IS SUPPORTING RETAILERS
LOOKING AHEAD
BRANDS MAY HELP OVERALL PERFORMANCE, ESPECIALLY IN DEVELOPED MARKETSOne way for the retail industry to improve its
fi nancial performance could be a greater emphasis
on branded diamonds and diamond jewellery.
Increasing consumer preference for brands is evident
in the US from the jump in claimed acquisition of
branded engagement rings, from just seven per cent
of consumers in 2002 stating that their diamond
engagement ring (DER) was branded to one-third of
consumers in 2013 claiming that this was the case.
By offering brands with a specifi c positioning, and a
story that goes beyond the 4Cs, retailers are able to
address consumer needs for emotional engagement,
differentiate the product from generic offerings and
reinforce the diamond dream. While scale companies
are better placed to make the level of investment
required to benefi t from this growing preference, all
retailers have the potential to benefi t from this trend.
Branded diamond jewellery can also be an attractive
fi nancial proposition for retailers. Successful brands
typically command a price premium above generic
products. This is based upon factors such as polished
diamonds’ beauty and appearance, jewellery design,
higher levels of consumer confi dence, and superior
service, offering retailers opportunities to differentiate
from generic propositions (see Fig. 14).
The additional revenues from brands help retailers
to invest further in the in-store experience and in
promoting their businesses and the category,
helping to generate growth.
GLOBAL LUXURY BRANDS ARE SUPPORTING THE DIAMOND DREAM AND CHANGING CONSUMER EXPECTATIONS Many global luxury players such as Chanel and Dior
have entered the market for diamond jewellery, and
their approach to retailing is raising the bar for all
(see Fig. 15). As consumers become accustomed to
the retail standards set by the luxury houses, their
expectations of the store environment and customer
service are rising – with important consequences
for other fi ne jewellery retailers.
Global luxury companies are not only changing
consumer expectations of how to buy, but also
consumer beliefs about what to buy. When selecting
diamonds, a consumer’s focus is often on acquiring
the best diamond possible: the carat content and
quality are critical. Global luxury brands are often
trying to shift the focus towards acquiring distinctive
designer pieces, adorned with diamonds.
30
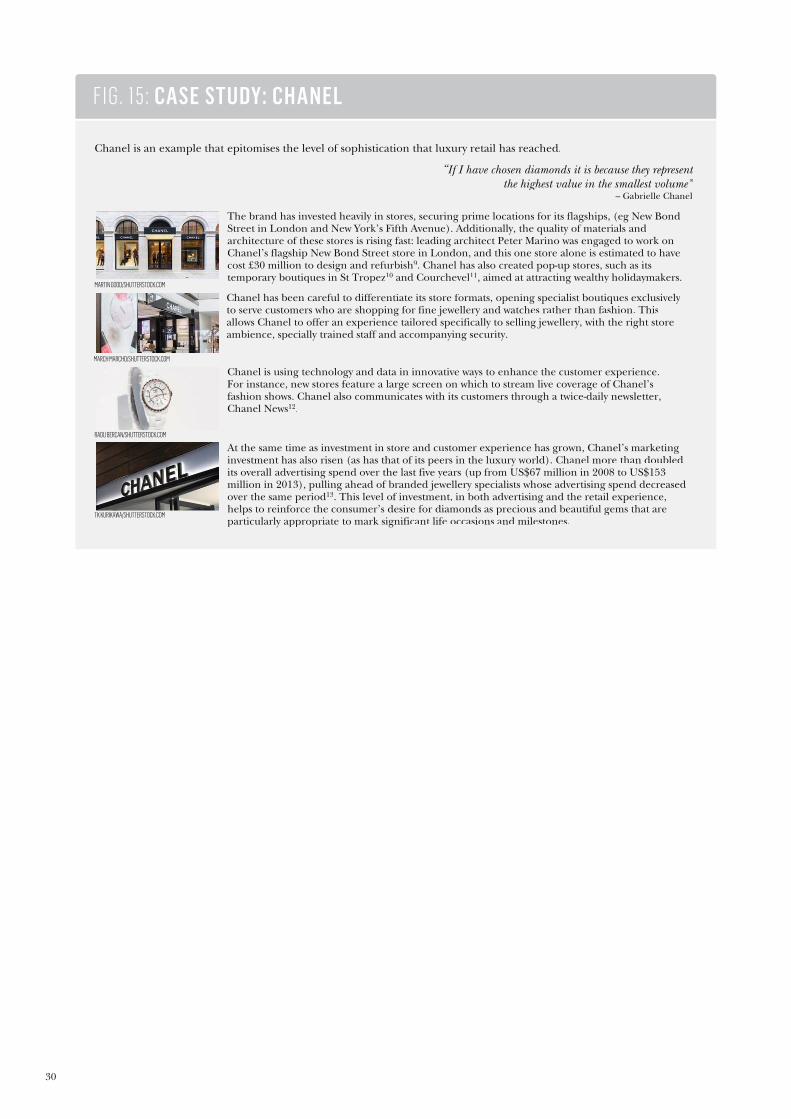
“If I have chosen diamonds it “ is because they representthe highest value in the smallest volume”
– Gabrielle Chanel
Chanel is an example that epitomises the level of sophistication that luxury retail has reached.
Chanel has been careful to differentiate its store formats, opening specialist boutiques exclusively to serve customers who are shopping for fine jewellery and watches rather than fashion. Thisallows Chanel to offer an experience tailored specifically to selling jewellery, with the right store ambience, specially trained staff and accompanying security.
MARCH MARCHO/SHUTTERSTOCK.COM
At the same time as investment in store and customer experience has grown, Chanel’s marketinginvestment has also risen (as has that of its peers in the luxury world). Chanel more than doubledits overall advertising spend over the last five years (up from US$67 million in 2008 to US$153million in 2013), pulling ahead of branded jewellery specialists whose advertising spend decreased over the same period13. This level of investment, in both advertising and the retail experience, helps to reinforce the consumer’s desire for diamonds as precious and beautiful gems that areparticularly appropriate to mark significant life occasions and milestones.
TK KURIKAWA/SHUTTERSTOCK.COM
MARTIN GOOD/SHUTTERSTOCK.COM
The brand has invested heavily in stores, securing prime locations for its flagships, (eg New Bond Street in London and New York’s Fifth Avenue). Additionally, the quality of materials andarchitecture of these stores is rising fast: leading architect Peter Marino was engaged to work onChanel’s flagship New Bond Street store in London, and this one store alone is estimated to have tcost £30 million to design and refurbish9. Chanel has also created pop-up stores, such as itstemporary boutiques in St Tropez10 and Courchevel11, aimed at attracting wealthy holidaymakers.
RADU BERCAN/SHUTTERSTOCK.COM
Chanel is using technology and data in innovative ways to enhance the customer experience.For instance, new stores feature a large screen on which to stream live coverage of Chanel’s fashion shows. Chanel also communicates with its customers through a twice-daily newsletter,Chanel News12.
FIG. 15: CASE STUDY: CHANEL

31
CONTINUED CONSOLIDATION CAN BE EXPECTEDA possible response to rising consumer expectations,
and the increased investment required to support
them, could be retailer consolidation. In fact, given
the recent weakness in the world’s economy and the
number of underperforming retailers, consolidation
might already have been expected to happen.
In reality, deal numbers and volumes in the industry
have grown slowly, at only two per cent CAGR from
2003 to 201314 (see Fig. 16).
The recent transaction announced between Zale
Corporation and Signet Jewelers in the US may signal
a change in the US jewellery retail space. The new
combined Signet/Zale entity could have as much as
10 per cent of total diamond jewellery sales in the US.
The US$100 million of annual savings estimated to
be achieved by fiscal year-end 201815, which the new
entity hopes to generate through store rationalisation
and increasing buying power, are meant to support its
profitability and allow it to invest in responding to the
changing consumer landscape.
F I G . 1 6 : J E W E L L E R Y M A R K E T M & A V O L U M E S A N D N U M B E R S O V E R T I M E
Source: Dealogic
0
1,000
2,000
3,000
4,000
5,000
6,000
7,000
8,000
9,000
0
5
10
15
20
25
30
35
40
45
50
55
60
65
70
75
80
85
90
2013 2012 2011 2010 2009 2008 2007 2006 2005 2004
# DEALS SUM OF DEAL VALUE USD million
Includes US$5.2 million
LVMH/Bulgari deal

32
C U T T I N G A N D P O L I S H I N G
2013 SNAPSHOTThe cutting and polishing industry is global in nature.
It remains fragmented, with thousands of companies
operating with multiple business models, including
wholesalers, rough dealers, manufacturers and
polished dealers, as well as combinations of these
activities. The Israel Diamond Exchange, for example,
has more than 3,000 members16, many of which are
very small companies or sole proprietors. Even among
the leading companies in the sector, there are many
traditional family-owned businesses with a long history
in the diamond industry.
However, recent years have seen the midstream sector
coming under increasing pressure for a number of
reasons. These include lower carat supply, increasing
costs in the upstream, and growing pressure from
the retail sector, where consumers make higher
demands and brands take greater share (as described
in the ‘Diamond Jewellery Retail’ chapter of this
report). These trends are compounded by significant
financing challenges: as polished demand increases,
the midstream needs additional funding. Declining
overall central bank interest rates17 have not resulted
in lower borrowing costs for midstream companies,
indicating that banks perceive increasing risks in the
diamond sector overall (see Fig. 17).
FIG. 17: DIAMANTAIRES’ BORROWING COSTS OVER TIME VS LIBOR RATES
Source: De Beers estimates; ICE Benchmark Administration Limited (IBA) for Libor rates
8
6
4
2
0
2011 2010 2014 2013 2012
INTEREST RATE
2009 2008 2007 2006 2005 2004 2003
Average interest rate
paid by diamantaires
Libor
Per cent

33

34
An interview with Erik A. Jens, CEO, ABN AMRO International Diamond & Jewellery Clients
A D I A M O N D I N D U S T R Y B A N K E R ’ S V I E W O N M I D S T R E A M I S S U E S A N D S O L U T I O N S
CAN YOU BRIEFLY INTRODUCE YOURSELF AND YOUR EXPERIENCE WITH THE DIAMOND INDUSTRY?I joined ABN AMRO International Diamond & Jewellery Clients, one of the major lenders to the midstream over the last century, as the CEO more than two years ago. My background is in private banking and finance, particularly hedge funds, so I entered the diamond industry with a fresh perspective.
HOW HAVE YOU SEEN THE MIDSTREAM EVOLVE SINCE YOU FIRST STARTED WORKING HERE? I have seen the industry’s attitude to change evolve. A couple of years ago, the midstream had a large culture of blame: blaming miners for high prices, retailers for stealing margins and bankers for limited support. Recently, however, midstream players have looked at themselves in the mirror, and become self-critical in their practices. There appears to be a readiness to embrace change from within, in order to tackle the increasingly competitive landscape. I believe this is a positive thing because it means the industry is becoming more transparent and sustainable.
Q
Q
LOOKING AHEAD
PRESSURE ON THE MIDSTREAM IS LIKELY TO LEAD TO PROFESSIONALISATION AND CONSOLIDATIONFinancing challenges are increasingly critical and
could intensify over the coming years. Rising inventory
costs, and diamond banks’ drive to constrain the
growth of their lending to the midstream, will mean
financing costs are unlikely to decrease, particularly
if the trend of low interest rates begins to change.
Additional financial scrutiny of the midstream
sector can therefore be expected. Leading banks in
the diamond sector have come to realise that they
have been taking equity-type risks in the diamond
midstream without getting the corresponding returns.
This is now changing and, as a result, borrowing costs
are going up while banks are asking their borrowers
to professionalise their capital management.
Overall, this trend is expected to affect the way the
industry operates. New lending standards will increase
the regulatory burden on the midstream, leading to
higher costs and operational complexity. One possible
consequence is that less well-established companies
may even exit the industry, leading to some level
of consolidation.
Over time, those firms that are able to add significant
value in the diamond cutting and polishing process
are more likely to be successful.
To succeed in today’s highly competitive midstream,
diamond businesses must develop strongly
differentiated, value-added propositions that set
them apart from their competition. Diamantaires
at all stages of the value chain have approached
this challenge in their own unique ways. Rough
dealers and preparers, such as Dianco, Diarough,
De Toledo and Fruchter Gad, have developed their
own unique, proprietary and bespoke assortments
which are carefully targeted and adapted to the
needs of specialist manufacturers.
Rough polishing has been the source of tremendous
innovation over the past decade, with Indian firms
such as K Girdharlal, Venus, Karp and Kiran leading
the way: their implementation of advanced IT and
laser technology has revolutionised the precision and
yield recovery of the cutting and polishing process.
For other firms, polished diamond distribution has
become the key to their differentiation. Sophisticated
internet-enabled stock management systems allow
businesses such as EZ Diamonds, YDI and Star Rays to
respond with speed and precision to their customers’
changing needs, often integrating seamlessly with a
customer’s own order management systems.

35
WHAT ARE YOUR KEY CONCERNS REGARDING THE FINANCIAL HEALTH OF THE MIDSTREAM?There is general lack of transparency in business practices and quality of reported financials across the midstream, leading to a loss of trust. This is compounded by the fact that the midstream is highly levered. Banks are therefore being more critical and thorough with funding decisions, and looking for a greater level of security against their loans.
HOW DO YOU THINK THE MIDSTREAM CAN ADDRESS THESE CONCERNS FOR THE FUTURE? WHO HAS BETTER ACCESS TO FUNDING AND WHY?When approaching financing decisions, we assess the ‘bankability’ of the clients – whether their business is in good financial health with transparent business plans, if they apply IFRS or equivalent GAAP standards especially when reporting receivables and inventory, and streamlining processes such as the removal of inventory round-tripping. Financiers reward sound fiscal management and good compliance by providing better lending conditions and more favourable rates. I also believe in openness between banks and their clients in order to work through any issues – which in the end comes back to the importance of transparency.
WHICH DO YOU BELIEVE ARE THE MOST SUCCESSFUL PLAYERS IN THIS INDUSTRY AND WHAT ARE THEY DOING THAT IS MAKING THEM SUCCESSFUL?In an increasingly competitive landscape, competitors have to adopt strategies to ensure survival and sustainability. Sustainability, in my opinion, is the right to exist. This is achieved by being prepared to compete in a saturated space with dynamic and flexible business plans, investment in infrastructure and technology and diversification. Some successful players have shown innovative manufacturing and cutting strategies to produce greater yields as well as developing a unique product.
DO YOU EXPECT CONSOLIDATION GOING FORWARD?The rate of change is still very slow, so I do not envisage much consolidation in the next five years or so. However, I do see the competitive landscape getting tougher, which will lead to those less sustainable businesses disappearing.
Q Q
Q
Q
Many midstream companies now also offer a
consumer branded proposition that creates a
unique identity around the precision cuts they
manufacture. These include Leo Schachter with
the Leo cut, Exelco with Tolkowsky and Crossworks
with the Ideal Square and Ideal Cushion.
THERE WILL BE A CONTINUED PUSH FOR IN-COUNTRY BENEFICIATIONWhen it comes to the geographical location of cutting
and polishing, the move towards low-cost centres in
India and the Far East is likely to have reached its
peak. Over recent years, producing countries such
as Botswana, South Africa and Namibia have been
striving for increased domestic beneficiation, leading
to some cutting and polishing jobs migrating to
those countries.
Diamonds are critical to the economies of some
producing nations. In Botswana, for example,
diamonds represent more than one quarter of GDP18
and over three-quarters of overall exports19, whereas
in Namibia they represent eight per cent of GDP20,
and almost 20 per cent of exports21 (see Fig. 18).
However, diamond mining in itself only creates a
limited number of jobs (as is also the case with other
types of mining) since it is capital-intensive rather
than labour-intensive.
FIG. 18: DIAMONDS’ SHARE OF GDP IN KEY PRODUCING COUNTRIES IN 2013
Source: The World Bank; Kimberley Process Statistics; De Beers analysis
Per cent
10
60
70
80
50
0
30
40
20
26
8
76
19
Diamond production, by
value, as per cent of GDP
Diamond exports, by value,
as per cent of total exports
Namibia Botswana

36

37
This is one of the main reasons why the governments
of southern African countries, for example, have been
keen to ensure their countries expand along the value
chain to sectors that create more jobs, such as cutting
and polishing.
At the same time as creating local jobs, benefi ciation
policies create a challenge. Lower worker productivity
means that cutting costs are higher in southern Africa
than in countries such as India, and so the move
towards local cutting increases costs and reduces the
profi t pool that can be shared between producers and
governments (see Fig. 19).
In order for local benefi ciation to be sustainable in the
long term, producing countries will need to make an
effort to develop competitive downstream industries
that can create value as well as generate jobs.
This will require investment in skills development and
infrastructure as well as thoughtful regulation. Only in
this way can the downstream diamond industry ensure
long-term job creation that will attract investors and
developers to the sector.
APPROXIMATE TOTALCUTTING AND POLISHING JOBS
APPROXIMATE CUTTING AND POLISHING COST USD/CARAT i
Producer countries are gaining share on the back of government policy, despitehigher costs than traditionalmanufacturing locations
‘Old’ cutting locations have lost share of manufacturing following migration first to low-cost locations and subsequently toproducer countries
The trend of growth in low-cost locationshas recently started to reverse
2008CUTTING CENTRE
Canada 300 50-800 NW
180 Ontario
25
2,200 3,75060-12045->125Botswana
1,000 150-200150+120Belgium
1,0001,800130-15060-100South Africa
2,000 400140->30047->55Israel
29,000 10,00020-5015-35Far East
850,000 800,00010-506-50India
2013 2008 2013
,5005 > 25Namibia 9701,50060-14045->125
US 80-100100300110
Source: De Beers estimates
i These are estimates for the majority of production units and exclude outliers
FIG. 19: CONSENSUS VIEW OF CUTTING AND POLISHING COSTS AND EMPLOYMENT IN CUTTING CENTRES

38
R O U G H D I A M O N D S A L E S A N D D I S T R I B U T I O N
2013 SNAPSHOTGlobal rough diamond sales by producers increased
approximately five per cent from 2012 to 2013, to
reach a total of just under US$18 billion.
De Beers remained the largest supplier with roughly
33 per cent of overall sales measured by value (the
same share as in 2012), followed by ALROSA with
25 per cent of sales (vs 23 per cent the year before).
Other primary suppliers included SODIAM (Angola)
with an estimated six per cent share, Rio Tinto
with a five per cent share and Dominion Diamond
Corporation and the Zimbabwe alluvial producers
with about four per cent each, all in approximate
USD value terms (see Fig. 20).
A variety of rough diamond sales channels are used
by primary suppliers (see Fig. 21). De Beers uses
multi-year contracts with more than 80 term contract
clients – Sightholders – to sell most of its production.
De Beers has also used sophisticated online auctions
since 2008 to sell a proportion of the Group’s
production. In recent years, ALROSA has established
three-year supply agreements with a selection of
customers and supplements these sales with one-
time sales as well as competitive bidding (auctions)22.
However, some producers, such as Gem Diamonds
and Petra Diamonds, use an auction-only platform.
FIG. 20: GLOBAL ROUGH SUPPLY
Source: De Beers
Per cent
i Okavango Diamond Company sales are accounted for in the De Beers number as sales from DTC Botswana
ii Excludes sales of polished diamonds and sales of rough diamonds to Gokhran
iii Company Annual/Quarterly Reports iv De Beers estimates v Includes 40 per cent of Diavik production and 80 per cent of
revenue from Ekati from April 2013 vi Company reports including Gem, Petra, Firestone, Lucara,
Kimberley Diamonds, among others
2013 ROUGH DIAMOND SALES BY VALUE SHARE
De Beersi
33
ALROSAii
25
Rio Tintoiii
5
SODIAMiv
6
Artisanal/
Informaliv
12
Othervi
11
Zimbabwe/
Marange
(Chiadzwa)iv
4
Dominionv
4

39
In fact, supply through term contracts with a number
of selected customers seems to be the preferred mode
among suppliers offering a relatively stable volume
and mix of goods, often supplemented by auctions,
especially of large stones.
Whereas BHP Billiton used auctions to sell production
from its Ekati mine, Dominion Diamond Corporation,
which acquired 80 per cent of the mine from BHP
in 201323, has recently announced that the company
plans to sell its production from Ekati and its share of
the Diavik mine production through contract sales to
approximately 30 companies from July 201424.
MORE ROUGH DIAMONDS ARE BEING SOLD LOCALLYProducing countries have been playing a more active
role in the sale and distribution of rough diamonds.
This is driven by a strong desire on the part of national
governments to increase their share of value-add
of the primary resource, and has resulted in the
establishment of domestic sales channels such as
the State Diamond Trader in South Africa, and the
Okavango Diamond Company in Botswana.
The trend towards in-country value addition to
diamonds saw perhaps its largest milestone yet in 2013,
with the move of De Beers’ Global Sightholder Sales to
Botswana, and the organisation of De Beers’ fi rst ever
international ‘Sight’ in Gaborone in November 2013.
FIG. 21: ROUGH DIAMOND SALES METHODOLOGIES
Source: De Beers
DESCRIPTION SALES METHOD
Agreement for the continued sale of a certain
type and amount of rough diamonds over an
extended period. Contract lengths vary.
Generally, the price is set by the seller and the
same prices are charged for the same products
to all buyers.
TERM CONTRACT
Ad hoc sales agreement between seller and
buyer for a particular type of range of rough
diamonds with no guarantee of continued
supply. Price, either set by seller or subject to
negotiation between buyer and seller.
WILLING BUYER, WILLING SELLER (OR ‘PLACED’ SALES)
Discrete sales event at which bidders compete
for the purchase of a parcel of rough diamonds
through a series of ‘rounds’. Various types can
be employed such as multiple unit auctions and
open ascending price auctions. In most auction
types (except for tenders – see below),
participants have the opportunity to amend
their offers in response to other bids submitted.
When one bidder has outcompeted the others
in the process, the auction is complete. Price is
an outcome of the competitive bidding process.
AUCTION
Discrete sales event at which bidders submit a
single bid for the purchase of rough diamonds
through a ‘closed envelope’ approach. The
highest bid submitted is the winner and as a
rule participants have no opportunity to amend
their offer once submitted.
TENDER
40
This move followed the conclusion of a new diamond
sales and marketing agreement between De Beers
and the Government of the Republic of Botswana
and involved the transfer of the majority of De
Beers’ sorting and rough diamond sales activities,
including 84 employees, from De Beers’ London
offi ces to Gaborone. Employees who relocated from
London continue to work to integrate and harmonise
international skills, while also developing the skills of
the Batswana, strengthening the domestic talent pool
and the Botswana diamond sector overall.
As of 2014, the majority of De Beers’ rough diamond
availability is sold in Botswana. This will help position
the country as a global centre for the diamond
industry. The holding of Sights in Botswana’s capital
means that representatives of De Beers’ Sightholders
– more than 80 of the world’s leading diamantaires
– travel to Gaborone up to 10 times a year, creating
additional demand for local goods and services. It
will also facilitate the expansion into downstream
benefi ciation and the development of diamond-related
services. All of this has the potential to contribute to
substantial job creation in the Botswana economy well
beyond the jobs created by De Beers’ activities directly
related to diamond selling (see Fig. 22).
For more than 45 years, the partnership between
De Beers and Botswana has delivered signifi cant
benefi ts to the people of Botswana. At the heart of
this partnership is Debswana, the diamond mining
joint venture between the Government and De Beers.
Similar arrangements exist in Namibia and South
Africa, where partnership agreements are also in
place – in Namibia with the Government through
Namdeb Holdings, and in South Africa with its
Black Economic Empowerment partner Ponahalo.
Governments in all these countries, as well as the
thousands of local workers in the diamond industry,
have made substantial efforts to support the industry.
However, to ensure the long-term sustainability of
the domestic diamond sector, it remains critical
that all stakeholders work together to maintain and
strengthen the productivity and competitiveness of
the sector.
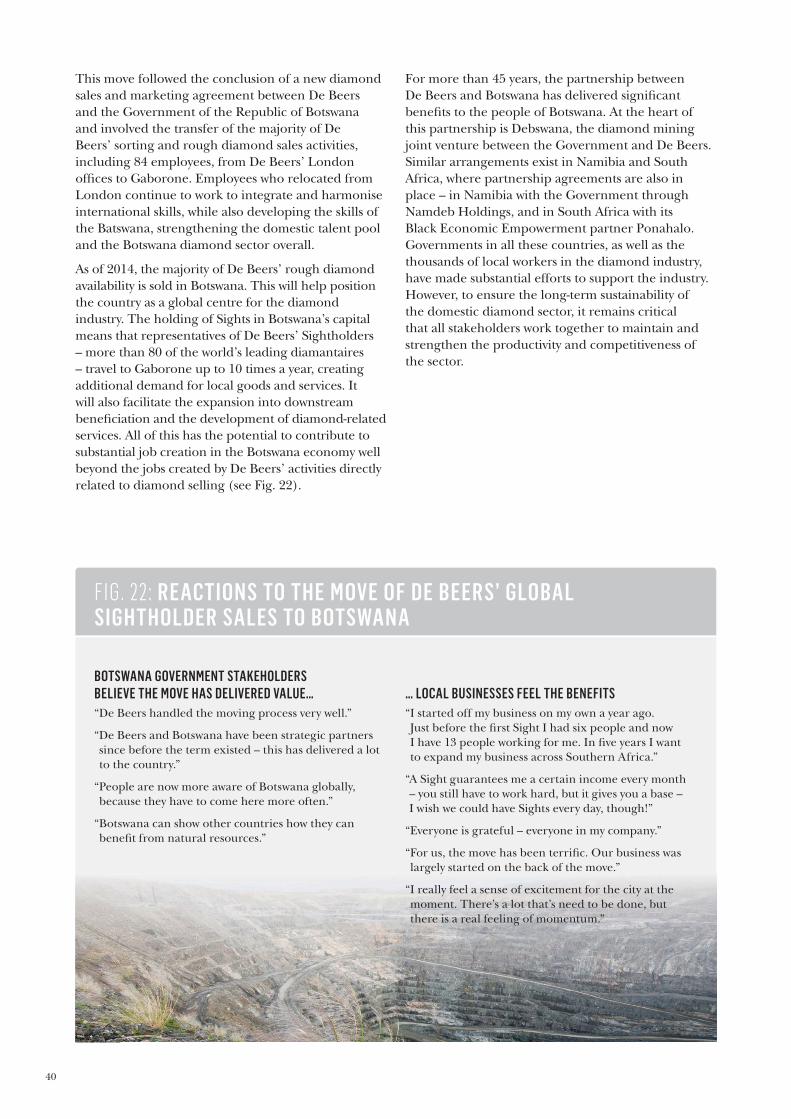
FIG. 22: REACTIONS TO THE MOVE OF DE BEERS’ GLOBALSIGHTHOLDER SALES TO BOTSWANA
… LOCAL BUSINESSES FEEL THE BENEFITS“ I started off my business on my own a year ago.
Just before the fi rst Sight I had six people and now
I have 13 people working for me. In fi ve years I want
to expand my business across Southern Africa.”
“ A Sight guarantees me a certain income every month
– you still have to work hard, but it gives you a base –
I wish we could have Sights every day, though!”
“Everyone is grateful – everyone in my company.”
“ For us, the move has been terrifi c. Our business was
largely started on the back of the move.”
“ I really feel a sense of excitement for the city at the
moment. There’s a lot that’s need to be done, but
there is a real feeling of momentum.”
BOTSWANA GOVERNMENT STAKEHOLDERS BELIEVE THE MOVE HAS DELIVERED VALUE… “De Beers handled the moving process very well.”
“ De Beers and Botswana have been strategic partners
since before the term existed – this has delivered a lot
to the country.”
“ People are now more aware of Botswana globally,
because they have to come here more often.”
“ Botswana can show other countries how they can
benefi t from natural resources.”

41
LOOKING AHEAD
SALES CHANNELS WILL CONTINUE TO EVOLVEIn rough diamond sales, there are significant benefits
to being a scale producer and supplier. The various
mines offer quite different production profiles, and
production fluctuates in the quantity, size and quality
of diamonds. This means that a company’s ability to
offer a consistent supply of gems is strengthened by
operating several mines.
This kind of offering attracts the best diamantaires and
also allows for a steadier cash flow for the company.
Rough diamond sales channels will continue to
evolve as producers strive to maximise value creation
for their production. De Beers is in the process of
redesigning its distribution system.
The company remains committed to its model of term
contract sales to Sightholders, to which the company
will continue to allocate the majority of its supply.
However, in May 2015, it will introduce a new category
of rough diamond customer: the Accredited Buyer.
An Accredited Buyer will not be supplied by way of a
term contract, but will be eligible to purchase rough
diamonds not already committed for sale by way of
term contracts. Over time, Accredited Buyers that
demonstrate sufficient demand for De Beers’ goods
will be eligible to apply for Sightholder status.

42
R O U G H D I A M O N D P R O D U C T I O N
2013 SNAPSHOT
CURRENT PRODUCTION IS WELL BELOW ITS 2005 PEAK De Beers estimates that overall global rough diamond
production increased by three per cent from 2012
to US$18 billion in 2013. Measured in carats, the
increase was seven per cent, to reach 146 million
carats. This is still well below the production peak in
2005, when overall production was above 176 million
carats25 (see Fig. 23).
The largest diamond producing country, by volume,
is Russia, which in 2013 produced 25 per cent
of total carats, and 26 per cent of overall rough
diamond value. Botswana produced 16 per cent of
carats, corresponding to 21 per cent of overall value.
Another large volume producing country is the DRC,
which has historically produced on average 19 per
cent of total volume, but equivalent to only roughly
six per cent of value due to low value per carat26
(see Fig. 24).
De Beers and ALROSA continue to be the two largest
diamond producing groups by value. De Beers’ 2013
share of volume was 21 per cent and its share of value
33 per cent, while ALROSA’s share of volume and
value were 25 per cent and 26 per cent respectively
in 2013 (see Figs. 25 and 26).
The third largest company in the sector is Rio Tinto,
which produced 11 per cent of total carats in 2013,
corresponding to approximately five per cent of global
production value. Another large producer is Angola’s
Catoca mine, generating approximately five per cent
of both volume and value of production in 2013. The
companies operating the alluvial fields of Chiadzwa in
Zimbabwe contributed an estimated eight per cent of
volume and four per cent in value in 2013.
FIG. 23: GLOBAL PRODUCTION VOLUME (1882-2013)
Source: De Beers
160
140
120
100
80
60
40
20
0
180
1882 2013
Million carats (gem only 1882-2008; all carats included 2008-2013)
Note: Prior to 2008, Russian industrial carats were excluded from the total. From 2008, they are included

43
FIG. 25: GLOBAL ROUGH DIAMOND PRODUCTION VOLUME
Source: De Beers estimates, Kimberley Process Statistics
10
140
120
80
40
60
100
20
0
30
50
70
90
110
130
150
160 153
-4
2013
146
20122011201020092008
-8
1
2
22
0
1
Informal/ArtisanalOther Major/Junior
ALROSA Catoca
Zimbabwe (Chiadzwa)De Beers
2008-2013 CAGRPer cent
2008-2013 CAGRPer cent
Million carats
FIG. 26: GLOBAL ROUGH DIAMOND PRODUCTION VALUE
Source: De Beers estimates
0
8
71
3
10
5,000
0
20,000
15,000
10,000
+17
2008 20112010 201320122009
Catoca
Other Major/Junior
ALROSA
De Beers
Informal/Artisanal
Zimbabwe (Chiadzwa)
1
2008-2013 CAGRPer cent
2008-2013 CAGRPer cent
USD million
Source: De Beers estimates
F I G . 2 4 : R O U G H D I A M O N D P R O D U C T I O N B Y M A I N P R O D U C I N G C O U N T R Y
VOLUME Million carats
0
10
20
30
40
50
60
70
80
90
100
110
120
130
140
150+7
20132012
All others
Botswana
DRC
Angola
South Africa
Canada
Australia
Russia
VALUEUSD million
0
5,000
10,000
15,000
20,000+3
20132012
GROWTH Per cent
GROWTH Per cent

44
F I G . 2 7 : P R O J E C T E D G L O B A L R O U G H D I A M O N D P R O D U C T I O N
Source: McKinsey & Company, ‘Perspectives on the Diamond Industry’, September 2014
60
30
90
40
10
20
130
160
140
150
110
0
50
120
100
80
70
170
20
23
20
28
20
29
20
30
20
25
20
26
20
24
20
27
20
22
20
20
20
17
20
16
20
19
20
14
20
13
20
12
20
21
20
15
20
18
Expansions New projects Existing Million carats
LOOKING AHEAD
DIAMOND PRODUCTION IS EXPECTED TO FALL GRADUALLY WHILE OPERATING COSTS WILL CONTINUE TO INCREASEOverall diamond supply is expected to increase in
the next few years, driven by new projects coming
on stream. By 2020, when many of the existing mines
will begin to see declining outputs, overall supply is
expected to plateau (see Fig. 27).
A number of projects are under way to expand
diamond production. By 2020, about 25 per cent of
carat production will come from projects currently
under development, but much of this increase in
output comes from projected expansion at current
mines such as Rio Tinto’s Argyle mine in Australia.
Among new developments, the largest are ALROSA’s
Botuobinskaya, Lukoil’s Grib and De Beers’/
Mountain Province Diamonds’ Gahcho Kué projects.
Beyond 2020, there is a risk that production levels
will begin to decline unless major new discoveries are
made in the coming years and rapidly developed. As
illustrated elsewhere in this report (see ‘Diamond
Exploration’ chapter), the likelihood of large
economically viable discoveries is low, and so supply
can be expected to decline gradually after 2020.
1
2
3
4
Rio Tinto’s decision to continue to
operate in the diamond industry. Rio
Tinto conducted a strategic review of
its diamond business, which included a
potential divestment. In June, the company
announced its decision to retain the
diamond business27.
In April, Rio Tinto commenced
underground operations at its Argyle
mine in Australia28.
BHP Billiton’s exit from the industry upon
completing the sale of its stake in the Ekati
diamond mine to Dominion Diamond
Corporation in April29.
In October, the Russian government
privatised 16 per cent of its stake in
ALROSA, by way of an Initial Public
Offering, for US$1.3 billion.
MAJOR EVENTS IN 2013 DIAMOND PRODUCTION

45
Source: De Beers
F I G . 2 8 : D I A M O N D P R O J E C T P I P E L I N E ( 2 0 1 4 - 2 0 1 7 )
Note: All data estimated based on best available public information as of May 2014
DEPOSIT NAME OWNER(S)DISCOVERER ANDYEAR OF DISCOVERY COUNTRY STATUS
EST. FIRST PRODUCTION
AVERAGE ANNUAL PRODUCTION (MCTS)
ADC (1997) Development 2014 4Grib Lukoil Oil Company
ALROSA (1994) Development 2015 2Botuobinskaya ALROSA
ALROSA (1982) Development 2015 1Karpinsky-1 ALROSA
Mountain Province Diamonds (1995)
Permitting 2016 5Gahcho Kué De Beers/Mountain Province Diamonds
Ashton (2001) Permitting 2017 2Renard Stornoway, Newmont
Rio Tinto (2004) Pre-feasibility 2017+ 2Bunder Rio Tinto
Falcon Bridge (1981)
Construction 2014 0.4Ghaghoo Gem Diamonds
Uranerz (1988) Feasibility 2017+ 2Star-Orion South Shore Gold Inc
Russia
Russia
Botswana
India
Canada
Canada
Canada
Russia
In order to make a difference to global availability,
any discovery would have to be substantial – even the
largest of new projects under development, Gahcho
Kué, will only expect to add approximately five
million carats per year at its peak of production,
about three to four per cent of annual global
production (see Fig. 28).
Even if new discoveries were made, the impact of such
discoveries on production levels would be likely to
be slow. From 1950 to today, it took an average of
14 years between the discovery of a diamond deposit
and the start of production. For projects currently
in development, however, this time is even longer:
it will take more than 20 years from discovery to first
production. Gahcho Kué, for example, was discovered
in 1995, but is not projected to enter production
until late 2016.
Diamond production is also becoming increasingly
challenging as mining moves towards deeper, less
profitable and more remote sources. This trend
is explored further in the ‘In Focus’ section, ‘The
miracle of production’.

46
D I A M O N D E X P L O R AT I O NThe chase is on: diamond miners continue to search the ends of the earth for the next big find.
2013 SNAPSHOT
AROUND US$7 BILLION HAS BEEN SPENT ON EXPLORATION SINCE 2000Diamond mineral systems occur in very specific
cratonic target areas – these are well-known.
With growing demand for diamonds and dwindling
supplies from existing mines, the search for the
next diamond mines is expected to continue.
Since 2000, the diamond mining industry has
spent almost US$7 billion on exploration30.
To date, these efforts have yielded relatively meagre
results: only one diamond deposit of significant size
(Bunder, in India) has been discovered during this
period31, in addition to other smaller deposits such
as Orapa AK6 in Botswana (now the Karowe mine),
owned by Lucara Diamond Corporation.
Today, the majority of diamond exploration spend
takes place in relatively underexplored African
countries such as Angola, the DRC and Zimbabwe,
as well as the vast swathes of Arctic Siberia and
Canada. Recently, there has been some change in
the allocation of this spending: from 2011 to 2013
the share of global exploration spending that went to
Russia increased from 27 per cent to 54 per cent, at
the expense of countries such as Canada, South Africa
and India32 (see Fig. 29).
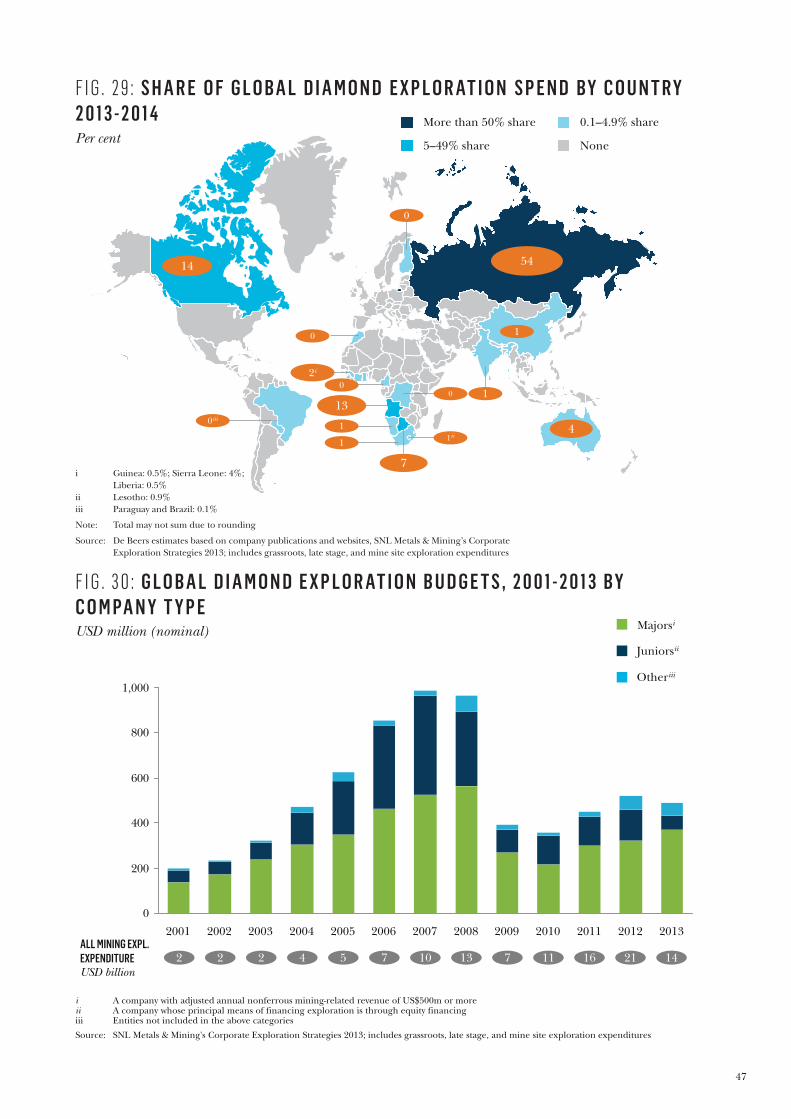
47
2 2 4 5 7 10 13 7 11 16 21
Source: SNL Metals & Mining's Corporate Exploration Strategies 2013; includes grassroots, late stage, and mine site exploration expenditures
F I G . 3 0 : G L O B A L D I A M O N D E X P L O R AT I O N B U D G E T S , 2 0 0 1 - 2 0 1 3 B Y C O M PA N Y T Y P E
0
200
400
600
800
1,000
2012 201320112010200920082007200620052004200320022001ALL MINING EXPL. EXPENDITUREUSD billion
2
USD million (nominal)
i A company with adjusted annual nonferrous mining-related revenue of US$500m or moreii A company whose principal means of financing exploration is through equity financing iii Entities not included in the above categories
Otheriii
Majorsi
Juniorsii
14
14 54
4
1
7
0
0
1ii
2i
0 1 0
1
13
1
0iii
F I G . 2 9 : S H A R E O F G L O B A L D I A M O N D E X P L O R AT I O N S P E N D BY C O U N T RY 2 0 1 3 - 2 0 1 4 More than 50% share
5–49% share
0.1–4.9% share
None Per cent
i Guinea: 0.5%; Sierra Leone: 4%;
Liberia: 0.5%
ii Lesotho: 0.9%
iii Paraguay and Brazil: 0.1%
Note: Total may not sum due to rounding
Source: De Beers estimates based on company publications and websites, SNL Metals & Mining’s Corporate
Exploration Strategies 2013; includes grassroots, late stage, and mine site exploration expenditures

48

49
7
Tier 1i Tier
2 & 3
53
Economical
deposits
60
Non-
economical
Diamond-
iferous
deposits
1,000
Non-
diamond-
iferous
5,800
Kimberlite
pipes
sampled
6,800
FIG. 31: NUMBER OF DIAMOND DEPOSITS SUFFICIENTLY RICH TO WARRANT DEVELOPMENT
Source: De Beers
i Over US$20 billion reserves. 7 ‘Tier 1’ finds are: Jwaneng, Orapa, Udachny, Venetia, Catoca, Premier (now Cullinan), Mir
While the appetite for exploration remains high
(2013 spending was 2.5 times that of 2001), overall
spending has still not reached the record levels of
2007, when companies spent almost US$1 billion on
diamond exploration (see Fig. 30). The trend here
differs from the mining sector in general, where 2013
expenditure, although lower than in 2012, remains
well above 2007/2008 levels. De Beers and ALROSA
represented almost 75 per cent of exploration
spending in 201333.
LOOKING AHEAD
LARGE-SCALE PROFITABLE DISCOVERIES WILL MOST LIKELY REMAIN ELUSIVE The large diamond mining companies are expected
to continue to invest in exploration, but the
probability of a major profitable new diamond
discovery will remain relatively low. This is simply
because finding economic diamond deposits is
difficult: even spending billions of US dollars
in exploration carries no guarantee of actually
discovering economically viable deposits.
Over the last 140 years, almost 7,000 kimberlite pipes
have been sampled by geologists, about 1,000 of
which have been diamondiferous. However, only
about 60 of these are sufficiently rich in diamond to
be economically viable. Just seven mines (Jwaneng
and Orapa in Botswana, Udachny and Mir in Russia,
Premier (now Cullinan) and Venetia in South Africa
and Catoca in Angola) are what miners refer to as
‘Tier 1 deposits’ with more than US$20 billion worth
of reserves (see Fig. 31).
Overall, the global mining industry is facing
increasing pressure on capital expenditure, and in
recent years many large-scale development projects
have been placed on hold.
This also puts pressure on exploration spending.
Across the mining sector, exploration expenditure
fell by almost a third to about US$14 billion in 201334.
The geographical focus of diamond exploration will
be likely to continue to be in those areas where the
prospectivity potential is highest and where the least
exploration has been conducted to date, such as
Central Africa, Russia and Canada. In addition, South
Africa and Zimbabwe are countries with potential:
although they have a long tradition of diamond
mining, high-resolution exploration technology has
not yet been applied systematically here.

50

51
03I N F O C U S

52
I N F O C U S : C H A N G I N G C O N S U M E R P R E F E R E N C E S A N D T H E G R O W T H O F B R A N D S I N T H E U N I T E D S TAT E S A N D C H I N A
The diamond dream is very much alive. The physical
attributes that diamond jewellery consumers are
drawn to – the sparkle and beauty of diamonds –
are accompanied by emotional associations of love
and promise, prestige, mystique, tradition and a
sense of the eternal. Diamonds continue to be seen
as an emotional symbol and a store of value.
However, the diamond industry cannot afford to
take this situation for granted, especially when
the consumer landscape is changing so rapidly.
This ‘In Focus’ section provides an insight into
the changes in two of the world’s most important
diamond consumer markets: the US, the world’s
largest, and China, the world’s fastest growing.
The results shown here are drawn from extensive
consumer research commissioned by De Beers. In its
most recent survey, the research covered over 20,000
women in the US (nationally representative) and
over 10,000 women in China (representative of 123
Tier 1, 2 and 3 cities).

53
The US remains the largest market for diamonds in
the world. Total US retail sales of diamond jewellery
reached pre-2009 downturn levels in 2013 while
polished diamond content in jewellery increased by
20 per cent from 2008. Overall, the US accounted
for approximately 40 per cent of global polished
diamond consumption by value in 2013.
The US consumer market is made up of women’s
jewellery, men’s jewellery and jewellery for adolescent
girls, called ‘teens’ jewellery’. Of those three segments,
women’s jewellery represents by far the largest portion
of total diamond jewellery sales, with well over 90
per cent of sales value.
Traditionally, two major segments of diamond
jewellery have been analysed in the US women’s
category: bridal jewellery (including diamond
engagement rings (DER) and diamond wedding
bands (DWB)) and non-bridal jewellery (which can
be further subdivided into married women’s diamond
jewellery (MWDJ) and single women’s diamond
jewellery (SWDJ)) – see Fig. 32.
Non-bridal diamond jewellery is the largest segment
by value in the US. In 2013, it accounted for over
four in five pieces and about two-thirds of sales value
of women’s DJ. However, compared with the pre-
recession state of the US market, this segment has
lost share both in volume and in value to the bridal
segment (see Fig. 33).
This shift has been driven by two changes. Firstly, the
number of DER pieces sold has increased and the
average price per DER piece has grown even more
rapidly than unit sales. The average DER price is
more than three times higher than the average price
for other women’s jewellery. As a result, in 2013 DER
accounted for a little over one in 10 pieces sold, but
represented close to 28 per cent of retail market value
of women’s DJ.
Secondly, within the non-bridal segment, the two
sub-sets – MWDJ and SWDJ – have behaved quite
differently since the economic downturn. Over this
period, the share of MWDJ has declined in volume
of pieces, while its share of value has gone up slightly.
At the same time, the SWDJ segment has retained its
share of volume, but its share of value has declined.
Note: Area of rectangles reflects approximate proportion of total market by value
F I G . 3 2 : D I A M O N D J E W E L L E R Y ( D J ) M A I N C O N S U M E R S E G M E N T S I N T H E U N I T E D S TAT E S ( 2 0 1 3 )
Source: De Beers
Men’s & Teens’ DJ
6
Total DJ demand
100
MWDJ
52 SWDJ
12
Bridal DJ
30 Non-Bridal DJ
64
Men’s DJ
5
Women’s DJ (WDJ)
94
DER
26 DWB
4
Teens’ DJ
1
Per cent of DJ value
THE UNITED STATES OPPORTUNITIES EMERGING DESPITE CHALLENGING ECONOMIC CONDITIONS

54
These trends reflect, in part, the impact of the
economic downturn experienced by married and
single women in the US:
Married women in households most affected by
economic pressures exited the category while
those who acquired received more expensive
pieces on average.
Single women continued to acquire pieces but at
lower prices on average.
FINE JEWELLERY IS FACING STRONG COMPETITION FROM OTHER CATEGORIESIt is clear that, as the US economy recovers from the
financial crisis, the new consumer landscape holds
both challenges and promise for diamond jewellery.
First of all, fine jewellery is facing strong competition
from other luxury and experiential categories. In
2013, fine jewellery was not among the top five on the
list of gifts that US women would most like to receive,
ranking behind holidays (foreign and domestic),
electronics, home furnishings and spa days. Among
young people (aged 18-34), the desirability of fine
jewellery ranked below branded luxury products such
as designer handbags and clothing. However, diamonds
were still the most popular choice for fine jewellery for
all age segments; in fact, diamonds were almost three
times more popular than any other type of jewellery.
F I G . 3 3 : B R E A K D O W N O F W O M E N ' S D I A M O N D J E W E L L E R Y S H A R E B Y S E G M E N T I N T H E U N I T E D S TAT E S
Source: De Beers
50
35
12
MarriedWomen
(MWDJ)
SingleWomen
(SWDJ)
DWBi
DER
Pieces
3
+6.2
-0.6
-0.3
55
13
28
Value
4
+8.1
-0.6
-8.8
US$3,700
US$600
US$1,400
SHARE CHANGES VS 2007Percentage points
SHARE CHANGES VS 2007Percentage points
AVERAGE PRICE Paid in 2013
-5.3 +1.4
US$2,300
i In 2013, diamond wedding band (DWB) defined as ring with a setting of diamonds in a single row, all about the same size
Per cent (by pieces and value)
BRIDAL
NON-BRIDAL
FIG. 34: SHARE OF ADVERTISING VOICE IN THE UNITED STATES
Source: Mindshare
2013
100
42
36
9
13
2007
100
39
30
10
21
Time pieces
Jewellery Fashion
Electronics
Per cent

55
Part of the explanation for this relative weakness
of fine jewellery in consumers’ preference may
be that other luxury and discretionary categories
have continued to compete far more strongly for
consumers’ attention. Share of advertising voice
for fine jewellery within the US luxury segment has
declined over the last seven years (from 21 per cent
in 2007 to 13 per cent in 2013 – see Fig. 34)35.
Overall, the fine jewellery category has been growing
at a slower rate than other discretionary and luxury
goods for some time (see Fig. 35). Luxury jewellery
sales grew at a compound annual growth rate of just
below two per cent between 2004 and 2013, well
behind luxury electronic gadgets (14 per cent), fine
wines (11 per cent) and premium beauty/personal
care (eight per cent)36.
In addition, a growing number of Americans facing
financial strain in the aftermath of the financial crisis
have resorted to recycling jewellery. The experience
customers sometimes encountered when trying to
sell back their jewellery pieces, especially to non-
specialised businesses, could also have played a role
in impacting upon the product’s relative desirability
(see the ‘Trends to Watch’ box).
FIG. 35: GROWTH OF LUXURY CATEGORIES IN THE UNITED STATES
Source: Euromonitor
TOTAL LUXURY MARKET = 3.6
CAGR, 2004-2013
Design apparel
Luxury writing instruments
and stationery (0.5)
1.8
Luxury jewellery 1.9
Luxury time pieces 2.5
Luxury tobacco
Luxury travel goods
3.1
4.1
Luxury accessories 5.1
Super premium beauty and
personal care8.3
Fine wines, champagne, spirits 11.2
13.7Luxury electronic gadgets
Per cent
DIAMOND JEWELLERY RECYCLING
Trading of previously owned diamonds (sellback, trade-up) is a normal part of the lifecycle of
jewellery and forms a growing segment of the diamond jewellery industry. However, this activity
has attracted greater attention in the diamond industry in recent years, as its scale was boosted
not only by the global economic downturn but also by the accompanying appreciation of gold
prices during that period. In many cases, consumers wanted to sell back their gold jewellery,
and diamonds were simply a by-product; on other occasions, the diamond was the main item
being sold back.
Due to the lack of a reliable buy-back offer from traditional retailers, US consumers have
increasingly turned to pawnbrokers and to high-visibility, non-specialised new entrants to sell
back their diamond jewellery. Consumers who have sold diamond jewellery through these
channels have often left dissatisfied, especially due to a perceived lack of transparency and
objectivity in the pricing of their jewellery. Consumers who trade up their diamond jewellery
through specialised channels are generally less dissatisfied with their experience.
The recycling trend could undermine trust in the diamond industry and consumers’ belief in
the diamond dream. The industry will need to continue to work towards offering consumers
expert advice and clear choices when it comes to recycling of diamond jewellery.
TRENDS TO WATCH

56

57
FIG. 36: CONSUMERS WHO REPORTED BUYING A BRANDED DIAMOND ENGAGEMENT RING
Source: De Beers
7
2013
36
2011
22
2002
Per cent
FIG. 37: RETAILER QUOTES ON IMPACT OF FOREVERMARK ON THEIR BUSINESS
Source: De Beers
When I was initially introduced to Forevermark,
I was very intrigued by Forevermark's brand
promise and, more importantly, how
partnering with De Beers and Forevermark
could elevate my brand and increase my
margins. In the year and a half that I have been
involved with Forevermark, I have seen an
increase in margins anywhere from 15 to 30 per
cent. I am sometimes seeing a 35 per cent
increase on loose goods, compared with the
equivalent unbranded polished since I'm not
competing with other jewellers and online
companies who are selling inferior Gemological
Institute of America (GIA) graded stones for
little to no margin.
Since partnering with Forevermark, the
sheer beauty of the diamonds, exclusivity of
the brand, and the other value added
features have enabled us to ask for margins
at 15 to 30 per cent higher than we had for
GIA certified diamonds. We have been able
to achieve it with great success.
Raising fine jewellery’s place to the top of the
desirability list is not a simple matter. As discussed
in the retail section of this report, US jewellers
have been under financial pressure and find it
challenging to invest in innovation and advertising
to boost the category.
Despite the challenges facing fine jewellery in the
US, there are promising opportunities for growth in
diamond jewellery. The premium and bridal segments
continue to expand. The rise of brands and premium
products means that retailers have the opportunity
to realise higher margins necessary for investing in
desire-creating activities.
BRANDS HOLD THE KEY TO GROWTHBrands are becoming more important to the US
consumer. The acceleration in consumer preference
for brands of diamonds and diamond jewellery is
evident from the claimed acquisition of branded
engagement rings – from just seven per cent in 2002
to three and five times that level in 2011 and 2013
respectively (see Fig. 36). The growth in importance
of branded jewellery will have a particular impact in
attracting the brand-conscious younger US consumer.
A variety of brands has been gaining space in the
US market for diamond jewellery in recent years.
There has been an uplift in awareness of specialist
diamond brands such as Hearts on Fire, Leo and
Tacori. Traditional branded jewellers such as Tiffany
and Cartier have seen a jump in claimed brand
acquisitions in the last couple of years, and fashion
brands such as Dior and Chanel are also growing.
Forevermark has been part of this trend and has
experienced growing retailer and consumer interest
since its US launch in Q4 2011.
The attraction of branded diamond jewellery to
retailers is that it supports both the diamond dream
and higher margins. The offer of brands with a
specific positioning and story, which goes beyond
the 4Cs, helps retailers address consumer needs for
emotional engagement with the product and protects
the offer against commoditisation (see Fig. 37).

58
HIGHER-END JEWELLERY IS A FURTHER GROWTH OPPORTUNITYAdditionally, there are exciting growth opportunities
in the US for high-end diamond jewellery. Average
incomes for the top one per cent of Americans have
grown much faster than national average wages37. In
2013, female consumers with household income of
over US$150,000 accounted for eight per cent of the
consumer base for diamond jewellery, but in terms
of actual acquisition this group accounted for 14 per
cent of diamond jewellery pieces and 33 per cent of
sales by value (see Fig. 38).
The presence of an affl uent customer base for higher-
end products has resulted in a shift of the profi le of
polished diamonds consumed in the US in the past
fi ve years. Large higher-clarity stones have grown
notably, while all other types of polished have either
declined or remained fl at (see Fig. 39).
BRITNEY’S PROFILE
26 years old
Eventco-ordinator fora cruise ship company
Lives in Chicago
Has a Forevermarkdiamond engagement ring
B R I T N E Y ’ S J O U R N E Y
At one of the stores, Britney was shown a Forevermarkdiamond. She loved the beauty of the diamond and the sales assistant showed her andher fiancé the inscription.They told herabout registering the ring online, and how it was responsibly sourced.
Shortly afterwards Britney and her fiancé Kevin went to try on rings. They made a special trip to the mall where they could browse a number of high-end department stores and jewellers in one go.
“When I Googledengagement rings, Tiffany was the first website to pop up. I used its ring finder to get an idea of styles and cuts – and decided I wanted a cushion cut.”
For as long as she could remember,Britney had known she wanted a diamond engagement ring.
As soon as her fiancé proposed, she went online to search for rings.
In 2013, 36% of consumers and 53%of brides browsedjewellery storesbefore purchase, visiting an averageof three stores each.
Few women decidewhat they wantbefore going in-store.In 2013:
48% purchasedecisions made on the spotOnly 14%completely selectedbefore purchase.
For most brides (81%in 2013), the decisionprocess begins withselecting the shapeof the main diamondin the DER.
While rounds are stillpopular, fancy shapes have become more attractive, and now represent over half of bridal pieces:
Princess (25%)Cushion (8%)Emerald (4%)Other fancy cuts (19%).
The DER traditionis well established in the US, with acquisition rates remaining around80% since the 1980s (compared with 10% in 1940).
Online is the most popular channelfor research. In2013, 34% of consumers andhalf of bridesresearched online before acquisition.
When choosing between a generic andbranded diamond,beauty and rarity arethe key attributes that influence selection in 2013, bothattributes had over80% relevance.
Responsible sourcing becomes a differentiator when choosing between brands – in 2013, morethan half of consumersthought it provideddistinctiveness tothe brand.Source: De Beers
Note: Names have been changed
TESTIMONAL
CONTEXT
FIG. 39: CHANGE IN TYPE OF POLISHED CONSUMED
Source: De Beers
2008–2013 CAGR
CHANGE IN TYPE OF POLISHED CONSUMED IN US
i Low: Pique; high: VS+
ii Small: <0.49 carat; large: >1 carat
0% +11%
(7)% (11)%
Clarityi
High
Low
Small Large
Sizeii
FIG. 38: 2013 FEMALE CONSUMERS WITH HOUSEHOLDINCOME OVER US$150K ACCOUNTED FOR
Source: De Beers
8
Of diamond jewellery sales by value
33
Of diamond jewellery pieces sold
14
Of consumer base for diamond jewellery
Per cent

59
“I couldn’t believe it when Kevin pulled out the box and I saw it was from Forevemark! I guess I secretly hoped he would get it. It was such a nice surprise!”
“I’m very proudof my ring and love it when people ask me about it –I can tell themall about the inscription andthe fact it is responsibly sourced.”
Britney also used this occasion to buy a pair of diamond earrings – a gift from her parents to wear on her wedding day.
A few months later, the couple returned to the same store to buy their wedding rings, which they had tried on earlier when they were browsing for engagement rings. Kevin’s was plain, but Britney wanted a few diamonds on the wedding ring as well.
A few weeks later,Kevin returned to the store where they had seen the Forevermarkdiamond and bought it.
“I really loved the Forevermarkdiamond, but it was a bit more expensive than some of the other rings, and slightly more than our agreed budget.The sales assistant was lovely but I told her I had togo home and think about it.”
For DER, there are two key moments when branding isimportant: the first isthe receipt of the DER in a branded box.
The second key moment when branding is important is when friends andfamily ask about the DER, and the acquireris able to describe theattributes particularto the DER brand shehas selected.
In 2013, many women bought another piece of diamond jewellery in addition to their DER for thewedding occasion:
Earrings: 9%Necklace: 8%Bracelet: 4%.
Brides now wait 14 months between engagement and marriage (five timeslonger than 1980s),allowing them to save for longer and spend more on diamond jewellery.
Over half of womenhave some say inselecting their engagement ring.In 2013:
35% chose thepiece25% hinted/ advised on choice.
In 2013, the most popular places topurchase DER were:
Independent jeweller (28% of acquirers)National jeweller(28%)Regional jeweller (17%).
77% DER pieces in2013 were paid for by the man alone; men tend to spend moreon a DER whenshopping alone thanwith their partner.
In the high-endbridal market (DER over US$8,000),three- quarters of couples have adefined budget forthe DER.
Despite this, almost half of couples with set budgets end up spending slightly more than theyhad planned.
Clearly, precise targeting of this consumer segment
through higher-end products and brands would help
capture its potential more effectively.
THE BRIDAL SEGMENT HAS EXCELLENT PROSPECTSDespite a lower percentage of the US population
opting for marriage, and a longer wait to fi rst
marriage among those who do, among those who
choose to marry the average amount spent per
occasion continues to increase, according to a report
by Mintel, a consultancy38.
In this context, the tradition for bridal diamond
jewellery is still going strong. Current penetration of
bridal diamond jewellery is in line with historic levels,
highlighting the resilience of this segment to the
economic pressures in the US in the last few years:
79 per cent of those who got engaged in 2013
acquired a new diamond-only DER;
73 per cent of those who married in 2013 acquired
a new diamond-only DER.
Of all DERs acquired in 2013, a total of 82 per cent
were diamond-only rings, the majority set in white gold
or yellow gold, followed by platinum and silver, with
the latter taking share from gold in the last few years.
The amount spent on diamond engagement rings
has increased in real terms over the last 10 years.
In 2003, the average DER cost just over US$2,500
(US$3,165 in 2013 terms); in 2013, it cost just
under US$3,700 on average.
There are several reasons for the considerable growth
of bridal jewellery in the US. The post-recession US
bride tends to be more educated, older and more
affl uent (particularly second-time brides, who make
up one-third of the total), and can afford to spend
more on the wedding. Brides today also wait fi ve times
longer between engagement and marriage than in the
1980s (14 months today on average vs less than three
months in 1980); their longer engagement period may
allow the couple to save up for the wedding and their
budget for diamond jewellery may therefore be bigger.
There has also been notable growth in the number
of brides who buy other types of jewellery to celebrate
their engagement in addition to their DER. In 2013,
17 per cent of women who got engaged and received
a DER acquired an additional piece of diamond
jewellery compared with only fi ve per cent of women
in this situation 10 years ago.

60
CHINA A STORY OF GROWTH AND EVEN GREATER GROWTH POTENTIAL Sales of diamond jewellery to Chinese consumers
were the fastest growing in the world over the last
decade, with a compound annual growth rate of 21
per cent from 2003 to 2013 (see Fig. 40). As a result,
the share of polished diamonds sold in jewellery to
Chinese consumers grew from barely three per cent
in 2003 to just over 13 per cent of global demand in
2013. Including Hong Kong and Macau, the share
of this region’s consumers in the global demand
of polished diamonds in jewellery was almost
16 per cent in 2013 in USD.
This vertiginous growth in demand for diamond
jewellery has been driven by growing numbers of
consumers able to buy into the category, and by
the increase in the average price and the sizes of
diamonds they can afford to buy. Average prices
paid jumped by 32 per cent in real terms between
2003 and 2013, to over RMB 8,000 (US$1,300)
(see Fig. 41). Average carats per piece over the
same period rose from 0.18 to 0.25.
Source: De Beers
Per cent (by acquirers, pieces and value)
F I G . 4 1 : 2 0 1 3 C H I N E S E D I A M O N D J E W E L L E RY BY S E G M E N T
AVERAGE PRICE PAID IN 2013
72
24
4Bridal
Consumers
Single women
Married women 65
14
21
Pieces
Note: The 2013 FX assumed is US$1 = RMB 6.1905. All prices rounded
65
11
24
Value
RMB 10,300(US$1,700)
RMB 7,000(US$1,100)
RMB 9,000(US$1,500)
FIG. 40: DIAMOND SALES TO CHINESE CONSUMERS
Source: De Beers
USD million (nominal)
10,000
8,000
6,000
4,000
2,000
0
2013 2007 2003
Polished diamond value
Diamond jewellery value
2003 – 2013 CAGR Diamond jewellery: 21%
Polished value: 23%

61
THERE IS STRONG POTENTIAL FOR FURTHER GROWTH Fine jewellery is the object or experience most desired
by urban women in China. Asked to select from a
list of competitive items or experiences they most
coveted, almost half (48 per cent) of Chinese women
selected fine jewellery, a much higher percentage
than the next most desirable gift item – designer
handbags, chosen by just under a third of Chinese
women. Among types of jewellery, diamond jewellery
was by far the most popular choice, with about two-
thirds of female consumers selecting it as their first
or second preference (see Fig. 42).
Even so, China remains underpenetrated: while
diamond jewellery ownership has risen to 20 per cent
in the top urban cities surveyed (up from just 10 per
cent in 2003), it is still far below the US ownership
rate of approximately 70 per cent.
The consumer base is likely to continue to widen as
the portion of the Chinese population able to buy into
the category expands further. McKinsey & Company
predicts that, by 2020, ‘mainstream’ consumers –
relatively well-to-do households with annual disposable
income of between US$16,000 and US$34,000 – will
make up 51 per cent of urban households (from
six per cent in 2010), and affluent households with
annual incomes of more than US$34,000 will make up
six per cent (from two per cent in 2010 – see Fig. 43)39.
In addition, consumers who have already bought
diamond jewellery are expected to find additional
occasions to buy diamonds.
The number of wealthy individuals has also grown
strongly in China. In its 2013 Wealth Report, Credit
Suisse estimates the number of Chinese millionaires
(ie individuals with assets above US$1 million) to be
1.1 million in 2013, up 90,000 in one year alone40.
According to global consultancy Capgemini, China
has the fourth-largest number of high net-worth
individuals (HNWI, those with investable assets
of over US$1 million), reaching 643,000 in 2012,
up just under 16 per cent on 201141. A 2014 study
by consultancy WealthInsight shows that together,
Beijing (sixth in the list of the top 10 cities with most
millionaires) and Shanghai (ninth on the list) have
more USD millionaires (excluding the value of their
primary residences) than London42.
This potential for growth is recognised by the big
Chinese jewellery chains. Their store network
expansion has continued apace over the past three
years, leading to an estimated total of, approximately,
15,500 stores offering diamond jewellery in 2013 – 29
per cent more than in 2010. Chow Tai Fook, a leading
specialised jewellery chain, has disclosed its aims to
open a net of 200 jewellery points of sale each year
in the medium to long term (see Fig. 44)43. This is a
further indication of local retailers’ confidence in the
prospects for diamond jewellery in China.
FIG. 42: CHINESE WOMEN'S DESIRE FOR DIAMONDS AND COMPETING ITEMS
Source: De Beers
A genuine
luxury
watch
25 27
A holiday
abroad
31 30
A genuine
designer
handbag
31 31
A desktop
PC, laptop,
netbook,
tablet PC
36
17
A piece
of fine
jewellery
48 48
DIAMOND
Self purchase
Gift
ALL OTHER
Per cent selected as first choice, 2012
-4
20
27
1
FIG. 43: SHARE OF URBAN HOUSEHOLDS BY ANNUAL HOUSEHOLD INCOME
i
Source: De Beers
7
36
51
6
2020
100
2010
2
100
10
6
2000
100
82
1
0
63
36
Poor (<US$6,000)
Mainstream (US$16,000–34,000)
Value (US$6,000–15,999)
Affluent (>US$34,000)
Projected CAGR 2000–2020 Per cent
i In real 2010 dollars; in 2010, US$1 = RMB 6.73
Per cent
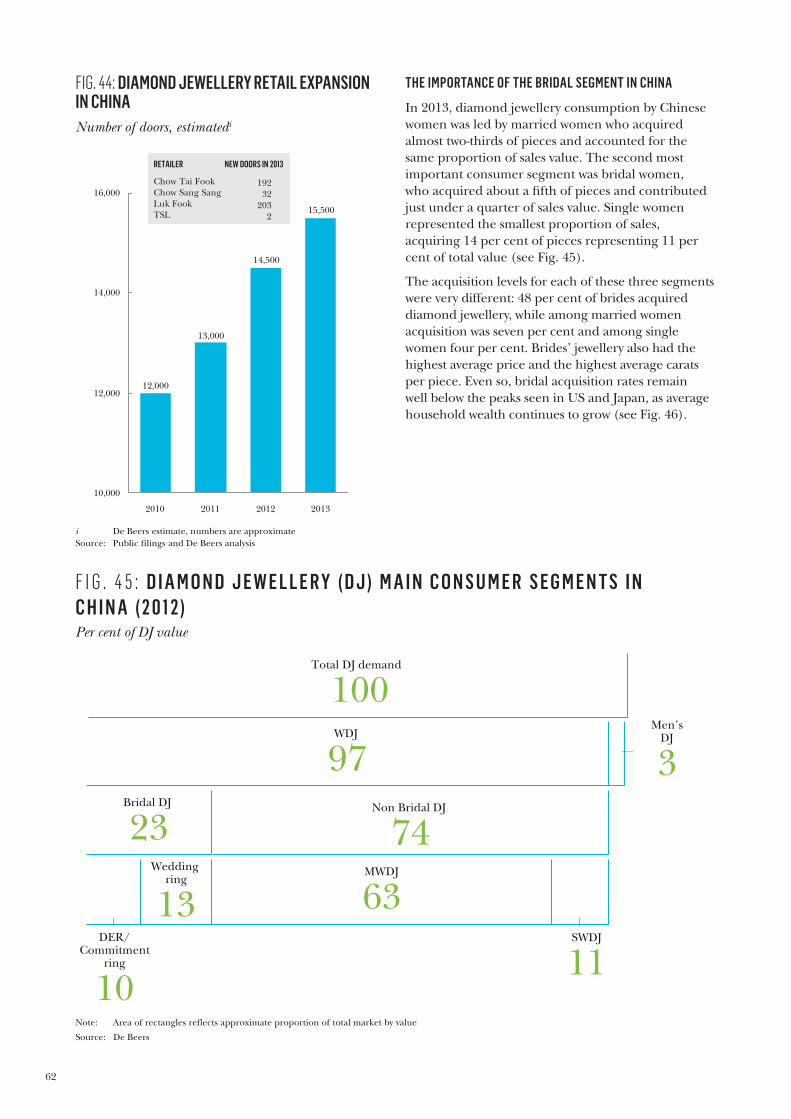
62
THE IMPORTANCE OF THE BRIDAL SEGMENT IN CHINA
In 2013, diamond jewellery consumption by Chinese
women was led by married women who acquired
almost two-thirds of pieces and accounted for the
same proportion of sales value. The second most
important consumer segment was bridal women,
who acquired about a fifth of pieces and contributed
just under a quarter of sales value. Single women
represented the smallest proportion of sales,
acquiring 14 per cent of pieces representing 11 per
cent of total value (see Fig. 45).
The acquisition levels for each of these three segments
were very different: 48 per cent of brides acquired
diamond jewellery, while among married women
acquisition was seven per cent and among single
women four per cent. Brides’ jewellery also had the
highest average price and the highest average carats
per piece. Even so, bridal acquisition rates remain
well below the peaks seen in US and Japan, as average
household wealth continues to grow (see Fig. 46).
FIG. 44: DIAMOND JEWELLERY RETAIL EXPANSION IN CHINA
Source: Public filings and De Beers analysis
Number of doors, estimatedi
16,000
14,000
12,000
10,000
2012
14,500
2011
13,000
2010
12,000
2013
15,500
RETAILER
Chow Tai Fook
Chow Sang Sang
Luk Fook
TSL
NEW DOORS IN 2013
192
32
203
2
i De Beers estimate, numbers are approximate
F I G . 4 5 : D I A M O N D J E W E L L E R Y ( D J ) M A I N C O N S U M E R S E G M E N T S I N C H I N A ( 2 0 1 2 )
Wedding ring
13
Non Bridal DJ
74
WDJ
97
DER/ Commitment
ring
10
SWDJ
11
Bridal DJ
23 MWDJ
63
Note: Area of rectangles reflects approximate proportion of total market by value
Source: De Beers
Total DJ demand
100 Men’s
DJ
3
Per cent of DJ value

63
GROWTH IS LIKELY ACROSS ALL THREE ROUTES TO DIAMOND OWNERSHIP As described above, the bridal segment in China is
important today not only for commercial reasons
but also because of the important role it plays in the
consumer’s introduction to the diamond category.
There are three main routes into the diamond
jewellery category for the Chinese consumer (see
Fig. 47). By far the most common of these is falling
in love and getting married (the ‘Love route’).
Typically, a diamond solitaire ring is acquired as part
of an engagement or marriage celebration; later
on, earrings or necklaces may be given as further
expressions of love.
Major milestones in life such as birthdays and
wedding anniversaries form the second most
important route into the category for Chinese
consumers (the ‘Milestone route’). Younger
consumers, in particular, often receive their first
piece of diamond jewellery as a gift for a special
occasion from their parents or boyfriend.
Finally, there is the ‘Spoiling route’: receiving or
buying their first diamond jewellery piece (usually
earrings or a bracelet) as a treat. In 2013, 18 per cent of
Chinese consumers bought diamond jewellery for ‘no
specific occasion’ and 24 per cent of diamond jewellery
was self-purchased rather than received as a gift.
FIG. 46: PENETRATION OF BRIDAL DIAMOND JEWELLERY
Source: De Beers
Peak
year
?
2012
48
1994
1
1990
80
1940
10
50 YEARS
1995
77
1965
3
Peak
30 YEARS 18 YEARS
Peak Peak
US JAPAN … AND NOW CHINA
Per cent
Source: De Beers
F I G . 4 7 : C H I N E S E W O M E N ’ S M A I N A C Q U I S I T I O N R O U T E S
The Love route starts with the diamond ring, typically acquired
for engagement or marriage
celebration
The diamond is used as a symbol
of true love and promise
It is often chosen together with the
purchaserLess likely to be motivated by price
Loveroute
Around
50%
First acquisition is a solitaire pendant acquired to celebrate a
personal milestone
The diamond represents success
and achievement
Likely to be a gift from a
boyfriend, spouse or parent
Quick decision (few days –22 per cent) or even unplanned
(36 per cent)
Milestoneroute
Around
23%
First acquisition is earrings or bracelet
The diamond is ornamental,
attracting compliments
More likely that this is a nice
treat, acquired as a present from
a boyfriend
Recipients are younger and have more say in choosing the item
Spoilingroute
Around
16%of all journeys of all journeys of all journeys

64
As the Chinese market matures, we expect to see
growth across all three of these consumer journeys:
‘Love’, ‘Milestones’ and ‘Spoiling’.
The growing importance of ‘Milestones’ and
‘Spoiling’ makes it more likely that consumers will
acquire more than one ‘must-have, one-off’ piece
of diamond jewellery over their lifetime. It also
opens the door to more indulgent pieces and more
varied designs, moving beyond the solitaire-only
design that still makes up 80 per cent of diamond
pieces across all types of jewellery, including rings,
neckwear and earrings.
ENGAGING THE CONSUMER WILL BEKEY TO GROWTHThe diamond jewellery selection process in China
involves a high level of engagement from the woman
who will be acquiring the piece, even when receiving
diamond jewellery as a gift.
The vast majority of recent acquirers or consumers
currently choosing a piece of diamond jewellery
consider branded offers as their fi rst or second
choice. When it comes to actual acquisition, Chinese
consumers prefer to buy from trusted domestic
retailers such as Chow Tai Fook and Chow Sang Sang,
which surveyed consumers say they can trust.
Since 2008, however, claimed acquisition of diamond
jewellery from international brands Cartier and
Tiffany by young middle-class consumers has grown
eight to nine times.
The purchase process is consultative: both the man
and the woman need to be convinced, despite the
fact that 71 per cent of pieces are paid for by the
giver alone. In 2013, nearly half of pieces gifted were
chosen by the recipient of the gift together with the
actual purchaser.
As part of this process, customers undertake extensive
browsing in shops. The most common place is a
specialist jewellery retailer, with almost six in 10
acquirers, followed by jewellery counters/sections in
department stores, with more than a third of acquirers.
The purchase journey involves a range of touch-
points before a selection is made, including word-of-
mouth recommendations from friends and family.
The internet has its role to play too. Although not a
signifi cant sales channel in China, the internet is used
by over a fi fth of acquirers for related purposes, such
as to learn about fi ne jewellery quality and prices,
learn about brands, and to pre-select designs. The
internet is used more frequently in the diamond
purchase process by single women, 40 per cent of
whom resort to it, and also by affl uent consumers
(about six in 10 research online).
J I L AY M AY ’ S J O U R N E Y
JI LAYMAY’SPROFILE
26 years old
Living in Shanghai
An employee working in finance
A wedding diamond ring bought from Donghua
TESTIMONAL Ms Ji planned to buy a diamond ring because her wedding was approaching.She thought that adiamond ring was a necessity for her marriage.
Her friends recommended she go to the Tiffany and Cartier stores to have a look. However, the prices were too high for her.
Ms Ji decided to learnmore about diamonds on the internet before continuing her search. That is the first time she noticed the brand Forevermark, althoughshe did not click the link. Online, she learnt about the 4Cs and browsed various designs and cuts.
In 2012, almost half of new brides, in Tier 1, 2and 3 cities, acquired a diamond engagement ring, up from below one per cent in 1994.
In China, brands enter intothe purchase decision very early. 99% of women have awareness of major local and some international brands, and on averageeach customer is aware of 5.5 brands.
10% of women sought advice from friends and family when making significant jewellery purchases.
Over a fifth of Chinese women use the internet for research into diamond jewellery:
11% look to learn moreabout quality and prices6% educate themselveson brands5% are pre-selecting designs.
Among single women andaffluent consumers, internet use for these purposes is evenhigher at 40% and 56%.
CONTEXT
Source: De Beers

65
In addition, mobile usage in China is growing quickly,
with mobile broadband and WiFi penetration rates up
64 per cent and 600 per cent respectively from 2011 to
201344. Retailers and jewellery brands need therefore
to maintain a strong online presence in China.
Chinese spend abroad has become more important
on a global scale. In the diamond jewellery category,
the average price of pieces acquired abroad is over 50
per cent higher than the average paid at home.
According to McKinsey Consumer and Shopper
Insights, the spend by Chinese tourists on goods,
including jewellery and other luxury items, accounts
for about a third of a total projected spend overseas
in 2014 of US$154 billion. This level of spend was
generated by an estimated 93 million trips abroad in
2013, more than fi ve-fold growth in trips since 2002.
Chinese travel abroad is expected to grow by 13 per
cent annually to reach 135 million trips by 2016.
Overall, the Chinese are reported to represent no
less than 27 per cent of global luxury purchases, with
60 per cent of this fi gure being conducted abroad45.
It is evident that China presents a huge growth
opportunity for diamonds. But the Chinese consumer
is increasingly sophisticated and discerning. To
succeed, retailers and brands will need to establish
a trusted name, and be prepared to meet the
Chinese consumer’s desire for inspirational and
authentic stories, information and assurance of high-
quality products.
Ms Ji’s elder sister recommended she go to the Donghua store. She thought that the store was reputable and had a good selection. Ms Ji went toDonghua on North Sichuan Road. There she noticed the Forevermark counter and went to see the products. The salesman told her that every Forevermark diamond is unique and has an invisible inscription with a unique number.
Ms Ji didn’t make her decision at once. She came back home and had a long think about the three diamonds. In the end, she thought the 75 point ringoffered the best value for money. The next day,she went to the store and bought it.
Ms Ji went to some jewellery stores on Nanjing Road, such as Laofengxiang, Xieruilinand Laomiaohuangjin,but none of their products attracted her. Finally, she went to the Donghua store which is located in Nanjing Road. She went to the Forevermark counter and chose a 75 point diamond solitaire to try. The salesman gave her another two (60 points and 70 points) to compare.
This information about Forevermark attracted Ms Ji a lot, so she came back home and searched formore information about the brand. on the Forevermarkwebsite. Here she noticed its rarity (only one per cent of diamonds make the Forevermark grade) and its responsible sourcing promise. This gave Ms Ji a good impression that Forevermark was a high-quality product.
Store visits are the most popular research channel for Chinesewomen. In 2012:
56% visited specialist jewellery stores to view selections 38% visiteddepartment stores.
Within the brandedoffer, best value formoney still plays an important part for the Chinese consumer.
Chinese consumers shop around actively – visitingan average of three stores before purchase.
Chinese consumers attach trust to known brands such as Forevermark. Trust is the top driver of diamondjewellery brand consideration in China.
Ethical sourcing appeals to consumers as it indicatesthe company is more likely to be honest with themand to provide a genuinely high quality product.

66
The Canadian Arctic and Botswana are a long way from
the diamond jewellers of Fifth Avenue in New York,
Times Square in Hong Kong, Bond Street in London,
and Place Vendôme in Paris. However, it is in places
like these that the world’s most valuable diamonds are
being extracted at immense cost and effort.
Diamonds were formed within the earth’s sub-cratonic
lithospheric mantle by processes more than three
billion years ago. They tend to occur within ancient
and stable parts of the earth’s crust, known as cratons,
where they have been protected from destructive
geological processes and were then transported to
the earth’s surface within kimberlite.
I N F O C U S : T H E M I R A C L E O F P R O D U C T I O NChallenges and innovation in rough diamond production.

67
ESCALATING COST AND COMPLEXITYFinding, developing and mining kimberlite pipes
in some of the world’s most inhospitable places
are astonishing feats of engineering and human
ingenuity. They each require enormous investments
in exploration, project development, infrastructure,
mine equipment and also human capital – training
miners to mine in a safe and sustainable way.
The cost and capital intensity of diamond mining
projects are rising, for three main reasons. Firstly,
global demand for capital goods has driven price
increases in equipment. At the same time, operating
costs in some of the major mining geographies
have increased significantly over the last few years.
In Botswana, for example, the cost of electricity
increased 11 per cent per year between 2002 and
201246 and labour costs increased 14 per cent per
year47. In Russia, the price of electricity increased
12 per cent per year over the same period48 and
labour costs 19 per cent49, while in South Africa
power prices have risen by an average of 14 per
cent over the same period50 (see Fig. 48).
Secondly, diamond miners are developing deeper
and more remote parts of existing deposits, such
as the Jwaneng Cut 8 project or the Venetia
Underground mine.
Finally, new projects are further away, in more hostile
natural environments that include the Arctic. Such
operations are inherently more complex to run and
involve greater infrastructure investments.
Miners go to extraordinary lengths to bring diamonds
to market. This has always been the case and supply
will continue to increase as demand grows. However,
this cannot happen without substantial effort and
investment. The cost and complexity of mining
diamonds will continue to increase, and diamonds will
remain one of the most coveted of earth’s products.
F I G . 4 8 : C O S T S I N C R E A S E S A C R O S S T H E M O S T C O M M O N O P E X I N P U T FA C T O R S
Canada 4
Russia 12
South Africa 14
Botswana 11
ELECTRICITY DIESEL
17
7
11
16i
9
4
19
14ii
LABOUR
Source: South Africa: Eskom, SAPIA, South Africa Department of Mineral Reserves; Botswana: Ministry of Minerals, Energy and Water Resources, Botswana department of statistics, press searches; Russia: Russian Statistics
i From 2006 to 2012 ii From 2002 to 2011
CAGR 2002-2012 in local currencies (nominal), per cent

68
F R O M D I S C O V E R Y T O S TA R T O F P R O D U C T I O N
Time lapse to development has increased for diamond mines.
MirAikhalUdachnyOrapaInternational
JwanengJubileeArgyleCatocaEkatiZarnitsa
KomsomolskyaNyurbaDiavikArkhangelskayaVictorSnap Lake
GribKarpinskogo-1BotuobinskayaGahcho KuéRenard
M I N E
4 years1 year16 years4 years2 years
10 years10 years6 years29 years17 years45 years
26 years5 years9 years25 years20 years11 years
18 years35 years21 years21 years16 years
Y E A R S T O P R O D U C T I O N
average 5 years
average 20 years
average 16 years
average 22 years
LOOKING FOR BROADER ECONOMIC AND SOCIAL CONTRIBUTIONSThe governments of many diamond producing
countries have a strong desire to ensure that
diamond extraction maximises local social and
economic benefits.
Diamond mining companies make substantial
direct and indirect contributions to local economic
development in most countries where they mine.
With lifespans that can cover decades, mining
projects require large-scale and long-term capital
investment, often reaching billions of US dollars.
This investment often attracts significant additional
inward investment to host countries. It results
in direct economic and fiscal benefits including
infrastructure development, provision of local
healthcare and education, direct employment, and
payment of taxes and royalties. Indirect benefits
include the development of a supply chain to support
the mining operations, skills development, indirect
employment and community support.
For example, in Canada, De Beers has numerous
comprehensive Impact Benefit Agreements (IBAs)
with aboriginal communities in the areas near the
company’s operations. These IBAs not only provide
compensation for any loss or potential loss of land
during the construction, operation and closure
of a mine, but they also provide a framework
regarding priorities for local training, employment,
business contracts, environmental management
and social investment in areas such as culture and
heritage activities.
In 2013, De Beers distributed more than US$5 billion
– or over 90 per cent of the value of total sales – to
governments, suppliers, employees, shareholders
and other finance providers. And of this, more than
US$3 billion was paid to stakeholders in Africa, where
De Beers has the greatest proportion of its operations.

69
1 9 5 0 1 9 9 01 9 8 01 9 6 0 2 0 0 0 2 0 1 0 2 0 2 01 9 7 0

70
It’s in Botswana, a sparsely populated country in
southern Africa, that Jwaneng, one of the most valuable
diamond mines in the world, was discovered in 1972
by De Beers’ geologists. Ten years later, the mine
commenced operations, yielding about 12 million
carats per year. The ore that is mined at Jwaneng is
particularly rich in high-quality diamonds. Jwaneng
represents 60-70 per cent of the overall revenues of
Debswana, the joint venture between De Beers and
the Government of the Republic of Botswana.
The mine has been extended through various
programmes, gradually unearthing new parts of
the ore body by deepening the mine pit (see chart
below). The most recent of these projects, known as
Cut 8, will remove an initial 500 million tonnes of
waste earth to expose the ore and, to ultimately,
recover more than 100 million additional carats and
prolong the life of the mine to at least 2028. The
project began in 2010 and the total investment cost is
US$3 billion – the single largest private investment in
Botswana’s history.
JWANENG IS ONE OF THE MOST VALUABLE DIAMOND MINES IN THE WORLD
Mining always carries safety risks, and while open-pit
mines such as Jwaneng are generally seen as safer
than underground mines, risks remain. Technology
can help improve safety, however: in October 2013, a
slope failure was predicted using stability analysis. As
a result, the mine was evacuated ahead of the actual
slope collapse and no workers were harmed, unlike
an earlier instance in 2012, when a similar incident
tragically resulted in a loss of life.
D I A M O N D S I N T H E D E S E R T
CCUT-7
CUT-7CUT-6
CUT-5
CUCUT-5
CUC T-6
CUT-8
CUT-8
CENTRECENTREPIPE
CENTRE PIPE
OVERHEAD VIEW
N
1640 M
20177624 4 M
2320
M
(diamond bearing ore)
120110330 M
CROSS SECTION OF THEJWANENG MINE, BOTSWANA

71
F I R E I N T H E I C E
SNAP LAKE
CANADA
Thousands of miles lie between the heat of Botswana
and the frozen lakes of the Canadian Arctic. Canada
has been home to some of the largest recent
developments of diamond mines; however, mining
in the Arctic carries particular challenges. One
example of this is De Beers’ mine at Snap Lake in the
Northwest Territories, 220 kilometres north of the
closest city, Yellowknife.
The portrait of Calinda gives you a sense of what
life is like for the mine workers there.
Calinda is 31 years old and has worked at Snap
Lake since she completed the Underground Miner
Training Program in 2008. “These past 4.5 years
as a female underground miner have been an
honour,” said Calinda, who is a lube truck operator
underground.
Calinda typically works a 12-hour shift for two weeks
on the mine before returning home to the Tlicho
community of Wekweeti for the next two weeks. The
mine can only be accessed by plane, so she and her
colleagues catch a special charter fl ight for De Beers
employees to and from the mine from Yellowknife,
and then board another plane home.
At Snap Lake, it is dark and remains so throughout
most of the day. Temperatures can go down to -45
degrees Celsius and colder on the surface, although
down in the mine it’s warmer, where the air is heated
to an average temperature of three to fi ve degrees
Celsius. De Beers provides all the warm clothing and
safety items required for each employee to do his or
her work safely.
SAFETY IS A BIG DEAL AT SNAP LAKE – THE MINE HAS WON TWO
REGIONAL SAFETY AWARDS FOR OUTSTANDING PERFORMANCE
As Calinda explains: “Safety is our top priority: it’s on
everyone’s minds, all the time, and we work together
to keep each other and the environment safe. At the
beginning and the end of every shift, the team does
a handover, to ensure everybody is aware of the exact
location they are mining.”

72
In 1908, railway worker Zacharias Lewala was
shovelling sand off a railway line in Kolmanskop,
a few kilometres inland from the port of Lüderitz
in Namibia, and picked up several stones, thereby
unknowingly starting a diamond rush in Namibia.
But how did this whole coastline along southwest
Africa come to be strewn with diamonds?
It’s another quirk of nature. Millions of years ago,
glacial fl oods carried diamonds down the Orange
River from some 500 miles inland and out to sea.
Over millennia, the diamonds tumbled along the
riverbed, in the process being naturally cleaned and
polished, and arrived on the seabed in near-perfect
form, making them amongst the most sought after
treasures of nature.
It has taken a massive investment in new offshore
mining technology by De Beers to enable these
diamonds to be brought to the surface. Unaffected
by the wild crashing waves of the Atlantic Ocean,
the Debmarine Namibia mining fl eet is a triumph
of engineering ingenuity.
A gigantic crawler – like a monster vacuum – ploughs
along the seabed sucking up the diamond-rich
sediment and pumping it up to the ship (which is
essentially a fl oating mine) on the surface. The ‘mv
Mafuta’ is the latest of Debmarine Namibia’s fi ve
deep sea mining vessels.
At a cost of more than US$100 million, it is the largest
and most sophisticated of Debmarine Namibia’s
fl eet. The ship is automatically kept in position
by a GPS that moves both ship and crawler along
predetermined tracks to comb the seabed areas
that geologists determine are most likely to yield the
largest number of high-quality gems. Four hundred
tonnes of sediment are pumped aboard every hour.
The sediment enters an unceasing production line
where it is automatically sized and separated, and
the diamonds sealed in cans, a complex process
untouched by human hands.
A GIGANTIC CRAWLER – LIKE A MONSTER VACUUM – PLOUGHS ALONG THE
SEABED SUCKING UP THE DIAMOND-RICH SEDIMENT AND PUMPING IT UP TO
THE SHIP (WHICH IS ESSENTIALLY A FLOATING MINE) ON THE SURFACE
Once the diamonds are extracted, the sediment is
returned to the seabed to minimise environmental
damage. Once a month, when the crew of the
vessel change over amid the strictest security, the
diamonds are brought ashore by helicopter before
being transported to the sort house and eventually
beginning the long journey to diamond jewellery
retail stores all over the world.
T R E A S U R E S O F T H E D E E P

73

74
I N F O C U S : S A F E G U A R D I N G T H E I N D U S T R Y T H R O U G H T E C H N O L O G YTechnology plays a vital role across the entire diamond pipeline, helping both to secure future supply and to maintain the diamond dream.
SECURING SUPPLY IN A SAFE AND SUSTAINABLE MANNER Throughout the pipeline, technology is critical to
ensuring the supply of diamonds: in exploration,
mining and sorting for diamonds efficiently, and also
making sure that these activities are safe and minimise
environmental impact.
EXPLORATIONGeologists rely on technological innovation to help
them discover new viable sources of diamonds
in locations that are often remote, previously
underexplored and difficult to work in, such as
near the Arctic Circle. In many such remote areas,
traditional approaches to exploration are limited,
and geologists therefore need to use new techniques
to select targets51.
One new exploration technique, in particular, has
been made possible by the recent development of
SQUID (Super Conducting Quantum Interference
Device). SQUID is a very sensitive magnetometer used
to measure extremely subtle magnetic fields. This
technology provides significant benefits over current
exploration methods such as airborne magnetic
and ground exploration systems, and has provided
geologists with an important new tool52.

75
Another example is improvements in geophysical
hardware that De Beers Exploration has developed.
These improvements have resulted in the development
of new systems with improved signal-processing
capabilities, substantial reduction of noise, increased
power and more sensitive receivers.
Furthermore, technology is a critical part of reducing
the environmental impact of exploration. The
development of geophysical down-hole logging
tools, for example, will improve the accuracy of
3D modelling, reducing the number of drill holes
required. This not only reduces cost, but also
minimises the effects on local environments.
PRODUCTIONTechnology also plays an important role in the
advancement of mining with ever-improving process
effi ciencies and novel and unique extraction methods.
De Beers has been at the forefront of many of these
innovations, ranging from process improvements
through the adoption of dense media cyclones to the
exploitation of new resources by the pioneering of
marine mining for offshore deposits.
Technology also enhances the industry by detecting
and deterring diamond theft through improved
surveillance, smart security systems and access
control. In particular, Scannex, a security system
developed by De Beers that allows safe, low-dosage,
full-body x-ray, ensures that diamonds do not leave
with employees exiting the high security areas of the
De Beers operations53. This technology has also had
applications outside mining (see Fig. 49).
Additionally, several producers including De Beers
are using strategic laboratory facilities to add value to
production operations by extracting critical data and
information required to target, discover and evaluate
diamond deposits. Such laboratories may comprise in-
house sample treatment, indicator mineral, analytical,
microdiamond and macrodiamond capacity
and capability.
SAFETYTechnology also helps geologists and producers to
manage the safety risks associated with operating in
remote locations. Commercially available technologies
include SMARTY cameras in vehicles to encourage
safe driving, monitor driving behaviour, and enhance
overall safety on the road; rollover protection aimed
at protecting equipment operators and motorists from
injuries caused by vehicle overturns or rollovers; and
smaller, safer drill rigs.
MIDSTREAM OPERATORSIn sorting, valuing and sales, De Beers utilises
proprietary technology to produce consistent
assortments of its diamonds to satisfy the needs
of its customers. In order to achieve this at
economically viable rates, De Beers has developed
and implemented advanced proprietary sorting
technology for weighing and shape/colour/quality
sorting of around 300 million stones that pass
through the business each year. Sophisticated electro-
mechanical feed and dispense mechanisms, and state-
of-the-art image-processing, enable the fastest sorting
machines to operate at up to 15 stones per second.
De Beers’ Scannex technology has been used
in hospitals to scan patients in a rapid and cost-
effi cient manner. This technology was fi rst
developed alongside a team from the University
of Cape Town in the 1990s. Following its success,
De Beers formed Lodox Systems (Pty), a separate
company incorporated in South Africa, to produce
the machines.
The Groote Schuur hospital in South Africa was
one of the fi rst in the world to use the scanner.
“About 1,250 patients a year benefi t from the
Lodox machines. In the past, time-consuming
multiple images had to be done but the Lodox
saves time so life-saving decisions can be made
more quickly.54”
To date, fi ve Lodox machines have been installed,
and orders for a further 12 have been placed55.
FIG. 49: EXTENDING THE BENEFITS OF TECHNOLOGY OUTSIDE MINING

76

77
SAFEGUARDING THE CONSUMER AGAINST THE RISK OF UNDISCLOSED SYNTHETICSWhen a consumer acquires a diamond, he or
she wants to know for certain that it is a rare and
inherently precious natural gem, brought to the
surface after lying for hundreds of millions of years
within the earth’s mantle. Any damage to consumers’
confidence in their natural diamond purchases could
have consequences for the whole industry.
Undisclosed synthetic diamonds present exactly
such a risk. The inability to distinguish confidently
(and therefore disclose) synthetics from natural gem
diamonds could lead to a collapse of consumer and
trade confidence in the value-perception of, and
desire for, natural gem diamonds. This may ultimately
lead to consumers abandoning the category,
temporarily or permanently.
Several organisations (De Beers included) have been
working hard over many years to minimise the risks
to consumer confidence resulting from deliberate
or inadvertent undisclosed synthetics.
De Beers has invested nearly US$65 million in research
over the last 30 years (in today’s value) to develop
sophisticated technology, including DiamondSure™,
DiamondView™ and DiamondPlus™ (see sidebar
for further detail), that can readily detect all types
of gem synthetics, providing consumers with the
confidence that they are not unknowingly purchasing
an undisclosed synthetic instead of a natural gem.
At the end of 2013, evidence came to light that
some synthetic products may have been seeded,
undisclosed, into parcels of natural diamonds in
the major diamond trading centres. Earlier in
2012, more than 600 Chemical Vapour Deposition
(CVD) synthetic colourless diamonds were found to
have been sold undisclosed to someone who then
submitted them to the International Gemological
Institute facilities in Belgium and India. Small
quantities of undisclosed high-quality CVD synthetic
diamonds were also detected in China and in India56.
Although technology was already available to detect
synthetic gems, the first generation of detection
technology had focused on screening larger gems.
At the time, there was no cost-effective method of
screening melée diamonds in the supply chain. It
was not therefore possible to assess accurately the
extent to which undisclosed synthetic melée posed
a consumer confidence risk to the industry.
Research and development efforts were accelerated
to address this issue, and effective melée-screening
technology is now available.
The Swiss Gemmological Institute (SSEF) has
developed a non-portable Automated Spectral
Diamond Inspection (ASDI) machine designed
to screen colourless melée diamonds at a rate of
3,000-4,000 per hour58.
De Beers, drawing on a co-ordinated effort between its
Global Sightholder Sales and Technologies divisions,
and the International Institute of Diamond Grading
and Research (IIDGR), built a compact, portable
automated machine, the Automatic Melée Screening
(AMS) device, to scan both colourless and near-
colourless melée quickly and cost-effectively. The AMS
machine was piloted in Antwerp in mid-2013 and is
now being sold to De Beers’ Sightholders, helping
to maintain confidence across the industry. The first
100 AMS machines were produced and available for
shipment to the Sightholder community less than
12 months after the issue first surfaced. By the end
of July 2014, orders for 60 AMS machines had been
received, with installation and training having been
completed for 25 of these units.
A synthetic is a product that has been partly or
completely crystallised by artificial or human
intervention through a variety of processes, such
as High Pressure High Temperature (HPHT) or
Chemical Vapour Deposition (CVD).
In some cases, synthetic diamond stones are treated
to improve their colour, using heat treatment,
irradiation or a combination of these treatments.
The first commercially successful synthesis of
diamond was announced by the General Electric
Company in 1955. These synthetics were produced
using HPHT processes. An alternative method
of diamond synthesis carried out by Union
Carbide, based on Chemical Vapour Deposition
techniques, is claimed to have pre-dated that of
HPHT by two years.
The primary use of synthetics since then has been
in industry, where they are used for wide range of
applications, including mechanical, optical and
electronic. Significant advances in the production
of synthetics have occurred since then, with the
first incidence of HPHT synthetics in the jewellery
industry being noticed in the late 1980s and that
of CVD synthetics in the late 1990s57.
WHAT IS A SYNTHETIC?

78
De Beers has estimated total synthetics production
capacity by combining publicly available information
about the number and type of machines used by
the main synthetics producers with the practical
experience of Element Six Technologies (a leader
in synthetic diamond production for technical
applications, wholly owned by De Beers) in using
such technology.
If all known CVD reactors capable of producing gems
were used solely for synthetic gem production, the
company estimates that annual production would be
around 150,000 polished carats. HPHT production of
colourless and near-colourless synthetics is estimated
at below 10,000 carats.
In reality, however, most of the available capacity
is used for industrial purposes, not for gem-quality
production. Based on disclosed volumes, known cases
of undisclosed synthetics and initial feedback from
users of the AMS machines, the company estimates
that production of gem-grade synthetics is in the
range of 15,000-60,000 carats per year. The majority of
these carats are produced by two or three companies
based in South East Asia and North America.
Overall, the volume of gem-quality synthetics
produced by either CVD or HPHT processes
is estimated to still be low.
Despite these low volumes, the diamond industry
must remain vigilant about the persistent risk of
undisclosed synthetics. To date, through technological
innovation, the industry has been successful in
safeguarding consumer confi dence. Continual
investment in developing and deploying technology
will be required to sustain that success in future.
De Beers continues to make its detection technology
available to Sightholders and the industry at large.
Additionally, the company is working to raise
awareness of how undisclosed synthetics might
deliberately or unwittingly be introduced into the
pipeline and of how this risk can be managed.
De Beers has developed four different types of
detection machines and introduced them to the
wider diamond industry:
DiamondSure™ is a portable
screening instrument
designed to screen rapidly for
synthetics and simulants (with
a measurement time of a few
seconds per stone).
DiamondView™ is designed to
identify the two per cent of stones
that are referred for further
testing by DiamondSure™.
From the characteristic surface
fl uorescence patterns which
are imaged and produced by short-wave ultra-violet
illumination, a user is able to identify whether a
stone is natural or synthetic.
DiamondPlus™ simplifi es
and signifi cantly speeds up
the task of detecting HPHT
treatments applied to type II
natural diamonds. It tests loose
diamonds of between 0.05 and
10 carats within 15 seconds. DiamondPlus also helps
to identify CVD synthetics, by detecting a feature
which is very commonly found in CVD synthetics
currently available.
The Automated Melée
Screening Device (AMS)
machine is a compact,
automated version of
DiamondSure™ with
additional detection functionality, which enables
360 small stones per hour to be tested completely
‘hands-off.’ It makes it possible to screen melée-
sized diamonds (1 to 20 pts) in a cost-effective
manner. During pilot testing, an average pass rate
of 98.5 per cent was achieved on nearly 80,000
colourless and near-colourless melée diamonds.
The remaining 1.5 per cent diamonds were sent
for further testing with DiamondView™ and
confi rmed as natural. No synthetic melée was
found during this test.
DE BEERS’ PROPRIETARY DETECTION TECHNOLOGY

79
INITIAL SIGHTHOLDER FEEDBACK ON AMS
“A relationship with a client is all about
trust. It is our duty and responsibility to
reassure our clients that all diamonds
supplied are 100 per cent natural. While
our in-house systems and processes already
ensure this, it is inevitably more reassuring
for them to know that all shipments have
been screened by the latest and most
effi cient technology available, prior to their
leaving our offi ces.”
“Like most responsible members of
the industry, we are concerned that
unscrupulous traders may facilitate
synthetics entering the system undisclosed.
Therefore, despite being fully confi dent
of the integrity of our own pipeline, we
wish to give our clients total confi dence
by adding an extra line of defence by
screening all melée shipments on exit.
Currently, the AMS machine is the most
practical technology for this purpose,
and on that basis we have integrated it
into our processes.”
“The machine is practical and simple to use
and, therefore, having been assured of the
effi ciency of its detection processes by the
International Institute of Diamond Grading
and Research, we fi nd the AMS machine a
highly effective fi nal safeguard in the fi ght
against undisclosed synthetics.”
“All deliveries to our clients receive a
fi nal QC before they leave our offi ces.
Just as weights are checked and stone
counts made, it is easy to integrate a fi nal
screening by the AMS machine into our
operations.”
1
2
3
4

80

81
GLOSSARYBENEFICIATION Creation of activities beyond mining the natural resource in producing countries. For diamonds, this usually means sorting, valuing, selling and manufacturing
4Cs The four main characteristics that define the quality of a polished diamond: carat, colour, cut and clarity
CAGR Compound annual growth rate, a year-on-year percentage growth rate over a specified period of time
CARAT A unit of mass for diamonds and gemstones, standardised worldwide in the 20th century at exactly one-fifth of a gram (the metric carat). One of the 4Cs
CARATS PER PIECE The number of carats in an individual piece of jewellery
COLOURLESS DIAMOND A diamond’s colour is a result of its composition: colourless diamonds allow more light to pass through than a coloured diamond
CONFLICT DIAMONDS Mined rough diamonds used to fund rebel and revolutionary activities against legitimate and internationally recognised governments
CRATON An old and stable part of the continental lithosphere that may contain diamonds. Having often survived cycles of merging and rifting of continents, cratons are generally found in the interiors of tectonic plates
CUTTING AND POLISHING The process of preparing a rough gem-quality diamond so that it can be used in the manufacture of jewellery
CVD Chemical Vapour Deposition: a process to create synthetic diamonds
CVD REACTOR A machine designed to create synthetic diamonds using the CVD process
DENSE MEDIA CYCLONE A device used in the recovery plant to separate the diamondiferous material from waste
DIAMOND A precious stone consisting of a clear and typically colourless crystalline form of pure carbon, the hardest naturally occurring substance
DIAMANTAIRES The French term ‘diamantaire’ (‘diamantair’ in Flemish) is used in the diamond industry to denote a person who possesses diamond-related skills
DIAMOND JEWELLERY ACQUISITION Diamond jewellery received as a gift or self purchased
DIAMOND DEPOSIT A body of rock or other mineralisation containing a concentration of diamond of possible economic interest
DIAMOND DREAM The allure that diamonds have for consumers on the basis of their association with romance and a sense of the eternal, and the fact that they are seen as a lasting source of value
DIAMONDIFEROUS Containing or yielding diamonds
DIAMOND JEWELLERY Jewellery containing diamonds, no matter how big or small, including in combination with other precious or semi-precious stones
DIAMOND PIPELINE The industry value chain that runs from consumers and retail stores to jewellery manufacturers, cutters and polishers, back to producers and explorers
DIAMOND RECYCLING The sellback or trade-up of previously-owned diamonds or diamond jewellery
DOWN-HOLE LOGGING The process of measuring physical, chemical, and structural properties of penetrated geological formations using logging tools that are either lowered into the borehole on a wireline cable (wireline logging) or placed just behind the drill bit as part of the drill pipe itself (logging-while-drilling)
DOWNSTREAM The stage of the diamond value chain that includes jewellery retailing to end consumers
DER Diamond Engagement Ring
EBIT Earnings Before Interest and Tax: an indicator of a company’s profitability, calculated as revenue minus expenses, excluding tax and interest
FINE JEWELLERY Jewellery made with precious materials such as gold, and precious and semi-precious stones
GEM A cut and polished precious stone fine enough for use in jewellery
GEM-GRADE, GEM-QUALITY A rough or manufactured precious stone fine enough for use in jewellery
GIA Gemological Institute of America. A US-based non-profit organisation established in 1931 engaged in research, gem identification and grading services as well as a variety of educational programmes worldwide
HPHT High Pressure High Temperature: a process to create and treat synthetic diamonds
IBA Impact Benefit Agreement: an agreement made with aboriginal peoples to ensure that they benefit from mining projects and are compensated for any negative impacts of mines on their communities, their land, and their traditional way of life

82
IIDGR The International Institute of Diamond Grading and Research is the part of De Beers which offers polished diamond grading services and through which De Beers’ diamond verification instruments are sold
INDICATOR MINERALS Minerals that are used to help locate diamond deposits. They are minerals which are characteristic of kimberlite, but which are usually more abundant than diamonds (and therefore easier to find). Indicators form in association with diamonds in the kimberlite and are scattered over a wide area by erosion. By tracing these indicators, the source of the kimberlite may also be found
INDUSTRIAL DIAMONDS Natural diamonds and synthetics used for non-jewellery purposes in manufacturing processes across various industries (oil and gas, precision tools, mining, etc.)
INTERNATIONAL GEMOLOGICAL INSTITUTE A diamond, coloured stone and jewellery certification organisation established in 1975 and headquartered in Antwerp
KIMBERLEY PROCESS (KP) Intergovernmental rough diamond certification scheme aimed at preventing the sale of conflict diamonds entering the legitimate diamond value chain
KIMBERLITE An intrusive igneous rock that is sometimes diamondiferous. It is unevenly grained, containing minerals such as olivine, phlogopite and pyrope garnet, cemented with a groundmass consisting of minerals such as serpentine, calcite and chromate. Kimberlite occurs in the earth’s crust in vertical structures known as kimberlite pipes
MACRODIAMOND A recovered rough diamond greater than 0.5mm
MELÉE A term used to describe small cut and polished diamonds. The diamond weight for melée diamonds ranges from as low as 0.001 carats (1000th/carat) to 0.18 carats
MICRODIAMONDS Very small rough diamonds, less than 0.5mm
MIDSTREAM The stage of the diamond value chain that includes sales of rough diamonds, cutting and polishing, primary and secondary sales of polished diamonds and jewellery manufacturing
NATURAL DIAMOND A diamond formed naturally over millions of years in the earth’s crust
NEAR GEM QUALITY A quality band between gem-quality and industrial diamonds
OPEN-PIT MINING Mining from the surface to expose the ore below
POLISHED Diamonds that have been cut and polished (manufactured) in preparation for use in jewellery manufacture
PWP Polished Wholesale Price, a term referring to prices achieved by cutter polishers in Cutting Centres for polished diamonds
RESERVES Mineral deposits that can be economically extracted
RIPPLE EFFECT Temporary mismatch between supply and demand caused by the de-stocking or re-stocking activities of midstream operators in response to changes in market conditions
ROIC Return On Invested Capital: The return on invested capital measure gives a sense of how well a company is using its money to generate returns. Comparing a company’s return on capital (ROIC) with its cost of capital (WACC) reveals whether invested capital was used effectively
ROUGH DIAMOND A diamond that has been mined but not yet cut and polished in preparation for use in jewellery manufacture
SIGHT An event during which customers can inspect and buy diamonds from De Beers
SIGHTHOLDERS Term contract rough diamond customers of De Beers
SIMULANT A substance used to imitate diamond
SMALLS Colloquial term for rough diamonds under three grainers. A grainer is a unit often used in the diamond trade to approximate the weight of a rough diamond; a grain is approximately 0.25 carats
SMARTY CAMERA An in-vehicle Event Data Recorder (EDR) which makes constant video recordings of a journey; it is designed to reduce risk by encouraging safe driving behaviour and aiding in the process of investigating car accidents
SOLITAIRE An item of jewellery (for example, a ring) that highlights a single diamond
SORTING The process of classifying rough diamonds into a variety of categories based on their natural characteristics, specifically their colour, clarity, carat and model or shape
SYNTHETIC A man-made diamond that has the same chemical composition, crystal structure and physical properties as its natural counterpart. Where a product is man-made, but has the same structure as a natural counterpart, an accepted description must be used to make clear that the product is man-made. Synthetic is one such description

83
TREATMENT Any non-natural processes (other than shaping, polishing and surface cleaning) that change, interfere with and/or contaminate the natural appearance, composition or durability of a gemstone. For diamonds, this includes colour treatments (and decolourisation or ‘bleaching’), fracture-filling, laser-drilling, irradiation treatment, and coating
UNDISCLOSED SYNTHETIC A synthetic diamond that has been falsely passed off as a natural gem
UPSTREAM The stage of the diamond value chain that includes rough-diamond exploration and production
WACC Weighted Average Cost of Capital: A calculation of a company’s cost of capital in which each category of capital is proportionately weighted. All capital sources – common stock, preferred stock, bonds and any other long-term debt – are included in a WACC calculation
WHOLESALER An organisation that buys polished diamonds in order to distribute them to jewellery manufacturers and retailers

84
END NOTES1 See Kimberley Process statistics “Annual Summary
Tables 2005”
2 McKinsey & Company, “Perspectives on the Diamond Industry”, September 2014
3 Saudi Arabia, UAE, Qatar, Kuwait, Oman and Bahrain
4 Bloomberg, ROIC and EBIT margin; accessed
1 August 2014
5 Company filings
6 Bloomberg, ROIC and EBIT margin; accessed
1 August 2014
7 Blue Nile, “2013 Annual Report”, p.26
8 Bloomberg, ROIC and EBIT margin; accessed
1 August 2014
9 Laura Chesters, “Bruno Pavlovsky is making the Chanel dream come true with Bond Street address”, London
Evening Standard online, 13 June 2013: http://www.
standard.co.uk/business/markets/bruno-pavlovsky-is-
making-the-chanel-dream-come-true-with-bond-street-
address-8657099.html
10 Margaux Krehl, “Chanel’s St Tropez pop up shop”, Vogue
online, 5 May 2014: http://en.vogue.fr/fashion/fashion-
news/diaporama/chanel-s-st-tropez-pop-up-shop/18619
11 Anne Combaz, “Chanel pops up in Courchevel”, The
Telegraph online, 9 December 2013: http://fashion.
telegraph.co.uk/article/TMG10505236/Chanel-pops-up-
in-Courchevel.html
12 Chanel News, http://chanel-news.chanel.com/en/home.
html; accessed 27 May 2014
13 Mindshare 2014
14 Dealogic, “M&A Analytics”, M&A activity in sectors:
Precious Metal/Jewelry, Retail – Jewelry stores, Retail –
Apparel/Shoes, Textile – Apparel Manufacturing;
time range: 1995-2014; accessed on 30 April 2014
15 Signet Jewelers Press Release “Signet Jewelers Completes Acquisition of Zale Corporation”, 29 May 2014
16 http://www.israelidiamond.co.il/english/news.
aspx?boneid=3024; accessed on 1 August 2014
17 ICE Benchmark Administration Limited (IBA)
18 The World Bank data website http://data.worldbank.
org/; accessed on 9 July 2014, GDP current USD
19 The World Bank, Kimberley Process statistics and
De Beers data and analysis
20 The World Bank data website http://data.worldbank.
org/; accessed on 9 July 2014, GDP current USD
21 The World Bank, Kimberley Process statistics and
De Beers data and analysis
22 http://eng.alrosa.ru/operations/sales-policy/; accessed
on 1 August 2014
23 Dominion Diamond Corporation: http://www.ddcorp.ca/
investors/news-single?id=1945908; accessed 25 July2014
24 Rough & Polished website, http://www.rough-polished.
com/en/news/91426.html; accessed on 1 August 2014
25 See Kimberley Process statistics “Annual Summary Tables 2005”
26 https://kimberleyprocessstatistics.org/static/pdfs/
public_statistics/2013/2013 GlobalSummary.pdf ;
accessed on 1 August 2014
27 https://www.riotintodiamonds.com/ENG/media/
media_releases_1429.asp; accessed on 1 August 2014
28 https://www.riotintodiamonds.com/ENG/ourmines/
argyle_diamond_diamonds.asp; accessed on 1 August 2014
29 http://www.bhpbilliton.com/home/investors/news/
Pages/Articles/BHP-Billiton-Completes-Sale-of-
Diamonds-Business-to-Dominion-Diamond-Corporation.
aspx; accessed on 1 August 2014
30 SNL-MEG Corporate Exploration Strategies 2013.
Includes grassroots, late stage and mine-site expenditure
31 Rio Tinto Diamonds website, http://www.
riotintodiamonds.com/eng/ourmines/565_the_bunder_
diamond_project.asp; accessed on 25 July, 2014
32 De Beers estimates based on company publications
and websites, SNL-MEG Corporate Exploration
Strategies 2013
33 De Beers estimates based on company publications
and websites, SNL-MEG Corporate Exploration
Strategies 2013
34 2010-13 MEG Corporate Exploration Strategies. Includes
grassroots, late stage and mine-site expenditure
35 Mindshare 2014
36 Euromonitor, “Euromonitor International: Luxury Goods Retail Value in the USA”; time range: 2004-2013; accessed
on 4 April 2014

85
37 US Bureau of Labor Statistics; http://www.bls.gov/oes/
current/oes_nat.htm; accessed on 1 August 2014, mean
hourly wage for all occupations
38 Mintel Report, Weddings – US – May 2013
39 McKinsey & Company, “Meet the Chinese Consumer of 2020”, March 2012, pp.3-4
40 Credit Suisse Research Institute Global Wealth
Report 2013
41 Capgemini and RBC Wealth Management 2012
World Wealth Report
42 “WealthInsight defines ‘millionaires’ as individuals with net assets of US$1 million or more, excluding their primary residences”, City A.M, 24 July 2014 edition
43 Chow Tai Fook Jewellery Group Limited Annual Results
Announcement for the year ended 31 March 2014,
17 June 2014
44 http://www.chinainternetwatch.com/5132/mobile-
broadband-became-daily-life-necessity-in-china/;
accessed on 1 August 2014
45 McKinsey & Company, “Winning Today’s Globe Hopping and Shopping Chinese Luxury Consumers”, June 2014, pp.1-2
46 Botswana Power Corporation, 2007 Annual report,
page 6 http://www.bpc.bw/Documents/bpc_annual_
report_2007.pdf, and Namibian Manufacturers’
Association, Electricity Price Comparison, page 15,
http://www.nmanamibia.com/fileadmin/user_upload/
pdf/NMA_electricity_price_comparison_2012.pdf;
accessed on 1 August 2014
47 Business Monitor International, subscription
service, http://www.businessmonitor.com/; accessed
on 1 August 2014
48 Russian Federation Federal State Statistics Service,
http://www.gks.ru/free_doc/new_site/prices/prom/
cena-OKPD.xls; accessed on 1 August 2014
49 Russian Federation Federal State Statistics Service,
http://www.gks.ru/free_doc/new_site/population/trud/
sr-zarplata/t3.docx; accessed on 1 August 2014
50 Eskom Annual Report 2002, page 143; and Eskom
Annual Report 2012, Divisional Report, page 94
51 http://business.financialpost.com/2011/08/31/arctic-
has-great-riches-but-greater-challenges and http://www.
irishexaminer.com/business/karelian-diamonds-applies-
for-two-arctic-circle-claims-247056.html; accessed on
1 August 2014
52 http://www.ewh.ieee.org/tc/csc/europe/newsforum/
pdf/H16_IPHT_MiningAwardPressAnnounce_120307.
pdf and http://www.angloamerican.co.za/our-
operations/mining-and-technology.aspx; accessed on 1
August 2014
53 http://www.debtech.com/pdf/Leaflet_Scannex.pdf;
accessed on 1 August 2014
54 http://lodox.com/about/; accessed on 1 August 2014
55 http://lodox.com/2014/05/better-by-the-dozen-a-roll-
out-of-12-lodox-scanners-in-gauteng-medical-facilities-
this-financial-year/ and http://lodox.com/2014/04/and-
then-there-were-five/; accessed on 1 August 2014
56 http://www.diamonds.net/News/NewsItem.
aspx?ArticleID=40156 and http://www.israelidiamond.
co.il/english/News.aspx?boneId=2525&objid=11188”;
accessed on 1 August 2014
57 http://www.e6.com/wps/wcm/connect/e6_
content_en/home/the+power+of+supermaterials/
synthetic+diamonds+extreme+properties; accessed on
1 August 2014
58 http://www.ssef.ch/asdi/; accessed on 1 August 2014

86
Please note that names such as Tiffany, Cartier, Chanel and Harry Winston are trademarks of the respective brand owners.
De Beers UK Limited is a member of The De Beers Group of Companies and is a limited liability company, incorporated in
England and Wales (Registered Number 02054170) with its registered office at 17 Charterhouse Street, London, EC1N 6RA.
De BeersTM, A Diamond is ForeverTM, DTCTM, ForevermarkTM, and TM are used under licence by De Beers UK Limited.
© De Beers UK Limited 2014. All rights reserved.
A member of the Anglo American plc group.

D E B E E R S U K LT D1 7 C H A RT E R H O U S E ST R E E T
LO N D O NEC 1 N 6 R A
www.debeersgroup.com/insightreport
@ D E B E E R S G R O U P# D I R 2 0 1 4