Dialysis Dose Prescription and Delivery - … Dose Prescription and Delivery . Dose in RRT: ... 618...
36
William Clark, M.D. Claudio Ronco, M.D. Rolando Claure-Del Granado, M.D. CRRT Conference February 15, 2012 Dialysis Dose Prescription and Delivery
Transcript of Dialysis Dose Prescription and Delivery - … Dose Prescription and Delivery . Dose in RRT: ... 618...
William Clark, M.D.
Claudio Ronco, M.D.
Rolando Claure-Del Granado, M.D.
CRRT Conference
February 15, 2012
Dialysis Dose Prescription and Delivery

Dose in RRT: Key concepts
• Dose definition
• Quantifying dose
• Prescribed versus delivered
• Factors influencing clearance
• Practical Considerations
Dose in RRT: Key concepts
• Dose definition
• Quantifying dose
• Prescribed versus delivered
• Factors influencing clearance
• Practical Considerations

What defines dose?
A measure of the quantity of blood purification achieved
by means of extracorporeal techniques.
A measure of the quantity of a representative marker
solute which is removed from a patient.

• Major flaws in the previous concept:
– The marker solute cannot and does not represent all the solutes
that accumulate in AKI.
– Its kinetics and volume of distribution are also different from
those of the solutes of interest.
– Its removal during RRT is not representative of the removal of
other solutes.
What defines dose?
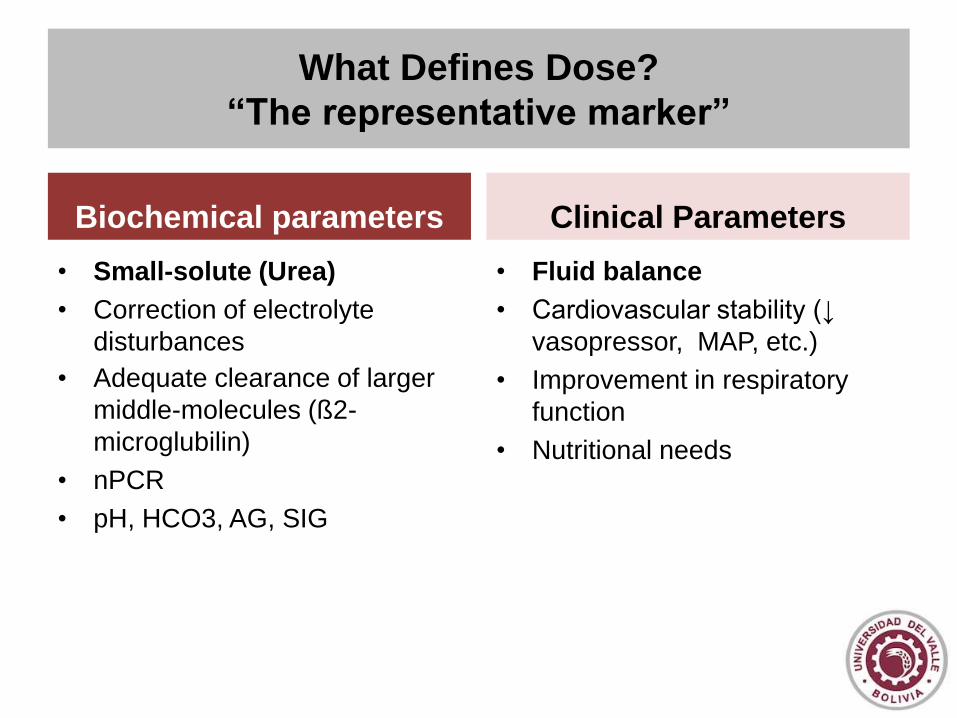
What Defines Dose?
“The representative marker”
• Small-solute (Urea)
• Correction of electrolyte
disturbances
• Adequate clearance of larger
middle-molecules (ß2-
microglubilin)
• nPCR
• pH, HCO3, AG, SIG
• Fluid balance
• Cardiovascular stability (↓
vasopressor, MAP, etc.)
• Improvement in respiratory
function
• Nutritional needs
Biochemical parameters Clinical Parameters

Davenport and Farrington Lancet; 2010
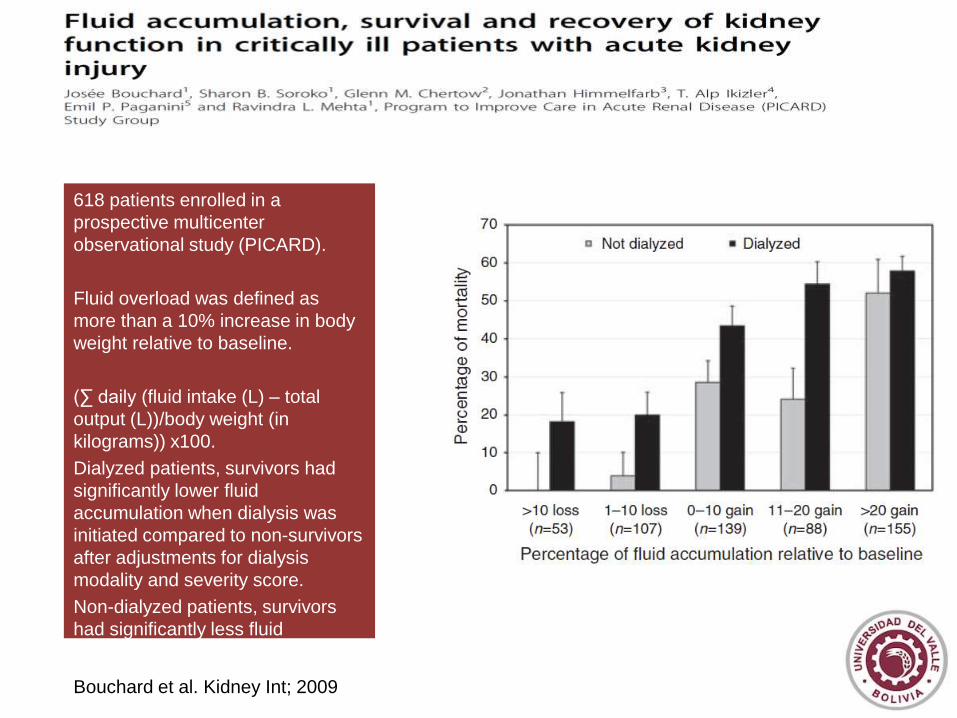
618 patients enrolled in a
prospective multicenter
observational study (PICARD).
Fluid overload was defined as
more than a 10% increase in body
weight relative to baseline.
(∑ daily (fluid intake (L) – total
output (L))/body weight (in
kilograms)) x100.
Dialyzed patients, survivors had
significantly lower fluid
accumulation when dialysis was
initiated compared to non-survivors
after adjustments for dialysis
modality and severity score.
Non-dialyzed patients, survivors
had significantly less fluid
accumulation at the peak of their
serum creatinine.
Bouchard et al. Kidney Int; 2009
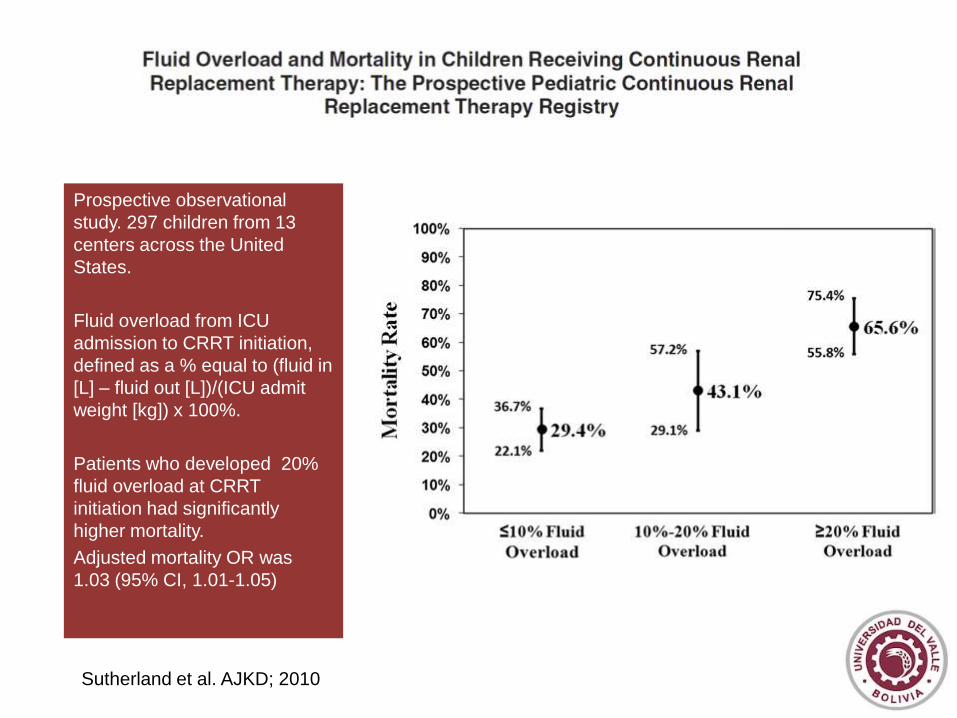
Prospective observational
study. 297 children from 13
centers across the United
States.
Fluid overload from ICU
admission to CRRT initiation,
defined as a % equal to (fluid in
[L] – fluid out [L])/(ICU admit
weight [kg]) x 100%.
Patients who developed 20%
fluid overload at CRRT
initiation had significantly
higher mortality.
Adjusted mortality OR was
1.03 (95% CI, 1.01-1.05)
Sutherland et al. AJKD; 2010
Dose in RRT: Key concepts
• Dose definition
• Quantifying dose
• Prescribed versus delivered
• Factors influencing clearance
• Practical Considerations

• Efficiency: clearance (K); volume of blood cleared of a
given solute over a given time.
• Intensity: clearance × time (Kt); Kt × frequency (Kt ×
treatment days per week)
• Efficacy: represents effective solute removal
– Fractional clearance of a given solute
– Kt/V
Quantifying delivered dose: Efficiency, Intensity,
Efficacy
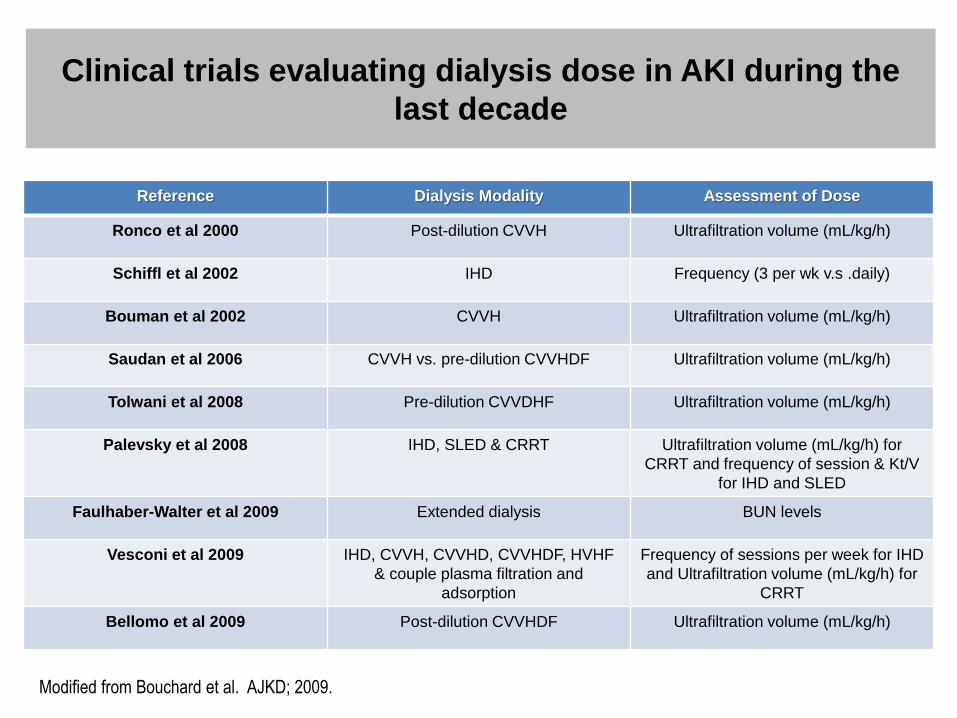
Clinical trials evaluating dialysis dose in AKI during the
last decade
Reference Dialysis Modality Assessment of Dose
Ronco et al 2000 Post-dilution CVVH Ultrafiltration volume (mL/kg/h)
Schiffl et al 2002 IHD Frequency (3 per wk v.s .daily)
Bouman et al 2002 CVVH Ultrafiltration volume (mL/kg/h)
Saudan et al 2006 CVVH vs. pre-dilution CVVHDF Ultrafiltration volume (mL/kg/h)
Tolwani et al 2008 Pre-dilution CVVDHF Ultrafiltration volume (mL/kg/h)
Palevsky et al 2008 IHD, SLED & CRRT Ultrafiltration volume (mL/kg/h) for
CRRT and frequency of session & Kt/V
for IHD and SLED
Faulhaber-Walter et al 2009 Extended dialysis BUN levels
Vesconi et al 2009 IHD, CVVH, CVVHD, CVVHDF, HVHF
& couple plasma filtration and
adsorption
Frequency of sessions per week for IHD
and Ultrafiltration volume (mL/kg/h) for
CRRT
Bellomo et al 2009 Post-dilution CVVHDF Ultrafiltration volume (mL/kg/h)
Modified from Bouchard et al. AJKD; 2009.

Dose expression characteristics
• Any dose measurement must have the ability to be
associated to:
– Process of solute removal
– Patient outcomes
• Measurement should also be simple to calculate without
sacrificing accuracy
• Ideal measurement for RRT dose should be numerically
comparable across all modalities and treatment schedules

Toward the Optimal Dose Metric in Continuous Renal
Replacement Therapy.
1Rolando Claure-Del Granado, MD; 2Etienne Macedo MD, PhD; 3Glenn M. Chertow, MD, MPH; 1Sharon Soroko; 4Jonathan Himmelfarb, MD; 5T. Alp Ikizler, MD; 6Emil P. Paganini, MD; and 1Ravindra L. Mehta, MD.
1University of California San Diego; 2University of Sao Paulo, Brazil; 3Stanford University School of Medicine; 4Kidney Research Institute,
University of Washington; 5Vanderbilt University Medical Center; 6Cleveland Clinic Foundation
- Data from 52 critically-ill
patients with AKI requiring
dialysis.
- All patients were treated with
pre-dilution CVVHDF and
regional citrate anticoagulation.
Delivered dose was calculated
using blood-side and dialysis-side
kinetics.
- Filter function was assessed
during the entire course of
therapy by calculating BUN to
dialysis fluid urea nitrogen (FUN)
ratios q/12 hours.
- EKR and KD presented a
decline in their values that was
related to the decrease in filter
function assessed by the
FUN/BUN ratio.
Claure-Del Granado Int J Artif Organs; In
press.
Dose in RRT: Key concepts
• Dose definition
• Quantifying dose
• Prescribed versus delivered
• Factors influencing clearance
• Practical Considerations
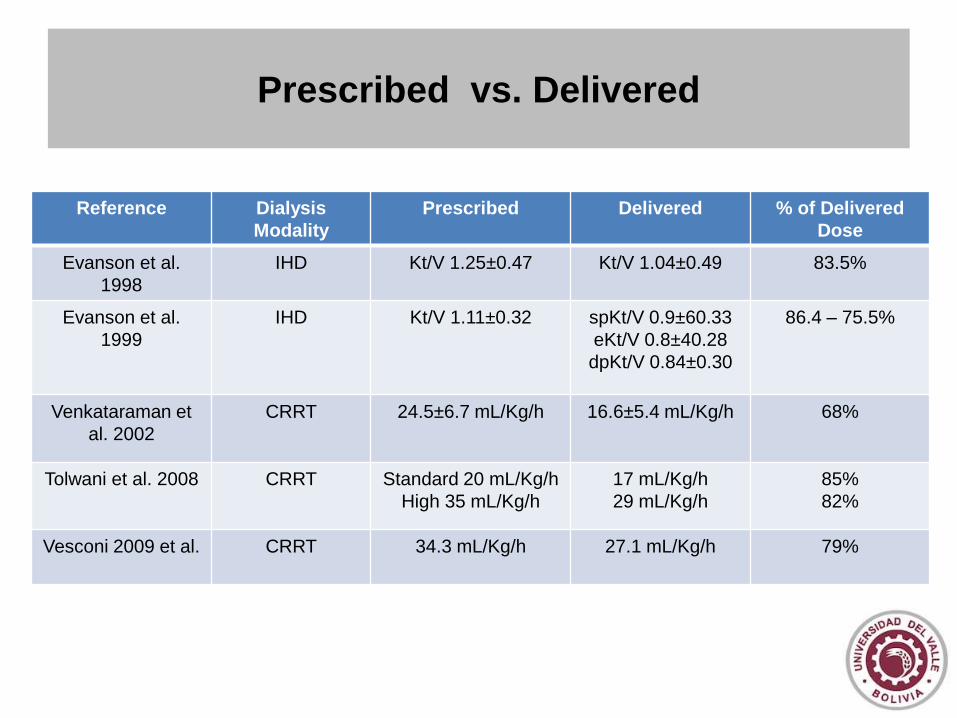
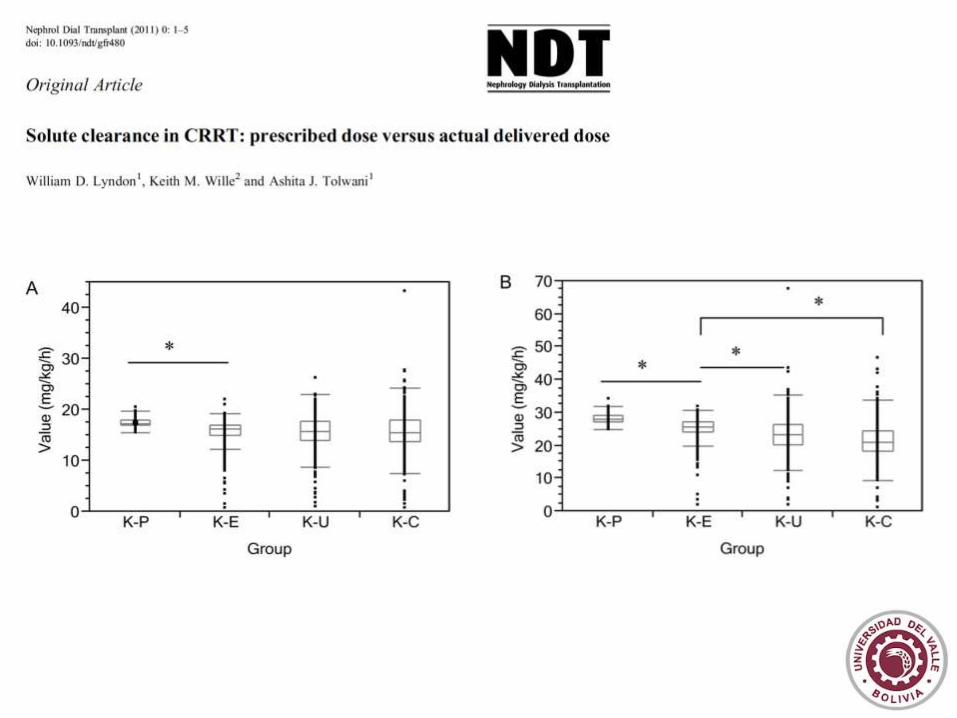
Prescribed vs. Delivered
Reference Dialysis
Modality
Prescribed Delivered % of Delivered
Dose
Evanson et al.
1998
IHD Kt/V 1.25±0.47 Kt/V 1.04±0.49 83.5%
Evanson et al.
1999
IHD Kt/V 1.11±0.32 spKt/V 0.9±60.33
eKt/V 0.8±40.28
dpKt/V 0.84±0.30
86.4 – 75.5%
Venkataraman et
al. 2002
CRRT 24.5±6.7 mL/Kg/h 16.6±5.4 mL/Kg/h
68%
Tolwani et al. 2008 CRRT Standard 20 mL/Kg/h
High 35 mL/Kg/h
17 mL/Kg/h
29 mL/Kg/h
85%
82%
Vesconi 2009 et al. CRRT 34.3 mL/Kg/h 27.1 mL/Kg/h 79%
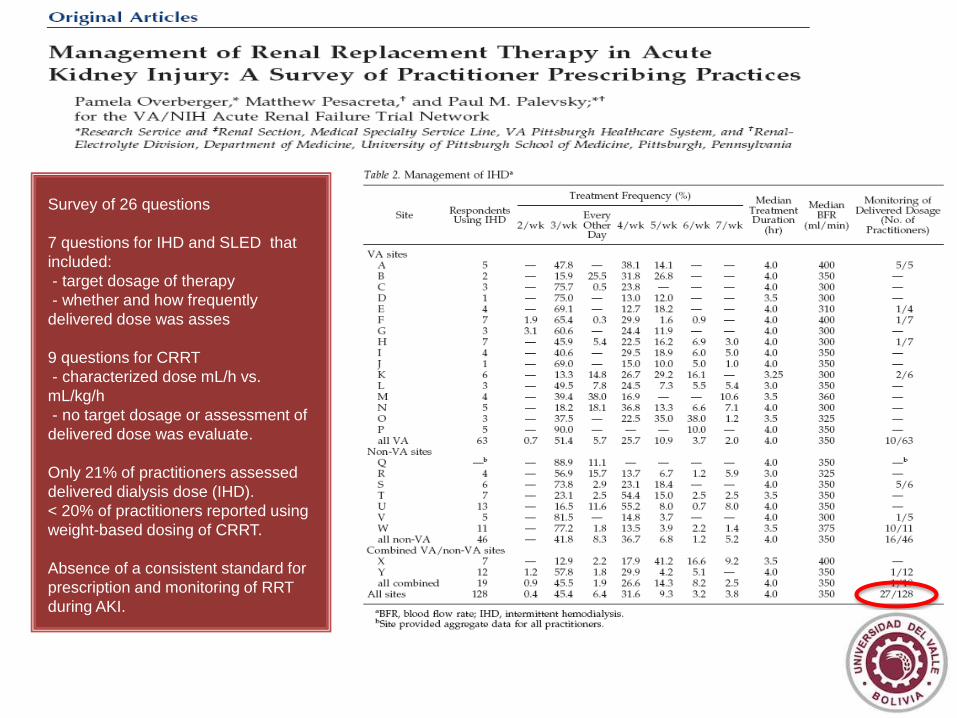
Survey of 26 questions
7 questions for IHD and SLED that
included:
- target dosage of therapy
- whether and how frequently
delivered dose was asses
9 questions for CRRT
- characterized dose mL/h vs. mL/kg/h
- no target dosage or assessment of
delivered dose was evaluate.
Only 21% of practitioners assessed
delivered dialysis dose (IHD).
< 20% of practitioners reported using
weight-based dosing of CRRT.
Absence of a consistent standard for
prescription and monitoring of RRT
during AKI.
Survey of 26 questions
7 questions for IHD and SLED that
included:
- target dosage of therapy
- whether and how frequently
delivered dose was asses
9 questions for CRRT
- characterized dose mL/h vs.
mL/kg/h
- no target dosage or assessment of
delivered dose was evaluate.
Only 21% of practitioners assessed
delivered dialysis dose (IHD).
< 20% of practitioners reported using
weight-based dosing of CRRT.
Absence of a consistent standard for
prescription and monitoring of RRT
during AKI.
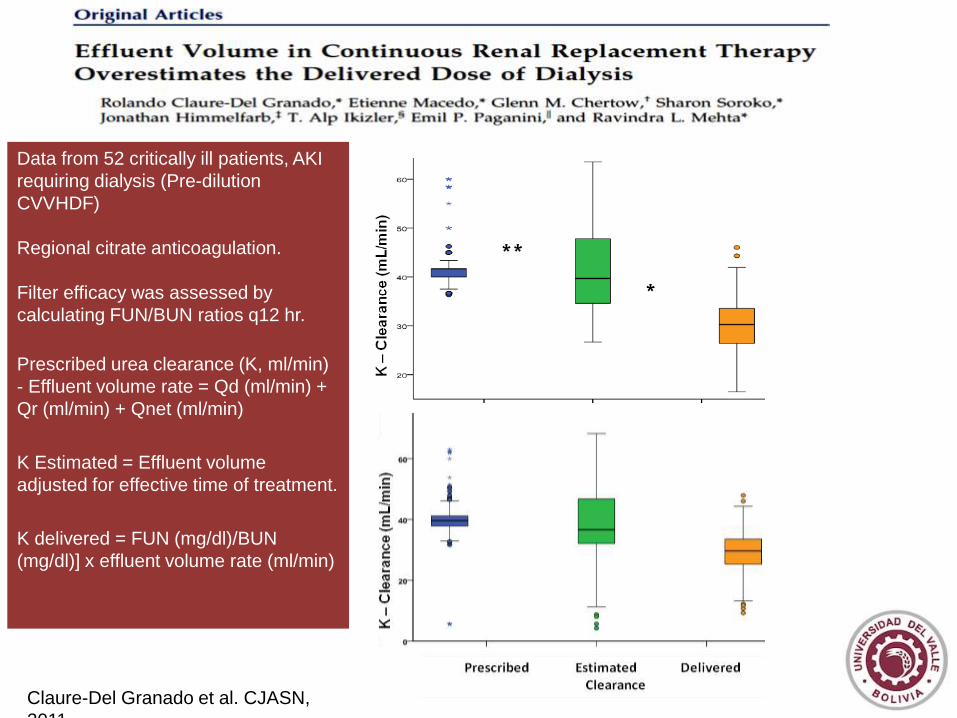
Data from 52 critically ill patients, AKI
requiring dialysis (Pre-dilution
CVVHDF)
Regional citrate anticoagulation.
Filter efficacy was assessed by
calculating FUN/BUN ratios q12 hr.
Prescribed urea clearance (K, ml/min)
- Effluent volume rate = Qd (ml/min) +
Qr (ml/min) + Qnet (ml/min)
K Estimated = Effluent volume
adjusted for effective time of treatment.
K delivered = FUN (mg/dl)/BUN
(mg/dl)] x effluent volume rate (ml/min)
Claure-Del Granado et al. CJASN,
2011
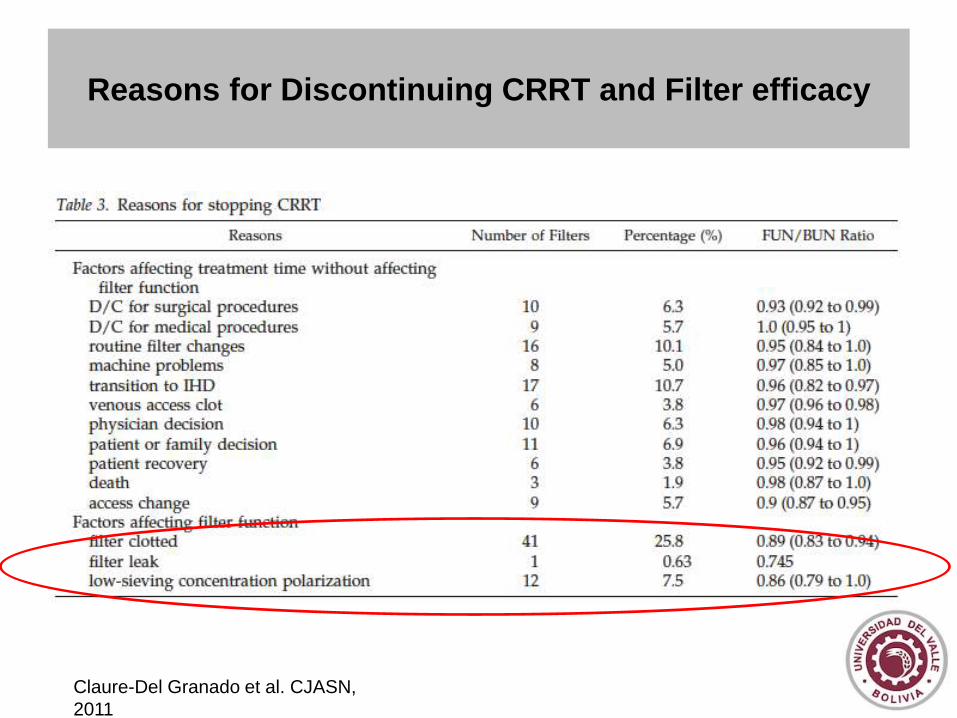
Reasons for Discontinuing CRRT and Filter efficacy
Claure-Del Granado et al. CJASN,
2011
Dose in RRT: Key concepts
• Dose definition
• Quantifying dose
• Prescribed versus delivered
• Factors influencing clearance
• Practical Considerations

Factors Influencing RRT Clearances in the ICU
• Patient factors
• Treatment factors

Patient Related Factors
• Generation of uremic toxins (G)
• Pool of uremic toxins (V)
Patient Related Factors
• Generation of uremic toxins (G)
– Higher in general than for ESRD (nPCR often >1.5
g/kg/day)
– Variable
• Pool of uremic toxins (V)
• Generation of uremic toxins (G)
• Pool of uremic toxins (V)
• V is higher in AKI compared to ESRD patients, often
>0.65L/kg
• V does not equate to TBW in AKI as assessed BIA
• V is greater than anthropometrically calculated values
Himmelfarb et al. Kidney Int;
2002.
Patient Related Factors
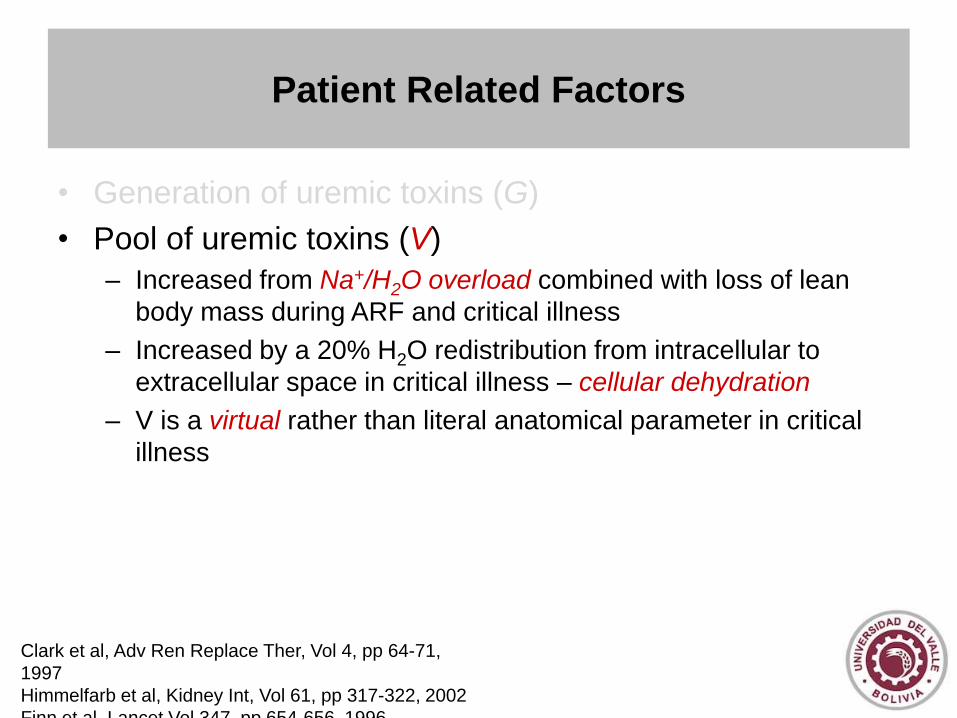
Patient Related Factors
• Generation of uremic toxins (G)
• Pool of uremic toxins (V)
– Increased from Na+/H2O overload combined with loss of lean
body mass during ARF and critical illness
– Increased by a 20% H2O redistribution from intracellular to
extracellular space in critical illness – cellular dehydration
– V is a virtual rather than literal anatomical parameter in critical
illness
Clark et al, Adv Ren Replace Ther, Vol 4, pp 64-71,
1997
Himmelfarb et al, Kidney Int, Vol 61, pp 317-322, 2002
Finn et al, Lancet Vol 347, pp 654-656, 1996
Treatment Related Factors
• Catheter
• Filter
• Time out of therapy

Treatment Related Factors
• Catheter
• Filter
• Time out of therapy

Pre-dilution CVVHDF
Filter 0.9 m2 AN69
Anticoagulation LMW Heparin
Filter change each 72 hrs. or if
clotted
Randomized
-15 patients (46 treatments) PNT
catheter
-15 patients (46 treatments) ST
catheter
Prescribed and delivered clearance
was assessed
No difference in Qb
No difference in recirculation rate
ST catheters less catheter related
thrombosis and infection
Klouche K et al. Am J Kidney Dis,
2007

Treatment Related Factors
• Catheter
• Filter
• Time out of therapy
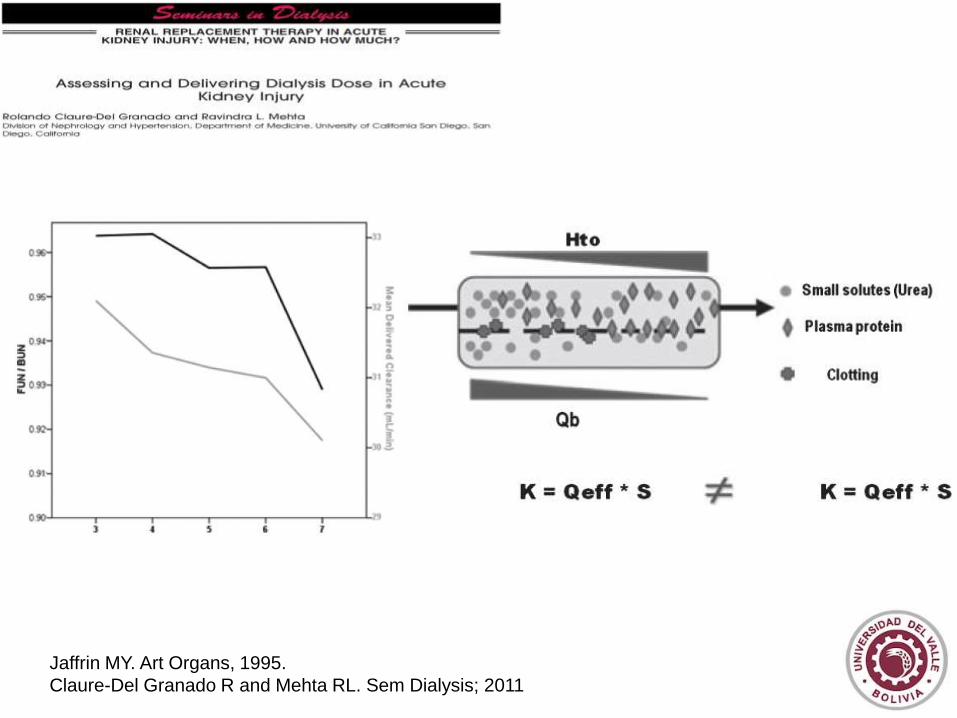
Jaffrin MY. Art Organs, 1995.
Claure-Del Granado R and Mehta RL. Sem Dialysis; 2011

Effect of type of anticoagulation on filter life and
delivered dose
Citrate vs. Heparin , p < 0.001
Citrate vs. no anticoagulant, p < 0.001
Heparin vs. no anticoagulant, p = 0.012
6.1 (4.4 – 8.1)
8.1 (5.9 – 10.4) 7.4 (5.4 – 9.8)
Type of
anticoagulant
Median (IQR) Filter Life
in Hours
Citrate 48 (20.3-75.0)
Heparin
15.9 (8.5 - 27.0)
No anticoagulant
17.5 (9.5 to 32)
p value
< 0.0001
J Am Soc Nephrol 21: TH-PO422, 2010
Treatment Related Factors
Catheter
Filter
Time out of therapy

The Impact of Down-Time and Filter Efficacy on
Delivered Dose of Continuous Renal Replacement
Therapy
J Am Soc Nephrol 21: F-FC172, 2010
Dose in CRRT: Practical considerations
• Clearances should be measured as part of routine care delivery as
estimated clearances do not equate delivered.
• Optimizing RRT clearances requires constant assessment and
adjustment for operational characteristics and treatment factors.
• Delivered Dose is less than Prescribed and consequently prescribed
dose should compensate for the anticipated reduction
(approximately 15-25%).
• Solute Clearances are not the sole measure of dialysis adequacy.
Fluid removal and fluid balance are equally if not more important
parameters to be monitored.

Proposed parameters for Dose Assessment
Claure-Del Granado R and Mehta RL. Sem Dialysis; 2011