Dialog Semiconductor Q2 2019 Results - Seeking Alpha
33
© 2019 Dialog Semiconductor Dialog Semiconductor Q2 2019 Results 30 JULY 2019
Transcript of Dialog Semiconductor Q2 2019 Results - Seeking Alpha

© 2019 Dialog Semiconductor
Dialog Semiconductor
Q2 2019 Results
30 JULY 2019

Dialog Semiconductor Plc Q2 2019 Results, 30 July 2019.
All Rights Reserved. © Copyright 2019 2
Forward Looking Statement
This document contains “forward-looking statements” that reflect management’s current views with respect to future events. The words
“anticipate,” “believe,” “estimate”, “expect,” “intend,” “may,” “plan,” “project” and “should” and similar expressions identify forward-looking
statements. Examples include statements regarding financial metrics, operational matters, and closing conditions and regulatory approvals
required under the new contract with Apple. Forward-looking statements are subject to risks and uncertainties, including, but not limited to:
an economic downturn in the semiconductor and telecommunications markets; changes in currency exchange rates and interest rates, the
timing of customer orders and manufacturing lead times, insufficient, excess or obsolete inventory, the impact of competing products and
their pricing, political risks in the countries in which we operate or sale and supply constraints. If any of these or other risks and uncertainties
occur (some of which are described under the heading “Risks and their management” in Dialog Semiconductor’s most recent Annual
Report) or if the assumptions underlying any of these statements prove incorrect, then actual results may be materially different from those
expressed or implied by such statements. We do not intend or assume any obligation to update any forward-looking statement which speaks
only as of the date on which it is made, however, any subsequent statement will supersede any previous statement.

Dialog Semiconductor Plc Q2 2019 Results, 30 July 2019.
All Rights Reserved. © Copyright 2019
Agenda
3
▪ Business Review
▪ Financial Review
▪ Q&A

Dialog Semiconductor Plc Q2 2019 Results, 30 July 2019.
All Rights Reserved. © Copyright 2019 4
A New Organisation Supporting Our Growth Strategy
Davin Lee
SVP & GM
Advanced
Mixed Signal
Sean McGrath
SVP & GM
Connectivity &
Audio
Wissam Jabre
SVP Finance and CFO
Julie Pope
SVP HR
Colin Sturt
SVP General Counsel
Tom Sandoval
SVP Automotive
John Teegen
SVP Worldwide Sales
Vivek Bhan
SVP & GM
Custom Mixed
Signal
Jalal Bagherli
CEO
Mark Tyndall
SVP Corporate Development and Strategy
Alex McCann
SVP Global Operations

Dialog Semiconductor Plc Q2 2019 Results, 30 July 2019.
All Rights Reserved. © Copyright 2019 5
Growth Vectors by End Market
▪ Increasing number of connected devices: BLE, low-power Wi-Fi
▪ Consumers demand for better audio experience: Wireless and USB Audio
▪ Complementary offering with CMICs
AutomotiveIoT Mobile Computing & Storage
▪ Growth opportunities with our largest customer on a range of mixed-signal products outside main PMIC license
▪ Increasing adoption of CMICs in camera modules
▪ Rapid charge products
▪ Technologies supporting infotainment systems and ADAS
▪ Increased adoption of technologies such as Power Management, BLE, CMICs, display backlight drivers
▪ Custom power management for gaming applications and SSDs
▪ Increasing adoption of CMICs and audio in notebooks
Leveraging Technology in Automotive and C&SBuilding on IoT and Mobile Strength

Dialog Semiconductor Plc Q2 2019 Results, 30 July 2019.
All Rights Reserved. © Copyright 2019 6
Organic Business Transformation with Further Inorganic Opportunities
Reduced customer concentration and a more
balanced end-market exposure
▪ Strong focus on IoT, automotive, and
computing & storage
Growing business (excluding licensed products)
▪ Growth vectors offset ~2/3 of the
revenue impact from the license
agreement
High returns and cash flow generation –
sustainable underlying operating margin
70%1
+20% YoY2
19.5%
2018
35% to 40%
Mid-teens %
2018-2022 CAGRGrowing mixed-signal
business at largest
customer and expansion in
other end markets
18%-23%
2022
1 Revenue from Apple recognised in Custom Mixed Signal as a percentage of total Group revenue.
2 Based on twelve months 2017 revenue for Silego Technology Inc. of $84.3 million.

7 Dialog Semiconductor Plc Q2 2019 Results, 30 July 2019.
All Rights Reserved. © Copyright 2019
Well-Positioned to Create Shareholder Value Over the Long-Term
Building on a strong foundation of mixed-signal and power-efficient IC expertise
Apple agreement positions Dialog for robust earnings and cash generation with visibility through 2022
Sharpening focus on fast-growing segments of IoT, Mobile, Automotive and Computing & Storage markets
Significant financial flexibility to pursue growth strategy and commitment to disciplined capital allocation

Dialog Semiconductor Plc Q2 2019 Results, 30 July 2019.
All Rights Reserved. © Copyright 2019
Agenda
8
▪ Business Review
▪ Financial Review
▪ Q&A

Dialog Semiconductor Plc Q2 2019 Results, 30 July 2019.
All Rights Reserved. © Copyright 2019 9
At a Glance – Q2 2019
Extending Dialog and Apple’s Long-Standing Partnership
$336m(Q2 2018: $296m)
24.4%(Q2 2018: 14.2%)
Underlying revenue
+14% YoY
Underlying EBIT %+10.2 percentage points YoY
49.7%(Q2 2018: 48.3%)
86 cents(Q2 2018: 45 cents)
Underlying gross margin+140bps YoY
Underlying diluted EPS +91% YoY
29.2%(Q2 2018: 34.2%)
$290m 60.2%(Q2 2018: $37m 12.4%)
Underlying OPEX %-500bps YoY
Free cash flow and margin+695% YoY

10 Dialog Semiconductor Plc Q2 2019 Results, 30 July 2019.
All Rights Reserved. © Copyright 2019
Q2 2019 Underlying Revenue Above The High-End of The Guidance Range
109 115
2164
166
150
Q2 2018 Q2 2019
296
336
Revenue Profile $M
166 150
21 64
Q2 2018 Q2 2019
64 64
Q2 2018 Q2 2019
37 45
Q2 2018 Q2 2019
Custom Mixed Signal (CMS) $M
Advanced Mixed Signal (AMS) $M
Connectivity & Audio (C&A) $M
YoY Movement
63% 4
1 Ongoing license revenue and revenue from the acquisition of FCI 2 Sub-PMICs in phones and tablets.3 Other includes PMICs for Mac, accessories. 4 Revenue from Apple recognised in Custom Mixed Signal as a percentage of total Group revenue.
AMS, C&A (exc.
FCI), and
automotive
products reported
under CMS
Apple Sub-PMICs2
and Other3
Apple Main
PMICs
Other1
+208% YoY
+5% YoY
-10%YoY
195 219
+14%YoY
64% 4
→ Expected lower main PMIC for
phones
→ Increased content and higher
volumes across multiple
platforms
→ Lower demand for rapid
charge products offset by solid
performance of LED
backlighting products
→ Higher BLE demand and
increased adoption of more
complex audio solutions
47

Dialog Semiconductor Plc Q2 2019 Results, 30 July 2019.
All Rights Reserved. © Copyright 2019 11
▪ Q2 2019 underlying gross margin at 49.7%, 140 bps higher than Q2 2018
▪ Year-on-year increase due to product mix and lower manufacturing costs
▪ Positive contribution from ongoing license revenue (Q2 2019: $6 million)
▪ H1 2019 underlying gross margin at 49.6%, 190 bps higher than H1 2018
▪ Year-on-year increase mainly due to product mix and lower manufacturing costs
Underlying Gross Margin Improvement
Underlying gross margin
48.3%49.6% 49.7%
Q2 2018 Q1 2019 Q2 2019
47.7%49.6%
H1 2018 H1 2019
+190 bps
YoY
+140 bps
YoY

Dialog Semiconductor Plc Q2 2019 Results, 30 July 2019.
All Rights Reserved. © Copyright 2019 12
1
Lower Year-on-Year OPEX
Underlying OPEX $M and OPEX % of Underlying Revenue
R&D
SG&A
R&D
SG&A
205.8 32.8%
23.0%
9.8%
▪ Q2 2019 underlying OPEX decreased by 3% year-on-year
▪ Q2 2019 underlying R&D expenses 5% below Q2 2018
▪ Approximately $9 million savings from the transfer of over 300 employees to Apple
▪ Q2 2019 underlying SG&A expenses 1% above Q2 2018
▪ First time consolidation of FCI into the group
▪ H1 2019 underlying OPEX decreased by 2% year-on-year
▪ Underlying R&D decreased 3% year-on-year
▪ Underlying SG&A increased 1% year-on-year
71.0 67.5
30.2 30.5
Q2 2018 Q2 2019
101.298.034.2%
24.0%
10.2%
29.2%
9.1%
20.1%
144.3 139.8
61.5 61.9
H1 2018 H1 2019
32.0%
22.2%
9.8%
201.7

Dialog Semiconductor Plc Q2 2019 Results, 30 July 2019.
All Rights Reserved. © Copyright 2019 13
▪ Q2 2019 underlying operating margin over 10 percentage points higher than Q2 2018
▪ Higher revenue and gross margin
▪ Lower OPEX
▪ $12.5 million income from engineering contracts
▪ Corporate costs reduction of approximately 2/3 year-on-year
▪ $6 million ongoing license revenue
▪ Q2 2019 underlying effective tax rate 50bps below Q2 2018 at 20.5% (Q2 2018: 21.0%)
▪ Q2 2019 underlying diluted EPS up 91% year-on-year
Increased Profitability and Operating Margin
Underlying Operating Profit $M and Margin by Segment
3.5
66.6
5.3
6.8
-7.7
37.6
8.2
4.1
CMS
AMS
C&A
Corporate
10.9%
14.5%
12.8%
8.3%
19.3%
30.4%
Q2 2018
Q2 2019
42.1
82.194.5
129.3
Q2 2018 Q2 2019 H1 2018 H1 2019
15.1%
14.2%
0.45
0.86 0.98
1.35
Q2 2018 Q2 2019 H1 2018 H1 2019
Underlying Operating Profit $M and Margin Underlying Diluted EPS $
24.4%
20.5%
+91% YoY
+38% YoY

Dialog Semiconductor Plc Q2 2019 Results, 30 July 2019.
All Rights Reserved. © Copyright 2019 14
▪ Inventory value in line with Q1 2019, including ~$4 million from FCI
▪ Q2 2019 cash flow from operating activities of $300 million (Q2 2018:$56 million)
▪ Q2 2019 free cash flow at $290 million (Q2 2018: $37 million)
▪ Key items driving the increase in cash and cash equivalents:
▪ $600 million inflow from closing of Apple agreement
▪ $45 million outflow from closing of FCI acquisition
▪ US$112 million outflow from the settlement of the 2018 share buyback programme
▪ On 5 June we launched a new tranche of the share buyback between €125m and €150 million
Strong Balance Sheet and Cashflow Generation
134 141150 155 156
7864 61
9483
Q2 2018 Q3 2018 Q4 2018 Q1 2019 Q2 2019
Inventory ($M and DIO)
644 537
690
1,141
Q2 2017 Q2 2018 Q1 2019 Q2 2019
Cash and cash equivalents ($M)

Appendix
15Dialog Semiconductor Plc Q2 2019 Results, 30 July 2019.
All Rights Reserved. © Copyright 2019

Dialog Semiconductor Plc Q2 2019 Results, 30 July 2019.
All Rights Reserved. © Copyright 2019 16
At a Glance – H1 2019
Extending Dialog and Apple’s Long-Standing Partnership
$631m(H1 2018: $628m)
20.5%(H1 2018: 15.1%)
Underlying revenue
+1%YoY
Underlying EBIT %+540bps YoY
49.6%(H1 2018: 47.7%)
135 cents(H1 2018: 98 cents)
Underlying gross margin+190bps YoY
Underlying diluted EPS +38% YoY
32.0%(H1 2018: 32.8%)
$318m 41.0%(H1 2018: $68m 10.9%)
Underlying OPEX %-80bps YoY
Free cash flow and margin+365% YoY

Dialog Semiconductor Plc Q2 2019 Results, 30 July 2019.
All Rights Reserved. © Copyright 2019 17
Accounting of Apple License Agreement – Q2 2019
License revenue
One-off $146m
Ongoing
$6m
Transfer of assets
One-off gain $16m
Transfer of employees
OPEX2
reduction of ~$9m
NRE
One-off
$12.5m
Transaction costs
$7.6m
Underlying1
IFRS
1 Items included in underlying measures are also included in IFRS measures.2 Annualised OPEX savings of approximately $35 million
Dialog Semiconductor Plc Q2 2019 Results, 30 July 2019.
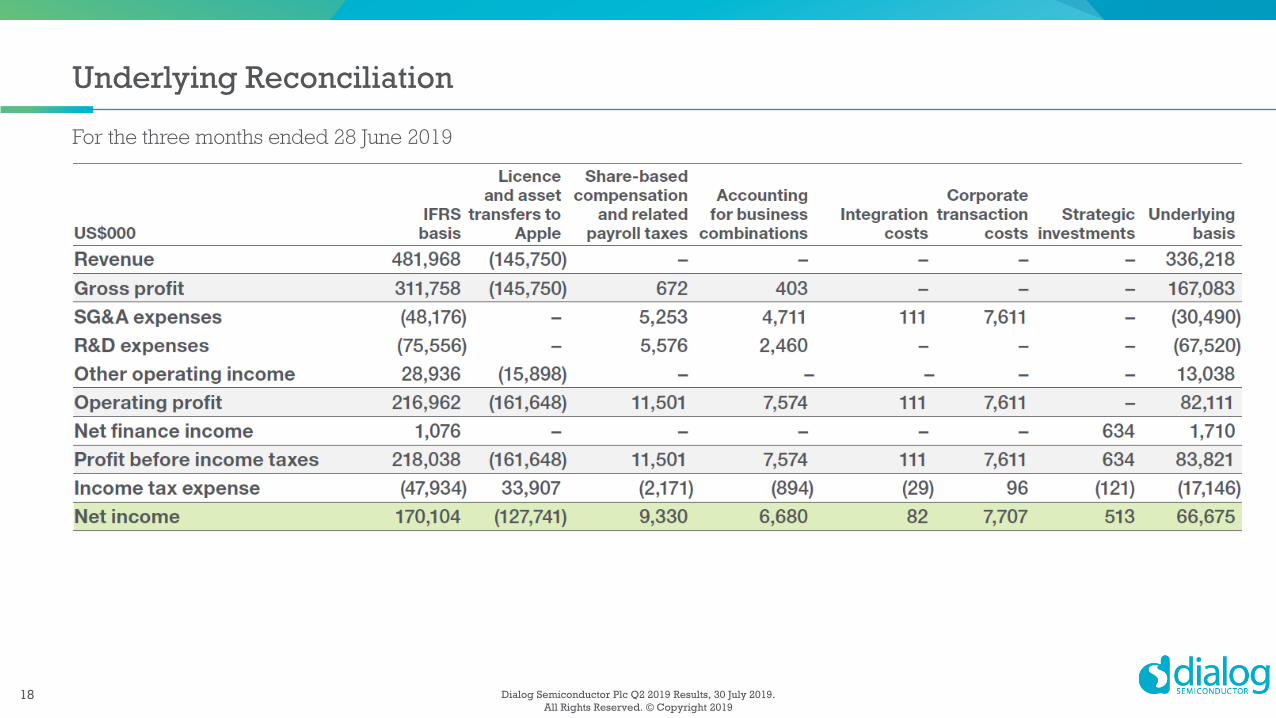
All Rights Reserved. © Copyright 2019 18
For the three months ended 28 June 2019
Underlying Reconciliation

Dialog Semiconductor Plc Q2 2019 Results, 30 July 2019.
All Rights Reserved. © Copyright 2019 19
For the three months ended 29 June 2018
Underlying Reconciliation

Dialog Semiconductor Plc Q2 2019 Results, 30 July 2019.
All Rights Reserved. © Copyright 2019 20
For the six months ended 28 June 2019
Underlying Reconciliation

Dialog Semiconductor Plc Q2 2019 Results, 30 July 2019.
All Rights Reserved. © Copyright 2019 21
For the six months ended 29 June 2018
Underlying Reconciliation

Dialog Semiconductor Plc Q2 2019 Results, 30 July 2019.
All Rights Reserved. © Copyright 2019 22
Business Segment Breakdown
Underlying Revenue Operating profit/(loss) Operating margin
$M Q2 2019 Q2 2018 Change Q2 2019 Q2 2018 Change Q2 2019 Q2 2018
Custom Mixed Signal 219.3 194.5 +13% 66.6 37.6 +77% 30.4% 19.3%
Advanced Mixed Signal 64.0 63.7 +1% 5.3 8.2 -35% 8.3% 12.8%
Connectivity & Audio 46.9 37.5 +25% 6.8 4.1 +67% 14.5% 10.9%
Total segments 330.2 295.7 +12% 78.7 49.8 +58% 23.8% 16.8%
Corporate activities 6.0 - - 3.5 (7.7) -
Total Group 336.2 295.7 +14% 82.1 42.1 +95% 24.4% 14.2%
Underlying Revenue Operating profit/(loss) Operating margin
$M H1 2019 H1 2018 Change H1 2019 H1 2018 Change H1 2019 H1 2018
Custom Mixed Signal 430.9 439.9 -2% 111.5 98.1 +14% 25.9% 22.3%
Advanced Mixed Signal 114.9 117.6 -2% 6.3 11.2 -44% 5.5% 9.5%
Connectivity & Audio 79.3 70.3 +13% 11.8 3.4 +241% 14.9% 4.9%
Total segments 625.1 627.8 -0.4% 129.6 112.7 +15% 20.7% 18.0%
Corporate activities 6.0 - - (0.3) (18.2) -
Total Group 631.1 627.8 +1% 129.3 94.5 +37% 20.5% 15.1%

Dialog Semiconductor Plc Q2 2019 Results, 30 July 2019.
All Rights Reserved. © Copyright 2019 23
Condensed Consolidated Statement of Income

Dialog Semiconductor Plc Q2 2019 Results, 30 July 2019.
All Rights Reserved. © Copyright 2019 24
Consolidated Balance Sheet – Total Assets
* Extracted from the Company’s audited consolidated financial statements for the year ended 31 December 2018.

Dialog Semiconductor Plc Q2 2019 Results, 30 July 2019.
All Rights Reserved. © Copyright 2019 25
Consolidated Balance Sheet – Total Liabilities and Equity
* Extracted from the Company’s audited consolidated financial statements for the year ended 31 December 2018.

Dialog Semiconductor Plc Q2 2019 Results, 30 July 2019.
All Rights Reserved. © Copyright 2019 26
Consolidated Cash Flow Statement

Dialog Semiconductor Plc Q2 2019 Results, 30 July 2019.
All Rights Reserved. © Copyright 2019 27
Consolidated Cash Flow Statement – Continued

Dialog Semiconductor Plc Q2 2019 Results, 30 July 2019.
All Rights Reserved. © Copyright 2019 28
Revenue – Historical Data
Full year revenue ($ million)
87162 218
296
527
774909
1,1561,355
1,1981,353
1,442
2007 2008 2009 2010 2011 2012 2013 2014 2015 2016 2017 2018
10% Revenue CAGR 2016-2018
14 14 25 3532 34 44 5236 45
5978
61 69 80 8898 116141
172166 160180
268
180
151
225
353
221 219
281
435
311 316 330
397
241 246
346365
271 256
363
464
332296
384
431
295
336
Q1 Q2 Q3 Q4
Quarterly underlying revenue
($ million)

Dialog Semiconductor Plc Q2 2019 Results, 30 July 2019.
All Rights Reserved. © Copyright 2019 29
Full Year Revenue by Business Segment
Revenue1 Profile $M
947 867
85 149
2017 2018
148245
2017 2018
138 154
2017 2018
Custom Mixed Signal (CMS) $M
Advanced Mixed Signal (AMS) $M
Connectivity & Audio (C&A) $M
YoY Movement
→ Increasing content and
extended range of
technologies at largest
customer
→ Higher rate of adoption of
CMICs and LED backlighting
products
→ Increasing adoption of
Bluetooth® low energy and
more complex audio solutions 77% 6 Apple 35-40% of Revenue 70% 6
321426
85
149
947867
2017 2018 2022E
1,3531,442
+75% YoYAMS, C&A,
automotive
products reported
in CMS, and
Corporate
CAGR5 10%-15%
Apple Sub-
PMICs3
and Other4
CAGR5 30%-35%
Apple Main
PMICs
Strategic Growth
Initiatives2
-8% YoY
+33% YoY
+7% YoY
1,0421,060
¹ Chart not drawn to scale
² Includes inorganic growth and new projects forecasted
to be awarded in 2019 and 20203 Sub-PMICs include newly awarded contracts.4 Other includes PMICs for Mac, accessories, audio
subsystem and charging ICs
5 Revenue CAGR from 2018E through 2022E based on
company projections6 Revenue from Apple recognised in Custom Mixed
Signal as a percentage of total Group revenue

Dialog Semiconductor Plc Q2 2019 Results, 30 July 2019.
All Rights Reserved. © Copyright 2019 30
10290
61
7078
64
61
9483
-100
-50
0
50
100
$0
$20
$40
$60
$80
$100
$120
$140
$160
$180
$200
Q2'17 Q3'17 Q4'17 Q1'18 Q2'18 Q3'18 Q4'18 Q1'19 Q2'19
Finished goods
Work in process
Raw materials
DIO
134
149
187
141
13%
45%
42%
150
25%
32%
43% 42%
35%
23%
▪ At the end of Q2 2019 inventory value was broadly in line with Q1 2019 and DIO decreased by 11 days
▪ In Q3 2019, we expect inventory value to increase from Q2 2019 due to seasonality and days of inventory to be below Q2 2019
Effective Inventory Management
Inventory ($ million) and Days Inventory Outstanding (# days)
23%
31%
46%
13%
43%
44%
3%
30%
67%
7%
36%
57%
12%
33%
54%
DIO (1)
Average DIO of 78 days
(1) Calculated using average
inventory balance over the period.
DIO recalculated in line with the
reclassification of certain R&D costs.
169
138
155
25%
32%
43%
156

Dialog Semiconductor Plc Q2 2019 Results, 30 July 2019.
All Rights Reserved. © Copyright 2019 31
Strong Cash Flow Generation
644 636479 501 537 617 678 690
1,141
Q2 2017 Q3 2017 Q4 2017 Q1 2018 Q2 2018 Q3 2018 Q4 2018 Q1 2019 Q2 2019
Cash and cash equivalents ($M)
Cash flow bridge from Q1’19 ($M)
▪ $1.1 billion cash and cash equivalents balance at 28 June 2019
▪ Q2 2019 cash flow from operating activities of $300 million (Q2 2018:$56 million)
▪ Q2 2019 free cash flow at $290 million (Q2 2018: $37 million)
▪ $600 million inflow from closing of Apple agreement
▪ $45 million outflow from closing of FCI acquisition
▪ Returning cash to shareholders:
▪ €100 million (US$112 million) returned to shareholders in Q2 2019
▪ New share buyback tranche launched under the 2019 Programme up to €150 million
689.5
239.9
(52.2) (10.9) 4.6 (22.6) 292.9
1,141.2

Dialog Semiconductor Plc Q2 2019 Results, 30 July 2019.
All Rights Reserved. © Copyright 2019 32
Investor Information
Analyst coverage
Alphavalue Hugo Paternoster
Bank of America Merrill
LynchAdithya Metuku
Bankhaus Lampe Dr. Karsten Iltgen
Barclays Capital Andrew Gardiner
Bloomberg Woo Jin Ho
Bryan, Garnier & Co Frédéric Yoboué
Credit Suisse Achal Sultania
Deutsche Bank Rob Sanders
DZ Bank Harald Schnitzer
Exane BNP Paribas David O’Connor
Hauck & Aufhauser Robin Brass
JP Morgan Cazenove Sandeep Deshpande
Kepler Cheuvreux Sebastien Sztabowicz
MainFirst Bank AG Juergen Wagner
ODDO BHF Stephane Houri
RBC Mitch Steves
Jose Cano
Head of Investor Relations
T: +44 (0)1793 756 961
ContactsFinancial PR/IR Advisers:
FTI Consulting – London
Matt Dixon
T: +44 (0)20 7831 3113
FTI Consulting – Frankfurt
Anja Meusel
T: +49 (0)69 9203 7120
Financial Calendar
06 November 2019 – Q3 Earnings Call
Key Events
London roadshow
30 July -31 July 2019
dbAccess European TMT Conference
6 September 2019, London
dbAccess Global TMT Conference
11 September 2019, Las Vegas
Baader Investment Conference
25 September 2019, Munich
Morgan Stanley European TMT Conference
13-15 November 2019, Barcelona

Powering the Smart Connected Future
© 2019 Dialog Semiconductor
Personal • Portable • Connected
www.dialogsemiconductor.com