DIAL: A Distributed Adaptive-Learning Routing Method in VDTNshs6ms/publishedPaper/... · learning...
12
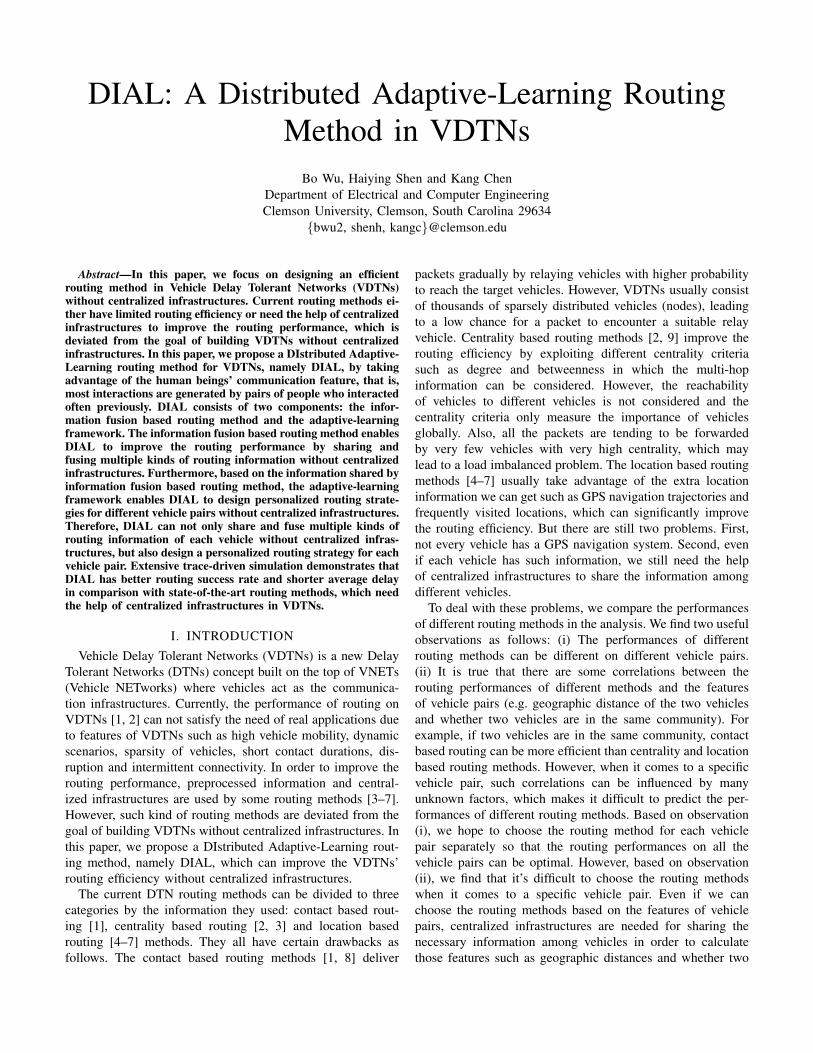
DIAL: A Distributed Adaptive-Learning Routing Method in VDTNs Bo Wu, Haiying Shen and Kang Chen Department of Electrical and Computer Engineering Clemson University, Clemson, South Carolina 29634 {bwu2, shenh, kangc}@clemson.edu Abstract—In this paper, we focus on designing an efficient routing method in Vehicle Delay Tolerant Networks (VDTNs) without centralized infrastructures. Current routing methods ei- ther have limited routing efficiency or need the help of centralized infrastructures to improve the routing performance, which is deviated from the goal of building VDTNs without centralized infrastructures. In this paper, we propose a DIstributed Adaptive- Learning routing method for VDTNs, namely DIAL, by taking advantage of the human beings’ communication feature, that is, most interactions are generated by pairs of people who interacted often previously. DIAL consists of two components: the infor- mation fusion based routing method and the adaptive-learning framework. The information fusion based routing method enables DIAL to improve the routing performance by sharing and fusing multiple kinds of routing information without centralized infrastructures. Furthermore, based on the information shared by information fusion based routing method, the adaptive-learning framework enables DIAL to design personalized routing strate- gies for different vehicle pairs without centralized infrastructures. Therefore, DIAL can not only share and fuse multiple kinds of routing information of each vehicle without centralized infras- tructures, but also design a personalized routing strategy for each vehicle pair. Extensive trace-driven simulation demonstrates that DIAL has better routing success rate and shorter average delay in comparison with state-of-the-art routing methods, which need the help of centralized infrastructures in VDTNs. I. INTRODUCTION Vehicle Delay Tolerant Networks (VDTNs) is a new Delay Tolerant Networks (DTNs) concept built on the top of VNETs (Vehicle NETworks) where vehicles act as the communica- tion infrastructures. Currently, the performance of routing on VDTNs [1, 2] can not satisfy the need of real applications due to features of VDTNs such as high vehicle mobility, dynamic scenarios, sparsity of vehicles, short contact durations, dis- ruption and intermittent connectivity. In order to improve the routing performance, preprocessed information and central- ized infrastructures are used by some routing methods [3–7]. However, such kind of routing methods are deviated from the goal of building VDTNs without centralized infrastructures. In this paper, we propose a DIstributed Adaptive-Learning rout- ing method, namely DIAL, which can improve the VDTNs’ routing efficiency without centralized infrastructures. The current DTN routing methods can be divided to three categories by the information they used: contact based rout- ing [1], centrality based routing [2, 3] and location based routing [4–7] methods. They all have certain drawbacks as follows. The contact based routing methods [1, 8] deliver packets gradually by relaying vehicles with higher probability to reach the target vehicles. However, VDTNs usually consist of thousands of sparsely distributed vehicles (nodes), leading to a low chance for a packet to encounter a suitable relay vehicle. Centrality based routing methods [2, 9] improve the routing efficiency by exploiting different centrality criteria such as degree and betweenness in which the multi-hop information can be considered. However, the reachability of vehicles to different vehicles is not considered and the centrality criteria only measure the importance of vehicles globally. Also, all the packets are tending to be forwarded by very few vehicles with very high centrality, which may lead to a load imbalanced problem. The location based routing methods [4–7] usually take advantage of the extra location information we can get such as GPS navigation trajectories and frequently visited locations, which can significantly improve the routing efficiency. But there are still two problems. First, not every vehicle has a GPS navigation system. Second, even if each vehicle has such information, we still need the help of centralized infrastructures to share the information among different vehicles. To deal with these problems, we compare the performances of different routing methods in the analysis. We find two useful observations as follows: (i) The performances of different routing methods can be different on different vehicle pairs. (ii) It is true that there are some correlations between the routing performances of different methods and the features of vehicle pairs (e.g. geographic distance of the two vehicles and whether two vehicles are in the same community). For example, if two vehicles are in the same community, contact based routing can be more efficient than centrality and location based routing methods. However, when it comes to a specific vehicle pair, such correlations can be influenced by many unknown factors, which makes it difficult to predict the per- formances of different routing methods. Based on observation (i), we hope to choose the routing method for each vehicle pair separately so that the routing performances on all the vehicle pairs can be optimal. However, based on observation (ii), we find that it’s difficult to choose the routing methods when it comes to a specific vehicle pair. Even if we can choose the routing methods based on the features of vehicle pairs, centralized infrastructures are needed for sharing the necessary information among vehicles in order to calculate those features such as geographic distances and whether two
Transcript of DIAL: A Distributed Adaptive-Learning Routing Method in VDTNshs6ms/publishedPaper/... · learning...
DIAL: A Distributed Adaptive-Learning RoutingMethod in VDTNs
Bo Wu, Haiying Shen and Kang ChenDepartment of Electrical and Computer EngineeringClemson University, Clemson, South Carolina 29634
{bwu2, shenh, kangc}@clemson.edu
Abstract—In this paper, we focus on designing an efficientrouting method in Vehicle Delay Tolerant Networks (VDTNs)without centralized infrastructures. Current routing methods ei-ther have limited routing efficiency or need the help of centralizedinfrastructures to improve the routing performance, which isdeviated from the goal of building VDTNs without centralizedinfrastructures. In this paper, we propose a DIstributed Adaptive-Learning routing method for VDTNs, namely DIAL, by takingadvantage of the human beings’ communication feature, that is,most interactions are generated by pairs of people who interactedoften previously. DIAL consists of two components: the infor-mation fusion based routing method and the adaptive-learningframework. The information fusion based routing method enablesDIAL to improve the routing performance by sharing andfusing multiple kinds of routing information without centralizedinfrastructures. Furthermore, based on the information shared byinformation fusion based routing method, the adaptive-learningframework enables DIAL to design personalized routing strate-gies for different vehicle pairs without centralized infrastructures.Therefore, DIAL can not only share and fuse multiple kinds ofrouting information of each vehicle without centralized infras-tructures, but also design a personalized routing strategy for eachvehicle pair. Extensive trace-driven simulation demonstrates thatDIAL has better routing success rate and shorter average delayin comparison with state-of-the-art routing methods, which needthe help of centralized infrastructures in VDTNs.
I. INTRODUCTIONVehicle Delay Tolerant Networks (VDTNs) is a new Delay
Tolerant Networks (DTNs) concept built on the top of VNETs(Vehicle NETworks) where vehicles act as the communica-tion infrastructures. Currently, the performance of routing onVDTNs [1, 2] can not satisfy the need of real applications dueto features of VDTNs such as high vehicle mobility, dynamicscenarios, sparsity of vehicles, short contact durations, dis-ruption and intermittent connectivity. In order to improve therouting performance, preprocessed information and central-ized infrastructures are used by some routing methods [3–7].However, such kind of routing methods are deviated from thegoal of building VDTNs without centralized infrastructures. Inthis paper, we propose a DIstributed Adaptive-Learning rout-ing method, namely DIAL, which can improve the VDTNs’routing efficiency without centralized infrastructures.
The current DTN routing methods can be divided to threecategories by the information they used: contact based rout-ing [1], centrality based routing [2, 3] and location basedrouting [4–7] methods. They all have certain drawbacks asfollows. The contact based routing methods [1, 8] deliver
packets gradually by relaying vehicles with higher probabilityto reach the target vehicles. However, VDTNs usually consistof thousands of sparsely distributed vehicles (nodes), leadingto a low chance for a packet to encounter a suitable relayvehicle. Centrality based routing methods [2, 9] improve therouting efficiency by exploiting different centrality criteriasuch as degree and betweenness in which the multi-hopinformation can be considered. However, the reachabilityof vehicles to different vehicles is not considered and thecentrality criteria only measure the importance of vehiclesglobally. Also, all the packets are tending to be forwardedby very few vehicles with very high centrality, which maylead to a load imbalanced problem. The location based routingmethods [4–7] usually take advantage of the extra locationinformation we can get such as GPS navigation trajectories andfrequently visited locations, which can significantly improvethe routing efficiency. But there are still two problems. First,not every vehicle has a GPS navigation system. Second, evenif each vehicle has such information, we still need the helpof centralized infrastructures to share the information amongdifferent vehicles.
To deal with these problems, we compare the performancesof different routing methods in the analysis. We find two usefulobservations as follows: (i) The performances of differentrouting methods can be different on different vehicle pairs.(ii) It is true that there are some correlations between therouting performances of different methods and the featuresof vehicle pairs (e.g. geographic distance of the two vehiclesand whether two vehicles are in the same community). Forexample, if two vehicles are in the same community, contactbased routing can be more efficient than centrality and locationbased routing methods. However, when it comes to a specificvehicle pair, such correlations can be influenced by manyunknown factors, which makes it difficult to predict the per-formances of different routing methods. Based on observation(i), we hope to choose the routing method for each vehiclepair separately so that the routing performances on all thevehicle pairs can be optimal. However, based on observation(ii), we find that it’s difficult to choose the routing methodswhen it comes to a specific vehicle pair. Even if we canchoose the routing methods based on the features of vehiclepairs, centralized infrastructures are needed for sharing thenecessary information among vehicles in order to calculatethose features such as geographic distances and whether two
Information fusion
A
B
A
C B
D
C
D
Current method
A B
A B
A B
A B
Time
1
2
3
4
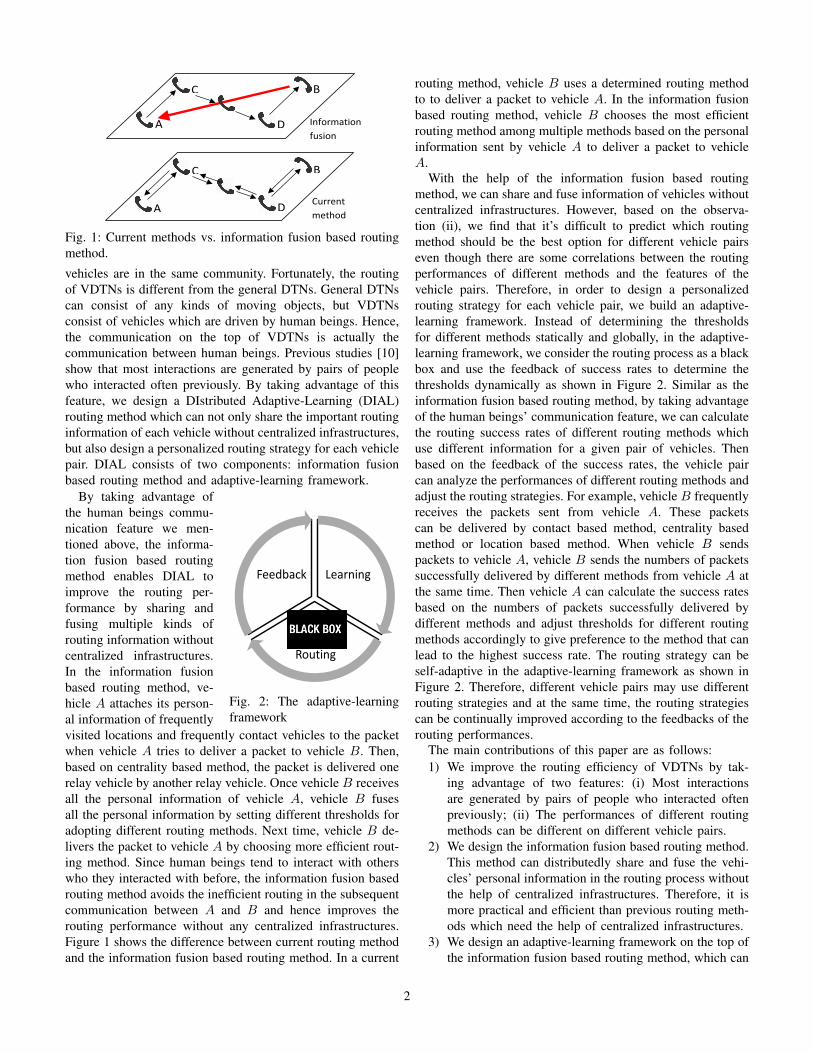
Fig. 1: Current methods vs. information fusion based routingmethod.
vehicles are in the same community. Fortunately, the routingof VDTNs is different from the general DTNs. General DTNscan consist of any kinds of moving objects, but VDTNsconsist of vehicles which are driven by human beings. Hence,the communication on the top of VDTNs is actually thecommunication between human beings. Previous studies [10]show that most interactions are generated by pairs of peoplewho interacted often previously. By taking advantage of thisfeature, we design a DIstributed Adaptive-Learning (DIAL)routing method which can not only share the important routinginformation of each vehicle without centralized infrastructures,but also design a personalized routing strategy for each vehiclepair. DIAL consists of two components: information fusionbased routing method and adaptive-learning framework.
Learning
Routing
Feedback
Fig. 2: The adaptive-learningframework
By taking advantage ofthe human beings commu-nication feature we men-tioned above, the informa-tion fusion based routingmethod enables DIAL toimprove the routing per-formance by sharing andfusing multiple kinds ofrouting information withoutcentralized infrastructures.In the information fusionbased routing method, ve-hicle A attaches its person-al information of frequentlyvisited locations and frequently contact vehicles to the packetwhen vehicle A tries to deliver a packet to vehicle B. Then,based on centrality based method, the packet is delivered onerelay vehicle by another relay vehicle. Once vehicle B receivesall the personal information of vehicle A, vehicle B fusesall the personal information by setting different thresholds foradopting different routing methods. Next time, vehicle B de-livers the packet to vehicle A by choosing more efficient rout-ing method. Since human beings tend to interact with otherswho they interacted with before, the information fusion basedrouting method avoids the inefficient routing in the subsequentcommunication between A and B and hence improves therouting performance without any centralized infrastructures.Figure 1 shows the difference between current routing methodand the information fusion based routing method. In a current
routing method, vehicle B uses a determined routing methodto to deliver a packet to vehicle A. In the information fusionbased routing method, vehicle B chooses the most efficientrouting method among multiple methods based on the personalinformation sent by vehicle A to deliver a packet to vehicleA.
With the help of the information fusion based routingmethod, we can share and fuse information of vehicles withoutcentralized infrastructures. However, based on the observa-tion (ii), we find that it’s difficult to predict which routingmethod should be the best option for different vehicle pairseven though there are some correlations between the routingperformances of different methods and the features of thevehicle pairs. Therefore, in order to design a personalizedrouting strategy for each vehicle pair, we build an adaptive-learning framework. Instead of determining the thresholdsfor different methods statically and globally, in the adaptive-learning framework, we consider the routing process as a blackbox and use the feedback of success rates to determine thethresholds dynamically as shown in Figure 2. Similar as theinformation fusion based routing method, by taking advantageof the human beings’ communication feature, we can calculatethe routing success rates of different routing methods whichuse different information for a given pair of vehicles. Thenbased on the feedback of the success rates, the vehicle paircan analyze the performances of different routing methods andadjust the routing strategies. For example, vehicle B frequentlyreceives the packets sent from vehicle A. These packetscan be delivered by contact based method, centrality basedmethod or location based method. When vehicle B sendspackets to vehicle A, vehicle B sends the numbers of packetssuccessfully delivered by different methods from vehicle A atthe same time. Then vehicle A can calculate the success ratesbased on the numbers of packets successfully delivered bydifferent methods and adjust thresholds for different routingmethods accordingly to give preference to the method that canlead to the highest success rate. The routing strategy can beself-adaptive in the adaptive-learning framework as shown inFigure 2. Therefore, different vehicle pairs may use differentrouting strategies and at the same time, the routing strategiescan be continually improved according to the feedbacks of therouting performances.
The main contributions of this paper are as follows:1) We improve the routing efficiency of VDTNs by tak-
ing advantage of two features: (i) Most interactionsare generated by pairs of people who interacted oftenpreviously; (ii) The performances of different routingmethods can be different on different vehicle pairs.
2) We design the information fusion based routing method.This method can distributedly share and fuse the vehi-cles’ personal information in the routing process withoutthe help of centralized infrastructures. Therefore, it ismore practical and efficient than previous routing meth-ods which need the help of centralized infrastructures.
3) We design an adaptive-learning framework on the top ofthe information fusion based routing method, which can
2
design different routing strategies for different vehiclepairs for more efficient VDTN routing than the basicinformation fusion based routing method.
The rest of this paper is organized as follows. Section IIpresents the related work. Section III explains the rationaleof DIAL by measuring the routing performances of differentmethods, analyzing the reason and discussing the solution.Section IV introduces the detailed design of DIAL. In Sec-tion V, the performance of DIAL is evaluated by trace-drivenexperiments. Section VI summarizes the paper with remarkson our future work.
II. RELATED WORK
Based on the methods to access the routing information,the current routing methods can be divided to two categories:distributed routing method (which accesses the routing infor-mation distributedly) and centralized routing method (whichaccesses the routing information with the help of central-ized infrastructures). In the category of distributed routingmethod, PROPHET [1] simply selects vehicles with higherencounter frequency with target vehicles for relaying packets.PeopleRank [2] is inspired by the PageRank algorithm, whichcalculates the rank of vehicles and forwards packets to thevehicles with higher ranks. In the category of centralizedrouting method, SimBet [3] identifies some bridge nodesas relay nodes which can better connect the VNETs bycentrality characteristics to relay packets. AAR [4] definesthe frequently visited locations of each vehicle and tries todeliver the packets to the frequently visited locations of targetvehicles. GeOpps [5] directly obtains the future location of thetarget vehicle from GPS data and spreads packets to certaingeographical locations for routing opportunities through theshortest paths. GeoDTN [6] encodes historical geographicalmovement information in a vector to predict the possibilitythat two vehicles become neighbors. DTN-FLOW [7] dividesthe map to different areas and predicts the future visiting areaof vehicles, which improves the routing performance since itis much easier to predict the future visiting areas than exactfuture locations.
Based on the type of information applied, the above routingmethods can be divided to three categories: contact basedrouting method, centrality based routing method and locationbased routing method as we mentioned in Section I. In theabove introduced methods, PROPHET [1] belongs to thecontact based routing method; PeopleRank [2] and SimBet [3]belong to the centrality based routing method; AAR [4],GeOpps [5], GeoDTN [6] and DTN-FLOW [7] belong to thelocation based routing method. These methods have certaindrawbacks as indicated in Section I.
III. RATIONALE
There are many works comparing the overall performancesof different routing methods. However, there lacks a com-prehensive analysis when it comes to the performances ofdifferent vehicle pairs with different features. Therefore, inthis section, we measure the success rates of different routing
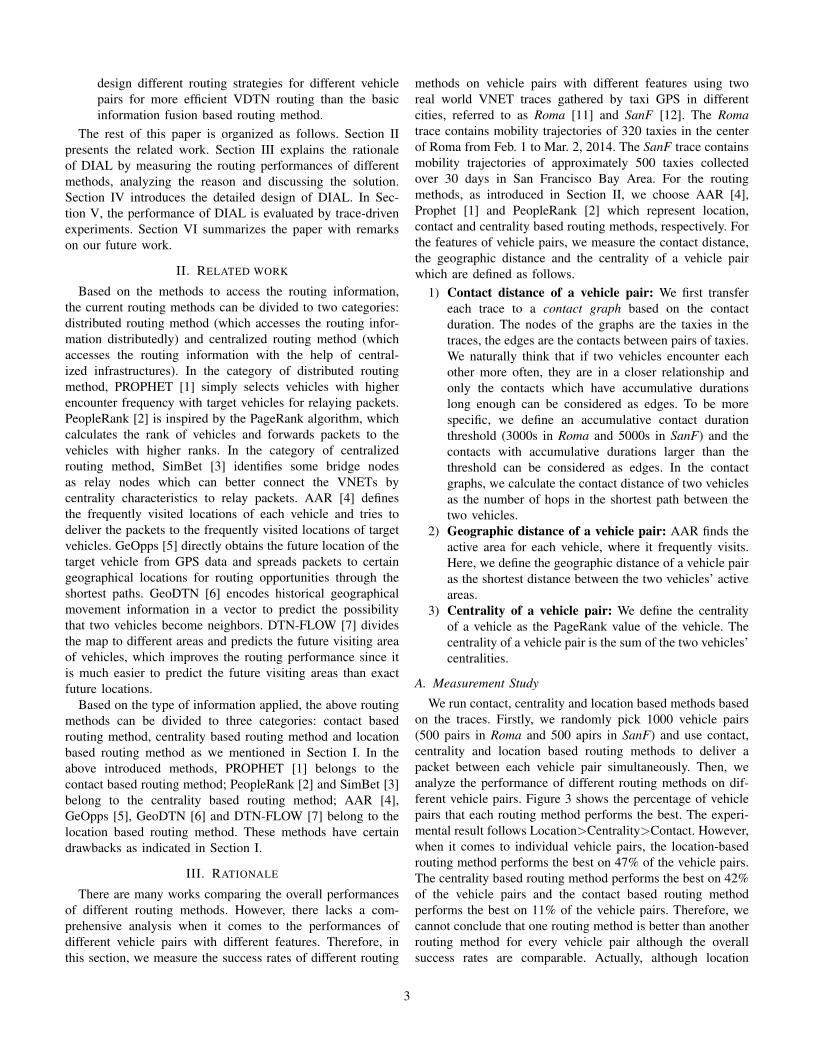
methods on vehicle pairs with different features using tworeal world VNET traces gathered by taxi GPS in differentcities, referred to as Roma [11] and SanF [12]. The Romatrace contains mobility trajectories of 320 taxies in the centerof Roma from Feb. 1 to Mar. 2, 2014. The SanF trace containsmobility trajectories of approximately 500 taxies collectedover 30 days in San Francisco Bay Area. For the routingmethods, as introduced in Section II, we choose AAR [4],Prophet [1] and PeopleRank [2] which represent location,contact and centrality based routing methods, respectively. Forthe features of vehicle pairs, we measure the contact distance,the geographic distance and the centrality of a vehicle pairwhich are defined as follows.
1) Contact distance of a vehicle pair: We first transfereach trace to a contact graph based on the contactduration. The nodes of the graphs are the taxies in thetraces, the edges are the contacts between pairs of taxies.We naturally think that if two vehicles encounter eachother more often, they are in a closer relationship andonly the contacts which have accumulative durationslong enough can be considered as edges. To be morespecific, we define an accumulative contact durationthreshold (3000s in Roma and 5000s in SanF) and thecontacts with accumulative durations larger than thethreshold can be considered as edges. In the contactgraphs, we calculate the contact distance of two vehiclesas the number of hops in the shortest path between thetwo vehicles.
2) Geographic distance of a vehicle pair: AAR finds theactive area for each vehicle, where it frequently visits.Here, we define the geographic distance of a vehicle pairas the shortest distance between the two vehicles’ activeareas.
3) Centrality of a vehicle pair: We define the centralityof a vehicle as the PageRank value of the vehicle. Thecentrality of a vehicle pair is the sum of the two vehicles’centralities.
A. Measurement Study
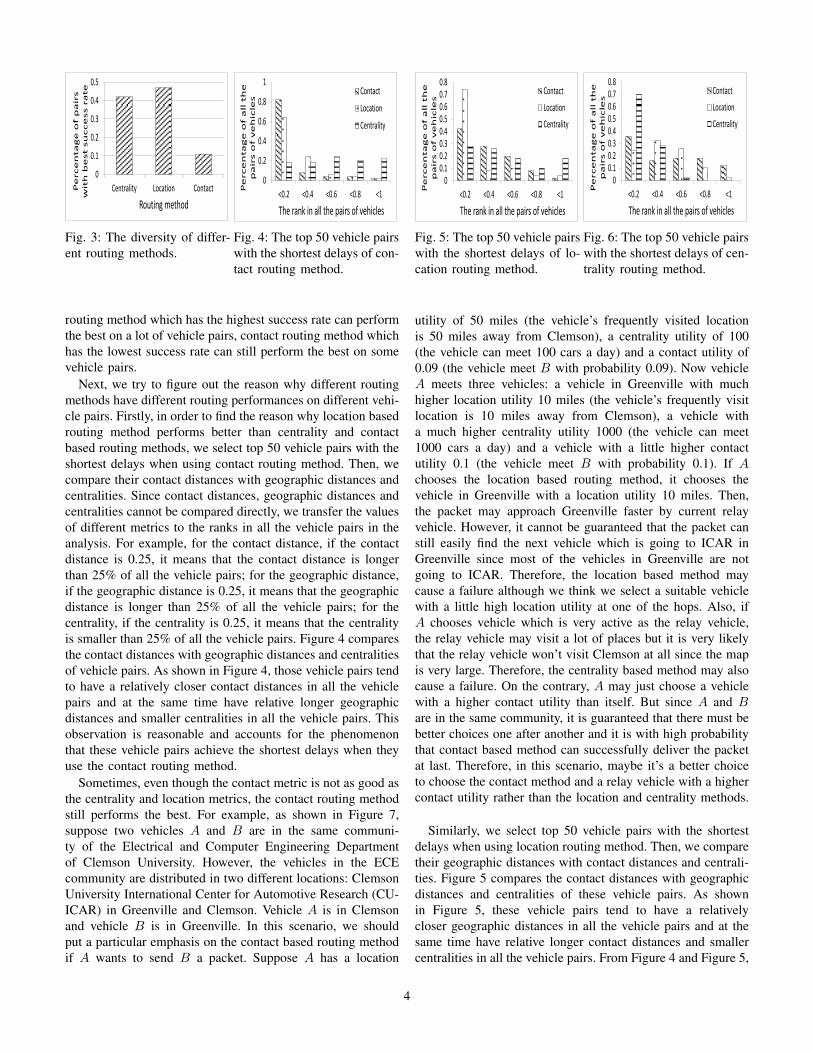
We run contact, centrality and location based methods basedon the traces. Firstly, we randomly pick 1000 vehicle pairs(500 pairs in Roma and 500 apirs in SanF) and use contact,centrality and location based routing methods to deliver apacket between each vehicle pair simultaneously. Then, weanalyze the performance of different routing methods on dif-ferent vehicle pairs. Figure 3 shows the percentage of vehiclepairs that each routing method performs the best. The experi-mental result follows Location>Centrality>Contact. However,when it comes to individual vehicle pairs, the location-basedrouting method performs the best on 47% of the vehicle pairs.The centrality based routing method performs the best on 42%of the vehicle pairs and the contact based routing methodperforms the best on 11% of the vehicle pairs. Therefore, wecannot conclude that one routing method is better than anotherrouting method for every vehicle pair although the overallsuccess rates are comparable. Actually, although location
3
0
0.1
0.2
0.3
0.4
0.5
Centrality Location ContactPe
rce
nta
ge
of p
air
s
wit
h b
est s
ucce
ss r
ate
Routing method
Fig. 3: The diversity of differ-ent routing methods.
0
0.2
0.4
0.6
0.8
1
<0.2 <0.4 <0.6 <0.8 <1
Pe
rce
nta
ge
of a
ll t
he
p
air
s o
f v
eh
icle
s
The rank in all the pairs of vehicles
Contact
Location
Centrality
Fig. 4: The top 50 vehicle pairswith the shortest delays of con-tact routing method.
routing method which has the highest success rate can performthe best on a lot of vehicle pairs, contact routing method whichhas the lowest success rate can still perform the best on somevehicle pairs.
Next, we try to figure out the reason why different routingmethods have different routing performances on different vehi-cle pairs. Firstly, in order to find the reason why location basedrouting method performs better than centrality and contactbased routing methods, we select top 50 vehicle pairs with theshortest delays when using contact routing method. Then, wecompare their contact distances with geographic distances andcentralities. Since contact distances, geographic distances andcentralities cannot be compared directly, we transfer the valuesof different metrics to the ranks in all the vehicle pairs in theanalysis. For example, for the contact distance, if the contactdistance is 0.25, it means that the contact distance is longerthan 25% of all the vehicle pairs; for the geographic distance,if the geographic distance is 0.25, it means that the geographicdistance is longer than 25% of all the vehicle pairs; for thecentrality, if the centrality is 0.25, it means that the centralityis smaller than 25% of all the vehicle pairs. Figure 4 comparesthe contact distances with geographic distances and centralitiesof vehicle pairs. As shown in Figure 4, those vehicle pairs tendto have a relatively closer contact distances in all the vehiclepairs and at the same time have relative longer geographicdistances and smaller centralities in all the vehicle pairs. Thisobservation is reasonable and accounts for the phenomenonthat these vehicle pairs achieve the shortest delays when theyuse the contact routing method.
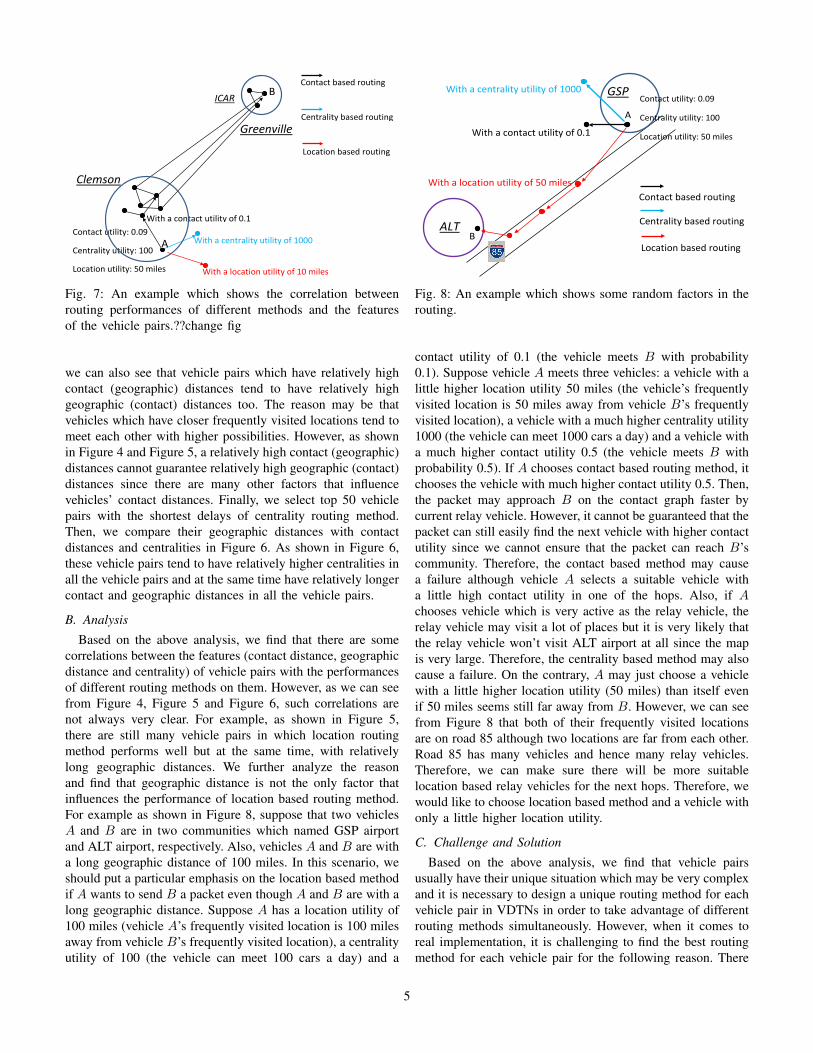
Sometimes, even though the contact metric is not as good asthe centrality and location metrics, the contact routing methodstill performs the best. For example, as shown in Figure 7,suppose two vehicles A and B are in the same communi-ty of the Electrical and Computer Engineering Departmentof Clemson University. However, the vehicles in the ECEcommunity are distributed in two different locations: ClemsonUniversity International Center for Automotive Research (CU-ICAR) in Greenville and Clemson. Vehicle A is in Clemsonand vehicle B is in Greenville. In this scenario, we shouldput a particular emphasis on the contact based routing methodif A wants to send B a packet. Suppose A has a location
00.10.20.30.40.50.60.70.8
<0.2 <0.4 <0.6 <0.8 <1
Pe
rce
nta
ge
of a
ll t
he
p
air
s o
f v
eh
icle
s
The rank in all the pairs of vehicles
Contact
Location
Centrality
Fig. 5: The top 50 vehicle pairswith the shortest delays of lo-cation routing method.
00.10.20.30.40.50.60.70.8
<0.2 <0.4 <0.6 <0.8 <1
Pe
rce
nta
ge
of a
ll t
he
p
air
s o
f v
eh
icle
s
The rank in all the pairs of vehicles
Contact
Location
Centrality
Fig. 6: The top 50 vehicle pairswith the shortest delays of cen-trality routing method.
utility of 50 miles (the vehicle’s frequently visited locationis 50 miles away from Clemson), a centrality utility of 100(the vehicle can meet 100 cars a day) and a contact utility of0.09 (the vehicle meet B with probability 0.09). Now vehicleA meets three vehicles: a vehicle in Greenville with muchhigher location utility 10 miles (the vehicle’s frequently visitlocation is 10 miles away from Clemson), a vehicle witha much higher centrality utility 1000 (the vehicle can meet1000 cars a day) and a vehicle with a little higher contactutility 0.1 (the vehicle meet B with probability 0.1). If Achooses the location based routing method, it chooses thevehicle in Greenville with a location utility 10 miles. Then,the packet may approach Greenville faster by current relayvehicle. However, it cannot be guaranteed that the packet canstill easily find the next vehicle which is going to ICAR inGreenville since most of the vehicles in Greenville are notgoing to ICAR. Therefore, the location based method maycause a failure although we think we select a suitable vehiclewith a little high location utility at one of the hops. Also, ifA chooses vehicle which is very active as the relay vehicle,the relay vehicle may visit a lot of places but it is very likelythat the relay vehicle won’t visit Clemson at all since the mapis very large. Therefore, the centrality based method may alsocause a failure. On the contrary, A may just choose a vehiclewith a higher contact utility than itself. But since A and Bare in the same community, it is guaranteed that there must bebetter choices one after another and it is with high probabilitythat contact based method can successfully deliver the packetat last. Therefore, in this scenario, maybe it’s a better choiceto choose the contact method and a relay vehicle with a highercontact utility rather than the location and centrality methods.
Similarly, we select top 50 vehicle pairs with the shortestdelays when using location routing method. Then, we comparetheir geographic distances with contact distances and centrali-ties. Figure 5 compares the contact distances with geographicdistances and centralities of these vehicle pairs. As shownin Figure 5, these vehicle pairs tend to have a relativelycloser geographic distances in all the vehicle pairs and at thesame time have relative longer contact distances and smallercentralities in all the vehicle pairs. From Figure 4 and Figure 5,
4
With a location utility of 10 miles
With a centrality utility of 1000
With a contact utility of 0.1 Contact utility: 0.09
Centrality utility: 100
Location utility: 50 miles
Greenville
Clemson
ICAR B
A
Contact based routing
Centrality based routing
Location based routing
Fig. 7: An example which shows the correlation betweenrouting performances of different methods and the featuresof the vehicle pairs.??change fig
we can also see that vehicle pairs which have relatively highcontact (geographic) distances tend to have relatively highgeographic (contact) distances too. The reason may be thatvehicles which have closer frequently visited locations tend tomeet each other with higher possibilities. However, as shownin Figure 4 and Figure 5, a relatively high contact (geographic)distances cannot guarantee relatively high geographic (contact)distances since there are many other factors that influencevehicles’ contact distances. Finally, we select top 50 vehiclepairs with the shortest delays of centrality routing method.Then, we compare their geographic distances with contactdistances and centralities in Figure 6. As shown in Figure 6,these vehicle pairs tend to have relatively higher centralities inall the vehicle pairs and at the same time have relatively longercontact and geographic distances in all the vehicle pairs.
B. Analysis
Based on the above analysis, we find that there are somecorrelations between the features (contact distance, geographicdistance and centrality) of vehicle pairs with the performancesof different routing methods on them. However, as we can seefrom Figure 4, Figure 5 and Figure 6, such correlations arenot always very clear. For example, as shown in Figure 5,there are still many vehicle pairs in which location routingmethod performs well but at the same time, with relativelylong geographic distances. We further analyze the reasonand find that geographic distance is not the only factor thatinfluences the performance of location based routing method.For example as shown in Figure 8, suppose that two vehiclesA and B are in two communities which named GSP airportand ALT airport, respectively. Also, vehicles A and B are witha long geographic distance of 100 miles. In this scenario, weshould put a particular emphasis on the location based methodif A wants to send B a packet even though A and B are with along geographic distance. Suppose A has a location utility of100 miles (vehicle A’s frequently visited location is 100 milesaway from vehicle B’s frequently visited location), a centralityutility of 100 (the vehicle can meet 100 cars a day) and a
GSP
ALT
With a location utility of 50 miles
With a contact utility of 0.1
With a centrality utility of 1000 Contact utility: 0.09
Centrality utility: 100
Location utility: 50 miles
A
B
Contact based routing
Centrality based routing
Location based routing
Fig. 8: An example which shows some random factors in therouting.
contact utility of 0.1 (the vehicle meets B with probability0.1). Suppose vehicle A meets three vehicles: a vehicle with alittle higher location utility 50 miles (the vehicle’s frequentlyvisited location is 50 miles away from vehicle B’s frequentlyvisited location), a vehicle with a much higher centrality utility1000 (the vehicle can meet 1000 cars a day) and a vehicle witha much higher contact utility 0.5 (the vehicle meets B withprobability 0.5). If A chooses contact based routing method, itchooses the vehicle with much higher contact utility 0.5. Then,the packet may approach B on the contact graph faster bycurrent relay vehicle. However, it cannot be guaranteed that thepacket can still easily find the next vehicle with higher contactutility since we cannot ensure that the packet can reach B’scommunity. Therefore, the contact based method may causea failure although vehicle A selects a suitable vehicle witha little high contact utility in one of the hops. Also, if Achooses vehicle which is very active as the relay vehicle, therelay vehicle may visit a lot of places but it is very likely thatthe relay vehicle won’t visit ALT airport at all since the mapis very large. Therefore, the centrality based method may alsocause a failure. On the contrary, A may just choose a vehiclewith a little higher location utility (50 miles) than itself evenif 50 miles seems still far away from B. However, we can seefrom Figure 8 that both of their frequently visited locationsare on road 85 although two locations are far from each other.Road 85 has many vehicles and hence many relay vehicles.Therefore, we can make sure there will be more suitablelocation based relay vehicles for the next hops. Therefore, wewould like to choose location based method and a vehicle withonly a little higher location utility.
C. Challenge and Solution
Based on the above analysis, we find that vehicle pairsusually have their unique situation which may be very complexand it is necessary to design a unique routing method for eachvehicle pair in VDTNs in order to take advantage of differentrouting methods simultaneously. However, when it comes toreal implementation, it is challenging to find the best routingmethod for each vehicle pair for the following reason. There
5
are many factors which can influence the performances ofdifferent routing methods. It is impossible for us to designcorresponding strategy for each of them. Furthermore, evenif we can list as many as factors and design correspondingstrategy for each of them, it still will not be the best waysince the situation for each vehicle pair is a combination ofdifferent factors.
In order to solve the problem, first of all, we give athreshold to the corresponding utility of each routing method.In addition, to continually send packets to relay vehicles withhigher the same kind of utility, the first relay vehicle (so asthe following relay vehicles) must have a utility larger thanthe corresponding threshold. A higher threshold means thecorresponding routing method is less suitable for the vehiclepair and we won’t choose it unless the current encounteredvehicle has a relatively high routing utility (i.e., has very highchance to deliver the packet). A lower threshold means thecorresponding routing method is more suitable for the vehiclepair. Therefore, although the current encountered vehicle maynot have very high chance to deliver the packet, there must bemore chances in the future.
Then, we ignore the detailed factors in the micro-scope andonly focus on the routing success rates of different routingmethods. We believe that a higher success rate can reflect theunderestimate of the corresponding method in the system andhence we can decrease the threshold of the method. On thecontrary, we can also increase the threshold of the method.In order to calculate the threshold, we let the target vehiclerecord the numbers of successfully delivered copies deliveredby different routing methods and let the source vehicle recordthe numbers of copies delivered by different routing methods.Once the target vehicle receives the copies, it sends a packetto the source vehicle with the information of successfullydelivered copies delivered by different routing methods. In thisway, we can jump over the difficulty of analyzing differentfactors from a micro-scope and at the same time, each vehiclepair can learn its own optimized thresholds continually.
IV. SYSTEM DESIGN
Before introducing the detailed design of DIAL, we firstgive an overview of DIAL. DIAL consists of two components:information fusion based routing method and adaptive-learningframework. As we introduced in Section II, in order to improvethe routing performance, current routing methods take advan-tage of the information shared by centralized infrastructures,which is deviated from the initial goal of building DTNs.By taking advantage of the human beings’ communicationfeature mentioned above, the information fusion based routingmethod enables DIAL to improve the routing performanceby sharing and fusing multiple kinds of routing informationwithout centralized infrastructures. First, two vehicles adoptcentrality based method to achieve the first communication.In the first communication, two vehicles store the frequentlyvisited locations and frequently encountered vehicles of eachother. Then, when the two vehicles need to communicateagain, based on more detailed information of target vehicle
which includes the frequently visited locations and frequentlyencountered vehicle, they choose the best routing methodfor communication. At the same time, the information ofthe frequently visited locations and frequently encounteredvehicles of target vehicle is updated from time to time duringthe communication. Therefore, the information fusion basedrouting method can share multiple kinds of routing informationof vehicles in the network and choose different routing methodto deliver packets based on the different information. At thesame time, in order to balance the numbers of copies of apacket sent by different routing methods and optimize therouting performance, we set each routing method with athreshold of utility based on the overall routing efficiency ofthe method. In each routing method, the selected relay vehiclesnot only need to have a higher utility of the correspondingmethod than the previous relay vehicles, but also need to havea higher utility than the corresponding threshold of the method.
In information fusion based routing method, the thresholdsfor different methods are static. However, from observation(i), the performances of different methods can be differenton different vehicle pairs. Therefore, we design an adaptive-learning framework which further enables DIAL to design per-sonalized routing strategies for different vehicle pairs withoutcentralized infrastructures. Similar as the information fusionbased routing method, by taking advantage of the humanbeings’ communication feature, we can calculate the routingsuccess rates of different routing methods which use differentinformation. Then, based on the feedback of the success rates,we can analyze the performances of different routing methodsand adjust the routing strategies. For example, vehicle Bfrequently receives the packets sent from vehicle A. Thesepackets can be delivered by contact based method, centralitybased method or location based method. When vehicle B send-s packets to vehicle A, vehicle B sends the numbers of packetssuccessfully delivered by different methods from vehicle A inthe last time. Then, vehicle A can calculate the success ratesbased on the numbers of packets successfully delivered bydifferent methods and adjust thresholds for different routingmethods accordingly to give preference to the method thatcan lead to the highest success rate. The routing strategy canbe self-adaptive in the adaptive-learning framework as shownin Figure 2. Therefore, we can determine different routingstrategies for different vehicle pairs and at the same time therouting strategies can be adaptively changed according to thefeedbacks of the routing performances.
In the following part of this section, we introduce the detailsof the information fusion based routing method and adaptive-learning framework, respectively.
A. Information Fusion based Routing Method
In the information fusion based routing method, we firstintroduce the initial routing method of delivering a packet fromvehicle A to vehicle B when vehicle A and vehicle B nevercommunicated before. Then, we introduce a data structure onvehicle B named address book which stores the frequentlyvisited locations and frequently encountered vehicles of vehi-
6
Vehicle ID Location Contact 1 LTable ① CTable ① 2 LTable ② CTable ② 3 LTable ③ CTable ③ 4 LTable ④ CTable ④
……
Vehicle ID Encounter frequency
7 0.1 8 0.3 9 0.2
10 0.4 ……
Location Visited frequency Road a 1 Road b 1
Road c 2 Road d 1
……
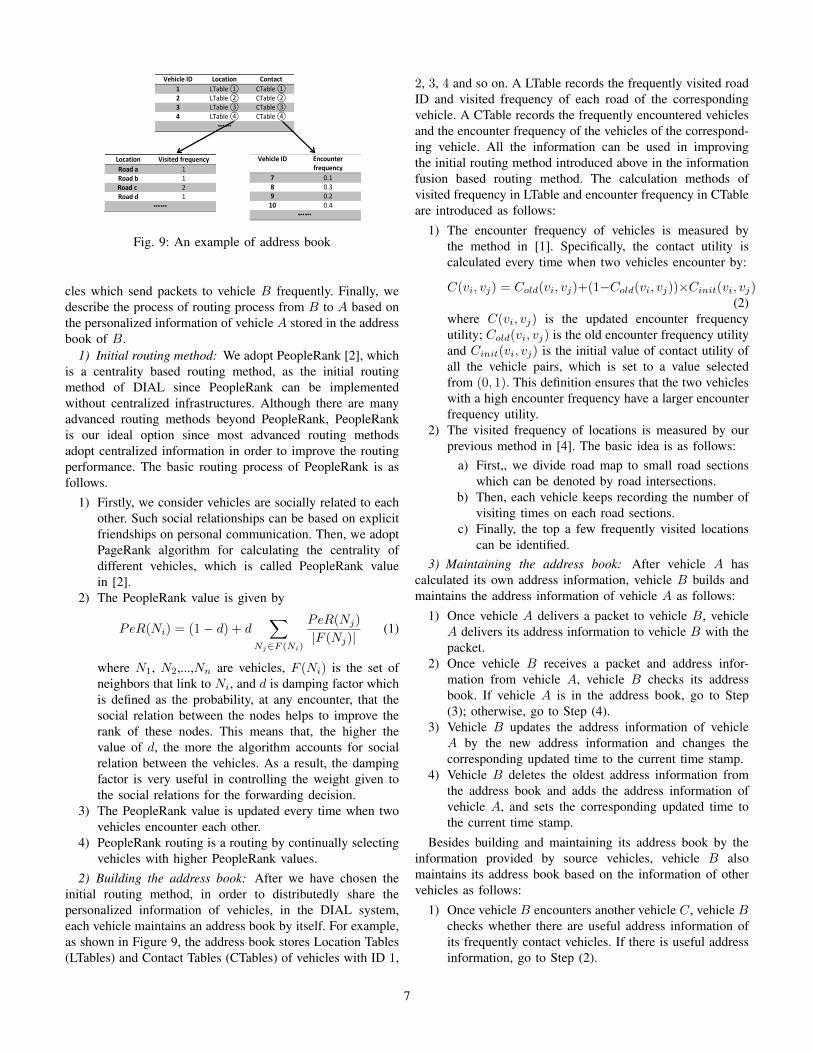
Fig. 9: An example of address book
cles which send packets to vehicle B frequently. Finally, wedescribe the process of routing process from B to A based onthe personalized information of vehicle A stored in the addressbook of B.
1) Initial routing method: We adopt PeopleRank [2], whichis a centrality based routing method, as the initial routingmethod of DIAL since PeopleRank can be implementedwithout centralized infrastructures. Although there are manyadvanced routing methods beyond PeopleRank, PeopleRankis our ideal option since most advanced routing methodsadopt centralized information in order to improve the routingperformance. The basic routing process of PeopleRank is asfollows.
1) Firstly, we consider vehicles are socially related to eachother. Such social relationships can be based on explicitfriendships on personal communication. Then, we adoptPageRank algorithm for calculating the centrality ofdifferent vehicles, which is called PeopleRank valuein [2].
2) The PeopleRank value is given by
PeR(Ni) = (1− d) + d∑
Nj∈F (Ni)
PeR(Nj)
|F (Nj)|(1)
where N1, N2,...,Nn are vehicles, F (Ni) is the set ofneighbors that link to Ni, and d is damping factor whichis defined as the probability, at any encounter, that thesocial relation between the nodes helps to improve therank of these nodes. This means that, the higher thevalue of d, the more the algorithm accounts for socialrelation between the vehicles. As a result, the dampingfactor is very useful in controlling the weight given tothe social relations for the forwarding decision.
3) The PeopleRank value is updated every time when twovehicles encounter each other.
4) PeopleRank routing is a routing by continually selectingvehicles with higher PeopleRank values.
2) Building the address book: After we have chosen theinitial routing method, in order to distributedly share thepersonalized information of vehicles, in the DIAL system,each vehicle maintains an address book by itself. For example,as shown in Figure 9, the address book stores Location Tables(LTables) and Contact Tables (CTables) of vehicles with ID 1,
2, 3, 4 and so on. A LTable records the frequently visited roadID and visited frequency of each road of the correspondingvehicle. A CTable records the frequently encountered vehiclesand the encounter frequency of the vehicles of the correspond-ing vehicle. All the information can be used in improvingthe initial routing method introduced above in the informationfusion based routing method. The calculation methods ofvisited frequency in LTable and encounter frequency in CTableare introduced as follows:
1) The encounter frequency of vehicles is measured bythe method in [1]. Specifically, the contact utility iscalculated every time when two vehicles encounter by:
C(vi, vj) = Cold(vi, vj)+(1−Cold(vi, vj))×Cinit(vi, vj)(2)
where C(vi, vj) is the updated encounter frequencyutility; Cold(vi, vj) is the old encounter frequency utilityand Cinit(vi, vj) is the initial value of contact utility ofall the vehicle pairs, which is set to a value selectedfrom (0, 1). This definition ensures that the two vehicleswith a high encounter frequency have a larger encounterfrequency utility.
2) The visited frequency of locations is measured by ourprevious method in [4]. The basic idea is as follows:
a) First,, we divide road map to small road sectionswhich can be denoted by road intersections.
b) Then, each vehicle keeps recording the number ofvisiting times on each road sections.
c) Finally, the top a few frequently visited locationscan be identified.
3) Maintaining the address book: After vehicle A hascalculated its own address information, vehicle B builds andmaintains the address information of vehicle A as follows:
1) Once vehicle A delivers a packet to vehicle B, vehicleA delivers its address information to vehicle B with thepacket.
2) Once vehicle B receives a packet and address infor-mation from vehicle A, vehicle B checks its addressbook. If vehicle A is in the address book, go to Step(3); otherwise, go to Step (4).
3) Vehicle B updates the address information of vehicleA by the new address information and changes thecorresponding updated time to the current time stamp.
4) Vehicle B deletes the oldest address information fromthe address book and adds the address information ofvehicle A, and sets the corresponding updated time tothe current time stamp.
Besides building and maintaining its address book by theinformation provided by source vehicles, vehicle B alsomaintains its address book based on the information of othervehicles as follows:
1) Once vehicle B encounters another vehicle C, vehicle Bchecks whether there are useful address information ofits frequently contact vehicles. If there is useful addressinformation, go to Step (2).
7
Source
Contact based routing
Location based routing
Centrality based routing
Target
Contact based routing
Location based routing
Location based routing
Previous method
Our method
Fig. 10: Routing with combination of different methods
2) Vehicle B checks the corresponding updated time ofthe address information. If it is later than the addressinformation stored in the address book, it updates theaddress information.
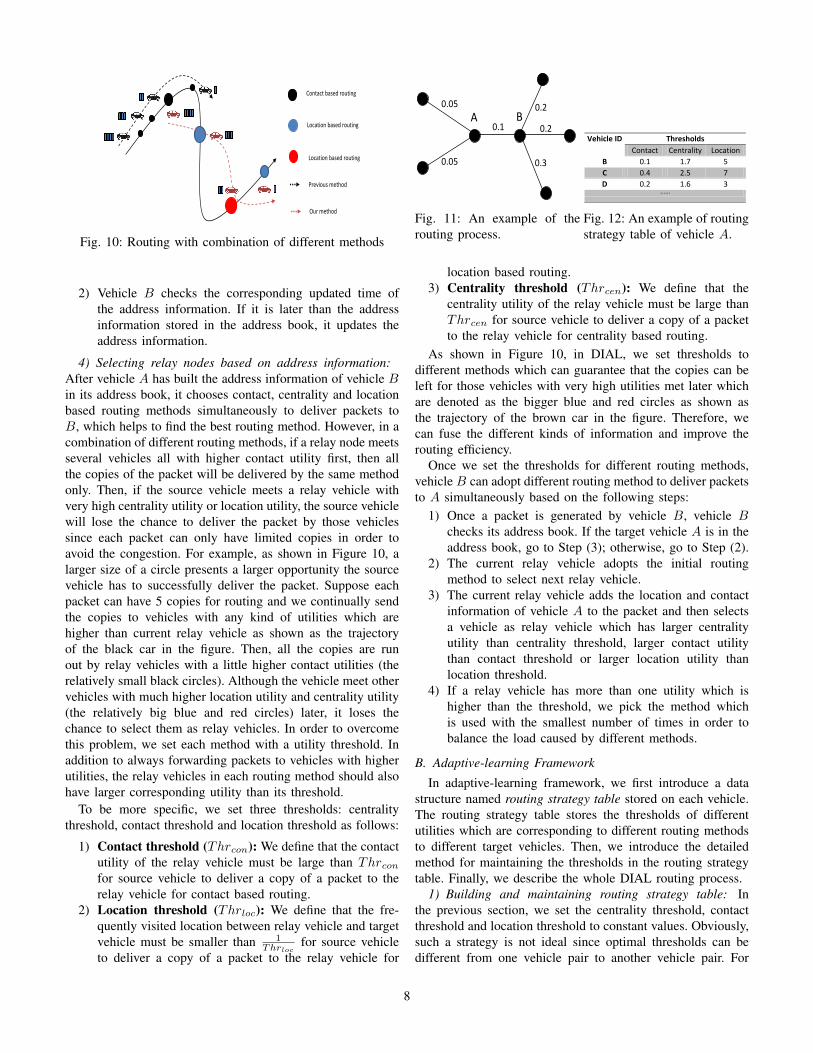
4) Selecting relay nodes based on address information:After vehicle A has built the address information of vehicle Bin its address book, it chooses contact, centrality and locationbased routing methods simultaneously to deliver packets toB, which helps to find the best routing method. However, in acombination of different routing methods, if a relay node meetsseveral vehicles all with higher contact utility first, then allthe copies of the packet will be delivered by the same methodonly. Then, if the source vehicle meets a relay vehicle withvery high centrality utility or location utility, the source vehiclewill lose the chance to deliver the packet by those vehiclessince each packet can only have limited copies in order toavoid the congestion. For example, as shown in Figure 10, alarger size of a circle presents a larger opportunity the sourcevehicle has to successfully deliver the packet. Suppose eachpacket can have 5 copies for routing and we continually sendthe copies to vehicles with any kind of utilities which arehigher than current relay vehicle as shown as the trajectoryof the black car in the figure. Then, all the copies are runout by relay vehicles with a little higher contact utilities (therelatively small black circles). Although the vehicle meet othervehicles with much higher location utility and centrality utility(the relatively big blue and red circles) later, it loses thechance to select them as relay vehicles. In order to overcomethis problem, we set each method with a utility threshold. Inaddition to always forwarding packets to vehicles with higherutilities, the relay vehicles in each routing method should alsohave larger corresponding utility than its threshold.
To be more specific, we set three thresholds: centralitythreshold, contact threshold and location threshold as follows:
1) Contact threshold (Thrcon): We define that the contactutility of the relay vehicle must be large than Thrconfor source vehicle to deliver a copy of a packet to therelay vehicle for contact based routing.
2) Location threshold (Thrloc): We define that the fre-quently visited location between relay vehicle and targetvehicle must be smaller than 1
Thrlocfor source vehicle
to deliver a copy of a packet to the relay vehicle for
Contact based routing
Location based routing
A
Copy 1
Copy 2
Copy 3
B 0.05 0.2
0.05
0.1
0.3
0.2
Fig. 11: An example of therouting process.
Vehicle ID Thresholds
Contact Centrality Location B 0.1 1.7 5 C 0.4 2.5 7 D 0.2 1.6 3
……
Vehicle ID Location Contact 1 LTable ① CTable ① 2 LTable ② CTable ② 3 LTable ③ CTable ③ 4 LTable ④ CTable ④
……
Vehicle ID PersonalizedRank 7 1 8 3 9 2
10 4 ……
Location Time Rank Road a 8:00-9:00 1 Road b 18:00-19:00 1
Road c 8:00-9:00 2 Road d 12:00-13:00 1
……
Fig. 12: An example of routingstrategy table of vehicle A.
location based routing.3) Centrality threshold (Thrcen): We define that the
centrality utility of the relay vehicle must be large thanThrcen for source vehicle to deliver a copy of a packetto the relay vehicle for centrality based routing.
As shown in Figure 10, in DIAL, we set thresholds todifferent methods which can guarantee that the copies can beleft for those vehicles with very high utilities met later whichare denoted as the bigger blue and red circles as shown asthe trajectory of the brown car in the figure. Therefore, wecan fuse the different kinds of information and improve therouting efficiency.
Once we set the thresholds for different routing methods,vehicle B can adopt different routing method to deliver packetsto A simultaneously based on the following steps:
1) Once a packet is generated by vehicle B, vehicle Bchecks its address book. If the target vehicle A is in theaddress book, go to Step (3); otherwise, go to Step (2).
2) The current relay vehicle adopts the initial routingmethod to select next relay vehicle.
3) The current relay vehicle adds the location and contactinformation of vehicle A to the packet and then selectsa vehicle as relay vehicle which has larger centralityutility than centrality threshold, larger contact utilitythan contact threshold or larger location utility thanlocation threshold.
4) If a relay vehicle has more than one utility which ishigher than the threshold, we pick the method whichis used with the smallest number of times in order tobalance the load caused by different methods.
B. Adaptive-learning Framework
In adaptive-learning framework, we first introduce a datastructure named routing strategy table stored on each vehicle.The routing strategy table stores the thresholds of differentutilities which are corresponding to different routing methodsto different target vehicles. Then, we introduce the detailedmethod for maintaining the thresholds in the routing strategytable. Finally, we describe the whole DIAL routing process.
1) Building and maintaining routing strategy table: Inthe previous section, we set the centrality threshold, contactthreshold and location threshold to constant values. Obviously,such a strategy is not ideal since optimal thresholds can bedifferent from one vehicle pair to another vehicle pair. For
8
Source
Contact based routing
Location based routing
Centrality based routing
Target
Fig. 13: An example of setting thresholds.
example, as shown in Figure 11, there are two target vehiclesA and B. Vehicle A is inactive and 0.1 is a high enoughcontact threshold for delivering packets to vehicle A, whilevehicle B is active and 0.2 can be a good enough contactthreshold for delivering packets to vehicle B. In order to setdifferent thresholds for different vehicle pairs, in the adaptive-learning framework, a vehicle A maintains a routing strategytable as shown in Figure 12. The routing strategy table storesthe thresholds for vehicle A to deliver packets to vehicles withIDs B, C, D and so on.
However, as we mentioned in Section III, it is difficult topredict the routing performances of different routing methodson different vehicle pairs. To solve this problem, in theadaptive-learning framework, instead of applying features ofvehicle pairs to predict the performances of different routingmethods on different vehicle pairs, we consider the routingprocess and all the features of vehicle pairs as a black box. Bytaking advantage of the human beings’ communication featurethat most interactions are generated by pairs of people whointeracted often previously, the adaptive-learning frameworktests the routing performances of different routing methodson different vehicle pairs. Then, based on the feedback ofthe tests, the adaptive-learning framework can adjust thethresholds of utilities for different routing methods.
To be more specific, the source vehicle A remembers thenumber of copies sent by different routing methods to targetvehicle B. At the same time, target vehicle B remembers thenumber of copies successfully delivered by different routingmethod from source vehicle A and sends it back to sourcevehicle A with other packets. Then, vehicle A can calculatethe success rates of different routing methods on itself. If thesuccess rate of a routing method is higher than others, it meansthat the threshold of that utility is too low and a lot of copiesdelivered to vehicles with higher utility than the threshold arewasted. Therefore, we increase the threshold. Otherwise, ifthe success rate of a routing method is lower than others, itmeans that the threshold of that utility is too low. Therefore,we decrease the threshold. Here, we define the success rate ofa specific method as:
SRcon/loc/cen =|SScon/loc/cen||Scon/loc/cen|
(3)
where SRcon/loc/cen is the success rate of contact, lo-
Source
Target
T1
T2
T3
T4
Send feedback
Send a packet
Send new packet
Record the
numbers of copies
successfully
delivered by
different methods
Record the
numbers of copies
sent by different
methods
Adjust thresholds
based on
coefficients of
utilization of
different methods
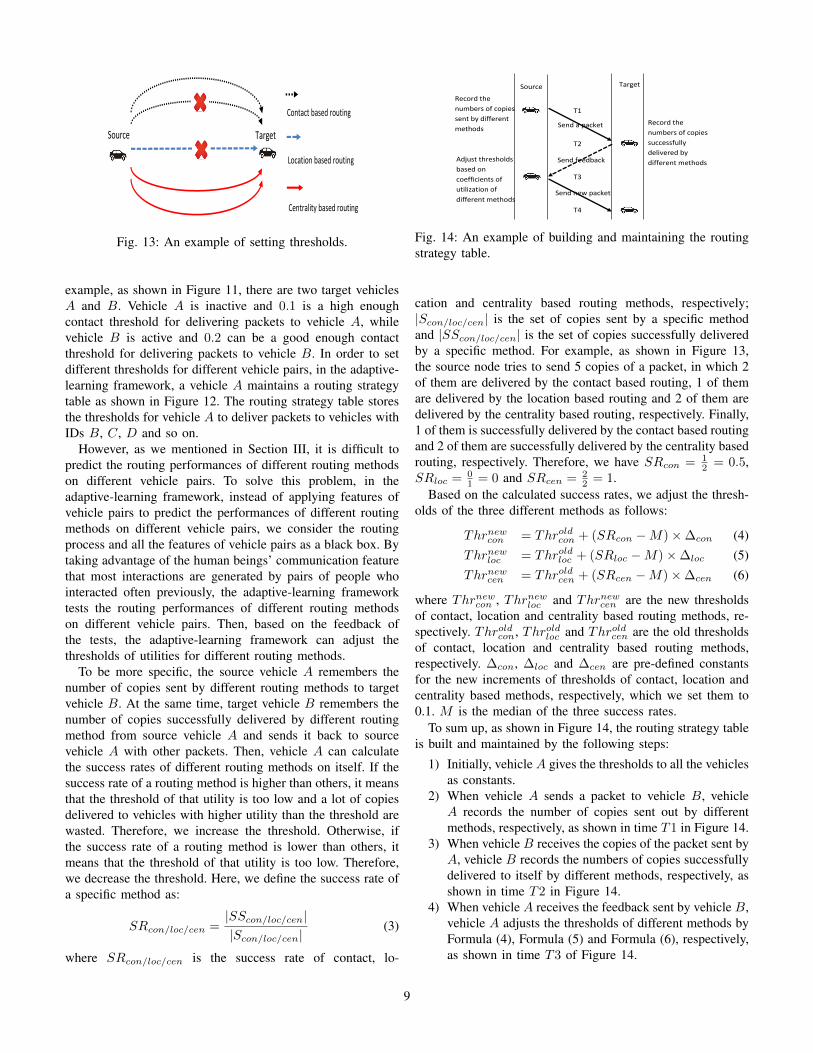
Fig. 14: An example of building and maintaining the routingstrategy table.
cation and centrality based routing methods, respectively;|Scon/loc/cen| is the set of copies sent by a specific methodand |SScon/loc/cen| is the set of copies successfully deliveredby a specific method. For example, as shown in Figure 13,the source node tries to send 5 copies of a packet, in which 2of them are delivered by the contact based routing, 1 of themare delivered by the location based routing and 2 of them aredelivered by the centrality based routing, respectively. Finally,1 of them is successfully delivered by the contact based routingand 2 of them are successfully delivered by the centrality basedrouting, respectively. Therefore, we have SRcon = 1
2 = 0.5,SRloc = 0
1 = 0 and SRcen = 22 = 1.
Based on the calculated success rates, we adjust the thresh-olds of the three different methods as follows:
Thrnewcon = Throldcon + (SRcon −M)×∆con (4)Thrnewloc = Throldloc + (SRloc −M)×∆loc (5)Thrnewcen = Throldcen + (SRcen −M)×∆cen (6)
where Thrnewcon , Thrnewloc and Thrnewcen are the new thresholdsof contact, location and centrality based routing methods, re-spectively. Throldcon, Throldloc and Throldcen are the old thresholdsof contact, location and centrality based routing methods,respectively. ∆con, ∆loc and ∆cen are pre-defined constantsfor the new increments of thresholds of contact, location andcentrality based methods, respectively, which we set them to0.1. M is the median of the three success rates.
To sum up, as shown in Figure 14, the routing strategy tableis built and maintained by the following steps:
1) Initially, vehicle A gives the thresholds to all the vehiclesas constants.
2) When vehicle A sends a packet to vehicle B, vehicleA records the number of copies sent out by differentmethods, respectively, as shown in time T1 in Figure 14.
3) When vehicle B receives the copies of the packet sent byA, vehicle B records the numbers of copies successfullydelivered to itself by different methods, respectively, asshown in time T2 in Figure 14.
4) When vehicle A receives the feedback sent by vehicle B,vehicle A adjusts the thresholds of different methods byFormula (4), Formula (5) and Formula (6), respectively,as shown in time T3 of Figure 14.
9
2) Detailed DIAL routing process: Based on the abovedescription, we give a detailed DIAL routing process asfollows:
1) Once a packet is generated by vehicle B, vehicle Bchecks its address book. If the target vehicle A is in theaddress book, go to Step (3); otherwise, go to Step (2).
2) The current relay vehicle adopts the initial routingmethod to select next relay vehicle. Then go to Step(5).
3) The source vehicle B checks its routing strategy table. Ifthere is a routing strategy for target vehicle A, vehicle Buses the thresholds stored in the routing strategy table;otherwise, it uses the initial values of the thresholds.Then go to Step (4)
4) The current relay vehicle adds the location and con-tact information of vehicle A to the packet. Vehicleswith larger centrality utility, larger contact utility andlarger location utility than the corresponding (centrality,contact and location) thresholds are selected as relayvehicles.
5) The current relay vehicle checks its address book. If thetarget vehicle A is in the address book, go to Step (3);otherwise, go to Step (2).
V. PERFORMANCE EVALUATION
In this section, we evaluate the performance of DIAL andcompare it with other methods. We conduct the trace-drivenexperiments based on both the Roma and SanF traces. Inorder to evaluate on continual interactions between vehiclesin a long term, we recursively set the states of vehicles to thebeginning of the trace data and replay the trace data once thetrace data run out since the durations of the trace data are notlong enough. Based on the above experiment environment, weuse the following metrics to evaluate the routing performance:
1) Success rate: The percentage of packets that successfullyarrive at their target vehicles.
2) Average delay: The average time per packet for success-fully delivered packets to reach their target vehicles.
Our evaluation is divided to two aspects:1) From a micro-scope, we measure the routing perfor-
mance of DIAL with different interaction frequenciessince DIAL is designed based on the fact that most inter-actions are generated by pairs of people who interactedoften previously.
2) From a macro-scope, we compare the performanceof DIAL with the AAR [4], PeopleRank [2] andPROPHET [1] methods. AAR represents location basedrouting methods. PeopleRank represents centrality basedrouting methods. PROPHET represents contact basedrouting methods. The details of the methods are intro-duced in Section II.
A. Performance Comparison With Different Parameters
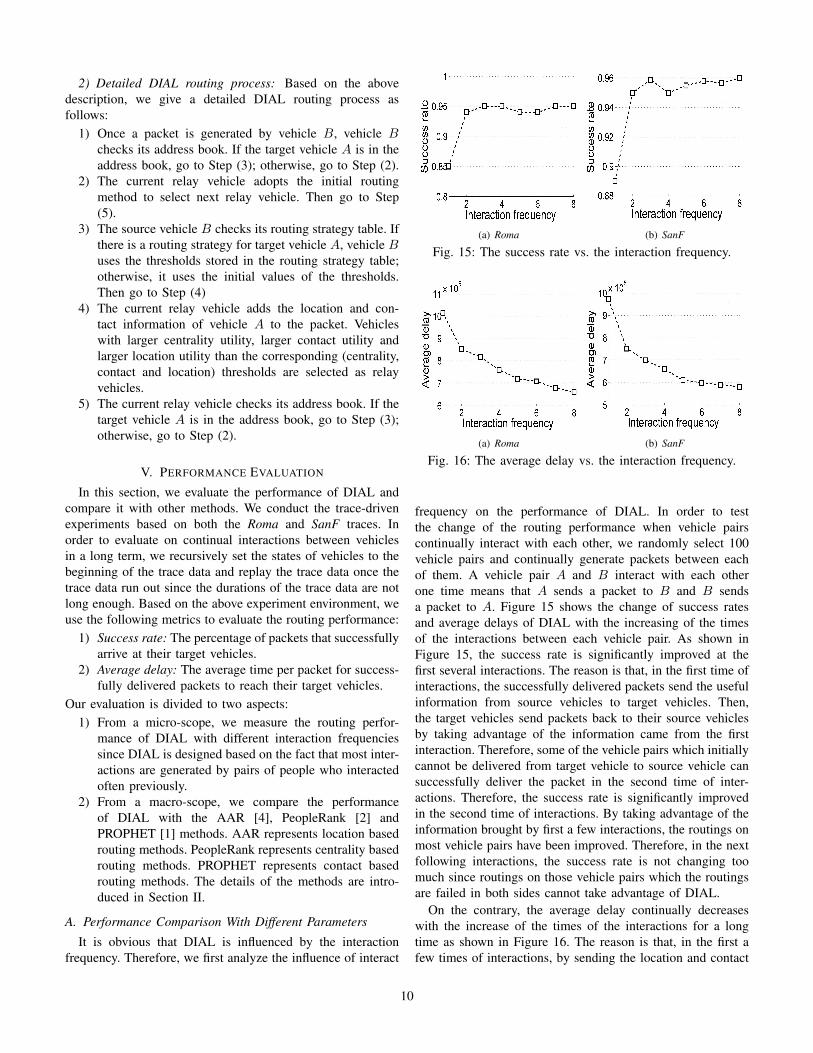
It is obvious that DIAL is influenced by the interactionfrequency. Therefore, we first analyze the influence of interact
(a) Roma (b) SanF
Fig. 15: The success rate vs. the interaction frequency.
(a) Roma (b) SanF
Fig. 16: The average delay vs. the interaction frequency.
frequency on the performance of DIAL. In order to testthe change of the routing performance when vehicle pairscontinually interact with each other, we randomly select 100vehicle pairs and continually generate packets between eachof them. A vehicle pair A and B interact with each otherone time means that A sends a packet to B and B sendsa packet to A. Figure 15 shows the change of success ratesand average delays of DIAL with the increasing of the timesof the interactions between each vehicle pair. As shown inFigure 15, the success rate is significantly improved at thefirst several interactions. The reason is that, in the first time ofinteractions, the successfully delivered packets send the usefulinformation from source vehicles to target vehicles. Then,the target vehicles send packets back to their source vehiclesby taking advantage of the information came from the firstinteraction. Therefore, some of the vehicle pairs which initiallycannot be delivered from target vehicle to source vehicle cansuccessfully deliver the packet in the second time of inter-actions. Therefore, the success rate is significantly improvedin the second time of interactions. By taking advantage of theinformation brought by first a few interactions, the routings onmost vehicle pairs have been improved. Therefore, in the nextfollowing interactions, the success rate is not changing toomuch since routings on those vehicle pairs which the routingsare failed in both sides cannot take advantage of DIAL.
On the contrary, the average delay continually decreaseswith the increase of the times of the interactions for a longtime as shown in Figure 16. The reason is that, in the first afew times of interactions, by sending the location and contact
10
1 2 3 4 50
0.2
0.4
0.6
0.8
1
The # of copies
Su
cce
ss r
ate
AARDIALPeopleRankPROPHET
(a) Roma
1 2 3 4 50
0.2
0.4
0.6
0.8
1
The # of copies
Success r
ate
AARDIALPeopleRankPROPHET
(b) SanF
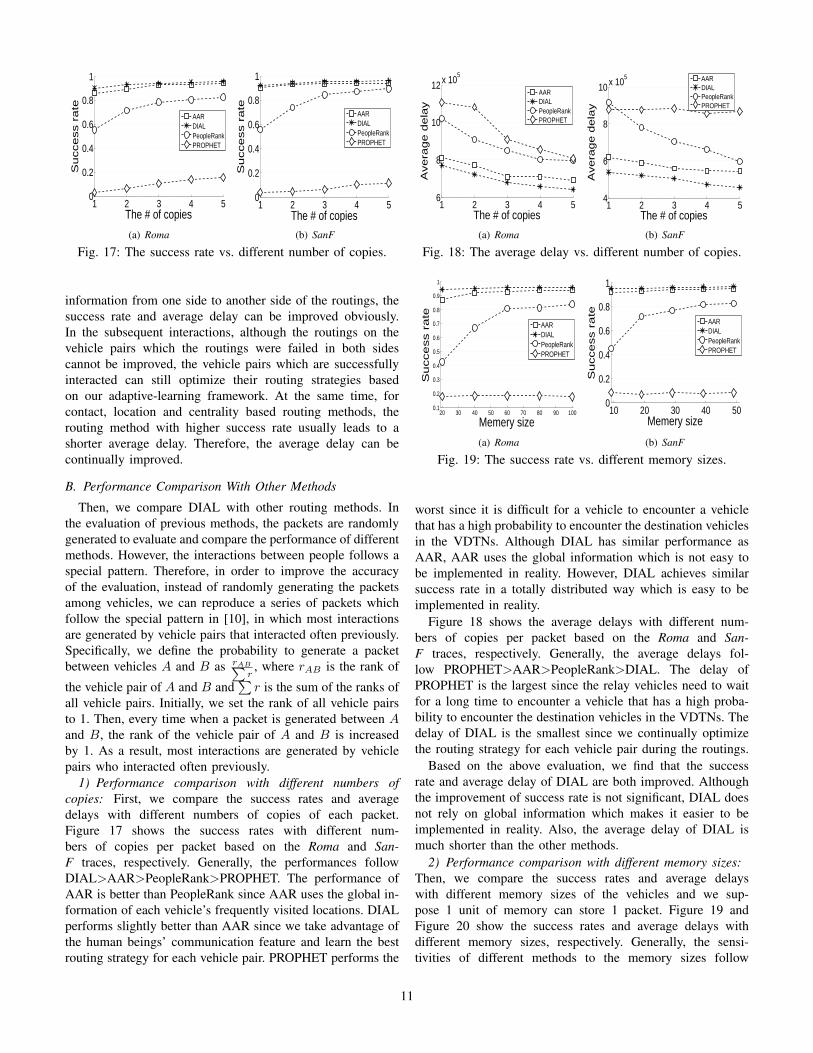
Fig. 17: The success rate vs. different number of copies.
information from one side to another side of the routings, thesuccess rate and average delay can be improved obviously.In the subsequent interactions, although the routings on thevehicle pairs which the routings were failed in both sidescannot be improved, the vehicle pairs which are successfullyinteracted can still optimize their routing strategies basedon our adaptive-learning framework. At the same time, forcontact, location and centrality based routing methods, therouting method with higher success rate usually leads to ashorter average delay. Therefore, the average delay can becontinually improved.
B. Performance Comparison With Other Methods
Then, we compare DIAL with other routing methods. Inthe evaluation of previous methods, the packets are randomlygenerated to evaluate and compare the performance of differentmethods. However, the interactions between people follows aspecial pattern. Therefore, in order to improve the accuracyof the evaluation, instead of randomly generating the packetsamong vehicles, we can reproduce a series of packets whichfollow the special pattern in [10], in which most interactionsare generated by vehicle pairs that interacted often previously.Specifically, we define the probability to generate a packetbetween vehicles A and B as rAB∑
r, where rAB is the rank of
the vehicle pair of A and B and∑
r is the sum of the ranks ofall vehicle pairs. Initially, we set the rank of all vehicle pairsto 1. Then, every time when a packet is generated between Aand B, the rank of the vehicle pair of A and B is increasedby 1. As a result, most interactions are generated by vehiclepairs who interacted often previously.
1) Performance comparison with different numbers ofcopies: First, we compare the success rates and averagedelays with different numbers of copies of each packet.Figure 17 shows the success rates with different num-bers of copies per packet based on the Roma and San-F traces, respectively. Generally, the performances followDIAL>AAR>PeopleRank>PROPHET. The performance ofAAR is better than PeopleRank since AAR uses the global in-formation of each vehicle’s frequently visited locations. DIALperforms slightly better than AAR since we take advantage ofthe human beings’ communication feature and learn the bestrouting strategy for each vehicle pair. PROPHET performs the
1 2 3 4 56
8
10
12 x 105
The # of copies
Avera
ge d
ela
y
AARDIALPeopleRankPROPHET
(a) Roma
1 2 3 4 54
6
8
10 x 105
The # of copies
Ave
rag
e d
ela
y
AARDIALPeopleRankPROPHET
(b) SanF
Fig. 18: The average delay vs. different number of copies.
20 30 40 50 60 70 80 90 1000.1
0.2
0.3
0.4
0.5
0.6
0.7
0.8
0.9
1
Memery sizeS
ucce
ss r
ate
AARDIALPeopleRankPROPHET
(a) Roma
10 20 30 40 500
0.2
0.4
0.6
0.8
1
Memery size
Success r
ate
AARDIALPeopleRankPROPHET
(b) SanF
Fig. 19: The success rate vs. different memory sizes.
worst since it is difficult for a vehicle to encounter a vehiclethat has a high probability to encounter the destination vehiclesin the VDTNs. Although DIAL has similar performance asAAR, AAR uses the global information which is not easy tobe implemented in reality. However, DIAL achieves similarsuccess rate in a totally distributed way which is easy to beimplemented in reality.
Figure 18 shows the average delays with different num-bers of copies per packet based on the Roma and San-F traces, respectively. Generally, the average delays fol-low PROPHET>AAR>PeopleRank>DIAL. The delay ofPROPHET is the largest since the relay vehicles need to waitfor a long time to encounter a vehicle that has a high proba-bility to encounter the destination vehicles in the VDTNs. Thedelay of DIAL is the smallest since we continually optimizethe routing strategy for each vehicle pair during the routings.
Based on the above evaluation, we find that the successrate and average delay of DIAL are both improved. Althoughthe improvement of success rate is not significant, DIAL doesnot rely on global information which makes it easier to beimplemented in reality. Also, the average delay of DIAL ismuch shorter than the other methods.
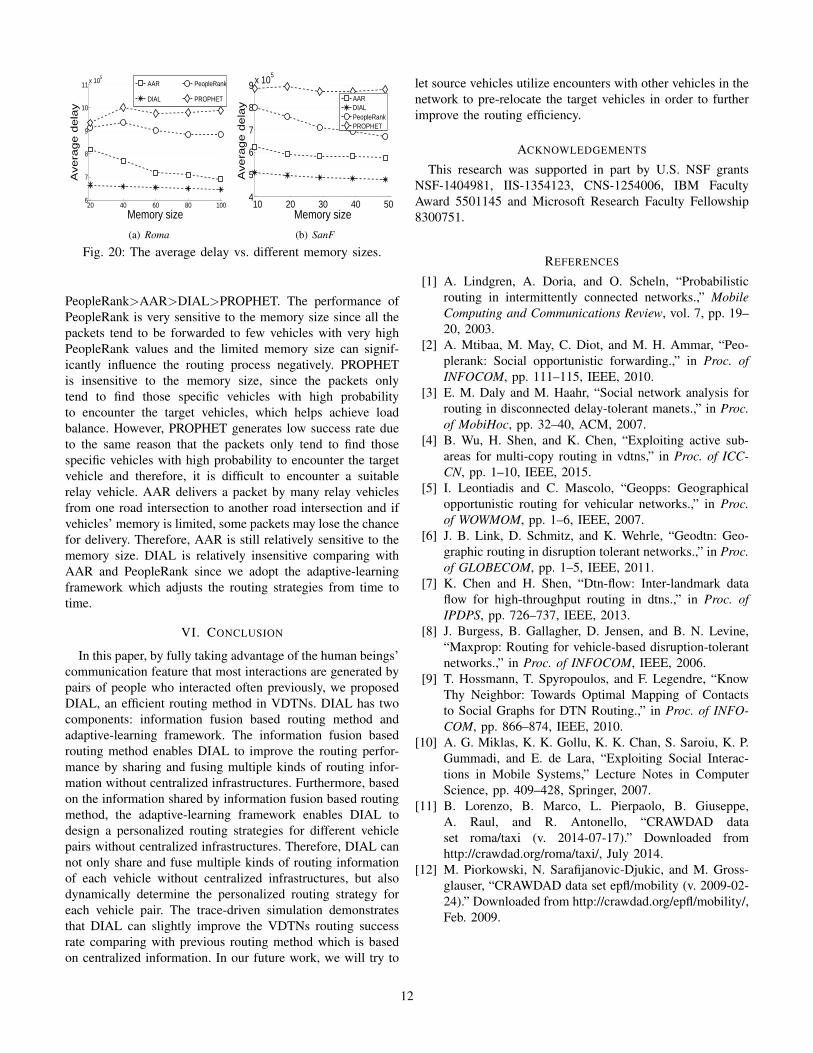
2) Performance comparison with different memory sizes:Then, we compare the success rates and average delayswith different memory sizes of the vehicles and we sup-pose 1 unit of memory can store 1 packet. Figure 19 andFigure 20 show the success rates and average delays withdifferent memory sizes, respectively. Generally, the sensi-tivities of different methods to the memory sizes follow
11
20 40 60 80 1006
7
8
9
10
11x 10
5
Memory size
Ave
rag
e d
ela
y
AAR
DIAL
PeopleRank
PROPHET
(a) Roma
10 20 30 40 504
5
6
7
8
9x 10⁵
Memory size
Ave
rag
e d
ela
y
AARDIALPeopleRankPROPHET
(b) SanF
Fig. 20: The average delay vs. different memory sizes.
PeopleRank>AAR>DIAL>PROPHET. The performance ofPeopleRank is very sensitive to the memory size since all thepackets tend to be forwarded to few vehicles with very highPeopleRank values and the limited memory size can signif-icantly influence the routing process negatively. PROPHETis insensitive to the memory size, since the packets onlytend to find those specific vehicles with high probabilityto encounter the target vehicles, which helps achieve loadbalance. However, PROPHET generates low success rate dueto the same reason that the packets only tend to find thosespecific vehicles with high probability to encounter the targetvehicle and therefore, it is difficult to encounter a suitablerelay vehicle. AAR delivers a packet by many relay vehiclesfrom one road intersection to another road intersection and ifvehicles’ memory is limited, some packets may lose the chancefor delivery. Therefore, AAR is still relatively sensitive to thememory size. DIAL is relatively insensitive comparing withAAR and PeopleRank since we adopt the adaptive-learningframework which adjusts the routing strategies from time totime.
VI. CONCLUSION
In this paper, by fully taking advantage of the human beings’communication feature that most interactions are generated bypairs of people who interacted often previously, we proposedDIAL, an efficient routing method in VDTNs. DIAL has twocomponents: information fusion based routing method andadaptive-learning framework. The information fusion basedrouting method enables DIAL to improve the routing perfor-mance by sharing and fusing multiple kinds of routing infor-mation without centralized infrastructures. Furthermore, basedon the information shared by information fusion based routingmethod, the adaptive-learning framework enables DIAL todesign a personalized routing strategies for different vehiclepairs without centralized infrastructures. Therefore, DIAL cannot only share and fuse multiple kinds of routing informationof each vehicle without centralized infrastructures, but alsodynamically determine the personalized routing strategy foreach vehicle pair. The trace-driven simulation demonstratesthat DIAL can slightly improve the VDTNs routing successrate comparing with previous routing method which is basedon centralized information. In our future work, we will try to
let source vehicles utilize encounters with other vehicles in thenetwork to pre-relocate the target vehicles in order to furtherimprove the routing efficiency.
ACKNOWLEDGEMENTS
This research was supported in part by U.S. NSF grantsNSF-1404981, IIS-1354123, CNS-1254006, IBM FacultyAward 5501145 and Microsoft Research Faculty Fellowship8300751.
REFERENCES
[1] A. Lindgren, A. Doria, and O. Scheln, “Probabilisticrouting in intermittently connected networks.,” MobileComputing and Communications Review, vol. 7, pp. 19–20, 2003.
[2] A. Mtibaa, M. May, C. Diot, and M. H. Ammar, “Peo-plerank: Social opportunistic forwarding.,” in Proc. ofINFOCOM, pp. 111–115, IEEE, 2010.
[3] E. M. Daly and M. Haahr, “Social network analysis forrouting in disconnected delay-tolerant manets.,” in Proc.of MobiHoc, pp. 32–40, ACM, 2007.
[4] B. Wu, H. Shen, and K. Chen, “Exploiting active sub-areas for multi-copy routing in vdtns,” in Proc. of ICC-CN, pp. 1–10, IEEE, 2015.
[5] I. Leontiadis and C. Mascolo, “Geopps: Geographicalopportunistic routing for vehicular networks.,” in Proc.of WOWMOM, pp. 1–6, IEEE, 2007.
[6] J. B. Link, D. Schmitz, and K. Wehrle, “Geodtn: Geo-graphic routing in disruption tolerant networks.,” in Proc.of GLOBECOM, pp. 1–5, IEEE, 2011.
[7] K. Chen and H. Shen, “Dtn-flow: Inter-landmark dataflow for high-throughput routing in dtns.,” in Proc. ofIPDPS, pp. 726–737, IEEE, 2013.
[8] J. Burgess, B. Gallagher, D. Jensen, and B. N. Levine,“Maxprop: Routing for vehicle-based disruption-tolerantnetworks.,” in Proc. of INFOCOM, IEEE, 2006.
[9] T. Hossmann, T. Spyropoulos, and F. Legendre, “KnowThy Neighbor: Towards Optimal Mapping of Contactsto Social Graphs for DTN Routing.,” in Proc. of INFO-COM, pp. 866–874, IEEE, 2010.
[10] A. G. Miklas, K. K. Gollu, K. K. Chan, S. Saroiu, K. P.Gummadi, and E. de Lara, “Exploiting Social Interac-tions in Mobile Systems,” Lecture Notes in ComputerScience, pp. 409–428, Springer, 2007.
[11] B. Lorenzo, B. Marco, L. Pierpaolo, B. Giuseppe,A. Raul, and R. Antonello, “CRAWDAD dataset roma/taxi (v. 2014-07-17).” Downloaded fromhttp://crawdad.org/roma/taxi/, July 2014.
[12] M. Piorkowski, N. Sarafijanovic-Djukic, and M. Gross-glauser, “CRAWDAD data set epfl/mobility (v. 2009-02-24).” Downloaded from http://crawdad.org/epfl/mobility/,Feb. 2009.
12

![DIAL: A Distributed Adaptive-Learning Routing Method in VDTNscs.virginia.edu/~hs6ms/publishedPaper/Conference/2016/... · 2016-04-21 · [1] T. Henderson, etc. “The changing usage](https://static.fdocuments.in/doc/165x107/5f7bfe18ed3c330fdd019a1f/dial-a-distributed-adaptive-learning-routing-method-in-hs6mspublishedpaperconference2016.jpg)