![Diagramming Review II - WCUSD15 · about sentence diagramming. classes are excited ... -ed, -d, -t, or ... Diagramming Review II [Compatibility Mode]](https://static.fdocuments.in/doc/165x107/5af7254d7f8b9a9271913b29/diagramming-review-ii-sentence-diagramming-classes-are-excited-ed-d-t.jpg)
Diagramming Prior Knowledge in the Classroom: A Case Study ...
115
Diagramming Prior Knowledge in the Classroom: A Case Study Arthur Thomas Conroy III Dissertation submitted to the faculty of the Virginia Polytechnic Institute and State University in partial fulfillment of the requirements for the degree of Doctor of Philosophy In Human Development Clare D. Klunk, Chair Marcie Boucouvalas Linda E. Morris Paul D. Renard December 8, 2015 Falls Church, Virginia Keywords: Human Development, Adult Learning, Diagramming, Prior Knowledge, Student-Generated, Constructivism, Elicitation Copyright 2015
Transcript of Diagramming Prior Knowledge in the Classroom: A Case Study ...

Diagramming Prior Knowledge in the Classroom: A Case Study
Arthur Thomas Conroy III
Dissertation submitted to the faculty of the Virginia Polytechnic Institute and
State University in partial fulfillment of the requirements for the degree of
Doctor of Philosophy
In
Human Development
Clare D. Klunk, Chair
Marcie Boucouvalas
Linda E. Morris
Paul D. Renard
December 8, 2015
Falls Church, Virginia
Keywords: Human Development, Adult Learning, Diagramming, Prior
Knowledge, Student-Generated, Constructivism, Elicitation
Copyright 2015

Diagramming Prior Knowledge in the Classroom: A Case Study
Arthur Thomas Conroy III
ABSTRACT
Engaging the student’s prior knowledge is considered by educational researchers
to be an important part of constructing a strong foundation for new learning. Diagrams
are one technique used in the classroom. Jill Larkin and Herbert Simon described the
computational advantages of diagrams over text when used to communicate information
in their 1987 article entitled “Why a Diagram is (Sometimes) Worth Ten Thousand
Words.”
This case study describes a novel abstract diagramming technique facilitated in
four separate university classroom settings. Using paper and crayons, the students created
three diagrams that represented the externalization of their unconscious perceptions of
their own prior knowledge. The study illustrates how differences in prior knowledge can
be visualized using diagrams with greater speed in less time than the traditional use of
text-based descriptions.
The use of the abstract diagramming technique led to an unexpected finding. The
student diagrams were shown to contain a hidden conceptual topology, one that is
described by Egenhofer in his 1991 article entitled “Reasoning About Binary Topological
Relations.” This topology is recommended as a framework for structuring and facilitating
student collaboration and sharing of prior knowledge and new learning.

iii
The present study recommends the diagramming technique as the basis for the
establishment of a standard diagram research framework that can be used across multiple
research disciplines and subject domains. This dissertation describes a domain-general
abstract diagram technique that can be adapted for domain-specific subjects and made
operational using basic materials (paper and crayons). The study also describes the
instructors’ responses to questions about the diagram technique used in their classes. The
case study offers recommendations for future diagram research.

iv
Dedication
Killed in South Korea, March 24th
, 1984, Helicopter Crash
Captain S.J BURLEY
Captain J.H. HOUSTON
Sergeant D.C. HIGGINS
Corporal J.J ACQUISTO
Gunnery Sergeant Richard M. BJECKO
Staff Sergeant John R. LIDDLE
Sergeant Kevin J. MUGOODWIN
Corporal Tim B. KELLY
Corporal Kenneth B. CROSBY
Lance Corporal Bradley A. MCCOMAS
Lance Corporal Daniel B. ZINCK
Lance Corporal Fernando ROSALEZ Jr.
Private First Class James T. ROONEY
Private First Class Edward C. FERRELL
Private First Class William A. SOLES
Private First Class Anthony S. DUGAS
Lance Corporal Herman L. OSCEOLA 262
Private First Class John M. ANDREWS III
Second Lieutenant JYE KWON KOO
Staff Sergeant JAE KEUN SIM
Staff Sergeant SOON SOK KIM
Staff Sergeant HWI MOON KIM
Sergeant MOON JOO OH
Sergeant SEONG YI LEE
Sergeant TAE YOUNG KIM
Sergeant SOON KI LEE
Corporal YOON NAM LEE
Corporal YOUNG CHUL SIN
Private DOO SONG CHANG

v
Acknowledgments
A special thank goes to my family for supporting me in a journey that few could
understand; the soon-to-be Dr. Joann F.Conroy, Mom, Dad, Kevin, Tim, Cynthia, and
Chris. Prior knowledge is for future generations, so I couldn’t be happier than to pass this
legacy on to my daughters, Amanda and Kelsey.
The faculty of the Adult Learning and Human Resource Development Program at
Virginia Tech/National Capital Region played a critical role in the development of this
dissertation. Dr. Clare Klunk was the guiding light as Committee Chair, and the person
who has the patience of a saint, and led me through the twists, turns, roadblocks, and
detours, especially given my curiosity and penchant for wanting to turn over every stone.
My scholarly writing evolved over six years, thanks to the steady and insightful critique
of Dr. Paul Renard, despite my bad habits learned from years of bureaucratic writing. A
debt of sincere gratitude goes to Dr. Linda Morris for being available at a moment’s
notice for questions, answers, advice, insights, and her review of my work at the 11th
hour. This work would have never gotten off the ground without the vision and
leadership of Dr. Marcie Boucouvalas and her leadership as the Program Chair, Adult
Learning and Human Resource Development Program.

vi
Table of Contents
CHAPTER ONE - INTRODUCTION.....................................................................1
Background ......................................................................................................... 1
Statement of the Problem .................................................................................... 3
The Gap in the Literature .................................................................................... 3
Purpose and Significance .................................................................................... 5
The Conceptual Framework ................................................................................ 6
Research Questions ............................................................................................. 7
Assumptions and Limitations .............................................................................. 7
Definition of Terms ............................................................................................. 8
Summary ........................................................................................................... 10
CHAPTER TWO – LITERATURE REVIEW ......................................................11
Background ....................................................................................................... 11
Literature Survey Rubric ................................................................................... 13
Conceptual Framework ..................................................................................... 15
Prior Knowledge ............................................................................................... 17
Declarative Knowledge ................................................................................. 18
Procedural Knowledge .................................................................................. 18
Conceptual Knowledge .................................................................................. 19
Diagrams ........................................................................................................... 19
Standards and Terminology ........................................................................... 20
Research Frameworks .................................................................................... 20
Shape Grammars............................................................................................ 21
Dissertations .................................................................................................. 21
Summary ........................................................................................................... 25

vii
CHAPTER THREE - METHOD ...........................................................................26
Background of the Elicitation Technique.......................................................... 26
Constructivist Orientation to Diagram Elicitation ............................................ 27
Organization of the Data ................................................................................... 27
Interactive Structure ...................................................................................... 28
Participants ........................................................................................................ 28
Students ......................................................................................................... 28
Instructors ...................................................................................................... 29
Participant Biases .......................................................................................... 30
Data Collection .................................................................................................. 30
Prototype ........................................................................................................ 30
Materials ........................................................................................................ 31
Stimulus Questions ........................................................................................ 31
Data Analysis .................................................................................................... 33
Analysis of Student Diagrams ....................................................................... 34
Unit of Analysis ............................................................................................. 34
Validity .......................................................................................................... 36
Reliability ...................................................................................................... 36
Analysis of Instructor Interviews .................................................................. 37
Summary ........................................................................................................... 37
CHAPTER FOUR – ANALYSIS ..........................................................................38
Research Question One ..................................................................................... 38
Making the Diagram Technique Operational ................................................ 39
Making Prior Knowledge Visually Accessible ............................................. 41
Construct Validity.......................................................................................... 42
Internal Validity ............................................................................................. 43
viii
External Validity............................................................................................ 43
Reliability ...................................................................................................... 44
Research Question Two .................................................................................... 45
A Framework for Collaboration .................................................................... 45
Student Collaboration Using Conceptual Relations ...................................... 46
The Role of Topology in Student Collaboration ........................................... 47
Research Question Three .................................................................................. 50
Instructor Experience Using Diagrams.......................................................... 50
Instructor Behavior Observing Students........................................................ 51
Instructor Responses to Interview Questions ................................................ 51
Summary of Analysis ........................................................................................ 53
CHAPTER FIVE - SUMMARY, LIMITATIONS, AND
RECOMMENDATIONS ...................................................................................................55
Summary of the Study ....................................................................................... 55
Discussion of the Findings ................................................................................ 56
Limitations of the Study .................................................................................... 58
Recommendations for Future Research ............................................................ 59
Conclusion ......................................................................................................... 60
REFERENCES ......................................................................................................62
APPENDIX A – IRB APPROVAL LETTER .......................................................84
APPENDIX B - SAMPLE DIAGRAMS ...............................................................85
APPENDIX C – CONCEPT TOPOLOGY COLLABORATION QUESTIONS .89
APPENDIX D – INSTRUCTOR RESPONSE TO RESEARCH QUESTIONS ..90
APPENDIX E – INSTRUCTOR RESEARCH QUESTIONS ............................101
APPENDIX F – KEY TERMS ............................................................................104

ix
List of Tables
Table 2.1 Dissertations Summary According to the Question Rubric ………………..24
Table 4.1 Classroom Setting and School Location …………………………………..38
Table 4.2 Conceptual Relations ………………………………………………..……..46
Table 4.3 Conceptual Relations of College Teaching ………………………………..48
Table 4.4 Student Examples of Conceptual Relations in College Teaching………….49

x
List of Figures
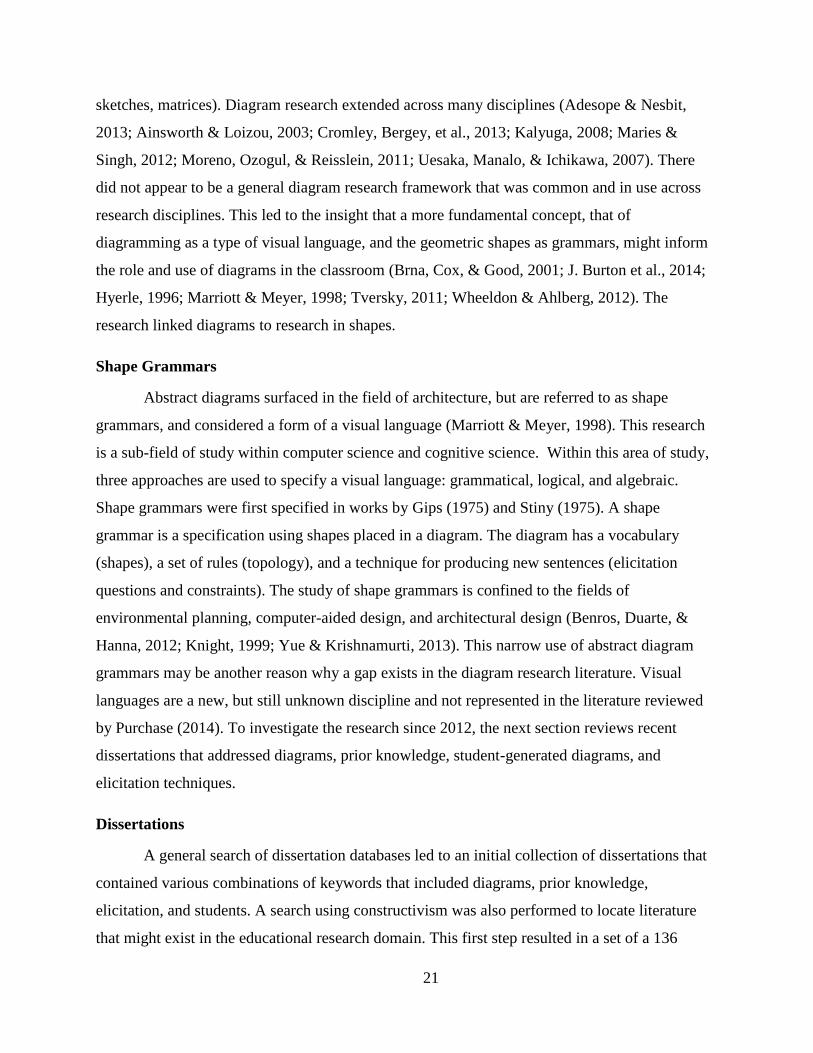
Figure 3.1 Diagrams by students taking class in subject domain of college teaching…35

1
CHAPTER ONE - INTRODUCTION
The classroom in today’s university environment is very different from the setting of
even just a few years ago. Students have new information at their fingertips thanks to innovations
targeting the internet, mobile phones, and the wireless web. Engaging the student’s prior
knowledge is considered by researchers and academics to be an important instructional strategy
when laying the foundation for new learning in the classroom (Ambrose, Bridges, Lovett,
DiPietro, & Norman, 2010; Bransford, 2000; Harris, Breier, & Wihak, 2011; Hattie, 2009). This
context presents a unique challenge for the university instructor.
In this case study university students were observed creating diagrams of prior
knowledge using an abstract diagram elicitation technique. The technique was facilitated in four
different classroom settings. My research describes how the diagramming technique was made
operational, how the student-generated diagrams revealed a hidden topology of shapes that
supported a framework for sharing and collaboration, and how the instructors responded to their
experience of sponsoring the diagram elicitation technique. Suggestions for future research are
included with a focus on the use of abstract diagrams in the classroom and in practice.
Background
I first encountered the value of using diagrams to communicate prior knowledge while
serving in the United States military. My squadron was training to fly with night vision goggles,
but the underlying concepts of how the technology worked were not included in the instructional
materials. This lack of training in the operational limitations of the technology led to a tragic
accident, killing 29 U.S. Marines (Powers, 1984). The basic concepts and risks regarding night
vision goggle flying while piloting helicopters had been published a decade earlier, but never
included in the training program (Sanders, Kimball, Frezell, & Hofmann, 1975). The simple,
abstract diagrams contained in the publication were quite effective in communicating the
limitations of the night vision goggle technology.
My studies in graduate school at the University of Southern California included a review
of a paper published in the cognitive science field related to the use of node-link diagrams and
pattern matching (Larkin, McDermott, Simon, & Simon, 1980). This paper came to mind years
later while preparing for a class project in facilitating adult learning at Virginia Tech (Klunk,

2
2009). I discovered an updated work by the previous authors (Larkin & Simon, 1987) during my
research for the class project. The researchers described the unique advantages of using diagrams
as an external representation when communicating information in contrast with using text.
My background in systems engineering and data modeling complemented my research in
the use of diagrams. The development of computer system architecture is based on the use of
entity-relationship (E-R) diagrams to model systems of large organizations (P. Chen, 1975).
These types of diagrams function as conceptual models of how organizations operate and how
they manage their resources. By combining my data modeling experience with the ideas
proposed by Larkin and Simon (1987), I conceived of student-generated diagrams as a possible
technique for eliciting prior knowledge.
The idea of using diagrams as the focal point of the class project was reinforced
by my experience taking three other graduate courses in the spring semester of 2009
(Boucouvalas, 2009; L. Morris, 2009; Renard, 2009). The course subjects included adult learning
theory and practice, small group theory and practice, and consulting in human systems theory
and practice.
During the semester, my experience attending the in-person classes, and participating in
the peer-to-peer interactions, confirmed my personal belief that the prior knowledge of my
fellow students’ conceptualization about adult learning theories varied widely. Considering the
instructors’ challenge of engaging prior knowledge led me to further investigate possible
diagram techniques for use in my project. None of the research I surveyed addressed diagrams as
a technique to elicit student prior knowledge. This gap in the research led me to construct a
diagramming prototype and experimental technique for the class project.
My design of the experimental technique created for the class project required the
students to create three diagrams using butcher block paper, glue sticks, and cut-outs of
geometric shapes. I created three questions as a way of prompting the students for a response
when creating their diagrams of prior knowledge. The questions were based on findings by a
National Research Council project that summarized key recommendations for teachers when
engaging students in new learning (Bransford, 2000). The elicitation questions were designed to

3
elicit the student’s general prior knowledge of conceptualizations about how the world worked. I
have reproduced the questions below.
1) How does the world work?
2) How do you store that information in memory?
3) How do you monitor your own learning when things change in the real world?
Each student was instructed to use the materials to create an answer to each of the three
questions, all in the form of diagrams, made from the geometric shape pieces, and glued to the
butcher block paper. At the conclusion of the diagram generation phase of the exercise, the
students provided verbal explanations of what their diagrams were meant to communicate. The
objective of the exercise was to show how their worldviews differed when represented visually.
There was a general surprise and curiosity among the students about how effective the technique
was in representing personal conceptualizations of general knowledge. It was this experience that
led to my proposal for this dissertation. This case study was designed to further explore how to
make diagram elicitation operational in the classroom, as a technique to elicit the student’s prior
knowledge, within a domain subject area.
Statement of the Problem
The college Professor is faced with teaching a student population that is diverse and
represented by a broad range of cultural backgrounds, education, and personal experiences.
Engaging the student’s prior knowledge is also challenging in an environment constrained by
time and resources, much of which is dedicated to new learning (Ambrose et al., 2010). How can
instructors engage student prior knowledge in a way that helps create a foundation for new
learning, collaboration, and sharing?
The Gap in the Literature
There is a significant body of literature on diagrams, prior knowledge, and the assessment
of student knowledge. On closer inspection, the range of topics in the field of diagram research
spans many disciplines, all of which include varying definitions. For example, Purchase (2014, p.
59) offers a definition of diagram as “taken to mean a composite set of marks (visual elements)
on a two-dimensional plane that, when taken together, represent a concept or object in the mind
4
of the viewer.” I selected the Larkin and Simon (1987, p.68) definition of diagram as a “data
structure in which information is indexed in a two-dimensional location” for use in this case
study.
In a similar fashion, the definition of prior knowledge varied across disciplines (Falk &
Dierking, 1995). The most widely accepted view in the educational psychology field of prior
knowledge is that knowledge is “what the learner already knows” (Ausubel, 1968). Educational
researchers have continued to further classify prior knowledge into three sub-categories,
described as declarative, procedural, and conceptual knowledge (Duffy & Jonassen, 1993;
Jonassen, Beissner, & Yacci, 1993). Conceptual knowledge is considered by educational
researchers as the foundation upon which all other knowledge is grounded (Dochy, Segers, &
Buehl, 1999; Eppler, 2006; Jonassen, 2004; Sowa, 1984; Vosniadou, 2008). Based on this
orientation to knowledge in the educational research field, I selected conceptual knowledge as
the focus of my elicitation technique.
I searched the literature for detailed information about how to leverage the advantages
inherent in diagrams as described by Larkin and Simon (1987). I was specifically looking for
diagram research that characterized diagrams as more abstract and consistent with the node-link
definition I had selected. I could not locate research that described techniques for using abstract
diagrams to elicit prior knowledge of concepts in a subject area. I turned to a review of
dissertations as a possible source of information regarding the use of diagrams as a technique for
eliciting student-generated representations of prior knowledge. None of the results met the
requirements for my search.
The design of research using visual data is seeing renewed interest in other areas. Euler
diagrams were implemented as a technique to visualize concepts (J. Burton, Stapleton, Howse, &
Chapman, 2014). Diagrams were used to study meaning in mathematics (Dimmel & Herbst,
2015). Research explored the use of diagrams in professional practice (Giardino, 2013). Political
scientists used diagrams in qualitative studies (Mahoney & Vanderpoel, 2015). Diagrams were
used in design studies and the cognitive sciences (Nickerson et al., 2013; Tversky, 2011; Tversky
& Kessell, 2014; Tversky & Suwa, 2009). Diagrams were used in research to understand how
exceptional children learn (Poch, van Garderen, & Scheuermann, 2015; van Garderen &
Scheuermann, 2015; van Garderen, Scheuermann, & Jackson, 2013). Diagrams were used in the

5
health sciences field to collect data in qualitative research settings (Burchett, Umoquit, &
Dobrow, 2011; Umoquit, Tso, Burchett, & Dobrow, 2011; Umoquit, Tso, Vargas-Atkins,
O'Brien, & Wheeldon 2013).
The most comprehensive studies of elicitation techniques were consistent in their
orientation to abstract diagrams. Research focused on abstract diagrams was minimal. The use of
student-generated, abstract diagrams to elicit prior knowledge of conceptual understanding was a
gap in the literature (A. Burton, Shadbolt, Rugg, & Hedgecock, 1990; Cooke, 1994; Dieste &
Juristo, 2011; Gavrilova, Leshcheva, & Rumyantseva, 2011; Jones, Miles, & Read, 1996;
Marshall & Gordon, 2011; Purchase, 2014; Umoquit et al., 2013).
Purpose and Significance
The purpose of this case study was to describe a diagram technique that was made
operational for use as an elicitation of prior knowledge technique using student-generated
diagrams. This study describes my observations and interpretation of the instructors’ responses
to the diagram elicitation exercises conducted in their classrooms.
This case study is significant because the method explores a technique for eliciting prior
knowledge in the classroom that places minimal requirements on the students, instructors, or
researchers when learning to use abstract diagrams as a communications tool. The diagram
technique links prior diagram research to new research by using a novel, but common visual
language (geometric shapes) situated in a conceptual space (Gardenfors, 2000, 2014). The study
offers conceptual change theorists a tool for conducting studies using diagrammatic data
collected from multiple dimensions (Vosniadou, 2008, 2012). This study adds to the growing
body of research in the field of spatial intelligence and spatial cognition through the contribution
of a general technique for eliciting domain-specific external representations (Waller & Nadel,
2013). It describes an accessible and easy-to-adapt technique for studying the differences in the
embedded binary relations of conceptual topology found in cognitive spatial models (Leighton &
Gierl, 2007, 2011).
Research Design
The research was presented in the form of a case study, considered here to be the best
approach to describe my observations of the students and instructors in the four different

6
classroom settings. Yin (2009) recommends a project plan orientation to the tasks associated
with designing, preparing, collecting, analyzing, sharing, and reporting. This approach best
supported the various timelines, logistics, and coordination required for data collection that took
place across four campus locations. The hierarchical order of the student data in the diagram
artifacts was based on the unit of analysis construct suggested by Yin (2009). This orientation
provided the top-down organization for managing the data collection tasks and resources.
The structure of organizing the research data from the bottom-up was based on the
integrative node-link structure proposed by Maxwell (2013). This made it possible to easily
organize, visually contrast, and compare the individual student diagram topology across the
students, classes, and subject levels. The Maxwell topology and conceptual framework placing
the research questions as central to the case study aligned to the concepts of geometric topology
and abstraction suggested by Egenhofer (1991).
The Conceptual Framework
This study is positioned within the disciplines of adult learning (Knowles, Holton, &
Swanson, 2005) and human development (Deacon, 1998; Staats, 2012). The research is based on
constructivism as the conceptual framework (Fosnot, 1996). Early discourse in philosophy
informed our inquiry into learning and development beginning during the time of Plato and
Aristotle. The origins of modern educational psychology and constructivism were based on the
works of Dewey (1916), Piaget (1954), and Vygotsky (1978). The work by Ausubel (1960) in
developing advanced organizers provided a grounded approach to creating physical artifacts that
represented prior knowledge and new learning. Contributions from computer science, artificial
intelligence, and the cognitive sciences accelerated the introduction of constructivism to
educators inside and outside the classroom (R. Anderson, Spiro, & Montague, 1977; Newell &
Simon, 1972; Novak & Gowin, 1984; Sowa, 1984). This stream of research led to public debates
in the field regarding the efficacy of the various constructivist approaches to learning in the
classroom and were detailed in the work by Tobias and Duffy (2009).
The evolution of constructivist theories in recent years positions students in the classroom
as occupying a mental space wherein they construct conceptual knowledge (Fiorini, Gardenfors,
& Abel, 2014; Gardenfors, 2014; Gardenfors & Zenker, 2013; Warglien & Gardenfors, 2013).

7
The diagram technique brought this mental space to life by grounding the elicitation of
conceptual knowledge in the form of crayons and paper. This process placed the study as one
more contribution to the catalogue of constructivist approaches to knowledge creation in the
classroom (Buckley & Waring, 2013; Cromley, Bergey, et al., 2013; Cromley, Perez, et al.,
2013; Novick & Catley, 2014; van Garderen et al., 2013).
Research Questions
The research questions were designed to position the case study as a report of my
observations of students using geometric shapes to diagram their prior knowledge in four
different classroom setting. The research questions provided a structure to analyze the diagram
differences, investigate how students could use the diagrams in a group setting, and follow up
with the instructors regarding their experience in observing the elicitation technique. The
research questions are provided below.
How can abstract diagrams constrained by domain-general, geometric shapes be made
operational in a diagram elicitation technique, and thereby make prior knowledge of
students accessible visually within the context of a domain-specific classroom setting?
How can the diagrams offer learners the opportunity to collaborate and share diagrams
that could lead to the creation of shared prior knowledge?
To what extent does the instructor perceive the diagram technique to be useful as a tool
for eliciting prior knowledge at the individual level, and at the group level?
Assumptions and Limitations
This dissertation described the facilitation and elicitation of student-generated diagrams
based on a technique that was created for a class project. The research questions provided the
basis for situating the student-generated diagrams as a visual technique for representing student
prior knowledge. The diagram technique described in this study was designed to align with the
Larkin and Simon research framework of using node-link structures to illustrate the differences
in the search, recognition, and inferences possible when using a topology of visual indexes
(Larkin & Simon, 1987). A general assumption was made in the study that students would be
familiar with the basic use of paper and crayons in the context of creating triangles, squares, and

8
circles. Beyond that prior knowledge, the study did not infer or assume any prior knowledge by
the student regarding abstract diagramming knowledge, skills, or abilities.
This study did not address the elicitation of diagrams using concrete visual
representations given the existing body of literature noted in this area by Purchase (2014). It did
not seek to collect and interpret data with the goal of inferring diagram meanings or semantics of
the student-generated diagrams, although this area is a new and emerging area in the diagram
research (Galantucci, 2010; Gardenfors, 2014). The possible combinations and permutations of
diagram shapes, topology, and relations are theoretically infinite (Papadimitriou & Steiglitz,
1982). The study did not seek to explore and document methods for creating subject-specific
lexicons, vocabularies, or referent diagrams in a given domain of study for this reason.
Definition of Terms
The key terms are defined for the reader in this section. The terms are in such general use
across domains that they can be easily misinterpreted. The definitions are provided within the
context of how they are used in this study and not meant to extend these interpretations or
meanings to other research domains.
Diagram is defined within the context of this study as a visual image that is constructed
through the physical process of locating a point and a connecting line on a drawing canvas, in
this case, a piece of blank paper (Larkin & Simon, 1987).
The diagram is further constrained by the limitation that excludes embellishments,
annotations, labels, numbers, and other special notations, making the diagrams abstract in
contrast to concrete diagrams (Purchase, 2014).
The node-link, point-line connections must be constructed in such a way as to create the
geometric shapes of triangles, squares, or circles. These are the only shapes allowed in the
diagram created by the students. This rule or specification is referred to in the literature as a
shape grammar (Stiny, 1975).
The drawing canvas is embodied in the form of a blank sheet of paper measuring 8.5 by
11 inches. The diagramming utensils are a random collection of colored crayons chosen by the
students from a large selection stored in a box. The materials make it possible for students to

9
construct external representations of internal thought processes in a location referred to by
cognitive science researchers as a conceptual space (Gardenfors, 2000, 2014).
Domain as used in this case study refers to a body of knowledge that is normally
identified by a subject label such as physics, economics, biology, and mathematics (Novick,
2006). Domain-specific is meant to communicate that a noun or adjective is specific to one
domain when compared to other domains. Domain-general is meant to communicate or describe
a noun or adjective that can be applied across different domains (Novick, 2006).
Knowledge describes the collection of facts, processes, information, data, skills, and
abilities associated with a subject area (Sowa, 1984). In turn, it follows that prior knowledge is
the collective knowledge a student brings with them to the classroom that they have acquired
through education, training, and life experience (Dochy et al., 1999). The study adopts the
further breakdown of prior knowledge into declarative, procedural, or conceptual types of
knowledge (Jonassen, 2006; Jonassen et al., 1993; Jonassen & Strobel, 2006).
Declarative knowledge refers to the collection of facts, statements, and principles that
describe a subject or specific domain (Jonassen, 2004).
Procedural knowledge refers to the collection of processes, methods, and activities that
describe how to act upon or with facts, statements, principles, or physical objects in a subject or
specific domain (Jonassen, 2004).
Conceptual knowledge refers to the collection of symbolic representations, space-time
events, and physical things humans experience in life. Similar features shared by concepts and
the similar relationships shared between concepts are used to describe classes of symbolic
representations, space-time events, and physical things (Jonassen, 2004; Murphy, 2004).
Topology is a mathematical concept that defines a set of points, along with a set of shapes
described by the points, and includes a definition of the relations between the shapes in a two-
dimensional plane (Egenhofer, 1991; Mendelson, 1962).
Binary relations are a categorization of the eight possible topological relationships that
can exist between two shapes in a two-dimensional plane (Egenhofer 1991, 1994).

10
Summary
This chapter presented a description of the origins and background that motivated my
desire to conduct this case study. Chapter Two reviews the research addressing the use of
diagrams as an elicitation technique for engaging the student’s prior knowledge in a classroom
setting. The review of the literature also includes a discussion of dissertations that address
diagrams and student prior knowledge. Chapter Two also provides a discussion of constructivism
as the conceptual framework that grounded this study within the historical context of learning
theories.
Chapter Three describes the elicitation technique, materials, and the participants from
each of the four different classroom settings. The subject domains represented in the case study
included college teaching, project management, and operations management. The chapter
includes examples of the student-generated diagram artifacts. Chapter Four provides an analysis
of the elicitation exercise and of my observations working with the students and the instructors.
The study concludes with a discussion in Chapter Five of a summary of the observations,
findings, and insights resulting from the experience of facilitating the diagram exercises, eliciting
the abstract diagrams from the students, and performing the pattern analysis of the diagram
topology across the four classroom settings. The study recommends avenues for further research
and study.
11
CHAPTER TWO – LITERATURE REVIEW
This chapter describes the background, theoretical framework, and literature related to
diagrams and prior knowledge. My preparation for developing the diagramming technique
included a literature search in preparation for a class project (Klunk, 2009). That initial search
did not produce any results specifically focused on diagramming prior knowledge. I was
fortunate during my research for this case study that Purchase (2014) published a summary of
diagram research based on conference proceedings covering the period 2000 through 2012. She
established the Larkin and Simon (1987) article as marking the beginning of the diagram
research field. Her summary of diagram research covered 177 papers and 135 posters. Her
research served as an important tool for me in placing my work within the historical timeline of
the diagram research literature.
I consider Larkin and Simon (1987) the foundational document in the field. The authors
made a clear distinction between abstract diagrams and concrete diagrams. Abstract diagrams
played a prominent role in my research. This chapter reviews the literature relevant to the use of
abstract diagrams as a technique for eliciting prior knowledge and concludes with a summary of
how my study contributes to the body of diagram research.
Background
During my research in 2009, I could not find literature related to the use of
abstract diagrams in the classroom. I was familiar with the research by Herbert Simon related to
problem solving (Newell & Simon, 1972) based on my studies during the period 1982-1985,
while a graduate student at the University of Southern California. His later collaboration focused
on diagrams (Larkin & Simon, 1987) and surfaced as an important resource for me while
preparing for the class project in 2009. Larkin and Simon did not perform any experiments or
involve any participants as part of their 1987 study. To the contrary, they begin the paper with a
definition of an abstract diagram. Diagrams are a node-link data structure that exhibits
advantages over text when used to communicate information to the viewer. They used several
problem statements in physics, geometry, and economics to illustrate how a diagrammatic
representation allows for more efficient search, recognition, and inferences by the human mind.
They pointed out that the mind processes spatial and geometric topology with greater ease and
efficiency when compared with the processing of textual information.

12
The survey by Purchase (2014) covered diagram research beginning with the work of
Larkin and Simon in 1987. Her introduction included a definition for the term diagram, which
she defined as “a composite set of marks (visual elements) on a two-dimensional plane that,
when taken together, represent a concept or object in the mind of the viewer” (Purchase, 2014, p.
59). Her definition was similar to that of Larkin and Simon. I used this definition in my study.
Purchase organized her research by making a distinction between concrete diagrams and
abstract diagrams. Concrete diagrams have a direct visual relationship to the object they depict.
Abstract diagram have an indirect relationship to the object or concept. My study focused on
abstract diagrams. Research by Purchase (2014) noted that abstract diagrams appeared rarely in
the literature. She identified the Larkin and Simon (1987) work as foundational, but revealed that
diagram use in the classroom was mentioned in only three works covered in her survey
(DeLeeuw & Hegarty, 2008; Epstein & Keibel, 2002; Manalo & Uesaka, 2012). These
researchers addressed diagrams in the form of spatial mental models as problem representations,
how diagrams influenced language ability and imagination, and the role of diagrams in human
problem solving. Her observations confirmed my own research experience where I found very
little literature regarding the use of abstract diagrams in the research literature. The majority of
diagram research was based on diagrams that included notations and embellishments in the form
of lines, arrows, dots, and labels. These make diagrams more concrete.
In this case study, I was particularly interested in the advantages that minimalist, abstract
diagrams afforded the viewer, in a way that improved the recognition of differences between
indices. Larkin and Simon (1987) illustrated how the indexing system of nodes and links in a
diagram preserve the topological and geometric relations of the indices. They did not provide a
method for classifying these differences found in the indexing system.
This problem was solved by Egenhofer (1991). He described the differences between two
node-link indices using the concept of binary relations. These relations preserved the topological
and geometric features between the two shapes. I used geometric shapes for my project in 2009. I
did not have a way to explain the differences in the diagrams in a qualitative way for that project.
It was during the research for this study that I discovered the work by Egenhofer (1991, 1994)
related to topology. His work provided the missing link back to the study by Larkin and Simon

13
(1987). The binary relations provided a way for me to understand and describe the differences in
the shapes when comparing the diagrams created by the students.
The problem posed in this case study was that of the university professor who wants to
engage the students and make their prior knowledge of concepts in a domain of study easy to
recognize and easy to infer differences. Abstract diagrams make it possible to search for and
recognize differences with less mental effort than with the use of textual information.
Representing misconceptions of prior knowledge using abstract diagrams in this way is a novel
approach. This technique for creating a visual foundation of conceptual knowledge supports the
recommendations cited by the National Research Council (Bransford, 2000). These differences
can be expressed using the language of binary relations (Egenhofer, 1991). These differences in
conceptual understanding can then be characterized in qualitative, topological terms: disjoint,
contains, inside, equal, meets, covers, covered by, and overlap. These qualitative features of a
diagram topology are discussed later in this chapter.
Literature Survey Rubric
The goal of my literature review was to find research related to diagramming, prior
knowledge, and university classroom settings. The majority of the research reviewed by
Purchase (2014) concerned concrete diagrams, although several studies did relate to abstract
diagrams. I created a question rubric to help identify research that met the goal of my review.
The literature survey rubric assisted me in identifying applicable studies. Given the differences in
how researchers define diagrams, prior knowledge, and student-generated diagrams, the rubric
functioned as a tool for organizing the studies in a systematic way. The questions are described
below. A short description following each question provides my logic in applying the question to
the literature under review.
1. Did the article reference the Larkin and Simon article from 1987? In my detailed
review of Purchase (2014), Egenhofer (1991), and Larkin & Simon (1987), it
appeared to me that Larkin & Simon’s presence in the references of an article was a
strong indicator of the article’s point of view. After reviewing several hundred
abstracts that contained diagram in the keyword list, many did not contain the citation
for the Larkin and Simon article. These data were very useful in separating research

14
into abstract diagram research and concrete diagram research. As Purchase (2014)
found, very little research was available that addressed the use of abstract diagrams.
2. Did the article describe abstract diagrams using a definition similar to that provided
by Larkin and Simon (1987) or Purchase (2014)? Abstract diagrams contained node-
link, point-line geometry. Determining how the researcher defined a diagram was
useful in the assessment of the study and how it could be applied to my case study.
None of the articles contained diagrams that met the strict definition of node-link data
structures.
3. Did the diagram described in the article reference the Egenhofer (1991) topology of
binary relations? Egenhofer is considered a seminal thinker in the geographic
information systems (GIS) community and was the creator of the topology used to
describe the eight binary relations. If the article did not reference his work or that of
another researcher mentioning diagram topology, this lack of reference was noted.
4. Was the diagram generated by the student? The article by Larkin and Simon (1987)
stated that their research showed how mental images and mental processes in the
brain could be well represented by external symbolic diagrams. Studies that did not
include student-generated diagrams were also annotated as such. I was specifically
interested in the diagrams generated by students. Diagrams created by others and used
to make inferences about what a student might be thinking is a much more difficult
psychological research effort. Techniques for conducting such mind-reading
experiments are still considered experimental (Goldman, 2006).
5. Was the diagram intended to represent the student’s prior knowledge? Purchase
(2014) identified diagram research that included the use of student-generated
diagrams. Upon closer inspection, these diagrams were concrete and contained the
addition of notations and embellishments. The focus of my case study was the
representation of prior knowledge using abstract diagrams. I made an annotation of
the research that included student-generated diagrams and then further categorized the
type of diagram as either abstract or concrete.
The rubric helped me define the nature of the gap in the literature. I noticed a general
pattern that emerged through my use of the question rubric. The first group of articles did not cite
or reference Larkin and Simon (1987). The second group of articles did cite Larkin and Simon

15
(1987) but did not cite Egenhofer (1991). The third group of articles included student-generated
diagrams, but did not define diagrams in a way that qualified them as being abstract.
Prior knowledge was the other concept used in the question rubric. Research about prior
knowledge appeared predominantly in the fields of educational psychology and the learning
sciences (Amadieu, van Gog, Paas, Tricot, & Mariné, 2009; Cook, Wiebe, & Carter, 2008;
Dochy et al., 1999; Meyer, 2004; Novick & Catley, 2014; B. Rittle-Johnson, Star, & Durkin,
2009; Williams & Lombrozo, 2013). I could not locate research about prior knowledge that also
cited the works by Larkin and Simon (1987), Egenhofer (1991), or Purchase (2014).
There were studies that made reference to elicitation techniques. These studies
characterized elicitation as a technique for understanding and documenting the knowledge of
experts (Carrizo, Dieste, & Juristo, 2014; Dieste & Juristo, 2011; Gavrilova & Andreeva, 2012;
Ley, Kump, & Albert, 2010), but did not include eliciting abstract diagrams. Three articles did
surface related to graphic elicitation, but not eliciting abstract diagrams (Copeland & Agosto,
2012; Crilly, Blackwell, & Clarkson, 2006; Umoquit et al., 2013). The example of using the
rubric to evaluate research that contained data related to elicitation was just one scenario in
which the questions helped identify relevant research.
Conceptual Framework
The rubric was useful in filtering the research from the bottom up. The conceptual
framework helped place the case study within the context from the top down of constructivism
(Fosnot, 1996). Constructivist theory evolved from the writings and research of Dewey (1916),
Piaget (1954), and Vygotsky (1978). Dewey viewed education as a practical experience, one that
led to the construction of knowledge and skills by the student, for application to problem solving
in daily life. His pragmatic philosophy was the foundation upon which Piaget and Vygotsky
developed their psychologically-oriented theories of constructivism.
Piaget’s early work embraced the structure and role of wholeness, transformation, and
self-regulation in psychological development (Piaget, 1970). This was followed by his later work
which detailed his views on the role of cognition in human development (Piaget & Brown,
1985). He viewed thinking as an internal cognitive response to changes in the external
environment. Cognition was an attempt to maintain a physical and psychological equilibrium in

16
reaction to human experiences in the real world. Piaget further refined his characterization of
equilibrium by referring to them as a process of assimilation and accommodation. This led Piaget
to formulate his theory of equilibrium based on two postulates: “Every assimilatory scheme
tends to incorporate external elements that are compatible with it…” and “Every assimilatory
scheme has to be accommodated to the elements it assimilates…” (Piaget, 1985, p.6). This
reminded me of the balance that a professor might seek in the classroom to assimilate and
understand the prior knowledge of the students in a way that is equal to the objective.
In contrast to Piaget’s development theory, Vygotsky’s theory of learning and
development positioned the student’s response to change as a socially mediated experience
(Vygotsky, 1978). Vygotsky viewed learning and development as the outcome of shared social
activities that are internalized by the student (John-Steiner & Mahn, 1996). Vygotsky conceived
of the zone of proximal development as “the distance between the actual development level as
determined by independent problem solving, and the level of potential development as
determined with problem solving exercises, under adult guidance or in collaboration with more
capable peers” (Vygotsky, 1978, p. 86). During my experience using the diagram elicitation
technique, it occurred to me that the student diagrams represented a “zone of proximal
conceptualization,” where the students use diagrams to explore their own knowledge of concepts
as they anticipate the addition of new information. This concept is also present in the theory of
conceptual spaces (Gardenfors, 2000, 2014).
The learning theory of Ausubel (1968) extended the constructivist philosophies of
Dewey, Piaget, and Vygotsky in the form of his development of the advance organizer, a well-
established technique for organizing the student’s prior knowledge in advance of new learning
(Ausubel, 1960). The diagram technique described in this dissertation could be interpreted as a
type of advance organizer, one that is manifested in the form of student-generated diagrams.
The advance organizer was followed by researchers who were influenced by the arrival
of computers. These researchers developed constructivist techniques under topics such as
knowledge management (L. Anderson & Krathwohl, 2001), knowledge ontology (Sowa, 1984),
and knowledge taxonomy (L. Anderson & Krathwohl, 2001; Duffy & Jonassen, 1993). These
techniques made it clear that conceptual knowledge was the most abstract form of knowledge
when compared with declarative and procedural knowledge (Foshay, Silber, & Stelnicki,
17
2003).This insight from constructivist learning theory reinforced the choice of questions used in
the diagram technique itself. I developed the elicitation questions to prompt the students to think
conceptually when creating diagrams.
The differences of opinion regarding the role of constructivist theory in the classroom are
documented in the literature (Kirschner, Sweller, & Clark, 2006; Tobias, 2010). I align myself
with those in the research field who believe that graphic tools used by students in the classroom
are constructivist by design (Barone & Cheng, 2005; Cheng, 2002, 2011; Cook, Carter, &
Wiebe, 2008; Garcia & Pacheco, 2013; Kolloffel, Eysink, & de Jong, 2010, 2011; Rau,
Michaelis, & Fay, 2015). I now turn to a detailed investigation of prior knowledge to better
position the importance of using abstract diagrams to elicit the conceptual understanding of
students.
Prior Knowledge
The rubric was also used to filter research from the bottom up that addressed prior
knowledge. Ausubel (1968) is the best known advocate for engaging the student’s prior
knowledge in a way that supports the construction of new learning. More recent works advocated
for engaging the student’s prior knowledge as important part of building a foundation for new
learning (Amadieu et al., 2009; Ambrose et al., 2010; S. Chen & Huang, 2013; Khosrowjerdi &
Iranshahi, 2011; Rokers, 2007; Wetzels, Kester, & van Merriënboer, 2011; Williams &
Lombrozo, 2013). Much of the prior knowledge research happens in domain-specific settings (S.
Chen & Huang, 2013; Cordova, Sinatra, Jones, Taasoobshirazi, & Lombardi, 2014; Novick &
Catley, 2014; Williams & Lombrozo, 2013). These articles follow a line of inquiry illustrated in
the research by Gick and Holyoak (1980). They described how students transferred the prior
knowledge of solving one problem to the task of solving a subsequent problem. Students were
provided a hint by the researcher to re-read a story about how a similar problem was solved. This
technique helped to activate memory of previous problem solving techniques.
Prior knowledge operates in settings outside the classroom as well. For example, research
has shown how the prior knowledge of soccer matches and players led to a higher recall of
soccer scores in one group than the recall of scores by those in another group with less soccer
match viewing experience (P. Morris, Gruneberg, Sykes, & Merrick, 1981). I used the three

18
different types of prior knowledge (declarative, procedural, and conceptual) to help the reader
locate my study within the larger body of educational research literature. This distinction
between these types is important. Framing conceptualizations by students within a domain of
study provides insight into the general applicability of the diagram technique across subject areas
and classroom settings.
Declarative Knowledge
The educational research literature categorized knowledge as being declarative,
procedural, or conceptual in nature. The literature does not explicitly make distinctions between
past knowledge, current knowledge, and future knowledge. The characterization of knowledge as
being “prior” is discussed in greater detail later in this chapter. In this dissertation, prior
knowledge is positioned as knowledge that is constructed by the student (Jonassen et al., 1993).
The construction of declarative knowledge is characterized by facts, figures, events, and objects
(Bolc & Carbonell, 1987). Declarative knowledge can be represented through spoken, visual, or
written forms of communication (Deacon, 1998; Pinker, 1997). It can also be exhibited through
the knowledge of how to do something, and communicated through action (Pouw, van Gog, &
Paas, 2014), or through interactions with physical objects in the real world, such as navigating a
ship or flying an airplane (Hutchins, 1995). This type of knowledge is thought to be stored in
long-term memory in the form of mental schemas. These schemas or scripts enable the learner to
know the “what” of a subject or domain (Bartlett, 1967; McVee, Dunsmore, & Gavelek, 2005;
Schank & Abelson, 1977; Tversky, 2001).
Procedural Knowledge
The second type of knowledge described in the literature was procedural in nature and is
the knowledge a student constructs to show they know “how” something works (Branch, 2009;
Foshay et al., 2003). Procedural knowledge is knowing about the sequence of steps required to
solve problems (Bethany Rittle-Johnson & Alibali, 1999). The goal of improving procedural
knowledge is often based on the study of expert knowledge (J. Anderson, 1996; Chi, Feltovich,
& Glaser, 1981; Chi, Glaser, & Farr, 1988; Ericsson, 2006; Farrington-Darby & Wilson, 2006;
R. Hoffman, Shadbolt, Burton, & Klein, 1995; R Hoffman, Ward, & Feltovich, 2013; Larkin et
al., 1980). The orientation of the research on procedural knowledge is very often domain-
specific, and designed to cover specific skills and abilities (Canobi & Bethune, 2008; B. Rittle-

19
Johnson et al., 2009; Schneider, Rittle-Johnson, & Star, 2011). The majority of the diagram
research reviewed by Purchase (2014) is focused around the study of how diagrams can be used
to improve business processes (Laguna & Marklund, 2005).
Conceptual Knowledge
The third type of knowledge described in the literature was referred to as structural
knowledge (Jonassen et al., 1993). Over time the educational psychology field came to see
structure in all types of knowledge (O'Donnell, Dansereau, & Hall, 2002). The term conceptual
knowledge better represented the students understanding of concepts and the relationships
between concepts (Barsalou, Simmons, Barbey, & Wilson, 2003; Gardenfors, 2000; Sowa,
1984). Conceptual knowledge functions as a higher level construct that includes links to
declarative knowledge and procedural knowledge (Thagard, 1992).
This dissertation is focused on the elicitation of the student’s conceptual knowledge using
a domain-general diagramming technique. The research addresses the use of diagrams in
relationship to these three types of knowledge (declarative, procedural, and conceptual).
Purchase (2014) identified abstract diagrams, student diagrams, and conceptual knowledge as
one of the areas in which there was little representation in the research. Research related to
diagrams is reviewed in the next section.
Diagrams
I used the question rubric to locate the relevant research that was directed at abstract
diagram use in the classroom and grounded in the works by Larkin and Simon (1987), Egenhofer
(1991), and Purchase (2014). While the literature reported various taxonomies for organizing
diagram research based on the researcher’s personal preferences, I chose to link abstract
diagrams to a qualitative topology, and then follow the different threads of diagram research
reported by Purchase to compare and contrast the research to my study goals. Examples of the
variations that surfaced in the literature regarding diagram taxonomies, diagram standards,
diagram terminology, diagram research frameworks, and diagram grammars are discussed
below.

20
Research Taxonomies
Research taxonomies varied in the research according to Purchase (2014). She organized
her review into nine topics: notations, translation between external representations of diagrams
and semantics, the nature of diagrams, cognitive models of diagram comprehension, the study of
diagram comprehension, internal diagram manipulations, tools that support diagram use,
graphical literacy, and miscellaneous research. This taxonomy led to the discovery of other
works that published various diagram taxonomies and were collected in a study by Blackwell
and Engelhardt (2002). Their report had a diagram topology that included vocabulary, tokens,
abstraction, structure, mode of correspondence, represented information, task and interaction,
cognitive processes, and social context. The highlight of her work and review of these studies
was in her categorization of diagram types being either abstract or concrete. She only found three
articles or posters which covered abstract diagram use out of the 312 she reviewed (Purchase &
Samra, 2008; Ware, Gilman, & Bobrow, 2008; Yoon, Narayanan, Lee, & Kwon, 2006). None of
these three studies included concepts related to student-generated diagrams, prior knowledge,
diagram topology, or elicitation techniques.
Standards and Terminology
Purchase (2014) pointed out that diagram research standards and terminology vary. This
was also confirmed by research originating in the health care domain (Umoquit et al., 2011). The
variation in diagram research taxonomies extended to diagram use in grounded theory (Buckley
& Waring, 2013), diagrams used to augment research in cognitive architecture (Chandrasekaran,
Banerjee, Kurup, & Lele, 2011), diagram use in visual language theory (Cheng, 2014; Flower,
Stapleton, & Rodgers, 2014; Gottfried, 2014, 2015), diagrams in a descriptive role in knot theory
(De Toffoli & Giardino, 2014), diagrams used in political science research (Mahoney &
Vanderpoel, 2015), diagrams used in problem solving research (Mahoney & Vanderpoel, 2015),
and diagram use in understanding tree thinking skills of college students (Phillips, Novick,
Catley, & Funk, 2012). This may help explain the gap in the literature regarding abstract diagram
research.
Research Frameworks
A study by Cox (1999) described how graphics generated by students in the course of
solving problems took many forms, and included more than just diagrams (tables, charts, lists,
21
sketches, matrices). Diagram research extended across many disciplines (Adesope & Nesbit,
2013; Ainsworth & Loizou, 2003; Cromley, Bergey, et al., 2013; Kalyuga, 2008; Maries &
Singh, 2012; Moreno, Ozogul, & Reisslein, 2011; Uesaka, Manalo, & Ichikawa, 2007). There
did not appear to be a general diagram research framework that was common and in use across
research disciplines. This led to the insight that a more fundamental concept, that of
diagramming as a type of visual language, and the geometric shapes as grammars, might inform
the role and use of diagrams in the classroom (Brna, Cox, & Good, 2001; J. Burton et al., 2014;
Hyerle, 1996; Marriott & Meyer, 1998; Tversky, 2011; Wheeldon & Ahlberg, 2012). The
research linked diagrams to research in shapes.
Shape Grammars
Abstract diagrams surfaced in the field of architecture, but are referred to as shape
grammars, and considered a form of a visual language (Marriott & Meyer, 1998). This research
is a sub-field of study within computer science and cognitive science. Within this area of study,
three approaches are used to specify a visual language: grammatical, logical, and algebraic.
Shape grammars were first specified in works by Gips (1975) and Stiny (1975). A shape
grammar is a specification using shapes placed in a diagram. The diagram has a vocabulary
(shapes), a set of rules (topology), and a technique for producing new sentences (elicitation
questions and constraints). The study of shape grammars is confined to the fields of
environmental planning, computer-aided design, and architectural design (Benros, Duarte, &
Hanna, 2012; Knight, 1999; Yue & Krishnamurti, 2013). This narrow use of abstract diagram
grammars may be another reason why a gap exists in the diagram research literature. Visual
languages are a new, but still unknown discipline and not represented in the literature reviewed
by Purchase (2014). To investigate the research since 2012, the next section reviews recent
dissertations that addressed diagrams, prior knowledge, student-generated diagrams, and
elicitation techniques.
Dissertations
A general search of dissertation databases led to an initial collection of dissertations that
contained various combinations of keywords that included diagrams, prior knowledge,
elicitation, and students. A search using constructivism was also performed to locate literature
that might exist in the educational research domain. This first step resulted in a set of a 136

22
dissertations. Much like the experience encountered by Purchase (2104), the further inspection of
the abstracts revealed ambiguities in how the terms were used to code the studies by the
dissertation authors.
Thirteen dissertations qualified as meeting some part of the question rubric. I was looking
for dissertations in the literature that discussed the use of diagrams created by students. I was
looking for data that reflected similar findings by Larkin and Simon (1987) that showed how
abstract diagrams improved search, recognition, and inference. I was also looking for data that
indicated the researchers knew of or included references to the work by Egenhofer (1991). These
dissertations are discussed below and organized in the order of the rubric questions. The
discussion of the dissertation follows the question.
1. Did the dissertation reference the Larkin and Simon article from 1987?
The dissertation by Karrass (2012) was the only study that referenced the Larkin and
Simon article. He used arrows, lines, and labels to embellish the diagrams in the form
of sketches for geometric proofs. The labeling made the diagrams more concrete than
abstract. The study also used computer mediated technology to generate the proofs
and did not represent an external representation of the internal processes of the
students thinking. The technology was also domain specific and useful in the
mathematics domain.
2. Did the article describe diagrams using a definition similar to that
provided by Purchase (2014) and qualify as abstract diagrams? The dissertations in
the next group were selected because they were indexed under the keyword diagram.
Upon closer review, the diagram techniques used in the studies were actually
techniques better described as drawing (concrete pictures), sketching (storyboards),
and creating iconic representations (concrete objects found in biology and ecology).
These works did not cite the Larkin and Simon article from 1987 and did not define a
diagram as a minimalist, abstract, type consisting of node-link geometric shapes.
There was no discussion of an underlying typology of student conceptualizations of
prior knowledge.
3. Did the diagram described in the article reference the Egenhofer (1991)
study? The diagrams described in the thirteen dissertations all used enhancements,

23
embellishments, and annotations, which rendered the diagrams very concrete in their
appearance and use. This concrete type of diagram reduced the recognition of any
underlying binary relations that might have been present in the diagrams. None of the
studies included digital copies of the diagrams other than an exemplar. This made it
impossible to assess if differences were present in the diagram topology.
4. Was the diagram generated by the student? Nine of the dissertations were
situated in a university classroom and included a mix of undergraduate students,
graduate students, and student teachers attending pre-service training (Adesope, 2010;
Asmuth, 2009; Bussey, 2013; Karrass, 2012; Kline, 2012; Madsen, 2013; Pastore,
2009; Rosengrant, 2007; Yestness, 2012). Again, in the above studies, the diagrams
were composed of extensive forms of enhancements, embellishments, and
annotations, all with the intent of representing procedural and declarative knowledge.
Diagrams were not used to represent conceptual knowledge. Diagrams were
generated by students in only five instances (Bussey, 2013; Landin, 2011; Pillsbury,
2008; Rosengrant, 2007; Yestness, 2012). The students in two cases were middle
school students (Pillsbury, 2008). The diagrams that were created in all cases were of
a concrete nature and fell outside the definition of a node-link, abstract diagram as
defined by Purchase (2014).
5. Was the diagram a representation of the student’s prior knowledge? Seven
of the dissertations described an exercise in which the students were asked to
illustrate their knowledge. The elicitation questions in all cases asked about
declarative or procedural knowledge, using techniques of sketching, drawing pictures,
or diagrams that included enhancements, embellishments, and annotations (Bussey,
2013; Jessee, 2012; Karrass, 2012; Landin, 2011; Li, 2013; Pastore, 2009; Pillsbury,
2008). None of the dissertations used questions to prompt the student for their prior
knowledge of concepts or conceptual understanding. When students were asked to
create diagrams, the techniques were specific to the domain under study. For
example, using formula notation in mathematics was not transferrable to diagrams in
the domain of biology.
In summary, the manner in which these dissertations described the use of diagrams, how
diagrams were defined, how diagram use was implemented in the classroom, and how diagrams

24
were used as an instructional intervention, varied widely. The studies conducted outside the
university setting (high school and middle school) are noted under the author names. None of the
dissertations used abstract diagrams. Table 2.1 contains the summary of the research.
Table 2.1
Dissertations Summary According to the Question Rubric
Study
Author
Cite
L& S
Cited
Purchase
Cited
Egenhofer
Student
Diagram
Elicit Prior
Knowledge
Concrete
Diagram Types
Adesope 2010 No No No No No Concept maps of the human
nervous system
Kline 2012 No No No No No Physics diagrams of air pumps, carburetors, toilet arrows
Asmuth 2009
No No No No No Geometric diagrams of
hyperbolic lines, closed figures
Madsen 2013 No No No No No Physics diagrams with lines, labels, text, numbers, icons,
symbols
Rosengrant 2007 No No No Yes No Free body diagram
Yestness 2012 No No No Yes No Algebra
proofs
Karrass 2012 Yes No No No Yes Axioms, sketches,
parallelograms
Li 2013 No No No No Yes Engineering free body diagrams
Jessee – 2012
*High School
No No No No Yes Charts, graphs in civics and
economics
Pastore 2009 No No No No Yes Drawing with text of human heart
Bussey 2013 No No No Yes Yes Protein translation
Landin – 2011
*Middle School
No No No Yes Yes Biology tree taxonomy
Pillsbury – 2008 *Middle School
No No No Yes Yes Ecology tree taxonomy
*Studies involved university students except where noted.
Three studies were the most representative in approximating an understanding of student-
generated diagrams as a tool for knowledge discovery, but were aligned to very specific
domains. Research by Bussey (2013) was situated in a university biochemistry class setting and
showed how the appropriate level of diagrammatic abstraction was important to how well the
student acquired the new learning, but the diagrams were concrete in nature. Research by Landin
(2011) supported the idea that drawing about biology concepts improved learning in the
laboratory, but these drawings were also concrete in nature. Research involving middle school
students by Pillsbury (2008) used pictorial drawings in place of diagrams to assist in the

25
scaffolding of student learning in a semester long project in ecology. The techniques were not
generally applicable across subject areas.
Summary
The literature review expanded on the initial review first conducted for the class project
in 2009. My experience of not finding research related to diagramming prior knowledge led to
the literature search described in this chapter. The story of diagram research is told along the
review by Purchase (2014), wherein she established the work by Larkin and Simon (1987) as the
foundational paper in the diagram research field. They mentioned topology in their paper and
this reference led to the discovery of topology relations described by Egenhofer (1991). His work
provided the framework for understanding the qualitative nature of binary relations in abstract
diagrams. Chapter Three describes the diagram technique, the classroom setting, and the
participants. The analysis of the data is provided in Chapter Four. I close the case study in
Chapter Five with discussion and interpretation of my findings and recommendations for future
research.

26
CHAPTER THREE - METHOD
This chapter describes the diagram technique, the participants, the data collection, the
approach to data analysis, and the references that contributed to the organization of this method
section of the case study. The diagram elicitation technique was used to collect data from the
students in the form of abstract diagrams. The elicitation questions were based on a report by the
National Research Council (Bransford, 2000). The report summary noted three observations
common to student behavior when they enter the classroom at the beginning of a new semester.
Students enter the classroom with prior knowledge, a unique way of storing information in long-
term memory, and personal strategies for monitoring their own learning. My personal experience
as a graduate student and adjunct professor validated the challenges that students and instructors
go through when meeting for the first class. This chapter describes a technique designed to help
facilitate this introduction to new material at the beginning of the semester using a technique for
diagramming prior knowledge.
Background of the Elicitation Technique
The elicitation technique presented in this chapter is based on research by Larkin and
Simon (1987) who described advantages of diagrams over text when communicating
information. They argue that differences in diagrams are easier to recognize. The use of student-
generated, abstract diagrams appeared to be a gap in the literature based on the discussion in
Chapter Two. I designed this elicitation technique for general use by university instructors as
part of this case study. Students are provided crayons and three blank sheets of paper. Three
questions are used to elicit responses in the form of diagrams. The students have five minutes to
draw an answer to each question in the form of an abstract diagram. The diagrams can only
contain triangles, squares, and circles. They cannot use letters, numbers, labels, symbols, icons,
special characters, or other marks.
The elicitation technique was also based on a prototype of the technique first developed
for a graduate school project in 2009 (Klunk, 2009). The version of the technique described in
this study was changed to minimize the cost of materials by using blank paper and crayons. I also
adapted the questions to fit a domain specific course. My experience conducting similar
facilitations with small teams in industry and government settings are often followed by week-
long working groups, during which we develop conceptual models and problem-specific

27
vocabularies. The time limitations placed on the schedules in the university classroom
environment, prevented me from conducting these type of activities during this case study
Constructivist Orientation to Diagram Elicitation
This case study adopted a constructivist view of the processes related to students creating
diagrams of prior conceptual knowledge that was discussed in the context of other research in
Chapter Two. The elicitation technique is general in nature and designed to be adapted to many
domains and subject areas. The research questions were developed to explore the nature of
diagramming prior knowledge in the university classroom setting. The questions are provided
below.
How can abstract diagrams constrained by domain-general, geometric shapes be
operationalized in a diagram elicitation technique, and thereby make prior
knowledge of the students accessible visually within the context of a domain-
specific classroom setting?
How can the diagrams offer learners the opportunity to collaborate and share
diagrams that could lead to the creation of shared prior knowledge?
To what extent does the instructor perceive the diagram technique to be useful as
a tool for eliciting prior knowledge at the individual level and at the group level?
Organization of the Data
The research data was organized according to two principles. First, the interactive model
of research design (Maxwell, 2013) was chosen to provide a structure that enabled a many-to-
many set of relationships between the individual diagrams, the diagrams within a class, and the
diagrams as a singular collection of case study data. Second, the case study adopted the unit-of-
analysis concept to structure the comparison of similarities and differences between the diagrams
(Yin, 2009). The unit-of-analysis approach defines a boundary around each set of data created by
the student in the form of a diagram. The student diagram represented a collection of prior
knowledge concepts rendered in the form of geometric shapes on the blank paper. This approach
to guiding the students in producing abstract diagrams had the unintended outcome of making
visible a hidden topology in each diagram.

28
Interactive Structure
The value of the interactive structure advocated by Maxwell derives from the framing of
the diagrams as the central piece of data that establishes links between the study goals,
theoretical framework, units of analysis, and the tests of validity. The structure also aligned with
the organization of the data as representing a topology. The analysis addressed the hidden
patterns found in the topology of the diagram shapes. At first glance, diagrams of this type
appear to have nothing in common. The data analysis uses binary relations embedded in the
topology to make the relations explicit. What might appear to be just a collection of student-
generated diagrams of unlimited and random combinations are actually a visual representation of
hidden patterns of conceptual relationships and prior knowledge rendered as diagrams.
Participants
The participants in this study included the students and the sponsoring instructors. I
performed the tasks of facilitating the diagram elicitation technique. The instructors hosting the
facilitation in their classrooms observed the creation of the diagrams by their students, but did
not participate in the diagramming technique. Each class was comprised of students who agreed
to create diagrams at the invitation of their instructor. Students were provided the opportunity to
opt-out of the exercise at the beginning of the class, but none did so. Selection criteria,
confidentiality, protection of the participant identity, and researcher biases are discussed in the
following sections.
Students
The students were enrolled at four universities located in the eastern United States, two
groups in graduate level classes, and two groups in undergraduate level classes. One university
was located more than fifty miles from a major metropolitan area. The second location was a
suburban campus located outside a major metropolitan area. The remaining two facilitations took
place in urban campus locations. One institution was a privately chartered university and the
others were state chartered public universities. The diagram technique did not require any
specific classroom configuration, layout, or equipment. The classroom settings accommodated
the diagram facilitation equally. I did not collect demographic data. There appears to be little
existing research that could provide a basis for qualitative or quantitative correlations, or

29
meanings that might be related to attempting to map shape styles and configurations to student
gender, age, or ethnicity.
Student selection method. The students participating in the case study were invited to do
so through an email communication originating from the sponsoring instructor. The instructor
notified the students in advance of the facilitation exercise. The date and time were proposed in
advance. Students were provided the opportunity to opt-out of the exercise in advance. On the
day of the facilitation, prior to the commencement of the classroom session, the students were
also provided the opportunity to opt out of the exercise. The instructors explained that there were
no prerequisites required for participation in the exercise and that it was not part of any course
assessment.
Student confidentiality and anonymity. The confidentiality of the students was
maintained in several ways. First, the diagramming materials provided to the students consisted
of blank paper and crayons. These materials did not contain any markings that would identify the
student. Second, the diagrams contained a blank line at the top of the page. The students were
asked to think of a random eight digit string containing letters and numbers. Each student was
instructed to place the same alphanumeric string at the top of each of the three sheets of blank
paper. This unique string served as an identity label for organizing the diagrams in sets without
disclosing their personal identity. I also asked the students to place a classroom code at the top of
the three pages to identify each classroom. The student diagrams were collected by a student
volunteer at the completion of the exercise. The volunteer placed the diagrams in an envelope
and returned the envelope to me at the conclusion of the facilitation event.
Instructors
I invited the instructors to participate in the case study based on a personal and
professional relationship. They had expressed a shared interest in the use of diagrams in the
classroom. I provided the instructors with the background, history, and artifacts representative of
the diagrams and technique. The instructors were provided a copy of the Institutional Review
Board application prior to their agreement to participate in the facilitation exercise.
Instructor confidentiality and anonymity. The confidentiality of the sponsoring
instructors was protected by excluding the use of data related to classroom settings, instructional

30
syllabus, or student enrollment. The instructors did not participate in the diagram elicitation
exercise.
Participant Biases
I used a minimal set of instructions and basic shape rules to minimize bias that might be
introduced by the instructors and students to the data collection technique. The abstract nature of
the diagram does not guarantee that some diagrams may be a marginal effort on the part of the
student when creating a conceptual diagram of their prior knowledge. The type of bias I have
experienced in the past when using this technique in a work setting, takes the form of a
participant choosing not to create diagrams. The other response I have observed that would
qualify as a form of bias is the creation of highly primitive diagrams that violate the shape rules
in which the allowed forms are triangles, squares, and circles. The instructors did not create
diagrams. I did collect data from the instructors in the form of a set of questions. They reserved
the right to opt out of responding to the questions. One instructor did respond to the questions.
To minimize my own bias as the researcher as I interacted with the student participants
during the facilitation of the elicitation exercise in the following way. I provided the students
with blank paper and crayons. I did not engage in any diagram instructional interventions other
than reading the diagram instructions. The instructions I used are provided in the appendices.
Data Collection
The data collection technique described in this study was created based on a prototype
that was created for a graduate school project in adult learning facilitation (Klunk, 2009). This
section includes a description of the history and background of the prototype. Changes made to
the prototype for use in the case study are noted in the following section.
Prototype
The idea of using a diagram technique in the class project and the case study grew out of
my professional experience creating entity-relationship diagrams (E-R) in my role as a data
architect. E-R diagrams are highly constrained diagrams that describe logical and physical
models of computer information systems. The E-R diagrams serve the purpose of translating the
business user’s conceptual requirements into the technical user’s conceptual designs. This

31
diagramming experience in industry led me to the idea of using diagrams as a technique in the
class project in 2009. The elicitation technique was later modified slightly to accommodate the
facilitation in larger classroom settings.
Materials
The diagram prototype technique created for the adult learning class (Klunk, 2009) used
large sheets of white poster paper, geometric shape foam pieces, and glue sticks. The materials
used in the prototype were effective in engaging the students in knowledge construction
activities. Using identical materials was not deemed manageable when used in a larger university
classroom setting due to time and material constraints. This led to the decision to use paper and
crayons in the university classroom facilitations.
Stimulus Questions
The format for the stimulus questions was based on statements made in the National
Research Council report on learning in the classroom (Bransford, 2000). The report included
three observations that related to student epistemology, long-term memory, and meta-cognition.
These insights provided the basis for creating three stimulus questions for use in the elicitation
technique. The format of the three questions is provided below.
How do you think _______ works?
How do you store information about ______ in long term memory?
How do you monitor your own learning about ______?
The question formats were constructed as templates for use by instructors in a subject
domain. The questions function as fill-in-the-blank type of diagram elicitation stimulus
questions. For example, the questions provided below illustrate how they appear when how-type
questions are used in an elicitation exercise for a class in adult learning. For such an introductory
course, it could be useful for the instructor to quickly assess how varied the student’s
conceptualizations of prior knowledge about the concept of adult learning that they bring with
them to the classroom might be. Note that this technique could have been applied to virtually any
domain of learning in any class on any topic—its application within a course on adult learning
was purely opportunistic.

32
Some students may have a background in elementary education, some may be
professional trainers working in a corporate setting, and others may be researchers for a not-for-
profit social services outreach organization serving minority communities. Each student would
likely have a unique perspective as to how adult learning operates in the real world. This
scenario describes the setting that was the basis for the experimental prototype conducted in
2009 as part of the class project.
The sample questions are provided below as an illustration of how questions appear in
this context.
How do you think adult learning works?
How do you store information about adult learning in long term memory?
How do you monitor your own learning about adult learning?
Diagram Elicitation Procedures
The steps facilitating the diagram elicitation technique are described below.
1. Explain to the students that they will be participating in an exercise that asks
them to create diagrams using geometric shapes in response to three questions.
2. Explain to the students that the objective of the diagram exercise is to enable
them to share their individual interpretations with others in the class of how
they conceptualize their prior knowledge and experiences about concepts in a
subject domain.
3. Explain to the students that they will have five minutes to complete each
diagram in response to each of three questions.
4. The instructor has the option of asking the students to explain their diagrams
to fellow students upon completion of the exercise.
5. Hand out the materials to the students. Each student is given three sheets of
blank paper and several colored crayons they select from a box of crayons.
6. Once the students have received the materials, ask them to think of a random
eight digit number. Ask them to write the number in the upper right hand
corner of the three sheets of paper. Explain to them that this random number is
used to reassemble the sheets of paper in the event that the diagrams become

33
separated. Repeat for the student’s benefit how the number should not contain
any personal identifying marks embedded in the string such as social security
numbers, birth dates, or similar identity numbers. The instructor can also
modify the instructions to change the number sequence to a sequence of
random numbers and letters.
7. The next step in the process is to explain to the students that the diagrams can
only contain triangles, squares, and circles. The diagrams should not contain
any other markings. Letters, numbers, special symbols, lines, arrows, points,
or another marks are not allowed as part of the diagram constructions. Explain
to the students that they are free to create the diagrams using the geometric
shapes in any configuration, composition, quantity, order, or layout.
8. Before proceeding with the timed portion of the facilitation ask the students if
they have any questions.
9. State the questions one at a time. Allocate five minutes for each question.
Remind the students to fill in the blank with the question topic. Announce to
the students that they can begin to answer the first question. At the four
minute mark, announce to the students that they have one minute left. Ask the
students to complete the diagram for the first question at the five minute mark.
Ask the students to turn the diagram face down. Repeat the timed portion as
described above for the two remaining questions.
10. At the completion of the timed diagramming period, ask the students to pass
the diagrams to the student volunteer assigned to collect the diagrams. Ask the
volunteer to place the diagrams in an envelope and hand the envelope to the
facilitator or instructor. This completes the steps involved in conducting the
facilitation exercise.
Data Analysis
The data were collected in the form of student-generated, abstract diagrams. Researchers
use many approaches when analyzing diagrams. The study of diagrams is predominantly
quantitative in nature (Purchase, 2014). The approach taken in this study was based on the
qualitative nature of a topology that is embedded in a diagram (Egenhofer, 1991). The qualitative

34
attributes of a topology are characterized by the visual representation of the relationship between
two shapes. These relations were used to identify how differences in the student diagrams can be
distinguished. The shapes used in the diagram technique described in this study were constrained
to the use of the geometric shapes of triangles, squares, and circles.
Analysis of Student Diagrams
The analysis of the student diagrams was conducted with several aims in mind. The first
objective was to determine how the diagram technique could be made operational in different
classroom settings. The second objective was to determine how the differences in the diagram
representations (relations between shapes) could foster student sharing and collaboration when
constructing conceptualizations of prior knowledge. The third objective was to solicit instructor
feedback based on their experience of observing the facilitation exercise.
Unit of Analysis
The three objectives described above were used to compare and contrast the diagram
artifacts collected from each of the four facilitation exercises. The analysis of the diagrams
collected from each of the four units served as the basis for making observations regarding the
generalization of the technique across subject domains. For example, the subject domain under
study in one of the classroom settings was college teaching. The diagrams represented in Figure
3.1 depict the general diagram layout and aesthetics present in abstract diagrams generated using
the technique described in this study.
The collection and storage of the abstract diagrams involved three steps. First, the
physical diagrams were collected from the students. Second, the diagrams were then scanned and
converted into a digital file format known as Portable Document Format (PDF). Third, the
diagrams were organized in the storage media by creating a directory folder for each of the four
classroom settings.
35
Figure 3.1. Diagrams by students taking class in subject domain of college teaching.
Stimulus questions. Three stimulus questions were used to elicit a response from the
student. The use of the word “how” in the elicitation question had the effect of guiding the
student to think about concepts in a way so they could produce a shape constrained to forms of
triangles, squares, and circles. The question template was used in all four classroom settings.

36
Binary relations. The binary relations that existed between the shapes placed by the
students in each diagram were used as evidence of the visual variation that is recognizable as
differences in prior knowledge conceptualizations. The possible binary relations that can exist
between two shapes are disjoint, meet, equal, inside, covered by, contain, cover, and overlap.
These are based on concepts of topology (Egenhofer, 1991; Egenhofer & Golledge, 1998;
Mendelson, 1962).
Validity
The traditional strategies for reporting validity include member checking, triangulation,
viewer description, peer reviews, and external audits (Merriam, 1998, 2009). Data collection
using diagrams benefits from the unique features of diagrams when used to communicate
information (Larkin & Simon, 1987). The value of data collection in the form of diagrams is that
observers can check their own perceptions in a direct way when the artifacts are visual (Bagnoli,
2009). The similarities and differences represented in the diagrams allowed triangulation through
the relational lens of a topology (Mendelson, 1962). Students, instructors, and researchers have
equal access and can cross-check peer reviews with self-reporting instruments.
The abstract diagrams generated by the students can be interpreted by the viewer
in very personal ways. Each diagram is open to interpretation by viewers based on their own
personal perception of visual features. Personal observations can be made by anyone who views
the diagram artifacts. The research design in this case included descriptions of the setting, the
diagram intervention techniques, the description of the diagram outcomes, and samples of the
diagrammatic evidence to support validity checking (Burchett et al., 2011). The diagrammatic
artifacts used student-generated, randomized identity strings to provide a visual marking that
verified that the diagram belonged to a specific classroom unit.
Reliability
The case study addressed the test of reliability in several important ways. The technique
was first tested for reliability after the prototype exercise in 2009. The results were compared to
similar behaviors observed when creating E-R diagrams in the work setting. Given a clear set of
constraints as part of the diagram rules, the resulting artifacts could be expected to share similar
features. In this case, the similarity was in their predictable differences. The second test occurred

37
when the diagram technique produced similar outcomes and findings in all four classroom
settings. The use of the same materials, instructions, and diagramming rules led to similar
outcomes. All the student-generated diagrams were different. The design of the diagram
elicitation technique is guided by the goal of minimizing errors and reducing researcher biases.
Analysis of Instructor Interviews
The original strategy was to conduct instructor interviews after the completion of the
exercises. The instructors did not participate in the diagram exercise, but did observe the students
creating the diagrams. I developed a set of questions and provided these to the instructors. The
questions are provided in the appendix. One of the two instructors responded and these
comments are discussed in the next chapter.
Summary
The diagram elicitation technique described in this chapter originated as part of a class
project for a graduate school course in 2009. That experience led to the modification of the
technique in a way to support instructor use in specific classroom settings. This chapter
described the participants, the materials used in the technique, and the steps involved when
facilitating the technique in a university classroom setting. The chapter also described the
qualitative nature of topological relations that exist between shapes. Questions were provided to
the instructors and a copy is included in the appendices.
Each student was asked to generate three diagrams in response to questions related to
student conceptualizations about prior knowledge, how they store those concepts in memory, and
how they monitor their own learning about change related to those concepts. The chapter
included an example of one set of diagrams that was collected in one of the classroom exercises.
The literature review indicated that the use of abstract diagrams is not a focus of diagram
research. The detailed discussion of data related to this technique and the research questions is
provided in the next chapter.

38
CHAPTER FOUR – ANALYSIS
The qualitative data analyzed in this chapter consists of my observations made, diagrams
produced by the students, and responses to a list of questions provided to the instructors. The
analysis of the data was organized around the three research questions. The first question was
concerned with operationalizing a diagram technique. The second question focused on student
collaboration. The third question addressed feedback from the instructors regarding their
experiences.
The analysis of the elicitation technique itself was based on research by Larkin and
Simon (1987). They described why differences in diagrams were easier to recognize when
compared with text. The analysis related to student collaboration was based on the binary
relations described by Egenhofer (1991). The analysis of the instructor experiences and feedback
with the diagram technique was framed within the larger context of diagram use in the university
classroom setting.
Research Question One
The first research question contained two parts. Part one focused on how to make the
technique operational. How can abstract diagrams constrained by domain-general, geometric
shapes be operationalized in a diagram elicitation technique?
In pursuit of this sub-question, I facilitated the diagram technique described in Chapter
Three. The objective was to facilitate the technique and observe the students constructing the
diagrams in four separate classroom settings described in Table 4.1.
Table 4.1
Classroom Setting and School Location
Class Subject School Location Student Status Class Size Instructor ID
College Teaching Rural State University > 20,000
Students
Full-Time, Graduate Students 12 A
Program Operations
Management
Urban Private University < 5,000
Students
Full-Time, Undergraduate
Students
28 B
Project Management Suburban State University > 10,000
Students
Part-Time, Graduate Students 18 B
Project Management Suburban State University > 10,000
Students
Part-Time & Full-Time,
Undergraduate Students
32 B

39
Making the Diagram Technique Operational
In each of the four settings, I was introduced to the class by the instructor. The instructor
explained to the class that I was a graduate student doing research for my dissertation in the field
of diagrams and prior knowledge. After the introduction, I described the diagram technique to
the students. They would use paper and crayons to help them create diagrams. They would be
constructing diagrams in response to each of three questions. I explained that they would have
five minutes to complete each diagram. The time required to facilitate the technique included
distributing the materials to the students. Facilitating the exercise took me approximately 30
minutes with the smaller class, and 40 minutes with the larger classes. The remaining time was
set aside to give students an opportunity to describe their diagrams to their fellow students. The
last five minutes of the facilitation exercise was reserved for concluding remarks by the
instructor. We agreed in advance that the facilitation would be limited to one hour of classroom
time in each of the four classroom settings.
I observed the students assisting one another in distributing the crayons and paper with a
degree of excitement and curiosity. This was likely due to the novelty of the exercise. The
literature review did not surface research related to student diagrams used to elicit prior
knowledge. I expected few if any students to have previous experience creating diagrams of prior
knowledge. I also believe that the energy level I observed in the classroom was related to their
prior experience using crayons in elementary school or earlier. Crayons introduced an element of
fun and playfulness.
I did not observe any hesitancy in the students as they prepared for the exercise. I
explained the steps that they were to follow in answering the questions. The answers would be in
the form of a diagram. The diagrams were to contain only triangles, squares, and circles. I
emphasized that letters, numbers, words, arrows, special characters, or other symbols were not
allowed in the diagrams.
I pointed to my watch and noted that each question would be timed. I told them in
advance that they could volunteer to explain their diagrams to the class, if time permitted. I did
not receive any clarifying questions from the students prior to the start of the exercise. The

40
instructors sat near the front of the class in each of the four settings and observed the exercise.
The instructors did not participate in the diagramming technique.
My experience and observations noted similar behaviors of the students in the four
classroom settings. The students participated in distributing the materials at the beginning of the
exercise. They also assisted in collecting the diagrams and materials at the end of the exercise.
During the diagram exercise, I observed the students creating diagrams without any discussion
among themselves, although the instructions did not restrict this communication. Students’
behavior seemed to indicate that they did not want to share the diagrams before the end of the
diagramming part of the exercise. I believe the phrasing of the questions had the effect of
recommending a quiet and serious demeanor, and waiting to share the diagrams until the end of
the time was up for all three questions. For each question, I observed that some students started
diagramming immediately. Other students would think about the question and hesitate before
beginning to create a diagram. Some of the students seemed to diagram as if the goal was to
finish first and other students would continue diagramming right up until the instruction was
given to stop. This behavior was similar across all four classroom settings.
At the end of the facilitations, I explained to the students that they created three diagrams
that were intended to represent their prior knowledge of the general concepts prompted by the
questions. I pointed out that the diagrams were different and illustrated, in a visual diagram, the
externalization of their internal mental models. I explained that we carry with us internal mental
models of concepts about a domain of knowledge when we experience the real world (Craik,
1967). I explained that the use of the three geometric shapes made the diagrams more abstract
(Novick, Hurley, & Francis, 1999). This made it easier to spot differences in the diagrams
quickly and without a significant investment in time. I also explained that this form of
communicating with diagrams made it easier to contrast and compare how individuals think
about concepts (Landy & Goldstone, 2007).
The concept behind the exercise was the idea that teams should make time to explore
their conceptual differences when they first come together (van den Bossche, Gijselaers, Segers,
Woltjer, & Kirschner, 2011). The differences in individual diagrams helped explain why
differences of opinion exist in groups of people. I explained to the students that describing prior
knowledge using essays would require a significant investment in time on the part of the

41
instructor and that it is easier to recognize patterns and differences in diagrams. In this respect,
diagrams have an advantage over text when recognizing differences in geometric shapes.
Making Prior Knowledge Visually Accessible
The second part of the research question continued with the phrase “and thereby make
prior knowledge of the students accessible visually within the context of a domain-specific
classroom setting?” The domain setting was varied by conducting the elicitation in each of the
four classrooms. The use of three how-type questions was designed to elicit the student’s prior
knowledge of concepts linked to the topic of the class. In contrast to asking declarative (what-
type) or procedural (when-type) questions, the three how-type questions guided the students in
using geometric shapes in a way that made spatial relations (topology) easy to recognize. This
had the effect of replicating the findings described in the Larkin and Simon (1987) research.
Differences were easy to see in the diagrams.
Larkin and Simon (1987) made the case that a line, segment, and point contained in a
diagram are easier for the brain to locate in a plane due to the spatial indexes. The additional
cognitive tasks required for search and inferences are higher when using text. In the elicitation
technique, the shapes are spatial representations of concepts located in a plane. The relations
between shapes communicate the relations between concepts.
At the completion of the diagram exercises, to further illustrate the differences for the
students, I asked for volunteers to explain to their fellow classmates what their diagrams were
meant to communicate. There was time remaining for volunteers to explain their diagrams in
each class. The students did not hesitate to explain what their diagrams were meant to convey
about their prior knowledge of the topic. I also think their willingness to share their explanations
was based on the fact that there were no reference diagrams to act as exemplars of good
diagrams. The design of the diagram technique was to encourage free and open communication
and expression. The use of crayons and basic geometric shapes helped to create this climate of
the exercise being an ungraded activity for the class.
The use of crayons and blank paper in combination with the steps outlined in the
elicitation technique caused the students to transform internal conceptualizations of prior
knowledge into external representations in the form of a spatial topology rendered using
42
geometric shapes. Using diagrams in this manner made it possible to show how conceptual
knowledge can be made external in a visual way. The diagrams were accessible visually to the
students and instructor.
Engaging a student’s prior knowledge of concepts is important, and can be made part of
the instructional design of a course using basic materials and the diagram technique. The
exercise did, in fact, make the students’ prior knowledge visible to them and to the instructor,
based on the comments made by the students, and later confirmed in discussions with the
instructors. However, the technique did not allow for an evaluation of the depth of that prior
knowledge or how it connected to other domains that might have been relevant to the class or the
instructors. This is an area that will require further investigation in future studies.
Construct Validity
Construct validity generally refers to the validity of the evidence collected and intended
to support the interpretations of a particular construct, in this case the diagrams as a valid
measure of conceptual differences. Diagrams allow for the direct observation of the dimensions
of the concepts created by the students in the diagrams (Salkind, 2010). In this study, the
dimensions are characterized as the binary relations of a topology (Egenhofer, 1991). The quality
of the elicitation technique rests on a set of measures that are well-defined and establish a clear
chain of evidence, thereby reducing the subjective nature of the data collection tasks. The
elicitation technique was designed to make it possible to visually recognize differences in
conceptual prior knowledge when viewed through the lens of student diagrams. These pattern
differences were made more specific and visible using labels to identify the binary topological
relations Egenhofer (1991). The topological relations provide the reader with a vocabulary with
which to distinguish the differences noted in the student diagrams. The use of the binary relations
does not suggest that an algorithm has been identified and used to compute a measure or score
for an individual diagram.
The diagrams were marked with anonymous numbers and characters created by the
students to aid in grouping the diagrams later for analysis. The diagrams were converted to
digital data formats using software that created scanned images stored in a portable document
format. Sample diagrams are included in the appendix. The process of collecting, marking, and

43
storing the diagrams constituted the chain of custody procedures. These steps helped to improve
the construct validity and quality of the research design.
Internal Validity
Internal validity refers to the causal relationship between the diagram created by the
student and existence of recognizable difference between the shapes placed on the diagram. The
binary relations serve the purpose of providing a qualitative lens for describing the differences
(Salkind, 2010). The spatial arrangement of the lines, segments, and points in the diagram help
the viewer recognize the patterns quickly as being triangles, squares, or circles. Larkin and
Simon (1987) set the background for describing differences in pattern recognition using
diagrams in problem solving settings. In this case study, the differences in spatial arrangements
are set against the background of students generating diagrams of prior knowledge. The diagrams
contained topological differences that were easy to detect visually. The geometric shape rules
helped to make the diagrams appear more abstract. This made detecting pattern differences
easier. The eight binary relations described by Egenhofer (1991) provide a second level of
specification by allowing the shape relations to be organized by eight binary relations. The
binary relations provided a simple pattern-matching framework and strengthened the internal
validity of the study. The differences in patterns are recognizable within and across student
diagrams and class settings.
External Validity
Generalizing results to a broader group of people in the university community speaks to
nature of establishing the external validity of the diagram technique (Salkind, 2010). This study
tested external validity (i.e., determining whether the diagram elicitation technique can be
generalized across domain settings) by conducting the facilitation in four different university
settings, each with different topics, and involving students with a diversity of experiences and
backgrounds. The same framework, technique, and process were used in all four classroom
settings. Similar diagrams were generated by the students. The general outcome of the technique
was characterized by the diagrams consistently being different in their topologies, but containing
some or all of the binary relations, in various configurations. In this respect, the diagram
technique, if used widely across a university campus in many different classroom settings, will
likely produce similar results. Those results would be in the form of diagrams representing

44
variations in the prior knowledge of concepts by the students in the classroom. The diagram
elicitation technique described in this study appears to be generalizable across different
classroom settings and topic domains.
Reliability
The final test of the research quality and the elicitation technique was the determination
that another researcher, conducting the diagram elicitation technique as it is described in this
study, would experience a similar outcome and therefore demonstrate its reliability. To illustrate
this test, this case study included the facilitation of the elicitations in four different classroom
settings. The goal was to show how the technique reliably produces similar outcomes. The same
materials were used in the four settings and similar elicitation question templates were used in
the four classes. The elicitation steps were made operational and the instructors served as
unofficial auditors of the technique. The students generated diagrams without any intervention
on the part of the facilitator or instructors.
The research design improved the outcomes of the tests for validity and reliability. The
goal was to make the technique operational in a general way, but applicable for use in specific
domains. The combination of the research by Larkin and Simon (1987) with the topology
relations described by Egenhofer (1991) strengthened the validity and reliability of the study and
the diagram technique.
The reliability of the diagram elicitation technique rests on two fundamental skills and
experience that students bring with them to the classroom. First, students are exposed to drawing
at an early age in most cases, but there may be exceptions. Drawing geometric shapes is a skill
that is included in many subject areas beginning in the earlier grade levels. Triangles, squares,
and circles are geometries that appear in most instructional materials, even in the most basic of
visual metaphors. Shapes are images that surface in most subject areas long before the student
reaches college. Given that the elicitation technique places few constraints on the quality,
quantity, configuration, composition, or relations between shapes in the rules, the technique is
representative of a combinatorial mix that is likely to generate unique diagrams in most cases. In
effect, the variability in the inputs has the likelihood of producing variations in the output,
making the technique reliable in this respect.

45
Research Question Two
The first research question sought to illustrate how a diagram technique could be made
general and facilitate the generation of student-generated diagrams in different classroom
settings, making prior knowledge visible to the instructor and viewer. The second research
question included additional activities organized around the collaboration and sharing of
diagrams among the students.
How can the diagrams offer learners the opportunity to collaborate and share diagrams
that could lead to the creation of shared prior knowledge?
The time required to elicit the diagrams for question one took a full hour. There was not
an opportunity to add an additional hour to the class schedule to accommodate the collaboration
and sharing activities. The lack of time in the elicitation to facilitate the creation of shared
diagrams led to the design of an alternative approach to data analysis of potential student
collaboration.
A Framework for Collaboration
The diagrams contained within them a pattern of relations that are known as the basic
eight binary, topological relations. These relations are recognized internationally as the standard
for describing geometric topologies (Kresse & Danko, 2012). The student diagrams contained
shape differences and relations that were visually differentiated between students, by question,
and by classroom setting.
Student diagrams have embedded in them hidden patterns of binary relations that are not
self-describing to the casual observer, yet have significant meaning to an expert in diagram and
geospatial topology. The framing of the second research question was to position the resulting
student diagrams as informal research artifacts that could then be used by the class for further
activities that could be classified as collaborative in nature.
The objective of this study was not to make the instructor an expert in the cognitive
science of topology. The analysis of the diagram differences can be characterized within the
framework of the eight binary relations that topology experts have established as the
foundational differences that can exist between two shapes that co-exist in a plane. The diagram

46
technique had the effect of translating shapes to place holders for concepts and the binary
relations as the way of characterizing and categorizing concepts in a domain of study.
This creates a framework within which the instructor can create collaboration exercises
for students. These activities would guide students in how they explore the differences in their
conceptual understanding within a domain of study. The sample questions described in the next
section illustrate how general questions can serve as a foundation for adaptation to specific
domains.
Student Collaboration Using Conceptual Relations
The student diagrams offer the instructor a ready-made corpus of diagrams for engaging
the students in small group exercises and the creation of shared conceptual diagrams—and
connecting to prior research and conceptualization about the concept of diagramming. Egenhofer
(1991) described eight binary relations of topology that are used as the standard in the geospatial
community when describing differences represented in spatial diagrams. Each binary relation can
be re-written for use in interpreting the spatial relations depicted between the shapes in the
student diagrams. This translation of spatial relations into more meaningful collaboration
questions is depicted in Table 4.2. This is a significant contribution to the field of educational
psychology. The proposition that abstract conceptual diagrams can be translated into the
construct of a spatial topology suggests a link exists between what the mind records in memory
and how it is replayed in the form of student-generated, external diagrams.
Table 4.2
Conceptual Relations
Relation Collaboration Question Visual Example
Disjoint What are the attributes and values that make
concepts distinct in this domain?
Meet What are the attributes and values that connect these
concepts along a common boundary in this domain?
Equal What are the attributes and values of concepts that
are viewed to be equal to each other in this domain?

47
Relation Collaboration Question Visual Example
Inside What are the attributes and values of concepts that are contained within a larger encompassing concept?
Covered By What are the attributes and values of concepts that are covered by and replaced by other concepts that
are present in the same space?
Contains What are the attributes and values of concepts
contained within another concept and share a
common boundary with other external spaces?
Covers What are the attributes and values of a concept that
obscure and hide another concept from view?
Overlap What are the attributes and values of a concept that
overlaps part of another concept, hiding part of it
from view?
The Role of Topology in Student Collaboration
Topology is a branch of mathematics that is concerned with the study of geometries and
sets of shapes. By definition, any placement of a line, segment, and point on a blank canvas is
eligible for study through the lens of topology. The elicitation technique includes instructions
that ask students to draw geometric shapes. The placement of the very first line, segment and
point by the student qualifies the diagram as having a topology, no matter how primitive
(Mendelson, 1962). The diagram elicitation technique is designed in a way to restrict the student
to only drawing diagrams, making it much easier to recognize the relations between the shapes as
defined by Egenhofer (1991). The use of the questions in the technique to elicit student
knowledge of concepts has the effect of the topology representing the relations between
concepts.
One of the facilitations was conducted in a graduate school class whose topic for the
semester was the theory and practice of college teaching. Their diagrams are topological
representations of concepts in the field of college teaching. The appendix contains examples of
the diagrams from these students. The relations between concepts to be explored in the college
teaching domain were re-written as an example in Table 4.3. This exercise is an example of how

48
the binary relations can used to frame questions that promote further discussions of the diagram
shapes and meaning.
Table 4.3
Conceptual Relations of College Teaching
Relation Collaboration Question Visual Example
Disjoint What concepts make up the domain of college
teaching?
Meet Do the concepts in college teaching share common
attributes and values?
Equal Are there concepts in college teaching that have similar
meaning?
Inside Is there a hierarchy of concepts that can be inferred in
the field of college teaching?
Covered By Are there concepts in college teaching that can replace
other less significant concepts in use and practice?
Contains Are there concepts in college teaching that can be
organized within the boundary of a larger concept?
Covers What concepts might hide the meaning of less visible
concepts in college teaching?
Overlap Are there concepts in college teaching that overlap
meanings found in other concepts?
The diagram examples in Table 4.4 show the similarities between the binary relations in
student diagrams and their labels as described in the work by Egenhofer (1991).

49
Table 4.4
Student Examples of Conceptual Relations in College Teaching
Relation Student Diagram Visual Example
Disjoint
Meet
Equal
Inside
Covered By
Contains
Covers
Overlap

50
My research and analysis suggests that the topological binary relations may serve as
general framework facilitating student collaboration and the creation of shared knowledge. This
hypothesis was formed without the opportunity to collect data in the form of student responses to
domain-specific topology questions. I estimated that such an effort would take several hours of
class time and would require a significant investment in time by the instructor.
Research Question Three
The research design included a proposed activity to interact with the instructors several
weeks after the elicitation exercises and solicit their feedback regarding their observations and
experience with the elicitation technique in their classes. The research question designed to
frame this topic is provided below.
To what extent does the instructor perceive the diagram technique to be useful as a tool
for eliciting prior knowledge at the individual level, and at the group level?
The goal was to determine to what extent the instructors perceived the diagram technique
to be useful as a tool for eliciting prior knowledge at the individual level and at the group level.
The data collection and initial follow-up inquiries with the instructors surfaced a change in the
communications and dynamics that followed over the subsequent weeks with the instructors.
Instructor Experience Using Diagrams
During the initial discussion with the instructors regarding their willingness to sponsor
the diagram elicitation technique, the concept of using diagrams to illustrate differences in how
students conceptualized prior knowledge in a domain seemed an innocent enough arrangement
and they agreed to participate. One instructor agreed to host the facilitation in a graduate class on
the topic of college teaching. The other instructor was an adjunct professor teaching at two
different universities. This instructor agreed to sponsor the other three elicitation exercises in a
combination of undergraduate and graduate school classes.
The concept of using diagrams in the classroom was not new to the instructors. They did
mention that the use of abstract diagrams constrained by rules that only allowed triangles,
squares, and circles was a new idea for them. I explained my experience with the technique in

51
the original format as it was facilitated in a graduate school class in 2009, and how the materials
and technique were changed to accommodate a larger class size with minimal investment time or
materials.
The instructors also acknowledged that their students came to class with a broad range of
backgrounds, education, and cultural upbringing. We discussed how the use of diagrams in the
exercise appeared to be effective in my 2009 class project. I described for the instructors how the
diagrams were a useful technique for encouraging students to express visually how they think the
real world works. I explained how the analysis of the student diagrams indicated that nothing
more than basic skills, knowledge, and ability to use crayons were required to produce abstract
diagrams of conceptual knowledge. The instructors were supportive of using a technique that
only required blank paper and crayons.
Instructor Behavior Observing Students
The instructors did not participate in the elicitation exercises. They took a seat in the
classroom and watched their students create the diagrams. Neither instructor was familiar with
the work of Larkin and Simon (1987) or Egenhofer (1991). One instructor had an academic
background in educational psychology, but was unfamiliar with research related to the nature of
diagram use in the classroom. The other instructor had a background in business and information
technology. The concept of using abstract diagrams to elicit prior knowledge was new
information for both instructors. This did not surprise me as I had found few sources in my
literature review that related to eliciting prior knowledge using student-generated diagrams.
At the conclusion of the elicitation exercises the instructors summarized for their students
the value of using diagrams to help visualize how people see the world through different
perspectives. There were several questions during the elicitations in which a student asked what
the shapes were meant to communicate. I made the point that the diagrams are valuable in how
easily they communicate differences.
Instructor Responses to Interview Questions
The original plan, based on the IRB application, was to interview the instructors, and
record, transcribe, and code the interviews. The instructors chose to opt out of this interview
process—an option provided to them and included in the IRB agreement. They both expressed to

52
me in conversations after the diagram experience that they did not want to participate in any type
of interview other than being willing to answer a series of questions that were sent to them in
advance.
The use of diagrams as a formal instructional tool is not taught in the educational
community based on the literature reviewed for this study. In particular, diagram use in this
study is narrowly focused on a very specific definition of a diagram, one that is abstract in
rendering, and only allows for the inclusion of three geometric shapes. The use of diagrams in
this study is also oriented to the elicitation of knowledge that is conceptual in nature. This study
does not explore the use of diagrams that are concrete in representation, or address knowledge
that is considered declarative or procedural in nature.
In my professional practice, designing and constructing conceptual models of information
architectures for government and commercial clients, the use of diagrams is often unfamiliar to
the teams I support. I have observed professionals in the workplace reacting to the diagram
exercise in ways very similar to the behavior of the students. The behavior is a mix of curiosity
and speculation. I believe the instructors find the use of diagrams a challenge without guidance
and instruction. The instructors told me that diagram training is not offered as part of their
education and training. I believe the experience for the instructors of not being able to explain
the meaning of the diagrams to their students is a significant obstacle to wider adoption of
diagram use in the classroom. I felt responsible for not estimating in advance how much more
time should have been allocated to exploring the use of diagrams in the classroom, and believe
the diagram elicitation has limited use without introducing instructors to the research of Larkin,
Simon, and Egenhofer.
The concept of data permeates our culture. Data comes in all types of digital shapes and
sizes (text, images, pictures, graphics, video, audio, messages, web pages, and maps). Abstract
diagrams represent another type of data, but a type not commonly known outside the fields of
cognitive science and psychology. Data are often referred to as schemata in these fields. A
schema is an outline of an object or event that is experienced by human beings in the real world.
Schema theory suggests that our experiences are stored in more abstract schemas in memory to
improve storage and retrieval (Mandler, 1984). It appeared that the students and instructors
sensed that there was more to the diagrams than was discussed in the elicitation exercise.

53
Speculating on what this meaning could be was not a topic that could be easily integrated into
the class during the elicitation exercises. This underlying lack of experience and knowledge of
diagrams may have contributed to the instructor’s unwillingness to participate in the follow-up
interviews.
I was able to reach an alternative strategy with the adjunct instructor responsible for
sponsoring the diagram elicitation exercises in three of the four classes. I created a set of
questions. The instructor agreed to answer these questions in writing. These answers are
provided in appendix. The highlights of the answers are consistent with my observations made
earlier.
The instructor and students found the exercise interesting, but unusual.
The idea that the diagrams had no right or wrong answer was a limiting feature of the
technique.
The use of the diagrams to build team collaboration was viewed as a valuable feature
that should be explored in future research.
The technique could be improved with the addition of an exercise to create a common
vocabulary of concepts.
The students showed little experience with diagramming as a skill. The instructor
stated that the use of diagrams as a communication tool might be a useful addition to
the curriculum.
Summary of Analysis
The data analysis in this chapter covered the operation of the diagram technique, how the
students might potentially use the diagrams to collaborate and share prior knowledge, and the
limitations of the techniques identified through questions and answers provided by one of the
instructors. Combining the work of Larkin and Simon (1987) with the topology of Egenhofer
(1991) helped give structure to the data analysis and illustrate how diagrams can be used in an
educational setting.
The use of the diagram elicitation technique to generate abstract conceptual diagrams
produced visual data that varied widely. The nature of the data suggested that diagrams are an

54
effective technique for eliciting more personal and ontological representations of student
worldviews. The variations in the diagram topology suggested that the underlying foundation of
prior knowledge varies in a way that can be engaged quickly with the use of abstract diagrams.
The data also suggested that neither the students nor the instructors had prior knowledge of
abstract diagram elicitation techniques. The inherent patterns of prior knowledge hidden beneath
the surface of the diagrams can be expressed in general topological terms using binary relations.
The structure and schemas of prior knowledge and student conceptualizations of domain
knowledge are visible in diagrams created with basic paper and colored crayons.
The research design and the technique were used to explore an observed shared behavior
among the student diagram constructions. The diagrams shared the feature of being different.
The validity and reliability of the technique was established by repeating the process in four
separate classrooms using the same instructions and materials. The data also suggested that the
challenge of expanding the use of diagrams in the classroom begins once the diagramming
elicitation technique ends. The students were limited in the amount of time that had to create the
diagrams in this case study. There was not the additional time available for the instructor to
facilitate the development of shared student diagrams and the creation of conceptual vocabularies
of the subject domain. A summary of the data analysis in the context of the study and
recommendations for future research are provided in Chapter Five.

55
CHAPTER FIVE - SUMMARY, LIMITATIONS, AND RECOMMENDATIONS
My study described the background, literature, diagram technique, and analysis of the
data collected from students in the form of diagrams. The diagrams were intended to represent a
conceptualization of the student’s prior knowledge. The analysis of the diagrams was performed
in the context of shapes containing a general pattern of eight possible binary, topological
features. I used this approach to illustrate that shapes could be used to categorize the similarities
and differences of the student’s conceptualizations of prior knowledge. I wrote this study to
show how a general diagram technique could be operationalized and applied to the context of
prior knowledge in specific domains. Constructivist theories of learning provided me the
conceptual framework within which observations about the technique could be situated. This
chapter summarizes the case study. Limitations and recommendations for future research are
included.
Summary of the Study
The goal of this study was to explore the use of a diagramming technique as a way of
eliciting prior knowledge from students in a university classroom setting. I was able to facilitate
the technique in four classrooms and observe the students creating abstract diagrams. The
diagram technique served as a constructivist learning tool. Research supports the need to engage
the student’s prior knowledge as an instructional strategy for creating a solid foundation for new
learning. The data collected in the form of diagrams supported my goal of visually illustrating
that student prior knowledge varies widely.
This study was based on research by Larkin and Simon (1987) that described how
diagrams afforded the viewer an advantage over using text when communicating information.
Their study led to Egenhofer’s (1991) discovery of how binary relations can be used to describe
the differences in the diagrammatic shapes. The literature review also uncovered a significant
analysis of diagram research from 2000 to 2012 by (Purchase, 2014). The result was a strong
body of evidence suggesting that abstract diagram research is a gap in the current diagram
research literature. The technique described in this study has the potential to close this gap by
offering a general tool for collecting diagram data across many subject domains.

56
The diagrams collected during the class project led me to the proposition that the
seemingly random shapes might contain hidden patterns. The comment by Larkin and Simon
(1987), regarding the importance of topology in diagram research, led to the findings by
Egenhofer (1991) whose work is seminal in the field of geography. He framed relations between
two shapes represented in a diagram as being organized into eight binary relations. The relation
between any two shapes in a diagram could be one or several of these relations. These relations
provided a way of thinking about concepts in a qualitative way. The relations also provided the
framework for describing diagram differences in a structured way.
I observed the reactions of the instructors as they watched their students create diagrams.
The instructors did not participate in the diagram exercise. My observations of the students and
the instructors led me to the conclusion that diagramming skills are not taught in the university
system in any formal way that I could discern. I was successful in answering the research
questions outlined in this study and turn to those topics in the next section.
Discussion of the Findings
My research was based on the use of abstract diagrams. This approach led to several
insights about the nature of abstract diagram use in the classroom. First, by operationalizing the
abstract diagram technique with basic materials and the use of basic shape rules, it was clear
from my observations that abstract diagramming as a skill was not a technique familiar to the
students or instructors. Despite this situation, the students easily engaged in the technique, and
the instructors readily supported my facilitation of the technique in their classrooms. The
technique was easy for the students to learn and use. I interpreted this behavior as an indication
that the students could conceive of prior knowledge about the class topic and express it in the
form of a diagram.
The limited rule set used in the technique allowed them to freely express very different
conceptualizations without any questions regarding the nature of there being a right or wrong
answer. I made the assumption that the students considered any and all diagrams to be valid and
appropriate representations in the context of the class exercise. The diversity of the shapes and
relations indicated a broad spectrum of personal interpretations by the students of concepts
related to the class subject. This rather simple technique operated as a powerful visual metaphor

57
in a way that made it easy to see the diversity of prior knowledge that students brought with them
to the classroom.
I also discovered that the diagrams can be used in ways that consume far more time than I
had allocated for the technique in the classrooms. My original research design included an
additional task of developing a set of terms to accompany the diagrams. In actuality, the
diagramming activity took the majority of the class time that was allocated for the diagram
exercise. Only a few minutes remained for some students to share their verbal explanations of
their diagrams. The amount of time required to create shared vocabularies was well beyond the
time allocated in my study.
An unanticipated finding of the study was the use of topology and binary relations to
describe what were thought to be random shape configurations included in the diagrams. The
diversity of shapes was a qualitative feature of the diagrams as defined by Egenhofer (1991). The
diagrams served as a conceptual space in which students could construct visual representations
of prior knowledge.
More time is required during practical application if the diagram technique is to be used
to create domain concepts, shared vocabularies, and shared diagrams. The diagrams could be
modified and updated throughout the semester as a way of visualizing conceptual change
throughout the semester as the students construct new knowledge. This was also an unanticipated
finding since conceptual change research is not well understood outside the learning science field
(Vosniadou, 2008).
Larkin and Simon (1987) advocated for more rigorous diagram research frameworks. My
observations indicated to me that diagrams were an effective communications tool. The need for
better tools to communicate information quickly is undeniable in a society driven by
technological innovations and rapid change. Abstract diagrams could be useful in
communicating information if the research community adopted standard frameworks, tools, and
methods.
The hidden topology discovered in the diagrams led me to envision that abstract diagrams
could be the basis for the development of novel forms of visual language (Marriott & Meyer,
1998). I interpreted the ease with which the students and instructors engaged with the concept of

58
a diagramming technique as evidence for an underlying spatial intelligence that naturally
engages with information (Waller & Nadel, 2013). Research related to diagrams from this
cognitive perspective is in the early stages of development (Galantucci, 2010). The study
illustrated how diagrams make visible hidden conceptualizations that help human beings
visualize prior knowledge.
Limitations of the Study
The gap in the literature related to diagram research in the classroom was specific to the
use of abstract external representations that are constrained by geometric shape rules. My case
study was designed to address this gap by describing a diagram elicitation technique that was
general in orientation, but adaptable to different subject domains.
The technique was not designed to make explicit the meanings and semantics embodied
in the diagrams. The study was not designed as a tool for determining how best to produce
diagram lexicons, vocabularies, or dictionaries. It was not designed to recommend any particular
way of generating abstract reference diagrams that would normally be produced by subject
matter experts. The time and resources required to attempt such tasks require a significant
investment in time and resources that extend well beyond the context of the classroom setting.
The study was not designed to capture and generate harmonized conceptual diagrams within a
specific domain of study.
The view of diagrams as data collected in the form of two-dimensional shape artifacts is,
by definition, self-limiting. Applying the technique to data with additional dimensions was not
within the scope of this study. The diagrams were not used to derive semantics of a person’s
personal epistemology, social psychology, or mental state of mind. The study situated diagrams
within the historical framework of diagram research as a technique that followed in the tradition
of a node-link, diagram metaphor. There are other definitions of a diagram that extend beyond
the limitations of a diagram as defined for use in this study.
Visual perception is fundamental to the human experience. The variation in diagrams
along the continuum from concrete to abstract can be explored in unlimited ways given the
ingenuity of the human mind. The diagram technique is limited in application by the very nature
of its abstractness. This feature was shown to lead to a novel connection between geometric

59
shapes and framing conceptual understanding in the context of binary relations. This is the
strongest feature of the technique. The abstract nature allows for great flexibility in adaptation to
the world around us. Thinking in diagrams offers a bright future for a new generation of
researchers in many domains, inside and outside academia.
Recommendations for Future Research
My search for a standard abstract diagram research framework did not produce any
results. I recommend that the diagram technique described in this case study be considered by
other researchers for use as a general research framework that can be adapted for domain-
specific applications.
I recommend that the diagram technique be used to research new visual languages that
adopt different variations of abstract shape grammars in a way that can improve communications
in a wide-range of public safety settings. My experience living through the tragic helicopter
accident described in the introduction opened my eyes to the value of diagrams as
communication tools in all types of industrial safety systems.
I encourage researchers to consider the ways in which diagrams can make explicit, in a
visual format, the perceptions of reality that are reflective of both conscious and unconscious
cognition. The diagrams can be used as a mental modeling tool to elicit and represent steps in
expert problem solving tasks that are known to originate in the unconscious (Kihlstrom, 1987).
The nature of abstract diagrams as metaphors for human cognition should encourage researchers
to explore how abstract diagrams can be used to improve more subtle aspects of critical thinking,
situational awareness, and the unconscious aspects of decision making under pressure. The
current research in spatial intelligence is just one example of the renewed interest in visual
communications tools, techniques, theories, and practices.
My experience facilitating the diagram technique in four university settings indicated that
conceptual change research could likely benefit from the longitudinal use of abstract diagrams as
a way of measuring change visually over longer periods of time. Researchers might investigate
how abstract diagrams can be used to benchmark and measure the development of cognition and
intelligence using abstract diagrams in the university setting.

60
Researchers in business schools could learn from my experience and develop formal
diagram skills courses that expand upon the limited research I used in this study. I only adapted
my study based on research from cognitive science, diagram research, and topology. There are
likely many other ways to modify and extend abstract diagram skill sets to other domains in
businesses across a wide variety of industries.
I encourage researchers to extend diagram research to the lower grades and beyond
university settings to vocational schools, trade schools, and technical colleges. The nature of
abstract diagrams to communicate information quickly in a way that can be easily understood
could have positive impacts on the teaching of behaviors related to public safety and social
welfare. Simple iconic diagrams have the potential for improving communications in many
aspects of public life. An example of this application could be the development of better
diagrams for communicating important information on labels of grocery products, medicines,
and toxic chemicals.
My native language is English and my second language in college was German. I believe
the intersection of visual language research with spoken language research could lead to
expanded vocabularies of international symbol sets across disciplines of shared interest. Visual
designs for campaigns advocating for common interests across borders in times of peace and war
could benefit from visual languages that operate in times of need.
These are just a few areas where I think the recommendations can be implemented in a
short time frame with positive outcomes. Technology is making it possible to capture and
communicate data visually with great speed and specificity than ever before. The visual language
of abstract diagrams has the potential to illuminate a wide variety research threads beyond those
I have mentioned above.
Conclusion
This study was the result of a six year journey that took me on detours into dozens of
domain-specific fields of inquiry, science, and the arts. I read widely in the fields of adult
learning, human development, anthropology, sociology, computer science, cognitive science,
evolutionary biology, computational linguistics, neuroscience, geometry, mathematics, human

61
factors, semiotics, and engineering. The diagram technique I described in this case study resulted
in findings that I had not planned on uncovering along the way.
I started this journey with a simple goal. Diagrams used wisely can save lives and prevent
senseless human tragedy. Diagrams are a powerful communications tool. My experience of not
having planned for adequate time in my own study to conduct all the inquiries is a warning to the
adventurous researcher. Diagram research is field that is wide and deep.
I truly have only scratched the surface of research regarding the use of abstract diagrams
in the classroom. I do believe the design of the case study and the keep it simple nature of the
research questions provides a research framework for other researchers to adapt to their own
needs.
Communicating through diagrams is a literacy skill that could begin in the elementary
school. The skill should be developed through the years of formal schooling and into adulthood.
The simple abstract diagram technique described in this dissertation requires nothing more than
the hand and the mind. Paper and crayons are optional. The development and adoption of a
visual language is the key to unlocking the landscape of the human mind (Hoffecker, 2011).
Draw a diagram, share it with others, collaborate to solve problems, and co-create new
knowledge.

62
REFERENCES
Adesope, O. (2010). The cognitive effects of verbal redundancy and animated concept maps on
learning. Retrieved from ProQuest Dissertations & Theses Global database.
(305369055).
Adesope, O., & Nesbit, J. (2013). Animated and static concept maps enhance learning from
spoken narration. Learning and Instruction, 27(0), 1-10.
doi:10.1016/j.learninstruc.2013.02.002
Ainsworth, S., & Loizou, A. (2003). The effects of self-explaining when learning with text or
diagrams. Cognitive Science, 27(4), 669-681. doi:10.1016/S0364-0213(03)00033-8
Amadieu, F., van Gog, T., Paas, F., Tricot, A., & Mariné, C. (2009). Effects of prior knowledge
and concept-map structure on disorientation, cognitive load, and learning. Learning and
Instruction, 19(5), 376-386. doi:10.1016/j.learninstruc.2009.02.005
Ambrose, S., Bridges, M., Lovett, M., DiPietro, M., & Norman, M. (2010). How learning works:
Seven research-based principles for smart teaching. San Francisco, CA: Jossey-Bass.
Anderson, J. (1996). The architecture of cognition. Mahwah, NJ: Lawrence Erlbaum Associates.
Anderson, L., & Krathwohl, D. (2001). A taxonomy for learning, teaching, and assessing : a
revision of Bloom's taxonomy of educational objectives. New York, NY: Longman.
Anderson, R., Spiro, R., & Montague, W. (1977). Schooling and the acquisition of knowledge.
New York, NY: Lawrence Erlbaum Associates.
Asmuth, J. (2009). The role of structure in learning non-Euclidean geometry. Retrieved from
ProQuest Dissertations & Theses Full Text database. (304973258).
Ausubel, D. (1960). The use of advance organizers in the learning and retention of meaningful
verbal material. Journal of Educational Psychology, 51(5), 267-272.
doi:10.1037/h0046669

63
Ausubel, D. (1968). Educational psychology : A cognitive view. New York, NY: Holt, Rinehart
and Winston.
Bagnoli, A. (2009). Beyond the standard interview: the use of graphic elicitation and arts-based
methods. Qualitative Research, 9(5), 547-570. doi:10.1177/1468794109343625
Barone, R., & Cheng, P. (2005). Semantic traits of graphical interfaces to support human
scheduling. Paper presented at the Ninth International Conference on Information
Visualisation, London, United Kingdom: IEEE.
Barsalou, L., Simmons, W., Barbey, A., & Wilson, C. (2003). Grounding conceptual knowledge
in modality-specific systems. Trends in Cognitive Sciences, 7(2), 84-91.
doi:10.1016/S1364-6613(02)00029-3
Bartlett, F. (1967). Remembering : A study in experimental and social psychology. London,
United Kingdom: Cambridge University Press.
Benros, D., Duarte, J., & Hanna, S. (2012). A new palladian shape grammar. International
Journal of Architectural Computing, 10(4), 521-540.
Blackwell, A., & Engelhardt, Y. (2002). A meta-taxonomy for diagram research. In M.
Anderson, B. Meyer, & P. Olivier (Eds.), Diagrammatic representation and inference
(pp. 47-64). Berlin, Germany: Springer.
Bolc, L., & Carbonell, J. (1987). Natural language parsing systems. Berlin, Germany: Springer.
Boucouvalas, M. (2009). ALHR 5514 Adult Learning[Course syllabus]. Falls Church, VA:
Department of Human Development, Adult Learning and Human Resource
Development. Virginia Tech/National Capital Region.
Branch, R. (2009). Instructional design : The ADDIE approach. New York, NY: Springer.
64
Bransford, J. (2000). How people learn : Brain, mind, experience, and school. Washington, DC:
National Academy Press.
Brna, P., Cox, R., & Good, J. (2001). Learning to think and communicate with diagrams: 14
questions to consider. Artificial Intelligence Review, 15(1-2), 115-134.
doi:10.1023/A:1006584801959
Buckley, C., & Waring, M. (2013). Using diagrams to support the research process: Examples
from grounded theory. Qualitative Research, 13(2), 148-172.
doi:10.1177/1468794112472280
Burchett, H., Umoquit, M., & Dobrow, M. (2011). How do we know when research from one
setting can be useful in another? A review of external validity, applicability and
transferability frameworks. Journal of Health Services Research & Policy, 16(4), 238-
244. doi:10.1258/jhsrp.2011.010124
Burton, A., Shadbolt, N., Rugg, G., & Hedgecock, A. (1990). The efficacy of knowledge
elicitation techniques: A comparison across domains and levels of expertise. Knowledge
Acquisition, 2(2), 167-178. doi:10.1016/S1042-8143(05)80010-X
Burton, J., Stapleton, G., Howse, J., & Chapman, P. (2014). Visualizing concepts with euler
diagrams. In T. Dwyer, H. Purchase, & A. Delaney (Eds.), Diagrammatic representation
and inference (pp. 54-56). Berlin, Germany: Springer.
Bussey, T. (2013). What can biochemistry students learn about protein translation? Using
variation theory to explore the space of learning created by some common external
representations. Retrieved from ProQuest Dissertations & Theses Full Text database.
(1447008185).

65
Canobi, K., & Bethune, N. (2008). Number words in young children’s conceptual and procedural
knowledge of addition, subtraction and inversion. Cognition, 108(3), 675-686.
doi:10.1016/j.cognition.2008.05.011
Carrizo, D., Dieste, O., & Juristo, N. (2014). Systematizing requirements elicitation technique
selection. Information and Software Technology, 56(6), 644-669.
doi:10.1016/j.infsof.2014.01.009
Chandrasekaran, B., Banerjee, B., Kurup, U., & Lele, O. (2011). Augmenting cognitive
architectures to support diagrammatic imagination. Topics in Cognitive Science, 3(4),
760-777. doi:10.1111/j.1756-8765.2011.01156.x
Chen, P. (1975). The entity-relationship model: Toward a unified view of data. SIGIR Forum,
10(3), 9-9. doi:10.1145/1095277.1095279
Chen, S., & Huang, P. (2013). The comparisons of the influences of prior knowledge on two
game-based learning systems. Computers & Education, 68(0), 177-186.
doi:10.1016/j.compedu.2013.05.005
Cheng, P. (2002). Electrifying diagrams for learning: principles for complex representational
systems. Cognitive Science, 26(6), 685-736.
Cheng, P. (2011). Probably good diagrams for learning: Representational epistemic
recodification of probability theory. Topics in Cognitive Science, 3(3), 475-498.
doi:10.1111/j.1756-8765.2009.01065.x
Cheng, P. (2014). Graphical notations for syllogisms: How alternative representations impact the
accessibility of concepts. Journal of Visual Languages & Computing, 25(3), 170-185.
doi:10.1016/j.jvlc.2013.08.008

66
Chi, M., Feltovich, P., & Glaser, R. (1981). Categorization and representation of physics
problems by experts and novices. Cognitive Science, 5(2), 121-152.
Chi, M., Glaser, R., & Farr, M. (1988). The nature of expertise. Hillsdale, NJ: Lawrence Erlbaum
Associates.
Cook, M., Carter, G., & Wiebe, E. N. (2008). The interpretation of cellular transport graphics by
students with low and high prior knowledge. International Journal of Science Education,
30(2), 239-261. doi:10.1080/09500690601187168
Cook, M., Wiebe, E. N., & Carter, G. (2008). The influence of prior knowledge on viewing and
interpreting graphics with macroscopic and molecular representations. Science
Education, 92(5), 848-867. doi:10.1002/sce.20262
Cooke, N. (1994). Varieties of knowledge elicitation techniques. International Journal of
Human-Computer Studies, 41(6), 801-849. doi:10.1006/ijhc.1994.1083
Copeland, A., & Agosto, D. (2012). Diagrams and relational maps: The use of graphic elicitation
techniques with interviewing for data collection, analysis, and display. International
Journal of Qualitative Methods, 11(5), 513-533.
Cordova, J., Sinatra, G., Jones, S., Taasoobshirazi, G., & Lombardi, D. (2014). Confidence in
prior knowledge, self-efficacy, interest and prior knowledge: Influences on conceptual
change. Contemporary Educational Psychology, 39(2), 164-174.
doi:10.1016/j.cedpsych.2014.03.006
Cox, R. (1999). Representation construction, externalised cognition and individual differences.
Learning and Instruction, 9(4), 343-363. doi:10.1016/S0959-4752(98)00051-6
Craik, K. (1967). The nature of explanation. Cambridge, United Kingdom: Cambridge
University Press.

67
Crilly, N., Blackwell, A., & Clarkson, P. (2006). Graphic elicitation: Using research diagrams as
interview stimuli. Qualitative Research, 6(3), 341-366. doi:10.1177/1468794106065007
Cromley, J., Bergey, B., Fitzhugh, S., Newcombe, N., Wills, T., Shipley, T., & Tanaka, J.
(2013). Effects of three diagram instruction methods on transfer of diagram
comprehension skills: The critical role of inference while learning. Learning and
Instruction, 26(0), 45-58. doi:10.1016/j.learninstruc.2013.01.003
Cromley, J., Perez, T., Fitzhugh, S., Newcombe, N., Wills, T., & Tanaka, J. (2013). Improving
students' diagram comprehension with classroom instruction. The Journal of
Eexperimental Education, 81 (4), 511–537. doi:10.1080/00220973.2012.745465
De Toffoli, S., & Giardino, V. (2014). Forms and roles of diagrams in knot theory. Erkenntnis,
79(4), 829-842. doi:10.1007/s10670-013-9568-7
Deacon, T. (1998). The symbolic species : The co-evolution of language and the brain. New
York, NY: W.W. Norton.
DeLeeuw, K., & Hegarty, M. (2008). What diagrams reveal about representations in linear
reasoning, and how they help. In G. Stapleton, J. Howse, & J. Lee (Eds.), Diagrammatic
representation and inference (pp. 89-102). Berlin, Germany: Springer.
Dewey, J. (1916). Democracy and education : An introduction to the philosophy of education.
New York, NY: Macmillan.
Dieste, O., & Juristo, N. (2011). Systematic review and aggregation of empirical studies on
elicitation techniques. IEEE Transactions on Software Engineering, 37(2), 283-304.
doi:10.1109/TSE.2010.33

68
Dimmel, J., & Herbst, P. (2015). The semiotic structure of geometry diagrams: How textbook
diagrams convey meaning. Journal for Research in Mathematics Education, 46(2), 147-
195. doi:10.5951/jresematheduc.46.2.0147
Dochy, F., Segers, M., & Buehl, M. (1999). The relation between assessment practices and
outcomes of studies: The case of research on prior knowledge. Review of Educational
Research, 69(2), 145-186. doi:10.3102/00346543069002145
Duffy, T., & Jonassen, D. (1993). Constructivism and the technology of instruction : A
conversation. Hillsdale, NJ: Lawrence Erlbaum Associates.
Egenhofer, M. (1991). Reasoning about binary topological relations. Lecture notes in computer
science, 525, 144-160.
Egenhofer, M. (1994). Deriving the composition of binary topological relations. Journal of
Visual Languages & Computing, 5(2), 133-149. doi:10.1006/jvlc.1994.1007
Egenhofer, M., & Golledge, R. (1998). Spatial and temporal reasoning in geographic
information systems. New York, NY: Oxford University Press.
Eppler, M. (2006). A comparison between concept maps, mind maps, conceptual diagrams, and
visual metaphors as complementary tools for knowledge construction and sharing.
Information Visualization, 5(3), 202-210. doi:10.1057/palgrave.ivs.9500131
Epstein, S., & Keibel, J. (2002). Learning on paper: Diagrams and discovery in game playing. In
M. Hegarty, B. Meyer, & N. H. Narayanan (Eds.), Diagrammatic representation and
inference (pp. 31-45). Berlin, Germany: Springer.
Ericsson, K. (2006). The Cambridge handbook of expertise and expert performance. Cambridge,
United Kingdom: Cambridge University Press.

69
Falk, J., & Dierking, L. (1995). Public institutions for personal learning : Establishing a
research agenda. Washington, DC: American Association of Museums.
Farrington-Darby, T., & Wilson, J. (2006). The nature of expertise: A review. Applied
Ergonomics, 37(1), 17-32. doi:10.1016/j.apergo.2005.09.001
Fiorini, S., Gardenfors, P., & Abel, M. (2014). Representing part–whole relations in conceptual
spaces. Cognitive Processing, 15(2), 127-142. doi:10.1007/s10339-013-0585-x
Flower, J., Stapleton, G., & Rodgers, P. (2014). On the drawability of 3D Venn and Euler
diagrams. Journal of Visual Languages & Computing, 25(3), 186-209.
doi:10.1016/j.jvlc.2013.08.009
Foshay, W., Silber, K., & Stelnicki, M. (2003). Writing training materials that work : how to
train anyone to do anything : A practical guide for trainers based on current cognitive
psychology and ID theory and research. San Francisco, CA: Jossey-Bass.
Fosnot, C. (1996). Constructivism : Theory, perspectives, and practice. New York, NY:
Teachers College Press.
Galantucci, B. (2010). Experimental semiotics : A new approach for studying the emergence and
the evolution of human communication. Amsterdam, Netherlands: Benjamins.
Garcia, I., & Pacheco, C. (2013). A constructivist computational platform to support
mathematics education in elementary school. Computers & Education, 66, 25-39.
doi:10.1016/j.compedu.2013.02.004
Gardenfors, P. (2000). Conceptual spaces : The geometry of thought. Cambridge, MA: MIT
Press.
Gardenfors, P. (2014). The geometry of meaning semantics based on conceptual spaces.
Cambridge, MA: MIT Press.

70
Gardenfors, P., & Zenker, F. (2013). Theory change as dimensional change: Conceptual spaces
applied to the dynamics of empirical theories. Synthese, 190(6), 1039-1058.
doi:10.1007/s11229-011-0060-0
Gavrilova, T., & Andreeva, T. (2012). Knowledge elicitation techniques in a knowledge
management context. Journal of Knowledge Management, 16(4), 523-537.
doi:10.1108/13673271211246112
Gavrilova, T., Leshcheva, I., & Rumyantseva, M. (2011). Knowledge elicitation methods
taxonomy: Russian view. Paper presented at the 15th International Conference on
Knowledge-Based and Intelligent Information and Engineering Systems, Kaiserslautern,
Germany: Elsevier.
Giardino, V. (2013). A practice-based approach to diagrams. In A. Moktefi & S.-J. Shin (Eds.),
Visual reasoning with diagrams (pp. 135-151). Berlin, Germany: Springer.
Gick, M., & Holyoak, K. (1980). Analogical problem solving. Cognitive Psychology, 12(3), 306-
355. doi:10.1016/0010-0285(80)90013-4
Gips, J. (1975). Shape grammars and their uses : Artificial perception, shape generation and
computer aesthetics. Basel, Switzgerald: Birkhäuser.
Goldman, A. (2006). Simulating minds : The philosophy, psychology, and neuroscience of
mindreading. Oxford, United Kingdom: Oxford University Press.
Gottfried, B. (2014). Set space diagrams. Journal of Visual Languages & Computing, 25(4), 518-
532. doi:10.1016/j.jvlc.2014.04.003
Gottfried, B. (2015). The diamond of contraries. Journal of Visual Languages & Computing, 26,
29-41. doi:10.1016/j.jvlc.2014.11.003

71
Harris, J., Breier, M., & Wihak, C. (2011). Researching the recognition of prior learning :
international perspectives. Leicester, United Kingdom: NIACE.
Hattie, J. (2009). Visible learning : A synthesis of over 800 meta-analyses relating to
achievement. New York, NY: Routledge.
Hoffecker, J. (2011). Landscape of the mind : Human evolution and the archaeology of thought.
New York, NY: Columbia University Press.
Hoffman, R., Shadbolt, N., Burton, A., & Klein, G. (1995). Eliciting knowledge from experts: A
methodological analysis. Organizational Behavior and Human Decision Processes,
62(2), 129-158. doi:10.1006/obhd.1995.1039
Hoffman, R., Ward, P., & Feltovich, P. (2013). Accelerated expertise : training for high
proficiency in a complex world. New York, NY: Taylor & Francis.
Hutchins, E. (1995). Cognition in the wild. Cambridge, Mass.: MIT Press.
Hyerle, D. (1996). Visual tools for constructing knowledge. Alexandria, VA: Association for
Supervision and Curriculum Development.
Jessee, E. (2012). Understanding student experiences: A case study in scientific visualization and
civics and economics. Retrieved from ProQuest Dissertations & Theses Full Text
database. (1346225930).
John-Steiner, V., & Mahn, H. (1996). Sociocultural approaches to learning and development: A
Vygotskian framework. Educational Psychologist, 31(3-4), 191-206.
doi:10.1080/00461520.1996.9653266
Jonassen, D. (2004). Learning to solve problems : An instructional design guide. San Francisco,
CA: Pfeiffer.

72
Jonassen, D. (2006). On the role of concepts in learning and instructional design. Educational
Technology Research and Development, 54(2), 177-196. doi:10.1007/s11423-006-8253-9
Jonassen, D., Beissner, K., & Yacci, M. (1993). Structural knowledge : Techniques for
representing, conveying, and acquiring structural knowledge. Hillsdale, NJ: Lawrence
Erlbaum Associates.
Jonassen, D., & Strobel, J. (2006). Modeling for meaningful learning. In D. Hung & M. Khine
(Eds.), Engaged learning with emerging technologies (pp. 1-27). Berlin, Germany:
Springer.
Jones, S., Miles, U., & Read, M. (1996). A comparison of knowledge elicitation methods. Expert
Systems, 13(4), 277-294.
Kalyuga, S. (2008). Relative effectiveness of animated and static diagrams: An effect of learner
prior knowledge. Computers in Human Behavior, 24(3), 852-861.
doi:10.1016/j.chb.2007.02.018
Karrass, M. (2012). Diagrammatic reasoning skills of pre-service mathematics teachers.
Retrieved from ProQuest Dissertations & Theses Full Text database. (919522981).
Khosrowjerdi, M., & Iranshahi, M. (2011). Prior knowledge and information-seeking behavior of
PhD and MA students. Library & Information Science Research, 33(4), 331-335.
doi:10.1016/j.lisr.2010.04.008
Kihlstrom, J. (1987). The cognitive unconscious. Science, 237(4821), 1445-1452.
Kirschner, P., Sweller, J., & Clark, R. (2006). Why minimal guidance during instruction does not
work: An analysis of the failure of constructivist, discovery, problem-based, experiential,
and inquiry-based teaching. Educational Psychologist, 41(2), 75-86.
doi:10.1207/s15326985ep4102_1

73
Kline, K. (2012). The effects of visualizations and spatial ability on learning from static
multimedia instructions. Retrieved from ProQuest Dissertations & Theses Full Text
database. (1114891162).
Klunk, C. (2009). ALHR 5584 Facilitating Adult Learning[Course syllabus]. Falls Church, VA:
Department of Human Development, Adult Learning and Human Resource
Development. Virginia Tech/National Capital Region.
Knight, T. W. (1999). Shape grammars: Six types. Environment and Planning B: Planning and
Design, 26(1), 15-31. doi:10.1068/b260015
Knowles, M., Holton, E., & Swanson, R. (2005). The adult learner : The definitive classic in
adult education and human resource development. Boston, MA: Elsevier.
Kolloffel, B., Eysink, T., & de Jong, T. (2010). The influence of learner-generated domain
representations on learning combinatorics and probability theory. Computers in Human
Behavior, 26(1), 1-11. doi:10.1016/j.chb.2009.07.008
Kolloffel, B., Eysink, T., & de Jong, T. (2011). Comparing the effects of representational tools in
collaborative and individual inquiry learning. International Journal of Computer-
Supported Collaborative Learning, 6(2), 223-251. doi:10.1007/s11412-011-9110-3
Kresse, W., & Danko, D. (2012). Springer handbook of geographic information (Vol. 1). New
York, NY: Springer.
Laguna, M., & Marklund, J. (2005). Business process modeling, simulation, and design. Upper
Saddle River, NJ: Pearson Prentice Hall.
Landin, J. (2011). Perceptual drawing as a learning tool in a college biology laboratory.
Retrieved from ProQuest Dissertations & Theses Full Text database. (879433467).

74
Landy, D., & Goldstone, R. (2007). How abstract is symbolic thought? Journal of Experimental
Psychology: Learning, Memory, and Cognition, 33(4), 720-733. doi:10.1037/0278-
7393.33.4.720
Larkin, J., McDermott, J., Simon, D. P., & Simon, H. A. (1980). Expert and novice performance
in solving physics problems. Science, 208(4450), 1335-1342.
doi:10.1126/science.208.4450.1335
Larkin, J., & Simon, H. A. (1987). Why a diagram is (sometimes) worth ten thousand words.
Cognitive Science, 11(1), 65-100. doi:10.1016/S0364-0213(87)80026-5
Leighton, J., & Gierl, M. (2007). Cognitive diagnostic assessment for education : Theory and
applications. Cambridge, United Kingdom: Cambridge University Press.
Leighton, J., & Gierl, M. (2011). The learning sciences in educational assessment : The role of
cognitive models. Cambridge, United Kingdom: Cambridge University Press.
Ley, T., Kump, B., & Albert, D. (2010). A methodology for eliciting, modelling, and evaluating
expert knowledge for an adaptive work-integrated learning system. International Journal
of Human-Computer Studies, 68(4), 185-208. doi:10.1016/j.ijhcs.2009.12.001
Li, S. (2013). Formative feedback using pseudo peer diagrams: Evaluating system equilibrium of
buoyancy forces. Retrieved from ProQuest Dissertations & Theses Full Text database.
(1438901188).
Madsen, A. (2013). Studies of visual attention in physics problem solving. Retrieved from
ProQuest Dissertations & Theses Full Text database. (1417754761).
Mahoney, J., & Vanderpoel, R. (2015). Set diagrams and qualitative research. Comparative
Political Studies, 48(1), 65-100. doi:10.1177/0010414013519410

75
Manalo, E., & Uesaka, Y. (2012). Elucidating the mechanism of spontaneous diagram use in
explanations: How cognitive processing of text and diagrammatic representations are
influenced by individual and task-related factors. In P. Cox, B. Plimmer, & P. Rodgers
(Eds.), Diagrammatic representation and inference (pp. 35-50). Berlin, Germany:
Springer.
Mandler, J. (1984). Stories, scripts, and scenes : Aspects of schema theory. Hillsdale, NJ:
Lawrence Erlbaum Associates.
Maries, A., & Singh, C. (2012). Should students be provided diagrams or asked to draw them
while solving introductory physics problems? AIP Conference Proceedings, 1413(1),
263-266. doi:10.1063/1.3680045
Marriott, K., & Meyer, B. (1998). Visual language theory. New York, NY: Springer.
Marshall, P., & Gordon, D. (2011). Knowledge acquisition to knowledge elicitation: A roadmap.
Paper presented at the 12th European Conference on Knowledge Management (ECKM
2011), Passau, Germany.
Maxwell, J. (2013). Qualitative research design : An interactive approach. Thousand Oaks, CA:
SAGE.
McVee, M., Dunsmore, K., & Gavelek, J. (2005). Schema theory revisited. Review of
Educational Research, 75(4), 531-566. doi:10.2307/3516106
Mendelson, B. (1962). Introduction to topology. Boston, MA: Allyn and Bacon.
Merriam, S. (1998). Qualitative research and case study applications in education. San
Francisco, CA: Jossey-Bass.
Merriam, S. (2009). Qualitative research : A guide to design and implementation. San Francisco,
CA: Jossey-Bass.

76
Meyer, H. (2004). Novice and expert teachers' conceptions of learners' prior knowledge. Science
Education, 88(6), 970-983. doi:10.1002/sce.20006
Moreno, R., Ozogul, G., & Reisslein, M. (2011). Teaching with concrete and abstract visual
representations: Effects on students' problem solving, problem representations, and
learning perceptions. Journal of Educational Psychology, 103(1), 32-47.
doi:10.1037/a0021995
Morris, L. (2009). ALHR 5544 Small Groups in Adult Learning[Course syllabus]. Falls Church,
VA: Department of Human Development, Adult Learning and Human Resource
Development. Virginia Tech/National Capital Region.
Morris, P., Gruneberg, M., Sykes, R., & Merrick, A. (1981). Football knowledge and the
acquisition of new results. British Journal of Psychology, 72(4), 479-483.
doi:10.1111/j.2044-8295.1981.tb01777.x
Murphy, G. (2004). The big book of concepts. Cambridge, MA: MIT Press.
Newell, A., & Simon, H. A. (1972). Human problem solving. Englewood Cliffs, NJ: Prentice-
Hall.
Nickerson, J., Corter, J., Tversky, B., Rho, Y., Zahner, D., & Yu, L. (2013). Cognitive tools
shape thought: Diagrams in design. Cognitive Processing, 14(3), 255-272.
doi:10.1007/s10339-013-0547-3
Novak, J., & Gowin, D. (1984). Learning how to learn. Cambridge, United Kingdom:
Cambridge University Press.
Novick, L. (2006). The importance of both diagrammatic conventions and domain-specific
knowledge for diagram literacy in science: The hierarchy as an illustrative case. In D.

77
Barker-Plummer, R. Cox, & N. Swoboda (Eds.), Diagrammatic representation and
inference (pp. 1-11). Berlin, Germany: Springer.
Novick, L., & Catley, K. (2014). When relationships depicted diagrammatically conflict with
prior knowledge: An investigation of students’ interpretations of evolutionary trees.
Science Education, 98(2), 269-304. doi:10.1002/sce.21097
Novick, L., Hurley, S., & Francis, M. (1999). Evidence for abstract, schematic knowledge of
three spatial diagram representations. Memory & Cognition, 27(2), 288-308.
doi:10.3758/BF03211413
O'Donnell, A., Dansereau, D., & Hall, R. (2002). Knowledge maps as scaffolds for cognitive
processing. Educational Psychology Review, 14(1), 71-86. doi:10.2307/23363489
Papadimitriou, C., & Steiglitz, K. (1982). Combinatorial optimization : Algorithms and
complexity. Englewood Cliffs, NJ: Prentice Hall.
Pastore, R. (2009). The instructional effects of diagrams and time-compressed instruction on
student achievement and learners' perceptions of cognitive load. Retrieved from
ProQuest Dissertations & Theses Full Text database. (304983547).
Phillips, B., Novick, L., Catley, K., & Funk, D. (2012). Teaching tree thinking to college
students: It's not as easy as you think. Evolution: Education & Outreach, 5(4), 595-602.
doi:10.1007/s12052-012-0455-5
Piaget, J. (1954). The construction of reality in the child. New York, NY: Basic Books.
Piaget, J. (1970). Structuralism. New York, NY: Basic Books.
Piaget, J., & Brown, T. (1985). The equilibration of cognitive structures : The central problem of
intellectual development. Chicago, IL: University of Chicago Press.

78
Pillsbury, R. (2008). Diagramming the never ending story: Student-generated diagrammatic
stories integrate and retain science concepts improving science literacy. Retrieved from
ProQuest Dissertations & Theses Full Text database. (304369897).
Pinker, S. (1997). How the mind works. New York, NY: Norton.
Poch, A., van Garderen, D., & Scheuermann, A. (2015). Students’ understanding of diagrams for
solving word problems: A framework for assessing diagram proficiency. Teaching
exceptional children, 47(3), 153-162.
Pouw, W., van Gog, T., & Paas, F. (2014). An embedded and embodied cognition review of
instructional manipulatives. Educational Psychology Review, 26(1), 51-72.
doi:10.1007/s10648-014-9255-5
Powers, M. (1984). Investigation to inquire into the circumstances connected with the crash of
Marine CH-53D helicopter, bureau number 157132 (YN-666) near Widibin,Korea at
0400 on 24 March 1984. San Francisco, CA: Department of Defense.
Purchase, H. (2014). Twelve years of diagrams research. Journal of Visual Languages &
Computing, 25(2), 57-75. doi:10.1016/j.jvlc.2013.11.004
Purchase, H., & Samra, A. (2008). Extremes are better: Investigating mental map preservation in
dynamic graphs. In G. Stapleton, J. Howse, & J. Lee (Eds.), Diagrammatic
representation and inference (pp. 60-73). Berlin, Germany: Springer.
Rau, M., Michaelis, J., & Fay, N. (2015). Connection making between multiple graphical
representations: A multi-methods approach for domain-specific grounding of an
intelligent tutoring system for chemistry. Computers & Education, 82, 460-485.
doi:10.1016/j.compedu.2014.12.009

79
Renard, P. (2009). ALHR 6814 Consulting With Human Systems[Course syllabus]. Falls Church,
VA: Department of Human Development, Adult Learning and Human Resource
Development. Virginia Tech/National Capital Region.
Rittle-Johnson, B., & Alibali, M. W. (1999). Conceptual and procedural knowledge of
mathematics: Does one lead to the other? Journal of Educational Psychology, 91(1), 175-
189. doi:10.1037/0022-0663.91.1.175
Rittle-Johnson, B., Star, J., & Durkin, K. (2009). The importance of prior knowledge when
comparing examples: Influences on conceptual and procedural knowledge of equation
solving. Journal of Educational Psychology, 101(4), 836-852. doi:10.1037/a0016026
Rokers, B. (2007). The role of prior knowledge in perception, learning, and cognition. Retrieved
from ProQuest Dissertations & Theses Full Text database. (305339627).
Rosengrant, D. (2007). Multiple representations and free-body diagrams: Do students benefit
from using them? Retrieved from ProQuest Dissertations & Theses Full Text database.
(304805210).
Salkind, N. (2010a). Encyclopedia of research design. Thousand Oaks, CA: SAGE.
Salkind, N. (2010b). Encyclopedia of research design. Thousand Oaks, CA: SAGE.
Salkind, N. (2010c). Encyclopedia of research design. Thousand Oaks, CA: SAGE.
Sanders, M., Kimball, K., Frezell, T., & Hofmann, M. (1975). Aviator performance measurement
during low altitude rotary wing flight with the AN PVS 5 night vision goggles. Fort
Rucker, AL: Defense Technical Information Center.
Schank, R., & Abelson, R. (1977). Scripts, plans, goals, and understanding : An inquiry into
human knowledge structures. New York, NY: Lawrence Erlbaum Associates.

80
Schneider, M., Rittle-Johnson, B., & Star, J. (2011). Relations among conceptual knowledge,
procedural knowledge, and procedural flexibility in two samples differing in prior
knowledge. Developmental Psychology, 47(6), 1525-1538. doi:10.1037/a0024997
Sowa, J. (1984). Conceptual structures : Information processing in mind and machine. Reading,
MA: Addison-Wesley.
Staats, A. (2012). The marvelous learning animal : What makes human nature unique. Amherst,
NY: Prometheus Books.
Stiny, G. (1975). Pictorial and formal aspects of shape and shape grammars. Basel, Switzgerald:
Birkhäuser.
Thagard, P. (1992). Conceptual revolutions. Princeton, NJ: Princeton University Press.
Tobias, S. (2010). Generative learning theory, paradigm shifts, and constructivism in educational
psychology: A tribute to Merl Wittrock. Educational Psychologist, 45(1), 51-54.
doi:10.1080/00461520903433612
Tobias, S., & Duffy, T. (2009). Constructivist instruction : Success or failure? New York, NY:
Routledge.
Tversky, B. (2001). Spatial schemas in depictions. Spatial Schemas and Abstract Thought (pp.
79-111). Cambridge, MA: MIT Press.
Tversky, B. (2011). Visualizing thought. Topics in Cognitive Science, 3(3), 499-535.
doi:10.1111/j.1756-8765.2010.01113.x
Tversky, B., & Kessell, A. (2014). Thinking in action. Pragmatics & Cognition, 22(2), 206-223.
Tversky, B., & Suwa, M. (2009). Thinking with sketches. Tools for innovation (pp. 75-84).
Oxford, United Kingdom: Oxford University Press.

81
Uesaka, Y., Manalo, E., & Ichikawa, S. (2007). What kinds of perceptions and daily learning
behaviors promote students' use of diagrams in mathematics problem solving? Learning
and Instruction, 17(3), 322-335. doi:10.1016/j.learninstruc.2007.02.006
Umoquit, M., Tso, P., Burchett, H., & Dobrow, M. (2011). A multidisciplinary systematic
review of the use of diagrams as a means of collecting data from research subjects:
Application, benefits and recommendations. BMC Medical Research Methodology, 11(1),
11.
Umoquit, M., Tso, P., Vargas-Atkins, T., O'Brien, M., & Wheeldon , J. (2013). Diagrammatic
elicitation: Defining the use of diagrams in data collection. Qualitative Report, 18(30), 1.
van den Bossche, P., Gijselaers, W., Segers, M., Woltjer, G., & Kirschner, P. (2011). Team
learning: Building shared mental models. Instructional Science, 39(3), 283-301.
doi:10.1007/s11251-010-9128-3
van Garderen, D., & Scheuermann, A. (2015). Diagramming word problems: A strategic
approach for instruction. Intervention in School and Clinic, 50(5), 282-290.
doi:10.1177/1053451214560889
van Garderen, D., Scheuermann, A., & Jackson, C. (2013). Examining how students with diverse
abilities use diagrams to solve mathematics word problems. Learning Disability
Quarterly, 36(3), 145-160. doi:10.1177/0731948712438558
Vosniadou, S. (2008). International handbook of research on conceptual change. New York,
NY: Routledge.
Vosniadou, S. (2012). Reframing the classical approach to conceptual change: Preconceptions,
misconceptions and synthetic models. In B. J. Fraser, K. Tobin, & C. J. McRobbie (Eds.),

82
Second international handbook of science education (pp. 119-130). Berlin, Germany:
Springer.
Vygotsky, L. (1978). Mind in society : The development of higher psychological processes.
Cambridge, MA: Harvard University Press.
Waller, D., & Nadel, L. (2013). Handbook of spatial cognition. Washington, DC: American
Psychological Association.
Ware, C., Gilman, A., & Bobrow, R. (2008). Visual thinking with an interactive diagram. In G.
Stapleton, J. Howse, & J. Lee (Eds.), Diagrammatic representation and inference (pp.
118-126). Berlin, Germany: Springer.
Warglien, M., & Gardenfors, P. (2013). Semantics, conceptual spaces, and the meeting of minds.
Synthese, 190(12), 2165-2193. doi:10.1007/s11229-011-9963-z
Wetzels, S., Kester, L., & van Merriënboer, J. (2011). Adapting prior knowledge activation:
Mobilisation, perspective taking, and learners’ prior knowledge. Computers in Human
Behavior, 27(1), 16-21. doi:10.1016/j.chb.2010.05.004
Wheeldon, J., & Ahlberg, M. (2012). Visualizing social science research : Maps, methods, &
meaning. Los Angeles, CA: SAGE.
Williams, J., & Lombrozo, T. (2013). Explanation and prior knowledge interact to guide
learning. Cognitive Psychology, 66(1), 55-84. doi:10.1016/j.cogpsych.2012.09.002
Yestness, N. (2012). A study of undergraduate students' use of diagrams in understanding and
constructing proofs about groups, subgroups, and isomorphisms. Retrieved from
ProQuest Dissertations & Theses Full Text database. (1285524159).
Yin, R. (2009). Case study research: Design and methods. Los Angeles, CA: SAGE.

83
Yoon, D., Narayanan, N., Lee, S., & Kwon, O. (2006). Exploring the effect of animation and
progressive revealing on diagrammatic problem solving. In D. Barker-Plummer, R. Cox,
& N. Swoboda (Eds.), Diagrammatic representation and inference (pp. 226-240). Berlin,
Germany: Springer.
Yue, K., & Krishnamurti, R. (2013). Tractable shape grammars. Environment and Planning B:
Planning and Design, 40(4), 576-594.

84
APPENDIX A – IRB APPROVAL LETTER

85
APPENDIX B - SAMPLE DIAGRAMS
Sample Student Diagrams – Graduate Students, College Teaching

86
Sample Student Diagrams – Graduate Students, Project Management

87
Sample Student Diagrams – Undergraduate Students, Project Management

88
Sample Student Diagrams – Undergraduate Students, Program and Operations
Management

89
APPENDIX C – CONCEPT TOPOLOGY COLLABORATION QUESTIONS
Relation Collaboration Question Visual Example
Disjoint What are the attributes and values
that make concepts distinct in this
domain?
Meet What are the attributes and values
that connect these concepts along a
common boundary in this domain?
Equal What are the attributes and values
of concepts that are viewed to be
equal to each other in this domain?
Inside What are the attributes and values
of concepts that are contained
within a larger encompassing
concept?
Covered By What are the attributes and values
of concepts that are covered by and
replaced by other concepts that are
present in the same space?
Contains What are the attributes and values
of concepts contained within
another concept and share a
common boundary with other
external spaces?
Covers What are the attributes and values
of a concept that obscure and hide
another concept from view?
Overlap What are the attributes and values
of a concept that overlaps part of
another concept, hiding part of it
from view?

90
APPENDIX D – INSTRUCTOR RESPONSE TO RESEARCH QUESTIONS
Question 1
What did you observe regarding the student’s response to the diagramming instructions?
>> Both graduate and undergraduate students were initially confused when told they
could only diagram using triangles, squares, and circles. At least some thought it was some sort
of trick question.
Probe 1A. How did the students react to using crayons and blank sheets of paper?
>> Both graduate and undergraduate students were surprised when asked to draw with
crayons and some expressed concern that drawing with crayons was for school children.
Probe 1B. How did the student’s react to viewing their own generated diagrams?
>> Both graduate and undergraduate students looked at their own diagrams with a mix
of pride and uncertainty. That is, they are often asked questions for which there is only one,
correct answer (particularly undergrads) so they could not initially assess if they got it “right”
or not.
Probe 1C. How did the students respond to the experience of creating the diagrams?
>> After getting over the initial thought of having to draw with crayons, both graduate
and undergraduate students seemed to enjoy the exercise.
Probe 1D. How did the students respond to the use of the three elicitation questions?

91
>> Most of my graduate and undergraduate students acted confidently that they knew
how to diagram how the world works (#1; more of an opinion question) but less so on you store
information (#2) and even less so on how you monitor your own learning (#3), the latter two
being more technical than opinion.
Probe 1E. What did you observe about the student’s response when asked to share their
diagram descriptions with the other students in the class?
>> Both graduate and undergraduate students were hesitant to share their diagrams
(particularly undergrads, who are used to there being only one correct answer to a question and
how can one know if a crayon-drawn diagram is the correct one?). However, once the first few
students shared their diagrams it became apparent that no two people diagrammed the questions
the same way (or even close to each other) and there wasn’t one, “right” answer.
Question 2
What features of the student diagrams did you find aligned with your course content?
>> These exercises were done in a mix of graduate and undergraduate courses in
Information Systems (business courses, not computer science ones) and project management.
For the IS courses, it fit very well because the underlying course theme was, “Convert data into
information so we can solve problems and make better decisions.” and students could see the
relevance. For project management courses, the alignment was even stronger, particularly when
they were asked by Mr. Conroy, “How many of you have ever joined a project team and were
asked, ‘How do you define how the world works?’” The grad students really resonated with this
as the impacts of not having a shared vocabulary were apparent.
Probe 2A. When you review samples of the student diagrams, what meaning would you
assign to the different shapes created by the students in their diagrams?

92
>> The variability was too great to assign a particular meaning to a given shape;
however, the question “How does the world work?” elicited the most consistent shape
definitions. That is, most answers fell into one of three, main categories using the following
shapes:
Power (or hierarchy) = triangle
Structure = square
Love (or symbiosis) = circle
Probe 2B. What meaning would you assign to the differences in shape?
>> Although not measured as part of the exercise, after having watched hundreds of
students complete this exercise, I can say anecdotally there were marked differences based on:
age, gender, culture, and work experience/area of study.
Probe 2C. What meaning would you assign to the differences in color?
>> None of the exercises done with my students involved an evaluation of color and
given the many different crayon colors used I cannot comment on this.
Probe 2D. What meaning would you assign to the differences in size?
>> There was too much variability to comment other than what seemed obvious: the size
of the object was related to its strength or importance.
Probe 2E. What did you observe regarding the behavior of the students during their
participation in the diagramming exercise?
93
>> Overall, students found the exercise to be worthwhile and eye-opening when they got
to the end and realized diagrams created with crayons and simple shapes can be very useful.
Question 3
What did you observe regarding the technique of limiting the students to using only three
geometric shapes when creating their diagrams?
>> Without this restriction, the exercise would have devolved into something resembling
interpreting abstract art, with definitions so variable as to make meaningful comparisons nearly
impossible.
Probe 3A. What meaning would you assign to the geometric shapes?
>> Hierarchy = triangle
Structure = square
Flexibility (or unity) = circle
Probe 3B. What might be the source of the geometric shape knowledge exhibited by the
students?
>> This is difficult to assess objectively. Again, it’s anecdotal but there were marked
differences based on: age, gender, culture, and work experience/area of study. Perhaps a further
area of study would be to control for these variables.
Probe 3C. What meaning would you assign to the differences in shapes exhibited by each
of the student’s diagrams?
>> See answer to Probe 3C.

94
Probe 3D. Based on the student diagrams, what would you infer about their prior
knowledge of the course knowledge?
>> This is difficult to recall objectively. I can say that there were large differences in
prior knowledge. Some students had 10+ years of experience and some were traditional
undergrads (19-22 years old). Again, perhaps a further area of study would be to control for
these variables.
Probe 3E. What terms would you use to describe the range of diagramming skills
exhibited by the students?
>> I would say most students had not done any more than cursory or simplistic
diagramming of concepts or business processes.
Question 4
How could the diagrams be used to support the students in generating shared course
content knowledge?
>> I think a team exercise to evaluate and attempt to harmonize the diagrams (at least as
far as “How does the world work?”) could be very useful.
Probe 4A. How do you think sharing the diagrams in small groups would affect
communication between students?
>> I think it would be useful and could contribute to teams coming to a realization more
quickly that two people can look at the same thing and explain it very differently.

95
Probe 4B. How might the creation of shared diagrams improve student collaborations
during the semester?
>> Again, I think a team exercise to evaluate and attempt to harmonize diagrams could
be very useful. To take this thought to the next level, perhaps a taxonomy of views could be
created (maybe something similar to Meyers-Briggs).
Probe 4C. What do you think the response would be of the students when asked to create
shared diagrams of prior knowledge?
>> While I think this would be really, really interesting and useful, I suspect some
students (particularly undergrads) would be overwhelmed by the question.
Probe 4D. How would you create a rubric for evaluating the differences between
diagrams created by different groups?
>> This is a very tough question. Either a Meyers-Briggs type rubric or what I have used
to explain organizational structures:
Triangles = hierarchies that are organized around function; the fundamental question
they ask is, “Who is in charge?”
Squares = matrix companies that are organized around outcome; the fundamental
question they ask is, “How can this problem be solved?”
Circles = virtual or Protean companies are organized around tasks; the fundamental
question they ask is, “What needs to be done?”

96
Probe 4E. What type of behaviors would you expect from small groups when
collaborating to create shared diagrams?
>> This is another very tough question. I would say the younger the audience, the more
structure/definition is needed to prevent the exercise from devolving into an exercise in
unsubstantiated opinions.
Question 5
What changes to the diagram technique would you recommend to better formalize the
diagramming rules and constraints in a way that it can become a learned skill that the students
can use in other settings?
>> While adding formality and structure helps guide teams to a common “language”, it
may conceal dramatic differences in definitions. If the goal is commonality, the instructor should
explain definitions of the shapes, color, and sizes; if the goal is to illustrate the difficulty in
getting to commonality, less formality is better.
Probe 5A. How often do you encourage students use diagrams in the classroom?
>> This is highly dependent upon the course. While nearly all the business classes
involved a minimum of using diagrams created by other people, most Information Systems
classes include basics of business process modeling (BPM) creation. However, if the syllabus
doesn’t call for diagramming, I don’t include it.
Probe 5B. How would you describe the features of the diagramming exercise to a fellow
instructor or peer?

97
>> I would say this is a great icebreaker or tool to help teams learn early on the
challenges they will face working together.
Probe 5C. How would you change the diagramming rules to improve the diagramming
technique?
>> Again, it depends upon the desired outcome: commonality = more formality; not
commonality = less (or no) formality.
Probe 5D. In which domains of study do you think diagrams work best?
>> At a minimum: Information Systems, Project Management, Organizational
Development, and Entrepreneurship.
Probe 5E. How would you explain the role of using diagrams in classroom discourse and
student communications?
>> Having watched hundreds of students complete this exercise I can safely say that
some sort of diagramming skills and/or diagram use should be required in business courses (and
I’m not talking about formal diagrams such as Use Cases, ERD, DFD, etc.)
Question 6
How would you change the technique or add additional annotations to the diagrams to
strengthen their use as a data collection tool for use by instructors?
>> Perhaps allowing students to add text callouts to shapes to explain their meaning.
Probe 6A. What role do you think text labels could play in the technique?
>> A great idea.

98
Probe 6B. How would the outcome of having the students create a shared vocabulary
impact your approach to the concepts in the course?
>> Again, it depends on the course. Some IS courses and most project management or
Organizational Development courses could benefit greatly from a shared vocabulary.
Probe 6C. How would you compare the use of other rule sets, such as concept maps, to
create diagrams?
>> It depends upon the course but I can see this being very useful.
Probe 6D. How could the diagrams be used as research data?
>> As was mentioned previously, controlling for factors like: age, gender, culture, etc.
could be extremely useful to businesses looking to maximize performance from cross-functional
teams. Likewise, assessing how high-performing teams diagram things could yield strong
insights into some of the reasons why such teams do so well.
Probe 6E. How would you explain the advantages of the diagram technique to other
instructors?
>> I would say something like, “Using this technique, in 30 minutes or less, you will able
to gage your students’ abilities to collaborate and communicate effectively in teams.”
Probe 6F. How would you explain the disadvantages of the diagram technique to other
instructors?
>> The level of subjectivity could make-or-break this technique.

99
Probe 6G. How would you change the technique or add additional annotations to the
diagrams to strengthen their use as a data collection tool for use by educational researchers?
>> At a minimum: age, gender, ethnic culture, business culture (e.g., finance, marketing,
and engineering), industry, major/concentration, work type (project-based or operations).
Question 7
What other techniques would you recommend for eliciting prior knowledge from the
students using external representations that are graphic in nature?
>> Perhaps showing trends in past diagrams (e.g., something like, “X% of people define
way world works as X, Y, or Z.”
Probe 7A. How could identifying gaps in prior knowledge benefit the instructors?
>> I’m not sure how this would be done – I think there would have to be some way to
determine what prior knowledge there should be so that the gaps could be identified. For
example, I poll my students before the semester as to their knowledge (on a numeric scale) of
certain concepts and software programs. By having a numeric scale, I calculate an average
score per skill that I use to determine where the center of the distribution lies. I don’t see how
triangles, squares, and circles could yield something similar but that may be because I’m
thinking more quantitatively.
Probe 7B. Can you recommend other tools and techniques when eliciting prior
knowledge of the students about the course domain knowledge?
>> Perhaps a situational or role-playing exercise could be used as a prelude to the
diagraming exercise.

100
Probe 7C. How could identifying gaps in prior knowledge benefit the students?
>> Please see comments on Probe 7A.
Probe 7D. How could identifying gaps in prior knowledge benefit the educational
researchers?
>> Again, if the issues in Probe 7A could be overcome/addressed, researchers might be
able to tell instructors what to expect from a given group of students regarding their prior
knowledge and gaps thereof.

101
APPENDIX E – INSTRUCTOR RESEARCH QUESTIONS
Question 1
How did you think the students understood the diagramming instructions?
Probe 1A. What was the student’s reaction to using crayons and blank sheets of paper?
Probe 1B. What was the student’s reaction to viewing their own generated diagrams?
Probe 1C. How would you characterize the student’s response to creating the diagrams?
Probe 1D. How would you characterize the student’s response to the three questions?
Probe 1E. What did you think about the student’s response in sharing their diagram
descriptions with the other students in the class?
Question 2
What features of the student diagrams did you find interesting?
Probe 2A. What do you think the differences in shape placement meant?
Probe 2B. What do you think the differences in shape meant?
Probe 2C. What did you think the differences in color meant?
Probe 2D. What do you think the students thought about the differences in their
diagrams?
Probe 2E. What did you think the student’s thought of the exercise?
Question 3
How effective was the technique of limiting the students to using only geometric shapes?
Probe 3A. What do you think the geometry represented?
Probe 3B. Where do you think the geometric knowledge originates in the mind?

102
Probe 3C. How would you describe the range of differences in the geometric
descriptions?
Probe 3D. What type of prior knowledge do you think the geometry represents?
Probe 3E. How would you describe the diagramming skill level of the students?
Question 4
How would you use the diagrams to support the students in generating shared diagrams
created by students in small groups?
Probe 4A. What do you think sharing the diagrams in small groups would do to the
communication between students?
Probe 4B. How do you think the diagrams could improve the student’s perception of the
new material they are learning?
Probe 4C. How involved do you think the students would become in creating shared
diagrams?
Probe 4D. How do you think the students would evaluate the shared diagrams created by
different groups?
Probe 4E. How would you evaluate the diagrams created in small groups?
Question 5
How would you make changes to the diagram technique to better formalize the rules and
constraints in a way that it becomes a learned skill that the students can use in other settings?
Probe 5A. How often do you think the students use diagrams in the classroom?
Probe 5B. How would you describe the features of a diagramming skill?
Probe 5C. How would you change the rules to improve the diagramming technique?
Probe 5D. In which domains of study do you think diagrams work best?

103
Probe 5E. How would you explain the role of using diagrams in discourse and
communication?
Question 6
How would you change the technique or add additional annotations to the diagrams to
strengthen their use as a data collection tool for educational researchers?
Probe 6A. What role do you think text labels could play in the technique?
Probe 6B. How would the outcome of having the students create a shared vocabulary
impact your approach to the concepts in the course?
Probe 6C. How would you compare the use of other rule sets, such as concept maps, to
create diagrams?
Probe 6D. How would you use the diagrams as research data?
Probe 6E. How would you explain the diagram data to other instructors?

104
APPENDIX F – KEY TERMS
The key terms are defined for the reader in this appendix. The terms are in such general
use across domains that they can be easily misinterpreted. The definitions are provided within
the context of how they are used in this study and not meant to extend these interpretations or
meanings to other research domains.
Diagram is defined within the context of this study as a visual image that is constructed
through the physical process of locating a point and a connecting line on a drawing canvas, is
this case, a piece of blank paper (Larkin & Simon, 1987).
The diagram is further constrained by the limitation that excludes embellishments,
annotations, labels, numbers, and other special notations, making the diagrams abstract in
contract to concrete diagrams (Purchase, 2014).
The node-link, point-line connections must be constructed in such a way as to create the
geometric shapes of triangles, squares, or circles. These are the only shapes allowed in the
diagram created by the students. This rule or specification is referred to in the literature as a
shape grammar (Stiny, 1975).
The drawing canvas is embodied in the form of a blank sheet of paper measuring 8.5 by
11 inches. The diagramming utensils are a random collection of colored crayons chosen by the
students from a large selection stored in a box. The materials make it possible for students to
construct external representations of internal thought processes in a location referred to by
cognitive science researchers as a conceptual space (Gardenfors, 2000, 2014).
Domain as used in this case study refers to a body of knowledge that is normally
identified by a subject label such as physics, economics, biology, and mathematics (Novick,
2006). Domain-specific is meant to communicate that a noun or adjective is specific to one
domain when compared to other domains. Domain-general is meant to communicate or describe
a noun or adjective that can be applied across different domains (Novick, 2006).
Knowledge describes the collection of facts, processes, information, data, skills, and
abilities associated with a subject area (Sowa, 1984). In turn, it follows that prior knowledge is

105
the collective knowledge a student brings with them to the classroom that they have acquired
through education, training, and life experience (Dochy et al., 1999). The study adopts the
further breakdown of prior knowledge into declarative, procedural, or conceptual types of
knowledge (Jonassen, 2006; Jonassen et al., 1993; Jonassen & Strobel, 2006).
Declarative knowledge refers to the collection of facts, statements, and principles that
describe a subject or specific domain (Jonassen, 2004).
Procedural knowledge refers to the collection of processes, methods, and activities that
describe how to act upon or with facts, statements, principles, or physical objects in a subject or
specific domain (Jonassen, 2004).
Conceptual knowledge refers to the collection of symbolic representations, space-time
events, and physical things humans experience in life. Similar features shared by concepts and
the similar relationships shared between concepts are used to describe classes of symbolic
representations, space-time events, and physical things (Jonassen, 2004; Murphy, 2004).
Topology is a mathematical concept that defines a set of points, along with a set of shapes
described by the points, and includes a definition of the relations between the shapes in a two-
dimensional plane (M. Egenhofer, 1991; Mendelson, 1962).
Binary relations are a categorization of the eight possible topological relationships that
can exist between two shapes in a two-dimensional plane. (M. Egenhofer, 1991; M. Egenhofer,
1994).