Diagram the blood flow Name some of the gill functions?
31
1 Gills • Diagram the blood flow • Name some of the gill functions?
Transcript of Diagram the blood flow Name some of the gill functions?

1
Gills
• Diagram the blood flow
• Name some of the gill functions?

2
Fish Cardiovascular system
• Branchial Heart – 4 chambers (different counting)
– Sinus venosus, atrium, ventricle, and bulbus arteriousus/conus arteriosus
• Sinus venosus has pacemaker tissues to initiate heart beat
• Atrial contraction fills ventricle
• Ventricle largest and main pressure

3
Fish Cardiovascular system
• Branchial Heart – 4 chambers
– Sinus venosus, atrium, ventricle,
and bulbus arteriosus or conus
arteriosus
• Sinus venosus has pacemaker
tissues to initiate heart beat
• Atrial contraction fills ventricle
• Ventricle largest and main
pressure
All blood goes to gills!

4
Adaptive Radiation
• Differences in blood pressures in fish
lineages
• Highest in active teleosts
• Cardiac output (Q) is distributed to
respiratory circulation via afferent branchial
arteries – does not return to heart
Regulation of Q- Cardiac Output
• Changes in heart rate (Fh) and stroke volume (SVh) that are controlled by intrinsic neural and humoral control mechanisms
• Cardiac cycle is a coordinated event with contraction /relaxation cycles of atrium or ventricle separated into systolic (raised blood pressure from contraction) and diastolic periods (relaxed ejection phase)

5
Activity and Temperature
• Fish that have high levels activity have
higher resting than sluggish forms
• Temperature has profound effect on Q and
increases with temperature.
hagfish
houndshark
Cat shark
lingcod
Sea raven
Skipjack tuna
Black fin
crocodile
Cod ice
fish

6
Blood pressures
• Systemic dorsal aortic pressure is 1/3 lower
than that of ventral aortic circulation
• Primary = ventral and dorsal aortas
• secondary systems drain the veins and have
accessory hearts arise from gills and
arterial vessels =

7
Blood pressures of rainbow trout
mm HgResting exercise
• Ventral aorta 40/30 55/43
• Dorsal aorta 30/25 33/29
• Large veins 0-10 0-18
Regulation of Cardiac Activity
• Pacemaker cells – temperature response
• Autonomic neural control –
neurotransmitters and Vagus activity
• Humoral control – circulating
catechlomines e.g. Adrenaline and
noradrenaline several types of receptors

8
Hemoglobin, the Magic Molecule
• Tetrameric molecule in most fish
• Two alpha two beta chains
Four disks = where the oxygen molecules bind
four sausage shapes represent polypeptide chainsHb + 4O2 = Hb.4O2
• O2 binds to the four heme groups
• H+ and CO2 bind to specific amino acid
residues in globin chain

9
Red Blood Cells of Fish
• Nucleated retain most organelles
• Long lived – rbt ~ 6 mo
• Mammalian red blood cells biconcave and
extrude their organelles shortly after release
into the circulation –short lived ~ 6 days
Binding and pH
• Hb-O2 binding affinity is decreased by reduction
in pH (Bohr effect)
• Increase in Hb-O2 saturation is associated with
release of protons, termed Bohr protons, from
hemoglobin (the Haldane effect)
• Acidification of rbc interior associated with CO2
to blood in tissues will augment O2 unloading in
tissues via Bohr effect

10
CO2diffuses into the blood plasma and RBC (erythrocytes) in the
presence of the catalyst carbonic anhydrase (CA) most CO2 reacts with
water in the erythrocytes and the dynamic equilibrium is established
H2O + CO2 H2CO3 H2CO3 H+ + HCO3-
What the Bohr Effect Does
Plasma and
Tissues
blood circulation
pH lower
pCO2 higher
lactic acid
Gills outside
pH higher
pCO2 lower
no lactic acid

11
Binding of Hb-O2
• Nucleoside triphosphates for energy
– ATP (adenoside triphosphate) & GTP
(guanosine tripohosphate)
• H ions
– Bohr effect, reduction in pH decreases affinity
– Increase in pH increases affinity

12
Blood samples – which is from
Arctic fish?
13
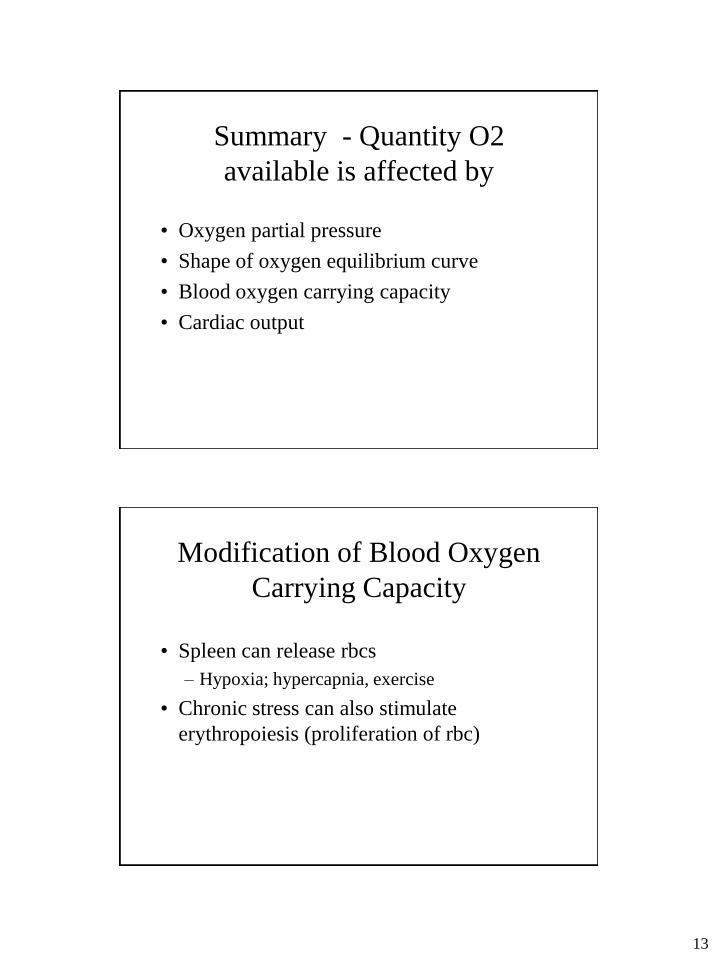
Summary - Quantity O2
available is affected by
• Oxygen partial pressure
• Shape of oxygen equilibrium curve
• Blood oxygen carrying capacity
• Cardiac output
Modification of Blood Oxygen
Carrying Capacity
• Spleen can release rbcs
– Hypoxia; hypercapnia, exercise
• Chronic stress can also stimulate
erythropoiesis (proliferation of rbc)

14
Catecholamines affect RBC
releases
• Chromaffin tissue areas that release
– Post cardinal vein (head kidney)
– Other regions of kidney
Acid Base Regulation –
Chemical/physical
• Normal blood pH 7.7 – 8
• Normal intracellular 7.2 – 7.5
• Maintenance via two tiered process of
internal buffering, and transfer of acid base
relevant molecules between animal and
water

15
pH of fish blood is temperature
dependent
• CO2 + H2O H2CO3 HCO3- + H+
• 8.0 at 10°C
• 7.7 at 30°C
pH and temperature
• Neutral pH is only neutral at 24°C
• Below that the ph is higher
• Above that the pH is lower --- why?

16
Conditions that disturb Acid Base
Balance
1. Metabolic acidosis – lactic acid
2. Respiratory acidosis – high CO2
3. Environmental hypercapnia – high CO2
4. Environmental acidosis – mine drainages,
acid rain
What is pH
• Negative log of H ion concentration!
17
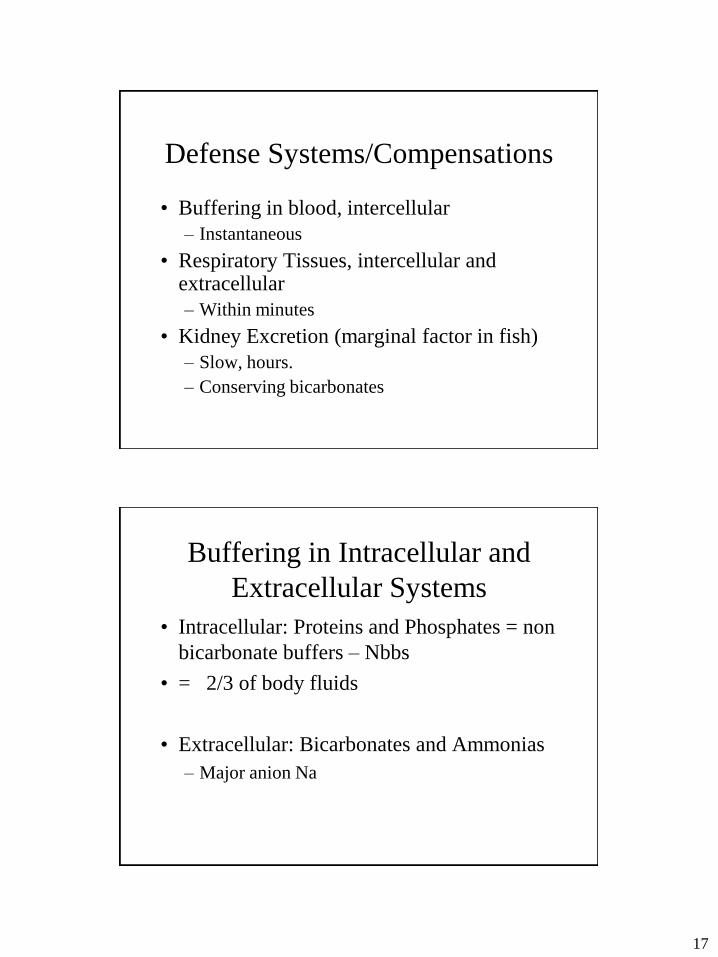
Defense Systems/Compensations
• Buffering in blood, intercellular
– Instantaneous
• Respiratory Tissues, intercellular and extracellular
– Within minutes
• Kidney Excretion (marginal factor in fish)
– Slow, hours.
– Conserving bicarbonates
Buffering in Intracellular and
Extracellular Systems
• Intracellular: Proteins and Phosphates = non
bicarbonate buffers – Nbbs
• = 2/3 of body fluids
• Extracellular: Bicarbonates and Ammonias
– Major anion Na

18
Metabolic Acidosis
• Lactic acid produced in tissues as consequence
of extreme exercise or hypoxia. H+ ions and
lactate ion diffuse into blood
• Effect on buffering system is shift to left
•CO2 + H2O H2CO3 HCO3- + H+
Compensation – metabolic
acidosis
• H+ excretion and / or HCO3- uptake
• The bicarbonate buffer shifts this to release
excess CO2

19
Metabolic Acidosis
Compensation
• H+ must be excreted to environment by
direct or indirect exchange for
environmental Na+ and/ or HCO3 – must be
retained (baseline rate of exchange for
environmental Cl- must be decreased)

20
Respiratory Acidosis
• Respiratory gas CO2 is produced in large
enough quantities so that it cannot be
immediately eliminated by diffusion across gills
•CO2 + H2O H2CO3 HCO3- + H
Respiratory Acidosis

21
Compensation for Respiratory
Acidosis
• CO2 diffusion from blood to water will
occur with bicarbonate buffering.
Pavement cell, chloride cells

22
Pavement cell, chloride cells
Reduction Cl increase H

23
Environmental Hypercapnia
• Environmental PCO2 is elevated.
• Often by ice cover, or metabolic of plants,
animals or microorganisms or CO2
anesthesia
CO2 + H2O H2CO3 HCO3- + H
Mitochondrial rich cells (MRC- chloride cells)
large area
CO2 + H2O H2CO3 HCO3- + H
Normal conditions

24
6 hr of hypercapnia. MRC are reduced, and look
different with surface area reduced.
Epithelial pavement cells (PVC) before and after 6 h
hypercapnia. Note density in microvilli is increased
Before After

25
Compensation
• Because environment is elevated in CO2,
equilibrium is shifted, bicarbonate reserves
are limited (except in air breathers)
• The compensations can take a long time,
depending on the environment
Blood to water gradient is affected and excess CO2 cannot be lost by
diffusion. To restore H+ back down, HCO3 must be retained, and
H+ excretion increases

26
Environmental Acidosis
• Acidification of water due to mine drainage
• Acid rain, etc.
• Response similar to metabolic acidosis
Longer term compensation for
acid base disturbance
• Buffering is short term
• Active exchanges occur at respiratory
epithelium
• Export of H ions through Na+/H+ exchange
• Chloride cells Cl-/HCO3- some through
morphology changes

27
Relative contribution of bicarbonate and non bicarbonate for
fixed or respiratory acid base changes for blood, and external
and internal cell fractions
Fixed Acid or Base Respiratory Acid Change
HCO3 Nbbs HCO3 Nbbs
Blood
& Extra CF some some none all
Intra CF little most none all
MRC ~ CC

28
freshwater elasmobranch

29
Brook lamprey - fw
Pouched lamprey
Killifish in seawater Killifish in freshwater

30
Gill filaments, A: scanning electron micrograph (left) and a
corresponding confocal laser scanning micrograph (right) of a
filament from a tilapia. MRCs are stained red; note their
increased abundance between the lamellae, which are stained
green, and on the Afferent A, compared with the Efferent A.
Autonomic nervous system mediators
Mediator Acetylcholine Epinepherine
(Adrenaline and
norpinepherine)
Sources Vagus nerve Spinal nerves
Chromaffin tissue
Types of
receptors
one Α receptor
Β receptor
(dialator)
parasympathetic sympathetic

31
Target tissues
• Heart: Decreased or increased heart rate and
stroke
• Gills: Increased or decreased resistance
• Vasculature: Increased resistance