Diagnostic Test - Pendidikan untuk Kesehatan...
19
H. Risanto Siswosudarmo Department of Obstetrics and Gynecology Faculty of Medicine, UGM Jogjakarta Diagnostic Test ِيمِح الرِنَٰمْح الرِهل الِمْسِ بRS Sardjito New (test Gold standard Column Total Disease No Disease Posi*ve a b a+b Nega*ve c d c+d Row Total a+c b+d N
Transcript of Diagnostic Test - Pendidikan untuk Kesehatan...

H. Risanto Siswosudarmo Department of Obstetrics
and Gynecology Faculty of Medicine, UGM
Jogjakarta
Diagnostic Test
بسم الله الرحمن الرحيم RS Sardjito
New (test Gold standard
Column Total Disease No Disease
Posi*ve a b a+b
Nega*ve c d c+d
Row Total a+c b+d N

Diagnostic Test 1. Objective
1. Recognizing DT and screening. 2. Identifying diseases appropriate for screening. 3. Defining, calculating, and interpreting the sensitivity,
specificity, positive predictive value and negative predictive value, false positive and false negative, SnNOUT and SpIN, LR+ and LR- of a screening test.
4. Explaining the influence of prevalence of disease to predictive value.
5. Understanding side effects of a screening test. 6. Understanding an ROC curve.
2. Method 1. Lecture 2. Discussion 3. Computer computation

When screening is beneficial
✦ The disease is serious (e.g., cervical cancer). ✦ When treatment before symptoms occur is more effective
than treatment that is delayed until symptoms appear. ✦ When the prevalence of disease in the DPCP is relatively
high. The time interval between possible detection by screening and later detection after symptoms is the "detectable pre-clinical phase" or DPCP.

✦ Inexpensive ✦ Easy to administer (easy to do, not complicated) ✦ Minimal discomfort (convenient) ✦ Reliable (consistent, reproducible) ✦ Valid (distinguishes diseased & non-diseased
people)
Characteristics of a Good Screening Test
Characteristic of gold standard test • The best test available • Widely accepted (by all) • Often expensive, or invasive

Basic Table: Two by two table
Tes baru (tes diagnos5k)
Gold standard
Total Sakit Tidak sakit
Posi*f a b a+b
Nega*f c d c+d
Total a+c b+d N
Sensitivity: a/(a+c)
Specificity: d/(b+d)
PPV: a/(a+b)
NPV: d/(c+d)
TP : a ; FP: b
TN : d ; FN: c
Accuracy: (a+d)/N

Test validity
✦ Test validity is the ability of a screening test to accurately identify diseased and non-disease individuals.
✦ An ideal screening test is exquisitely sensitive (high probability of detecting disease) and extremely specific (high probability that those without the disease will screen negative).
✦ The validity of a screening test is based on its accuracy in identifying diseased and non-diseased persons.
✦ This can only be determined if the accuracy of the screening test is compared to some "gold standard" test.
✦ Gold standard test is a test that establishes the true disease status. The gold standard should be very accurate, but may be expensive and invasive

1. Sensitivity: ✦ The accurate the screening test in identifying disease in
people who truly have the disease. ✦ The ability of the test to identify correctly those who have
the disease. ✦ Proportion of people with disease who have a pos. test
2. Specificity ✦ The accuracy of the screening test in correctly classifying
truly non-diseased people. ✦ The ability of the test to identify correctly those who DO
NOT HAVE the disease ✦ Proportion of people without disease who have a neg. test

1. Positive predictive value (PPV): ✦ The proportion of people with positive test who actually
HAVE the disease. ✦ If a person test is positive, what is the probability that
she/he really has the disesae? ✦ PPV= a/(a+b)
2. Negative predictive value (NPV) ✦ The proportion of people with negative test who actually
DO NOT HAVE the disease ✦ If a person test is negative, what is the probability that
she/he really DOESN’T HAVE the disease? ✦ NPV = d/(c+d)

1. SnNOUT ✦ When a test with a high SENsitivity is NEGative, it
effectively rules OUT the disease
2. SpPIN ✦ When a test with high SPEcificity is POSitive, it
effectively rules IN the disease.

Likelihood ratio 1. Likelihood ratio positive (LR+) ✦ The probability of a positive test in a person with the disease
divided by the probability of a positive test in a person without the disease.
✦ LR(+) = Sensitivity / (1 – Specificity) 2. Likelihood ratio negative (LR-) ✦ The probability of a negative test in a person with the disease,
divided by the probability of a negative test in a person without the disease.
✦ LR (-) = (1– Sensitivity) / Specificity

Impact of likelihood ratio
LR(+) LR(−) Impact on likelihood 10 0.1 Excellent 6 0.2 Very good 2 0.5 Fair 1 1 Useless

Two important down sides to screening:
1. False positive (Exp: Breast ca on a young women). ✦ The probability is extremely low ✦ The sensitivity of mammography is low because
younger women have denser breast tissue. ✦ Will be subjected to extreme anxiety and worry. ✦ May also undergo invasive diagnostic tests such as
needle biopsy and surgical biopsy unnecessarily. ✦ Time consuming and costy

Two important down sides to screening:
2. False negative. ✦ They will be reassured that they don't have disease,
when they really do. ✦ Delayed diagnosis ✦ Delayed treatment ✦ Increased morbidity and mortality ✦ Increased cost

Effect of prevalence on PPV
Screening
test Gold Standard
Total Column HIV (+) HIV (-‐)
Tes (+) 10 510 520
Tes (-‐) 0 99.480 99.480
Total Row 10 99.990 100.000
PPV = 10/520 = 1,9%
Skrining pada donor darah perempuan yang prevalensi HIV (+) adalah 0,01% (hanya 10 HIV positif dari 100.000 donor perempuan). Tes skrining memiliki sensitivitas 100% dan spesifisitas 95%. Berapa PPV nya? Perhatikan tabel berikut:

Effect of prevalence on PPV, scenario II
Screening
test Gold Standard Total Column
HIV (+) HIV (-‐)
Tes (+) 4.000 480 4.480
Tes (-‐) 0 95.520 95.520
Total Row 4.000 96.000 100.000
PPV = 4000/4480 = 89%
Skrining dilakukan pada laki-laki yang datang di klinik penyakit menular seksual yang prevalensi HIV (+) adalah 4 %. Tes skrining memiliki sensitivitas dan spesifisitas yang sama yakni masing-masing 100% dan 95%. Berapa PPV nya?

Effect of prevalence on PPV, scenario II
Screening
test Gold Standard Total Column
HIV (+) HIV (-‐)
Tes (+) 20.000 400 20.400
Tes (-‐) 0 79.600 95.520
Total Row 20.000 80.000 100.000
PPV = 20.000/20.400 = 98.%
Skrining dilakukan pada pengguna obat suntik intravena yang prevalensi HIV (+) nya adalah 20%. Berapa PPV nya?

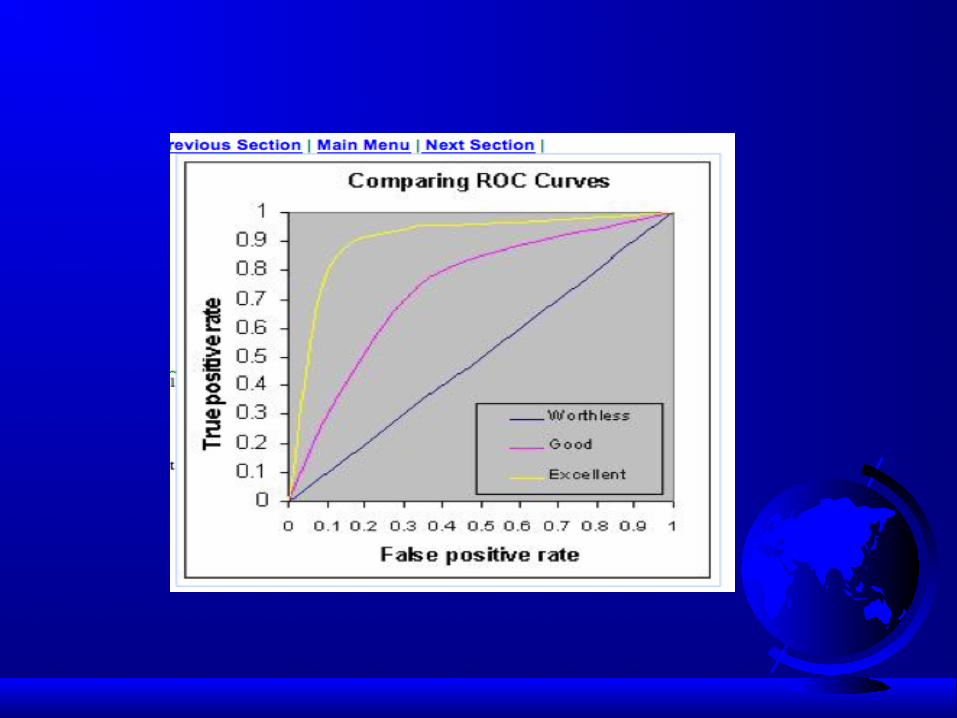
Receiver Operating Characteristic (ROC) Curve
✦ ROC curve is a plot of sensitivity (Y axis) versus 1-specificity ( X axis)
✦ The position of the ROC on the graph reflects the accuracy of the diagnostic test. It covers all possible thresholds (cut-off points).
✦ The ROC of random guessing lies on the diagonal line. It means that the test is worthless
✦ The ROC of a perfect diagnostic technique is a point at the upper left corner of the graph, where the TP proportion is 1.0 and the FP proportion is 0.

✦ The Area Under the Curve (AUC), also referred to as index of accuracy (A), and it is an accepted traditional performance metric for an ROC curve.
✦ The higher the area under the curve the better prediction power the model has.
✦ AUC = 0.8 indicates good predictive power of the model ✦ .90-1 = excellent ✦ .80-.90 = good ✦ .70-.80 = fair ✦ .60-.70 = poor ✦ .50-.60 = fail


![فيلأت - IslamHouse.com · (DU’AA’II):ىلاعت هللا لاق ﯣ ﯢﯡ ﯠ ﯟ ﯞ ﯝ ﯜ ﯛ ﯚ ﯙ ﯘ(]62 :لمنلا[ )ﯩ ﯨ ﯧ ﯦﯥ ﯤ Rabbiin s.w. akkana](https://static.fdocuments.in/doc/165x107/6083d280c46b6812a57fe837/-duaaaaii-i-ii-i-i-i-i.jpg)