Diagnostic management strategies for adults and children ...
220
Health Technology Assessment 2011; Vol. 15: No. 27 ISSN 1366-5278 Health Technology Assessment NIHR HTA programme www.hta.ac.uk August 2011 10.3310/hta15270 Diagnostic management strategies for adults and children with minor head injury: a systematic review and an economic evaluation A Pandor, S Goodacre, S Harnan, M Holmes, A Pickering, P Fitzgerald, A Rees and M Stevenson
Transcript of Diagnostic management strategies for adults and children ...
Health Technology Assessment 2011; Vol. 15: No. 27ISSN 1366-5278
Health Technology AssessmentNIHR HTA programmewww.hta.ac.uk
August 201110.3310/hta15270
Diagnostic management strategies for adults and children with minor head injury: a systematic review and an economic evaluation
A Pandor, S Goodacre, S Harnan, M Holmes, A Pickering, P Fitzgerald, A Rees and M Stevenson
Health Technology Assessment 2011; Vol. 15: No.271
ISSN 1366-5278
Abstract
Glossary
List of abbreviations
Executive summaryBackgroundObjectivesMethodsResultsConclusionsFunding
Chapter 1 BackgroundDescription of health problemCurrent service provision
Chapter 2 Research questionsRationale for the studyOverall aims and objectives of assessment
Chapter 3 Assessment of diagnostic accuracyMethods for reviewing diagnostic accuracyResults of the review of diagnostic accuracy
Chapter 4 Review of studies evaluating diagnostic management strategiesMethods for reviewing management practicesResults of the review of management practices
Chapter 5 Assessment of cost-effectiveness evidenceSystematic review of existing cost-effectiveness evidenceIndependent economic assessment
Chapter 6 Survey of current NHS practiceMethods of the surveyResults of the survey
Chapter 7 DiscussionStatement of principal findingsStrengths and limitations of the assessmentUncertaintiesAssessment of factors relevant to the NHS and other parties
Chapter 8 Conclusions
Implications for service provisionSuggested research priorities
AcknowledgementsContributions of authorsPublications
References
Health Technology Assessment programme
Appendix 1 Diagnostic accuracy and management strategies for minor head injury review: literature search strategies – a MEDLINE example 203
Appendix 2 The modified QUADAS tool for the methodological assessment of diagnostic studies 205
Appendix 3 Diagnostic accuracy review – PRISMA (adapted) flow chart 209
Appendix 4 Diagnostic accuracy review – table of excluded studies with rationale 211
Appendix 5 Individual clinical characteristics in adults – data for meta-analysis 215Intracranial injury in adultsNeed for neurosurgery in adults
Appendix 6 Individual clinical characteristics in children and infants – data for meta-analysis 239Intracranial injury in childrenNeed for neurosurgery in childrenIntracranial injury in infants
Appendix 7 Management practices review – PRISMA (adapted) flow chart 261
Appendix 8 Management practices review – table of excluded studies with rationale 263
Appendix 9 Cost-effectiveness review: literature search strategies – a MEDLINE example 265
Appendix 10 Cost-effectiveness review – PRISMA (adapted) flow chart 267
Appendix 11 Cost-effectiveness review – table of excluded studies with rationale 269
Appendix 12 Questionnaire survey (adults) sent to lead clinician 271
Appendix 13 Protocol 273Project title
Copyright notice
© Queen's Printer and Controller of HMSO 2011. This work was produced by Pandor et al. under the terms of a commissioning contract issued by the Secretary of State for Health HTA reports may be freely reproduced for the purposes of private research and study and may be included in professional journals provided that suitable acknowledgement is made and the reproduction is not associated with any form of advertising Violations should be reported to [email protected] Applications for commercial reproduction should be addressed to NETSCC, Health Technology Assessment, Alpha House, University of Southampton Science Park, Southampton SO16 7NS, UK

How to obtain copies of this and other HTA programme reports
An electronic version of this title, in Adobe Acrobat format, is available for downloading free of charge for personal use from the HTA website (www.hta.ac.uk). A fully searchable DVD is also available (see below).
Printed copies of HTA journal series issues cost £20 each (post and packing free in the UK) to both public and private sector purchasers from our despatch agents.
Non-UK purchasers will have to pay a small fee for post and packing. For European countries the cost is £2 per issue and for the rest of the world £3 per issue.
How to order:
– fax (with credit card details) – post (with credit card details or cheque) – phone during office hours (credit card only).
Additionally the HTA website allows you to either print out your order or download a blank order form.
Contact details are as follows:
Synergie UK (HTA Department)Digital House, The Loddon Centre Wade Road Basingstoke Hants RG24 8QW
Email: [email protected]
Tel: 0845 812 4000 – ask for ‘HTA Payment Services’ (out-of-hours answer-phone service)
Fax: 0845 812 4001 – put ‘HTA Order’ on the fax header
Payment methods
Paying by cheque If you pay by cheque, the cheque must be in pounds sterling, made payable to University of Southampton and drawn on a bank with a UK address.
Paying by credit card You can order using your credit card by phone, fax or post.
Subscriptions
NHS libraries can subscribe free of charge. Public libraries can subscribe at a reduced cost of £100 for each volume (normally comprising 40–50 titles). The commercial subscription rate is £400 per volume (addresses within the UK) and £600 per volume (addresses outside the UK). Please see our website for details. Subscriptions can be purchased only for the current or forthcoming volume.
How do I get a copy of HTA on DVD?
Please use the form on the HTA website (www.hta.ac.uk/htacd/index.shtml). HTA on DVD is currently free of charge worldwide.
The website also provides information about the HTA programme and lists the membership of the various committees.
HTA

Diagnostic management strategies for adults and children with minor head injury: a systematic review and an economic evaluation
A Pandor, S Goodacre,* S Harnan, M Holmes, A Pickering, P Fitzgerald, A Rees and M Stevenson
School of Health and Related Research (ScHARR), University of Sheffield, Sheffield, UK
*Corresponding author
Declared competing interests of authors: none
Published August 2011DOI: 10.3310/hta15270
This report should be referenced as follows:
Pandor A, Goodacre S, Harnan S, Holmes M, Pickering A, Fitzgerald P, et al. Diagnostic management strategies for adults and children with minor head injury: a systematic review and an economic evaluation. Health Technol Assess 2011;15(27).
Health Technology Assessment is indexed and abstracted in Index Medicus/MEDLINE, Excerpta Medica/EMBASE, Science Citation Index Expanded (SciSearch) and Current Contents/Clinical Medicine.

ii NIHR Health Technology Assessment programme
The Health Technology Assessment (HTA) programme, part of the National Institute for Health Research (NIHR), was set up in 1993. It produces high-quality research information on the effectiveness, costs and broader impact of health technologies for those who use, manage and provide care in the NHS. ‘Health technologies’ are broadly defined as all interventions used to promote health, prevent and treat disease, and improve rehabilitation and long-term care.The research findings from the HTA programme directly influence decision-making bodies such as the National Institute for Health and Clinical Excellence (NICE) and the National Screening Committee (NSC). HTA findings also help to improve the quality of clinical practice in the NHS indirectly in that they form a key component of the ‘National Knowledge Service’.The HTA programme is needs led in that it fills gaps in the evidence needed by the NHS. There are three routes to the start of projects.First is the commissioned route. Suggestions for research are actively sought from people working in the NHS, from the public and consumer groups and from professional bodies such as royal colleges and NHS trusts. These suggestions are carefully prioritised by panels of independent experts (including NHS service users). The HTA programme then commissions the research by competitive tender.Second, the HTA programme provides grants for clinical trials for researchers who identify research questions. These are assessed for importance to patients and the NHS, and scientific rigour.Third, through its Technology Assessment Report (TAR) call-off contract, the HTA programme commissions bespoke reports, principally for NICE, but also for other policy-makers. TARs bring together evidence on the value of specific technologies.Some HTA research projects, including TARs, may take only months, others need several years. They can cost from as little as £40,000 to over £1 million, and may involve synthesising existing evidence, undertaking a trial, or other research collecting new data to answer a research problem.The final reports from HTA projects are peer reviewed by a number of independent expert referees before publication in the widely read journal series Health Technology Assessment.
Criteria for inclusion in the HTA journal seriesReports are published in the HTA journal series if (1) they have resulted from work for the HTA programme, and (2) they are of a sufficiently high scientific quality as assessed by the referees and editors.Reviews in Health Technology Assessment are termed ‘systematic’ when the account of the search, appraisal and synthesis methods (to minimise biases and random errors) would, in theory, permit the replication of the review by others.
The research reported in this issue of the journal was commissioned by the HTA programme as project number 07/37/08. The contractual start date was in February 2009. The draft report began editorial review in June 2010 and was accepted for publication in October 2010. As the funder, by devising a commissioning brief, the HTA programme specified the research question and study design. The authors have been wholly responsible for all data collection, analysis and interpretation, and for writing up their work. The HTA editors and publisher have tried to ensure the accuracy of the authors’ report and would like to thank the referees for their constructive comments on the draft document. However, they do not accept liability for damages or losses arising from material published in this report.The views expressed in this publication are those of the authors and not necessarily those of the HTA programme or the Department of Health.Editor-in-Chief: Professor Tom Walley CBESeries Editors: Dr Martin Ashton-Key, Professor Aileen Clarke, Dr Tom Marshall, Professor John Powell,
Dr Rob Riemsma and Professor Ken SteinAssociate Editor: Dr Peter DavidsonEditorial Contact: [email protected] 1366-5278 (Print)
ISSN 2046-4924 (Online)
ISSN 2046-4932 (DVD)
© Queen’s Printer and Controller of HMSO 2011. This work was produced by Pandor et al. under the terms of a commissioning contract issued by the Secretary of State for Health.This journal is a member of and subscribes to the principles of the Committee on Publication Ethics (COPE) (http://www.publicationethics.org/).This journal may be freely reproduced for the purposes of private research and study and may be included in professional journals provided that suitable acknowledgement is made and the reproduction is not associated with any form of advertising.Applications for commercial reproduction should be addressed to: NETSCC, Health Technology Assessment, Alpha House, University of Southampton Science Park, Southampton SO16 7NS, UK.Published by Prepress Projects Ltd, Perth, Scotland (www.prepress-projects.co.uk), on behalf of NETSCC, HTA.Printed on acid-free paper in the UK by the Charlesworth Group. G
© Queen’s Printer and Controller of HMSO 2011. This work was produced by Pandor et al. under the terms of a commissioning contract issued by the Secretary of State for Health.
iii Health Technology Assessment 2011; Vol. 15: No. 27DOI: 10.3310/hta15270
Abstract
Diagnostic management strategies for adults and children with minor head injury: a systematic review and an economic evaluation
A Pandor, S Goodacre,* S Harnan, M Holmes, A Pickering, P Fitzgerald, A Rees and M Stevenson
School of Health and Related Research (ScHARR), University of Sheffield, Sheffield, UK
*Corresponding author
Background: Patients with minor head injury [Glasgow Coma Scale (GCS) score 13–15] have a small but important risk of intracranial injury (ICI) that requires early identification and neurosurgical treatment. Diagnostic assessment can use either a clinical decision rule or unstructured assessment of individual clinical features to identify those who are at risk of ICI and in need of computerised tomography (CT) scanning and/or hospital admission. Selective use of CT investigations helps minimise unnecessary radiation exposure and resource use, but can lead to missed opportunities to provide early treatment for ICI.Objectives: To determine the diagnostic accuracy of decision rules, individual clinical characteristics, skull radiography and biomarkers, and the clinical effectiveness and cost-effectiveness of diagnostic management strategies for minor head injury (MHI).Data sources: Several electronic databases [including MEDLINE, MEDLINE In-Process & Other Non-Indexed Citations, Cumulative Index to Nursing and Allied Health Literature (CINAHL), EMBASE and The Cochrane Library] were searched from inception to April 2009 (updated searches to March 2010 were conducted on the MEDLINE databases only). Searches were supplemented by hand-searching relevant articles (including citation searching) and contacting experts in the field. For each of the systematic reviews the following studies were included (1) cohort studies of patients with MHI in which a clinical decision rule or individual clinical characteristics (including biomarkers and skull radiography) were compared with a reference standard test for ICI or need for neurosurgical intervention and (2) controlled trials comparing alternative management strategies for MHI.Review methods: Study quality was assessed using the Quality Assessment of Diagnostic Accuracy Studies (QUADAS) tool (for the assessment of diagnostic accuracy) or criteria recommended by the Effective Practice and Organisation of Care Review Group (for the assessment of management practices). Where sufficient data existed, a meta-analysis was undertaken to generate pooled estimates of diagnostic parameters. A decision-analysis model was developed using Simul8 2008 Professional software (Simul8 Corporation, Boston, MA, USA) to estimate the costs and quality-adjusted life-years (QALYs) accrued by management strategies for MHI. The model took a lifetime horizon and NHS perspective. Estimates of the benefits of early treatment, harm of radiation exposure and long-term costs were obtained through literature reviews. Initial analysis was deterministic, but probabilistic sensitivity analysis was also performed. Secondary analyses were undertaken to explore the trade-off between sensitivity and specificity in diagnostic strategies and to determine the cost-effectiveness of scenarios involving hospital admission.Results: The literature searches identified 8003 citations. Of these, 93 full-text papers were

iv Abstract
included for the assessment of diagnostic accuracy and one for the assessment of management practices. The quality of studies and reporting was generally poor. The Canadian CT Head Rule (CCHR) was the most widely validated adult rule, with sensitivity of 99–100% and 80–100% for neurosurgical and any ICI, respectively (high- or medium-risk criteria), and specificity of 39–51%. Rules for children had high sensitivity and acceptable specificity in derivation cohorts, but limited validation. Depressed, basal or radiological skull fracture and post-traumatic seizure (PTS) [positive likelihood ratio (PLR) > 10]; focal neurological deficit, persistent vomiting, decrease in GCS and previous neurosurgery (PLR 5–10); and fall from a height, coagulopathy, chronic alcohol use, age > 60 years, pedestrian motor vehicle accident (MVA), any seizure, undefined vomiting, amnesia, GCS < 14 and GCS < 15 (PLR 2–5) increased the likelihood of ICI in adults. Depressed or basal skull fracture and focal neurological deficit (PLR > 10), coagulopathy, PTS and previous neurosurgery (PLR 5–10), visual symptoms, bicycle and pedestrian MVA, any seizure, loss of consciousness, vomiting, severe or persistent headache, amnesia, GCS < 14, GCS < 15, intoxication and radiological skull fracture (PLR 2–5) increased the likelihood of ICI in children. S100 calcium-binding protein B had pooled sensitivity of 96.8% [95% highest-density region (HDR) 93.8% to 98.6%] and specificity of 42.5% (95% HDR 31.0% to 54.2%). The only controlled trial showed that early CT and discharge is cheaper and at least as effective as hospital admission. Economic analysis showed that selective CT use dominated ‘CT all’ and ‘discharge all’ strategies. The optimal strategies were the CCHR (adults) and the CHALICE (Children’s Head injury Algorithm for the prediction of Important Clinical Events) or NEXUS II (National Emergency X-Radiography Utilization Study II) rule (children). The sensitivity and specificity of the CCHR (99% and 47%, respectively) represented an appropriate trade-off of these parameters. Hospital admission dominated discharge home for patients with non-neurosurgical injury, but cost £39 M per QALY for clinically normal patients with a normal CT.Conclusions: The CCHR is widely validated and cost-effective for adults. Decision rules for children appear cost-effective, but need further validation. Hospital admission is cost-effective for patients with abnormal, but not normal, CT. The main research priorities are to (1) validate decision rules for children; (2) determine the prognosis and treatment benefit for non-neurosurgical injuries; (3) evaluate the use of S100B alongside a validated decision rule; (4) evaluate the diagnosis and outcomes of anticoagulated patients with MHI; and (5) evaluate the implementation of guidelines, clinical decision rules and diagnostic strategies. Formal expected value of sample information analysis would be recommended to appraise the cost-effectiveness of future studies.Funding: The National Institute for Health Research Health Technology Assessment programme.

© Queen’s Printer and Controller of HMSO 2011. This work was produced by Pandor et al. under the terms of a commissioning contract issued by the Secretary of State for Health.
v Health Technology Assessment 2011; Vol. 15: No. 27DOI: 10.3310/hta15270
Contents
Glossary vii
List of abbreviations ix
Executive summary xi
1. Background 1Description of health problem 1Current service provision 2
2. Research questions 7Rationale for the study 7Overall aims and objectives of assessment 7
3. Assessment of diagnostic accuracy 9Methods for reviewing diagnostic accuracy 9Results of the review of diagnostic accuracy 13
4. Review of studies evaluating diagnostic management strategies 117Methods for reviewing management practices 117Results of the review of management practices 119
5. Assessment of cost-effectiveness evidence 129Systematic review of existing cost-effectiveness evidence 129Independent economic assessment 132
6. Survey of current NHS practice 161Methods of the survey 161Results of the survey 162
7. Discussion 165Statement of principal findings 165Strengths and limitations of the assessment 170Uncertainties 173Assessment of factors relevant to the NHS and other parties 174
8. Conclusions 175Implications for service provision 175Suggested research priorities 176
Acknowledgements 177
References 179
Health Technology Assessment programme 197

vi Contents
Appendix 1 Diagnostic accuracy and management strategies for minor head injury review: literature search strategies – a MEDLINE example 203
Appendix 2 The modified QUADAS tool for the methodological assessment of diagnostic studies 205
Appendix 3 Diagnostic accuracy review – PRISMA (adapted) flow chart 209
Appendix 4 Diagnostic accuracy review – table of excluded studies with rationale 211
Appendix 5 Individual clinical characteristics in adults – data for meta-analysis 215
Appendix 6 Individual clinical characteristics in children and infants – data for meta-analysis 239
Appendix 7 Management practices review – PRISMA (adapted) flow chart 261
Appendix 8 Management practices review – table of excluded studies with rationale 263
Appendix 9 Cost-effectiveness review: literature search strategies – a MEDLINE example 265
Appendix 10 Cost-effectiveness review – PRISMA (adapted) flow chart 267
Appendix 11 Cost-effectiveness review – table of excluded studies with rationale 269
Appendix 12 Questionnaire survey (adults) sent to lead clinician 271
Appendix 13 Protocol 273

© Queen’s Printer and Controller of HMSO 2011. This work was produced by Pandor et al. under the terms of a commissioning contract issued by the Secretary of State for Health.
vii Health Technology Assessment 2011; Vol. 15: No. 27DOI: 10.3310/hta15270
Glossary
Technical terms and abbreviations are used throughout this report. The meaning is usually clear from the context, but a glossary is provided for the non-specialist reader. In some cases,
usage differs in the literature, but the term has a constant meaning throughout this review.
Basal skull fracture A fracture involving the base of the cranium.
Battle’s sign Bruising that sometimes occurs behind the ear in cases of fracture of the base of the skull (basal skull fracture).
Clinical decision rule A rule that uses standardised information from the patient history, examination and investigations to direct a clinical management decision.
Coagulopathy A condition affecting the blood’s ability to form a clot.
Consciousness An alert cognitive state in which you are aware of yourself and your situation.
Cost-effectiveness acceptability curve A way of illustrating cost-effectiveness results by plotting the probability that the intervention is cost-effective (y-axis) against the maximum that society is willing to pay for an improvement in health (x-axis).
Cost-effectiveness plane A way of illustrating cost-effectiveness results by plotting the mean incremental cost and effectiveness on a four-quadrant graph. Interventions that are more costly and more effective fall in the north-east quadrant.
Diagnostic case–control study Diagnostic accuracy study in which the test results of a series of patients with an established diagnosis are compared with those of a non-diseased control group.
Diagnostic cohort study Diagnostic accuracy study in which a group of individuals with a suspected disease undergo both the index test and the reference standard, and the results of the two tests are compared.
Drowsiness A state of impaired awareness associated with a desire or inclination to sleep.
False-negative A patient with a condition who is wrongly diagnosed as not having it.
False-positive A patient without a condition who is wrongly diagnosed as having it.
Focal neurological deficit A neurological abnormality that is restricted to a particular part of the body or a particular activity.
Glasgow Coma Scale (GCS) A standardised system that is used to assess the degree of brain impairment and to identify the seriousness of injury in relation to outcome. The system involves three determinants – eye opening, verbal responses and motor response – all of which are evaluated independently according to a numerical value that indicates the level of consciousness and degree of dysfunction.
Highest-density region (HDR) The Bayesian equivalent of a confidence interval.
viii Glossary
Incremental cost-effectiveness ratio (ICER) The difference in costs between one intervention and an alternative, divided by the difference in outcomes.
Intracranial haematoma A collection of blood inside the cranium, caused by damage to brain tissue or the rupture of a blood vessel. The resulting swelling can compress the brain.
Likelihood ratio Describes how many times more likely a person with a disease is to receive a particular test result than a person without disease. A likelihood ratio of a positive test result is usually a number > 1; a likelihood ratio of a negative test result usually lies between 0 and 1.
Neurosurgery A surgical specialty for the treatment of diseases and disorders of the brain, spinal cord and nerves.
Quality-adjusted life-year (QALY) A measure of benefit of health care combining the impact of both expected length of life and quality of life.
Receiver-operating characteristic (ROC) A receiver-operating characteristic curve represents the relationship between ‘true-positive fraction’ (sensitivity) and ‘false-positive fraction’ (1–specificity). It displays the trade-offs between sensitivity and specificity as a result of varying the cut-off value for positivity in case of a continuous test result.
Reference standard Established test(s) against which the accuracy of a new test for detecting a particular condition can be evaluated.
Sensitivity (true-positive rate) The proportion of individuals with the target condition in a population who are correctly identified by a diagnostic test.
Specificity (true-negative rate) The proportion of individuals free of the target condition in a population who are correctly identified by a diagnostic test.
Test accuracy The proportion of test results that is correctly identified by the test.
True-negative (TN) A patient without a condition who is correctly diagnosed as not having it.
True-positive (TP) A patient with a condition who is correctly diagnosed as having it.

© Queen’s Printer and Controller of HMSO 2011. This work was produced by Pandor et al. under the terms of a commissioning contract issued by the Secretary of State for Health.
ix Health Technology Assessment 2011; Vol. 15: No. 27DOI: 10.3310/hta15270
List of abbreviations
ACEP American College of Emergency PhysiciansAUC area under curveCATCH Canadian Assessment of Tomography for Childhood InjuryCBA controlled before/afterCCHR Canadian CT Head RuleCCT controlled clinical trialCDSR Cochrane Database of Systematic ReviewsCENTRAL Cochrane Central Registry of Controlled TrialsCHALICE Children’s Head injury Algorithm for the prediction of Important Clinical EventsCHIP CT in Head Injury PatientsCINAHL Cumulative Index to Nursing and Allied Health LiteratureCI confidence intervalCK-BB creatine kinase isozymeCPCI Conference Proceedings Citation IndexCRD Centre for Reviews and DisseminationCT computerised tomography DARE Database of Abstracts of Reviews of EffectsDLYG discounted life-year gainedED emergency departmentEFNS European Federation of Neurological SocietiesEPOC Effective Practice and Organisation of CareEQ-5D European Quality of Life-5 DimensionsEVPI expected value of perfect informationEVPPI expected value of partial perfect informationFN false-negativeFP false-positiveGCS Glasgow Coma ScaleGOS Glasgow Outcome ScoreGOS-E Extended Glasgow Outcome ScoreHDR highest-density regionHES Hospital Episode Statistics HTA health technology assessmentICER incremental cost-effectiveness ratioICI intracranial injuryINAHTA International Network of Agencies for Health Technology AssessmentIQR interquartile rangeLOC loss of consciousnessMHI minor head injuryMRI magnetic resonance imagingMVA motor vehicle accidentNCWFNS Neurotraumatology Committee of the World Federation of Neurosurgical SocietiesNEXUS II National Emergency X-Radiography Utilization Study IINICE National Institute for Health and Clinical ExcellenceNIHR National Institute for Health ResearchNLR negative likelihood ratioNOC New Orleans CriteriaNSE neuron-specific enolasePECARN Paediatric Emergency Care Applied Research Network

x List of abbreviations
PLR positive likelihood ratioPSA probabilistic sensitivity analysisPSSRU Personal Social Services Research UnitPTA post-traumatic amnesiaPTS post-traumatic seizureQALY quality-adjusted life-yearQoL quality of lifeQUADAS Quality Assessment of Diagnostic Accuracy Studies RCS Royal College of SurgeonsRCT randomised controlled trial ReFeR Research Findings RegisterROC receiver-operating characteristicS100B S100 calcium-binding protein BSCI Science Citation IndexSIGN Scottish Intercollegiate Guidelines NetworkSSCI Social Science Citation IndexTBI traumatic brain injuryTN true-negativeTP true-positiveTRIP Turning Research into PracticeUCD University of California–Davis ruleVOI value of informationWoK Web of KnowledgeWoS Web of ScienceWWW world wide web
All abbreviations that have been used in this report are listed here unless the abbreviation is well known (e.g. NHS), or it has been used only once, or it is a non-standard abbreviation used only in figures/tables/appendices, in which case the abbreviation is defined in the figure legend or in the notes at the end of the table.
© Queen’s Printer and Controller of HMSO 2011. This work was produced by Pandor et al. under the terms of a commissioning contract issued by the Secretary of State for Health.
xi Health Technology Assessment 2011; Vol. 15: No. 27DOI: 10.3310/hta15270
Executive summary
Background
Head injury accounts for around 700,000 emergency department (ED) attendances each year in England and Wales; 90% of such head injuries are minor [Glasgow Coma Scale (GCS) score 13–15]. These patients have a small but important risk of serious intracranial injury (ICI) that requires early identification and neurosurgical treatment. Diagnostic assessment can either use a clinical decision rule or unstructured assessment of individual clinical features to identify those who are at risk of ICI and require computerised tomography (CT) scanning and/or hospital admission. Management involves a potential trade-off between underinvestigation, which risks missed opportunities to provide early effective treatment for ICI, and overinvestigation, which risks unnecessary radiation exposure and waste of NHS resources.
Objectives
The overall aim was to use secondary research methods to determine the most appropriate diagnostic management strategy for adults and children with minor (GCS 13–15) head injury in the NHS. More specifically, the objectives were to (1) undertake systematic reviews to determine the diagnostic accuracy of clinical decision rules and individual clinical characteristics for predicting ICI (including the need for neurosurgery) and evaluate the comparative effectiveness of different diagnostic management strategies for minor head injury (MHI); (2) undertake a cross-sectional survey and use routinely available data to describe current practice in the NHS; and (3) develop an economic model to estimate the cost-effectiveness of diagnostic strategies for MHI, identify the optimal strategy for managing MHI in the NHS, and identify the critical areas of uncertainty in the management of MHI.
Methods
Several electronic databases [including MEDLINE, MEDLINE In-Process & Other Non-Indexed Citations, the Cumulative Index to Nursing and Allied Health Literature (CINAHL), EMBASE and the Cochrane Library] were searched from inception to April 2009 (updated searches to March 2010 were conducted on the MEDLINE databases only). Searches were supplemented by hand-searching relevant articles (including citation searching) and contacting experts in the field. For each of the systematic reviews the following studies were included: (1) cohort studies of patients with MHI in which a clinical decision rule or individual clinical characteristics (including biomarkers and skull radiography) were compared with a reference standard test for ICI or need for neurosurgical intervention and (2) controlled trials comparing alternative management strategies for MHI. Study quality was assessed using the Quality Assessment of Diagnostic Accuracy Studies tool (for the assessment of diagnostic accuracy) or criteria recommended by the Effective Practice and Organisation of Care Review Group (for the assessment of management practices). Where sufficient data existed in accuracy studies, we used meta-analysis to generate pooled estimates of sensitivity, specificity and likelihood ratios.
For the economic analysis we developed a decision-analysis model using Simul8 Professional software (Simul8 Corporation, Boston, MA, USA) to estimate the costs and quality-adjusted life-years (QALYs) accrued by each potential management strategy for MHI, including a

xii Executive summary
theoretical ‘zero option’ strategy of discharging all patients home without investigation. The model took a lifetime horizon and the perspective of the NHS. The benefits of early detection of ICI were modelled using literature reviews to estimate the proportion of patients with each Glasgow Outcome Score (GOS) after each strategy and then estimate subsequent QALYs accrued. Hospital costs were estimated for each strategy and each GOS category. Each CT scan performed attracted an additional cost and QALY loss due to radiation-induced malignancy. The analysis was conducted for patients aged 1, 10, 40 and 75 years. Initial analysis was deterministic, but probabilistic sensitivity analysis (PSA) was also performed. Secondary analyses were undertaken to explore the trade-off between sensitivity and specificity in diagnostic strategies, to determine the cost-effectiveness of hospital admission compared with discharge home for (1) patients with non-neurosurgical injuries on CT scan and (2) patients with a normal CT scan, and to explore the cost-effectiveness of strategies for adults when no responsible adult was available to observe the patient after discharge.
To describe current NHS practice we mailed a questionnaire survey to the lead clinician of all major acute hospital EDs in the UK and analysed routine ED data from Hospital Episode Statistics (HES). Where possible, we correlated survey responses with HES to determine whether service provision was associated with difference in the proportion of patients admitted.
Results
The literature searches identified 8003 citations. Of these, 93 full-text papers were included for the assessment of diagnostic accuracy and one for the assessment of management practices. The quality of studies and reporting was generally poor.
The Canadian CT Head Rule (CCHR) was the most widely validated adult rule, with a sensitivity of 99–100% and a specificity of 48–77% for neurosurgical injury using the high-risk criteria, and sensitivity of 99–100% and 80–100% for neurosurgical and any ICI, respectively, using the high- or medium-risk criteria, with corresponding specificities of 37–48% and 39–51%. Rules for children were less well validated. Several had high sensitivity and acceptable specificity in derivation cohorts, but the limited validation data suggested that specificity was poor.
In adults, the presence of depressed, basal or radiological skull fracture and post-traumatic seizure (PTS) each substantially increased the likelihood of ICI [point estimate for positive likelihood ratio (PLR) > 10]. Focal neurological deficit, persistent vomiting, decrease in GCS and previous neurosurgery markedly increased the likelihood (PLR 5–10). Fall from a height, coagulopathy, chronic alcohol use, age over 60 years, pedestrian motor vehicle accident (MVA), any seizure, undefined vomiting, amnesia, GCS < 14 and GCS < 15 moderately increased the likelihood (PLR 2–5). Loss of consciousness (LOC) or headache had little diagnostic value.
In children, the presence of depressed or basal skull fracture and focal neurological deficit substantially increased the likelihood of ICI (PLR > 10). Coagulopathy, PTS and previous neurosurgery markedly increased the likelihood (PLR 5–10). Visual symptoms, bicycle and pedestrian MVA, any seizure, LOC, vomiting, severe or persistent headache, amnesia, GCS < 14, GCS < 15, intoxication and radiological skull fracture all moderately increased the likelihood (PLR 2–5). Headache, scalp haematoma and scalp laceration had little diagnostic value.
The S100 calcium-binding protein B (S100B) was the only widely evaluated biomarker and had a pooled sensitivity of 96.8% [95% highest-density region (HDR) 93.8% to 98.6%] and specificity of 42.5% (95% HDR 31.0% to 54.2%).
© Queen’s Printer and Controller of HMSO 2011. This work was produced by Pandor et al. under the terms of a commissioning contract issued by the Secretary of State for Health.
xiii Health Technology Assessment 2011; Vol. 15: No. 27DOI: 10.3310/hta15270
The only controlled trial showed that early CT and discharge of patients with MHI is at least as effective as hospital admission (21.4% vs 24.2% not fully recovered at 3 months) and costs less (mean cost £314 vs £462 per patient). An additional two contemporaneous cohort studies and nine uncontrolled before/after studies evaluated the effect of changes in management and implementation of guidelines, but methodological weaknesses and lack of generalisability limited the conclusions that could be drawn.
The deterministic economic analysis showed that for all ages a strategy of selective CT use based on a clinical decision rule dominated both the ‘CT all’ and ‘discharge all without investigation’ strategies (i.e. accrued more QALYs at lower cost). Selective CT use was cheaper than discharging without investigation because of the substantial costs of care for patients with worse outcomes due to delayed treatment. It was more effective than CT for all because of the QALY loss through radiation-induced malignancy associated with additional CT scanning, although this was only true for highly sensitive strategies. The optimal strategies were the CCHR (medium- and high-risk criteria) for adults and the Children’s Head Injury Algorithm for the Prediction of Important Clinical Events (CHALICE) rule for children, with other strategies being dominated or subject to extended dominance. PSA showed that these two strategies dominated all other strategies. However, deterministic scenario analyses showed that the CHALICE rule was dominated by other rules if validation cohort data were used instead of derivation cohort data, whereas the National X-Radiography Utilization Study II (NEXUS II) rule was the optimal rule for adults if different prevalence estimates were used for intracranial injuries.
Secondary deterministic analyses showed that the estimated sensitivity and specificity of the CCHR (99% and 47%, respectively) appeared to represent an appropriate trade-off of these two parameters. A rule with 100% sensitivity would only dominate the CCHR if specificity were ≥ 38%, whereas a rule with 70% specificity would dominate the CCHR only if sensitivity were ≥ 94%.
Other analyses showed that hospital admission for patients with non-neurosurgical injury on CT dominated discharge home, although hospital admission for clinically normal patients with a normal CT had an incremental cost-effectiveness ratio of £39M per QALY compared with discharge home with a responsible adult or £2.5M compared with discharge without a responsible adult. A selective CT strategy remained optimal for adults when there was no responsible adult available to observe the patient after discharge home.
The survey of NHS EDs showed that nearly all had unrestricted access to CT scanning (adults 96%, children 94.5%). Adults were usually admitted to an observation ward or clinical decision unit (61.4%), whereas children were usually admitted to an inpatient ward (86.7%). The median proportion of attendances admitted was higher for adults (18%) than for children (9%). There was no evidence of an association between the proportion admitted and the admission team, location or requirement for senior or specialist approval (all p > 0.1).
Conclusions
The CCHR is the most well-validated rule in adults and, when medium- and high-risk criteria are used, has high sensitivity and acceptable specificity. The CCHR and related National Institute for Health and Clinical Excellence guideline are based upon the clinical characteristics that our meta-analysis suggests are the most powerful predictors of ICI. The use of headache as an additional criterion for CT scanning (as used in some hospitals) was not supported by our meta-analysis.

xiv Executive summary
The CCHR appears to be the most cost-effective strategy for managing MHI in adults. Improving upon the CCHR would require improved accuracy rather than a different trade-off between sensitivity and specificity as the current balance appears appropriate in terms of cost-effectiveness. The S100B biomarker might improve specificity and thus cost-effectiveness, but further research is required to determine how S100B performs alongside clinical decision rules.
Decision rules for children have not been widely validated so conclusions are less clear. Three rules have been validated in a different setting from the derivation cohort and one in the same setting. Specificity appears to be worse in validation cohorts. The CHALICE and NEXUS II rules appeared to be based on characteristics that our meta-analysis suggested were the most powerful predictors of ICI. All decision rule strategies were more cost-effective than ‘CT all’ or ‘discharge all’. The CHALICE rule was the most cost-effective strategy when derivation data were used, but the NEXUS II rule was optimal where validation data were used.
Hospital admission for patients with non-neurosurgical injury on CT is cheaper and achieves better outcomes than discharge home, although data are currently lacking to clearly define which patients are most likely to benefit from hospital admission. Hospital admission of patients who are clinically well with a normal CT scan is not cost-effective.
The main research priorities are to (1) validate decision rules for children; (2) determine the prognosis and treatment benefit for non-neurosurgical injuries; (3) evaluate the use of S100B alongside a validated decision rule; (4) evaluate the diagnosis and outcomes of anticoagulated patients with MHI; and (5) evaluate the implementation of guidelines, clinical decision rules and diagnostic strategies. Formal expected value of sample information analysis would be recommended to appraise the cost-effectiveness of future studies.
Funding
Funding for this study was provided by the Health Technology Assessment programme of the National Institute for Health Research.

© Queen’s Printer and Controller of HMSO 2011. This work was produced by Pandor et al. under the terms of a commissioning contract issued by the Secretary of State for Health.
1 Health Technology Assessment 2011; Vol. 15: No. 27DOI: 10.3310/hta15270
Chapter 1
Background
Description of health problem
Head injuries account for over 700,000 emergency department (ED) attendances every year in England and Wales1 (with about 20% of head-injured patients being admitted to hospital for further assessment and treatment),2 and are responsible for a significant proportion of the ED workload. In the UK, 70–88% of all people who sustain a head injury are male, 10–19% are aged ≥ 65 years and 40–50% are children.1 The severity of head injury is directly related to the mechanism and cause.2 Most minor head injuries (MHIs) in the UK result from falls (22–43%), assault (30–50%) or road traffic accidents (25%).1 Alcohol may also be involved in up to 65% of adult head injuries. Motor vehicle accidents (MVAs) account for most fatal and severe head injuries.3 There are, however, marked variations in aetiology across the UK, particularly by age, gender, area of residence and socioeconomic status.3–5
Injury severity can be classified according to the patient’s consciousness level, as measured on the Glasgow Coma Scale (GCS) when they present to the emergency care services. Most patients (90%) present with a minor injury (GCS 13–15), whereas 10% present with either moderate (GCS 9–12) or severe (GCS 3–8) head injury.6 Patients with a MHI are conscious and responsive, but may be confused or drowsy. Initial management of MHI may involve identification and treatment of other injuries, or first aid for scalp bruising or bleeding, but MHIs are typically isolated so initial treatment is limited to analgesia and reassurance.
The main challenge in the management of MHI is identification of the minority of patients with significant intracranial injury (ICI), especially those who require urgent neurosurgery. Head injury can result in a range of intracranial lesions, including extradural or subdural haematoma, subarachnoid haemorrhage, cerebral contusion or intracerebral haematoma. Although patients with intracranial lesions often present with moderate or severe head injury according to their GCS, some present with apparently MHI. Subsequent progression of the intracranial lesion can result in a decreasing consciousness level, brain damage, disability and even death.
Early identification of an intracranial lesion can reduce the risk of brain damage and death. First, some intracranial lesions (typically extradural haematoma) can rapidly expand if untreated, leading to raised intracranial pressure, brain damage and death. Emergency neurosurgery to evacuate the haematoma and relieve increased pressure can allow most patients to make a full recovery,7–11 whereas delayed neurosurgery is associated with poorer outcomes.11,12 Second, a proportion of patients with an ICI that does not require urgent neurosurgery (i.e. a non-neurosurgical injury, such as an intracerebral haematoma) will subsequently deteriorate and require critical care support and/or neurosurgery. These patients may have better outcomes if they are admitted to hospital and managed in an appropriate setting.13 We have defined the former group as having ‘neurosurgical’ injuries and the latter as having ‘non-neurosurgical’ injuries. However, it should be recognised that our definition is based upon the emergency treatment required rather than all subsequent treatment. Many patients with injuries that we define as having ‘non-neurosurgical’ injuries will benefit from general neurosurgical care and may require later neurosurgical interventions.

2 Background
Outcome from head injury can be assessed using the Glasgow Outcome Score (GOS). The scale has the following categories:
1. dead2. vegetative state – unresponsive and unable to interact with environment3. severe disability – able to follow commands, but unable to live independently4. moderate disability – able to live independently, but unable to return to work or school5. good recovery – able to return to work or school.
The scale has subsequently been extended to eight categories by subdividing the severe disability, moderate disability and good recovery categories into upper and lower divisions [known as the extended GOS (GOS-E)].
Most patients with MHI have no intracranial lesion (or at least no lesion detectable by currently used imaging modalities) and will make a good recovery, although post-traumatic symptoms, such as headaches, depression and difficulty concentrating, are relatively common and often underestimated. There is some evidence that early educational intervention can improve these symptoms,14–17 but this does not rely upon initial diagnostic management. Most patients with a MHI and a neurosurgical or non-neurosurgical intracranial lesion will make a good recovery with appropriate timely treatment, although a significant proportion will suffer disability or die.7–11,18 Failure to provide appropriate timely treatment appears to be associated with a higher probability of disability or death.11,12
The incidence of death from head injury is estimated to be 6–10 per 100,000 population per annum.2 This low incidence is owing to most patients having MHI with no significant intracranial lesion and the good outcomes associated with ICI in patients presenting with MHI when treated appropriately. However, when death or disability does occur following MHI, it often affects young people and, therefore, results in a substantial loss of health utility and years of life. As such outcomes are potentially avoidable, clinicians typically have a low threshold for investigation.
Current service provision
Patients with MHI present to the ED, where a doctor or nurse practitioner will assess them and, if appropriate, arrange investigation. Clinical assessment may consist of an unstructured assessment of the patient history and examination or may use a structured assessment to combine features of the clinical history and examination in a clinical decision rule. Investigations include skull radiography and computerised tomography (CT) of the head. After assessment and investigation, patients may be discharged home, admitted to hospital for observation or referred for emergency neurosurgery. The aim of diagnostic management is to identify as many patients with ICI as possible (particularly those with neurosurgical injury), while avoiding unnecessary investigation or hospital admission for those with no significant ICI.
Guidelines for managing head injury in the NHS were drawn up by the National Institute for Health and Clinical Excellence (NICE) in 200319 and revised in 2007.1 These guidelines use clinical decision rules to determine which patients should receive CT scanning and which should be admitted to hospital. Similar guidelines from the Scottish Intercollegiate Guidelines Network (SIGN) are used in Scotland.20
The NICE guidelines were based upon a literature review and expert consensus. Cost-effectiveness analysis was not used to develop the guidelines, but was used to explore the potential impact on health service costs. The guidelines were expected to reduce the use of skull

© Queen’s Printer and Controller of HMSO 2011. This work was produced by Pandor et al. under the terms of a commissioning contract issued by the Secretary of State for Health.
3 Health Technology Assessment 2011; Vol. 15: No. 27DOI: 10.3310/hta15270
radiography, increase the use of CT scanning and reduce hospital admissions, thus reducing overall costs. Data from a number of studies have since confirmed that more CT scans and less skull radiography are being performed.21–23 However, Hospital Episode Statistics (HES) for England show that the annual number of admissions for head injury increased from 114,769 in 2001–2 to 155,996 in 2006–7. As average length of stay remained relatively constant, bed-days increased from 348,032 in 2001–2 to 443,593 in 2006–7. Figure 1 shows that the increase in admissions has been seen in adults rather than in children.24
These data suggest that the annual costs of admission for head injury have increased from around £170M to £213M since the guidelines were introduced.
The increase in admissions could be indirectly due to the NICE guidance. If, for example, clinicians were ordering more CT scans, but lacked the ability to interpret them or access to a radiological opinion then this could result in more admissions. However, changes in NHS emergency care occurring around 2003 other than NICE guidance could have been responsible for the increase in admissions. For example, the introduction of a target limiting the time spent in the ED to 4 hours could have resulted in patients being admitted to hospital rather than undergoing prolonged assessment in the ED. Furthermore, a general trend away from surgical specialties and towards emergency physicians in the responsibility for MHI admissions may have changed the threshold for hospital admission.
Description of technology under assessmentDiagnostic strategies for MHI include clinical assessment, clinical decision rules, skull radiography, CT scanning and biochemical markers. Clinical assessment can be used to identify patients with an increased risk of ICI and select patients for imaging or admission. A recent meta-analysis of 35 studies reporting data from 83,636 adults with head injury25 found that severe headache (relative risk 2.44), nausea (2.16), vomiting (2.13), loss of consciousness (LOC) (2.29), amnesia (1.32), post-traumatic seizure (PTS) (3.24), old age (3.70), male gender (1.26), fall from a height (1.61), pedestrian crash victim (1.70), abnormal GCS (5.58), focal neurology (1.80) and evidence of alcohol intake (1.62) were all associated with intracranial bleeding. A similar analysis of 16 studies reporting data from 22,420 children with head injury25 found that focal neurology (9.43), LOC (2.23) and abnormal GCS (5.51) were associated with intracranial bleeding.
180,000
160,000
140,000
120,000
100,000
60,000
80,000
40,000
0
20,000
Ad
mis
sion
s
1998–9 1999–2000
2000–1 2001–2 2002–3 2003–4 2004–5 2005–6 2006–7
Year
TotalAge 0–14 yearsAge 15–59 yearsAge 60–74 yearsAge 75+ years
FIGURE 1 Head injury admissions in England, 1998–2007.24

4 Background
Clinical features have been combined in a number of studies to develop a structured clinical decision rule. Initially, clinical decision rules were developed to determine which patients should be admitted to hospital for observation. More recently, clinical decision rules have been developed to determine which patients should receive CT scanning. A systematic review undertaken for the NICE guidance19 identified four studies of four different clinical decision rules. The studies of the Canadian CT Head Rule (CCHR) criteria26 and the New Orleans Criteria (NOC) rule27 were both high quality, applicable to the NHS and reported 100% sensitivity for the need for neurosurgical intervention. Of the other two studies, one28 reported poor sensitivity and one29 was not applicable to the NHS. On this basis, the NICE guidance adapted the CCHR for use in the NHS and recommended this for adults and children, effectively as the NICE clinical decision rule.19 In 2007, the guidance was updated1 to recommend using a rule developed specifically for children – the Children’s Head injury Algorithm for the prediction of Important Clinical Events (CHALICE) rule30 – although a modified version of the original rule continued to be recommended for adults.
Skull radiography can identify fractures that are associated with a substantially increased risk of intracranial bleeding, but cannot identify intracranial bleeding itself. Skull radiography is therefore used as a screening tool to select patients for investigation or admission, but not for definitive imaging. A meta-analysis31 found that skull fracture detected on a radiograph had a sensitivity of 38% and specificity of 95% for intracranial bleeding. More recent meta-analyses in adults25 and children32 reported relative risks of 4.08 and 6.13, respectively, for the association between skull fracture and intracranial bleeding. The NICE guidance only identifies a very limited role for skull radiography and use in the NHS has decreased accordingly.21–23
Computerised tomography scanning definitively shows significant bleeding and a normal CT scan effectively excludes a significant bleed at the time of scanning. Magnetic resonance imaging (MRI) can detect some lesions that are not evident on CT,33 but arguably none that is of clinical importance and certainly none that influences early management. CT can therefore be considered as a reference standard investigation for detecting injuries of immediate clinical importance. Liberal use of CT scanning will minimise the risk of missed ICI. However, this has to be balanced against the cost of performing large numbers of CT scans on patients with no ICI and the potential for harm from radiation exposure, particularly in children.
Hospital admission and observation may be used to identify intracranial bleeding by monitoring the patient for neurological deterioration. Although commonly used in the past, the effectiveness of this approach has not been studied extensively and has the disadvantage that neurosurgical intervention is delayed until after patient deterioration has occurred. Hospital admission and observation are usually used selectively, based upon clinical assessment or skull radiography findings. As with CT scanning, the use of hospital admission involves a trade-off between the benefits of early identification of patients who deteriorate owing to ICI and the costs of hospital admission for patients with no significant ICI.
Studies have compared CT-based strategies to skull radiography and/or admission to conclude that CT-based strategies are more likely to detect intracranial bleeding and less likely to require hospital admission.34,35 Both cost analyses based upon randomised controlled trial (RCT) data36 and economic modelling37 suggest that a CT-based strategy is cheaper. However, admission-based strategies may be an inappropriate comparator for cost-effectiveness analyses because they appear to be expensive and of limited effectiveness, particularly if applied unselectively.
More recently, the role of biochemical markers for the identification of brain injury has been investigated. The focus of these research efforts has been on a rule-out test, of high sensitivity and negative predictive value, such that patients with a negative test can be discharged without the

© Queen’s Printer and Controller of HMSO 2011. This work was produced by Pandor et al. under the terms of a commissioning contract issued by the Secretary of State for Health.
5 Health Technology Assessment 2011; Vol. 15: No. 27DOI: 10.3310/hta15270
radiation exposure associated with CT scanning. The most widely researched biomarker is the astroglial cell S100 calcium-binding protein beta subunit (S100B). Although it has been identified in non-head-injured patients,38 following isolated head injury a measurable concentration less than the currently used cut-off of 0.1 µg/l measured within 4 hours of injury39 has been linked to negative CT scans with a sensitivity of 96.8% and specificity of 42.5%. So far, inconsistency of sensitivity and specificity results has limited its widespread application. The question of clinical applicability and cost-effectiveness has also yet to be addressed adequately. Other biochemical markers, such as neuron-specific enolase (NSE), dopamine and adrenaline, have been studied but less extensively and without validation or consistent results, rendering it impossible to draw any evidence-based conclusions about their utilisation.

© Queen’s Printer and Controller of HMSO 2011. This work was produced by Pandor et al. under the terms of a commissioning contract issued by the Secretary of State for Health.
7 Health Technology Assessment 2011; Vol. 15: No. 27DOI: 10.3310/hta15270
Chapter 2
Research questions
Rationale for the study
The diagnostic management of MHI, particularly the use of CT scanning and hospital admission, involves a trade-off between the benefits of early accurate detection of ICI and the costs and harms of unnecessary investigation and admission for patients with no significant ICI. Clinical assessment, particularly if structured in the form of a decision rule, can be used to select patients for CT scanning and/or admission. Selective use of investigations or admission can reduce resource use, but may increase the risk of missed pathology. Cost-effectiveness analysis is therefore necessary to determine what level of investigation represents the most efficient use of health-care resources.
Although primary research can provide accurate estimates of the cost-effectiveness of alternative strategies, it can only compare a limited number of alternatives and is often restricted by ethical and practical considerations. Economic modelling allows comparison of a wide range of different strategies, including those that might currently be considered impractical or unethical, but may be revealed to be appropriate alternatives. Economic modelling is also a much cheaper and quicker way of comparing alternative strategies than primary research, so it can be used to identify which alternatives are most promising and where uncertainty exists and, thus, where primary research is best focused.
Economic modelling needs to be based upon systematic synthesis of robust and relevant data. We therefore planned to systematically review the literature to identify studies that evaluated the diagnostic accuracy of clinical assessment, decision rules and diagnostic tests used in MHI and studies that compared the outcomes of different diagnostic management strategies. These data could then be used to populate an economic model that estimated the costs and outcomes of potential strategies for managing patients with MHI and identify the optimal strategy for the NHS.
We limited our study to the diagnosis of acute conditions arising from MHI (the accuracy of tests for identifying acute injuries and the costs and benefits of identifying and treating acute injuries). Chronic subdural haematoma can develop weeks after MHI with an initially normal CT scan. As diagnosis and management of this condition occurs after initial presentation, it is more appropriately analysed as part of a separate decision-making process that is beyond the scope of this review. Similarly, we did not explore issues related to diffuse brain injury or persistent symptoms related to mild traumatic brain injury (TBI).
Overall aims and objectives of assessment
The overall aim was to use secondary research methods to determine the most appropriate diagnostic management strategy for adults and children with minor (GCS 13–15) head injury in the NHS. More specifically, the objectives were:

8 Research questions
1. To undertake systematic reviews to determine (1) the diagnostic performance of published clinical decision rules for identifying ICI (including the need for neurosurgery) in adults and children with MHI; (2) the diagnostic accuracy of individual clinical characteristics for predicting ICI (including the need for neurosurgery) in adults and children with MHI; and (3) the comparative effectiveness of different diagnostic management strategies for MHI in terms of process measures (hospital admissions, length of stay, time to neurosurgery) or patient outcomes.
2. To use a cross-sectional survey and routinely available data to describe current practice in the NHS, in terms of guidelines and management strategies used and hospital admission rates.
3. To develop an economic model to (1) estimate the cost-effectiveness of diagnostic strategies for MHI, in terms of the cost per quality-adjusted life-year (QALY) gained by each strategy; (2) identify the optimal strategy for managing MHI in the NHS, defined as the most cost-effective strategy at the NICE threshold for willingness to pay per QALY gained; and (3) identify the critical areas of uncertainty in the management of MHI, where future primary research would produce the most benefit.

© Queen’s Printer and Controller of HMSO 2011. This work was produced by Pandor et al. under the terms of a commissioning contract issued by the Secretary of State for Health.
9 Health Technology Assessment 2011; Vol. 15: No. 27DOI: 10.3310/hta15270
Chapter 3
Assessment of diagnostic accuracy
A systematic review of the literature and meta-analysis (where appropriate) was undertaken to evaluate the diagnostic performance of clinical decision rules and to measure the diagnostic
accuracy of key elements of clinical assessment for identifying intracranial injuries in adults and children with MHI.
The systematic review and meta-analysis was undertaken in accordance with the guidelines published by the Centre for Reviews and Dissemination (CRD) for undertaking systematic reviews40 and the Cochrane Diagnostic Test Accuracy Working Group on the meta-analysis of diagnostic tests.41,42
Methods for reviewing diagnostic accuracy
Identification of studiesElectronic databasesStudies were identified by searching the following electronic databases:
■ MEDLINE (via OvidSP) 1950 to March 2010 ■ MEDLINE In-Process & Other Non-Indexed Citations (via OvidSP) 1950 to March 2010 ■ Cumulative Index of Nursing and Allied Health Literature (CINAHL) (via EBSCO) 1981
to April 2009 ■ EMBASE (via OvidSP) 1980 to April 2009 ■ Web of Science (WoS) [includes Science Citation Index (SCI) and Conference Proceedings
Citation Index (CPCI)] [via Web of Knowledge (WoK) Registry] 1899 to April 2009 ■ Cochrane Central Registry of Controlled Trials (CENTRAL) (via Cochrane Library Issue 2,
2009) ■ Cochrane Database of Systematic Reviews (CDSR) (via Cochrane Library Issue 2, 2009) ■ NHS Database of Abstracts of Reviews of Effects (DARE) (via Cochrane Library Issue 2,
2009) ■ Health Technology Assessment (HTA) database (via Cochrane Library Issue 2, 2009) ■ Research Findings Register (ReFeR) ■ National Institute for Health Research (NIHR) databases ■ International Network of Agencies for Health Technology Assessment (INAHTA) ■ Turning Research Into Practice (TRIP) database.
Sensitive keyword strategies using free text and, where available, thesaurus terms using Boolean operators and database-specific syntax were developed to search the electronic databases. Synonyms relating to the condition (e.g. head injury) were combined with a search filter aimed at restricting results to diagnostic accuracy studies (used in the searches of MEDLINE, CINAHL and EMBASE). Date limits or language restrictions were not used on any database. All resources were searched from inception to April 2009. Updated searches to March 2010 were conducted on the MEDLINE databases only. An example of the MEDLINE search strategy is provided in Appendix 1.

10 Assessment of diagnostic accuracy
Other resourcesTo identify additional published, unpublished and ongoing studies, the reference lists of all relevant studies (including existing systematic reviews) were checked and a citation search of relevant articles [using WoK’s SCI and Social Science Citation Index (SSCI)] was undertaken to identify articles that cite the relevant articles. In addition, systematic keyword searches of the world wide web (WWW) were undertaken using the Copernic Agent Basic (version 6.12; Copernic, Quebec City, QC, Canada) meta-search engine and key experts in the field were contacted.
All identified citations from the electronic searches and other resources were imported into and managed using the Reference Manager bibliographic software version 12.0 (Thomson Reuters, Philadelphia, PA, USA).
Inclusion and exclusion criteriaThe inclusion of potentially relevant articles was undertaken using a three-step process. First, two experienced systematic reviewers (APa and SH) independently screened all titles and excluded any citations that clearly did not meet the inclusion criteria (i.e. non-human, unrelated to MHI). Second, the list of included abstracts that were identified as possibly relevant by title (or when uncertainty existed) was divided equally between two pairs of authors (comprising an experienced reviewer and a clinical expert – APa and APi, respectively, or SH and SG, respectively) and assessed independently by each reviewer for inclusion. The full manuscript of all potentially eligible articles that were considered relevant by either pair of authors was obtained, where possible. Third, two review authors (APa and SH) independently assessed the full-text articles for inclusion. This was then checked by two clinical experts (SG and APi) separately. Blinding of journal, institution and author was not performed. Any disagreements in the selection process (within or between pairs) were resolved through discussion and included by consensus between the four reviewers. The relevance of each article for the diagnostic accuracy review was assessed according to the following criteria.
Study designAll diagnostic cohort studies (prospective or retrospective) with a minimum of 20 patients were included. Case–control studies (i.e. studies in which patients were selected on the basis of the results of their reference standard test) were excluded.
Reviews of primary studies were not included in the analysis, but were retained for discussion and identification of additional studies. The following publication types were excluded from the review: animal studies, narrative reviews, editorials, opinions, non-English-language papers and reports in which insufficient methodological details are reported to allow critical appraisal of the study quality.
PopulationAll studies of adults and children (of any age) with MHI (defined as patients with a blunt head injury and a GCS of 13–15 at presentation) were included. Studies of patients with moderate or severe head injury (defined as patients with a GCS of ≤ 12 at presentation) or no history of injury were excluded. Studies that recruited patients with a broad range of head injury severity were included only if > 50% of the patients had MHI.
Index testAny test for ICI. This included clinical assessment (e.g. history, physical examination, clinical observation), laboratory testing (e.g. biochemical markers) or application of a clinical decision rule (defined as a decision-making tool that incorporates three or more variables obtained from the history, physical examination or simple diagnostic tests).43

© Queen’s Printer and Controller of HMSO 2011. This work was produced by Pandor et al. under the terms of a commissioning contract issued by the Secretary of State for Health.
11 Health Technology Assessment 2011; Vol. 15: No. 27DOI: 10.3310/hta15270
Target conditionThe target conditions of this review were:
■ the need for neurosurgical intervention (defined as any ICI seen on CT or MRI scanning that required neurosurgery)
■ any ICI (defined as any intracranial abnormality detected on CT or MRI scan due to trauma).
Reference standardThe following reference standards were used to define the target conditions:
■ CT scan ■ combination of CT scan and follow-up for those with no CT scan ■ MRI scan.
Computerised tomography scanning is the diagnostic reference standard for detecting intracranial injuries that require immediate neurosurgical intervention, as well as those that require in-hospital observation and medical management.1 Despite considerable variability in the use of CT scanning,44,45 performing a CT scan on all patients with MHI is costly and exposes most patients with normal CT scan to unnecessary radiation.46 Therefore, CT scanning or follow-up for those not scanned was also deemed to be an acceptable reference standard.
Magnetic resonance imaging is considered to be more sensitive than CT scanning in detecting acute traumatic ICI in patients with MHI (i.e. can detect some lesions that are not evident on CT).33 However, the lesions that are detected on MRI as opposed to CT are not likely to influence early neurosurgical management39 and its widespread use is constrained by costs, availability and accessibility issues.39 Nevertheless, it can still be regarded as an appropriate reference standard.
OutcomesSufficient data to construct tables of test performance [numbers of true-positives (TPs), false-negatives (FNs), false-positives (FPs) and true-negatives (TNs) or sufficient data to allow their calculation]. Studies not reporting these outcomes were identified, but not incorporated in the analyses.
Data abstraction strategyData abstraction was performed by one reviewer (SH) into a standardised data extraction form and independently checked for accuracy by a second (APa). Discrepancies were resolved by discussion between the two reviewers and, if agreement could not be reached, a third or fourth reviewer was consulted (SG and APi). Where multiple publications of the same study were identified, data were extracted and reported as a single study. The authors of the studies were contacted to provide further details in cases where information was missing from the articles.
The following information was extracted for all studies when reported: study characteristics (author, year of publication, journal, country, study design and setting), participant details (age, gender, percentage with MHI, GCS, inclusion and exclusion criteria), test details, reference standard details, prevalence of each outcome [clinically significant ICI and need for neurosurgery (including definitions)] and data for a two-by-two table (TP, FN, FP, TN). Where a study presented several different versions of a clinical decision rule (i.e. developed during the derivation phase), all test performance data were extracted. However, the analyses considered data from only the rule endorsed by the authors or the rule derived for the most appropriate outcome.

12 Assessment of diagnostic accuracy
Quality assessment strategyThe methodological quality of each included study was assessed by one reviewer (SH) and checked by another (APa) using a modified version of the Quality Assessment of Diagnostic Accuracy Studies (QUADAS) tool47 (a generic, validated, quality assessment instrument for diagnostic accuracy studies). In case of doubt, a third and fourth reviewer (SG and APi) were consulted.
The quality assessment items in QUADAS include the following: spectrum composition, description of selection criteria and reference standard, disease progression bias (this item was not applicable to this review as the reference standard was defined as CT or MRI within 24 hours of admission), partial and differential verification bias, test and reference standard review bias, clinical review bias, incorporation bias (this item was not applicable to this review as the reference standard was always independent of the index test), description of index and reference test execution, study withdrawals and description of indeterminate test results. For studies reporting decision rules, three items relating to the reference standard (adequacy of reference standard, partial and differential verification bias) were included twice, once for each target condition. For studies reporting clinical characteristics, these items were included once and scored negatively if either reference standard was inadequate. Study quality was assessed with each item scored as ‘yes’, ‘no’ or ‘unclear’. A summary score estimating the overall quality of an article was not calculated as the interpretation of such summary scores is problematic and potentially misleading.48,49 Further details on the modified version of the QUADAS tool are provided in Appendix 2.
Methods of data synthesisIndices of test performance were extracted or derived from data presented in each primary study of each test. Two-by-two contingency tables of TP cases, FN cases, FP cases and TN cases were constructed. Data from cohorts of children were analysed separately. Data from cohorts of adults, mixed cohorts and cohorts with no clear description of the age range included were analysed together.
For the diagnostic performance of published clinical prediction rules (for diagnosing intracranial bleeding requiring neurosurgery or any clinically significant ICI), the data of the two-by-two tables were used to calculate sensitivity and specificity [and their 95% confidence intervals (CIs) for each study]. We planned to undertake meta-analysis if there were a sufficient number of validation studies of the same rule in cohorts that were not markedly heterogeneous. However, after searches were completed it was apparent that no rule had been studied sufficiently to allow a meaningful meta-analysis. Therefore, results were presented in a narrative synthesis and illustrated graphically (forest plots) using the Cochrane Collaboration Review Manager software (version 5.0; The Nordic Cochrane Centre, Copenhagen, Denmark).50
For the diagnostic accuracy of clinical assessment, a different approach was used. We selected clinical characteristics that had been defined in a reasonably homogeneous and clinically meaningful way. Where applicable, three different approaches were used to meta-analyse the data. If data from only one study were available, no meta-analyses were undertaken, and the analysis produced estimates of sensitivity, specificity, negative likelihood ratio (NLR) and positive likelihood ratio (PLR), and corresponding 95% CIs. The last were calculated assuming that the statistics were normally distributed on the logit scale (sensitivity, specificity) and on the logarithm scale (NLR, PLR).
The PLR is the proportion with the outcome (neurosurgery or ICI) given that the risk factor is ‘positive’, divided by the proportion without the outcome given that the risk factor is ‘positive’, i.e. the PLR is the odds of having the outcome, given a positive risk factor. By a similar argument, the

© Queen’s Printer and Controller of HMSO 2011. This work was produced by Pandor et al. under the terms of a commissioning contract issued by the Secretary of State for Health.
13 Health Technology Assessment 2011; Vol. 15: No. 27DOI: 10.3310/hta15270
NLR is the odds of having the outcome given a negative risk factor.51 Thus, the PLR and NLR are two potentially useful clinical diagnostic measures, depending on whether or not a patient is risk factor positive or risk factor negative.
If there were data from two studies, a fixed-effects meta-analysis was conducted using the DerSimonian and Laird method,52 weighted by the inverse of study variance estimate, and, as before, estimates of sensitivity, specificity, NLR, PLR and corresponding 95% CI. Note, that the correlation between outcomes cannot be taken into account in this case as there were insufficient data.
For data from three or more studies, a full Bayesian meta-analysis was conducted. The bivariate random-effects method of Reitsma et al.53 was used. The Bayesian approach was chosen because the between-studies uncertainty can be modelled directly, which is important in any random effects meta-analysis where there are small numbers of studies and potential heterogeneity. Correlation between sensitivity and specificity was modelled at the logit level and the correlation was modelled separately. In addition to the estimated sensitivity, specificity, NLR, PLR and corresponding 95% highest-density regions (HDRs), results also included estimated heterogeneity (Q) statistics and corresponding p-values for sensitivity and specificity, calculated using a fixed-effects approach.
Results of the review of diagnostic accuracy
This section presents the results of the following systematic reviews separately:
■ the diagnostic performance of published clinical decision rules for identifying ICI or the need for neurosurgery in adults and children with MHI (see Clinical decision rules)
■ the diagnostic accuracy of individual clinical characteristics for predicting ICI or the need for neurosurgery in adults and children with MHI (see Individual characteristics)
■ the diagnostic accuracy of various biochemical markers for predicting ICI or the need for neurosurgery in adults and children with MHI (see Biomarkers).
Studies included in the reviewOverall, the literature searches identified 8003 citations. Of the titles and abstracts screened, 222 relevant full papers were retrieved and assessed in detail. A flow chart describing the process of identifying relevant literature can be found in Appendix 3. A total of 93 papers evaluating the diagnostic performance and/or accuracy of clinical decision rules, individual clinical characteristics (symptoms, signs and plain imaging) and biochemical markers met the inclusion criteria. Table 1 shows the number of studies included for each systematic review of diagnostic accuracy. Studies excluded from the review are listed in Appendix 4.
TABLE 1 Number of studies included for each systematic review of diagnostic accuracya
Diagnostic review
No. of included studies
Adults Children and/or infants
Clinical decision rules 19 14
Individual clinical characteristics 42 29
Biomarkers 11 1
a Some studies provided diagnostic data for more than one review.

14 Assessment of diagnostic accuracy
Clinical decision rulesDescription of included studiesAdultsThe design and patient characteristics of the 19 studies (representing 22 articles)26,27,29,46,54–71 that evaluated the diagnostic performance of clinical decision rules for identifying ICI or need for neurosurgery in adults with MHI are summarised in Table 2. Eight studies were from the USA,27,29,55,58,59,61,62,64 two each from Italy,54,57,71 Canada26,46 and the Islamic Republic of Iran,66,67 and one each from the Netherlands,68–70Australia,65 Japan,63 Spain60 and Denmark.56 Six were multicentre studies.26,46,62,66–70 Cohorts ranged in size from 16863 to 13,728.62 Fourteen studies derived a new rule.26,27,29,54–56,60,61–64,66,67,69 Four studies46,57,60,68–71 reported validation results for more than one rule in the same cohort. Data were collected prospectively in 15 studies,26,27,29,46,56–63,66–71 of which participants were recruited consecutively in 13,26,27,29,56–60,62,63,66–71 as a convenience sample in one,46 and one did not report the method of participant recruitment.61 The remaining four studies were retrospective.54,55,64,65 Of the 19 studies, three reported both a derivation and a validation cohort,27,61,63 making a total of 22 different cohorts.
Median prevalence of neurosurgical injury was 0.95% [interquartile range (IQR) 0.3% to 1.5%]. Median prevalence of ICI was 7.2% (IQR 6.3% to 8.5%). Variations in prevalence may be owing to differences in inclusion criteria, reference standards and outcome definitions. Participant inclusion ages ranged from > 3 years27 to adults aged ≥ 17 years,55 with five studies including all ages or not reporting an age limit.29,56,59,61,62 In seven studies,29,55,59,61,62,64,65 patients were enrolled only if they had a CT scan and in nine studies26,27,29,46,55,58,59,65,68–70 patients were selected on the basis of clinical characteristics, such as amnesia or LOC at presentation, which, in some studies, were used as criteria for having a CT scan. Five studies defined MHI as GCS 14–1554,57,58,60,63,71 and included only patients presenting within this range. Four studies collected data only on those with GCS 15,27,29,65,67 one study collected data on GCS 14 only,59 two studies61,62 included data from all GCS categories and two did not report GCS status.56,64 The remaining five studies26,46,55,66,68–70 included patients with GCS 13–15. Ten studies26,27,29,46,57,59,63,66–71 stated that they enrolled people who presented within 48 hours of injury, although the more usual figure was within 24 hours of injury.
Definitions of outcomes and the reference standards used varied across studies (Table 3). If CT was not an inclusion criterion and was not performed on all then the reference standard used telephone follow-up and/or review of hospital records to identify clinically significant lesions. This method would not be expected to accurately identify all intracranial injuries and would potentially affect estimates of sensitivity and specificity.80 Eight studies reported neurosurgery as an outcome.26,29,46,54,57,59,65,68–71 The length of follow-up for neurosurgery varied from being not reported to up to 30 days after injury. The main difference in outcome definition for ICI involved the perception of clinical significance, with five cohorts defining this and 16 identifying any common acute lesion (listed in Table 3). Definitions of surgical lesions also varied, but most definitions included haematoma evacuation, elevation of depressed skull fracture and intracranial pressure monitoring.

© Queen’s Printer and Controller of HMSO 2011. This work was produced by Pandor et al. under the terms of a commissioning contract issued by the Secretary of State for Health.
15 Health Technology Assessment 2011; Vol. 15: No. 27DOI: 10.3310/hta15270
TAB
LE 2
Dec
isio
n ru
les
for
adul
ts w
ith M
HI –
stu
dy d
esig
n an
d pa
tient
cha
ract
eris
tics
of in
clud
ed s
tudi
es
Author, year
Rule(s) derived
Rule(s) validated
Country
Design
No. of patients, n
Mean or median age, years (range)
Prevalence of neurosurgery
Prevalence of ICI
CT as inclusion? (yes/no)
Male, n
Patients with MHI, n
Prevalence of GCS 15, n
Other significant inclusion criteria
Other significant exclusion criteria
Arie
nta
et
al. 1
99754
Arie
nta
et a
l. 19
9754
Italy
R99
17NR
24/9
917
(0.2
%)
85/9
917
(0.8
6%)
NoNR
for t
his
subg
roup
9917
/991
7 (1
00%
)98
33/9
917
(99%
)≥
6 y
ears
of a
ge.
Pres
entin
g to
the
ED d
irect
ly
Child
ren
< 6
yea
rs
of a
ge
Borc
zuk
1995
55
Borc
zuk
1995
55
USA
R14
48NR
119/
1448
(8
.2%
)Ye
s99
9/14
48
(68%
)14
48/1
448
(100
%)
1211
/144
8 (8
3.6%
)≥
17
year
s of
ag
e. G
CS ≥
13,
bl
unt h
ead
traum
a, h
ad C
T sc
an
≤ 1
6 ye
ars.
Pat
ient
s w
ith p
enet
ratin
g cr
ania
l tra
uma
Duus
et a
l. 19
9456
Duus
et
al.
1994
56
Denm
ark
P, Cs
2204
Mea
n:
23.7
(0
to 1
08)
4/22
04
(0.1
8%)
No13
78/2
204
(62.
5%)
2204
/220
4 (1
00%
)NR
MHI
, abl
e to
wal
k an
d ta
lkCo
mat
ose,
una
ble
to
iden
tify
them
selve
s or
un
resp
onsi
ve to
pai
n
Fabb
ri et
al
. 200
5;57
a S
tein
et
al. 2
00971
CCHR
,26
NCW
FS,72
NI
CE,19
NOC
,27
NEXU
S II,
62
Scan
dina
vian73
Italy
P, Cs
7955
Med
ian:
44
108/
7955
(1
.4%
, re
porte
d as
1.3
%)
542/
7955
(6
.8%
)No
4415
/795
5 (5
5.5%
) 79
55/7
955
(100
%)
7426
/795
5 (9
3.4%
)≥
10
year
s. A
cute
M
HI w
ithin
24
hour
s of
inju
ry
Uncl
ear h
isto
ry,
unst
able
vita
l si
gns,
GCS
< 1
4,
pene
tratin
g in
jurie
s,
volu
ntar
y di
scha
rge,
re
atte
ndan
ces
Falim
irski
et
al.
2003
58
Falim
irski
et a
l. 20
0358
USA
P, Cs
331
Mea
n:
39.2
1 (1
6 to
95
)
40/3
31
(12.
1%)
No21
4/33
7 (6
5%)
331/
331
(100
%)
302/
331
(91.
2%)
≥ 1
6 ye
ars
of
age.
Blu
nt in
jury
, w
itnes
sed
LOC
or a
mne
sia,
GCS
14
–15
GCS
13, o
r tra
nsfe
rred
with
a
CT s
can
Hayd
el e
t al
. 200
027
NOC27
USA
P, Cs
520
Mea
n:
36 (3
to
97)
36/5
20
(6.9
%)
No33
8/52
0 (6
5%)
520/
520
(100
%)
520/
520
(100
%)
> 3
yea
rs o
f ag
e. G
CS 1
5,
LOC/
amne
sia,
no
rmal
by
brie
f ne
urol
ogic
al
exam
inat
ion,
in
jury
with
in la
st
24 h
ours
Decl
ined
CT,
conc
urre
nt in
jurie
s th
at p
recl
ude
CT
NOC27
P, Cs
b90
9bM
ean:
36
(3 to
94
)b
57/9
09
(6.3
%)b
Nob
591/
909
(65%
)b
909/
909
(100
%)b
909/
909
(100
%)b
As a
bove
As a
bove
cont
inue
d

16 Assessment of diagnostic accuracy
Author, year
Rule(s) derived
Rule(s) validated
Country
Design
No. of patients, n
Mean or median age, years (range)
Prevalence of neurosurgery
Prevalence of ICI
CT as inclusion? (yes/no)
Male, n
Patients with MHI, n
Prevalence of GCS 15, n
Other significant inclusion criteria
Other significant exclusion criteria
Holm
es e
t al
. 199
759
Mille
r et a
l. 19
9729
USA
P, Cs
264
Mea
n:
39.5
4/26
4 (1
.5%
)35
/264
(1
3.3%
, re
porte
d as
13
.2%
)
Yes
181/
/264
(6
8.5%
)26
4/26
4 (1
00%
)0
(all
GCS
14)
Clos
ed h
ead
inju
ry, e
viden
ce
of L
OC o
r am
nesi
a af
ter
head
trau
ma
and
GCS
14. H
ad C
T sc
an
Dela
y in
pre
sent
atio
n >
4 h
ours
afte
r inj
ury
Iban
ez
and
Arik
an
2004
60
Iban
ez
and
Arik
an
2004
60
Stei
n 19
96,74
To
mei
et a
l. 19
96,75
Arie
nta
et a
l. 19
97,54
La
pier
re
1998
,76 M
ursh
id
1998
,77 N
OC,27
Sc
andi
navia
n,73
SI
GN 2
000,
78
NCW
FNS,
72
CCHR
,26 E
FNS79
Spai
nP,
Cs11
01M
ean:
46
.7 (1
5 to
99)
83/1
101
(7.5
%)
No57
3/11
01
(52%
)11
01/1
101
(100
%)
978
(88.
8%)
> 1
4 ye
ars.
MHI
(G
CS 1
4 or
15)
, w
ith o
r with
out
LOC
Refe
rrals
from
oth
er
hosp
itals
Mad
den
et
al. 1
99561
Mad
den
et a
l. 19
9561
USA
P, NR
537
NR91
/537
(1
7%)
Yes
NRNR
All
All p
atie
nts
with
acu
te
head
trau
ma
pres
entin
g to
the
ED w
ith h
ead
CT
Patie
nts
who
rece
ived
faci
al C
T sc
ans
with
out c
ereb
ral
stud
ies
Mad
den
et a
l. 19
9561
P, NRb
273b
44/2
73
(16.
1%)b
Yesb
NRb
NRb
Allb
As a
bove
bAs
abo
veb
Mille
r et
al. 1
99729
Mille
r et
al.
1997
29
USA
P, Cs
2143
NR5/
2143
(0
.2%
)13
8/21
43
(6.4
%)
Yes
NR21
43/2
143
(100
%)
2143
/214
3 (1
00%
)No
rmal
men
tal
stat
us, L
OC/
amne
sia,
CT
afte
r blu
nt h
ead
traum
a. W
ithin
24
hour
s of
inju
ry,
< 2
hou
rs p
rior
to p
rese
ntin
g to
th
e ED
No e
xclu
sion
crit
eria
ap
plie
d
TAB
LE 2
Dec
isio
n ru
les
for
adul
ts w
ith M
HI –
stu
dy d
esig
n an
d pa
tient
cha
ract
eris
tics
of in
clud
ed s
tudi
es (c
ontin
ued)

© Queen’s Printer and Controller of HMSO 2011. This work was produced by Pandor et al. under the terms of a commissioning contract issued by the Secretary of State for Health.
17 Health Technology Assessment 2011; Vol. 15: No. 27DOI: 10.3310/hta15270
Author, year
Rule(s) derived
Rule(s) validated
Country
Design
No. of patients, n
Mean or median age, years (range)
Prevalence of neurosurgery
Prevalence of ICI
CT as inclusion? (yes/no)
Male, n
Patients with MHI, n
Prevalence of GCS 15, n
Other significant inclusion criteria
Other significant exclusion criteria
Mow
er e
t al
. 200
562
NEXU
S II62
USA
P, Cs
13,7
28NR
917/
13,7
28
(6.7
%)
Yes
8988
/13,
728
(66%
)NR
All
All a
ges.
Had
CT
scan
, acu
te b
lunt
he
ad tr
aum
a
Dela
yed
pres
enta
tion,
pe
netra
ting
traum
a
Ono
et a
l. 20
0763
Ono
et a
l. 20
0763
Japa
nP,
Cs10
64M
ean:
46
50
/106
4 (4
.7%
)No
621/
1064
(5
8.4%
)10
64/1
064
(100
%)
912
(85.
7%)
≥ 1
0 ye
ars.
With
he
ad in
jury
, w
ithin
6 h
ours
of
inju
ry, G
CS ≥
14
Extre
mel
y tri
vial
inju
ry (s
calp
or f
acia
l w
ound
s), t
hose
who
re
fuse
d ex
amin
atio
n
Ono
et a
l. 20
0763
NRb
168b
NRb
13/1
68
(7.7
%)b
Nob
NRb
168/
168
(100
%)b
NRb
As a
bove
(a
ssum
ed)
As a
bove
(ass
umed
)
Rein
us e
t al
. 199
364
Rein
us
et a
l. 19
9364
USA
R35
5M
ean:
39
(15
to 9
3)
44/3
55
(12.
4%)
Yes
234/
373
(62.
7%)
NRNR
> 1
5 ye
ars
of
age.
Ref
erre
d fo
r CT
scan
from
ED
for c
lose
d or
pen
etra
ting
traum
a to
the
head
Patie
nts
refe
rred
only
for e
valu
atio
n of
faci
al
bone
frac
ture
s
Rose
ngre
n et
al.
2004
65
CCHR
26Au
stra
liaR
240
Mea
n:
38 (1
4 to
95)
1/24
0 (0
.42%
)10
/240
(4
.17%
)Ye
s16
8/24
0 (7
0%)
240/
240
(100
%)
240/
240
(100
%)
Adul
ts, h
isto
ry
of b
lunt
trau
ma,
GC
S 15
, his
tory
of
LOC
or
amne
sia
None
repo
rted
Saad
at e
t al
. 200
966
Saad
at
et a
l. 20
0966
Saad
at e
t al.
2009
66
Isla
mic
Re
publ
ic
of Ir
an
P,Cs
318
NR20
/318
(6
.3%
)No
242/
318
(76%
)31
8/31
8 (1
00%
)28
5 (8
9.5%
)15
–70
year
s ol
d w
ith b
lunt
hea
d tra
uma
with
in
12 h
ours
of
pres
enta
tion
and
GCS
≥ 1
3
Opiu
m-a
ddic
ted,
co
ncur
rent
maj
or
inju
ries
that
ne
cess
itate
d sp
ecia
lised
car
e,
unst
able
, sus
pect
ed
of m
alin
gerin
g, o
r re
fuse
d to
par
ticip
ate
in th
e st
udy co
ntin
ued

18 Assessment of diagnostic accuracy
Author, year
Rule(s) derived
Rule(s) validated
Country
Design
No. of patients, n
Mean or median age, years (range)
Prevalence of neurosurgery
Prevalence of ICI
CT as inclusion? (yes/no)
Male, n
Patients with MHI, n
Prevalence of GCS 15, n
Other significant inclusion criteria
Other significant exclusion criteria
Sabo
ori e
t al
. 200
767
Sabo
ori
et a
l. 20
0767
Isla
mic
Re
publ
ic
of Ir
an
P, Cs
682
Mea
n:
29 (6
to
85)
46/6
82
(6.7
%)
No53
4/68
2 (7
8.3%
)68
2/68
2 (1
00%
)68
2 (1
00%
)≥
6 y
ears
of a
ge.
GCS
15 >
24
hour
s po
st
inju
ry, n
o cl
ear
hist
ory
of tr
aum
a,
obvio
us p
enet
ratin
g sk
ull i
njur
y or
obv
ious
de
pres
sed
fract
ure
Smits
et
al. 2
005,
68
2007
,69
2007
70
CHIP
69CC
HR,26
NO
C,27
Dut
ch,
NCW
FNS,
72
EFNS
,79
NICE
,19 S
IGN,
78
Scan
dina
vian73
Neth
er-
land
sP,
Cs31
81M
ean:
41
.4 (1
6 to
102
)
17/3
181
(0.5
%)
243/
3181
(7
.6%
)No
2244
/318
1 (7
0.5%
)31
81/3
181
(100
%)
2462
/318
1 (7
7.4%
)≥
16
year
s.
Pres
enta
tion
< 2
4 ho
urs,
GCS
sc
ore
13–1
4 at
pr
esen
tatio
n, o
r GC
S 15
and
one
ris
k fa
ctor
Conc
urre
nt
inju
ries
prec
lude
d he
ad C
T w
ithin
24
hou
rs o
f inj
ury,
co
ntra
indi
catio
ns to
CT
sca
nnin
g, tr
ansf
er
from
ano
ther
hos
pita
l
CCHR
26P,
Csc
1307
c2/
1307
(0
.15%
)c
117/
1307
(9
%)c
Noc
NRc
1307
/130
7 (1
00%
)c
NRc
Subs
et
(GCS
sco
re
13–1
5, L
OC,
no n
euro
logi
cal
defic
it, n
o se
izure
, no
antic
oagu
latio
n,
age
> 1
6 ye
ars)
se
lect
ed fr
om
orig
inal
coh
ort
NOC27
P, Cs
c20
28c
7/20
28
(0.3
%)c
205/
2028
(1
0.1%
)c
Noc
NRc
2028
/202
8 (1
00%
)c
NRc
Subs
et (G
CS
15, L
OC, n
o ne
urol
ogic
al
defic
it, a
ge
> 3
yea
rs)
sele
cted
from
or
igin
al c
ohor
t
TAB
LE 2
Dec
isio
n ru
les
for
adul
ts w
ith M
HI –
stu
dy d
esig
n an
d pa
tient
cha
ract
eris
tics
of in
clud
ed s
tudi
es (c
ontin
ued)

© Queen’s Printer and Controller of HMSO 2011. This work was produced by Pandor et al. under the terms of a commissioning contract issued by the Secretary of State for Health.
19 Health Technology Assessment 2011; Vol. 15: No. 27DOI: 10.3310/hta15270
Author, year
Rule(s) derived
Rule(s) validated
Country
Design
No. of patients, n
Mean or median age, years (range)
Prevalence of neurosurgery
Prevalence of ICI
CT as inclusion? (yes/no)
Male, n
Patients with MHI, n
Prevalence of GCS 15, n
Other significant inclusion criteria
Other significant exclusion criteria
Stie
ll et
al.
2001
26
CCHR
26Ca
nada
P, Cs
3121
Mea
n:
38.7
±
(16
to
99)
44/3
121
(1.4
1%)
254/
3121
(8
.14%
)No
21
35/3
121
(68.
4%)
3121
/312
1 (1
00%
)24
89/3
121
(80%
)≥
16
year
s.
Witn
esse
d LO
C or
am
nesi
a or
di
sorie
ntat
ion
and
GCS
≥ 1
3 an
d in
jury
in la
st
24 h
ours
< 1
6 ye
ars.
M
inim
al in
jury
, no
hist
ory
of tr
aum
a as
prim
ary
even
t, pe
netra
ting
inju
ry,
obvio
us d
epre
ssed
sk
ull f
ract
ure,
fo
cal n
euro
logi
cal
defic
it, u
nsta
ble
vital
sig
ns, s
eizu
re,
blee
ding
dis
orde
r/an
ticoa
gula
nts,
re
asse
ssm
ent o
f pr
evio
us in
jury
, pr
egna
nt
Stie
ll et
al.
2005
46
CCHR
,26 N
OC27
Cana
daP,
Cv27
07M
ean:
38
.4 (1
6 to
99)
41/2
707
(1.5
%)
231/
2707
(8
.5%
)No
1884
/270
7 (6
9.6%
)27
07/2
707
(100
%)
2049
/270
7 (7
5.7%
)As
per
Stie
ll et
al.
2001
26
As p
er S
tiell
et a
l. 20
0126
CCHR
,26 N
OC27
P, Cv
c18
22c
Mea
n:
37.7
(16
to 9
9)c
8/18
22
(0.4
%)c
97/1
822
(5.3
%)c
1246
/182
2 (6
8.4%
)c
1822
/182
2 (1
00%
)c
Subs
et (G
CS 1
5)
BHI,
blun
t hea
d in
jury
; CHI
P, CT
in H
ead
Inju
ry P
atie
nts;
Cs,
con
secu
tive;
Cv,
conv
enie
nce;
EFN
S,79
Eur
opea
n Fe
dera
tion
of N
euro
logi
cal S
ocie
ties;
NCW
FNS,
Neu
rotra
umat
olog
y Co
mm
ittee
of t
he W
orld
Fed
erat
ion
of
Neur
osur
gica
l Soc
ietie
s; N
EXUS
II, N
atio
nal E
mer
genc
y X-
Radi
ogra
phy
Utiliz
atio
n St
udy
II; N
R, n
ot re
porte
d; P
, pro
spec
tive.
a St
udy
char
acte
ristic
s da
ta d
raw
n fro
m b
oth
pape
rs.
b Se
para
te (n
ew) c
ohor
t for
val
idat
ion.
c Su
bgro
up o
f coh
ort.

20 Assessment of diagnostic accuracy
TABLE 3 Decision rules for adults with MHI – definitions of outcomes and reference standards used in included studies
Author, year Rule(s) tested Definition of ICI
Reference standard used for ICI
Patients who had CT, n
Definition of need for neurosurgery
Reference standard used for need for neurosurgery
Arienta et al. 199754
Arienta et al. 199754
Intracranial lesion: not defined. Injuries listed include extradural haematoma, cortical contusion, subarachnoid haemorrhage, pneumocephalus, depressed fracture with contusion, intracerebral haematoma and subdural haematoma
CT scan or follow-up telephone call. Further details NR
762/9917 (7.7%)
Neurosurgery or death
Retrospective chart review, telephone follow-up
Borczuk 199555
Borczuk 199555 ICI: abnormalities believed to be related to the trauma
CT scan 1448/1448 (100%)
NA NA
Duus et al. 199456
Duus et al. 199456
Intracranial complications: not defined
If admitted: observation, CT scan if deteriorating level of consciousness and/or neurological signs
If discharged: information sheet advising return if deterioration
National Danish Patient Register checked for anyone diagnosed with appropriate ICD codes
21/2204 (1%) NA NA
Fabbri et al. 2005;57 Stein et al. 200971
CCHR,26 NCWFNS,72 NICE,19 NOC,27 Nexus II,62 Scandinavian73
Stein et al. 200971 – any lesion: surgical (intracranial haematoma large enough to require surgical evacuation) or non-surgical (other intracranial abnormality diagnosed on CT)
Fabbri et al. 200557 – any post-traumatic lesion at CT within 7 days from trauma: depressed skull fracture, intracerebral haematoma/brain contusions, subarachnoid haemorrhage, subdural haematoma, epidural haematoma, intraventricular haemorrhage
Patients were managed accord to NCWFS guidelines where low-risk patients sent home without CT, medium-risk patients given CT and observed for 3–6 hours if negative then discharged, high-risk patients given CT and observed 24–48 hours. All discharged with written advice of signs and symptoms with which they should return
4177/7955 (52.5%)
Stein et al. 200971 – surgical intracranial lesion: intracranial haematoma large enough to require surgical evacuation
Fabbri et al. 2005:57 haematoma evacuation, skull fracture elevation within first 7 days of injury. Injuries after this period not considered in this analysis
Assume hospital records
Falimirski et al. 200358
Falimirski et al. 200358
Significant ICI: not defined. Injuries recorded include subarachnoid haemorrhage, subdural haematoma, epidural haematoma, intracerebral haemorrhage, contusion, pneumocephaly, skull fracture
CT scan 331/331 (100%)
NA NA

© Queen’s Printer and Controller of HMSO 2011. This work was produced by Pandor et al. under the terms of a commissioning contract issued by the Secretary of State for Health.
21 Health Technology Assessment 2011; Vol. 15: No. 27DOI: 10.3310/hta15270
Author, year Rule(s) tested Definition of ICI
Reference standard used for ICI
Patients who had CT, n
Definition of need for neurosurgery
Reference standard used for need for neurosurgery
Haydel et al. 200027
NOC27 ICI – presence of acute traumatic ICI: a subdural, epidural or parenchymal haematoma, subarachnoid haemorrhage, cerebral contusion or depressed skull fracture
CT scan 520/520
(100%)
909/909 (100%)a
NA NA
Holmes et al. 199759
Miller et al. 199729
Abnormal CT scan: any CT scan showing an acute traumatic lesion (skull fractures or intracranial lesions: cerebral oedema, contusion, parenchymal haemorrhage, epidural haematoma, subdural haematoma, subarachnoid haemorrhage or intraventricular haemorrhage)
CT scan: patients with abnormal CT scan followed to discharge; those with normal CT not studied further
264/264 (100%)
Neurosurgery Patients with abnormal CT scan followed to discharge
Those with normal CT not studied further
Ibanez and Arikan 200460
Ibanez and Arikan 2004,60 Stein 1996,74
Tomei et al. 1996,75 Arienta et al. 1997,54 Lapierre 1998,76 Murshid 1998,77 NOC,27 Scandinavian,73 SIGN 2000,78 NCWFNS,72 CCHR,26 EFNS79
Relevant positive CT scan: acute intracranial lesion, not including isolated cases of linear skull fractures or chronic subdural effusions
CT scan 1101/1101 (100%)
NA NA
Madden et al. 199561
Madden et al. 199561
Clinically significant scan: pathology related to trauma affecting the bony calvaria or cerebrum (including non-depressed skull fractures, excluding scalp haematomas, those with no bony skull or intracerebral pathology)
CT scan: scans examined for bony and soft tissue injury, herniation, pneumocephalus, penetrating injury and the size and location of any cortical contusions, lacerations or external axial haematomas
537/537 (100%)
273/273 (100%)a
NA NA
Miller et al. 199729
Miller et al. 199729
Abnormal CT scan: acute traumatic intracranial lesion (contusion, parenchymal haematoma, epidural haematoma, subdural haematoma, subarachnoid haemorrhage) or a skull fracture
CT scan: within 8 hours of injury
2143/2143 (100%)
Surgical intervention: craniotomy to repair an acute traumatic injury or placement of a monitoring bolt
Hospital records of those with positive CT scan followed until discharge
continued
TABLE 3 Decision rules for adults with MHI – definitions of outcomes and reference standards used in included studies (continued)
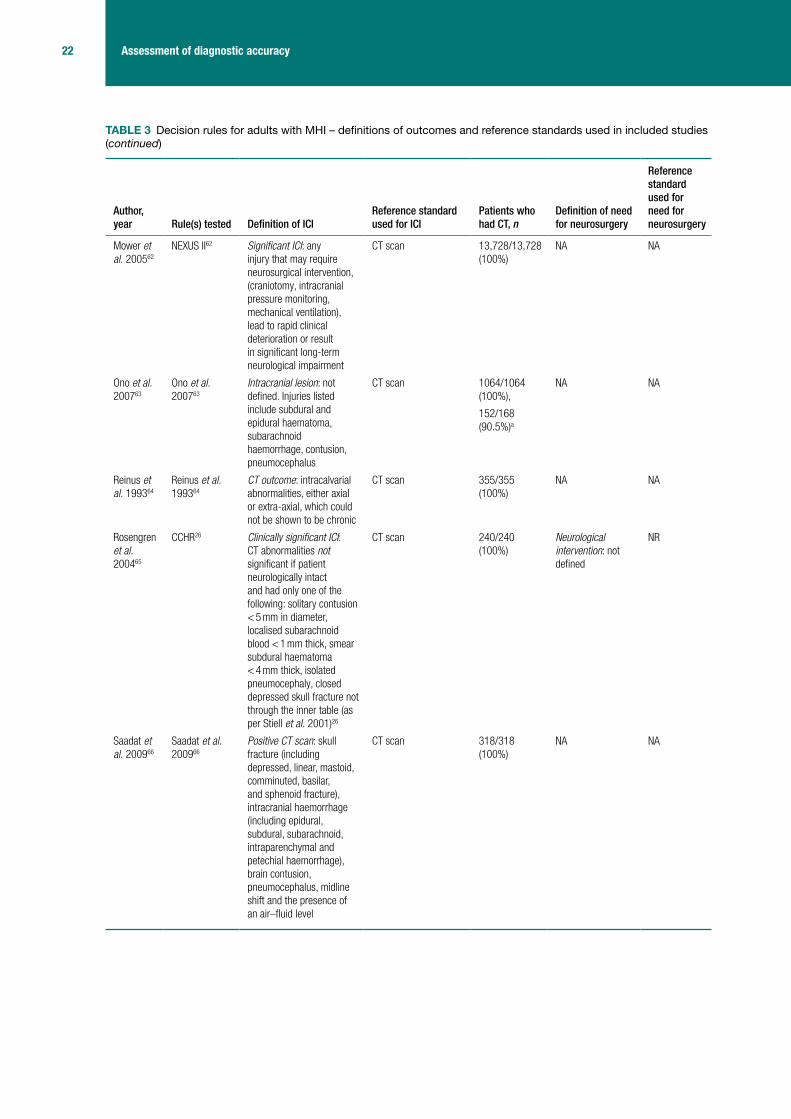
22 Assessment of diagnostic accuracy
Author, year Rule(s) tested Definition of ICI
Reference standard used for ICI
Patients who had CT, n
Definition of need for neurosurgery
Reference standard used for need for neurosurgery
Mower et al. 200562
NEXUS II62 Significant ICI: any injury that may require neurosurgical intervention, (craniotomy, intracranial pressure monitoring, mechanical ventilation), lead to rapid clinical deterioration or result in significant long-term neurological impairment
CT scan 13,728/13,728 (100%)
NA NA
Ono et al. 200763
Ono et al. 200763
Intracranial lesion: not defined. Injuries listed include subdural and epidural haematoma, subarachnoid haemorrhage, contusion, pneumocephalus
CT scan 1064/1064 (100%),
152/168 (90.5%)a
NA NA
Reinus et al. 199364
Reinus et al. 199364
CT outcome: intracalvarial abnormalities, either axial or extra-axial, which could not be shown to be chronic
CT scan 355/355 (100%)
NA NA
Rosengren et al. 200465
CCHR26 Clinically significant ICI: CT abnormalities not significant if patient neurologically intact and had only one of the following: solitary contusion < 5 mm in diameter, localised subarachnoid blood < 1 mm thick, smear subdural haematoma < 4 mm thick, isolated pneumocephaly, closed depressed skull fracture not through the inner table (as per Stiell et al. 2001)26
CT scan 240/240 (100%)
Neurological intervention: not defined
NR
Saadat et al. 200966
Saadat et al. 200966
Positive CT scan: skull fracture (including depressed, linear, mastoid, comminuted, basilar, and sphenoid fracture), intracranial haemorrhage (including epidural, subdural, subarachnoid, intraparenchymal and petechial haemorrhage), brain contusion, pneumocephalus, midline shift and the presence of an air–fluid level
CT scan 318/318 (100%)
NA NA
TABLE 3 Decision rules for adults with MHI – definitions of outcomes and reference standards used in included studies (continued)

© Queen’s Printer and Controller of HMSO 2011. This work was produced by Pandor et al. under the terms of a commissioning contract issued by the Secretary of State for Health.
23 Health Technology Assessment 2011; Vol. 15: No. 27DOI: 10.3310/hta15270
Author, year Rule(s) tested Definition of ICI
Reference standard used for ICI
Patients who had CT, n
Definition of need for neurosurgery
Reference standard used for need for neurosurgery
Saboori et al. 200767
Saboori et al. 200767
Intracranial lesion: all acute abnormal finding on CT
Normal CT: discharged with advice to return if symptoms occur, 1-week follow-up call
Abnormal CT: admission, treatment. Evaluation at 2 weeks and 1 month after discharge
682/682 (100%)
NA NA
Smits et al. 200568–70
CCHR,26 NOC,27 Dutch, NCWFNS,72 EFNS,79 NICE,19 SIGN, 78 Scandinavian,73 CHIP69
Any neurocranial traumatic finding on CT: any skull or skull base fracture and any intracranial traumatic lesion
Smits et al. 2007 (CHIP derivation) definition differs: any intracranial traumatic findings on CT that included all neurocranial traumatic findings except for isolated linear skull fractures
CT scan 3181/3181 (100%)
1307/1307 (100%)b
Neurosurgery: a neurosurgical intervention was any neurosurgical procedure (craniotomy, intracranial pressure monitoring, elevation of depressed skull fracture or ventricular drainage) performed within 30 days of the event
Assume patient records
Stiell et al. 200126
CCHR26 Clinically important brain injury on CT: all injuries unless patient neurologically intact and had one of following: solitary contusion < 5 mm, localised subarachnoid blood < 1 mm thick, smear subdural haematoma < 4 mm thick, closed depressed skull fracture not through inner table
1. CT scan ordered on basis of judgement of physician in ED or result of follow-up telephone interview
2. Proxy telephone interview performed by registered nurse (24.4%). For those whose responses did not warrant recall for a CT scan this was the only reference standard
2078/3121 (67%)
Within 7 days: death due to head injury, craniotomy, elevation of skull fracture, intracranial pressure monitoring, intubation for head injury demonstrated on CT
Performance of neurosurgery as reported in patient records and 14-day follow-up telephone interview (interview 100% sensitive for need for neurosurgery)
Stiell et al. 200546
CCHR,26 NOC27 As per Stiell et al. 200126 As per Stiell et al. 200126
2171/2707 (80.2%)
1378/1822 (75.6%)b
As per Stiell et al. 200126
As per Stiell et al. 200126
CHIP, CT in Head Injury Patients; EFNS, European Federation of Neurological Societies; ICD, International Classification of Diseases; NA, not applicable; NCWFNS, Neurotraumatology Committee of the World Federation of Neurosurgical Societies; NEXUS II, National Emergency X-Radiography Utilization Study II; NR, not reported.a Different cohort of data.b Subset of cohort.
TABLE 3 Decision rules for adults with MHI – definitions of outcomes and reference standards used in included studies (continued)

24 Assessment of diagnostic accuracy
Children and infantsThe design and patient characteristics of the 14 studies (representing 16 papers)30,81–95 that evaluated the diagnostic performance of clinical decision rules for identifying ICI or need for neurosurgery in children and/or infants with MHI are summarised in Table 4. Six studies82,84–86,90,91,93,95 recruited only infants or reported a subset of infants-only data. Eight studies were from the USA,82,84–6,88,90,91,93–95 one from the USA and Canada,81 and one each from Italy,83 the UK,30 Turkey,87 Finland89 and Canada.92 Nine studies30,81–87,89,90,92–94 derived a new rule or rules and five validated existing rules.30,88–91,95 Three studies both derived and validated rules.30,89,90 Six studies30,81,83,90–92,95 were multicentre studies. Eleven studies30,81,83–86,88,90–95 were prospective, one of which used a convenience sample,81 seven83–86,88,91,92,94,95 of which recruited consecutive patients, and three30,90,93 did not report how the sample was recruited. Three further studies82,87,89 used retrospective data. Two studies30,90 were very large with cohorts over 20,000. The smallest study was 97 patients.82
The median value for the prevalence of neurosurgery was 1.2% (IQR 0.2% to 1.4%). The median value for the prevalence of ICI was 6.5% (IQR 1.0% to 9.8%). Cohorts were not similar in terms of inclusion and exclusion criteria. For studies of children, the upper age limit ranged between 1630,83,87,89,92 and 21 years,81 and the lower limit between 081 and 5 years.88 For infants, the upper age limit was usually 2 years, but in one case was 3 years82 of age. Eight studies30,83–85,89,91,93–95 included all severities of head injury; six81,82,87,88,90,92 recruited those with MHI. Two of these studies reported results for a MHI subset of the larger cohort.86,93 Five studies excluded those with trivial head injury and/or recruited only those with clinical characteristics consistent with head trauma.88,90,92,93,94 Six studies81,84,87,88,91,94 included only those who had a CT scan and two reported a subset, all of whom underwent CT.86,93 Selection of patients on the basis of having had a CT scan and exclusion on the basis of trivial injury or not presenting with clinical characteristics is likely to recruit a patient spectrum with greater risk of ICI.
Definitions of outcomes and the reference standards used varied across studies (Table 5). The predominant differences in outcome definition for ICI involve the perception of clinical significance, with four cohorts30,89–91,95 having this defined and the remaining ten studies81–88,92–94 failing to define a positive outcome or just identifying any common acute lesion. The reference standards used where CT was not possible for all, and was not an inclusion criterion, usually comprised telephone follow-up, review of hospital records or both. The length of follow-up for neurosurgery varied from being not reported to following up until discharge, which may not capture all neurosurgical procedures leading to inaccurate estimations of diagnostic accuracy. Definitions of surgical lesions also varied or were not reported, but most definitions included haematoma evacuation and intracranial pressure monitoring; only one mentioned elevation of skull fracture explicitly.

© Queen’s Printer and Controller of HMSO 2011. This work was produced by Pandor et al. under the terms of a commissioning contract issued by the Secretary of State for Health.
25 Health Technology Assessment 2011; Vol. 15: No. 27DOI: 10.3310/hta15270
TAB
LE 4
Dec
isio
n ru
les
for
child
ren
and
infa
nts
with
MH
I – s
tudy
des
ign
and
patie
nt c
hara
cter
istic
s of
incl
uded
stu
dies
Author, year
Rule(s) derived
Rule(s) validated
Country
Design
No. of patients, n
Mean or median age, years (range)
Prevalence of neurosurgery
Prevalence of ICI
CT as inclusion? (yes/no)
Male, n
Patients with MHI, n
Prevalence of GCS 15, n
Other significant inclusion criteria
Other significant exclusion criteria
Atab
aki e
t al.
2008
81
Atab
aki e
t al.
2008
81
USA,
Ca
nada
P, Cv
1000
Mea
n: 8
.9
year
s (N
R)6/
1000
(0
.6%
)65
/ 100
0 (6
.5%
)Ye
s64
1/ 10
00
(64.
1%)
1000
/ 10
00
(100
%)
852/
1000
(8
5.2%
)Bi
rth to
21
year
s. C
lose
d he
ad tr
aum
a,
unde
rgoi
ng C
T
Prio
r CT
at re
ferri
ng
hosp
ital,
GCS
< 1
3
Buch
anic
h 20
0782
Buch
-ani
ch
2007
USA
R97
Mea
n: 1
5.2
mon
ths
(NR)
22/ 9
7 (2
2.7%
)No
97/
97(1
00%
)NR
< 3
yea
rs o
ld.
GCS
14–1
5Pe
netra
ting
inju
ries,
dep
ress
ed
skul
l fra
ctur
es,
inte
ntio
nal i
njur
ies,
CT
sca
n >
24
hour
s af
ter i
njur
y
Da D
alt e
t al.
2006
83
Da D
alt e
t al.
2006
83
Italy
P, Cs
3806
NR22
/ 380
6 (0
.6%
)No
2315
/ 38
06
(60.
8%)
NR14
or
norm
al
valu
e fo
r age
; 37
49/
3800
(9
8.7%
)
< 1
6 ye
ars,
hi
stor
y of
blu
nt
head
trau
ma
of
any
seve
rity
Adm
itted
> 2
4 ho
urs
afte
r tra
uma,
op
en in
jurie
s,
prev
ious
his
tory
of
neu
rolo
gica
l di
sord
ers
or
blee
ding
dia
thes
is
Diet
rich
et
al. 1
99384
Diet
rich
et a
l. 19
9384
USA
P, Cs
166a
NR fo
r thi
s su
bgro
upa
16/ 1
66
(9.6
4%)a
Yesa
NR fo
r th
is
subg
roup
a
NR fo
r th
is
subg
roup
a
NR fo
r th
is
subg
roup
a
≥ 2
yea
rs to
20
yea
rs, h
ead
traum
a, w
ith C
T sc
ana
Unab
le to
ans
wer
qu
estio
ns b
ecau
se
of a
ge o
r alte
red
men
tal s
tatu
sa
71a
NR fo
r thi
s su
bgro
upa
3/ 71
(4
.2%
)a
Yesa
NR fo
r th
is
subg
roup
a
NR fo
r th
is
subg
roup
a
NR fo
r th
is
subg
roup
a
< 2
yea
rs, a
s ab
ovea
As a
bove
a
Dunn
ing
et
al. 2
00630
CHAL
ICE30
RCS
guid
elin
es96
UKP, NR
22,7
72M
ean:
5.7
(N
R)13
7/
22,7
72
(0.6
%)
168/
22
,579
(0
.744
%)
No14
,767
/ 22
,772
(6
4.8%
)
22,2
98/
22,7
72
(97.
9%)
21,9
96/
22,7
72
(96.
6%)
< 1
6 ye
ars.
Hi
stor
y/ si
gns
of in
jury
to
the
head
. LOC
or
am
nesi
a w
as n
ot a
re
quire
men
t
Refu
sal t
o co
nsen
t to
ent
ry in
to th
e st
udy
cont
inue
d

26 Assessment of diagnostic accuracy
Author, year
Rule(s) derived
Rule(s) validated
Country
Design
No. of patients, n
Mean or median age, years (range)
Prevalence of neurosurgery
Prevalence of ICI
CT as inclusion? (yes/no)
Male, n
Patients with MHI, n
Prevalence of GCS 15, n
Other significant inclusion criteria
Other significant exclusion criteria
Gree
nes
and
Schu
tzm
an
1999
,85
b 200
186
Gree
nes
and
Schu
tzm
an
1999
85
USA
P, Cs
608
Mea
n: 1
1.2
mon
ths ±
6.
8 m
onth
s (N
R)
63/ 6
08
(10%
)No
344/
608
(57%
)NR
NR<
2 y
ears
. He
ad tr
aum
a (s
ympt
omat
ic
and
asym
ptom
atic
)
NR
b Gre
enes
an
d Sc
hutz
man
20
0186
172b
Mea
n: 1
1.6
mon
ths
(3 d
ays
to
23 m
onth
s)b
13/ 1
72
(7.6
%)b
Yesb
NRb
100%
(a
ssum
ed
from
in
clus
ion
crite
ria)b
NRb
Asym
ptom
atic
su
bset
of a
bove
co
hort.
With
he
ad C
T sc
anb
Sym
ptom
atic
b pa
tient
s w
ith a
ny
of h
isto
ry o
f LOC
, le
thar
gy, i
rrita
bilit
y,
seizu
res,
thre
e or
m
ore
epis
odes
of
emes
is, i
rrita
bilit
y or
dep
ress
ed
men
tal s
tatu
s,
bulg
ing
font
anel
le,
abno
rmal
vita
l si
gns
indi
catin
g in
crea
sed
intra
cran
ial
pres
sure
or f
ocal
ne
urol
ogic
al
findi
ngs
Guze
l et a
l. 20
0987
Guze
l et a
l. 20
0987
Turk
eyR
337
NR67
/ 337
(1
9.9%
)Ye
s (a
pplie
d at
dat
a ex
tract
ion
stag
e)
223/
337
(66.
2%)
337/
337
(100
%)
304/
337
(90.
2%),
< 1
6 ye
ars.
GCS
13
–15.
Had
CT
(app
lied
at
data
ext
ract
ion
stag
e)
> 1
6 ye
ars,
m
oder
ate
or s
ever
e he
ad in
jury
, no
clea
r his
tory
of
traum
a, o
bvio
us
pene
tratin
g sk
ull
inju
ry, u
nsta
ble
vital
sig
ns, s
eizu
re
befo
re a
sses
smen
t, bl
eedi
ng d
isor
der/
antic
oagu
lant
s,
reat
tend
ance
s
TAB
LE 4
Dec
isio
n ru
les
for
child
ren
and
infa
nts
with
MH
I – s
tudy
des
ign
and
patie
nt c
hara
cter
istic
s of
incl
uded
stu
dies
(con
tinue
d)

© Queen’s Printer and Controller of HMSO 2011. This work was produced by Pandor et al. under the terms of a commissioning contract issued by the Secretary of State for Health.
27 Health Technology Assessment 2011; Vol. 15: No. 27DOI: 10.3310/hta15270
Author, year
Rule(s) derived
Rule(s) validated
Country
Design
No. of patients, n
Mean or median age, years (range)
Prevalence of neurosurgery
Prevalence of ICI
CT as inclusion? (yes/no)
Male, n
Patients with MHI, n
Prevalence of GCS 15, n
Other significant inclusion criteria
Other significant exclusion criteria
Hayd
el a
nd
Sche
mbe
kar
2003
88
Noc27
USA
P, Cs
175
Mea
n: 1
2.8
(rang
e NR
)6/
175
(3.4
%)
14/ 1
75
(8%
)Ye
s 11
4/ 17
5 (6
7%)
100%
(a
ssum
ed
from
in
clus
ion
crite
ria)
175/
175
(100
%)
5–17
yea
rs.
With
in 2
4 ho
urs
of in
jury
, blu
nt
traum
a w
ith
LOC,
non
-triv
ial
mec
hani
sm o
f in
jury
, CT
scan
Trivi
al in
jurie
s,
refu
sed
CT,
conc
urre
nt in
jurie
s pr
eclu
ded
CT,
irrita
ble
or a
gita
ted
(GCS
< 1
5)
Klem
etti
et
al. 2
00989
Klem
etti
et
al. 2
00989
CHAL
ICE,
30
NEXU
S II,
62
UCD93
Finl
and
R48
5NR
83/ 4
85
(17.
1%)
No
313/
485
(65%
)NR
NR≤
16
year
s.
Adm
itted
to
paed
iatri
cs
(usu
ally
hosp
italis
ed
even
afte
r MHI
), hi
stor
y of
hea
d tra
uma.
Pat
ient
s id
entifi
ed b
y re
fere
nce
to
disc
harg
e di
agno
sis
NR
cont
inue
d

28 Assessment of diagnostic accuracy
Author, year
Rule(s) derived
Rule(s) validated
Country
Design
No. of patients, n
Mean or median age, years (range)
Prevalence of neurosurgery
Prevalence of ICI
CT as inclusion? (yes/no)
Male, n
Patients with MHI, n
Prevalence of GCS 15, n
Other significant inclusion criteria
Other significant exclusion criteria
c Kup
perm
an
et a
l. 20
0990
c PEC
ARN
(≥ 2
yea
rs to
<
18
year
s)90
USA
P, NR25
,283
cNR
for t
his
subs
etc
215/
25
,283
(0
.9%
)c
Noc
NRc
25,2
83/
25,2
83
(100
%)c
24,5
63/
25,2
83
(97.
2%)c
≥ 2
yea
rs to
<
18
year
s.
Child
ren
pres
entin
g w
ithin
24
hour
s GC
S ≥
14c
Trivi
al in
jurie
s,
pene
tratin
g tra
uma,
kno
wn
brai
n tu
mou
rs,
pre-
exis
ting
neur
olog
ical
di
sord
ers,
or
neur
oim
agin
g be
fore
tran
sfer
. Co
agul
opat
hy,
shun
ts, G
CS <
14c
c PEC
ARN
(< 2
yea
rs)90
8502
c73
/ 850
2 (0
.9%
)c
Noc
NRc
8502
/ 85
02
(100
%)c
8136
/ 85
02
(95.
7%)c
As a
bove
, <
2 y
ears
c
As a
bove
c
PECA
RN
(2 y
ears
to
< 1
8 ye
ars)
90
6411
c11
/ 641
1 (0
.2%
)c
63/ 6
411
(1%
)c
Noc
NRc
6411
/ 64
11
(100
%)c
6248
/ 64
11
(97.
5%)c
As fo
r der
ivatio
n co
hortc
As fo
r der
ivatio
n co
hortc
PECA
RN
(< 2
yea
rs)90
2216
c5/
2216
(0
.2%
)c
25/ 2
216
(1.1
%)c
Noc
NRc
2216
/ 22
16
(100
%)c
2124
/ 22
16
(95.
8%)c
As fo
r der
ivatio
n co
hortc
As fo
r der
ivatio
n co
hortc
TAB
LE 4
Dec
isio
n ru
les
for
child
ren
and
infa
nts
with
MH
I – s
tudy
des
ign
and
patie
nt c
hara
cter
istic
s of
incl
uded
stu
dies
(con
tinue
d)

© Queen’s Printer and Controller of HMSO 2011. This work was produced by Pandor et al. under the terms of a commissioning contract issued by the Secretary of State for Health.
29 Health Technology Assessment 2011; Vol. 15: No. 27DOI: 10.3310/hta15270
Author, year
Rule(s) derived
Rule(s) validated
Country
Design
No. of patients, n
Mean or median age, years (range)
Prevalence of neurosurgery
Prevalence of ICI
CT as inclusion? (yes/no)
Male, n
Patients with MHI, n
Prevalence of GCS 15, n
Other significant inclusion criteria
Other significant exclusion criteria
d Om
an
2006
;91 d S
un
et a
l. 20
0795
d NEX
US II
,62
UCD93
USA
P, Cs
1666
dNR
d13
8/ 16
66
(8.3
%)d
Yesd
1072
/ 16
66
(64%
)d
NRd
NRd
< 1
8 ye
ars.
Ha
d CT
sca
n (p
hysi
cian
s di
scre
tion)
, ac
ute
blun
t he
ad tr
aum
ad
Dela
yed
pres
enta
tion,
w
ithou
t blu
nt
traum
a (p
enet
ratin
g tra
uma)
d
d NEX
US II
9130
9d25
/ 309
(8
.1%
)d
Yesd
170/
309
(55%
)d
NRd
NRd
Subs
et o
f abo
ve,
< 3
yea
rs o
f ag
ed
As a
bove
d
d UCD
9520
8d7/
208
(3.4
%)d
Yesd
NR fo
r th
is
subg
roup
d
NRd
NRd
Subs
et o
f abo
ve,
< 2
yea
rs o
f ag
ed
As a
bove
d
Osm
ond
et
al. 2
00692
CATC
H fo
r IC
I,92 C
ATCH
fo
r Neu
ro-
surg
ery92
Cana
daP,
Cs37
81M
ean:
9.2
(N
R)27
/ 378
1 (0
.7%
)17
0/ 37
81
(4.5
%)
No
2458
(6
5%)
3781
/ 37
81
(100
%)
3414
/ 37
81
(90.
3%)
≤ 1
6 ye
ars.
GC
S 13
–15,
do
cum
ente
d LO
C, a
mne
sia,
di
sorie
ntat
ion,
pe
rsis
tent
vo
miti
ng o
r irr
itabi
lity
(if
≤ 2
yea
rs o
f ag
e)e
NR
cont
inue
d

30 Assessment of diagnostic accuracy
Author, year
Rule(s) derived
Rule(s) validated
Country
Design
No. of patients, n
Mean or median age, years (range)
Prevalence of neurosurgery
Prevalence of ICI
CT as inclusion? (yes/no)
Male, n
Patients with MHI, n
Prevalence of GCS 15, n
Other significant inclusion criteria
Other significant exclusion criteria
Palc
hak
et
al. 2
00393
UCD
(neu
ro-
surg
ery)
,93
UCD
(inte
rven
tion
or b
rain
in
jury
)93
USA
P, NR20
43M
ean:
8.
3 ±
5.3
(1
0 da
ys to
17
.9 y
ears
)
29/ 2
043
(1.4
%)
No13
23/
2043
(6
5%)
NRGC
S 14
or
15:
18
59/
2043
(9
1%)
< 1
8 ye
ars.
Hi
stor
y of
non
-tri
vial b
lunt
he
ad tr
aum
a w
ith fi
ndin
gs
cons
iste
nt w
ith
head
trau
ma:
LO
C, a
mne
sia,
se
izure
s,
vom
iting
, cu
rrent
he
adac
he,
dizz
ines
s,
naus
ea o
r vis
ion
chan
ge
or p
hysi
cal
exam
inat
ion
findi
ngs
of
abno
rmal
m
enta
l st
atus
, foc
al
neur
olog
ical
de
ficits
, clin
ical
si
gns
of s
kull
fact
ure
or s
calp
tra
uma
Trivi
al in
jurie
s,
neur
oim
agin
g be
fore
tran
sfer
UCD
(TBI
)9310
98NR
for t
his
subs
et39
/ 109
8 (3
.6%
)Ye
sNR
for
this
su
bset
1098
/ 10
98
(100
%)
GCS
14
or 1
5:
1098
/ 10
98
(100
%)
Subs
et o
f abo
ve
coho
rt; G
CS
14–1
5 an
d ha
d CT
sca
n on
ly
As a
bove
UCD
(TBI
)9319
4NR
for t
his
subs
et15
/ 194
(7
.73%
)Ye
sNR
for
this
su
bset
194/
194
(100
%)
NR fo
r th
is
subs
et
Subs
et o
f abo
ve
coho
rt (h
ad C
T sc
an G
CS 1
4 or
15
), ≤
2 y
ears
As a
bove
TAB
LE 4
Dec
isio
n ru
les
for
child
ren
and
infa
nts
with
MH
I – s
tudy
des
ign
and
patie
nt c
hara
cter
istic
s of
incl
uded
stu
dies
(con
tinue
d)
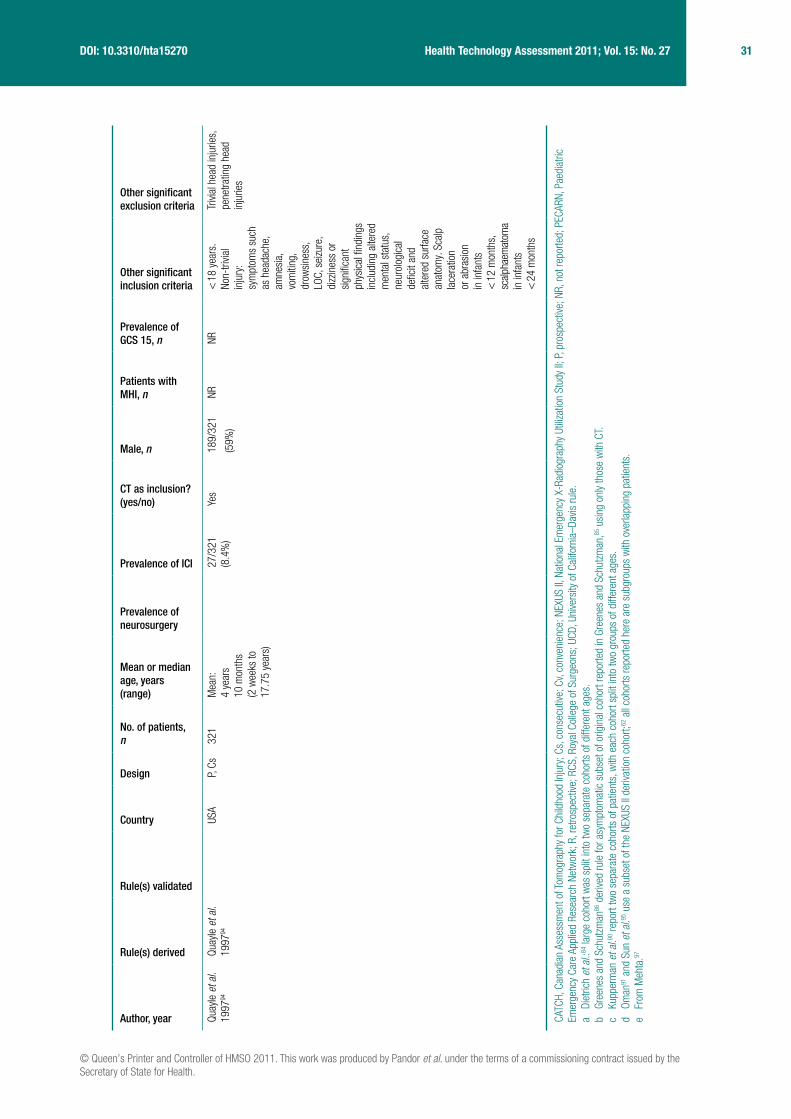
© Queen’s Printer and Controller of HMSO 2011. This work was produced by Pandor et al. under the terms of a commissioning contract issued by the Secretary of State for Health.
31 Health Technology Assessment 2011; Vol. 15: No. 27DOI: 10.3310/hta15270
Author, year
Rule(s) derived
Rule(s) validated
Country
Design
No. of patients, n
Mean or median age, years (range)
Prevalence of neurosurgery
Prevalence of ICI
CT as inclusion? (yes/no)
Male, n
Patients with MHI, n
Prevalence of GCS 15, n
Other significant inclusion criteria
Other significant exclusion criteria
Quay
le e
t al.
1997
94
Quay
le e
t al.
1997
94
USA
P, Cs
321
Mea
n:
4 ye
ars
10
mon
ths
(2 w
eeks
to
17.7
5 ye
ars)
27/ 3
21
(8.4
%)
Yes
189/
321
(59%
)
NRNR
< 1
8 ye
ars.
No
n-tri
vial
inju
ry:
sym
ptom
s su
ch
as h
eada
che,
am
nesi
a,
vom
iting
, dr
owsi
ness
, LO
C, s
eizu
re,
dizz
ines
s or
si
gnifi
cant
ph
ysic
al fi
ndin
gs
incl
udin
g al
tere
d m
enta
l sta
tus,
ne
urol
ogic
al
defic
it an
d al
tere
d su
rface
an
atom
y. S
calp
la
cera
tion
or a
bras
ion
in in
fant
s <
12
mon
ths,
sc
alp h
aem
atom
a in
infa
nts
< 2
4 m
onth
s
Trivi
al h
ead
inju
ries,
pe
netra
ting
head
in
jurie
s
CATC
H, C
anad
ian
Asse
ssm
ent o
f Tom
ogra
phy
for C
hild
hood
Inju
ry; C
s, c
onse
cutiv
e; C
v, co
nven
ienc
e; N
EXUS
II, N
atio
nal E
mer
genc
y X-
Radi
ogra
phy
Utiliz
atio
n St
udy
II; P
, pro
spec
tive;
NR,
not
repo
rted;
PEC
ARN,
Pae
diat
ric
Emer
genc
y Ca
re A
pplie
d Re
sear
ch N
etw
ork;
R, r
etro
spec
tive;
RCS
, Roy
al C
olle
ge o
f Sur
geon
s; U
CD, U
nive
rsity
of C
alifo
rnia
–Dav
is ru
le.
a Di
etric
h et
al.:
84 la
rge
coho
rt w
as s
plit
into
two
sepa
rate
coh
orts
of d
iffer
ent a
ges.
b Gr
eene
s an
d Sc
hutz
man
86 d
erive
d ru
le fo
r asy
mpt
omat
ic s
ubse
t of o
rigin
al c
ohor
t rep
orte
d in
Gre
enes
and
Sch
utzm
an,85
usi
ng o
nly
thos
e w
ith C
T.c
Kupp
erm
an e
t al.90
repo
rt tw
o se
para
te c
ohor
ts o
f pat
ient
s, w
ith e
ach
coho
rt sp
lit in
to tw
o gr
oups
of d
iffer
ent a
ges.
d Om
an91
and
Sun
et a
l.95 u
se a
sub
set o
f the
NEX
US II
der
ivatio
n co
hort;
62 a
ll co
horts
repo
rted
here
are
sub
grou
ps w
ith o
verla
ppin
g pa
tient
s.e
From
Meh
ta.97

32 Assessment of diagnostic accuracy
TABLE 5 Decision rules for children and infants with MHI: definitions of outcomes and reference standards used in included studies
Author, yearRule(s) tested Definition of ICI
Reference standard used for ICI
Patients who had CT, n
Definition of need for neurosurgery
Reference standard used for need for neurosurgery
Atabaki et al. 200881
Atabaki et al. 200881
ICI: subdural, epidural, subarachnoid, intraparenchymal and intraventricular haemorrhages as well as contusion and cerebral oedema
CT scan 1000/1000 (100%)
Neurosurgery, including craniotomy, craniectomy, evacuation or intracranial pressure monitoring
Medical record review (unclear when performed)
Buchanich 200782
Buchanich 200782
ICI: intracranial haematoma, intracranial haemorrhage, cerebral contusion and/or cerebral oedema
CT scan
Follow-up questionnaire/telephone interview
97/97 (100%) NA NA
Da Dalt et al. 200683
Da Dalt et al. 200683
ICI: identified on CT either at initial ER presentation or during any hospital admission or readmission
CT scan obtained at discretion of treating physician
All children discharged immediately from ER or after short observation received a follow-up telephone interview approximately 10 days later. Hospital records were checked for readmissions for 1 month after conclusion of study
79/3806 (2%) NA NA
Dietrich et al. 199384
Dietrich et al. 199384
Intracranial pathology: epidural or subdural haematoma, cerebral contusions or lacerations, intraventricular haemorrhage pneumocephaly or cerebral oedema, with or without skull fracture
CT scan 166/166 (100%)
71/71 (100%)a
NA NA
Dunning et al. 200630
CHALICE,30 RCS guidelines96
Clinically significant ICI: death as a result of head injury, requirement for neurosurgical intervention or marked abnormalities on the CT scan
All patients treated according to RCS guidelines. This recommends admission for those at high risk and CT scan for those at highest risk
Follow-up: all patients who were documented as having had a skull radiograph, admission to hospital, CT scan or neurosurgery were followed up
744/22,772 (3.3%)
NR NR, assume as for ICI

© Queen’s Printer and Controller of HMSO 2011. This work was produced by Pandor et al. under the terms of a commissioning contract issued by the Secretary of State for Health.
33 Health Technology Assessment 2011; Vol. 15: No. 27DOI: 10.3310/hta15270
Author, yearRule(s) tested Definition of ICI
Reference standard used for ICI
Patients who had CT, n
Definition of need for neurosurgery
Reference standard used for need for neurosurgery
Greenes and Schutzman 1999,85 200186
Greenes and Schutzman 1999,85 200186
Greenes and Schutzman 199985
ICI: acute intracranial haematoma, cerebral contusion and/or diffuse brain swelling evident on head CT
Greenes and Schutzman 200186
ICI: cerebral contusion, cerebral oedema or intracranial haematoma noted on CT
Greenes and Schutzman 199985
CT scan, follow-up calls, review of medical records
Greenes and Schutzman 200186
CT scan
188/608 (31%). 73 symptomatic patients did not receive CT85
b172/172 (100%)86
NA NA
Guzel et al. 200987
Guzel et al. 200987
Positive CT scan: definition NR
CT scan 337/337 (100%)
NA NA
Haydel and Schembekar 200388
NOC27 ICI on head CT: any acute traumatic intracranial lesion, including subdural epidural or parenchymal haematoma, subarachnoid haemorrhage, cerebral contusion or depressed skull fracture
CT scan 175/175 (100%)
Need for neurosurgical or medical intervention in patients with ICI on CT
All patients with abnormal CT scan admitted and followed until discharge
Klemetti et al. 200989
Klemetti et al. 2009,89 CHALICE,30 NEXUS II,62 UCD93
Complicated or severely complicated head trauma: brain contusion, skull base fracture, skull fracture. Patients who required neurosurgical intervention, patients who succumbed, epidural haematoma, subdural haematoma, subarachnoid haematoma, intracerebral haematoma
Hospital records 242/485 (49.9%)
NA NA
Kupperman et al. 200990
Kupperman et al. 200990
Clinically important brain injury: death from TBI, neurosurgery, intubation for > 24 hours for TBI, or hospital admission of two nights or more associated with TBI on CT. Brief intubation for imaging and overnight stay for minor CT findings not included
CT scans, medical records, and telephone follow-up.
Those admitted: medical records, CT scan results
Those discharged: telephone survey 7 to 90 days after the ED visit, and medical records and county morgue records check for those uncontactable
9420/25,283 (37.3%)c
2632/8502 (31.0%)c
2223/6411 (34.7%)c
694/2216 (31.3%)c
NR NR for neurosurgery. Assume as for ICI
Oman 2006;91 aSun et al. 200795
NEXUS II,62 UCD93
Clinically important/significant ICI: any injury that may require neurosurgical intervention, lead to rapid clinical deterioration, or result in significant long-term neurological impairment
CT scan 1666/1666 (100%)d
309/309 (100%)d
208/208 (100%)d
NA NA
continued
TABLE 5 Decision rules for children and infants with MHI: definitions of outcomes and reference standards used in included studies (continued)

34 Assessment of diagnostic accuracy
Quality of included studiesAdultsThe methodological quality assessment of each included study is summarised in Figures 2 and 3. Overall, most of the included studies were well reported and generally satisfied the majority of the quality assessment items of the QUADAS tool, but with notable exceptions.54–57,71 Despite poor reporting of the reference standards in most studies, the main source of variation was for patient spectrum, which will affect comparability across cohorts and application of conclusions to practice.
The spectrum of patients was appropriate in only one study,66 was unclear in three studies54,56,60 and did not completely match the desired patient spectrum in the remaining 15 studies, often because patients were selected on the basis of having a clinical characteristic at presentation (Table 2). Although 11 studies carried out CT in all participants,27,55,58–65,67 they did not state whether CT was performed within 24 hours and were therefore rated as unclear for the ICI reference standard quality assessment item. A further three cohorts performed CT on all
Author, yearRule(s) tested Definition of ICI
Reference standard used for ICI
Patients who had CT, n
Definition of need for neurosurgery
Reference standard used for need for neurosurgery
Osmond et al. 200692
CATCH92 Brain injury CT scan
14-day telephone interview
NR Neurosurgery: craniotomy, elevation of skull fracture, intubation, intracranial pressure monitor and/or anticonvulsants within 7 dayse
NR
Palchak et al. 200393
UCD93 TBI identified on CT scan or TBI requiring acute intervention or intervention by one or more of: neurosurgical procedure, ongoing antiepileptic pharmacotherapy beyond 7 days, the presence of a neurological deficit that persisted until discharge from the hospital, or two or more nights of hospitalisation because of treatment of the head injury
CT or performance of intervention
1271/2043 (62.2%)
1098/1098 (100%)
194/194 (100%)
Need for neurosurgical intervention
NR
Quayle et al. 199794
Quayle et al. 199794
ICI: definition NR CT scan 321/321 (100%)
NA NA
CATCH, Canadian Assessment of Tomography for Childhood Injury; Cs, consecutive; Cv, convenience; NA, not applicable; NEXUS II, National Emergency X-Radiography Utilization Study II; NR, not reported; P, prospective; PECARN, Paediatric Emergency Care Applied Research Network; R, retrospective; RCS, Royal College of Surgeons; UCD, University of California–Davis rule.a Dietrich et al.:84 large cohort was split into two separate cohorts of different ages.b Greenes and Schutzman86 derived rule for asymptomatic subset of original cohort reported in Greenes and Schutzman,85 using only those
with CT.c Kupperman et al.90 report two separate cohorts of patients, with each cohort split into two groups of different ages.d Oman91 and Sun et al.95 use a subset of the NEXUS II derivation cohort;62 all cohorts reported here are subgroups with overlapping patients.e From Mehta.97
TABLE 5 Decision rules for children and infants with MHI: definitions of outcomes and reference standards used in included studies (continued)

© Queen’s Printer and Controller of HMSO 2011. This work was produced by Pandor et al. under the terms of a commissioning contract issued by the Secretary of State for Health.
35 Health Technology Assessment 2011; Vol. 15: No. 27DOI: 10.3310/hta15270
participants within 24 hours and so scored well.29,66,68–70 The remaining five studies did not perform CT in all participants and so scored negatively for this item.26,46,54,56,57 The reference standard for neurosurgery was not reported for two studies54,68–70 and not considered adequate in the remaining six.26,29,46,57,59,65,71 This was usually because not all patients were followed up.
Partial verification bias was largely avoided, with only two cohorts scoring unclear54 or negatively.57,71 However, these two cohorts were large, and one reported results for a number of rules.71 Partial verification bias may be more of an issue for the neurosurgery data as no cohort scored well. Differential verification bias for ICI may have affected results in the same large cohort reporting several rules.57,71 Here participants received different reference standards according to clinical characteristics at presentation or the judgement of the treating physician. Criteria for CT were identical to the rule being tested in the case of the Neurotraumatology Committee of the World Federation of Neurosurgical Societies (NCWFNS)72 rule. In four cases26,46,54,56 it was unclear, although the majority avoided differential verification bias. For neurosurgery, it was unclear if differential verification bias was avoided in six cohorts26,46,54,57,65,68–71 and was scored negatively in two cohorts.29,59
The execution of the index test was well described in all studies. The execution of the reference standards (either one or both) was not reported well in nine studies54–59,63,65,68 and scored negatively for this item. Diagnostic and test review biases may affect results as less than half of the studies scored well for blinding; the index test was interpreted blind in eight cases,26,27,29,46,58,62,64,66, but blinding status was unclear in 11.54–57,59,60,61,63,65,67–70 The reference standard was interpreted blind in seven cases,26,46,60–62,66,67 and was not interpreted blind in two cases;64,68–70 blinding status
was unclear in ten cases.27,29,54–59,63,65 Studies were of mixed quality for clinical review bias, with almost equal numbers scoring in each quality category. Information about uninterpretable results was only given in one study,64 with all other studies scoring unclear for this item. Studies scored well for withdrawals, with only four studies55,57,59,65,71 scoring unclear because it was not apparent whether all patients were accounted for at the end of the study.
Children and infantsThe methodological quality assessment of each included study is summarised in Figures 4 and 5. Overall, most of the included studies were poorly reported and did not satisfy the majority
Yes (high quality)UnclearNo (low quality)Not applicable
Appropriate spectrum composition?
Selection criteria clearly described?
Reference standard intracranial injury adequate?
Reference standard neurosurgery adequate?
Partial verification bias avoided intracranial injury?
Partial verification bias avoided neurosurgery?
Differential verification bias avoided intracranial injury?
Differential verification bias avoided neurosurgery?
Test execution details reported?
Reference standard execution details reported?
Test review bias avoided?
Diagnostic review bias avoided?
Clinical review bias avoided?
Uninterpretable results reported?
Withdrawals accounted for?
0% 25% 50% 100%75%
FIGURE 2 Decision rules for adults with MHI – methodological quality graph. Review authors’ judgements about each methodological quality item presented as percentages across all included studies.
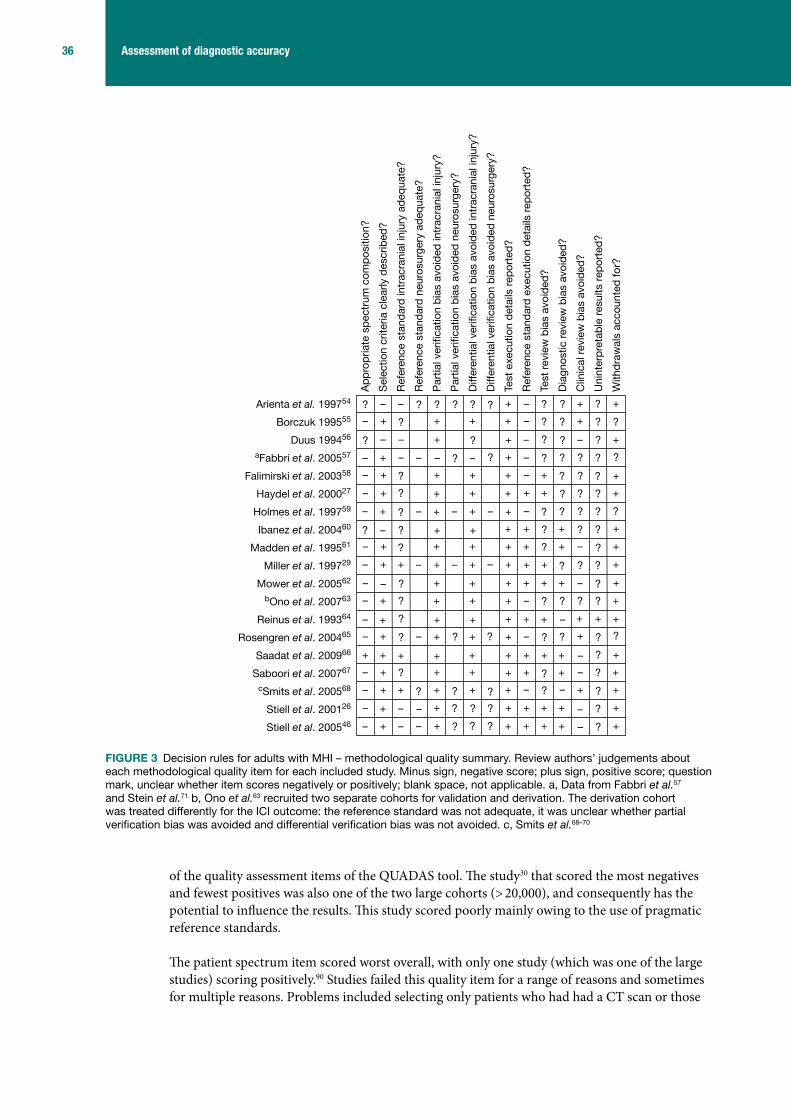
36 Assessment of diagnostic accuracy
of the quality assessment items of the QUADAS tool. The study30 that scored the most negatives and fewest positives was also one of the two large cohorts (> 20,000), and consequently has the potential to influence the results. This study scored poorly mainly owing to the use of pragmatic reference standards.
The patient spectrum item scored worst overall, with only one study (which was one of the large studies) scoring positively.90 Studies failed this quality item for a range of reasons and sometimes for multiple reasons. Problems included selecting only patients who had had a CT scan or those
Ap
pro
pria
te s
pec
trum
com
pos
ition
?
Sel
ectio
n cr
iteria
cle
arly
des
crib
ed?
Ref
eren
ce s
tand
ard
intr
acra
nial
inju
ry a
deq
uate
?
Ref
eren
ce s
tand
ard
neu
rosu
rger
y ad
equa
te?
Par
tial v
erifi
catio
n b
ias
avoi
ded
intr
acra
nial
inju
ry?
Par
tial v
erifi
catio
n b
ias
avoi
ded
neu
rosu
rger
y?
Diff
eren
tial v
erifi
catio
n b
ias
avoi
ded
intr
acra
nial
inju
ry?
Diff
eren
tial v
erifi
catio
n b
ias
avoi
ded
neu
rosu
rger
y?
Test
exe
cutio
n d
etai
ls r
epor
ted
?
Ref
eren
ce s
tand
ard
exe
cutio
n d
etai
ls r
epor
ted
?
Test
rev
iew
bia
s av
oid
ed?
Dia
gnos
tic r
evie
w b
ias
avoi
ded
?
Clin
ical
rev
iew
bia
s av
oid
ed?
Uni
nter
pre
tab
le r
esul
ts r
epor
ted
?
With
dra
wal
s ac
coun
ted
for?
Arienta et al. 199754
Borczuk 199555
Duus 199456
aFabbri et al. 200557
Falimirski et al. 200358
Haydel et al. 200027
Holmes et al. 199759
Ibanez et al. 200460
Madden et al. 199561
Miller et al. 199729
Mower et al. 200562
bOno et al. 200763
Reinus et al. 199364
Rosengren et al. 200465
Saadat et al. 200966
Saboori et al. 200767
cSmits et al. 200568
Stiell et al. 200126
Stiell et al. 200546
? ?–
–
+ ––
– ?
?
? + – ?
?
+–
+
–
+
++
––+
?
+
– +
+
+
+
+
+
+
–
–
? + ?
? +
?
+
+?
?
–
–
?
+ + +
+
+ –
+
+
?
+
?
++
+
–
?
+–
– + ?
? – ?
–
+
+
–+++
??
+
– ? +
+
?
?–+
?+––
+
+–
?
+ + ?
–
+
+
+
?
–
+
?
+
?
?
? ?
?
+ +
+
+? –
+
?–+
+??+
–
+
+
?
–
? ?
??
?
+??+
? +
+ ?–?
–
+ +
?–
+
++
– +
++–
– – ? + + +
+
+ +–
– + + ?
+++
– + +
?+–
– + ? +
?
?++
? ?
?
?
– ? +
?
+??
?
+
?
?
?
? ? ?
? +
+
+
+?
?
–
+
+ ?
–+
–
+?–+
+
– +
+
?
– ? +
+?–
+
++ ++?
+
?
–
FIGURE 3 Decision rules for adults with MHI – methodological quality summary. Review authors’ judgements about each methodological quality item for each included study. Minus sign, negative score; plus sign, positive score; question mark, unclear whether item scores negatively or positively; blank space, not applicable. a, Data from Fabbri et al.57 and Stein et al.71 b, Ono et al.63 recruited two separate cohorts for validation and derivation. The derivation cohort was treated differently for the ICI outcome: the reference standard was not adequate, it was unclear whether partial verification bias was avoided and differential verification bias was not avoided. c, Smits et al.68–70

© Queen’s Printer and Controller of HMSO 2011. This work was produced by Pandor et al. under the terms of a commissioning contract issued by the Secretary of State for Health.
37 Health Technology Assessment 2011; Vol. 15: No. 27DOI: 10.3310/hta15270
who presented with clinical characteristics, including patients with all severities of head injury, recruiting patients regardless of time since injury and using a retrospective design.
The reference standard for ICI was of a mixed standard: only three scored positively.84–86,94 Although, a further four81,87,88,91,95 did undertake CT in all participants, they failed to state whether this was within 24 hours and so scored unclear. The remaining seven studies scored negatively30,82,83,89,90,93 or unclear.92 This represents a potential source of bias. Equally, the reference standards for neurosurgery scored negatively or unclear in all but one study.93
Studies were well reported in terms of description of selection criteria and test execution details, with 1230,81–88,90,92–94 and 1130,81–88,90,91,93 studies, respectively, reporting these criteria adequately. Descriptions of the execution of the reference standard were mixed, with just over half scoring well.30,81,82,84–86,88,89,91,95 Uninterpretable results were not reported in 10 studies81–83,85,86,88,92,93 and so scored unclear for this item.
Partial verification bias was generally avoided (11 studies scored well)81–91,94,95 for ICI where a reference standard was applied to all participants, but not for neurosurgical outcomes, for which only one study scored well.81 The picture was less clear for differential verification bias of ICI, with three scoring negatively30,83,88 and almost equal numbers scoring well81,84–87,91,94,95 and unclear82,89,90,92,93 where, for example, it was not clear whether or not clinical characteristics (index test) may have contributed to the decision to give CT rather than follow-up as a reference standard. There is some potential for this bias to affect the results, especially as neither large cohort30,90 scored well. For neurosurgical outcomes only one study scored well.81 Blinding was generally poorly reported, with seven studies scoring unclear82–84,87,89,92,94 for the test review bias and 11 studies30,81–89,92,93 scoring unclear for the diagnostic review bias. However, six studies scored well for test review bias.81,85,86,88,90,91,93,95 Clinical review bias was avoided in retrospective studies by definition, but for most it was unclear81–83,85,86,88,92,93 or negative.90,91,95 There is potential for these biases to affect the results. Few studies reported withdrawals and so most scored well for this item.81,82,85–89,91–95
Yes (high quality)UnclearNo (low quality)Not applicable
Appropriate spectrum composition?
Selection criteria clearly described?
Reference standard intracranial injury adequate?
Reference standard neurosurgery adequate?
Partial verification bias avoided intracranial injury?
Partial verification bias avoided neurosurgery?
Differential verification bias avoided intracranial injury?
Differential verification bias avoided neurosurgery?
Test execution details reported?
Reference standard execution details reported?
Test review bias avoided?
Diagnostic review bias avoided?
Clinical review bias avoided?
Uninterpretable results reported?
Withdrawals accounted for?
0% 25% 50% 100%75%
FIGURE 4 Decision rules for children and infants with MHI – methodological quality graph. Review authors’ judgements about each methodological quality item presented as percentages across all included studies.
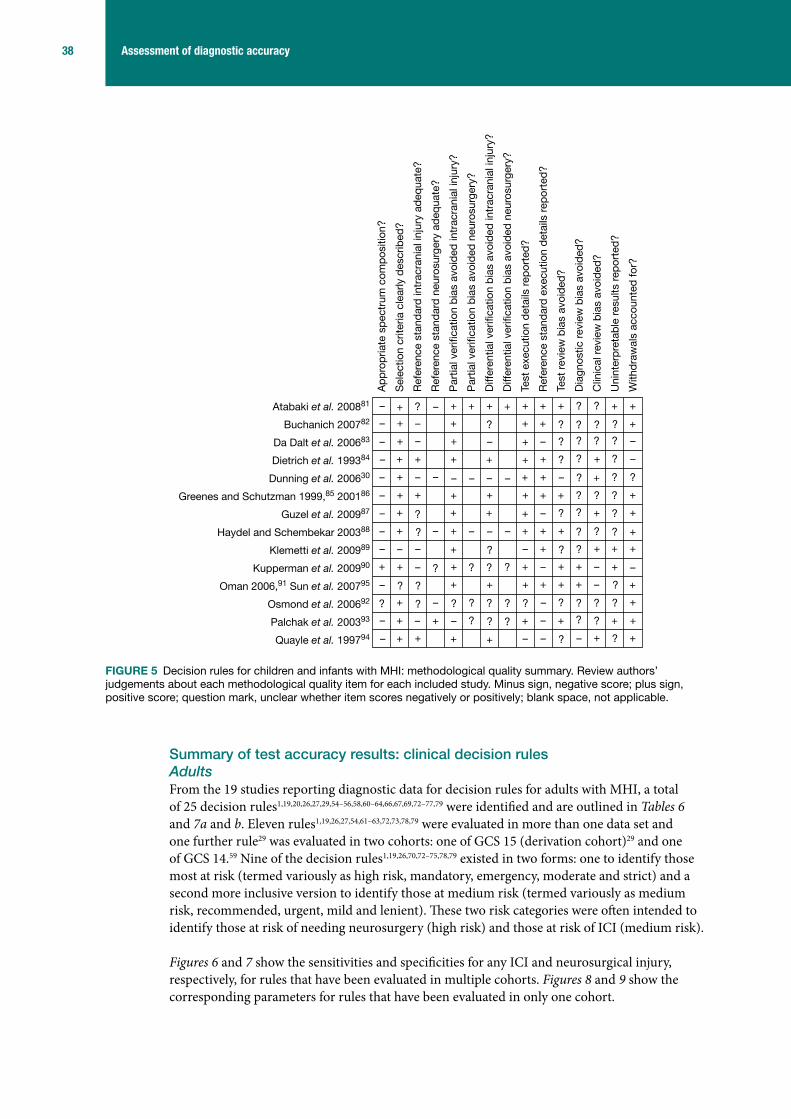
38 Assessment of diagnostic accuracy
Summary of test accuracy results: clinical decision rulesAdultsFrom the 19 studies reporting diagnostic data for decision rules for adults with MHI, a total of 25 decision rules1,19,20,26,27,29,54–56,58,60–64,66,67,69,72–77,79 were identified and are outlined in Tables 6 and 7a and b. Eleven rules1,19,26,27,54,61–63,72,73,78,79 were evaluated in more than one data set and one further rule29 was evaluated in two cohorts: one of GCS 15 (derivation cohort)29 and one of GCS 14.59 Nine of the decision rules1,19,26,70,72–75,78,79 existed in two forms: one to identify those most at risk (termed variously as high risk, mandatory, emergency, moderate and strict) and a second more inclusive version to identify those at medium risk (termed variously as medium risk, recommended, urgent, mild and lenient). These two risk categories were often intended to identify those at risk of needing neurosurgery (high risk) and those at risk of ICI (medium risk).
Figures 6 and 7 show the sensitivities and specificities for any ICI and neurosurgical injury, respectively, for rules that have been evaluated in multiple cohorts. Figures 8 and 9 show the corresponding parameters for rules that have been evaluated in only one cohort.
– ++
+
+ +–
? –
–
+ + + +
?
–+
+
–
+
+–
??–
–
+
? +
+
++
–
–
+ – +
+
?
?
–
– +
+
++
–
+
–
+–
– + ?
– + –
–
+
+
++?+
++
+
–
+
+
?
?–+
?+
+
+
+
– +
–
?
?
+
?
+
?
+ ?
?
– –
+ –––
–
+ – –
+
–
+
– –+
– ?
?
?++
– ? ?
?
+ + +
??
– ?–
– + + ?
+
? ? +
?
?+
?
+
?
+?
+ – +
–
?
? +
?
??
?
??
?
?
?
???
??
+
+
?
?
?
– +
?
?
+
+
?
–
+
+
+
–
–
+
+
+
+
+
+
Ap
pro
pria
te s
pec
trum
com
pos
ition
?
Sel
ectio
n cr
iteria
cle
arly
des
crib
ed?
Ref
eren
ce s
tand
ard
intr
acra
nial
inju
ry a
deq
uate
?
Ref
eren
ce s
tand
ard
neu
rosu
rger
y ad
equa
te?
Par
tial v
erifi
catio
n b
ias
avoi
ded
intr
acra
nial
inju
ry?
Par
tial v
erifi
catio
n b
ias
avoi
ded
neu
rosu
rger
y?
Diff
eren
tial v
erifi
catio
n b
ias
avoi
ded
intr
acra
nial
inju
ry?
Diff
eren
tial v
erifi
catio
n b
ias
avoi
ded
neu
rosu
rger
y?
Test
exe
cutio
n d
etai
ls r
epor
ted
?
Ref
eren
ce s
tand
ard
exe
cutio
n d
etai
ls r
epor
ted
?
Test
rev
iew
bia
s av
oid
ed?
Dia
gnos
tic r
evie
w b
ias
avoi
ded
?
Clin
ical
rev
iew
bia
s av
oid
ed?
Uni
nter
pre
tab
le r
esul
ts r
epor
ted
?
With
dra
wal
s ac
coun
ted
for?
Atabaki et al. 200881
Buchanich 200782
Da Dalt et al. 200683
Dietrich et al. 199384
Dunning et al. 200630
Greenes and Schutzman 1999,85 200186
Guzel et al. 200987
Haydel and Schembekar 200388
Klemetti et al. 200989
Kupperman et al. 200990
Oman 2006,91 Sun et al. 200795
Osmond et al. 200692
Palchak et al. 200393
Quayle et al. 199794
FIGURE 5 Decision rules for children and infants with MHI: methodological quality summary. Review authors’ judgements about each methodological quality item for each included study. Minus sign, negative score; plus sign, positive score; question mark, unclear whether item scores negatively or positively; blank space, not applicable.

© Queen’s Printer and Controller of HMSO 2011. This work was produced by Pandor et al. under the terms of a commissioning contract issued by the Secretary of State for Health.
39 Health Technology Assessment 2011; Vol. 15: No. 27DOI: 10.3310/hta15270
TAB
LE 6
Dec
isio
n ru
les
for
adul
ts w
ith M
HI –
sum
mar
y of
rul
es a
pplic
able
to a
dults
with
MH
I for
whi
ch m
ore
than
one
dat
a se
t is
avai
labl
e
Crite
ria
CCHR
26NO
C27a N
ICE
2003
,19 2
0071
NCW
FNS72
b Arie
nta
grou
ps β
and
γ54
Deci
sion
rule
Risk
cat
egor
yHi
gh ri
skM
ediu
m ri
skLe
nien
tSt
rict
High
risk
Med
ium
risk
Test
ed in
stu
dy b
ySt
iell
et a
l. 20
01,26
20
05;46
Ste
in
et a
l. 20
09;71
Ro
seng
ren
et a
l. 20
0465
Stie
ll et
al.
2001
,26
2005
;46 S
tein
et a
l. 20
09;71
Ros
engr
en e
t al
. 200
4;65
Sm
its e
t al.
2005
;68 c Ib
anez
and
Ar
ikan
200
460
Hayd
el e
t al.
2000
;27
Iban
ez a
nd A
rikan
20
04;60
Sm
its e
t al.
2005
;68 S
tiell
et a
l. 20
05;46
Ros
engr
en e
t al
. 200
465
Fabb
ri et
al.
2005
57
(NIC
E 20
03);S
mits
et
al.
2007
70 (N
ICE
2003
); St
ein
et a
l. 20
09 (N
ICE
2007
)71
Smits
et a
l. 20
0770
Smits
et a
l. 20
0769
Fabb
ri et
al
. 200
5;57
Sm
its e
t al.
2007
;69 S
tein
et
al.
2009
;71
c Iban
ez
and
Arik
an
2004
60
Arie
nta
et a
l. 19
97;54
c Iban
ez
and
Arik
an 2
00460
Elig
ibilit
y cr
iteria
dGC
S 13
–15,
clin
ical
cha
ract
eris
tics.
Som
e si
gnifi
cant
exc
lusi
ons
GCS
15, c
linic
al
char
acte
ristic
se–g
Sust
aine
d he
ad in
jury
Mild
, min
or o
r triv
ial h
ead
inju
ry
(GCS
14–
15h )
Head
inju
ry (G
CS 9
–15)
Men
tal s
tatu
sIm
paire
d co
nsci
ousn
ess
Foca
l/neu
rolo
gica
l defi
cits
Any
Neur
olog
ical
defi
cits
Neur
olog
ical
defi
cits
Skul
l fra
ctur
eSu
spec
ted
open
, de
pres
sed
or
basa
l
Susp
ecte
d op
en, d
epre
ssed
or b
asal
iAn
yOt
orrh
agia
/oto
rrhoe
a,
rhin
orrh
oea,
sig
ns o
f bas
al
skul
l fra
ctur
e
LOC
Any
Tran
sito
ry
Vom
iting
≥ 2
Any
Recu
rrent
iAn
yAn
y
Age
≥ 6
5 ye
ars
> 6
0 ye
ars
≥ 6
5 ye
ars
if w
ith L
OC/a
mne
siaa,
i>
60
year
sj,k
Amne
sia
Amne
sia
befo
re im
pact
of
≥ 3
0 m
inut
esAm
nesi
a be
fore
impa
ct
of ≥
30
min
utes
Any
Any
Coag
ulop
athy
If w
ith L
OC/a
mne
siai
Any
Antic
oagu
lant
ther
apy
or
coag
ulop
athy
Seizu
res
Any
PTS
Pre-
traum
a ep
ileps
yAn
y or
epi
lept
ic
Visi
ble
inju
ryTr
aum
a ab
ove
clav
icle
sPe
netra
ting
or p
erfo
rate
d w
ound
s
Into
xicat
ion
Any
Any
Alco
holic
pat
ient
s
Beha
viour
Unco
oper
ative
Head
ache
Any
Diffu
se
cont
inue
d

40 Assessment of diagnostic accuracy
Crite
ria
CCHR
26NO
C27a N
ICE
2003
,19 2
0071
NCW
FNS72
b Arie
nta
grou
ps β
and
γ54
Deci
sion
rule
Prev
ious
neu
rosu
rger
yAn
yIn
tracr
ania
l ope
ratio
ns
Failu
re to
impr
ove
GCS
< 1
5 at
2
hour
s af
ter
inju
ry
GCS
< 1
5 at
2 h
ours
afte
r inj
uryi
Mec
hani
sm o
f inj
ury
Dang
erou
slDa
nger
ous,
if w
ith
LOC/
amne
siai
Dete
riora
tion
in m
enta
l st
atus
Othe
rSu
bgal
eal s
wel
ling
Crite
ria
mEF
NS79
Mad
den
et a
l. 19
9561
Ono
et a
l. 20
0763
Scan
dina
vian
73SI
GN 2
00078
NEXU
S II62
Deci
sion
rule
Risk
cat
egor
yCT
man
dato
ryCT
reco
mm
ende
dCT
man
dato
ryCT
reco
mm
ende
dCT
as
emer
genc
yCT
urg
ently
Test
ed in
stu
dy b
ySm
its e
t al.
2007
70
c Iban
ez a
nd A
rikan
20
04;60
Sm
its e
t al.
2007
70
Mad
den
et a
l. 19
9561
Ono
et a
l. 20
0763
Smits
et a
l. 20
0770
Smits
et a
l. 20
07,70
20
09;71
c Iban
ez
and
Arik
an 2
00460
Smits
et a
l. 20
0770
Smits
et a
l. 20
07;70
c Ib
anez
and
Arik
an 2
00460
Stei
n et
al.
2009
;71 M
ower
et
al. 2
00562
Elig
ibilit
y cr
iteria
dM
ild T
BI, G
CS 1
3–15
Acut
e he
ad tr
aum
aM
HIM
inim
al, m
ild a
nd m
oder
ate
head
in
jury
Patie
nts
with
hea
d in
jury
Blun
t hea
d tra
uma
Men
tal s
tatu
sGC
S 13
–15
GCS
15p
GCS
< 1
5JC
S >
0GC
S 9–
13GC
S 14
–15n
GCS
≤ 1
2oGC
S <
15
with
failu
re to
im
prov
e w
ithin
4 h
ours
(s
ee b
elow
)
Alte
red
leve
l of
aler
tnes
s
Foca
l/neu
rolo
gica
l de
ficits
Pres
ent
pAc
ute
pupi
llary
in
equa
lity
Pres
ent
Prog
ress
ive s
igns
New
sig
ns th
at a
re n
ot
getti
ng w
orse
Neur
olog
ical
de
ficit
Skul
l fra
ctur
eCl
inic
al s
igns
sku
ll fra
ctur
e (s
kull
base
or
dep
ress
ed)
pPa
lpab
le d
epre
ssed
sk
ull f
ract
ure,
sig
ns
of b
asila
r sku
ll fra
ctur
e
Radi
ogra
phic
ally
dem
onst
rate
d sk
ull
fract
ure
or c
linic
al s
igns
of d
epre
ssed
or
bas
al s
kull
fract
ure
Radi
olog
ical
/clin
ical
ev
iden
ce o
f a fr
actu
re,
wha
teve
r the
leve
l of
cons
ciou
snes
s
Evid
ence
of
sign
ifica
nt s
kull
fract
ure
LOC
< 3
0 m
inut
esp
Hist
ory
of L
OC o
r LO
C >
5m
ins
Any
> 5
min
utes
≤ 5
min
utes
o
Vom
iting
Any
pVo
miti
ng o
r na
usea
Naus
ea o
r vom
iting
Pers
iste
nt
TAB
LE 6
Dec
isio
n ru
les
for
adul
ts w
ith M
HI –
sum
mar
y of
rul
es a
pplic
able
to a
dults
with
MH
I for
whi
ch m
ore
than
one
dat
a se
t is
avai
labl
e (c
ontin
ued)

© Queen’s Printer and Controller of HMSO 2011. This work was produced by Pandor et al. under the terms of a commissioning contract issued by the Secretary of State for Health.
41 Health Technology Assessment 2011; Vol. 15: No. 27DOI: 10.3310/hta15270
Crite
ria
mEF
NS79
Mad
den
et a
l. 19
9561
Ono
et a
l. 20
0763
Scan
dina
vian
73SI
GN 2
00078
NEXU
S II62
Deci
sion
rule
Age
< 2
yea
rsp o
r >
60
year
s60
yea
rs≥
65
year
s
Amne
sia
Cont
inue
d PT
APT
A
< 6
0 m
inut
esp
Any
o
Coag
ulop
athy
Coag
ulat
ion
diso
rder
sp
Ther
apeu
tic a
ntic
oagu
latio
n or
ha
emop
hilia
Coag
ulop
athy
Seizu
res
Any
pPT
SAn
y
Visi
ble
inju
ryTr
aum
a ab
ove
clav
icle
sp
Faci
al in
jury
, pe
netra
ting
skul
l in
jury
oSc
alp
haem
atom
a
Into
xicat
ion
Alco
hol/d
rugs
p
Beha
viour
Com
bativ
enes
sIrr
itabi
lity/
alte
red
beha
viour
Abno
rmal
be
havio
ur
Head
ache
Seve
rep
Any
Seve
re o
r per
sist
ent
Prev
ious
neu
rosu
rger
ySh
unt-
treat
ed h
ydro
ceph
alus
Failu
re to
impr
ove
Failu
re to
impr
ove
(from
GC
S <
15)
with
in 4
hou
rs
of c
linic
al o
bser
vatio
n
Mec
hani
sm o
f inj
ury
High
-ene
rgy
acci
dent
q
po
Dete
riora
tion
in m
enta
l st
atus
Decr
easi
ng le
vel o
f co
nsci
ousn
ess
Dete
riora
ting
leve
l of
con
scio
usne
ss
cont
inue
d

42 Assessment of diagnostic accuracy
Crite
ria
mEF
NS79
Mad
den
et a
l. 19
9561
Ono
et a
l. 20
0763
Scan
dina
vian
73SI
GN 2
00078
NEXU
S II62
Deci
sion
rule
Othe
rUn
clea
r or
ambi
guou
s ac
cide
nt
hist
ory
pM
ultip
le in
jurie
s‘O
ther
feat
ures
’ are
not
fu
lly e
num
erat
ed
o
EFNS
, Eur
opea
n Fe
dera
tion
of N
euro
logi
cal S
ocie
ties;
JCS
, Jap
anes
e Co
ma
Scal
e; N
EXUS
II, N
atio
nal E
mer
genc
y X-
Radi
ogra
phy
Utiliz
atio
n St
udy
II; P
TA, p
ost-
traum
atic
am
nesi
a.a
NICE
200
319 a
nd 2
0071 r
ules
: for
chi
ldre
n <
16
year
s, th
ere
are
addi
tiona
l ind
icat
ions
list
ed in
the
2007
upd
ate.
The
se m
ay h
ave
been
app
lied
by S
tein
et a
l. 20
0971
as
thei
r coh
ort i
nclu
ded
adol
esce
nts.
Adu
lts o
ver
65 y
ears
with
LOC
or a
mne
sia
are
incl
uded
in th
e st
rict a
nd le
nien
t crit
eria
in 2
003
vers
ion,
but
onl
y in
clud
ed in
the
stric
t crit
eria
in 2
007
vers
ion.
b Ru
le c
onsi
sts
of fo
ur ri
sk g
roup
s ac
cord
ing
to c
linic
al c
hara
cter
istic
s, c
over
ing
all s
ever
ity o
f inj
ury.
Clin
ical
cha
ract
eris
tics
from
the
two
risk
grou
ps th
at p
redi
ct n
eed
for a
CT
scan
in p
atie
nts
with
GCS
13–
15 a
re
pres
ente
d he
re, t
akin
g th
e m
ost i
nclu
sive
defi
nitio
n w
here
a c
hara
cter
istic
is c
over
ed b
y m
ore
than
one
risk
gro
up.
c As
sum
e th
e m
ost i
nclu
sive
ver
sion
of t
he ru
le u
sed
by Ib
anez
and
Arik
an.60
d El
igib
ility
crite
ria a
re e
ither
the
incl
usio
n cr
iteria
of t
he d
eriva
tion
coho
rt or
the
patie
nts
the
rule
was
inte
nded
for w
here
ther
e is
no
deriv
atio
n co
hort.
e No
t lis
ted
in S
mits
et a
l.68
f No
t lis
ted
in S
tiell
et a
l.46
g No
t rep
orte
d in
Ros
engr
en e
t al.65
h Re
porte
d in
Sm
its e
t al.69
as
GCS
13–1
4.i
Repo
rted
in F
abbr
i et a
l.57 a
s GC
S 14
or G
CS <
14
at a
ny p
oint
, sig
ns o
f bas
al s
kull
fract
ure
only,
any
vom
iting
and
LOC
/am
nesi
a pr
ovis
o no
t inc
lude
d fo
r coa
gulo
path
y, a
ge a
nd m
echa
nism
of i
njur
y.j
Not r
epor
ted
in F
abbr
i et a
l.57
k No
t rep
orte
d in
Ste
in e
t al.71
l Da
nger
ous
mec
hani
sm is
a p
edes
trian
stru
ck b
y a
mot
or v
ehic
le, a
n oc
cupa
nt e
ject
ed fr
om a
mot
or v
ehic
le o
r a fa
ll fro
m a
n el
evat
ion
of ≥
3 fe
et o
r five
sta
irs.
m R
ule
defin
es fo
ur ri
sk c
ateg
orie
s ac
cord
ing
to c
linic
al c
hara
cter
istic
s fo
r tho
se w
ith G
CS 1
3–15
. Cat
egor
y 0
is d
isch
arge
d, c
ateg
ory
1 is
reco
mm
ende
d to
hav
e CT
or r
adio
grap
hy, a
nd c
ateg
orie
s 2
and
3 ar
e re
quire
d to
hav
e CT
sca
n. C
linic
al c
hara
cter
istic
s fo
r the
thre
e gr
oups
that
pre
dict
nee
d fo
r CT
scan
(cat
egor
ies
1, 2
and
3) a
re p
rese
nted
her
e, ta
king
the
mos
t inc
lusi
ve d
efini
tion
whe
re a
cha
ract
eris
tic is
cov
ered
by
mor
e th
an
one
risk
cate
gory
.n
Repo
rted
in S
mits
et a
l.70 a
s GC
S 13
–14.
o Si
gn78
em
erge
ncy
repo
rted
in S
mits
et a
l.70 a
s GC
S 13
–14
at 4
hou
rs p
ost i
njur
y. S
ign78
CT
urge
ntly
repo
rted
as in
clud
ing
LOC,
PTA
, ext
erna
l inj
ury
to th
e sk
ull,
uncl
ear h
isto
ry a
nd n
on-t
rivia
l mec
hani
sm o
f inj
ury,
w
hich
are
list
ed a
s in
dica
tions
for s
kull
radi
ogra
phy
in th
e or
igin
al ru
le.
p Re
porte
d in
Sm
its e
t al.70
with
the
follo
win
g di
ffere
nces
: LOC
tim
e no
t defi
ned,
< 2
yea
rs n
ot li
sted
, all
risk
fact
ors
iden
tified
for C
T m
anda
tory
ver
sion
of t
he ru
le a
lso
liste
d fo
r CT
reco
mm
ende
d ve
rsio
n of
the
rule
.q
Repo
rted
in V
os e
t al.79
as
vehi
cle
acci
dent
with
initi
al s
peed
> 6
4 km
/hou
r, m
ajor
aut
o de
form
ity, i
ntru
sion
into
pas
seng
er c
ompa
rtmen
t > 3
0 cm
, ext
ricat
ion
time
from
veh
icle
> 2
0 m
inut
es, f
alls
from
> 6
m, r
ollo
ver,
auto
–ped
estri
an a
ccid
ents
or m
otor
cycl
e cr
ash
at s
peed
> 3
2 km
/hou
r or w
ith s
epar
atio
n of
ride
r and
bik
e.
TAB
LE 6
Dec
isio
n ru
les
for
adul
ts w
ith M
HI –
sum
mar
y of
rul
es a
pplic
able
to a
dults
with
MH
I for
whi
ch m
ore
than
one
dat
a se
t is
avai
labl
e (c
ontin
ued)

© Queen’s Printer and Controller of HMSO 2011. This work was produced by Pandor et al. under the terms of a commissioning contract issued by the Secretary of State for Health.
43 Health Technology Assessment 2011; Vol. 15: No. 27DOI: 10.3310/hta15270
TABLE 7a Decision rules for adults with MHI – summary of rules applicable to adults with MHI for which only one data set is availablea
Criteria
Borczuk 199555
Ibanez and Arikan 200460 Stein 199674 Tomei et al. 199675 Murshid 199877
Duus et al. 1994;56 admission, CT based on deterioration
Decision rule
Risk category Moderate category
Mild category
CT or radiography and observation
CT
Tested in Borczuk 199555
Ibanez and Arikan 200460
bIbanez and Arikan 200460
bIbanez and Arikan 200460
bIbanez and Arikan 200460
bIbanez and Arikan 200460
Ibanez and Arikan 200460
Duus et al. 199456
Eligibility criteriac
GCS 13–15 and clinical characteristics
GCS 14–15 Minor closed head injury
GCS 14–15, some exclusions
GCS 13–15 MHI, able to walk and talk
Mental status GCS 14 GCS 13 GCS 14 or impaired alertness or memory
GCS14 (confused)
GCS < 15 Impaired consciousness or unconsciousness in ED
Focal/neurological deficits
Present Neurological deficit
Present Neurological deficit
Present
Skull fracture Signs of basilar skull fracture
Signs of skull base fracture
Signs of basilar or depressed fracture
Suspected skull fracture
LOC Any ≥ 5 minutes
< 5 minutes
Any > 15 minutes (witnessed)
Vomiting Any Persistent/progressive
Age > 60 years ≥ 65 years
Amnesia For event Any Any > 15 minutes
Coagulopathy
Seizures Seizures History of convulsions
Visible injury Cranial soft tissue injury
Scalp contusion
Intoxication Alcohol (when mental status does not improve after several hours)
Behaviour Confusion or aggression
Headache Mild-to-moderate or severe
Diffuse Diffuse Persistent or progressive
Previous neurosurgery
Failure to improve
Plus conditions that interfere with assessment
Mechanism of injury
continued

44 Assessment of diagnostic accuracy
Criteria
Borczuk 199555
Ibanez and Arikan 200460 Stein 199674 Tomei et al. 199675 Murshid 199877
Duus et al. 1994;56 admission, CT based on deterioration
Decision rule
Deterioration in mental status
Other Pain in impact area, dizziness
Children ≤ 3 years with symptoms
TABLE 7a Decision rules for adults with MHI – summary of rules applicable to adults with MHI for which only one data set is availablea (continued)
TABLE 7b Decision rules for adults with MHI – summary of rules applicable to adults with MHI for which only one data set is availablea
Criteria
Reinus et al. 199364
Saboori et al. 200767
Falimirski et al. 200358
Dutch (reported in Smits et al. 200770)
CHIP detailed or simpled (Smits et al. 2007)69
Saadat et al. 200966
Miller et al. 199729
Decision rule
Risk category Strict Lenient
Tested in Reinus et al. 199364
Saboori et al. 200767
Falimirski et al. 200358
Smits et al. 200770
Smits et al. 200770
Smits et al. 200769
Saadat et al. 200966
Miller et al. 1997;29 Holmes et al. 199759
Eligibility criteriac
Closed or penetrating trauma to the head
GCS 15 With clinical characteristics
Unknown GCS score 13–14 or GCS 15, with clinical characteristics
Blunt head trauma, some exclusions
Tested in GCS 15 and GCS 14, with clinical characteristics
Mental status Mental status changes
GCS 13–14 GCS < 15e GCS < 14, GCS < 15f
Focal/neurological deficits
History of focal neurological deficit
Positive neurological examination
Focal neurological deficit
Neurological deficit
Focal neurological deficitsg
Neurological deficite
Skull fracture Skull fracture Haemotympanum Clinical signse Racoon sign
Skull depression on examination
LOC Witnessed LOC LOCe
Vomiting Any Nausea/emesis Vomitingg Vomitinge After impact
Vomiting, nausea
Age > 60 years > 60 yearsg ≥ 60 yearse, 40–60 yearsh
≥ 65 years
Amnesia History of amnesia
Definite PTA PTA
Persistent anterograde amnesiag
PTA PTA ≥ 4 hourse
Persistent anterograde amnesiah
PTA of 2 to < 4 hoursh
For impact

© Queen’s Printer and Controller of HMSO 2011. This work was produced by Pandor et al. under the terms of a commissioning contract issued by the Secretary of State for Health.
45 Health Technology Assessment 2011; Vol. 15: No. 27DOI: 10.3310/hta15270
TABLE 7b Decision rules for adults with MHI – summary of rules applicable to adults with MHI for which only one data set is availablea (continued)
Criteria
Reinus et al. 199364
Saboori et al. 200767
Falimirski et al. 200358
Dutch (reported in Smits et al. 200770)
CHIP detailed or simpled (Smits et al. 2007)69
Saadat et al. 200966
Miller et al. 199729
Decision rule
Coagulopathy Coagulopathy or history of taking anticoagulants
Coagulopathyg Use of anticoagulant therapye
Seizures PTS Seizure Early seizureg PTSe
Visible injury External injury above claviclesg
Contusion of the skulle
Scalp woundf
Intoxication Intoxication Alcohol or drugsg
Behaviour Confusion Confusion
Headache Any Headache Persistent headacheg
Severe headache
Previous neurosurgery
History of neurosurgery (shunt)g
Failure to improve
Mechanism of injury
Unclear accident historyg or high-energy accidentg
Pedestrian or cyclist vs vehiclee or
ejected from vehiclee or
fall from any elevationh
Deterioration in mental status
1 hour after presentation: GCS deterioration of ≥ 2 pointse or GCS deterioration of 1 pointh
Other Vertigo, blurred/double vision, somnolence, perseveration
CHIP, CT in Head Injury Patients; PTA, post-traumatic amnesia.a The Dutch rule was no longer available online in May 2010, but is described in Smits et al.;70 Lapierre’s rule76 was available only in French
and is not included in this table.b Assume the most inclusive version of the rule used by Ibanez and Arikan.60
c Eligibility criteria are either the inclusion criteria of the derivation cohort or the patients the rule was intended for where there is no derivation cohort.
d CHIP69 detailed rule calculates risk by addition of derived β-coefficients for each characteristic listed. If a value of ≥ 1.1 is achieved, CT scan is indicated. CHIP simple rule predicts CT findings on basis of presence of onee or twoh criteria.
e Computerised tomography indicated if one of these criteria were present.f If with one or more other risk criteria.g Computerised tomography indicated if patient also has LOC or PTA.h Computerised tomography indicated if two of these criteria were present.

46 Assessment of diagnostic accuracy
CC
HR
hig
h an
d m
ediu
m r
isk:
intr
acra
nial
inju
ryS
tud
y
Iban
ez e
t al
. 20
0460
Ros
engr
en e
t al
. 20
0465
Sm
its e
t al
. 20
0568
Ste
in e
t al
. 20
0971
Stie
ll et
al.
2001
26
Stie
ll et
al.
2005
46
CC
HR
hig
h an
d m
ediu
m r
isk
adap
ted
to
co
hort
: in
trac
rani
al in
jury
Stu
dy
Sm
its e
t al
. 20
0568
NO
C:
intr
acra
nial
inju
ryS
tud
y
Hay
del
et
al.
2000
27
Iban
ez e
t al
. 20
0460
Ros
engr
en e
t al
. 20
0465
Sm
its e
t al
. 20
0568
Ste
in e
t al
. 20
0971
Stie
ll et
al.
2005
46
NO
C a
dap
ted
to
co
hort
: in
trac
rani
al in
jury
Stu
dy
Sm
its e
t al
. 20
0568
NC
WFN
S h
igh
and
med
ium
ris
k: in
trac
rani
al in
jury
Stu
dy
Fab
bri
et a
l. 20
0557
Iban
ez e
t al
. 20
0460
Sm
its e
t al
. 20
0770
TP 71 8
171
526
250
231
TP 26
5
TP 57 79 10 11
552
6 97
TP 31
0
TP 53
0 81 307
FP
505
118
1105
3935
1446
1458
FP 1731
FP
640
828
221
1123
4974
1506
FP 2777
FP 4010 877
2786
FN 12 2 34 5 4 0 FN 47 FN 0 4 0 2 5 0 FN 2 FN 12 2 5
TN 51
311
271
834
8914
2110
18
TN 11
38
TN 21
219
0 9 6724
50 219
TN
92
TN 34
03 142 83
Sen
siti
vity
(95
% C
I)
0.86
(0.
76 t
o 0.
92)
0.80
(0.
44 t
o 0.
97)
0.83
(0.
78 t
o 0.
88)
0.99
(0.
98 t
o 1.
00)
0.98
(0.
96 t
o 1.
00)
1.00
(0.
98 t
o 1.
00)
Sen
siti
vity
(95
% C
I)
0.85
(0.
80 t
o 0.
89)
Sen
siti
vity
(95
% C
I)
1.00
(0.
94 t
o 1.
00)
0.95
(0.
88 t
o 0.
99)
1.00
(0.
69 t
o 1.
00)
0.98
(0.
94 t
o 1.
00)
0.99
(0.
98 t
o 1.
00)
1.00
(0.
96 t
o 1.
00)
Sen
siti
vity
(95
% C
I)
0.99
(0.
98 t
o 1.
00)
Sen
siti
vity
(95
% C
I)
0.98
(0.
96 t
o 0.
99)
0.98
(0.
92 t
o 1.
00)
0.98
(0.
96 t
o 0.
99)
Sp
ecifi
city
(95
% C
I)
0.50
(0.
47 t
o 0.
54)
0.49
(0.
42 t
o 0.
55)
0.39
(0.
37 t
o 0.
42)
0.47
(0.
46 t
o 0.
48)
0.50
(0.
48 t
o 0.
51)
0.41
(0.
39 t
o 0.
43)
Sp
ecifi
city
(95
% C
I)
0.40
(0.
38 t
o 0.
41)
Sp
ecifi
city
(95
% C
I)
0.25
(0.
22 t
o 0.
28)
0.19
(0.
16 t
o 0.
21)
0.04
(0.
02 t
o 0.
07)
0.06
(0.
04 t
o 0.
07)
0.33
(0.
32 t
o 0.
34)
0.13
(0.
11 t
o 0.
14)
Sp
ecifi
city
(95
% C
I)
0.03
(0.
03 t
o 0.
04)
Sp
ecifi
city
(95
% C
I)
0.46
(0.
45 t
o 0.
47)
0.14
(0.
12 t
o 0.
16)
0.03
(0.
02 t
o 0.
04)
Sen
siti
vity
Sen
siti
vity
Sen
siti
vity
Sen
siti
vity
Sen
siti
vity
00.
20.
40.
60.
81
00.
20.
40.
60.
81
00.
20.
40.
60.
81
00.
20.
40.
60.
81
00.
20.
40.
60.
81
Sp
ecifi
city
Sp
ecifi
city
Sp
ecifi
city
Sp
ecifi
city
Sp
ecifi
city
00.
20.
40.
60.
81
00.
20.
40.
60.
81
00.
20.
40.
60.
81
00.
20.
40.
60.
81
00.
20.
40.
60.
81

© Queen’s Printer and Controller of HMSO 2011. This work was produced by Pandor et al. under the terms of a commissioning contract issued by the Secretary of State for Health.
47 Health Technology Assessment 2011; Vol. 15: No. 27DOI: 10.3310/hta15270
Ari
enta
et
al.
199
7 ru
le:
intr
acra
nial
inju
ryS
tud
y
Arie
nta
et a
l. 19
9754
Iban
ez e
t al
. 20
0460
Mad
den
et
al.
199
5 ru
le:
intr
acra
nial
inju
ryS
tud
y
Mad
den
et
al.
1995
61
Mad
den
et
al.
1995
61
CC
HR
hig
h ri
sk:
intr
acra
nial
inju
ryS
tud
y
Ros
engr
en e
t al
. 20
0465
Ste
in e
t al
. 20
0971
NIC
E le
nien
t: in
trac
rani
al in
jury
Stu
dy
Fab
bri
et a
l. 20
0557
Sm
its e
t al
. 200
770
Ste
in e
t al
. 20
0971
Sp
ecifi
city
(95
% C
I)
0.91
(0.
91 t
o 0.
92)
0.54
(0.
51 t
o 0.
57)
Sp
ecifi
city
(95
% C
I)
0.21
(0.
17 t
o 0.
25)
0.21
(0.
15 t
o 0.
26)
Sp
ecifi
city
(95
% C
I)
0.77
(0.
71 t
o 0.
83)
0.51
(0.
50 t
o 0.
52)
Sp
ecifi
city
(95
% C
I)
0.70
(0.
69 t
o 0.
71)
0.46
(0.
44 t
o 0.
48)
0.31
(0.
30 t
o 0.
32)
Sp
ecifi
city
(95
% C
I)
0.60
(0.
57 t
o 0.
63)
0.21
(0.
20 t
o 0.
23)
0.53
(0.
52 t
o 0.
54)
Sen
siti
vity
(95
% C
I)
1.00
(0.
96 t
o 1.
00)
0.88
(0.
79 t
o 0.
94)
Sen
siti
vity
(95
% C
I)
0.97
(0.
91 t
o 0.
99)
0.95
(0.
85 t
o 0.
99)
Sen
siti
vity
(95
% C
I)
0.50
(0.
19 t
o 0.
81)
0.97
(0.
95 t
o 0.
98)
Sen
siti
vity
(95
% C
I)
0.94
(0.
91 t
o 0.
95)
0.82
(0.
77 t
o 0.
86)
0.99
(0.
98 t
o 1.
00)
Sen
siti
vity
(95
% C
I)
0.84
(0.
75 t
o 0.
91)
0.93
(0.
90 t
o 0.
96)
0.96
(0.
94 t
o 0.
98)
Sca
ndin
avia
n le
nien
t cr
iter
ia:
intr
acra
nial
inju
ryS
tud
y
Iban
ez e
t al
. 20
0460
Sm
its e
t al
. 20
0770
Ste
in e
t al
. 20
0971
TP 95 73
TP 88 42
TP
551
5
TP 50
725
652
6
TP 70 29
151
0
FP FP
874
466
FP
354
182
FP
5236
38
FP 2223
1545
5123
409
2260
3489
FN 0 10 FN 3 2FN 5 16FN 35 56 5 FN 13 21 21
TN 89
48 552
TN
92 47
TN 17
837
86
TN 51
9013
2423
01
TN 60
960
939
35
Sen
siti
vity
Sen
siti
vity
00.
20.
40.
60.
81
00.
20.
40.
60.
81
Sen
siti
vity
00.
20.
40.
60.
81
Sen
siti
vity
00.
20.
40.
60.
81
Sen
siti
vity
00.
20.
40.
60.
81
Sp
ecifi
city
Sp
ecifi
city
00.
20.
40.
60.
81
00.
20.
40.
60.
81
Sp
ecifi
city
00.
20.
40.
60.
81
Sp
ecifi
city
00.
20.
40.
60.
81
Sp
ecifi
city
00.
20.
40.
60.
81
FIG
UR
E 6
Dec
isio
n ru
les
for
adul
ts w
ith M
HI –
sen
sitiv
ity a
nd s
peci
ficity
of d
ecis
ion
rule
s fo
r w
hich
mor
e th
an o
ne d
ata
set i
s av
aila
ble
for
the
outc
ome
ICI.
NE
XU
S II
, Nat
iona
l E
mer
genc
y X
-Rad
iogr
aphy
Util
izat
ion
Stu
dy II
. (C
ontin
ued.
)

48 Assessment of diagnostic accuracy
FIG
UR
E 6
Dec
isio
n ru
les
for
adul
ts w
ith M
HI –
sen
sitiv
ity a
nd s
peci
ficity
of d
ecis
ion
rule
s fo
r w
hich
mor
e th
an o
ne d
ata
set i
s av
aila
ble
for
the
outc
ome
ICI.
NE
XU
S II
, Nat
iona
l E
mer
genc
y X
-Rad
iogr
aphy
Util
izat
ion
Stu
dy II
. (C
ontin
ued.
)
Ono
et
al.
200
7 ru
le:
intr
acra
nial
inju
ry
Stu
dy
Ono
et
al.
2007
63
Ono
et
al.
2007
63
SIG
N 2
000
CT
urg
entl
y: in
trac
rani
al in
jury
Stu
dy
Iban
ez e
t al
. 20
0460
Sm
its e
t al
. 20
0770
NE
XU
S I
I: in
trac
rani
al in
jury
Stu
dy
Mow
er e
t al
. 20
0562
Ste
in e
t al
. 20
0971
EFN
S C
T r
eco
mm
end
ed a
nd m
and
ato
ry:
intr
acra
nial
inju
ryS
tud
y
Iban
ez e
t al
. 20
0460
Sm
its e
t al
. 20
0770
Mill
er e
t a
l. c
rite
ria:
intr
acra
nial
inju
ryS
tud
y
Hol
mes
et
al.
1997
59
Mill
er e
t al
. 19
9729
TP 13 50
TP 54
309
TP
901
515
TP 80
312
TP 18 90
FN 0 0 FN 29 3 FN 16 16 FN 3 0 FN 17 48
TN
54 309
TN 75
9 70
TN
1752
3489
TN 28
2 0
TN 15
712
54
Sen
siti
vity
(95
% C
I)
1.00
(0.
75 t
o 1.
00)
1.00
(0.
93 t
o 1.
00)
Sen
siti
vity
(95
% C
I)
0.65
(0.
54 t
o 0.
75)
0.99
(0.
97 t
o 1.
00)
Sen
siti
vity
(95
% C
I)
0.98
(0.
97 t
o 0.
99)
0.97
(0.
95 t
o 0.
98)
Sen
siti
vity
(95
% C
I)
0.96
(0.
90 t
o 0.
99)
1.00
(0.
99 t
o 1.
00)
Sen
siti
vity
(95
% C
I)
0.51
(0.
34 t
o 0.
69)
0.65
(0.
57 t
o 0.
73)
Sp
ecifi
city
(95
% C
I)
0.35
(0.
27 t
o 0.
43)
0.30
(0.
28 t
o 0.
33)
Sp
ecifi
city
(95
% C
I)
0.74
(0.
72 t
o 0.
77)
0.02
(0.
02 t
o 0.
03)
Sp
ecifi
city
(95
% C
I)
0.14
(0.
13 t
o 0.
14)
0.47
(0.
46 t
o 0.
48)
Sp
ecifi
city
(95
% C
I)
0.28
(0.
25 t
o 0.
31)
0.00
(0.
00 t
o 0.
00)
Sp
ecifi
city
(95
% C
I)
0.69
(0.
62 t
o 0.
75)
0.63
(0.
60 t
o 0.
65)
FP
101
705
FP
260
2799
FP 3935
FP
736
2869
FP
72 751
11,0
59
Sen
siti
vity
Sen
siti
vity
Sen
siti
vity
Sen
siti
vity
Sen
siti
vity
00.
20.
40.
60.
81
00.
20.
40.
60.
81
00.
20.
40.
60.
81
00.
20.
40.
60.
81
00.
20.
40.
60.
81
Sp
ecifi
city
Sp
ecifi
city
Sp
ecifi
city
Sp
ecifi
city
Sp
ecifi
city
00.
20.
40.
60.
81
00.
20.
40.
60.
81
00.
20.
40.
60.
81
00.
20.
40.
60.
81
00.
20.
40.
60.
81

© Queen’s Printer and Controller of HMSO 2011. This work was produced by Pandor et al. under the terms of a commissioning contract issued by the Secretary of State for Health.
49 Health Technology Assessment 2011; Vol. 15: No. 27DOI: 10.3310/hta15270
CC
HR
hig
h ri
sk:
neur
osu
rger
yS
tud
y
Ros
engr
en e
t al
. 20
0465
Ste
in e
t al
. 20
0971
Stie
ll et
al.
2001
26
Stie
ll et
al.
2005
46
NO
C:
neur
osu
rger
yS
tud
y
Ros
engr
en e
t al
. 20
0465
Sm
its e
t al
. 20
0568
Ste
in e
t al
. 20
0971
Stie
ll et
al.
2005
46
NO
C a
dap
ted
to
co
hort
: ne
uro
surg
ery
Stu
dy
Sm
its e
t al
. 20
0568
CC
HR
hig
h an
d m
ediu
m r
isk:
neu
rosu
rger
yS
tud
y
Ros
engr
en e
t al
. 20
0465
Sm
its e
t al
. 20
0568
Ste
in e
t al
. 20
0971
CC
HR
hig
h an
d m
ediu
m r
isk
adap
ted
to
co
hort
: ne
uro
surg
ery
Stu
dy
Sm
its e
t al
. 20
0568
TP
110
7 44 41
TP
1 210
7 8
TP 17
TP
1 710
7
TP 17
FP
5640
80 962
918
FP
230
1236
5414
1595
FP 3070
FP
125
1269
4316
FP 1979
FN 0 1 0 0 FN 0 0 1 0 FN 0 FN 0 0 1 FN 0
TN 18
337
6721
1517
48
TN
9 6924
33 219
TN
94
TN 11
475
235
31
TN 11
85
Sen
siti
vity
(95
% C
I)
1.00
(0.
03 t
o 1.
00)
0.99
(0.
95 t
o 1.
00)
1.00
(0.
92 t
o 1.
00)
1.00
(0.
91 t
o 1.
00)
Sen
siti
vity
(95
% C
I)
1.00
(0.
03 t
o 1.
00)
1.00
(0.
16 t
o 1.
00)
0.99
(0.
95 t
o 1.
00)
1.00
(0.
63 t
o 1.
00)
Sen
siti
vity
(95
% C
I)
1.00
(0.
80 t
o 1.
00)
Sen
siti
vity
(95
% C
I)
1.00
(0.
03 t
o 1.
00)
1.00
(0.
59 t
o 1.
00)
0.99
(0.
95 t
o 1.
00)
Sen
siti
vity
(95
% C
I)
1.00
(0.
80 t
o 1.
00)
Sp
ecifi
city
(95
% C
I)
0.77
(0.
71 t
o 0.
82)
0.48
(0.
47 t
o 0.
49)
0.69
(0.
67 t
o 0.
70)
0.66
(0.
64 t
o 0.
67)
Sp
ecifi
city
(95
% C
I)
0.04
(0.
02 t
o 0.
07)
0.05
(0.
04 t
o 0.
07)
0.31
(0.
30 t
o 0.
32)
0.12
(0.
11 t
o 0.
14)
Sp
ecifi
city
(95
% C
I)
0.03
(0.
02 t
o 0.
04)
Sp
ecifi
city
(95
% C
I)
0.48
(0.
41 t
o 0.
54)
0.37
(0.
35 t
o 0.
39)
0.45
(0.
44 t
o 0.
46)
Sp
ecifi
city
(95
% C
I)
0.37
(0.
36 t
o 0.
39)
Sen
siti
vity
Sen
siti
vity
Sen
siti
vity
Sen
siti
vity
Sen
siti
vity
00.
20.
40.
60.
81
00.
20.
40.
60.
81
00.
20.
40.
60.
81
00.
20.
40.
60.
81
00.
20.
40.
60.
81
Sp
ecifi
city
Sp
ecifi
city
Sp
ecifi
city
Sp
ecifi
city
Sp
ecifi
city
00.
20.
40.
60.
81
00.
20.
40.
60.
81
00.
20.
40.
60.
81
00.
20.
40.
60.
81
00.
20.
40.
60.
81
FIG
UR
E 7
Dec
isio
n ru
les
for
adul
ts w
ith M
HI –
sen
sitiv
ity a
nd s
peci
ficity
of d
ecis
ion
rule
s fo
r w
hich
mor
e th
an o
ne d
ata
set i
s av
aila
ble
for
the
outc
ome
need
for
neur
osur
gery
. (C
ontin
ued.
)

50 Assessment of diagnostic accuracy
NC
WFN
S h
igh
and
med
ium
ris
k: n
euro
surg
ery
Stu
dy
Fab
bri
et a
l. 20
0557
Sm
its e
t al
. 20
0770
NIC
E le
nien
t cr
iter
ia:
neur
osu
rger
yS
tud
y
Fab
bri
et a
l. 20
0557
Sm
its e
t al
. 20
0770
Ste
in e
t al
. 20
0971
Sca
ndin
avia
n le
nien
t cr
iter
ia:
neur
osu
rger
yS
tud
y
Sm
its e
t al
. 20
0770
Ste
in e
t al
. 20
0971
Mill
er e
t a
l. c
rite
ria:
neu
rosu
rger
yS
tud
y
Hol
mes
et
al.
1997
59
Mill
er e
t al
. 19
9729
TP 10
7 16
TP 10
2 16 106
TP 16 10
7
TP
2 5
FP 4433
3077
FP 2628
1785
5571
FP 2535
3923
FP
88 836
FN 1 1 FN 6 1 2 FN 1 1 FN 2 0
TN 34
14 87
TN 52
1913
7922
76
TN 62
939
24
TN 17
213
02
Sen
siti
vity
(95
% C
I)
0.99
(0.
95 t
o 1.
00)
0.94
(0.
71 t
o 1.
00)
Sen
siti
vity
(95
% C
I)
0.94
(0.
88 t
o 0.
98)
0.94
(0.
71 t
o 1.
00)
0.98
(0.
93 t
o 1.
00)
Sen
siti
vity
(95
% C
I)
0.94
(0.
71 t
o 1.
00)
0.99
(0.
95 t
o 1.
00)
Sen
siti
vity
(95
% C
I)
0.50
(0.
07 t
o 0.
93)
1.00
(0.
48 t
o 1.
00)
Sp
ecifi
city
(95
% C
I)
0.44
(0.
42 t
o 0.
45)
0.03
(0.
02 t
o 0.
03)
Sp
ecifi
city
(95
% C
I)
0.67
(0.
65 t
o 0.
68)
0.44
(0.
42 t
o 0.
45)
0.29
(0.
28 t
o 0.
30)
Sp
ecifi
city
(95
% C
I)
0.20
(0.
19 t
o 0.
21)
0.50
(0.
49 t
o 0.
51)
Sp
ecifi
city
(95
% C
I)
0.66
(0.
60 t
o 0.
72)
0.61
(0.
59 t
o 0.
63)
Sen
siti
vity
Sen
siti
vity
Sen
siti
vity
Sen
siti
vity
00.
20.
40.
60.
81
00.
20.
40.
60.
81
00.
20.
40.
60.
81
00.
20.
40.
60.
81
Sp
ecifi
city
Sp
ecifi
city
Sp
ecifi
city
Sp
ecifi
city
00.
20.
40.
60.
81
00.
20.
40.
60.
81
00.
20.
40.
60.
81
00.
20.
40.
60.
81
FIG
UR
E 7
Dec
isio
n ru
les
for
adul
ts w
ith M
HI –
sen
sitiv
ity a
nd s
peci
ficity
of d
ecis
ion
rule
s fo
r w
hich
mor
e th
an o
ne d
ata
set i
s av
aila
ble
for
the
outc
ome
need
for
neur
osur
gery
. (C
ontin
ued.
)

© Queen’s Printer and Controller of HMSO 2011. This work was produced by Pandor et al. under the terms of a commissioning contract issued by the Secretary of State for Health.
51 Health Technology Assessment 2011; Vol. 15: No. 27DOI: 10.3310/hta15270
Dut
ch s
tric
t g
uid
elin
e: in
trac
rani
al in
jury
Stu
dy
TP
FPFN
TN
Sen
siti
vity
(95
% C
I)S
pec
ifici
ty (
95%
CI)
Sen
siti
vity
Sp
ecifi
city
Sm
its e
t al
. 20
0770
275
2136
3773
30.
88 (
0.84
to
0.92
)0.
26 (
0.24
to
0.27
)
Dut
ch le
nien
t g
uid
elin
es:
intr
acra
nial
inju
ry
Stu
dy
TP
FPFN
TN
Sen
siti
vity
(95
% C
I)S
pec
ifici
ty (
95%
CI)
Sen
siti
vity
Sp
ecifi
city
Sm
its e
t al
. 20
0770
275
2152
3771
70.
88 (
0.84
to
0.92
)0.
25 (
0.23
to
0.27
)
CH
IP s
imp
le d
ecis
ion
rule
: in
trac
rani
al in
jury
Stu
dy
TP
FPFN
TN
Sen
siti
vity
(95
% C
I)S
pec
ifici
ty (
95%
CI)
Sen
siti
vity
Sp
ecifi
city
Sm
its e
t al
. 20
0769
234
2205
973
30.
96 (
0.93
to
0.98
)0.
25 (
0.23
to
0.27
)
Sca
ndin
avia
n st
rict
cri
teri
a: in
trac
rani
al in
jury
Stu
dy
TP
FPFN
TN
Sen
siti
vity
(95
% C
I)S
pec
ifici
ty (
95%
CI)
Sen
siti
vity
Sp
ecifi
city
Sm
its e
t al
. 20
0770
281
2186
3168
30.
90 (
0.86
to
0.93
)0.
24 (
0.22
to
0.25
)
Iban
ez e
t al.
200
4 ru
le:
intr
acra
nial
inju
ry
Stu
dy
TP
FPFN
TN
Sen
siti
vity
(95
% C
I)S
pec
ifici
ty (
95%
CI)
Sen
siti
vity
Sp
ecifi
city
Iban
ez e
t al
. 20
0460
7845
45
00.
94 (
0.86
to
0.98
)0.
00 (
0.00
to
0.01
)
Ste
in 1
996
rule
: in
trac
rani
al in
jury
Stu
dy
TP
FPFN
TN
Sen
siti
vity
(95
% C
I)S
pec
ifici
ty (
95%
CI)
Sen
siti
vity
Sp
ecifi
city
Iban
ez e
t al
. 20
0460
7453
89
481
0.89
(0.
80 t
o 0.
95)
0.47
(0.
44 t
o 0.
50)
To
mei
et a
l. 19
96 r
ule:
intr
acra
nial
inju
ry
Stu
dy
TP
FPFN
TN
Sen
siti
vity
(95
% C
I)S
pec
ifici
ty (
95%
CI)
Sen
siti
vity
Sp
ecifi
city
Iban
ez e
t al
. 20
0460
7765
36
366
0.93
(0.
85 t
o 0.
97)
0.36
(0.
33 t
o 0.
39)
Lap
ierr
e 19
98 r
ule:
intr
acra
nial
inju
ry
Stu
dy
TP
FPFN
TN
Sen
siti
vity
(95
% C
I)S
pec
ifici
ty (
95%
CI)
Sen
siti
vity
Sp
ecifi
city
Iban
ez e
t al
. 20
0460
7776
96
250
0.93
(0.
85 t
o 0.
97)
0.25
(0.
22 t
o 0.
27)
00.
20.
40.
60.
81
00.
20.
40.
60.
81
00.
20.
40.
60.
81
00.
20.
40.
60.
81
00.
20.
40.
60.
81
00.
20.
40.
60.
81
00.
20.
40.
60.
81
00.
20.
40.
60.
81
00.
20.
40.
60.
81
00.
20.
40.
60.
81
00.
20.
40.
60.
81
00.
20.
40.
60.
81
00.
20.
40.
60.
81
00.
20.
40.
60.
81
00.
20.
40.
60.
81
00.
20.
40.
60.
81
FIG
UR
E 8
Dec
isio
n ru
les
for
adul
ts w
ith M
HI –
sen
sitiv
ity a
nd s
peci
ficity
of d
ecis
ion
rule
s fo
r w
hich
onl
y on
e da
ta s
et is
ava
ilabl
e fo
r th
e ou
tcom
e IC
I. (C
ontin
ued.
)

52 Assessment of diagnostic accuracy
Mur
shid
199
8 ru
le:
intr
acra
nial
inju
ry
Stu
dy
TP
FPFN
TN
Sen
siti
vity
(95
% C
I)S
pec
ifici
ty (
95%
CI)
Sen
siti
vity
Sp
ecifi
city
Iban
ez e
t al
. 20
0460
5019
233
826
0.60
(0.
49 t
o 0.
71)
0.81
(0.
79 t
o 0.
83)
Duu
s et
al.
1994
rul
e: in
trac
rani
al in
jury
Stu
dy
TP
FPFN
TN
Sen
siti
vity
(95
% C
I)S
pec
ifici
ty (
95%
CI)
Sen
siti
vity
Sp
ecifi
city
Duu
s et
al.
1994
564
426
017
741.
00 (
0.40
to
1.00
)0.
81 (
0.79
to
0.82
)
Rei
nus
et a
l. 19
93 r
ule:
intr
acra
nial
inju
ry
Stu
dy
TP
FPFN
TN
Sen
siti
vity
(95
% C
I)S
pec
ifici
ty (
95%
CI)
Sen
siti
vity
Sp
ecifi
city
Rei
nus
et a
l. 19
9364
4010
74
204
0.91
(0.
78 t
o 0.
97)
0.66
(0.
60 t
o 0.
71)
Sab
oo
ri e
t al
. 200
7 ru
le:
intr
acra
nial
inju
ry
Stu
dy
TP
FPFN
TN
Sen
siti
vity
(95
% C
I)S
pec
ifici
ty (
95%
CI)
Sen
siti
vity
Sp
ecifi
city
Sab
oori
et a
l. 20
0767
4642
20
214
1.00
(0.
92 t
o 1.
00)
0.34
(0.
30 t
o 0.
37)
Falim
irsk
i et
al. 2
003
rule
: in
trac
rani
al in
jury
Stu
dy
TP
FPFN
TN
Sen
siti
vity
(95
% C
I)S
pec
ifici
ty (
95%
CI)
Sen
siti
vity
Sp
ecifi
city
Falim
irski
et
al.
2003
5829
107
1118
40.
72 (
0.56
to
0.85
)0.
63 (
0.57
to
0.69
)
CH
IP d
etai
led
dec
isio
n ru
le:
intr
acra
nial
inju
ry
Stu
dy
TP
FPFN
TN
Sen
siti
vity
(95
% C
I)S
pec
ifici
ty (
95%
CI)
Sen
siti
vity
Sp
ecifi
city
Sm
its e
t al
. 20
0769
229
1995
1494
30.
94 (
0.91
to
0.97
)0.
32 (
0.30
to
0.34
)
Saa
dat
et
al. 2
009
rule
: in
trac
rani
al in
jury
Stu
dy
TP
FPFN
TN
Sen
siti
vity
(95
% C
I)S
pec
ifici
ty (
95%
CI)
Sen
siti
vity
Sp
ecifi
city
Saa
dat
et
al.
2009
6620
161
013
71.
00 (
0.83
to
1.00
)0.
46 (
0.40
to
0.52
)
Bo
rczu
k 19
95:
intr
acra
nial
inju
ry
Stu
dy
TP
FPFN
TN
Sen
siti
vity
(95
% C
I)S
pec
ifici
ty (
95%
CI)
Sen
siti
vity
Sp
ecifi
city
Bor
czuk
199
55510
971
510
614
0.92
(0.
85 t
o 0.
96)
0.46
(0.
43 t
o 0.
49)
00.
20.
40.
60.
81
00.
20.
40.
60.
81
00.
20.
40.
60.
81
00.
20.
40.
60.
81
00.
20.
40.
60.
81
00.
20.
40.
60.
81
00.
20.
40.
60.
81
00.
20.
40.
60.
81
00.
20.
40.
60.
81
00.
20.
40.
60.
81
00.
20.
40.
60.
81
00.
20.
40.
60.
81
00.
20.
40.
60.
81
00.
20.
40.
60.
81
00.
20.
40.
60.
81
00.
20.
40.
60.
81
FIG
UR
E 8
Dec
isio
n ru
les
for
adul
ts w
ith M
HI –
sen
sitiv
ity a
nd s
peci
ficity
of d
ecis
ion
rule
s fo
r w
hich
onl
y on
e da
ta s
et is
ava
ilabl
e fo
r th
e ou
tcom
e IC
I. (C
ontin
ued.
)
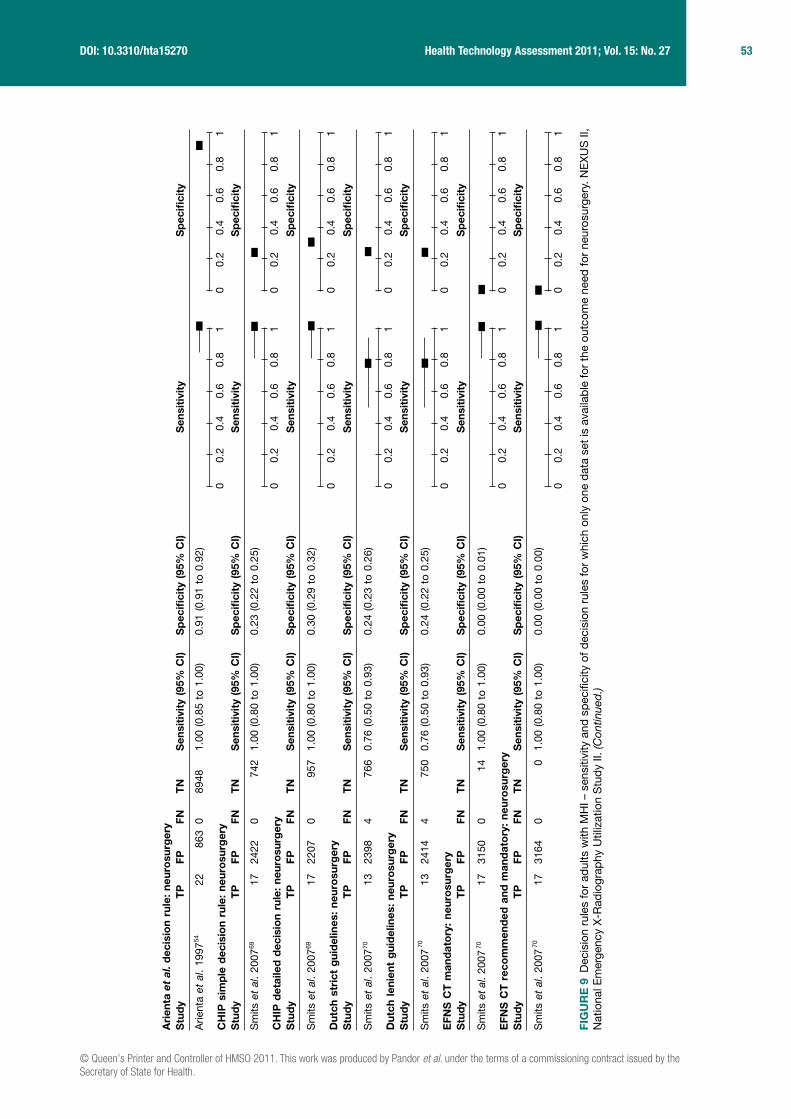
© Queen’s Printer and Controller of HMSO 2011. This work was produced by Pandor et al. under the terms of a commissioning contract issued by the Secretary of State for Health.
53 Health Technology Assessment 2011; Vol. 15: No. 27DOI: 10.3310/hta15270
FIG
UR
E 9
Dec
isio
n ru
les
for
adul
ts w
ith M
HI –
sen
sitiv
ity a
nd s
peci
ficity
of d
ecis
ion
rule
s fo
r w
hich
onl
y on
e da
ta s
et is
ava
ilabl
e fo
r th
e ou
tcom
e ne
ed fo
r ne
uros
urge
ry. N
EX
US
II,
Nat
iona
l Em
erge
ncy
X-R
adio
grap
hy U
tiliz
atio
n S
tudy
II. (
Con
tinue
d.)
Ari
enta
et
al. d
ecis
ion
rule
: ne
uro
surg
ery
Stu
dy
Arie
nta
et a
l. 19
9754
CH
IP s
imp
le d
ecis
ion
rule
: ne
uro
surg
ery
Stu
dy
Sm
its e
t al
. 20
0769
CH
IP d
etai
led
dec
isio
n ru
le:
neur
osu
rger
yS
tud
y
Sm
its e
t al
. 20
0769
Dut
ch s
tric
t g
uid
elin
es:
neur
osu
rger
yS
tud
y
Sm
its e
t al
. 20
0770
Dut
ch le
nien
t g
uid
elin
es:
neur
osu
rger
yS
tud
y
Sm
its e
t al
. 20
0770
EFN
S C
T m
and
ato
ry:
neur
osu
rger
yS
tud
y
Sm
its e
t al
. 200
770
EFN
S C
T r
eco
mm
end
ed a
nd m
and
ato
ry:
neur
osu
rger
yS
tud
y
Sm
its e
t al
. 20
0770
TP
22
TP
17
TP
17
TP
13
TP
13
TP
17
TP
17
FP
863
FP 2422
FP 2207
FP 2398
FP 2414
FP 3150
FP 3164
FN 0 FN 0 FN 0 FN 4 FN 4 FN 0 FN 0
TN
8948
TN
742
TN
957
TN
766
TN
750
TN
14
TN
0
Sen
siti
vity
(95
% C
I)
1.00
(0.
85 t
o 1.
00)
Sen
siti
vity
(95
% C
I)
1.00
(0.
80 t
o 1.
00)
Sen
siti
vity
(95
% C
I)
1.00
(0.
80 t
o 1.
00)
Sen
siti
vity
(95
% C
I)
0.76
(0.
50 t
o 0.
93)
Sen
siti
vity
(95
% C
I)
0.76
(0.
50 t
o 0.
93)
Sen
siti
vity
(95
% C
I)
1.00
(0.
80 t
o 1.
00)
Sen
siti
vity
(95
% C
I)
1.00
(0.
80 t
o 1.
00)
Sp
ecifi
city
(95
% C
I)
0.91
(0.
91 t
o 0.
92)
Sp
ecifi
city
(95
% C
I)
0.23
(0.
22 t
o 0.
25)
Sp
ecifi
city
(95
% C
I)
0.30
(0.
29 t
o 0.
32)
Sp
ecifi
city
(95
% C
I)
0.24
(0.
23 t
o 0.
26)
Sp
ecifi
city
(95
% C
I)
0.24
(0.
22 t
o 0.
25)
Sp
ecifi
city
(95
% C
I)
0.00
(0.
00 t
o 0.
01)
Sp
ecifi
city
(95
% C
I)
0.00
(0.
00 t
o 0.
00)
Sp
ecifi
city
Sp
ecifi
city
Sp
ecifi
city
Sp
ecifi
city
Sp
ecifi
city
Sp
ecifi
city
Sp
ecifi
city
00.
20.
40.
60.
81
00.
20.
40.
60.
81
00.
20.
40.
60.
81
00.
20.
40.
60.
81
00.
20.
40.
60.
81
00.
20.
40.
60.
81
00.
20.
40.
60.
81
Sen
siti
vity
Sen
siti
vity
Sen
siti
vity
Sen
siti
vity
Sen
siti
vity
Sen
siti
vity
Sen
siti
vity
00.
20.
40.
60.
81
00.
20.
40.
60.
81
00.
20.
40.
60.
81
00.
20.
40.
60.
81
00.
20.
40.
60.
81
00.
20.
40.
60.
81
00.
20.
40.
60.
81

54 Assessment of diagnostic accuracy
FIG
UR
E 9
Dec
isio
n ru
les
for
adul
ts w
ith M
HI –
sen
sitiv
ity a
nd s
peci
ficity
of d
ecis
ion
rule
s fo
r w
hich
onl
y on
e da
ta s
et is
ava
ilabl
e fo
r th
e ou
tcom
e ne
ed fo
r ne
uros
urge
ry. N
EX
US
II,
Nat
iona
l Em
erge
ncy
X-R
adio
grap
hy U
tiliz
atio
n S
tudy
II. (
Con
tinue
d.)
NC
WFN
S h
igh
risk
: ne
uro
surg
ery
Stu
dy
Sm
its e
t al
. 20
0770
NE
XU
S I
I: ne
uro
surg
ery
Stu
dy
Ste
in e
t al
. 20
0971
NIC
E s
tric
t cr
iter
ia:
neur
osu
rger
yS
tud
y
Sm
its e
t al
. 20
0770
Sca
ndin
avia
n st
rict
cri
teri
a: n
euro
surg
ery
Stu
dy
Sm
its e
t al
. 20
0770
SIG
N 2
000
CT
as
emer
gen
cy:
neur
osu
rger
yS
tud
y
Sm
its e
t al
. 20
0770
SIG
N 2
000
CT
urg
entl
y: n
euro
surg
ery
Stu
dy
Sm
its e
t al
. 20
0770
TP
16
TP
108
TP
15
TP
16
TP
16
TP
17
FP 2129
FP 4394
FP 1167
FP 2451
FP 2224
FP 3091
FN 1 FN 0 FN 2 FN 1 FN 1 FN 0
TN 10
35
TN 34
53
TN 19
97
TN
713
TN
940
TN
73
Sen
siti
vity
(95
% C
I)
0.94
(0.
71 t
o 1.
00)
Sen
siti
vity
(95
% C
I)
1.00
(0.
97 t
o 1.
00)
Sen
siti
vity
(95
% C
I)
0.88
(0.
64 t
o 0.
99)
Sen
siti
vity
(95
% C
I)
0.94
(0.
71 t
o 1.
00)
Sen
siti
vity
(95
% C
I)
0.94
(0.
71 t
o 1.
00)
Sen
siti
vity
(95
% C
I)
1.00
(0.
80 t
o 1.
00)
Sp
ecifi
city
(95
% C
I)
0.33
(0.
31 t
o 0.
34)
Sp
ecifi
city
(95
% C
I)
0.44
(0.
43 t
o 0.
45)
Sp
ecifi
city
(95
% C
I)
0.63
(0.
61 t
o 0.
65)
Sp
ecifi
city
(95
% C
I)
0.23
(0.
21 t
o 0.
24)
Sp
ecifi
city
(95
% C
I)
0.30
(0.
28 t
o 0.
31)
Sp
ecifi
city
(95
% C
I)
0.02
(0.
02 t
o 0.
03)
Sp
ecifi
city
Sp
ecifi
city
Sp
ecifi
city
Sp
ecifi
city
Sp
ecifi
city
Sp
ecifi
city
00.
20.
40.
60.
81
00.
20.
40.
60.
81
00.
20.
40.
60.
81
00.
20.
40.
60.
81
00.
20.
40.
60.
81
00.
20.
40.
60.
81
Sen
siti
vity
Sen
siti
vity
Sen
siti
vity
Sen
siti
vity
Sen
siti
vity
Sen
siti
vity
00.
20.
40.
60.
81
00.
20.
40.
60.
81
00.
20.
40.
60.
81
00.
20.
40.
60.
81
00.
20.
40.
60.
81
00.
20.
40.
60.
81

© Queen’s Printer and Controller of HMSO 2011. This work was produced by Pandor et al. under the terms of a commissioning contract issued by the Secretary of State for Health.
55 Health Technology Assessment 2011; Vol. 15: No. 27DOI: 10.3310/hta15270
The CCHR26 has been validated in a number of studies26,46,60,65,68,71 and tested using either the high-risk criteria as a threshold or high- and medium-risk criteria. Using the high-risk criteria alone it has a sensitivity of 99–100% and a specificity of 48–77% for neurosurgical injury. 26,46,65,71 The high-risk criteria were derived to identify neurosurgical injury and were not tested to identify any intracranial injuries by the original researchers. Two other studies,65,71 however, used the high-risk rule to identify intracranial injuries. Results varied dramatically between the two studies, so no useful conclusions can be drawn.
Using the high- or medium-risk criteria, the CCHR has a sensitivity of 99–100%65,68,71 and 80–100%26,46,60,65,68,71 for neurosurgical and any ICI, respectively, and corresponding specificities of 37–48% and 39–50%, respectively. The variation in sensitivity for any ICI is probably due to variation in the reference standard: sensitivity was 98–100% in studies in which clinically low-risk patients received telephone follow-up rather than CT,26,46,71 but was 80–86% in studies in which all patients had CT.60,65,68 This likely reflects differential identification of false-negative patients who were at low clinical risk and suffered no complication, but had ICI on CT.
Overall, it therefore appears that the CCHR has high sensitivity for detecting neurosurgical injuries, whether high-risk or high- and medium-risk criteria are used. This was consistent when some of the original patient exclusion criteria were included as risk factors (see Figure 6, CCHR high and medium risk adapted to cohort).68 Sensitivity for any ICI is probably more modest, but the missed cases are unlikely to be clinically significant. Specificity is adequate to allow a meaningful proportion of patients to avoid CT scanning.
The NOC27 rule has been validated in several studies and shown to have excellent sensitivity for neurosurgical lesion (99–100%)46,65,68,71 and any intracranial lesion (95–100%).27,46,60,65,68,71 However, specificity for neurosurgical lesions (3–31%) and any intracranial lesion (3–33%) was generally poor. In most cohorts, application of the NOC rule would have resulted in all patients having a CT scan.
The NICE guidelines1,19 were developed using the CCHR high- and medium-risk criteria. Sensitivity for neurosurgical injury and any injury varied from 88% to 98%57,70,71 and from 67% to 99%57,70,71 respectively, while corresponding specificities varied from 29% to 66% and from 31% to 70%, depending upon whether the 200319 or 20071 guidelines were tested and whether strict or lenient criteria were used. Amendment of the guidelines in 20071 entailed new recommendations for children and a change to management of patients over 65 years with LOC or amnesia. The revised NICE guidelines1 appeared to improve sensitivity at the cost of specificity, although the latter was still acceptable at 31%. The two versions of the rule were tested in the same cohort,57,71 which included adolescents over 10 years of age. It is possible that the improvement in performance of the rule is driven by the changes to the management of children rather than the relatively minor change in the management of adults.
Both the NCWFNS guidelines72 and the SIGN guidelines20 have sensitivities in a similar range to the CCHR when lenient criteria are used, but results for specificity are very variable and generally much lower. The Scandinavian lenient criteria73 have diagnostic parameters in the same range, but with more variation in sensitivity for neurosurgical injury (94–99%)69,74 and specificity for neurosurgical (20–50%) or any injury (21–60%).60,69,74 The NEXUS II (National Emergency X-Radiography Utilization Study II) rule62 appears to have high sensitivity for both neurosurgical and any injury, but variable specificity and very limited validation. Other rules have not been validated in sufficient cohorts and settings to draw meaningful conclusions.
56 Assessment of diagnostic accuracy
ChildrenFrom the 14 studies reporting diagnostic data for decision rules for children with MHI, a total of 15 decision rules30,81–94,96 were identified and are outlined in Table 8 a and b. Four studies presented more than one version of a rule: Greenes and Schutzman derived a decision rule85 for any severity of injury and a scoring system86 for asymptomatic patients from the same cohort; Kupperman et al.90 reported a second rule for those aged < 2 years; the Canadian Assessment of Tomography for Childhood Injury (CATCH)92 rule had a high and a medium- and high-risk format; the University of California–Davis rule (UCD)93 had three versions, each designed to identify a different outcome (need for neurosurgery, brain injury and intervention or brain injury). Four of the rules or their versions were specifically for infants.82,85,86,90
Of studies reporting prediction of ICI, only four rules30,90,91,93 were tested in more than one cohort (Figure 10). Of these four rules, the UCD rule93 for identifying patients with TBI or who needed acute intervention (which equates to ‘any ICI’) had the highest sensitivity (99% and 100%)89,93 with variable values for specificity (12% and 43%). A modified version of the UCD rule reported in Sun et al.,95 in which ‘headache’ and ‘vomiting’ were redefined as ‘severe headache’ and ‘severe vomiting’, produced lower sensitivity (91%) but similar specificity (43%).
The CHALICE rule30 had the next best sensitivity (98% and 98%), but very variable specificity (87% and 5%). The derivation cohort30 used a poor reference standard (3% given CT) and the other cohort89 had different patient inclusion criteria (selecting only those admitted), both of which may contribute to the difference in specificity.
The Paediatric Emergency Care Applied Research Network (PECARN) rule for children ≥ 2 years to < 18 years was tested in two cohorts, a derivation and a validation cohort, reported in the same paper.90 Sensitivity (97% and 97%) and specificity (58% and 60%) were very consistent. The rule appears to sacrifice a small degree of sensitivity for a higher specificity when compared with other rules.
The NEXUS II rule was tested in two studies.89,91 These reported similar sensitivity (96% and 99%) and specificity (15% and 21%), despite differences in the adequacy of the reference standard in one study, and differences in cohort selection and outcome definitions. Although these results seem less promising than the rules discussed earlier, further validation work in a different setting is warranted before conclusions can be drawn.
Nine further rules81,83,84,87–89,92,94,96 were tested in only one cohort (Figure 11) against the outcome of ICI. Of these, one rule (that of Da Dalt et al.83) had excellent sensitivity (100%) and specificity (87%). Further validation studies are needed before conclusions can be drawn regarding this rule. The Royal College of Surgeons (RCS) guidelines96 appeared to have excellent diagnostic accuracy.30 However, the reference standard used was management according to the RCS guidelines with only some patients followed up. This is likely to significantly increase the estimates of sensitivity and specificity.
Six rules30,81 88,90,92,93 were tested for prediction of the need for neurosurgery (Figure 12) and all in only one cohort. All had very good sensitivity (98–100%), but variable specificity (24–86%). The CHALICE rule30 had the highest specificity, but the lowest sensitivity. As observed with the PECARN criteria90 for children ≥ 2 years, the CHALICE rule30 appeared to sacrifice a degree of sensitivity for an improved specificity. All of these rules need further investigation and validation testing in other settings before firm conclusions can be drawn.

© Queen’s Printer and Controller of HMSO 2011. This work was produced by Pandor et al. under the terms of a commissioning contract issued by the Secretary of State for Health.
57 Health Technology Assessment 2011; Vol. 15: No. 27DOI: 10.3310/hta15270
TAB
LE 8
a D
ecis
ion
rule
s fo
r ch
ildre
n an
d in
fant
s w
ith M
HI –
sum
mar
y of
rul
es fo
r ch
ildre
n an
d in
fant
s w
ith M
HI
Crite
ria
Deci
sion
rule
s
Atab
aki e
t al
. 200
881Bu
chan
ich
2007
82Da
Dal
t et a
l. 20
0683
Diet
rich
et a
l. 19
9384
CHAL
ICE30
CATC
H92Gr
eene
s an
d Sc
hutz
man
Guze
l et a
l. 20
0987
Klem
etti
et a
l. 20
0989
Med
ium
risk
High
risk
1999
8520
0186
Vers
ion
of ru
leM
ediu
m-r
isk
fact
ors
High
-ris
k fa
ctor
sDe
cisi
on ru
le
Scor
ing
syst
em
Repo
rted
inAt
abak
i et
al. 2
00881
Buch
anic
h 20
0782
Da D
alt e
t al.
2006
83
Diet
rich
et a
l. 19
9384
Dunn
ing
et
al. 2
00630
Osm
ond
et a
l. 20
0692
Osm
ond
et a
l. 20
0692
Gree
nes
and
Schu
tzm
an
1999
85
Gree
nes
and
Schu
tzm
an
2001
86
Guze
l et a
l. 20
0987
Klem
etti
et a
l. 20
0989
Elig
ibilit
y cr
iteria
a<
21
year
s,
all s
ever
ity<
3 y
ears
, GCS
14
–15
< 1
6 ye
ars,
all
seve
rity,
som
e ex
clus
ions
≥ 2
yea
rs to
20
yea
rs, a
ll se
verit
y, s
ome
excl
usio
ns
< 1
6 ye
ars,
al
l sev
erity
≤ 1
6 ye
ars,
GC
S 13
–15,
w
ith c
linic
al
char
acte
ristic
s
≤ 1
6 ye
ars,
GC
S 13
–15,
w
ith c
linic
al
char
acte
ristic
s
< 2
yea
rs, a
ll se
verit
yAs
ympt
omat
ic
< 2
yea
rs<
16
year
s,
GCS
13–1
5≤
16,
all
seve
rity
Men
tal s
tatu
sGC
S <
15
Abno
rmal
GCS
GCS
< 1
5Ab
norm
al,
GCS
< 1
4 or
GC
S <
15
if <
1-y
ear-
old
Depr
esse
dAb
norm
al
Foca
l/neu
rolo
gica
l de
ficits
Sens
ory
defic
itAb
norm
al
neur
olog
ical
ex
amin
atio
n
Foca
l ne
urol
ogic
al
defic
its
Abno
rmal
vit
al s
igns
in
dica
ting
poss
ible
in
crea
sed
intra
cran
ial
pres
sure
or
foca
l ne
urol
ogic
al
findi
ngs
Neur
olog
ical
de
ficit
Skul
l fra
ctur
eDe
fect
or
sign
s of
ba
sila
r sk
ull
fract
ure
Clin
ical
sig
ns
in ri
sk a
rea,
sk
ull b
ase
fract
ure
Clin
ical
si
gns
of s
kull
fract
ure
Sign
s of
bas
al
skul
l fra
ctur
eb
Susp
ecte
d op
en
skul
l fra
ctur
eCl
inic
al
sign
s of
sku
ll fra
ctur
e
LOC
Prol
onge
dLO
CLO
CLO
CLO
CLO
C
Vom
iting
Vom
iting
Vom
iting
Vom
iting
Two
or m
ore
Vom
iting
Vom
iting
Age
< 2
yea
rsRi
sk fa
ctor
c
Amne
sia
Pers
iste
ntFo
r the
eve
ntAm
nesi
aPT
A
Coag
ulop
athy
cont
inue
d

58 Assessment of diagnostic accuracy
Crite
ria
Deci
sion
rule
s
Atab
aki e
t al
. 200
881Bu
chan
ich
2007
82Da
Dal
t et a
l. 20
0683
Diet
rich
et a
l. 19
9384
CHAL
ICE30
CATC
H92Gr
eene
s an
d Sc
hutz
man
Guze
l et a
l. 20
0987
Klem
etti
et a
l. 20
0989
Med
ium
risk
High
risk
1999
8520
0186
Seizu
res
Seizu
res
Seizu
res
Seizu
res
Seizu
res
Visi
ble
inju
rySc
alp
lace
ratio
nsSc
alp
traum
aLa
rge
bogg
y sc
alp
haem
atom
a
Scal
p ha
emat
oma
loca
tion
and
size
c
Scal
p tra
uma
Beha
viour
Inco
nsol
able
Pers
iste
nt
drow
sine
ssb
Irrita
bilit
y on
ex
amin
atio
nLe
thar
gy o
r irr
itabi
lity
Head
ache
Pers
iste
ntHe
adac
heb
Wor
seni
ng
head
ache
Head
ache
Prev
ious
ne
uros
urge
ry
Failu
re to
impr
ove
bFa
ilure
to re
ach
GCS
15 in
2
hour
s
Mec
hani
sm o
f inj
ury
Bicy
cle-
rela
ted
inju
ry
High
spe
ed
road
traf
fic,
or h
igh
spee
d or
fall
> 3
m
Dang
erou
s
Dete
riora
tion
in
men
tal s
tatu
sM
enta
l st
atus
ch
ange
Othe
rDi
zzin
ess
Visi
on
chan
ges,
ge
nder
, are
a of
re
side
nce
Susp
icio
n of
non
-ac
cide
ntal
in
jury
Bulg
ing
font
anel
leBl
urre
d vis
ion
Verti
go
PTA,
pos
t-tra
umat
ic s
eizu
re.
a El
igib
ility
crite
ria a
re e
ither
the
incl
usio
n cr
iteria
of t
he d
eriva
tion
coho
rt or
the
patie
nts
for w
hom
the
rule
was
inte
nded
ther
e is
no
deriv
atio
n co
hort.
b Th
ese
char
acte
ristic
s ar
e de
scrib
ed a
s hi
gh-r
isk
fact
ors.
It is
unc
lear
whe
ther
or n
ot th
ese
are
inco
rpor
ated
in th
is v
ersi
on o
f the
rule
.c
Thes
e cr
iteria
use
d to
gen
erat
e a
scor
e be
twee
n 0
and
8. A
sco
re o
f ≥ 3
indi
cate
s th
at C
T is
requ
ired.
TAB
LE 8
a D
ecis
ion
rule
s fo
r ch
ildre
n an
d in
fant
s w
ith M
HI –
sum
mar
y of
rul
es fo
r ch
ildre
n an
d in
fant
s w
ith M
HI (
cont
inue
d)

© Queen’s Printer and Controller of HMSO 2011. This work was produced by Pandor et al. under the terms of a commissioning contract issued by the Secretary of State for Health.
59 Health Technology Assessment 2011; Vol. 15: No. 27DOI: 10.3310/hta15270
Crite
ria
Deci
sion
rule
s
NEXU
S II91
NOC88
PECA
RN90
Quay
le e
t al.
1997
94a R
CS g
uide
lines
96
UCD93
(≥ 2
yea
rs to
<
18
year
s)(<
2 y
ears
)Ne
uros
urge
ryIn
terv
entio
n or
br
ain
inju
ryTB
I
Vers
ion
of ru
le≥
2 y
ears
to
< 1
8 ye
ars90
< 2
yea
rs90
Neur
osur
gery
93In
terv
entio
n or
br
ain
inju
ry93
TBI93
Repo
rted
inKl
emet
ti et
al.
2009
;89 O
man
20
0691
Hayd
el a
nd
Sche
mbe
kar 2
00388
Kupp
erm
an e
t al
. 200
990
Kupp
erm
an e
t al
. 200
990
Quay
le e
t al.
1997
94Du
nnin
g et
al.
2006
30
Palc
hak
et a
l. 20
03;93
Kle
met
ti et
al
. 200
989
Palc
hak
et a
l. 20
03;93
Sun
et a
l. 20
0795
Palc
hak
et a
l. 20
0393
Elig
ibilit
y cr
iteria
bAl
l age
s, b
lunt
he
ad tr
aum
a5–
17 y
ears
, GCS
15
with
clin
ical
ch
arac
teris
tics,
so
me
excl
usio
n
≥ 2
yea
rs
to <
18
year
s, G
CS
14–1
5, s
ome
excl
usio
ns (e
.g.
trivia
l inj
ury)
< 2
yea
rs, G
CS
14–1
5, s
ome
excl
usio
ns (e
.g.
trivia
l inj
ury)
< 1
8 ye
ars,
no
n-tri
vial i
njur
y (w
ith c
linic
al
char
acte
ristic
s)
All s
ever
ities
an
d ag
es,a w
ith
addi
tiona
l pro
toco
l fo
r chi
ldre
n
< 1
8 ye
ars,
no
n-tri
vial h
ead
inju
ry, w
ith c
linic
al
char
acte
ristic
, som
e ex
clus
ions
< 1
8 ye
ars,
not
tri
vial h
ead
inju
ry,
with
clin
ical
ch
arac
teris
tic,
som
e ex
clus
ions
< 1
8 ye
ars,
GCS
14
–15,
non
-tri
vial,
with
clin
ical
ch
arac
teris
tic,
som
e ex
clus
ions
Men
tal s
tatu
sAl
tere
d le
vel o
f al
ertn
ess
Alte
red
Alte
red
Alte
red
Abno
rmal
cAb
norm
alc
Abno
rmal
c
Foca
l/neu
rolo
gica
l de
ficits
Neur
olog
ical
de
ficit
Foca
l neu
rolo
gica
l de
ficit
Foca
l neu
rolo
gica
l de
ficit
Skul
l fra
ctur
eEv
iden
ce o
f si
gnifi
cant
sku
ll fra
ctur
e
Clin
ical
ly su
spec
ted
skul
l fra
ctur
eCl
inic
al s
igns
of
bas
ilar s
kull
fract
ure
Palp
able
or
uncl
ear
Sign
s of
bas
ilar
skul
l fra
ctur
eCl
inic
al s
igns
of
skul
l fra
ctur
eCl
inic
al s
igns
of
skul
l fra
ctur
e
LOC
LOC
LOC
LOCd
Vom
iting
Pers
iste
ntVo
miti
ngVo
miti
ngPe
rsis
tent
dVo
miti
ngVo
miti
nge
Vom
iting
Age
N/A
to c
hild
ren
(≥ 6
5 ye
ars)
Amne
sia
Amne
siad
Coag
ulop
athy
Coag
ulop
athy
Seizu
res
PTS
Visi
ble
inju
rySc
alp
haem
atom
aTr
aum
a ab
ove
the
clav
icle
sf
Scal
p ha
emat
oma
Scal
p la
cera
tion,
br
uise
or s
wel
lingd
Sign
ifica
nt
max
illofa
cial
in
jurie
sd
Scal
p ha
emat
oma
in a
chi
ld ≤
2 y
ears
Scal
p ha
emat
oma
in a
chi
ld ≤
2 y
ears
Into
xicat
ion
Drug
or a
lcoh
ol
cont
inue
d
TAB
LE 8
b D
ecis
ion
rule
s fo
r ch
ildre
n an
d in
fant
s w
ith M
HI –
sum
mar
y of
rul
es fo
r ch
ildre
n an
d in
fant
s w
ith M
HI

60 Assessment of diagnostic accuracy
Crite
ria
Deci
sion
rule
s
NEXU
S II91
NOC88
PECA
RN90
Quay
le e
t al.
1997
94a R
CS g
uide
lines
96
UCD93
(≥ 2
yea
rs to
<
18
year
s)(<
2 y
ears
)Ne
uros
urge
ryIn
terv
entio
n or
br
ain
inju
ryTB
I
Beha
viour
Abno
rmal
be
havio
urAc
ting
abno
rmal
ly ac
cord
ing
to
pare
nt
Head
ache
Head
ache
Seve
rePe
rsis
tent
dHe
adac
hee
Prev
ious
neu
rosu
rger
y
Failu
re to
impr
ove
Mec
hani
sm o
f inj
ury
Seve
reg
Seve
reh
Viol
entd
Fall
from
> 1
mi o
r on
to h
ard
surfa
cei
Dete
riora
tion
in m
enta
l st
atus
Othe
rSh
ort-
term
mem
ory
defic
itsj
Tens
e fo
ntan
elle
i
Susp
ecte
d no
n-ac
cide
ntal
inju
ryi
MVC
, mot
or v
ehic
le c
ollis
ion;
RCS
, Roy
al C
olle
ge o
f Sur
geon
s.a
RCS
guid
elin
es96
for a
ll ag
es is
in th
ree
parts
: (1)
Indi
catio
ns fo
r ref
erra
l to
neur
osur
geon
and
/or u
rgen
t CT:
com
a; d
eter
iora
ting
leve
l of c
onsc
ious
ness
or p
rogr
essi
ve fo
cal n
euro
logi
cal d
efici
t; fra
ctur
e of
the
skul
l if w
ith
conf
usio
n, d
eter
iora
ting
impa
irmen
t of c
onsc
ious
ness
, fits
, or n
euro
logi
cal s
ympt
oms
or s
igns
; ope
n in
jury
(dep
ress
ed c
ompo
und
fract
ure
of s
kull
vaul
t, ba
se o
f sku
ll fra
ctur
e or
pen
etra
ting
inju
ry);
patie
nt fu
lfils
crit
eria
fo
r CT
of th
e he
ad w
ithin
refe
rring
hos
pita
l but
this
can
not b
e pe
rform
ed w
ithin
a re
ason
able
tim
e (e
.g. 2
–4 h
ours
). (2
) Ind
icat
ions
for C
T of
the
head
prio
r to
refe
rral t
o ne
uros
urge
ons:
full
cons
ciou
snes
s bu
t with
a s
kull
fract
ure;
fits
with
out a
sku
ll fra
ctur
e; c
onfu
sion
or n
euro
logi
cal s
ympt
oms/
sign
s pe
rsis
ting
afte
r ini
tial a
sses
smen
t and
resu
scita
tion;
uns
tabl
e sy
stem
ic s
tate
pre
clud
ing
trans
fer t
o ne
uros
urge
ry, d
iagn
osis
unc
erta
in;
tens
e fo
ntan
elle
or s
utur
e di
asta
sis
in a
chi
ld; s
igni
fican
t hea
d in
jury
requ
iring
gen
eral
ana
esth
esia
. (3)
Indi
catio
ns fo
r ref
erra
l to
neur
osur
geon
s af
ter C
T of
the
head
: abn
orm
al C
T sc
an (a
fter n
euro
surg
ical
opi
nion
on
imag
es tr
ansf
erre
d el
ectro
nica
lly) o
r nor
mal
CT
scan
but
uns
atis
fact
ory
prog
ress
.b
Elig
ibilit
y cr
iteria
are
eith
er th
e in
clus
ion
crite
ria o
f the
der
ivatio
n co
hort
or th
e pa
tient
s fo
r who
m th
e ru
le w
as in
tend
ed if
ther
e is
no
deriv
atio
n co
hort.
c Ab
norm
al m
enta
l sta
tus
pres
ent i
f GCS
< 1
5, if
pat
ient
con
fuse
d, s
omno
lent
, rep
etiti
ve o
r slo
w to
resp
ond
to v
erba
l com
mun
icat
ion.
d In
dica
tions
for s
kull
radi
ogra
phy
in c
hild
ren.
If s
kull
radi
ogra
ph is
pos
itive
, CT
requ
ired.
Oth
er in
dica
tions
for a
ll ag
es a
lso
appl
y.a
e De
finiti
on u
sed
by S
un e
t al.;
95 h
igh-
risk
vom
iting
, sev
ere
or p
rogr
essi
ve h
eada
che.
f Co
ntus
ions
, abr
asio
ns, l
acer
atio
ns, h
aem
atom
a, d
efor
mity
, clin
ical
ly su
spec
ted
faci
al o
r sku
ll fra
ctur
e.g
Seve
re m
echa
nism
defi
ned
as M
VC w
ith p
atie
nt e
ject
ion,
dea
th o
f ano
ther
pas
seng
er, o
r rol
love
r, pe
dest
rian
or b
icyc
list w
ithou
t hel
met
stru
ck b
y a
mot
oris
ed v
ehic
le, f
alls
of >
1.5
m, h
ead
stru
ck b
y a
high
-impa
ct o
bjec
th
Mot
or v
ehic
le c
ollis
ion
with
pat
ient
eje
ctio
n, d
eath
of a
noth
er p
asse
nger
, or r
ollo
ver,
pede
stria
n or
bic
yclis
t with
out h
elm
et s
truck
by
a m
otor
ised
veh
icle
, fal
ls o
f > 0
.9 m
, hea
d st
ruck
by
a hi
gh-im
pact
obj
ect.
i In
dica
tions
for s
kull
radi
ogra
phy
in in
fant
s. If
sku
ll ra
diog
raph
is p
ositi
ve, C
T re
quire
d. O
ther
indi
catio
ns fo
r all
ages
als
o ap
ply.
a
j De
fined
by
pers
iste
nt a
nter
ogra
de a
mne
sia
and
norm
al G
CS, t
o th
ree-
obje
ct re
call.
TAB
LE 8
b D
ecis
ion
rule
s fo
r ch
ildre
n an
d in
fant
s w
ith M
HI –
sum
mar
y of
rul
es fo
r ch
ildre
n an
d in
fant
s w
ith M
HI (
cont
inue
d)

© Queen’s Printer and Controller of HMSO 2011. This work was produced by Pandor et al. under the terms of a commissioning contract issued by the Secretary of State for Health.
61 Health Technology Assessment 2011; Vol. 15: No. 27DOI: 10.3310/hta15270
UC
D r
ule:
a in
trac
rani
al in
jury
Stu
dy
TP
FPFN
TN
Sen
siti
vity
(95
% C
I)S
pec
ifici
ty (
95%
CI)
Sen
siti
vity
Sp
ecifi
city
Kle
met
ti et
al.
2009
8982
354
148
0.99
(0.
93 t
o 1.
00)
0.12
(0.
09 t
o 0.
16)
Pal
chak
et
al.
2003
9310
511
110
827
1.00
(0.
97 t
o 1.
00)
0.43
(0.
40 t
o 0.
45)
Sun
et
al.
2007
9512
587
613
652
0.91
(0.
84 t
o 0.
95)
0.43
(0.
40 t
o 0.
45)
NE
XU
S I
I: in
trac
rani
al in
jury
Stu
dy
TP
FPFN
TN
Sen
siti
vity
(95
% C
I)S
pec
ifici
ty (
95%
CI)
Sen
siti
vity
Sp
ecifi
city
Kle
met
ti et
al.
2009
8980
318
384
0.96
(0.
90 t
o 0.
99)
0.21
(0.
17 t
o 0.
25)
Om
an 2
006
9113
612
982
230
0.99
(0.
95 t
o 1.
00)
0.15
(0.
13 t
o 0.
17)
CH
ALI
CE
rul
e: in
trac
rani
al in
jury
Stu
dy
TP
FPFN
TN
Sen
siti
vity
(95
% C
I)S
pec
ifici
ty (
95%
CI)
Sen
siti
vity
Sp
ecifi
city
Dun
ning
et
al.
2006
3016
428
534
1955
80.
98 (
0.94
to
0.99
)0.
87 (
0.87
to
0.88
)K
lem
etti
et a
l. 20
0989
8138
22
200.
98 (
0.92
to
1.00
)0.
05 (
0.03
to
0.08
)
PE
CA
RN
> 2
yea
rs,
< 1
8 ye
ars
rule
:b in
trac
rani
al in
jury
Stu
dy
TP
FPFN
TN
Sen
siti
vity
(95
% C
I)S
pec
ifici
ty (
95%
CI)
Sen
siti
vity
Sp
ecifi
city
Kup
per
man
et
al.
2009
9061
2550
237
980.
97 (
0.89
to
1.00
)0.
60 (
0.59
to
0.61
)K
upp
erm
an e
t al
. 20
0990
208
10,4
127
14,6
560.
97 (
0.93
to
0.99
)0.
58 (
0.58
to
0.59
)
00.
20.
40.
60.
81
00.
20.
40.
60.
81
00.
20.
40.
60.
81
00.
20.
40.
60.
81
00.
20.
40.
60.
81
00.
20.
40.
60.
81
00.
20.
40.
60.
81
00.
20.
40.
60.
81
FIG
UR
E 1
0 D
ecis
ion
rule
s fo
r ch
ildre
n w
ith M
HI –
sen
sitiv
ity a
nd s
peci
ficity
of d
ecis
ion
rule
s fo
r w
hich
mor
e th
an o
ne d
ata
set i
s av
aila
ble
for
the
outc
ome
ICI.
a, S
un e
t al.95
giv
e a
stric
ter
defin
ition
of h
eada
che
and
vom
iting
than
the
orig
inal
rul
e; b
, der
ivat
ion
and
valid
atio
n co
hort
s re
port
ed in
the
sam
e ar
ticle
.

62 Assessment of diagnostic accuracy
Ata
bak
i et
al. 2
008
rule
: in
trac
rani
al in
jury
Stu
dy
TP
FPFN
TN
Sen
siti
vity
(95
% C
I)S
pec
ifici
ty (
95%
CI)
Sen
siti
vity
Sp
ecifi
city
Ata
bak
i et
al.
2008
8162
478
345
70.
95 (
0.87
to
0.99
)0.
49 (
0.46
to
0.52
)
CA
TC
H r
ule:
intr
acra
nial
inju
ry
Stu
dy
TP
FPFN
TN
Sen
siti
vity
(95
% C
I)S
pec
ifici
ty (
95%
CI)
Sen
siti
vity
Sp
ecifi
city
Osm
ond
et
al.
2006
9216
718
023
1809
0.98
(0.
95 t
o 1.
00)
0.50
(0.
48 t
o 0.
52)
Da
Dal
t et
al.
gro
up A
+B
vs
C+
D:
intr
acra
nial
inju
ry
Stu
dy
TP
FPFN
TN
Sen
siti
vity
(95
% C
I)S
pec
ifici
ty (
95%
CI)
Sen
siti
vity
Sp
ecifi
city
Da
Dal
t et
al.
2006
8322
478
032
981.
00 (
0.85
to
1.00
)0.
87 (
0.86
to
0.88
)
Die
tric
h et
al.
199
3 ru
le:
intr
acra
nial
inju
ry
Stu
dy
TP
FPFN
TN
Sen
siti
vity
(95
% C
I)S
pec
ifici
ty (
95%
CI)
Sen
siti
vity
Sp
ecifi
city
Die
tric
h et
al.
1993
8416
150
00
1.00
(0.
79 t
o 1.
00)
0.00
(0.
00 t
o 0.
02)
Guz
el e
t al.
200
9 ru
le:
intr
acra
nial
inju
ry
Kle
met
ti e
t al.
200
9 ru
le:
intr
acra
nial
inju
ry
Stu
dy
TP
FPFN
TN
Sen
siti
vity
(95
% C
I)S
pec
ifici
ty (
95%
CI)
Sen
siti
vity
Sp
ecifi
city
Guz
el e
t al
. 20
0987
4615
421
116
0.69
(0.
56 t
o 0.
79)
0.43
(0.
37 t
o 0.
49)
Stu
dy
TP
FPFN
TN
Sen
siti
vity
(95
% C
I)S
pec
ifici
ty (
95%
CI)
Sen
siti
vity
Sp
ecifi
city
Kle
met
ti et
al.
2009
8978
285
511
70.
94 (
0.86
to
0.98
)0.
29 (
0.25
to
0.34
)
NO
C:
intr
acra
nial
inju
ry
Stu
dy
TP
FPFN
TN
Sen
siti
vity
(95
% C
I)S
pec
ifici
ty (
95%
CI)
Sen
siti
vity
Sp
ecifi
city
Hay
del
and
Sch
emb
ekar
200
38814
120
041
1.00
(0.
77 t
o 1.
00)
0.25
(0.
19 t
o 0.
33)
Qua
yle
1997
rul
e: in
trac
rani
al in
jury
Stu
dy
TP
FPFN
TN
Sen
siti
vity
(95
% C
I)S
pec
ifici
ty (
95%
CI)
Sen
siti
vity
Sp
ecifi
city
Qua
yle
et a
l. 19
9794
1243
1525
10.
44 (
0.25
to
0.65
)0.
85 (
0.81
to
0.89
)
RC
S g
uid
elin
es:
intr
acra
nial
inju
ry
Stu
dy
TP
FPFN
TN
Sen
siti
vity
(95
% C
I)S
pec
ifici
ty (
95%
CI)
Sen
siti
vity
Sp
ecifi
city
Dun
ning
et
al.
2006
3024
212
1939
21,2
720.
86 (
0.82
to
0.90
)0.
95 (
0.94
to
0.95
)
00.
20.
40.
60.
81
00.
20.
40.
60.
81
00.
20.
40.
60.
81
00.
20.
40.
60.
81
00.
20.
40.
60.
81
00.
20.
40.
60.
81
00.
20.
40.
60.
81
00.
20.
40.
60.
81
00.
20.
40.
60.
81
00.
20.
40.
60.
81
00.
20.
40.
60.
81
00.
20.
40.
60.
81
00.
20.
40.
60.
81
00.
20.
40.
60.
81
00.
20.
40.
60.
81
00.
20.
40.
60.
81
00.
20.
40.
60.
81
00.
20.
40.
60.
81
FIG
UR
E 1
1 D
ecis
ion
rule
s fo
r ch
ildre
n w
ith M
HI –
sen
sitiv
ity a
nd s
peci
ficity
of d
ecis
ion
rule
s fo
r w
hich
onl
y on
e da
ta s
et is
ava
ilabl
e fo
r th
e ou
tcom
e IC
I.

© Queen’s Printer and Controller of HMSO 2011. This work was produced by Pandor et al. under the terms of a commissioning contract issued by the Secretary of State for Health.
63 Health Technology Assessment 2011; Vol. 15: No. 27DOI: 10.3310/hta15270
Ata
bak
i et a
l. 2
008
rule
: ne
uro
surg
ery
Stu
dy
TP
FPFN
TN
Sen
siti
vity
(95
% C
I)S
pec
ifici
ty (
95%
CI)
Sen
siti
vity
Sp
ecifi
city
Ata
bak
i et
al.
2008
816
534
046
01.
00 (
0.54
to
1.00
)0.
46 (
0.43
to
0.49
)
CA
TC
H r
ule:
neu
rosu
rger
y
Stu
dy
TP
FPFN
TN
Sen
siti
vity
(95
% C
I)S
pec
ifici
ty (
95%
CI)
Sen
siti
vity
Sp
ecifi
city
Osm
ond
et
al.
2006
9226
1111
026
431.
00 (
0.87
to
1.00
)0.
70 (
0.69
to
0.72
)
CH
ALI
CE
rul
e: n
euro
surg
ery
Stu
dy
TP
FPFN
TN
Sen
siti
vity
(95
% C
I)S
pec
ifici
ty (
95%
CI)
Sen
siti
vity
Sp
ecifi
city
Dun
ning
et
al.
2006
3013
430
763
19,5
590.
98 (
0.94
to
1.00
)0.
86 (
0.86
to
0.87
)
NO
C:
neur
osu
rger
y
Stu
dy
TP
FPFN
TN
Sen
siti
vity
(95
% C
I)S
pec
ifici
ty (
95%
CI)
Sen
siti
vity
Sp
ecifi
city
Hay
del
and
Sch
emb
ekar
20
0388
612
80
411.
00 (
0.54
to
1.00
)0.
24 (
0.18
to
0.31
)
UC
D r
ule:
neu
rosu
rger
y
Stu
dy
TP
FPFN
TN
Sen
siti
vity
(95
% C
I)S
pec
ifici
ty (
95%
CI)
Sen
siti
vity
Sp
ecifi
city
Pal
chak
et
al.
2003
9329
719
012
951.
00 (
0.88
to
1.00
)0.
64 (
0.62
to
0.66
)
PE
CA
RN
> 2
yea
rs:
neur
osu
rger
y
Stu
dy
TP
FPFN
TN
Sen
siti
vity
(95
% C
I)S
pec
ifici
ty (
95%
CI)
Sen
siti
vity
Sp
ecifi
city
Kup
per
man
et
al.
2009
9011
2600
038
001.
00 (
0.72
to
1.00
)0.
59 (
0.58
to
0.61
)
00.
20.
40.
60.
81
00.
20.
40.
60.
81
00.
20.
40.
60.
81
00.
20.
40.
60.
81
00.
20.
40.
60.
81
00.
20.
40.
60.
81
00.
20.
40.
60.
81
00.
20.
40.
60.
81
00.
20.
40.
60.
81
00.
20.
40.
60.
81
00.
20.
40.
60.
81
00.
20.
40.
60.
81
FIG
UR
E 1
2 D
ecis
ion
rule
s fo
r ch
ildre
n w
ith M
HI –
sen
sitiv
ity a
nd s
peci
ficity
for
the
outc
ome
neur
osur
gery
.

64 Assessment of diagnostic accuracy
For infants (Figure 13), only the PECARN rule was tested in two cohorts against the outcome ICI.90 This rule gave the most promising results out of the seven rules identified for ICI.82,84–86,90,91,93,95 Only the PECARN90 rule (Figure 14) was tested against the outcome of need for neurosurgery in infants. All of these rules require further investigation and validation testing in other settings before firm conclusions can be drawn.
Individual characteristicsDescription of included studiesAdultsThe design and patient characteristics of the 42 studies (representing 44 papers)26,27,29,46,54,55,57–
63,67,77,98–126 that evaluated the diagnostic accuracy of individual characteristics for identifying ICI or need for neurosurgery in adults with MHI are summarised in Table 9. Twenty-three studies were from the USA,27,29,55,58,59,61,62,100–102,104,107–112,116,118–123,126 two each from Italy,54,57 Germany,98,115 Spain,60,103 Japan,63,106 Canada,26,46 and India,120,124 and one from each of Saudi Arabia,77,114 Malaysia,99 Hong Kong,105 Islamic Republic of Iran,67 Denmark117 and Taiwan.125 One further study was an international collaboration.113 Ten studies were multicentre.26,46,67,98,106,108,62,113,118,119 Of the 42 studies, 22 were prospective; 16 recruited consecutive patients,26,27,29,57–60,62,67,98,100,101,105,108,111,115,124 whereas two selected a convenience sample46,126 and four did not report the method of selection. 61,109,113,118 Sixteen studies were retrospective54,55,67,102–106,110,112,114,116,117,119,121–123,125 and four63,107,120,127 did not report the mode of data collection.
The cohort sizes of the included studies ranged from 39120 to 13,728.62 The mean age of the cohorts ranged from 17114 to 4760 years, with two cohorts108,110 reporting older patients separately, with mean ages in excess of 70 years. The variation in mean age range appeared to be influenced by the minimum age for inclusion in the study; some studies included all ages29
,62,77,111,112,114,118,119,123,124 or did not report an age restriction,59,61,104,106,115,117,120–122,125 whereas others set a lower age limit.26,27,46,54,55, 57,58,60,63,67,98–103,105,107–110,113,116,126 The median prevalence of need for neurosurgery was 1.7% (IQR 1.2% to 3.8%). The prevalence of ICI ranged from 0.48%117 to 78.1%99 with a median prevalence of 9.4% (IQR 6.8% to 18%). This wide variation is likely to be owing to differences in patient selection criteria, adequacy of reference standards and definitions of ICI, and neurosurgery. There was no study that clearly selected the whole population of interest. As detailed in Table 9, patients were excluded based on GCS score, absence or presence of clinical characteristics at presentation or because they had not had a CT scan; alternatively, selection criteria were rendered unclear by phrases such as ‘those admitted’. Twenty studies selected only patients with GCS 13–15,26,46,55,98,99,101–103,105,110,112,113,115,119–125 six only patients with GCS 14 or 15,57,58,60,63,108,109 another five only patients with GCS 15,27,29,67,107,111,126 one only those with GCS 14,59 three studies54,104,118 selected all severities of injury (with data available for a GCS 13–15 subgroup in two studies)54,104 and six did not report GCS scores.61,62,77,106,114,116,117 One further study included GCS 13–15 or GCS < 13 if intoxicated.100 In 26 studies26,27,46,54,57,58,60,63,67,98,100–103,105,107–109,112,114,115,117,119,121,123,124 patients were not selected on the basis of having had a CT scan, whereas in 14 studies29,55,59,61,62,99,104,110,111,113,116,118,122,125,126 patients were only enrolled if they had a CT scan. The remaining two studies106,120 did not state whether this was used as an inclusion criterion. Selection of patients based on clinical characteristics at presentation varied widely.
Definitions of outcomes and the reference standards used varied across the 42 studies (Table 10). For ICI, 21 studies54,55,58,63,67,77,99,101,102,107–110,112,113,116,118,120,122,125,126 gave only a very general description of the outcome, such as ICI or positive CT findings, with no definition. The remainder varied in the level of detail provided and the type of injuries included, with some including all common acute lesions including skull fractures (e.g. Biberthaler et al.),98 and others defining injury in terms of severity and clinical significance (e.g. Mower et al.;62 Stiell et al.26,46).62 For the

© Queen’s Printer and Controller of HMSO 2011. This work was produced by Pandor et al. under the terms of a commissioning contract issued by the Secretary of State for Health.
65 Health Technology Assessment 2011; Vol. 15: No. 27DOI: 10.3310/hta15270
PE
CA
RN
< 2
yea
rs r
ule:
a intr
acra
nial
inju
ry in
fant
s
Stu
dy
TP
FPFN
TN
Sen
siti
vity
(95
% C
I)S
pec
ifici
ty (
95%
CI)
Sen
siti
vity
Sp
ecifi
city
Kup
per
man
et
al.
2009
9072
3901
145
280.
99 (
0.93
to
1.00
)0.
54 (
0.53
to
0.55
)K
upp
erm
an e
t al
. 20
0990
2510
150
1176
1.00
(0.
86 t
o 1.
00)
0.54
(0.
52 t
o 0.
56)
UC
D r
ule:
b tra
umat
ic b
rain
inju
ry o
nly,
infa
nts
Stu
dy
TP
FPFN
TN
Sen
siti
vity
(95
% C
I)S
pec
ifici
ty (
95%
CI)
Sen
siti
vity
Sp
ecifi
city
Pal
chak
et
al.
2003
9315
119
060
1.00
(0.
78 t
o 1.
00)
0.34
(0.
27 t
o 0.
41)
Sun
et
al.
2007
957
179
022
1.00
(0.
59 t
o 1.
00)
0.11
(0.
07 t
o 0.
16)
Buc
hani
ch e
t al
. 20
07 r
ule:
intr
acra
nial
inju
ry in
fant
s
Stu
dy
TP
FPFN
TN
Sen
siti
vity
(95
% C
I)S
pec
ifici
ty (
95%
CI)
Sen
siti
vity
Sp
ecifi
city
Buc
hani
ch e
t al
. 20
0782
2245
030
1.00
(0.
85 t
o 1.
00)
0.40
(0.
29 t
o 0.
52)
Die
tric
h et
al.
1993
rul
e: in
trac
rani
al in
jury
infa
nts
Stu
dy
TP
FPFN
TN
Sen
siti
vity
(95
% C
I)S
pec
ifici
ty (
95%
CI)
Sen
siti
vity
Sp
ecifi
city
Die
tric
h et
al.
1993
841
150
31.
00 (
0.03
to
1.00
)0.
17 (
0.04
to
0.41
)
Gre
enes
and
Sch
utzm
an 1
999
rule
: in
trac
rani
al in
jury
infa
nts
Stu
dy
TP
FPFN
TN
Sen
siti
vity
(95
% C
I)S
pec
ifici
ty (
95%
CI)
Sen
siti
vity
Sp
ecifi
city
Gre
enes
and
S
chut
zman
199
98516
161
1441
70.
53 (
0.34
to
0.72
)0.
72 (
0.68
to
0.76
)
Gre
enes
and
Sch
utzm
an 2
001
sco
ring
sys
tem
: in
trac
rani
al in
jury
infa
nts
Stu
dy
TP
FPFN
TN
Sen
siti
vity
(95
% C
I)S
pec
ifici
ty (
95%
CI)
Sen
siti
vity
Sp
ecifi
city
Gre
enes
and
S
chut
zman
200
18613
960
631.
00 (
0.75
to
1.00
)0.
40 (
0.32
to
0.48
)
NE
XU
S I
I: in
trac
rani
al in
jury
infa
nts
Stu
dy
TP
FPFN
TN
Sen
siti
vity
(95
% C
I)S
pec
ifici
ty (
95%
CI)
Sen
siti
vity
Sp
ecifi
city
Om
an 2
006
9125
269
015
1.00
(0.
86 t
o 1.
00)
0.05
(0.
03 t
o 0.
09)
00.
20.
40.
60.
81
00.
20.
40.
60.
81
00.
20.
40.
60.
81
00.
20.
40.
60.
81
00.
20.
40.
60.
81
00.
20.
40.
60.
81
00.
20.
40.
60.
81
00.
20.
40.
60.
81
00.
20.
40.
60.
81
00.
20.
40.
60.
81
00.
20.
40.
60.
81
00.
20.
40.
60.
81
00.
20.
40.
60.
81
00.
20.
40.
60.
81
FIG
UR
E 1
3 D
ecis
ion
rule
s fo
r in
fant
s w
ith M
HI –
sen
sitiv
ity a
nd s
peci
ficity
for
the
outc
ome
ICI.
a, d
eriv
atio
n an
d va
lidat
ion
coho
rts
repo
rted
in th
e sa
me
artic
le; b
, Sun
et a
l.95 g
ive
a st
ricte
r de
finiti
on o
f hea
dach
e an
d vo
miti
ng th
an th
e or
igin
al r
ule.

66 Assessment of diagnostic accuracy
TAB
LE 9
Ind
ivid
ual c
linic
al c
hara
cter
istic
s in
adu
lts w
ith M
HI –
stu
dy d
esig
n an
d pa
tient
cha
ract
eris
tics
of in
clud
ed s
tudi
es
Author, year
Country
Design
No. of patients, n
Mean or median age, years (range)
Prevalence of neurosurgery
Prevalence of ICI
CT as inclusion? (yes/no)
Male, n
Patients with MHI, n
Age group
Prevalence of GCS 15, n
Other significant inclusion criteria
Other significant exclusion criteria
Adul
ts (a
ny c
ohor
t sel
ectin
g pa
tient
s ab
ove
a gi
ven
age)
Arie
nta
et a
l. 19
9754
Italy
R10
,000
Mea
n NR
(6
to 9
5)15
4/10
,000
(1
.54%
)No
54%
9917
/10,
000
(99%
)Ad
ults
9833
/10,
000
(98.
3%)
≥ 6
yea
rs o
f age
. Pr
esen
ting
to th
e ED
dire
ctly
Child
ren
< 6
yea
rs
of a
ge
9917
(s
ubse
t of
abov
e)
24/9
917
(0.2
%)
85/9
917
(0.8
6%)
NoNR
for t
his
subs
et99
1/99
1 (1
00%
)Ad
ults
9833
/991
7 (9
9%)
Subs
et o
f abo
ve,
GCS
13–1
5 (a
pplie
d at
dat
a ex
tract
ion
stag
e)
Subs
et o
f abo
ve,
patie
nts
in a
com
a ex
clud
ed a
t dat
a ex
tract
ion
stag
e
Bibe
rthal
er
et a
l. 20
0698
Germ
any
P, Csa
1309
Med
ian:
47
(IQR
32
to 6
5)
93
/130
9 (7
.1%
)No
855/
1309
(6
5%)
1309
/130
9 (1
00%
)Ad
ults
1152
/130
9 (8
8%)
≥ 1
8 ye
ars.
Isol
ated
he
ad tr
aum
a,
adm
itted
with
in 3
ho
urs,
GCS
13–
15
at a
dmis
sion
, on
e or
mor
e of
: br
ief L
OC, P
TA,
naus
ea, v
omiti
ng,
seve
re h
eada
che,
di
zzin
ess,
ver
tigo,
in
toxic
atio
n,
antic
oagu
latio
n an
d ag
e >
60
year
s
Preg
nant
wom
en,
pris
oner
s an
d m
ultip
le-in
jure
d pa
tient
s
Borc
zuk
1995
55
USA
R14
48M
ean
NR
(16
to 9
9)
119/
1448
; (8
.2%
)Ye
s99
9/14
48
(69%
)14
48/1
448
(100
%)
Adul
ts12
11/1
448
(83.
6%)
≥ 1
7 ye
ars
of a
ge.
GCS
13 o
r mor
e,
blun
t hea
d tra
uma,
ha
d CT
sca
n
≤ 1
6 ye
ars,
pat
ient
s w
ith p
enet
ratin
g cr
ania
l tra
uma
Stu
dy
TP
FPFN
TN
Sen
siti
vity
(95
% C
I)S
pec
ifici
ty (
95%
CI)
Sen
siti
vity
Sp
ecifi
city
Kup
per
man
et
al.
2009
905
1035
011
761.
00 (
0.48
to
1.00
)0.
53 (
0.51
to
0.55
)
00.
20.
40.
60.
81
00.
20.
40.
60.
81
FIG
UR
E 1
4 D
ecis
ion
rule
s fo
r in
fant
s w
ith M
HI –
sen
sitiv
ity a
nd s
peci
ficity
for
the
outc
ome
neur
osur
gery
.

© Queen’s Printer and Controller of HMSO 2011. This work was produced by Pandor et al. under the terms of a commissioning contract issued by the Secretary of State for Health.
67 Health Technology Assessment 2011; Vol. 15: No. 27DOI: 10.3310/hta15270
Author, year
Country
Design
No. of patients, n
Mean or median age, years (range)
Prevalence of neurosurgery
Prevalence of ICI
CT as inclusion? (yes/no)
Male, n
Patients with MHI, n
Age group
Prevalence of GCS 15, n
Other significant inclusion criteria
Other significant exclusion criteria
Chan
et a
l. 20
0599
Mal
aysi
aNR
105
Who
le
coho
rt m
ean:
30
.4 (1
2 to
81)
82
/105
(7
8.1%
)Ye
s (a
pplie
d at
dat
a ex
tract
ion
stag
e)
78/1
05
(74.
3%)
105/
105
(100
%)
Adul
ts37
/105
(3
5.2%
)>
12
year
s.
Mal
aysi
an ID
ca
rds,
GCS
13–
15,
haem
odyn
amic
ally
stab
le, w
ith C
T sc
an
NR
92
(sub
set o
f ab
ove)
As a
bove
71
/92
(77.
2%)
Yes
(app
lied
at d
ata
extra
ctio
n st
age)
NRNR
Adul
tsNR
Subs
et o
f ab
ove
who
al
so u
nder
wen
t ra
diog
raph
y
Cook
et a
l. 19
9410
0
USA
P, Cs10
7M
ean
NR
(16
to N
R)
9/10
7 (8
.4%
)No
NRNR
Adul
tsNR
> 1
6 ye
ars.
Ev
iden
ce o
f al
coho
l int
oxic
atio
n (c
onfir
med
by
bloo
d te
st),
pres
umed
M
HI, G
CS ≥
13
or
< 1
3 w
ith e
than
ol
leve
ls ≥
200
mg/
dl)
Pene
tratin
g he
ad
traum
a
Fabb
ri et
al.
2005
57
Italy
P, Csb
7955
Med
ian:
44
(IQR
27
to 7
1)
108/
7955
(1
.4%
, re
porte
d as
1.3
%)
542/
7955
(6
.8%
)No
4415
/795
5 (5
5.5%
)b
7955
/795
5 (1
00%
)Ad
ults
7426
/795
5 (9
3.4%
)≥
10
year
s. A
cute
M
HI w
ithin
24
hour
s of
inju
ry
Uncl
ear h
isto
ry,
unst
able
vita
l sig
ns,
GCS
< 1
4, p
enet
ratin
g in
jurie
s, v
olun
tary
di
scha
rge,
re-
atte
ndan
ces
Falim
irski
et
al. 2
00358
USA
P, Cs33
1M
ean:
39
.21
(16
to 9
5)
40
/331
(1
2.1%
)No
214/
331
(65%
)33
1/33
1 (1
00%
)Ad
ults
302/
331
(91.
2%)
≥ 1
6 ye
ars
of
age.
Blu
nt in
jury
, w
itnes
sed
LOC
or a
mne
sia,
GCS
14
–15
GCS
13, o
r tra
nsfe
rred
with
a C
T sc
an cont
inue
d
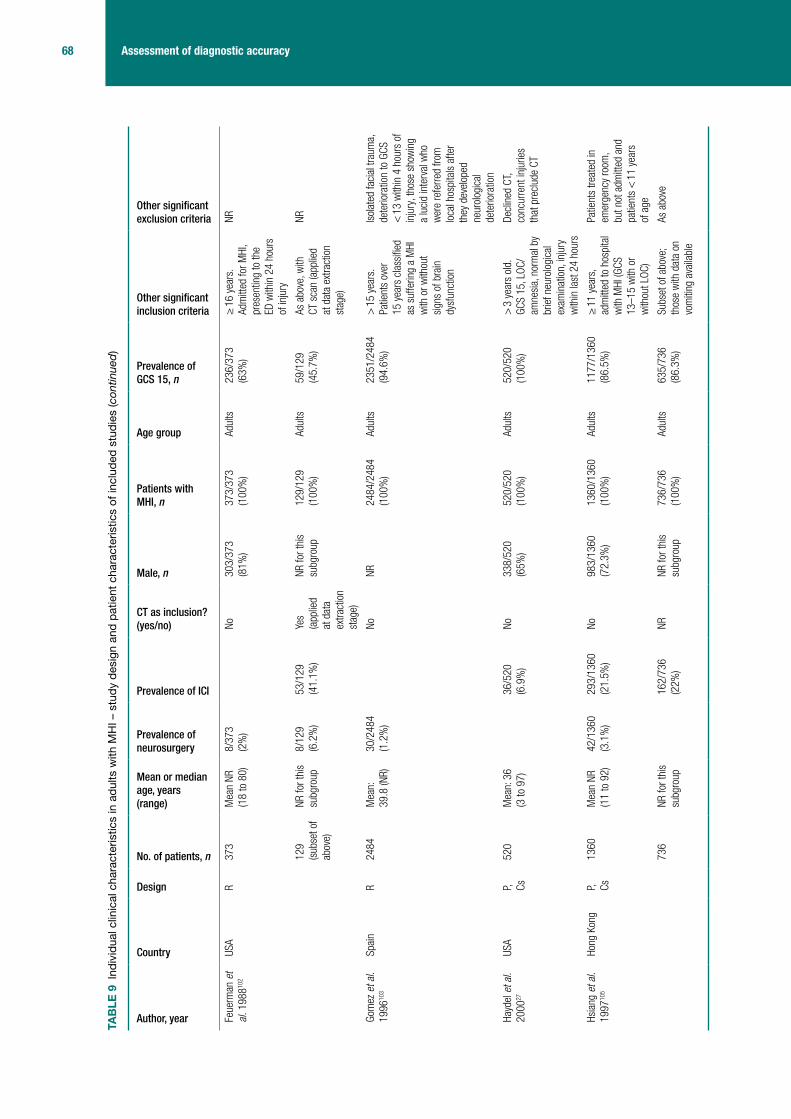
68 Assessment of diagnostic accuracy
Author, year
Country
Design
No. of patients, n
Mean or median age, years (range)
Prevalence of neurosurgery
Prevalence of ICI
CT as inclusion? (yes/no)
Male, n
Patients with MHI, n
Age group
Prevalence of GCS 15, n
Other significant inclusion criteria
Other significant exclusion criteria
Feue
rman
et
al. 1
98810
2
USA
R37
3M
ean
NR
(18
to 8
0)
8/37
3 (2
%)
No
303/
373
(81%
)37
3/37
3 (1
00%
)Ad
ults
236/
373
(63%
)≥
16
year
s.
Adm
itted
for M
HI,
pres
entin
g to
the
ED w
ithin
24
hour
s of
inju
ry
NR
129
(sub
set o
f ab
ove)
NR fo
r thi
s su
bgro
up8/
129
(6.2
%)
53/1
29
(41.
1%)
Yes
(app
lied
at d
ata
extra
ctio
n st
age)
NR fo
r thi
s su
bgro
up12
9/12
9 (1
00%
)Ad
ults
59/1
29
(45.
7%)
As a
bove
, with
CT
sca
n (a
pplie
d at
dat
a ex
tract
ion
stag
e)
NR
Gom
ez e
t al.
1996
103
Spai
nR
2484
Mea
n:
39.8
(NR)
30/2
484
(1.2
%)
No
NR24
84/2
484
(100
%)
Adul
ts23
51/2
484
(94.
6%)
> 1
5 ye
ars.
Pa
tient
s ov
er
15 y
ears
cla
ssifi
ed
as s
uffe
ring
a M
HI
with
or w
ithou
t si
gns
of b
rain
dy
sfun
ctio
n
Isol
ated
faci
al tr
aum
a,
dete
riora
tion
to G
CS
< 1
3 w
ithin
4 h
ours
of
inju
ry, t
hose
sho
win
g a
luci
d in
terv
al w
ho
wer
e re
ferre
d fro
m
loca
l hos
pita
ls a
fter
they
dev
elop
ed
neur
olog
ical
de
terio
ratio
n
Hayd
el e
t al.
2000
27
USA
P, Cs52
0M
ean:
36
(3 to
97)
36
/520
(6
.9%
)No
338/
520
(65%
)52
0/52
0 (1
00%
)Ad
ults
520/
520
(100
%)
> 3
yea
rs o
ld.
GCS
15, L
OC/
amne
sia,
nor
mal
by
brie
f neu
rolo
gica
l ex
amin
atio
n, in
jury
w
ithin
last
24
hour
s
Decl
ined
CT,
conc
urre
nt in
jurie
s th
at p
recl
ude
CT
Hsia
ng e
t al.
1997
105
Hong
Kon
gP, Cs
1360
Mea
n NR
(1
1 to
92)
42/1
360
(3.1
%)
293/
1360
(2
1.5%
)No
983/
1360
(7
2.3%
)13
60/1
360
(100
%)
Adul
ts11
77/1
360
(86.
5%)
≥ 1
1 ye
ars,
ad
mitt
ed to
hos
pita
l w
ith M
HI (G
CS
13–1
5 w
ith o
r w
ithou
t LOC
)
Patie
nts
treat
ed in
em
erge
ncy
room
, bu
t not
adm
itted
and
pa
tient
s <
11
year
s of
age
736
NR fo
r thi
s su
bgro
up
162/
736
(22%
)NR
NR fo
r thi
s su
bgro
up73
6/73
6 (1
00%
)Ad
ults
635/
736
(86.
3%)
Subs
et o
f abo
ve;
thos
e w
ith d
ata
on
vom
iting
ava
ilabl
e
As a
bove
TAB
LE 9
Ind
ivid
ual c
linic
al c
hara
cter
istic
s in
adu
lts w
ith M
HI –
stu
dy d
esig
n an
d pa
tient
cha
ract
eris
tics
of in
clud
ed s
tudi
es (c
ontin
ued)

© Queen’s Printer and Controller of HMSO 2011. This work was produced by Pandor et al. under the terms of a commissioning contract issued by the Secretary of State for Health.
69 Health Technology Assessment 2011; Vol. 15: No. 27DOI: 10.3310/hta15270
Author, year
Country
Design
No. of patients, n
Mean or median age, years (range)
Prevalence of neurosurgery
Prevalence of ICI
CT as inclusion? (yes/no)
Male, n
Patients with MHI, n
Age group
Prevalence of GCS 15, n
Other significant inclusion criteria
Other significant exclusion criteria
Iban
ez
and
Arik
an
2004
60
Spai
nP, Cs
1101
Mea
n:
46.7
(15
to 9
9)
83/1
101
(7.5
%)
No57
3/11
01
(52%
)11
01/1
101
(100
%)
Adul
ts97
8 (8
8.8%
)>
14
year
s. M
HI
(GCS
14
or 1
5)
with
or w
ithou
t LOC
Refe
rrals
from
oth
er
hosp
itals
Jere
t et a
l. 19
9310
7
USA
NR71
2M
ean:
35
.6 (1
8 to
90)
67
/712
(9
.4%
)No
520/
712
(73%
)71
2/71
2 (1
00%
)Ad
ults
712/
712
(100
%)
≥ 1
8 ye
ars.
GCS
15
as
dete
rmin
ed
by c
onsu
ltant
, bl
unt h
ead
traum
a,
thos
e w
ith L
OC o
r am
nesi
a
Patie
nts
trans
ferre
d fro
m o
ther
hos
pita
ls,
< 1
8 ye
ars
of a
ge,
no a
mne
sia
or L
OC,
pene
tratin
g cr
ania
l tra
uma
or p
rese
ntin
g m
ore
that
24
hour
s af
ter t
he e
vent
. Tho
se
who
refu
sed
CT
Livin
gsto
n et
al
. 199
1109
USA
P, NR60
Mea
n: 2
9 (1
6 to
70)
11
/60
(18.
3%)
No49
/60
(81.
7%)
60/6
0 (1
00%
)Ad
ults
38/6
0 (6
3.3%
)>
16
year
s.a A
ll pa
tient
s w
ith M
HI
(tran
sien
t LOC
or
sign
ifica
nt p
ost-
traum
atic
am
nesi
a GC
S 14
or 1
5,
norm
al n
euro
logi
cal
exam
inat
ion)
GCS
< 1
4, s
igns
of
basi
lar s
kull
fract
ure,
ad
mitt
ed fo
r oth
er
inju
ries
111
(sep
arat
e co
hort)
Mea
n NR
(1
7 to
79)
15
/111
(1
3.5%
)No
89/1
11 (8
0%)
111/
111
(100
%)
Adul
ts91
/111
(8
2.0%
)As
abo
veAs
abo
ve
Livin
gsto
n et
al
. 200
0108
USA
P, Cs21
52M
ean:
35
.8
33
6/21
52
(15.
6%)
No14
90/2
152
(69.
2%)
2152
/215
2 (1
00%
)Ad
ults
NR≥
16
year
s. A
ll pa
tient
s w
ith M
HI
(tran
sien
t LOC
or
post
-tra
umat
ic
amne
sia,
ED
reco
rded
GCS
14
or 1
5)
Disc
harg
ed
< 2
0 ho
urs,
CT
data
m
issi
ng, C
T sc
an
> 1
2 ho
urs
afte
r in
jury
, die
d <
20
hour
s af
ter i
njur
y
cont
inue
d

70 Assessment of diagnostic accuracy
Author, year
Country
Design
No. of patients, n
Mean or median age, years (range)
Prevalence of neurosurgery
Prevalence of ICI
CT as inclusion? (yes/no)
Male, n
Patients with MHI, n
Age group
Prevalence of GCS 15, n
Other significant inclusion criteria
Other significant exclusion criteria
Mul
ler e
t al.
2007
113
Mul
tinat
iona
l (N
orw
ay, U
K,
Switz
erla
nd
and
Swed
en)
P, NR22
6M
ean:
39
(18
to 9
2)
21/2
26 (9
%)
Yes
168/
226
(74.
3%)
226/
226
(100
%)
Adul
ts18
0/22
6 (7
9.6%
)≥
18
year
s.
Head
inju
ry, L
OC
or re
trogr
ade
amne
sia,
GCS
13–
15, b
lood
sam
ple
and
CT s
can
with
in
12 h
ours
of t
raum
a
Neur
olog
ical
or
psyc
hiat
ric d
isor
der,
foca
l neu
rolo
gica
l de
ficit,
mul
tiple
in
jurie
s re
quiri
ng
imm
edia
te
inte
rven
tion,
rena
l or
liver
dis
ease
Nels
on e
t al.
1992
116
USA
Ra13
1M
ean
NR
(16
to N
R)
20
/131
(1
5.3%
)Ye
sNR
NRAd
ults
NR≥
15
year
s. N
R;
how
ever
, maj
or
indi
cato
rs fo
r CT
scan
ning
incl
ude
LOC,
abn
orm
al
neur
olog
ical
ex
amin
atio
n,
phys
ical
or h
isto
ric
evid
ence
of h
ead
traum
a
NR
Ono
et a
l. 20
0763
Japa
nNR
1064
Mea
n:
46 (1
0 to
10
4)
50
/106
4 (4
.7%
)No
621/
1064
(5
8.4%
)10
64/1
064
(100
%)
Adul
ts91
2/10
64
(85.
7%)
≥ 1
0 ye
ars.
With
he
ad in
jury
, with
in
6 ho
urs
of in
jury
, GC
S ≥
14
Extre
mel
y tri
vial
inju
ry (s
calp
or f
acia
l w
ound
s), t
hose
who
re
fuse
d ex
amin
atio
n
Sabo
ori e
t al.
2007
67
Isla
mic
Re
publ
ic o
f Ira
n
P, Cs68
2M
ean:
29
(6 to
85)
46
/682
(6
.7%
)No
534/
682
(78.
3%)
682/
682
(100
%)
Adul
ts68
2/68
2 (1
00%
)≥
6 y
ears
of a
ge,
GCS
15>
24
hour
s po
st
inju
ry, n
o cl
ear h
isto
ry
of tr
aum
a, o
bvio
us
pene
tratin
g sk
ull i
njur
y or
obv
ious
dep
ress
ed
fract
ure
TAB
LE 9
Ind
ivid
ual c
linic
al c
hara
cter
istic
s in
adu
lts w
ith M
HI –
stu
dy d
esig
n an
d pa
tient
cha
ract
eris
tics
of in
clud
ed s
tudi
es (c
ontin
ued)

© Queen’s Printer and Controller of HMSO 2011. This work was produced by Pandor et al. under the terms of a commissioning contract issued by the Secretary of State for Health.
71 Health Technology Assessment 2011; Vol. 15: No. 27DOI: 10.3310/hta15270
Author, year
Country
Design
No. of patients, n
Mean or median age, years (range)
Prevalence of neurosurgery
Prevalence of ICI
CT as inclusion? (yes/no)
Male, n
Patients with MHI, n
Age group
Prevalence of GCS 15, n
Other significant inclusion criteria
Other significant exclusion criteria
Stie
ll et
al.
2001
26
Cana
daP, Cs
3121
Mea
n:
38.7
(16
to 9
9)
25
4/31
21
(8.1
4%)
No21
35/3
121
(68.
4%)
3121
/312
1 (1
00%
)Ad
ults
2489
/312
1 (7
9.8%
)≥
16
year
s.
Witn
esse
d LO
C or
am
nesi
a or
di
sorie
ntat
ion
and
GCS
≥ 1
3 an
d in
jury
in la
st
24 h
ours
< 1
6 ye
ars.
M
inim
al in
jury
, no
hist
ory
of tr
aum
a as
prim
ary
even
t, pe
netra
ting
inju
ry,
obvio
us d
epre
ssed
sk
ull f
ract
ure,
fo
cal n
euro
logi
cal
defic
it, u
nsta
ble
vital
sig
ns, s
eizu
re,
blee
ding
dis
orde
r/an
ticoa
gula
nts,
re
asse
ssm
ent o
f pr
evio
us in
jury
, pr
egna
nt
Stie
ll et
al.
2005
46
Cana
daP, Cv
2707
Mea
n:
38.4
(16
to 9
9)
41/2
707
(1.5
%)
231/
2707
(8
.5%
)No
1884
/270
7 (6
9.6%
)27
07/2
707
(100
%)
Adul
ts20
49/2
707
(75.
7%)
As p
er S
tiell
et a
l. 20
0126
As p
er S
tiell
et a
l. 20
0126
1822
(s
ubse
t of
abov
e)
Mea
n:
37.7
(16
to 9
9)
8/18
22
(0.4
%)
97/1
822
(5.3
%)
No12
46/1
822
(68.
4%)
Adul
ts18
22/1
822
(100
%)
Subs
et (G
CS 1
5)
Vilk
e et
al.
2000
126
USA
P, Cva
5837
.4 (1
7 to
77)
1/58
(1
.7%
)3/
58 (5
.2%
)Ye
s42
/58
(72%
)58
/58
(100
%)
Adul
ts58
/58
(100
%)
> 1
4 ye
ars.
Any
pa
tient
s 14
yea
rs
or o
lder
who
is
getti
ng a
hea
d CT
fo
r non
-pen
etra
ting
head
trau
ma
No L
OC o
r am
nesi
a fo
r the
eve
nt,
preg
nanc
y, c
linic
al
into
xicat
ion,
oth
er
sign
ifica
nt tr
aum
a w
ith
com
petin
g pa
in o
r GC
S sc
ore
≤ 1
4 cont
inue
d

72 Assessment of diagnostic accuracy
Author, year
Country
Design
No. of patients, n
Mean or median age, years (range)
Prevalence of neurosurgery
Prevalence of ICI
CT as inclusion? (yes/no)
Male, n
Patients with MHI, n
Age group
Prevalence of GCS 15, n
Other significant inclusion criteria
Other significant exclusion criteria
Dunh
am e
t al
. 199
6101
USA
P, Cs20
32M
ean
NR
(14
to 6
0)
128/
2032
(6
.3%
)No
NR20
32/2
032
(100
%)
Adul
ts,
excl
udin
g ol
der
adul
ts
1481
/203
2 (7
2.9%
)14
–60
year
s.
Mild
cog
nitiv
e im
pairm
ent,
trans
porte
d to
ED
by
Mar
yland
em
erge
ncy
serv
ices
. GCS
15
with
am
nesi
a, a
nd/
or w
itnes
sed
LOC
or G
CS 1
4/13
with
or
with
out L
OC o
r am
nesi
a
Tran
sfer
red
from
an
othe
r hos
pita
l. Th
ose
> 6
0 ye
ars
P, Cs22
0M
ean:
72
.5
35
/220
(1
5.9%
)NR
NR22
0/22
0 (1
00%
)Ad
ults
, ol
der
150/
220
(68.
2%)
> 6
0 ye
ars,
as
abov
eAs
abo
ve
Mac
k et
al.
2003
110
USA
R13
3M
ean:
80
.4 (6
5 to
NR)
19
/133
(1
4.3%
)Ye
s45
/133
(3
3.8%
)13
3/13
3 (1
00%
)Ad
ults
, ol
der
113/
133
(85%
)≥
65
year
s. H
ad C
T sc
an, h
ad m
inor
he
ad tr
aum
a (G
CS
13–1
5)
Thos
e w
ho d
id n
ot
sust
ain
head
trau
ma
All a
ges
(any
coh
ort r
epor
ting
a co
hort
with
no
age
limits
)c M
iller e
t al
. 199
6,11
1 c 1
99729
USA
P, Cs
c 138
2111
32.6
(NR)
3/13
82
(0.2
%)
84/1
382
(6.1
%)
Yes
NR13
82/1
382
(100
%)
All a
ges
1382
/138
2 (1
00%
)Al
l age
s. G
CS 1
5 or
age
-app
ropr
iate
be
havio
ur in
ch
ildre
n, L
OC/
amne
sia,
CT
afte
r bl
unt h
ead
traum
a.
With
in 2
4 ho
urs
of
inju
ry29
NR
2143
29
(som
e cr
osso
ver
with
abo
ve
coho
rt)c
NR5/
2143
(0
.2%
)c
138/
2143
(6
.4%
)c
Yesc
NR21
43/2
143
(100
%)c
All a
gesc
2143
/214
3 (1
00%
)c
As a
bove
cAs
abo
vec
TAB
LE 9
Ind
ivid
ual c
linic
al c
hara
cter
istic
s in
adu
lts w
ith M
HI –
stu
dy d
esig
n an
d pa
tient
cha
ract
eris
tics
of in
clud
ed s
tudi
es (c
ontin
ued)

© Queen’s Printer and Controller of HMSO 2011. This work was produced by Pandor et al. under the terms of a commissioning contract issued by the Secretary of State for Health.
73 Health Technology Assessment 2011; Vol. 15: No. 27DOI: 10.3310/hta15270
Author, year
Country
Design
No. of patients, n
Mean or median age, years (range)
Prevalence of neurosurgery
Prevalence of ICI
CT as inclusion? (yes/no)
Male, n
Patients with MHI, n
Age group
Prevalence of GCS 15, n
Other significant inclusion criteria
Other significant exclusion criteria
Mor
an e
t al.
1994
112
USA
R20
0M
ean:
33
.4 (6
to
83)
8/
200;
(4%
)No
126/
200
(63%
)20
0/20
0 (1
00%
)Al
l age
sNR
All a
ges.
GCS
13
–15
at b
oth
the
scen
e an
d in
the
ED. P
oten
tial h
ead
inju
ry. T
rans
porte
d to
faci
lity
by a
ir am
bula
nce
NR
d Mow
er e
t al.
2005
62
USA
P, Cs13
,728
NR
917/
13,7
28
(6.7
%)
Yes
8988
/13,
728
(66%
)NR
All a
ges
NRAl
l age
s. H
ad C
T sc
an, a
cute
blu
nt
head
trau
ma
Dela
yed
pres
enta
tion,
pe
netra
ting
traum
a
e Mur
shid
19
94,11
4 e 1
99877
Saud
i Ara
bia
Re 5
6611
4M
ean:
17
(1 m
onth
to
80
year
s)
7/56
6 (1
.2%
) N
RNo
396/
566
(70%
)56
6/56
6 (1
00%
)Al
l age
sNR
All a
ges,
adm
itted
fo
r MHI
, with
in
24 h
ours
of t
he
inju
ry. H
ad C
T sc
an
(app
lied
at d
ata
extra
ctio
n st
age)
NR
13177
(som
e cr
osso
ver
with
ab
ove
coho
rt)e
Mea
n: 1
7 (1
mon
th
to 8
0 ye
ars)
e
30
/131
(2
2.9%
)e
Yes
(app
lied
at d
ata
extra
ctio
n st
age)
e
91/1
31
(69.
2%)e
100%
eAl
l age
se11
2/13
1 (8
5.5%
)e
As a
bove
. Had
a
CT s
can
and
radi
ogra
phy
(app
lied
at d
ata
extra
ctio
n st
age)
e
NRe
Shac
kfor
d et
al
. 199
2119
USA
R42
3NR
97/4
23
(22.
9%)
NoNR
423/
423
(100
%)
All a
ges
NRAl
l age
s. L
OC, P
TA
and
GCS
> 1
2Si
gnifi
cant
non
-CNS
in
jurie
s –
exte
nsive
de
finiti
on g
iven
Schy
noll
et
al. 1
99311
8
USA
P, NR26
4NR
32
/264
(1
2.12
%)
Yes
139/
264
(53%
)24
4/26
4 (9
2.4%
)Al
l age
s21
3/26
4 (8
0.7%
)Al
l age
s. B
lunt
he
ad tr
aum
a,
had
head
CT
(at d
iscr
etio
n of
ph
ysic
ian)
Pene
tratin
g he
ad
traum
a
cont
inue
d

74 Assessment of diagnostic accuracy
Author, year
Country
Design
No. of patients, n
Mean or median age, years (range)
Prevalence of neurosurgery
Prevalence of ICI
CT as inclusion? (yes/no)
Male, n
Patients with MHI, n
Age group
Prevalence of GCS 15, n
Other significant inclusion criteria
Other significant exclusion criteria
Tend
er a
nd
Awas
thi
2003
123
USA
R25
535
(1 to
97
)15
3/25
5 (6
0%)
No21
9/25
5 (8
5.9%
)25
5/25
5 (1
00%
)Al
l age
s19
4/25
5 (7
6.1%
)Al
l age
s. G
CS
13–1
5, e
valu
ated
in
the
ED a
nd
adm
itted
to th
e ne
uros
urge
ry
serv
ice
Pene
tratin
g m
issi
le
inju
ry, t
hose
trea
ted
but n
ot a
dmitt
ed fr
om
the
acci
dent
room
Thiru
ppat
hy
and
Mut
huku
mar
20
0412
4
Indi
aP, Cs
381
Mea
n NR
(3
mon
ths
– 78
ye
ars)
27/3
81
(7.0
9%)
148/
381
(38.
9%
repo
rted,
38
.8%
ca
lcul
ated
)
NoNR
381/
381
(100
%)
All a
ges
285/
381
(74.
8%)
All a
ges.
GCS
13
–15.
Ref
erre
d fro
m E
D. M
ost E
D ph
ysic
ians
refe
r to
hea
d in
jury
uni
t irr
espe
ctive
of
seve
rity
Seve
re p
olyt
raum
a,
alco
holic
into
xicat
ion,
kn
own
hist
ory
of
seizu
re d
isor
der o
r co
agul
atio
n di
sord
er,
patie
nts
refe
rred
with
CT
sca
n
Age
limit
not r
epor
ted
Hara
d an
d Ke
rste
in
1992
104
USA
Ra49
7NR
17
2/49
7 (3
4.6%
)Ye
s36
2/49
7 (7
3%)
302/
497
(60.
8%)
NR25
1/49
7 (5
0.5%
)Th
ose
who
had
CT
(LOC
, am
nesi
a,
foca
l defi
cits
, de
pres
sed
or o
pen
skul
l fra
ctur
e,
dete
riora
ting
men
tal s
tatu
s an
d pu
pilla
ry in
equa
lity)
an
d LO
C st
atus
w
as k
now
n
LOC
stat
us n
ot k
now
n
302
NR
55/3
02
(18.
2%)
Yes
NR fo
r thi
s su
bset
302/
302
(100
%)
NR25
1/30
2 (8
3.1%
)GC
S 13
–15
and
had
CT
(LOC
, am
nesi
a,
foca
l defi
cits
, de
pres
sed
or o
pen
skul
l fra
ctur
e,
dete
riora
ting
men
tal s
tatu
s an
d pu
pilla
ry in
equa
lity)
TAB
LE 9
Ind
ivid
ual c
linic
al c
hara
cter
istic
s in
adu
lts w
ith M
HI –
stu
dy d
esig
n an
d pa
tient
cha
ract
eris
tics
of in
clud
ed s
tudi
es (c
ontin
ued)

© Queen’s Printer and Controller of HMSO 2011. This work was produced by Pandor et al. under the terms of a commissioning contract issued by the Secretary of State for Health.
75 Health Technology Assessment 2011; Vol. 15: No. 27DOI: 10.3310/hta15270
Author, year
Country
Design
No. of patients, n
Mean or median age, years (range)
Prevalence of neurosurgery
Prevalence of ICI
CT as inclusion? (yes/no)
Male, n
Patients with MHI, n
Age group
Prevalence of GCS 15, n
Other significant inclusion criteria
Other significant exclusion criteria
Holm
es e
t al.
1997
59
USA
P, Cs26
4NR
4/26
4 (1
.5%
)35
/264
(1
3.3%
, re
porte
d as
13
.2%
)
Yes
181/
264
(68.
6%)
264/
264
(100
%)
NR0/
264
(0%
)Cl
osed
hea
d in
jury
, ev
iden
ce o
f LOC
or
amne
sia
afte
r hea
d tra
uma
and
GCS
14. H
ad C
T sc
an
Dela
y in
pre
sent
atio
n >
4 h
ours
afte
r inj
ury
Hung
et a
l. 19
9610
6
Japa
nRa
7000
NR47
6/70
00
(6.8
%)
NRNR
for t
his
subg
roup
7000
/700
0 (1
00%
)NR
NRNR
NR
Mad
den
et
al. 1
99561
USA
P, NR53
7NR
91
/537
(1
7%)
Yes
NRNR
NR35
4/53
7 (6
5.9%
)Al
l pat
ient
s w
ith
acut
e he
ad tr
aum
a pr
esen
ting
to th
e ED
with
hea
d CT
Patie
nts
who
rece
ived
faci
al C
T sc
ans
with
out c
ereb
ral
stud
ies
Mus
sack
et
al. 2
00211
5
Germ
any
P, Cs13
9M
ean:
36
(28
to
60.1
)
19
/139
(1
3.7%
)No
106/
139
(76.
3%)
139/
139
(100
%)
NR12
9/13
9 (9
2.8%
)Hi
stor
y of
trau
ma,
GC
S 13
–15,
one
or
mor
e of
: LOC
(<
5 m
inut
es),
amne
sia,
nau
sea,
vo
miti
ng o
r ver
tigo
Refu
sed
CT, b
lood
-dr
awin
g, c
oncu
rrent
in
jurie
s th
at p
recl
uded
CT
Rose
norn
et
al. 1
99111
7
Denm
ark
R18
76NR
9/
1876
(0
.48%
)No
NRNR
NRNR
MHI
pat
ient
s ad
mitt
ed
(neu
rosu
rgic
al,
orth
opae
dic,
pa
edia
tric)
Thos
e di
scha
rged
di
rect
ly
Shar
ma
et
al. 2
00112
0
Indi
aNR
, Cs
39NR
18
/39
(46.
2%)
NRNR
39/3
9 (1
00%
)NR
NRAd
mitt
ed fo
r hea
d in
jury
. GCS
13–
15
data
ext
ract
ed
Left
agai
nst a
dvic
e, n
o CT
don
e, d
ied
Stei
n an
d Ro
ss19
9012
2
USA
R65
8NR
19/6
58
(2.9
%)
116/
658
(17.
6%)
Yes
NR65
8/65
8 (1
00%
)NR
454/
658
(69%
)M
HI w
ith L
OC/
amne
sia
for t
he
even
t, GC
S sc
ore
≥ 1
3. C
T sc
an
with
in 6
hou
rs o
f in
jury
NR
cont
inue
d
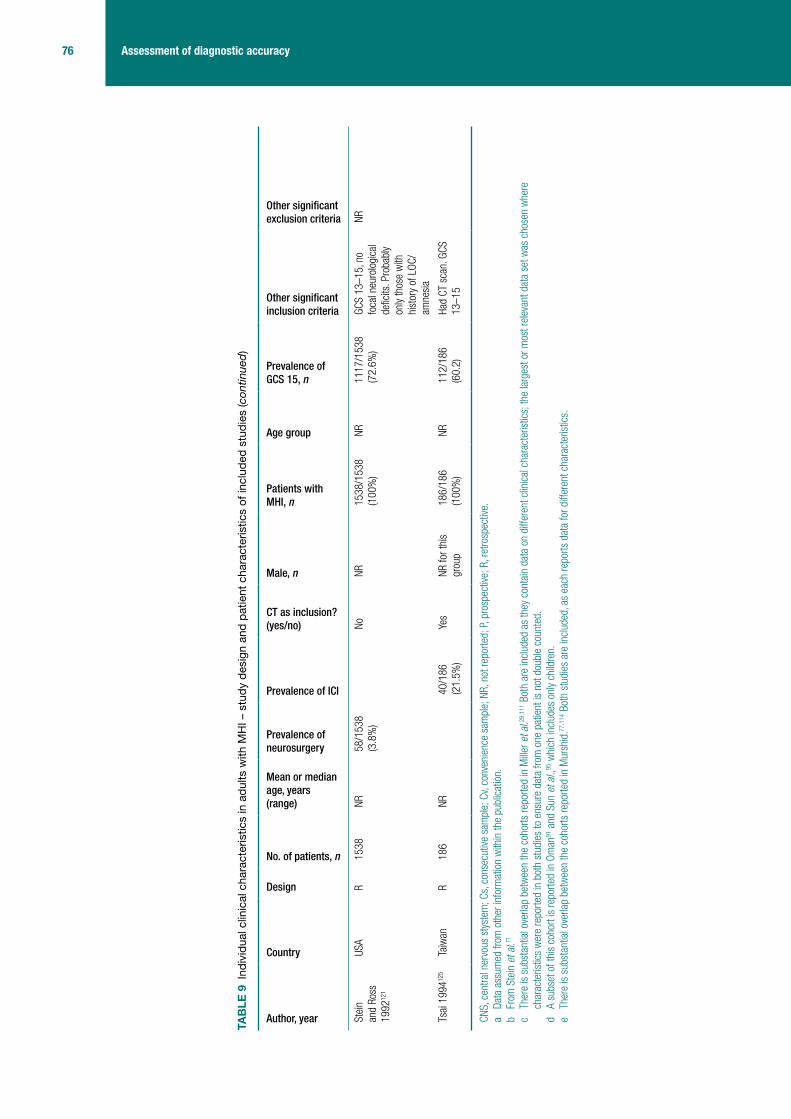
76 Assessment of diagnostic accuracy
Author, year
Country
Design
No. of patients, n
Mean or median age, years (range)
Prevalence of neurosurgery
Prevalence of ICI
CT as inclusion? (yes/no)
Male, n
Patients with MHI, n
Age group
Prevalence of GCS 15, n
Other significant inclusion criteria
Other significant exclusion criteria
Stei
n an
d Ro
ss
1992
121
USA
R15
38NR
58/1
538
(3.8
%)
No
NR15
38/1
538
(100
%)
NR11
17/1
538
(72.
6%)
GCS
13–1
5, n
o fo
cal n
euro
logi
cal
defic
its. P
roba
bly
only
thos
e w
ith
hist
ory
of L
OC/
amne
sia
NR
Tsai
199
4125
Taiw
anR
186
NR40
/186
(2
1.5%
)Ye
sNR
for t
his
grou
p18
6/18
6 (1
00%
)NR
112/
186
(60.
2)Ha
d CT
sca
n. G
CS
13–1
5
CNS,
cen
tral n
ervo
us s
tyst
em; C
s, c
onse
cutiv
e sa
mpl
e; C
v, co
nven
ienc
e sa
mpl
e; N
R, n
ot re
porte
d; P
, pro
spec
tive;
R, r
etro
spec
tive.
a Da
ta a
ssum
ed fr
om o
ther
info
rmat
ion
with
in th
e pu
blic
atio
n.b
From
Ste
in e
t al.71
c Th
ere
is s
ubst
antia
l ove
rlap
betw
een
the
coho
rts re
porte
d in
Mille
r et a
l.29,1
11 B
oth
are
incl
uded
as
they
con
tain
dat
a on
diff
eren
t clin
ical
cha
ract
eris
tics;
the
larg
est o
r mos
t rel
evan
t dat
a se
t was
cho
sen
whe
re
char
acte
ristic
s w
ere
repo
rted
in b
oth
stud
ies
to e
nsur
e da
ta fr
om o
ne p
atie
nt is
not
dou
ble
coun
ted.
d A
subs
et o
f thi
s co
hort
is re
porte
d in
Om
an91
and
Sun
et a
l.,95
whi
ch in
clud
es o
nly
child
ren.
e Th
ere
is s
ubst
antia
l ove
rlap
betw
een
the
coho
rts re
porte
d in
Mur
shid
.77,1
14 B
oth
stud
ies
are
incl
uded
, as
each
repo
rts d
ata
for d
iffer
ent c
hara
cter
istic
s.
TAB
LE 9
Ind
ivid
ual c
linic
al c
hara
cter
istic
s in
adu
lts w
ith M
HI –
stu
dy d
esig
n an
d pa
tient
cha
ract
eris
tics
of in
clud
ed s
tudi
es (c
ontin
ued)

© Queen’s Printer and Controller of HMSO 2011. This work was produced by Pandor et al. under the terms of a commissioning contract issued by the Secretary of State for Health.
77 Health Technology Assessment 2011; Vol. 15: No. 27DOI: 10.3310/hta15270
TABLE 10 Individual clinical characteristics in adults with MHI – definitions of outcomes and reference standards used in included studies
Study Definition of ICI Reference standard for ICIPatients receiving CT, n
Definition of need for neurosurgery
Reference standard for need for neurosurgery
Adults (any cohort selecting patients above a given age)
Arienta et al. 199754
Intracranial lesion: not defined CT scan or follow-up telephone call. Details NR
762/9917 (7.7%)
Neurosurgery or death: not defined further
Retrospective chart review, telephone follow-up
Biberthaler et al. 200698
CT abnormality: epidural, subdural, subarachnoid, intracerebral, cerebellar or brainstem haemorrhage, cortex contusion (haemorrhagic or non-haemorrhagic), fracture (skull cap, skull base, mastoid) or intracranial pressure (focal or generalised brain oedema)
CT scan 1309/1309 (100%)
NA NA
Borczuk 199555
ICI: abnormalities believed to be related to the trauma
CT scan 1448/1448 (100%)
Neurosurgery: placement of an intracranial pressure monitoring device alone was not considered a neurosurgical intervention
Review of ED and hospital charts
Chan et al. 200599
ICI: not defined CT scan 105/105 (100%), 92/92 (100%)
NA NA
Cook et al. 1994100
Positive CT scan: evidence of acute intracerebral injury, such as a haematoma or a contusion or a depressed skull fracture
CT scan: obtained after 1 hour’s observation or sooner if patient deteriorated
107/107 (100%)
NA NA
Fabbri et al. 200557
Any post-traumatic lesion at CT within 7 days from trauma: depressed skull fracture, intracerebral haematoma/brain contusions, subarachnoid haemorrhage, subdural haematoma, epidural haematoma, intraventricular haemorrhage
Patients were managed according to NCWFS guidelines where low-risk patients were sent home without CT, medium-risk patients underwent CT and observed for 3–6 hours if negative, then discharged, high-risk patients underwent CT and were observed for 24–48 hours. All those discharged were given written advice about signs and symptoms with which they should return
4177/7955 (52.5%)a
NA NA
Falimirski et al. 200358
Significant ICI: not defined CT scan 331/331 (100%)
NA NA
Feuerman et al. 1988102
Positive CT findings: not defined CT scan 129/373 (35%) 129/129 (100%)
Neurosurgery: operative haematoma or deterioration
Neurosurgery
Gomez et al. 1996103
2351/2484 (94.6%)
Neurosurgery: operation. Patients with focal mass intracranial lesions causing brain shift
Chart review: data entered into a database
continued

78 Assessment of diagnostic accuracy
Study Definition of ICI Reference standard for ICIPatients receiving CT, n
Definition of need for neurosurgery
Reference standard for need for neurosurgery
Haydel et al. 200027
ICI: presence of acute traumatic ICI (a subdural, epidural or parenchymal haematoma, subarachnoid haemorrhage, cerebral contusion or depressed skull fracture)
CT scan 520/520 (100%)
NA NA
Hsiang et al. 1997105
Abnormal radiographic findings: skull fracture (including depressed skull fracture), intracranial haematoma or contusion, traumatic subarachnoid haemorrhage
CT scan and/skull radiography: at discretion of admitting neurosurgeon
842/1360 (61.9%), NR for subgroup of 736
Neurosurgery: neurosurgical intervention in first 48 hours
Patient records
Ibanez and Arikan 200460
Relevant positive CT scan: acute intracranial lesion, not including isolated cases of linear skull fractures or chronic subdural effusions
CT scan 1101/1101 (100%)
NA NA
Jeret et al. 1993107
Abnormal CT: not defined CT scan 712/712 (100%)
NA NA
Livingston et al. 1991109
Positive CT scan: not defined CT scan NR NA NA
Livingston et al. 2000108
Positive CT scan: presence of ICI
CT scan 2152/2152 (100%)
NA NA
Muller et al. 2007113
Intracranial abnormality: not defined
CT scan: within 12 hours of injury 226/226 (100%)
NA NA
Nelson et al. 1992116
Abnormal CT scan: not defined CT scan 131/131 (100%)
NA NA
Ono et al. 200763
Intracranial lesion: not defined CT scan 1064/1064 (100%)
NA NA
Saboori et al. 200767
Intracranial lesion: all acute abnormal finding on CT
CT scan
Normal CT: discharged with advice to return if symptoms occur. One-week follow-up call
Abnormal CT: admission, treatment. Evaluation at 2 weeks and 1 month after discharge
682/682 (100%)
NA NA
Stiell et al. 200126
Clinically important brain injury on CT: all injuries unless patient neurologically intact and had one of the following: solitary contusion > 5 mm, localised subarachnoid blood > 1 mm thick, smear subdural haematoma > 4 mm thick, closed depressed skull fracture not through inner table
1. CT scan to positively classify clinically important brain injury (75.6%)
2. Proxy telephone interview performed by registered nurse (24.4%). For those whose responses did not warrant recall for a CT scan this was the only reference standard
2078/3121 (67%)
NA NA
Stiell et al. 200546
As Stiell et al. 200126 As Stiell et al. 200126 2171/2707 (80.2%), 1378/1822 (75.6%)b
NA NA
Vilke et al. 2000126
ICI: not defined CT scan: selected for CT at attending physician’s discretion
58/58 (100%) Neurosurgery: not defined
NR
TABLE 10 Individual clinical characteristics in adults with MHI – definitions of outcomes and reference standards used in included studies (continued)

© Queen’s Printer and Controller of HMSO 2011. This work was produced by Pandor et al. under the terms of a commissioning contract issued by the Secretary of State for Health.
79 Health Technology Assessment 2011; Vol. 15: No. 27DOI: 10.3310/hta15270
Study Definition of ICI Reference standard for ICIPatients receiving CT, n
Definition of need for neurosurgery
Reference standard for need for neurosurgery
Dunham et al. 1996101
CT detected intracranial haemorrhage: not defined
CT scan for 91.4%, NR for remainder
1857/2032 (91.4%), NR for 220, age > 60 years
NA NA
Mack et al. 2003110
ICI: not defined CT scan 133/133 (100%)
NA NA
All ages (any cohort reporting a cohort with no age limits)
Miller et al. 1996111
Abnormal CT scan: acute traumatic intracranial lesion (contusion, parenchymal haematoma, epidural haematoma, subdural haematoma, subarachnoid haemorrhage) or a skull fracture
CT scan: within 8 hours of injury 1382/1382 (100%)
Neurosurgery: surgical intervention (craniotomy to repair an acute traumatic injury or placement of a monitoring bolt)
Hospital records of those with positive CT scan followed until discharge
Miller et al. 199729
Abnormal CT scan: acute traumatic intracranial lesion (contusion, parenchymal haematoma, epidural haematoma, subdural haematoma, subarachnoid haemorrhage) or a skull fracture
CT scan: within 8 hours of injury 2143/2143 (100%)
Neurosurgery: surgical intervention (craniotomy to repair an acute traumatic injury or placement of a monitoring bolt)
Hospital records of those with positive CT scan followed until discharge
Moran et al. 1994112
Positive CT scan: not defined CT scan NR for those who did not have CT scan
96/200 (48%) NA NA
Mower et al. 200562
Significant ICI: any injury that may require neurosurgical intervention, lead to rapid clinical deterioration, or result in significant long-term neurological impairment
CT scan 13,728/13,728 (100%)
NA NA
Murshid 1994114
NA NA N/A Neurosurgery: not defined. Those reported positive had burr holes, craniotomy, ventilation, conservative treatment (assume not elevation of fracture)
NR
Murshid 199877
ICI on CT scan; not defined CT scan 127/566 (22%) NA NA
Shackford et al. 1992119
N/A NA N/A Surgical intervention: craniotomy or ICP monitor
Hospital records
Schynoll et al. 1993118
Abnormal CT scan: not defined CT scan: at discretion of evaluating physician
264/264 (100%)
NA NA
Tender and Awasthi 2003123
Abnormality on CT: intracranial haematoma, contusion, traumatic subarachnoid haemorrhage and skull fracture with an underlying lesion
CT scan 255/255 (100%)
NA NA
continued
TABLE 10 Individual clinical characteristics in adults with MHI – definitions of outcomes and reference standards used in included studies (continued)

80 Assessment of diagnostic accuracy
Study Definition of ICI Reference standard for ICIPatients receiving CT, n
Definition of need for neurosurgery
Reference standard for need for neurosurgery
Thiruppathy and Muthukumar 2004124
Positive CT scan: acute pathological state in the skull or brain attributable to head injury (vault or basilar fractures, epidural, subdural, intracerebral haematomas, contusions, intraventricular haemorrhage, pneumocephalus)
CT scan 381/381 (100%)
Neurosurgery: not defined
Neurosurgery
Age limit not reported
Harad and Kerstein 1992104
Abnormal CT scan: contusion, depressed skull fracture, diffuse axonal injury, epidural/subdural haematoma, subarachnoid haemorrhage and oedema
CT scan 497/497 (100%), 302/302 (100%)
Craniotomy NR
Holmes et al. 199759
Abnormal CT scan defined as any CT scan showing an acute traumatic lesion (skull fractures or intracranial lesions: cerebral oedema, contusion, parenchymal haemorrhage, epidural haematoma, subdural haematoma, subarachnoid haemorrhage or intraventricular haemorrhage)
CT scan 264/264 (100%)
Neurosurgery Neurosurgery: Patients with abnormal CT scan followed to discharge. Those with normal CT not studied further
Hung et al. 1996106
NA NA NA Surgically significant ICI
NR
Madden et al. 199561
Clinically significant scan: pathology related to trauma affecting the bony calvaria or cerebrum (including non-depressed skull fractures, excluding scalp haematomas, those with no bony skull or intracerebral pathology)
CT scan 537/537 (100%)
Mussack et al. 2002115
Post-traumatic lesion: skull fracture, subarachnoid haemorrhage, epidural or subdural haematoma, intracerebral haemorrhage or diffuse brain oedema
CT scan 139/139 (100%)
Rosenorn et al. 1991117
Intracranial complication: intracerebral haematoma, subdural haematoma, cerebral contusion, traumatic subarachnoid haemorrhage
CT scan or admission and observation
NR
Sharma et al. 2001120
Intracranial complications: not defined
CT scan 39/39 (100%)
TABLE 10 Individual clinical characteristics in adults with MHI – definitions of outcomes and reference standards used in included studies (continued)

© Queen’s Printer and Controller of HMSO 2011. This work was produced by Pandor et al. under the terms of a commissioning contract issued by the Secretary of State for Health.
81 Health Technology Assessment 2011; Vol. 15: No. 27DOI: 10.3310/hta15270
outcome, ‘need for neurosurgery’ there was again a variety of definitions across the 16 studies, including narrow definitions which, for example, only included ‘urgent surgery’122 or specified a timescale,105,121 and definitions that included any neurosurgical procedure, including fitting an intracranial pressure monitor.119
In the 10 studies26,46,54,57,67,77,101,105,112,117 in which CT was not possible for all and was not an inclusion criterion, the reference standard varied, with four studies26,46,54,67 using telephone follow-up and five57,77,101,105,112 not reporting how ICI was identified in those not undergoing CT. One study admitted those not undergoing CT.117 Telephone follow-up and no follow-up are both likely to miss some intracranial injuries, affecting estimates of diagnostic accuracy. The length of follow-up for neurosurgery varied from being not reported to following until discharge, which may not capture all neurosurgical procedures, again leading to inaccurate estimations of diagnostic accuracy.
Study Definition of ICI Reference standard for ICIPatients receiving CT, n
Definition of need for neurosurgery
Reference standard for need for neurosurgery
Stein and Ross 1990122
Abnormal CT scan: not defined CT scan 658/658 (100%)
Urgent surgery: urgent surgery because of finding on CT scan – haematoma or previously unsuspected depressed fracture large enough to require surgery on an urgent basis (not those who deteriorated subsequently)
NR
Stein and Ross 1992121
NA NA NA Immediate neurosurgery or subsequent deterioration: not defined
Records searched
Tsai 1994125 CT scan findings: not defined CT scan 186/186 (100%)
N/A, not available; NA, not applicable; NR, not reported.a From Stein et al.71
b GCS 15-only subgroup of cohort.
TABLE 10 Individual clinical characteristics in adults with MHI – definitions of outcomes and reference standards used in included studies (continued)

82 Assessment of diagnostic accuracy
Children and infantsThe design and patient characteristics of the 29 studies (representing 30 papers)30,81–84,86–91,93–95,127–
142 that evaluated the diagnostic accuracy of individual clinical characteristics for identifying ICI (including the need for neurosurgery) in children and/or infants with MHI are summarised in Table 11. Three studies84,90,135 provided separate data for children and infants, whereas two studies82,86 provided data for infants only, and one study84 provided data for infants as a subset of data from a cohort of children up to age 18 years. In one study only adolescents were selected.127 Eighteen studies were from the USA,82,84,86,88,90,91,93,94,129–131,135,137–142 three from Turkey,87,128,132 two from the UK,30,136 one a USA–Canadian collaboration81 and one each from Italy,83 Finland,89 Poland,133 Australia134 and Hong Kong.127 Eight studies30,81,83,90,91,95,129,135,140 were multicentre. Cohorts ranged in size from 39136 to 31,69490 patients with two cohorts30,90 providing a large data set of over 20,000 participants. Seventeen30,81,83,84,86,88,90,91,93–95,127,128,130,131,135,141,142 studies were prospective, seven of which were consecutive,83,84,86,88,91,94,95,127 one convenience81 and the remaining nine30,90,93,128,130, 131,135,141,142 did not report the method of patient recruitment. Twelve82,89,129,132–134,136–
140 studies were retrospective.
For studies of children, the upper age limit ranged between 12141 and 21 years,81 and the lower limit between 081 and 5 years.88 For infants, the upper age limit was 284,86,90,135 or 3 years.82,91
Mean age was not reported in the majority of cases; where it was reported it ranged from 4 years 10 months94 to 12 years 10 months.88 Prevalence of neurosurgery ranged from 1.0%137 to 8.5%131 (median 3.3%, IQR 1.55% to 7.23%) and prevalence of ICI ranged from 0.58%83 to 54.6%134 (median 12.1%, IQR 4.1% to 21.0%). It was clear in only one study30 that only the whole population of interest had been selected. Variations in selection criteria include selection of patients on the basis of having had a CT scan,81,84,87,88,91,93–95,129,130,134–138,140,142 selecting only patients presenting with some clinical characteristics,83,88,90,93,94,127–129,131,132,138,139,141,142 selecting only those admitted89,127,139 and selecting a spectrum of patients with a wider or narrower range of GCS scores. Five studies selected only those with GCS 15,86,88,128,129,137 five only those with GCS 14 or 15,82,90,93,132,138 one only those with GCS 13 or 14140 and 1283,84,89,91,94,95,127,130,134–136,141 either did not report selection on the basis of GCS or selected all severities. The remaining six81,87,131,133,139,142 selected or reported a subset of patients with GCS 13–15.
Definitions of outcomes and the reference standards used varied across the 29 studies (Table 12).30,81–84,86–91,93–95,127–142 The outcome definition for ICI differed across the 28 studies30,81–84,86–91,93–95,127–130,132–142 that reported this outcome. Four studies30,89–91,95 defined this as injuries of clinical significance, 13 studies81,82,84,86,88,93,128,130,132–135,138 had more general definitions including common acute lesions (listed in Table 12) and 11 studies83,87,94,127,129,136,137,139–142 did not give a definition. The reference standards used where CT was not possible for all and was not an inclusion criterion was unclear in five cases.30,89,127,132,140 Other reference standards comprised telephone follow-up, review of hospital records or both. Neurosurgery was poorly defined in most cases; one study included other medical interventions88 and one study excluded skull fracture surgery,137 but it was unclear if these were included or excluded in other studies. The length of follow-up for neurosurgery varied from being not reported to following until discharge88 or at an outpatients clinic.131
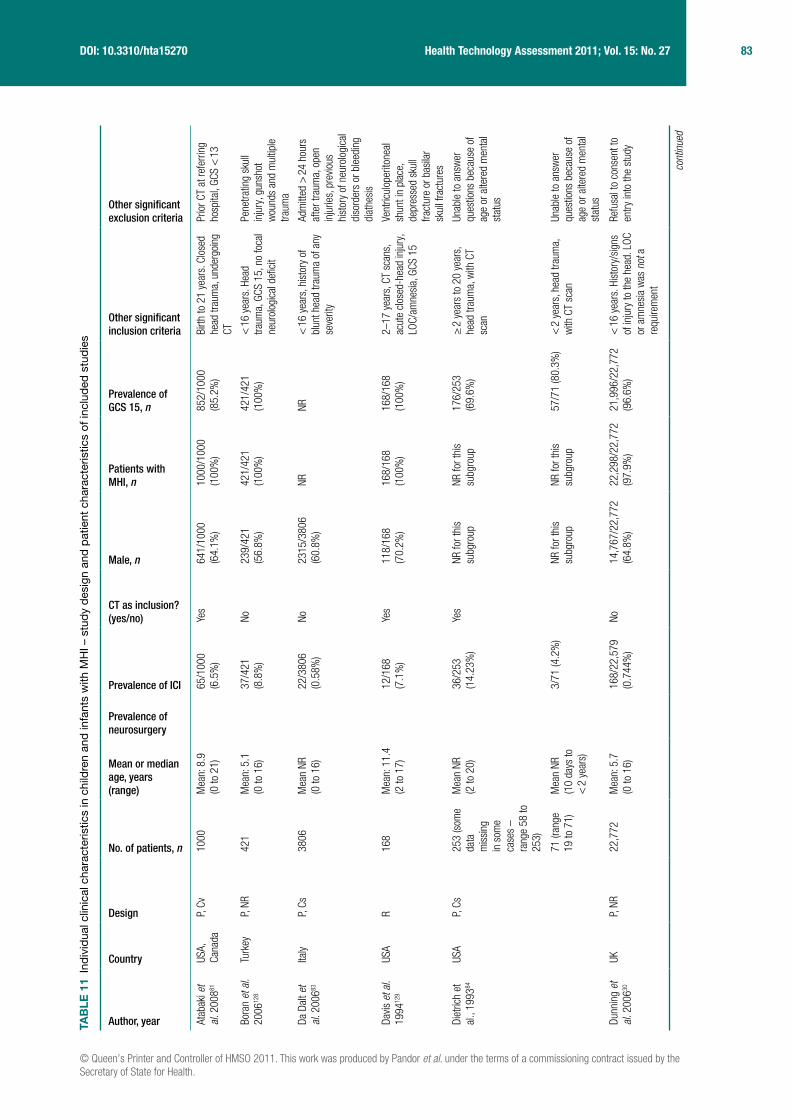
© Queen’s Printer and Controller of HMSO 2011. This work was produced by Pandor et al. under the terms of a commissioning contract issued by the Secretary of State for Health.
83 Health Technology Assessment 2011; Vol. 15: No. 27DOI: 10.3310/hta15270
TAB
LE 1
1 In
divi
dual
clin
ical
cha
ract
eris
tics
in c
hild
ren
and
infa
nts
with
MH
I – s
tudy
des
ign
and
patie
nt c
hara
cter
istic
s of
incl
uded
stu
dies
Author, year
Country
Design
No. of patients, n
Mean or median age, years (range)
Prevalence of neurosurgery
Prevalence of ICI
CT as inclusion? (yes/no)
Male, n
Patients with MHI, n
Prevalence of GCS 15, n
Other significant inclusion criteria
Other significant exclusion criteria
Atab
aki e
t al
. 200
881
USA,
Ca
nada
P, Cv
1000
Mea
n: 8
.9
(0 to
21)
65/1
000
(6.5
%)
Yes
641/
1000
(6
4.1%
)10
00/1
000
(100
%)
852/
1000
(8
5.2%
)Bi
rth to
21
year
s. C
lose
d he
ad tr
aum
a, u
nder
goin
g CT
Prio
r CT
at re
ferri
ng
hosp
ital,
GCS
< 1
3
Bora
n et
al.
2006
128
Turk
eyP,
NR42
1M
ean:
5.1
(0
to 1
6)37
/421
(8
.8%
)No
239/
421
(56.
8%)
421/
421
(100
%)
421/
421
(100
%)
< 1
6 ye
ars.
Hea
d tra
uma,
GCS
15,
no
foca
l ne
urol
ogic
al d
efici
t
Pene
tratin
g sk
ull
inju
ry, g
unsh
ot
wou
nds
and
mul
tiple
tra
uma
Da D
alt e
t al
. 200
683
Italy
P, Cs
3806
M
ean
NR
(0 to
16)
22/3
806
(0.5
8%)
No23
15/3
806
(60.
8%)
NRNR
< 1
6 ye
ars,
his
tory
of
blun
t hea
d tra
uma
of a
ny
seve
rity
Adm
itted
> 2
4 ho
urs
afte
r tra
uma,
ope
n in
jurie
s, p
revio
us
hist
ory
of n
euro
logi
cal
diso
rder
s or
ble
edin
g di
athe
sis
Davis
et a
l. 19
9412
9
USA
R16
8 M
ean:
11.
4 (2
to 1
7)12
/168
(7
.1%
)Ye
s11
8/16
8 (7
0.2%
)16
8/16
8 (1
00%
)16
8/16
8 (1
00%
)2–
17 y
ears
, CT
scan
s,
acut
e cl
osed
-hea
d in
jury
, LO
C/am
nesi
a, G
CS 1
5
Vent
ricul
oper
itone
al
shun
t in
plac
e,
depr
esse
d sk
ull
fract
ure
or b
asila
r sk
ull f
ract
ures
Diet
rich
et
al.,
1993
84
USA
P, Cs
253
(som
e da
ta
mis
sing
in
som
e ca
ses
– ra
nge
58 to
25
3)
Mea
n NR
(2
to 2
0)36
/253
(1
4.23
%)
Yes
NR fo
r thi
s su
bgro
upNR
for t
his
subg
roup
176/
253
(69.
6%)
≥ 2
yea
rs to
20
year
s,
head
trau
ma,
with
CT
scan
Unab
le to
ans
wer
qu
estio
ns b
ecau
se o
f ag
e or
alte
red
men
tal
stat
us
71 (r
ange
19
to 7
1)M
ean
NR
(10
days
to
< 2
yea
rs)
3/71
(4.2
%)
NR fo
r thi
s su
bgro
upNR
for t
his
subg
roup
57/7
1 (8
0.3%
)<
2 y
ears
, hea
d tra
uma,
w
ith C
T sc
anUn
able
to a
nsw
er
ques
tions
bec
ause
of
age
or a
ltere
d m
enta
l st
atus
Dunn
ing
et
al. 2
00630
UKP,
NR22
,772
Mea
n: 5
.7
(0 to
16)
168/
22,5
79
(0.7
44%
)No
14
,767
/22,
772
(64.
8%)
22,2
98/2
2,77
2 (9
7.9%
)21
,996
/22,
772
(96.
6%)
< 1
6 ye
ars.
His
tory
/sig
ns
of in
jury
to th
e he
ad. L
OC
or a
mne
sia
was
not
a
requ
irem
ent
Refu
sal t
o co
nsen
t to
entry
into
the
stud
y
cont
inue
d

84 Assessment of diagnostic accuracy
Author, year
Country
Design
No. of patients, n
Mean or median age, years (range)
Prevalence of neurosurgery
Prevalence of ICI
CT as inclusion? (yes/no)
Male, n
Patients with MHI, n
Prevalence of GCS 15, n
Other significant inclusion criteria
Other significant exclusion criteria
Fish
er
1997
141
USA
P, NR
42M
ean:
5.8
m
onth
s (1
to 1
53
mon
ths)
9/42
(21%
)No
NRNR
NR<
12
year
s. S
ympt
omat
ic
blun
t hea
d tra
uma
with
in
48 h
ours
with
any
of
LOC,
am
nesi
a, P
TS, o
r an
y of
vom
iting
hea
dach
e an
d so
mno
lenc
e >
1 h
our a
fter i
njur
y
Card
iac
arre
st in
pre
-ho
spita
l cou
rse,
pre
-ex
istin
g ne
urol
ogic
al
defic
it or
sus
pici
on
of im
pairm
ent d
ue to
to
xins
Frid
rikss
on
et a
l. 20
0013
0
USA
P, NR
49M
ean
NR (2
m
onth
s to
16
yea
rs)
22
/49
(44.
9%)
Yes
55%
39/4
9 (7
9.6%
)NR
0–18
yea
rs. W
ithin
24
hou
rs o
f inj
ury,
blu
nt
traum
a, re
quiri
ng h
ead
CT
Pene
tratin
g tra
uma,
bl
eedi
ng d
isor
ders
, lo
nger
than
24
hour
s si
nce
inju
ry
Guze
l et a
l. 20
0987
Turk
eyR
337
NR67
/337
(1
9.9%
)Ye
s (a
pplie
d at
dat
a ex
tract
ion
stag
e)
223/
337
(66.
2%)
337/
337
(100
%)
304/
337
(90.
2%),
< 1
6 ye
ars.
GCS
13–
15.
Had
CT (a
pplie
d at
dat
a ex
tract
ion
stag
e)
> 1
6 ye
ars,
mod
erat
e or
sev
ere
head
inju
ry,
no c
lear
his
tory
of
traum
a, o
bvio
us
pene
tratin
g sk
ull
inju
ry, u
nsta
ble
vital
sig
ns, s
eizu
re
befo
re a
sses
smen
t, bl
eedi
ng d
isor
der/
antic
oagu
lant
s, re
-at
tend
ance
s
Hahn
and
M
cLon
e 19
9313
1
USA
P, NR
791
Mea
n: 5
.5
(0 to
16)
67/7
91
(8.5
%)
No52
7/79
1 (6
6.6%
)79
1/79
1 (1
00%
)54
9/79
1 (6
9.4%
)0–
16 y
ears
. GCS
13–
15
and
LOC,
neu
rolo
gica
l de
ficits
, hea
dach
e,
vom
iting
or n
ause
a, a
m
ajor
or m
inor
sku
ll fra
ctur
e sh
own
on a
ra
diog
raph
or a
bnor
mal
fin
ding
on
CT s
cans
, su
spec
ted
child
abu
se,
care
take
r unr
elia
ble
or h
ome
obse
rvat
ion
unre
alis
tic
NR
TAB
LE 1
1 In
divi
dual
clin
ical
cha
ract
eris
tics
in c
hild
ren
and
infa
nts
with
MH
I – s
tudy
des
ign
and
patie
nt c
hara
cter
istic
s of
incl
uded
stu
dies
(con
tinue
d)

© Queen’s Printer and Controller of HMSO 2011. This work was produced by Pandor et al. under the terms of a commissioning contract issued by the Secretary of State for Health.
85 Health Technology Assessment 2011; Vol. 15: No. 27DOI: 10.3310/hta15270
Author, year
Country
Design
No. of patients, n
Mean or median age, years (range)
Prevalence of neurosurgery
Prevalence of ICI
CT as inclusion? (yes/no)
Male, n
Patients with MHI, n
Prevalence of GCS 15, n
Other significant inclusion criteria
Other significant exclusion criteria
Halle
y et
al.
2004
142
USA
P, NR
98M
ean
NR
(2 to
16)
13/9
8 (1
3.3%
)Ye
s73
/98
(74%
)98
/98
(100
%)
76/9
8 (7
7.6%
)2–
16 y
ears
with
min
or
clos
ed h
ead
inju
ry (G
CS
13–1
5), L
OC/a
mne
sia
Age
< 2
or >
16
year
s,
pain
fully
dis
tract
ing
inju
ry, i
ntox
icat
ion,
hi
stor
y of
pre
vious
ne
urol
ogic
al
abno
rmal
ity,
susp
icio
us h
isto
ry o
f no
n-ac
cide
ntal
inju
ry,
or n
ot u
nder
goin
g CT
Hayd
el a
nd
Sche
mbe
kar
2003
,88
USA
P, Cs
175
Mea
n: 1
2.8
(5 to
17)
6/17
5 (3
.4%
)14
/175
(8%
)Ye
s 11
4/17
5 (6
7%)
100%
(a
ssum
ed
from
incl
usio
n cr
iteria
)
175/
175
(100
%)
5–17
yea
rs. W
ithin
24
hou
rs o
f inj
ury,
blu
nt
traum
a w
ith L
OC, n
on-
trivia
l mec
hani
sm o
f in
jury
, CT
scan
Trivi
al in
jurie
s, re
fuse
d CT
, con
curre
nt in
jurie
s pr
eclu
ded
CT, i
rrita
ble
or a
gita
ted
(GCS
< 1
5)
Kesk
il et
al.
1995
132
Turk
eyR
257
Mea
n NR
(0
to 1
5)
30/2
57
(11.
7%)
No14
9/25
7 (5
8%)
100%
174/
257
(67.
7%)
≤ 1
5 ye
ars.
GCS
14–
15.
Thos
e w
ho p
erfo
rmed
no
rmal
ly af
ter b
rief L
OC
(< 2
0 m
inut
es) a
nd/o
r hi
stor
y of
PTA
Chro
nic
subd
ural
ha
emat
omas
, unl
ess
hist
ory
of a
cute
inju
ry
or a
cute
hae
mat
oma
pres
ent a
lso.
Dea
d on
ar
rival
, bra
in-d
ead
in
ED, g
unsh
ot w
ound
s
Klem
etti
et
al. 2
00989
Finl
and
R48
5M
ean:
7.7
(2
day
s to
16
yea
rs
83/4
85
(17.
1%)
No31
3/48
5 (6
5%)
NRNR
≤ 1
6 ye
ars.
Adm
itted
to
pae
diat
rics
(usu
ally
hosp
italis
ed e
ven
afte
r MHI
), hi
stor
y of
he
ad tr
aum
a. P
atie
nts
iden
tified
by
refe
renc
e to
di
scha
rge
diag
nosi
s
NR
cont
inue
d
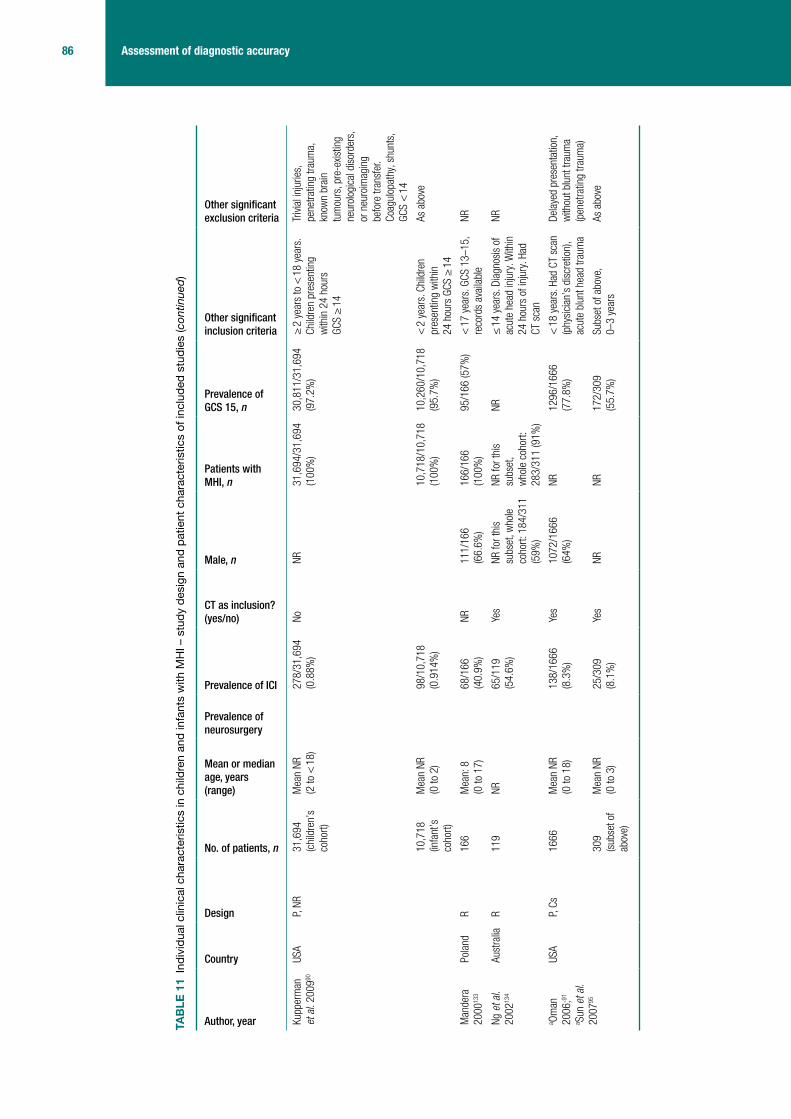
86 Assessment of diagnostic accuracy
Author, year
Country
Design
No. of patients, n
Mean or median age, years (range)
Prevalence of neurosurgery
Prevalence of ICI
CT as inclusion? (yes/no)
Male, n
Patients with MHI, n
Prevalence of GCS 15, n
Other significant inclusion criteria
Other significant exclusion criteria
Kupp
erm
an
et a
l. 20
0990
USA
P, NR
31,6
94
(chi
ldre
n’s
coho
rt)
Mea
n NR
(2
to <
18)
278/
31,6
94
(0.8
8%)
NoNR
31,6
94/3
1,69
4 (1
00%
)30
,811
/31,
694
(97.
2%)
≥ 2
yea
rs to
< 1
8 ye
ars.
Ch
ildre
n pr
esen
ting
with
in 2
4 ho
urs
GCS
≥ 1
4
Trivi
al in
jurie
s,
pene
tratin
g tra
uma,
kn
own
brai
n tu
mou
rs, p
re-e
xistin
g ne
urol
ogic
al d
isor
ders
, or
neu
roim
agin
g be
fore
tran
sfer
. Co
agul
opat
hy, s
hunt
s,
GCS
< 1
4
10,7
18
(infa
nt’s
co
hort)
Mea
n NR
(0
to 2
)98
/10,
718
(0.9
14%
)10
,718
/10,
718
(100
%)
10,2
60/1
0,71
8 (9
5.7%
)<
2 y
ears
. Chi
ldre
n pr
esen
ting
with
in
24 h
ours
GCS
≥ 1
4
As a
bove
Man
dera
20
0013
3
Pola
ndR
166
Mea
n: 8
(0
to 1
7)
68/1
66
(40.
9%)
NR11
1/16
6 (6
6.6%
)16
6/16
6 (1
00%
)95
/166
(57%
)<
17
year
s. G
CS 1
3–15
, re
cord
s av
aila
ble
NR
Ng e
t al.
2002
134
Aust
ralia
R11
9NR
65
/119
(5
4.6%
)Ye
sNR
for t
his
subs
et, w
hole
co
hort:
184
/311
(5
9%)
NR fo
r thi
s su
bset
, w
hole
coh
ort:
283/
311
(91%
)
NR≤
14
year
s. D
iagn
osis
of
acut
e he
ad in
jury
. With
in
24 h
ours
of i
njur
y. H
ad
CT s
can
NR
a Om
an
2006
;91
a Sun
et a
l. 20
0795
USA
P, Cs
1666
Mea
n NR
(0
to 1
8)
138/
1666
(8
.3%
)Ye
s10
72/1
666
(64%
)NR
1296
/166
6 (7
7.8%
)<
18
year
s. H
ad C
T sc
an
(phy
sici
an’s
dis
cret
ion)
, ac
ute
blun
t hea
d tra
uma
Dela
yed
pres
enta
tion,
w
ithou
t blu
nt tr
aum
a (p
enet
ratin
g tra
uma)
309
(sub
set o
f ab
ove)
Mea
n NR
(0
to 3
)
25/3
09
(8.1
%)
Yes
NRNR
172/
309
(55.
7%)
Subs
et o
f abo
ve,
0–3
year
sAs
abo
ve
TAB
LE 1
1 In
divi
dual
clin
ical
cha
ract
eris
tics
in c
hild
ren
and
infa
nts
with
MH
I – s
tudy
des
ign
and
patie
nt c
hara
cter
istic
s of
incl
uded
stu
dies
(con
tinue
d)
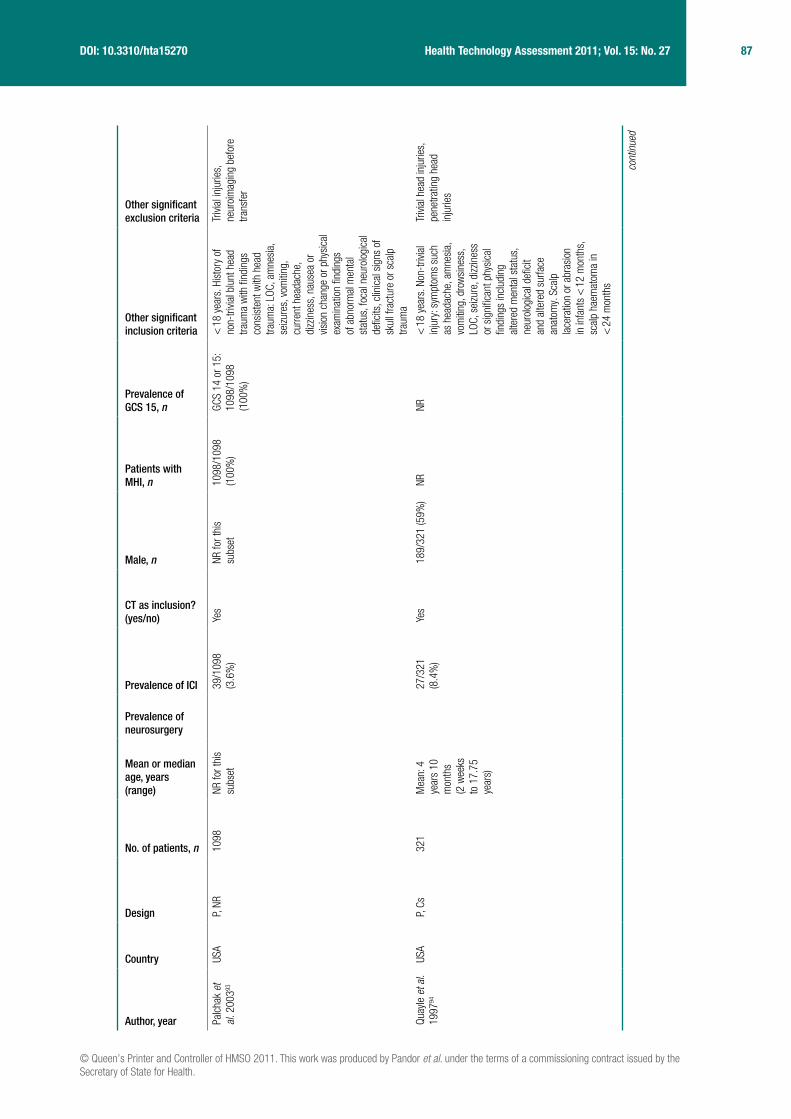
© Queen’s Printer and Controller of HMSO 2011. This work was produced by Pandor et al. under the terms of a commissioning contract issued by the Secretary of State for Health.
87 Health Technology Assessment 2011; Vol. 15: No. 27DOI: 10.3310/hta15270
Author, year
Country
Design
No. of patients, n
Mean or median age, years (range)
Prevalence of neurosurgery
Prevalence of ICI
CT as inclusion? (yes/no)
Male, n
Patients with MHI, n
Prevalence of GCS 15, n
Other significant inclusion criteria
Other significant exclusion criteria
Palc
hak
et
al. 2
00393
USA
P, NR
1098
NR fo
r thi
s su
bset
39/1
098
(3.6
%)
Yes
NR fo
r thi
s su
bset
1098
/109
8 (1
00%
)GC
S 14
or 1
5:
1098
/109
8 (1
00%
)
< 1
8 ye
ars.
His
tory
of
non-
trivia
l blu
nt h
ead
traum
a w
ith fi
ndin
gs
cons
iste
nt w
ith h
ead
traum
a: L
OC, a
mne
sia,
se
izure
s, v
omiti
ng,
curre
nt h
eada
che,
di
zzin
ess,
nau
sea
or
visio
n ch
ange
or p
hysi
cal
exam
inat
ion
findi
ngs
of a
bnor
mal
men
tal
stat
us, f
ocal
neu
rolo
gica
l de
ficits
, clin
ical
sig
ns o
f sk
ull f
ract
ure
or s
calp
tra
uma
Trivi
al in
jurie
s,
neur
oim
agin
g be
fore
tra
nsfe
r
Quay
le e
t al.
1997
94
USA
P, Cs
321
Mea
n: 4
ye
ars
10
mon
ths
(2 w
eeks
to
17.
75
year
s)
27/3
21
(8.4
%)
Yes
189/
321
(59%
)NR
NR<
18
year
s. N
on-t
rivia
l in
jury
: sym
ptom
s su
ch
as h
eada
che,
am
nesi
a,
vom
iting
, dro
wsi
ness
, LO
C, s
eizu
re, d
izzin
ess
or s
igni
fican
t phy
sica
l fin
ding
s in
clud
ing
alte
red
men
tal s
tatu
s,
neur
olog
ical
defi
cit
and
alte
red
surfa
ce
anat
omy.
Sca
lp
lace
ratio
n or
abr
asio
n in
infa
nts
< 1
2 m
onth
s,
scal
p ha
emat
oma
in
< 2
4 m
onth
s
Trivi
al h
ead
inju
ries,
pe
netra
ting
head
in
jurie
s
cont
inue
d
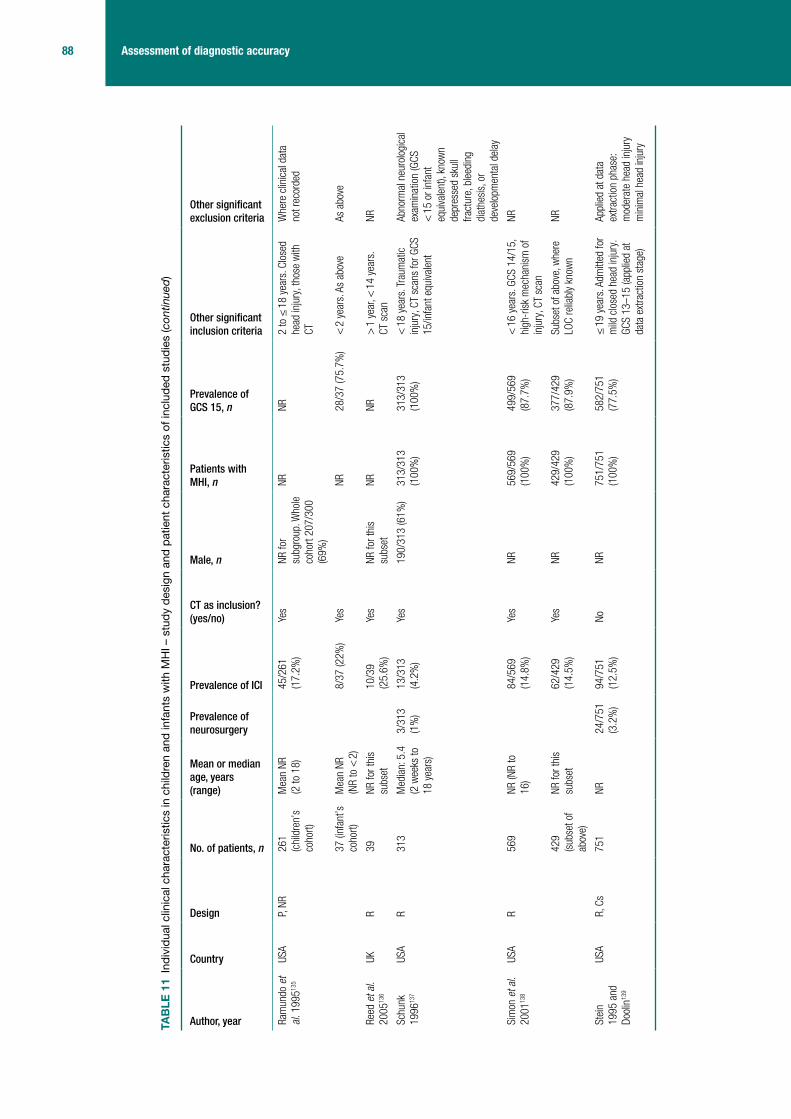
88 Assessment of diagnostic accuracy
Author, year
Country
Design
No. of patients, n
Mean or median age, years (range)
Prevalence of neurosurgery
Prevalence of ICI
CT as inclusion? (yes/no)
Male, n
Patients with MHI, n
Prevalence of GCS 15, n
Other significant inclusion criteria
Other significant exclusion criteria
Ram
undo
et
al. 1
99513
5
USA
P, NR
261
(chi
ldre
n’s
coho
rt)
Mea
n NR
(2
to 1
8)45
/261
(1
7.2%
)Ye
sNR
for
subg
roup
. Who
le
coho
rt 20
7/30
0 (6
9%)
NRNR
2 to
≤ 1
8 ye
ars.
Clo
sed
head
inju
ry, t
hose
with
CT
Whe
re c
linic
al d
ata
not r
ecor
ded
37 (i
nfan
t’s
coho
rt)M
ean
NR
(NR
to <
2)
8/37
(22%
)Ye
sNR
28/3
7 (7
5.7%
)<
2 y
ears
. As
abov
eAs
abo
ve
Reed
et a
l. 20
0513
6
UKR
39NR
for t
his
subs
et10
/39
(25.
6%)
Yes
NR fo
r thi
s su
bset
NRNR
> 1
yea
r, <
14
year
s.
CT s
can
NR
Schu
nk
1996
137
USA
R31
3M
edia
n: 5
.4
(2 w
eeks
to
18 y
ears
)
3/31
3 (1
%)
13/3
13
(4.2
%)
Yes
190/
313
(61%
)31
3/31
3 (1
00%
)31
3/31
3 (1
00%
)<
18
year
s. T
raum
atic
in
jury
, CT
scan
s fo
r GCS
15
/infa
nt e
quiva
lent
Abno
rmal
neu
rolo
gica
l ex
amin
atio
n (G
CS
< 1
5 or
infa
nt
equi
vale
nt),
know
n de
pres
sed
skul
l fra
ctur
e, b
leed
ing
diat
hesi
s, o
r de
velo
pmen
tal d
elay
Sim
on e
t al.
2001
138
USA
R56
9NR
(NR
to
16)
84
/569
(1
4.8%
)Ye
sNR
569/
569
(100
%)
499/
569
(87.
7%)
< 1
6 ye
ars.
GCS
14/
15,
high
-ris
k m
echa
nism
of
inju
ry, C
T sc
an
NR
429
(sub
set o
f ab
ove)
NR fo
r thi
s su
bset
62
/429
(1
4.5%
)Ye
sNR
429/
429
(100
%)
377/
429
(87.
9%)
Subs
et o
f abo
ve, w
here
LO
C re
liabl
y kn
own
NR
Stei
n 19
95 a
nd
Dool
in13
9
USA
R, C
s75
1NR
24/7
51
(3.2
%)
94/7
51
(12.
5%)
NoNR
751/
751
(100
%)
582/
751
(77.
5%)
≤ 1
9 ye
ars.
Adm
itted
for
mild
clo
sed
head
inju
ry.
GCS
13–1
5 (a
pplie
d at
da
ta e
xtra
ctio
n st
age)
Appl
ied
at d
ata
extra
ctio
n ph
ase:
m
oder
ate
head
inju
ry
min
imal
hea
d in
jury
TAB
LE 1
1 In
divi
dual
clin
ical
cha
ract
eris
tics
in c
hild
ren
and
infa
nts
with
MH
I – s
tudy
des
ign
and
patie
nt c
hara
cter
istic
s of
incl
uded
stu
dies
(con
tinue
d)

© Queen’s Printer and Controller of HMSO 2011. This work was produced by Pandor et al. under the terms of a commissioning contract issued by the Secretary of State for Health.
89 Health Technology Assessment 2011; Vol. 15: No. 27DOI: 10.3310/hta15270
Author, year
Country
Design
No. of patients, n
Mean or median age, years (range)
Prevalence of neurosurgery
Prevalence of ICI
CT as inclusion? (yes/no)
Male, n
Patients with MHI, n
Prevalence of GCS 15, n
Other significant inclusion criteria
Other significant exclusion criteria
Wan
g et
al.
2000
140
USA
Retro
spec
tive
(repo
rted:
pr
ospe
ctive
)
157
NR43
/157
(2
7.4%
)Ye
s (a
pplie
d at
dat
a ex
tract
ion
phas
e)
NR15
7/15
7 (1
00%
)NR
≤ 1
5 ye
ars.
Fie
ld G
CS
13 o
r 14,
blu
nt tr
aum
a.
Had
CT (a
pplie
d at
dat
a ex
tract
ion
stag
e)
Stab
or g
unsh
ot
wou
nds
Chan
et a
l. 19
9012
7
Hong
Ko
ngP,
Cs41
8M
ean
NR
(11
to 1
5)
13/4
18
(3.1
%)
NRNR
NR39
7/41
8 (9
5.0%
)11
–15
year
s. A
dmitt
ed.
Adm
issi
on c
riter
ia w
ere
GCS
< 1
5, s
kull
fract
ure
dete
cted
radi
olog
ical
ly an
d/or
sus
pect
ed
clin
ical
ly, in
clud
ing
base
of
sku
ll, a
ssoc
iate
d in
jurie
s, p
ost-
traum
atic
ep
ileps
y, n
euro
logi
cal
sign
s, h
isto
ry o
f LOC
, he
adac
he a
nd v
omiti
ng,
scal
p la
cera
tions
re
quiri
ng tr
eatm
ent,
drug
s or
alc
ohol
Thos
e di
scha
rged
ho
me
who
did
not
re-
atte
nd. T
hose
refe
rred
from
oth
er h
ospi
tals
Buch
anic
h 20
0782
USA
R97
Mea
n 15
.2
mon
ths
(NR
to 2
.9
year
s)
22/9
7 (2
2.7%
)No
52/9
7 (5
3.6%
)10
0%NR
< 3
yea
rs o
ld. G
CS
14–1
5Pe
netra
ting
inju
ries,
de
pres
sed
skul
l fra
ctur
es re
quiri
ng
surg
ery,
inju
ries
susp
ecte
d to
be
inte
ntio
nal a
nd in
itial
CT
sca
n >
24
hour
s af
ter i
njur
y
cont
inue
d

90 Assessment of diagnostic accuracy
Author, year
Country
Design
No. of patients, n
Mean or median age, years (range)
Prevalence of neurosurgery
Prevalence of ICI
CT as inclusion? (yes/no)
Male, n
Patients with MHI, n
Prevalence of GCS 15, n
Other significant inclusion criteria
Other significant exclusion criteria
Gree
nes
and
Schu
tzm
an
2001
86
USA
P, Cs
422
11.6
m
onth
s (3
day
s to
23
mon
ths)
13
/422
(3
.1%
)No
NR42
2/42
2 (1
00%
) (a
ssum
ed)
NR, b
ut a
ll as
ympt
omat
ic
so a
ssum
e GC
S 15
< 2
yea
rs. A
sym
ptom
atic
, he
ad tr
aum
aSy
mpt
omat
icb
patie
nts
with
any
of
: his
tory
of L
OC,
leth
argy
, irri
tabi
lity,
se
izure
s, th
ree
or
mor
e ep
isod
es o
f em
esis
, irri
tabi
lity
or
depr
esse
d m
enta
l st
atus
, bul
ging
fo
ntan
elle
, abn
orm
al
vital
sig
ns in
dica
ting
incr
ease
d in
tracr
ania
l pr
essu
re o
r foc
al
neur
olog
ical
find
ings
Cs, c
onve
nien
ce s
ampl
e; C
v, co
nven
ienc
e sa
mpl
e; N
R, n
ot re
porte
d; P
, pro
spec
tive;
PTA
, pos
t-tra
umat
ic a
mne
sia;
R, r
etro
spec
tive.
a Th
ese
data
are
a s
ubse
t of a
larg
er s
tudy
repo
rted
in M
ower
et a
l.,62
whi
ch in
clud
ed a
dults
as
wel
l as
child
ren.
b Da
ta a
ssum
ed fr
om o
ther
info
rmat
ion
with
in th
e pu
blic
atio
n.
TAB
LE 1
1 In
divi
dual
clin
ical
cha
ract
eris
tics
in c
hild
ren
and
infa
nts
with
MH
I – s
tudy
des
ign
and
patie
nt c
hara
cter
istic
s of
incl
uded
stu
dies
(con
tinue
d)

© Queen’s Printer and Controller of HMSO 2011. This work was produced by Pandor et al. under the terms of a commissioning contract issued by the Secretary of State for Health.
91 Health Technology Assessment 2011; Vol. 15: No. 27DOI: 10.3310/hta15270
TABLE 12 Individual clinical characteristics in children and infants with MHI: definitions of outcomes and reference standards used in included studies
Author, year Definition of ICI Reference standard for ICI
Patients receiving CT, n
Definition of need for neurosurgery
Reference standard for need for neurosurgery
Atabaki et al. 200881
ICI: subdural, epidural, subarachnoid, intraparenchymal and intraventricular haemorrhages, as well as contusion and cerebral oedema
CT scan 1000/1000 (100%)
NA NA
Boran et al. 2006128
Intracranial lesions: not including soft tissue swelling and linear skull fractures
CT scan 421/421 (100%)
NA NA
Da Dalt et al. 200683
ICI: identified on CT either at initial ER presentation or during any hospital admission or readmission
CT scan obtained at discretion of treating physician
All children discharged immediately from ER or after short observation received a follow-up telephone interview approximately 10 days later. Hospital records were checked for readmissions for 1 month after conclusion of study
79/3806 (2%) NA NA
Davis et al. 1994129
Intracranial haemorrhage: not defined
CT scan 168/168 (100%)
NA NA
Dietrich et al. 199384
Intracranial pathology: epidural or subdural haematoma, cerebral contusions or lacerations, intraventricular haemorrhage pneumocephaly or cerebral oedema, with or without skull fracture
CT scan 166/166 (100%)
NA NA
Dunning et al. 200630
Clinically significant ICI: death as a result of head injury, requirement for neurosurgical intervention or marked abnormalities on the CT scan
All patients treated according to RCS guidelines. This recommends admission for those at high risk and CT scan for those at highest risk
Follow-up: all patients who were documented as having had a skull radiograph, admission to hospital, CT scan or neurosurgery were followed up
744/22,772 (3.3%)
NA NA
Fisher 1997141
ICI: not defined CT scan 42/42 (100%) NA NA
Fridriksson et al. 2000130
Intracranial lesion: cerebral oedema, parenchymal bleeding, cerebral contusion or subarachnoidal subdural or epidural bleeding
CT scan 49/49 (100%) NA NA
Guzel et al. 200987
Positive CT scan: definition NR CT scan 337/337 (100%)
NA NA
continued

92 Assessment of diagnostic accuracy
Author, year Definition of ICI Reference standard for ICI
Patients receiving CT, n
Definition of need for neurosurgery
Reference standard for need for neurosurgery
Hahn and McLone 1993131
632/791 (79.9%)
Neurosurgical intervention: mass lesions (epidural or subdural haematoma requiring surgery)
CT scan, neurosurgery and follow-up at outpatient trauma clinic of those asymptomatic with clear CT
Halley et al. 2004142
ICI: abnormality on CT scan CT scan 98/98 (100%) NA NA
Haydel and Schembekar 200388
ICI on head CT: any acute traumatic intracranial lesion, including subdural epidural or parenchymal haematoma, subarachnoid haemorrhage, cerebral contusion or depressed skull fracture
CT scan 175/175 (100%)
Need for neurosurgical or medical intervention in patients with ICI on CT
All patients with abnormal CT scan admitted and followed until discharge
Keskil et al. 1995132
Epidural or subdural haematoma Observed at operation or CT NR NA NA
Klemetti et al. 200989
Complicated or severely complicated head trauma: brain contusion, skull base fracture, skull fracture. Patients who required neurosurgical intervention, patients who succumbed, epidural haematoma, subdural haematoma, subarachnoid haematoma, intracerebral haematoma
Hospital records 242/485 (49.9%)
NA NA
Kupperman et al. 200990
Clinically important brain injury: death from TBI, neurosurgery, intubation for > 24 hours for TBI or hospital admission of two nights or more associated with TBI on CT. Brief intubation for imaging and overnight stay for minor CT findings NOT included
CT scans, medical records, and telephone follow-up. Those admitted: medical records, CT scan results. Those discharged: telephone survey 7–90 days after the ED visit, and medical records and county morgue records check for those who were not contactable
11,643/31,694 (36.7%) (children)
3326/10,718 (31.0%) (infants)
NA NA
Mandera 2000133
ICI: mass lesion (epidural, subdural or intracerebral haematoma seen on CT)
CT scan 166/166 (100%)
NA NA
Ng et al. 2002134
Abnormal CT scan: isolated fractures and intracranial pathology (epidural, subdural or parenchymal haematoma, cerebral contusion, intraventricular or subarachnoid haemorrhage, cerebral oedema) with or without a fracture
CT scan: at physician’s discretion
119/119 (100%)
NA NA
aOman 2006;91 aSun et al. 200795
Clinically important/significant ICI: any injury that may require neurosurgical intervention, lead to rapid clinical deterioration or result in significant long-term neurological impairment
CT scan 1666/1666 (100%)
NA NA
TABLE 12 Individual clinical characteristics in children and infants with MHI: definitions of outcomes and reference standards used in included studies (continued)

© Queen’s Printer and Controller of HMSO 2011. This work was produced by Pandor et al. under the terms of a commissioning contract issued by the Secretary of State for Health.
93 Health Technology Assessment 2011; Vol. 15: No. 27DOI: 10.3310/hta15270
Author, year Definition of ICI Reference standard for ICI
Patients receiving CT, n
Definition of need for neurosurgery
Reference standard for need for neurosurgery
Palchak et al. 200393
TBI identified on CT scan or TBI requiring acute intervention OR intervention by one or more of: neurosurgical procedure, ongoing antiepileptic pharmacotherapy beyond 7 days, the presence of a neurological deficit that persisted until discharge from the hospital, or two or more nights of hospitalisation because of treatment of the head injury
CT or performance of intervention
1098/1098 (100%)
NA NA
Quayle et al. 199794
ICI: definition NR CT scan 321/321 (100%)
NA NA
Ramundo et al. 1995135
Depressed or basilar skull fractures, brain contusion, epidural or subdural haematomas, subarachnoid haemorrhage, intraparenchymal or intraventricular haemorrhage, pneumocephaly, cerebral oedema
CT scan 261/261 (100%) (children)
37/37 (100%) (infants)
NA NA
Reed et al. 2005136
ICI: not defined CT scan 39/39 (100%)
Schunk et al. 1996137
ICI: not defined CT scan 313/313 (100%)
ICI requiring neurosurgery, excluding skull fracture surgery
Records check
Simon et al. 2001138
ICI: subarachnoid haemorrhage, subdural haematoma, epidural haematoma and contusion
CT scan 569/569 (100%)
429/429 (100%) (subset)
Stein and Doolin 1995139
Intracranial lesion on CT: not defined
CT scan 751/751 (100%)
Neurosurgical procedure
NR
Wang et al. 2000140
CT scan abnormality: any evidence of traumatic injury to the cranial bones or brain (haemorrhages classified as epidural, subdural, subarachnoid or intraparenchymal spaces)
CT scan
NR for those who did not have a CT scan
134/157 (85.4%)
NA NA
Chan et al. 1990127
Intracranial haemorrhage: development of acute intracranial haemorrhage within 48 hours of injury
CT scan NR NA NA
Buchanich 200782
ICI: intracranial haematoma, intracranial haemorrhage, cerebral contusion and/or cerebral oedema
CT scan
Follow-up questionnaire/telephone interview: questions regarding child’s symptoms and behaviour following injury
97/97 (100%) NA NA
Greenes and Schutzman 200186
ICI: cerebral contusion, cerebral oedema or intracranial haematoma noted on CT
CT scan 172/172 (100%)
NA NA
NR, Not reported; NA, not applicable.a Oman91 and Sun et al.95 are a subset of the NEXUS II derivation cohort (Mower et al.).62
TABLE 12 Individual clinical characteristics in children and infants with MHI: definitions of outcomes and reference standards used in included studies (continued)

94 Assessment of diagnostic accuracy
Yes (high quality)UnclearNo (low quality)Not applicable
Appropriate spectrum composition?
Selection criteria clearly described?
Reference standard intracranial injury adequate?
Reference standard neurosurgery adequate?
Partial verification bias avoided?
Differential verification bias avoided?
Test execution details reported?
Reference standard execution details reported?
Test review bias avoided?
Diagnostic review bias avoided?
Clinical review bias avoided?
Uninterpretable results reported?
Withdrawals accounted for?
0% 25% 50% 100%75%
FIGURE 15 Individual clinical characteristics in adults with MHI – methodological quality graph. Review authors’ judgements about each methodological quality item presented as percentages across all included studies.
Quality of included studiesAdultsThe methodological quality assessment of each included study is summarised in Figures 15 and 16. Overall, most of the included studies were poorly reported and did not satisfy the majority of the quality assessment items of the QUADAS tool.
The main source of variation was patient spectrum, for which no study scored positively (further details are provided in Description of included studies). Fewer than one-quarter of the studies used an adequate reference standard for ICI,29,67,108,111,113,115,122 with the majority scoring unclear or negatively. Although 21 studies27,55,58–63,99,100,102,104,107,110,116,118,120,123–126 carried out CT in all participants, they failed to state whether this was done within 24 hours and were therefore scored unclear. Of the 14 studies26,29,46,54,57,59,102–105,111,121,122,124,126 that reported the outcome neurosurgery, all either reported an inadequate reference standard or were unclear on this point. Poor scores were usually given because length of follow-up was not adequate.
Partial verification bias was largely avoided. Similarly, studies scored well generally for differential verification bias, with reference standards being applied to the whole cohort in 29 cases.26,27,29,46,55,58,60,62,63,67,69,98–100,102–104,107,108,110,111,113,115,116,118,120–126 However, it should be noted that three54,57,106 of the four largest cohorts scored negatively or unclear across the reference standard and verification items, and two54,57 of these report data for a large number of clinical characteristics. There is the potential for bias in these studies to influence results.
The execution of the index test was reported more often than the reference standard. This probably reflects the routine nature of CT scanning, whereas the index tests required more explanation. Test review and diagnostic review biases were largely unreported. This may have been considered an unnecessary detail to report as it is likely that clinical characteristics will have been assessed prior to CT scanning and, therefore, blinded by default. However, where it is not clear that this is the case, studies have been scored unclear. Blinding of the index test results when reading the reference standard may have been thought unethical, although no study examined this issue. It was difficult to assess to what extent a lack of blinding has influenced results. Clinical review bias scored a little better as retrospective studies by definition reflect real-life practice, but overall scored poorly or unclear. Uninterpretable results were rarely discussed. In the one case where they were,108 it was unclear how these results were treated for analysis. Withdrawals were
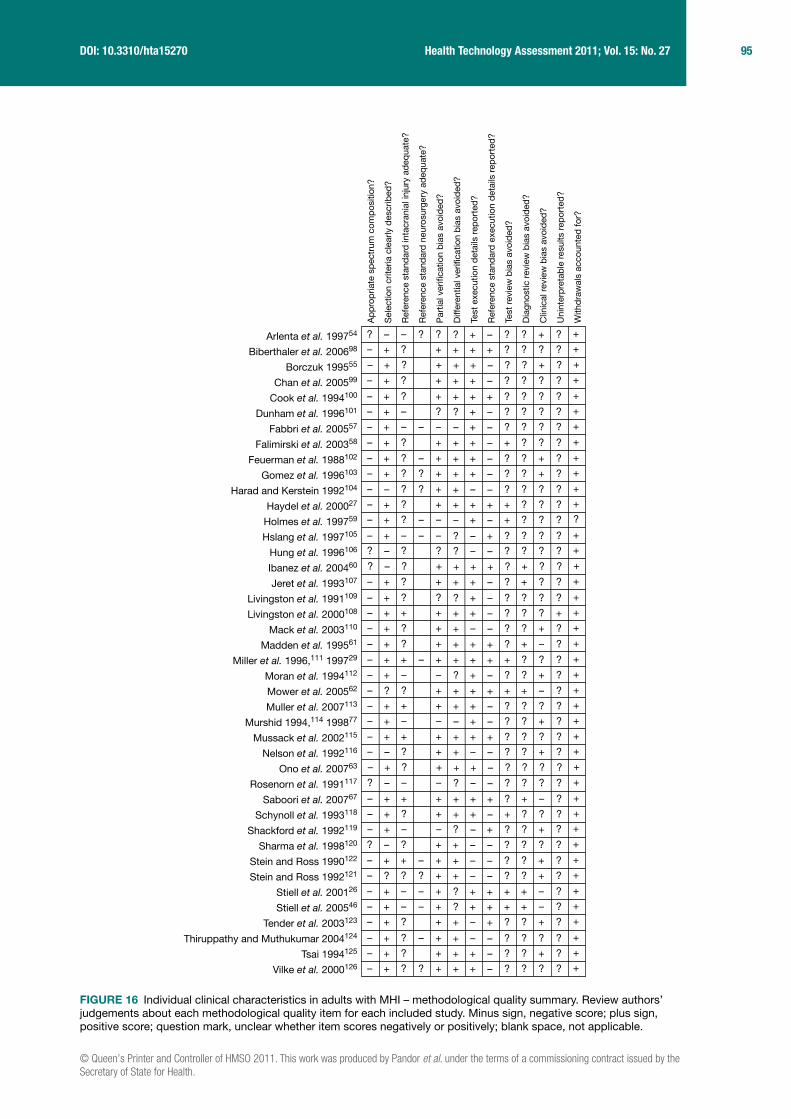
© Queen’s Printer and Controller of HMSO 2011. This work was produced by Pandor et al. under the terms of a commissioning contract issued by the Secretary of State for Health.
95 Health Technology Assessment 2011; Vol. 15: No. 27DOI: 10.3310/hta15270
? ?– – ? + ? ? +–? +?
– ++ ? + ? ? ?++ +?
– ++ ? + ? ? +–+ +?
– ++ ? + ? ? ?–+ +?
– ++ ? + ? ? ?++ +?
– ?+ – + ? ? ?–? +?
– –+ – – + ? ? ?–– +?
– ++ ? + + ? ?–+ +?
– ++ ? – + ? ? +–+ +?
– ++ ? ? + ? ? +–+ +?
– +– ? ? – ? ? ?–+ +?
– ++ ? + + ? ?++ +?
– –+ ? – + + ? ?–– ??
– –+ – – – ? ? ?+? +?
? ?– ? – ? ? ?–? +?
? +– ? + ? + ?++ +?
– ++ ? + ? + ?–+ +?
– ?+ ? + ? ? ?–? +?
– ++ + + ? ? ?–+ ++
– ++ ? – ? ? +–+ +?
– ++ ? + ? + –++ +?
– ++ + – + + ? ?++ +?
– –+ – + ? ? +–? +?
– +? ? + + + –++ +?
– ++ + + ? ? ?–+ +?
– –+ – + ? ? +–– +?
– ++ + + ? ? ?++ +?
– +– ? – ? ? +–+ +?
– ++ ? + ? ? ?–+ +?
? –– – – ? ? ?–? +?
– ++ + + ? + –++ +?
– ++ ? + + ? ?–+ +?
– –+ – – ? ? ++? +?
? +– ? – ? ? ?–+ +?
– ++ + – – ? ? +–+ +?
– +? ? ? – ? ? +–+ +?
– ++ – – + + + –+? +?
– ++ – – + + + –+? +?
– ++ ? – ? ? +++ +?
– ++ ? – – ? ? ?–+ +?
– ++ ? + ? ? +–+ +?
– ++ ? ? + ? ? ?–+ +?
Ap
pro
pria
te s
pec
trum
com
pos
ition
?
Sel
ectio
n cr
iteria
cle
arly
des
crib
ed?
Ref
eren
ce s
tand
ard
inta
cran
ial i
njur
y ad
equa
te?
Ref
eren
ce s
tand
ard
neu
rosu
rger
y ad
equa
te?
Par
tial v
erifi
catio
n b
ias
avoi
ded
?
Diff
eren
tial v
erifi
catio
n b
ias
avoi
ded
?
Test
exe
cutio
n d
etai
ls r
epor
ted
?
Ref
eren
ce s
tand
ard
exe
cutio
n d
etai
ls r
epor
ted
?
Test
rev
iew
bia
s av
oid
ed?
Dia
gnos
tic r
evie
w b
ias
avoi
ded
?
Clin
ical
rev
iew
bia
s av
oid
ed?
Uni
nter
pre
tab
le r
esul
ts r
epor
ted
?
With
dra
wal
s ac
coun
ted
for?
Arlenta et al. 199754
Biberthaler et al. 200698
Borczuk 199555
Chan et al. 200599
Cook et al. 1994100
Dunham et al. 1996101
Fabbri et al. 200557
Falimirski et al. 200358
Feuerman et al. 1988102
Gomez et al. 1996103
Harad and Kerstein 1992104
Haydel et al. 200027
Holmes et al. 199759
Hslang et al. 1997105
Hung et al. 1996106
Ibanez et al. 200460
Jeret et al. 1993107
Livingston et al. 1991109
Livingston et al. 2000108
Mack et al. 2003110
Madden et al. 199561
Miller et al. 1996,111 199729
Moran et al. 1994112
Mower et al. 200562
Muller et al. 2007113
Murshid 1994,114 199877
Mussack et al. 2002115
Nelson et al. 1992116
Ono et al. 200763
Rosenorn et al. 1991117
Saboori et al. 200767
Schynoll et al. 1993118
Shackford et al. 1992119
Sharma et al. 1998120
Stein and Ross 1990122
Stein and Ross 1992121
Stiell et al. 200126
Stiell et al. 200546
Tender et al. 2003123
Thiruppathy and Muthukumar 2004124
Tsai 1994125
Vilke et al. 2000126
FIGURE 16 Individual clinical characteristics in adults with MHI – methodological quality summary. Review authors’ judgements about each methodological quality item for each included study. Minus sign, negative score; plus sign, positive score; question mark, unclear whether item scores negatively or positively; blank space, not applicable.

96 Assessment of diagnostic accuracy
Yes (high quality)UnclearNo (low quality)Not applicable
Appropriate spectrum composition?
Selection criteria clearly described?
Reference standard intracranial injury adequate?
Reference standard neurosurgery adequate?
Partial verification bias avoided?
Differential verification bias avoided?
Test execution details reported?
Reference standard execution details reported?
Test review bias avoided?
Diagnostic review bias avoided?
Clinical review bias avoided?
Uninterpretable results reported?
Withdrawals accounted for?
0% 25% 50% 100%75%
FIGURE 17 Individual clinical characteristics in children and infants with MHI – methodological quality graph. Review authors’ judgements about each methodological quality item presented as percentages across all included studies.
generally not reported and, as there was no evidence to suggest that there were any withdrawals to report, all but one study59 scored well for this item.
ChildrenThe methodological quality assessment of each included study is summarised in Figures 17 and 18. Overall, most of the included studies were poorly reported and did not satisfy the majority of the quality assessment items of the QUADAS tool.
The main source of variation was patient spectrum, for which only one study scored positively90 (further details are in Description of included studies). Only five studies used an adequate reference standard for ICI,84,94,133,134,137 with the majority scoring unclear or negatively, including the two very large cohorts.30,90 Although 13 studies81,87,88,91,95,128–130,135,136,138,139,141,142 did carry out CT in all participants, they failed to state whether this was within 24 hours and were therefore scored unclear. Of the four88,131,137,139 studies that reported the outcome data for neurosurgery, none reported an adequate reference standard: two reported an inadequate reference standard and two were unclear on this point.
Partial verification bias was largely avoided, with 24 studies81–84,86–91,94,128–131,133–139,141,142 scoring well for this item, although one of the large cohorts scored negatively.30 Similarly, studies scored well generally for differential verification bias, with reference standards being applied to the whole cohort in 19 cases.81,84,86,87,91,94,128–131,133–139,141,142 For the two very large cohorts, one study scored negatively for this item,30 whereas for the other study90 the reference standard was determined at the physician’s discretion so the item scored unclear.
The execution of the index test was reported more often than the reference standard. Test review and diagnostic review biases were largely unreported. Blinding of the index test results when reading the reference standard may have been thought unethical, though no study examined this issue. Clinical review bias scored a little better as retrospective studies by definition reflect real-life practice, but over half scored poorly or unclear. Uninterpretable results were discussed in only one study,81 with reference to a single uninterpretable CT scan that was treated as a positive. Withdrawals were generally not reported and, as there was no evidence to suggest that there were any withdrawals to report, most studies scored well for this item.

© Queen’s Printer and Controller of HMSO 2011. This work was produced by Pandor et al. under the terms of a commissioning contract issued by the Secretary of State for Health.
97 Health Technology Assessment 2011; Vol. 15: No. 27DOI: 10.3310/hta15270
– ++ ? + + ? ?++ ++
– ++ ? + ? ? ?++ +?
– ++ – + ? ? ?+? +?
– –+ – – ? ? ?–– +?
– ++ – + ? ? ?–– –?
– ++ ? + ? + +–+ +?
– ++ + + ? ? +++ –?
– –+ – + – ? ++– ??
– ++ ? + ? ? ?–+ +?
– ++ ? + ? ? ?++ +?
– ++ – + ? ? ?++ +?
– ++ ? + ? ? +–+ +?
– ++ ? – – ? ? ?++ +?
– ++ ? + ? ? ?–+ +?
– ++ ? – – + ? ?+– +?
– ?+ – – ? ? ?+? +?
– +– – – ? ? ++? ++
+ ++ – + + + ––? –+
– +– + – ? ? +++ ??
– ++ + – ? ? +++ +?
– +? ? + + + –++ +?
– –+ – + + ? ?–? ++
– ++ + – ? – +–+ +?
– ++ ? + ? ? ?++ +?
– ++ ? – ? ? +–+ +?
– ++ + ? – ? ? +–+ +?
– ++ ? – ? ? +++ +?
– ++ ? ? + ? ? +–+ +?
– –+ – – ? ? ?–? +?
Ap
pro
pria
te s
pec
trum
com
pos
ition
?
Sel
ectio
n cr
iteria
cle
arly
des
crib
ed?
Ref
eren
ce s
tand
ard
intr
acra
nial
inju
ry a
deq
uate
?
Ref
eren
ce s
tand
ard
neu
rosu
rger
y ad
equa
te?
Par
tial v
erifi
catio
n b
ias
avoi
ded
?
Diff
eren
tial v
erifi
catio
n b
ias
avoi
ded
?
Test
exe
cutio
n d
etai
ls r
epor
ted
?
Ref
eren
ce s
tand
ard
exe
cutio
n d
etai
ls r
epor
ted
?
Test
rev
iew
bia
s av
oid
ed?
Dia
gnos
tic r
evie
w b
ias
avoi
ded
?
Clin
ical
rev
iew
bia
s av
oid
ed?
Uni
nter
pre
tab
le r
esul
ts r
epor
ted
?
With
dra
wal
s ac
coun
ted
for?
Atabaki et al. 200881
Boran 2006128
Buchanich 200782
Chan 1990127
Da Dalt et al. 200683
Davis 1994129
Dietrich et al. 199384
Dunning et al. 200630
Fisher 1997141
Fridriksson 2000130
Greenes and Schutzman 200186
Guzel et al. 200987
Hahn 1993131
Halley 2004142
Haydel and Schembekar 200388
Keskil 1995132
Klemetti et al. 200989
Kupperman et al. 200990
Mandera 2000133
Ng 2002134
Oman 2006,91 Sun et al. 200795
Palchak et al. 200393
Quayle et al. 199794
Ramundo 1995135
Reed 2005136
Schunk 1996137
Simon 2001138
Stein and Doolin 1995139
Wang 2000140
FIGURE 18 Individual clinical characteristics in children and infants with MHI – methodological quality summary. Review authors’ judgements about each methodological quality item for each included study. Minus sign, negative score; plus sign, positive score; question mark, unclear whether item scores negatively or positively; blank space, not applicable.

98 Assessment of diagnostic accuracy
Summary of test accuracy results: individual characteristicsAdultsTables 13 and 14 show the sensitivity, specificity, PLR and NLR for each individual clinical characteristic for predicting ICI or need for neurosurgery in adults. Further details are provided in Appendix 5. Only individual clinical characteristics that were defined consistently and in a clinically meaningful way were included in the meta-analysis. Two studies108,126 were excluded from the meta-analysis because they did not define the characteristics they reported (neurological examination) in a way similar enough to other studies to be meaningfully meta-analysed.
The PLR indicates how useful each characteristic is for ruling injury in, whereas the NLR indicates how useful it is for ruling injury out. In general, clinical assessment contributes to diagnosis by identifying features that increase the risk of ICI. There are no clinical or radiological characteristics that can be used individually to rule out ICI. The only test that does have a rule-out role is S100B with a NLR of 0.076 (further details are provided – see Biomarkers).
Depressed, basal or radiological skull fracture and PTS each substantially increased the likelihood of ICI (PLR > 10). These findings are of mainly historical interest, as CT scanning has generally replaced skull radiology. Skull fractures are now usually identified on CT scanning, which will also show the ICI.
Clinical characteristics appear to be more useful if they are precisely defined. Focal neurological deficit, persistent vomiting, decrease in GCS and previous neurosurgery all markedly increased the likelihood of ICI (PLR 5–10). However, the last was only assessed in three studies, was subject to significant heterogeneity and had a CI for the PLR crossing 1. Fall from a height, coagulopathy, chronic alcohol use, age over 60 years, pedestrian MVA, any seizure, undefined vomiting, retrograde or anterograde amnesia GCS < 14 and GCS < 15 moderately increased the risk of ICI (PLR 2–5). Meanwhile, LOC and headache (even if severe) appear to be of little value in diagnosing ICI.
Only a few studies have assessed the value of individual characteristics to diagnose specifically neurosurgical injury, so only limited conclusions can be drawn. GCS < 15 has some limited value for both ruling in and ruling out neurosurgical injury (i.e. a normal GCS reduces the likelihood of neurosurgical injury). Focal neurological injury, vomiting and radiological skull fracture all increased the likelihood of neurosurgical injury. The failure to demonstrate diagnostic value of many characteristics for diagnosing neurosurgical injury probably reflects the limited data available for this outcome and should not be interpreted as showing that individual characteristics are of limited value. There are good theoretical reasons to anticipate that characteristics that are useful for diagnosing any ICI will also be valuable for diagnosing specifically neurosurgical injury.

© Queen’s Printer and Controller of HMSO 2011. This work was produced by Pandor et al. under the terms of a commissioning contract issued by the Secretary of State for Health.
99 Health Technology Assessment 2011; Vol. 15: No. 27DOI: 10.3310/hta15270
TABLE 13 Individual clinical characteristics in adults with MHI – pooled estimates of likelihood ratios for predicting ICI
Clinical characteristic
No. of studies
Heterogeneity test p-valuea Pooled estimates
Sensitivity Specificity Sensitivity95% HDR Specificity
95% HDR NLR
95% HDR PLR
95% HDR
Intoxication 10 < 0.001 < 0.001 21.4 13.5 to 31.4
84.6 76.7 to 90.3
0.931 0.844 to 1.007
1.38 0.97 to 1.99
Fall – any 10 < 0.001 < 0.001 31.3 20.3 to 44.3
72.0 62.2 to 80.2
0.953 0.871 to 1.024
1.12 0.93 to 1.29
Fall from a height
1 NA NA 28.0 17.3 to 41.9
87.8 85.6 to 89.6
0.820 0.689 to 0.977
2.29 1.43 to 3.68
Dizziness 3 0.482 0.267 18.7 11.9 to 27.3
73.8 70.2 to 78.1
1.101 0.970 to 1.217
0.72 0.44 to 1.09
Coagulopathy 8 < 0.001 < 0.001 4.9 0.6 to 16.0
98.2 93.3 to 99.8
0.968 0.897 to 0.999
3.27 1.21 to 7.52
Chronic alcohol
4 < 0.001 < 0.001 5.9 0.7 to 40.8
97.6 49.5 to 99.8
0.973 0.933 to 1.186
2.00 0.79 to 9.03
Assault 8 < 0.001 < 0.001 14.1 3.9 to 36.0
86.2 67.4 to 95.4
0.997 0.924 to 1.038
1.02 0.68 to 1.33
Age > 60 years
7 < 0.001 < 0.001 23.9 14.5 to 36.5
88.0 78.1 to 93.8
0.868 0.785 to 0.925
1.97 1.48 to 2.81
Visual symptoms
3 0.265 < 0.001 2.4 0.0 to 21.4
94.2 70.7 to 99.3
1.033 0.940 to 1.199
0.39 0.00 to 2.49
Prior neurosurgery
3 0.231 < 0.001 1.9 0.3 to 5.1
99.8 92.3 to 100.0
0.985 0.969 to 1.030
8.67 0.62 to 308.90
Motor vehicle collision – pedestrian
6 0.182 < 0.001 15.9 10.9 to 21.3
95.4 91.9 to 97.8
0.882 0.836 to 0.923
3.43 2.27 to 6.45
Motor vehicle collision – in car
10 < 0.001 < 0.001 17.7 8.7 to 31.0
74.4 57.7 to 86.0
1.108 1.031 to 1.218
0.69 0.53 to 0.86
Motor vehicle collision with bicycle
2 0.011 < 0.001 10.6 6.4 to 16.9
89.0 87.3 to 90.5
0.963 0.601 to 1.543
1.67 1.01 to 2.75
Any seizure 10 0.262 < 0.001 2.8 1.1 to 5.1
99.0 96.2 to 99.7
0.984 0.970 to 0.996
2.59 1.20 to 6.40
Any LOC 17 < 0.001 < 0.001 59.9 43.0 to 75.8
58.0 39.5 to 74.1
0.698 0.532 to 0.871
1.41 1.14 to 1.84
Any headache 13 < 0.001 < 0.001 36.8 25.5 to 50.5
70.3 57.3 to 79.8
0.901 0.792 to 1.005
1.23 0.99 to 1.55
Undefined vomiting
10 < 0.001 < 0.001 20.2 13.7 to 28.3
92.2 85.8 to 95.9
0.868 0.794 to 0.935
2.58 1.52 to 4.49
continued

100 Assessment of diagnostic accuracy
TABLE 13 Individual clinical characteristics in adults with MHI – pooled estimates of likelihood ratios for predicting ICI (continued)
Clinical characteristic
No. of studies
Heterogeneity test p-valuea Pooled estimates
Sensitivity Specificity Sensitivity95% HDR Specificity
95% HDR NLR
95% HDR PLR
95% HDR
Undefined or mixed amnesia
7 < 0.001 < 0.001 50.9 24.5 to 77.9
60.0 35.3 to 79.7
0.815 0.579 to 1.008
1.27 0.98 to 1.59
PTS 2 0.002 0.002 7.9 6.0 to 10.4
99.4 99.2 to 99.5
0.921 0.841 to 1.009
12.39 8.41 to 18.24
Severe or persistent headache
2 < 0.001 < 0.001 19.4 16.8 to 22.2
80.5 79.9 to 81.2
1.028 0.959 to 1.101
1.00 0.86 to 1.16
Persistent vomiting
4 < 0.001 < 0.001 16.1 3.0 to 50.7
97.2 69.3 to 99.9
0.871 0.659 to 0.983
5.53 1.33 to 30.12
Retrograde amnesia
4 < 0.001 < 0.001 44.3 36.9 to 55.2
81.6 56.7 to 91.6
0.687 0.635 to 0.848
2.41 1.21 to 4.55
Anterograde or post-traumatic amnesia
6 < 0.001 < 0.001 16.2 6.8 to 30.9
91.9 83.2 to 96.4
0.912 0.825 to 0.972
1.95 1.48 to 2.62
GCS < 15 25 < 0.001 < 0.001 44.9 37.7 to 51.8
86.7 80.6 to 91.2
0.638 0.557 to 0.722
3.35 2.31 to 5.03
GCS < 14 12 < 0.001 < 0.001 15.0 11.4 to 18.9
96.0 94.3 to 97.4
0.885 0.853 to 0.915
3.81 2.87 to 4.93
GCS decrease 3 0.024 < 0.001 27.3 20.8 to 36.7
95.7 83.4 to 98.8
0.763 0.711 to 0.822
6.39 2.05 to 19.33
Focal neurological deficit
8 < 0.001 < 0.001 6.6 1.2 to 16.9
98.6 95.2 to 99.8
0.95 0.84 to 1.01
9.671 0.663 to 38.950
Depressed skull fracture
2 0.004 0.452 9.1 5.5 to 14.5
99.9 99.6 to 100.0
0.967 0.819 to 1.141
102.15 13.13 to 794.41
Basal skull fracture
8 < 0.001 < 0.001 21.1 8.4 to 33.9
98.4 90.5 to 100.0
0.80 0.72 to 0.92
54.070 3.594 to 353.700
Radiological skull fracture
8 < 0.001 < 0.001 29.8 9.8 to 55.9
97.4 94.2 to 99.2
0.720 0.455 to 0.923
14.26 3.68 to 38.43
NA, not applicable.a The p-value based on Q-statistic.

© Queen’s Printer and Controller of HMSO 2011. This work was produced by Pandor et al. under the terms of a commissioning contract issued by the Secretary of State for Health.
101 Health Technology Assessment 2011; Vol. 15: No. 27DOI: 10.3310/hta15270
TABLE 14 Individual clinical characteristics in adults with MHI – pooled estimates of likelihood ratios for predicting need for neurosurgery
Clinical characteristic
No. of studies
Heterogeneity test p-valuea Pooled estimates
Sensitivity Specificity Sensitivity95% HDR Specificity
95% HDR NLR
95% HDR PLR
95% HDR
Fall – any 2 0.952 0.002 17.9 5.2 to 46.1
74.4 72.3 to 76.5
1.027 0.334 to 3.159
0.91 0.29 to 2.83
Assault 1 NA NA 63.6 33.9 to 85.7
83.2 78.4 to 87.0
0.437 0.200 to 0.957
3.78 2.26 to 6.32
Motor vehicle collision – pedestrian
1 NA NA 4.5 0.3 to 44.8
85.9 81.4 to 89.5
1.111 0.969 to 1.274
0.32 0.02 to 4.91
Motor vehicle collision – in car
2 0.498 0.291 8.5 1.2 to 42.5
58.4 56.1 to 60.8
1.546 0.243 to 9.826
0.21 0.03 to 1.36
GCS < 15 7 0.026 < 0.001 53.1 34.8 to 73.1
86.8 62.3 to 96.2
0.546 0.310 to 0.881
4.00 1.24 to 14.61
GCS < 14 5 0.271 < 0.001 21.0 10.0 to 33.4
94.3 84.9 to 98.0
0.839 0.684 to 1.042
3.67 0.75 to 15.81
Focal neurological deficit
1 NA NA 50.0 20.0 to 80.0
93.7 90.7 to 95.8
0.534 0.125 to 2.272
7.93 1.86 to 33.79
Depressed skull fracture
1 NA NA 60.0 20.0 to 90.0
99.98 99.6 to 100.0
0.400 0.137 to 1.171
2.56 146.6 to 44,909
Any LOC 1 NA NA 16.7 1.0 to 80.6
38.7 36.1 to 41.3
2.156 0.103 to 44.998
0.27 0.01 to 5.67
Any headache 1 NA NA 25.0 3.4 to 76.2
78.5 73.0 to 83.0
0.956 0.098 to 9.368
1.16 0.12 to 11.38
Undefined vomiting
2 0.858 0.015 22.3 5.6 to 58.1
94.6 93.6 to 95.4
0.811 0.386 to 1.706
6.41 1.50 to 27.33
Undefined or mixed amnesia
1 NA NA 16.7 1.0 to 80.6
61.1 58.5 to 63.7
1.363 0.065 to 28.451
0.43 0.02 to 8.95
Severe or persistent headache
1 NA NA 20.0 2.7 to 69.1
67.7 65.7 to 69.6
1.182 0.132 to 10.596
0.62 0.07 to 5.55
Radiological skull fracture
3 0.004 < 0.001 43.1 31.0 to 58.6
91.3 87.3 to 94.1
0.623 0.444 to 0.788
4.99 2.48 to 9.48
PTS 1 NA NA 8.3 0.5 to 62.2
96.3 92.0 to 98.3
0.952 0.924 to 0.982
0.09 0.01 to 1.38
NA, not applicable.a The p-value based on Q-statistic.
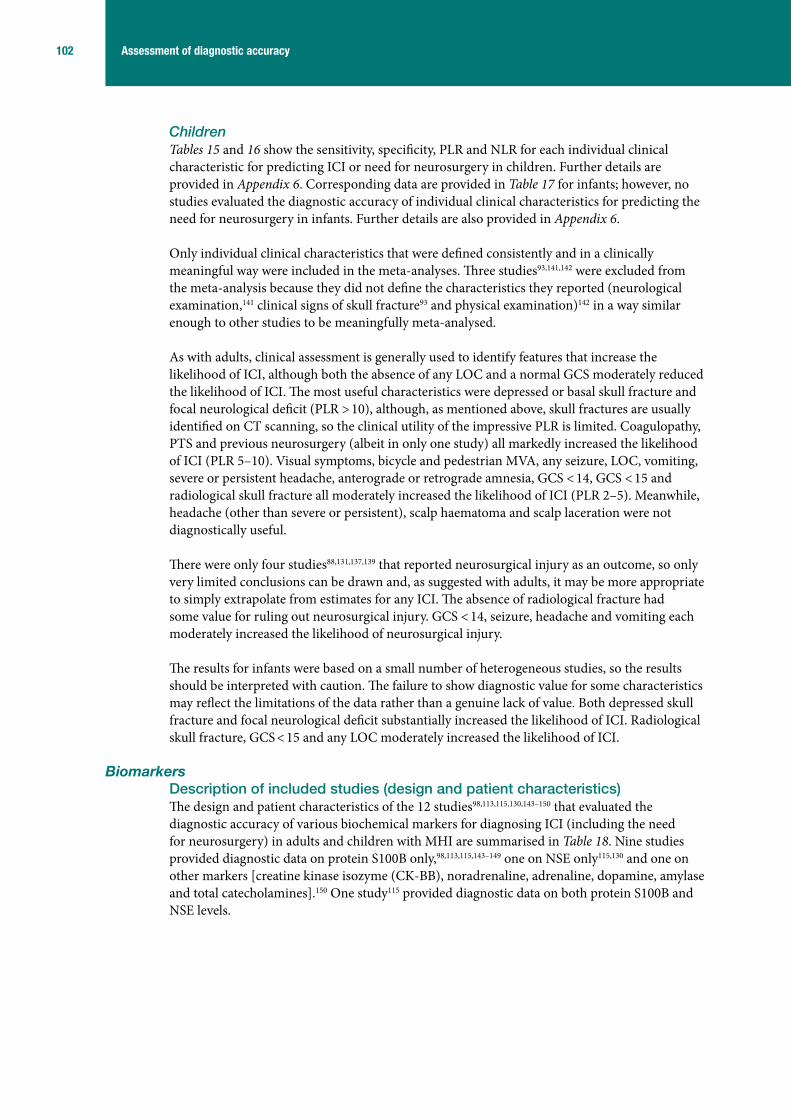
102 Assessment of diagnostic accuracy
ChildrenTables 15 and 16 show the sensitivity, specificity, PLR and NLR for each individual clinical characteristic for predicting ICI or need for neurosurgery in children. Further details are provided in Appendix 6. Corresponding data are provided in Table 17 for infants; however, no studies evaluated the diagnostic accuracy of individual clinical characteristics for predicting the need for neurosurgery in infants. Further details are also provided in Appendix 6.
Only individual clinical characteristics that were defined consistently and in a clinically meaningful way were included in the meta-analyses. Three studies93,141,142 were excluded from the meta-analysis because they did not define the characteristics they reported (neurological examination,141 clinical signs of skull fracture93 and physical examination)142 in a way similar enough to other studies to be meaningfully meta-analysed.
As with adults, clinical assessment is generally used to identify features that increase the likelihood of ICI, although both the absence of any LOC and a normal GCS moderately reduced the likelihood of ICI. The most useful characteristics were depressed or basal skull fracture and focal neurological deficit (PLR > 10), although, as mentioned above, skull fractures are usually identified on CT scanning, so the clinical utility of the impressive PLR is limited. Coagulopathy, PTS and previous neurosurgery (albeit in only one study) all markedly increased the likelihood of ICI (PLR 5–10). Visual symptoms, bicycle and pedestrian MVA, any seizure, LOC, vomiting, severe or persistent headache, anterograde or retrograde amnesia, GCS < 14, GCS < 15 and radiological skull fracture all moderately increased the likelihood of ICI (PLR 2–5). Meanwhile, headache (other than severe or persistent), scalp haematoma and scalp laceration were not diagnostically useful.
There were only four studies88,131,137,139 that reported neurosurgical injury as an outcome, so only very limited conclusions can be drawn and, as suggested with adults, it may be more appropriate to simply extrapolate from estimates for any ICI. The absence of radiological fracture had some value for ruling out neurosurgical injury. GCS < 14, seizure, headache and vomiting each moderately increased the likelihood of neurosurgical injury.
The results for infants were based on a small number of heterogeneous studies, so the results should be interpreted with caution. The failure to show diagnostic value for some characteristics may reflect the limitations of the data rather than a genuine lack of value. Both depressed skull fracture and focal neurological deficit substantially increased the likelihood of ICI. Radiological skull fracture, GCS < 15 and any LOC moderately increased the likelihood of ICI.
BiomarkersDescription of included studies (design and patient characteristics)The design and patient characteristics of the 12 studies98,113,115,130,143–150 that evaluated the diagnostic accuracy of various biochemical markers for diagnosing ICI (including the need for neurosurgery) in adults and children with MHI are summarised in Table 18. Nine studies provided diagnostic data on protein S100B only,98,113,115,143–149 one on NSE only115,130 and one on other markers [creatine kinase isozyme (CK-BB), noradrenaline, adrenaline, dopamine, amylase and total catecholamines].150 One study115 provided diagnostic data on both protein S100B and NSE levels.

© Queen’s Printer and Controller of HMSO 2011. This work was produced by Pandor et al. under the terms of a commissioning contract issued by the Secretary of State for Health.
103 Health Technology Assessment 2011; Vol. 15: No. 27DOI: 10.3310/hta15270
TABLE 15 Individual clinical characteristics in children with MHI: pooled estimates of likelihood ratios for predicting ICI
Clinical characteristic
No. of studies
Heterogeneity test p-valuea Pooled estimates
Sensitivity Specificity Sensitivity95% HDR Specificity
95% HDR NLR
95% HDR PLR
95% HDR
Intoxication 4 0.689 < 0.001 3.8 1.8 to 6.4
98.6 90.2 to 99.8
0.976 0.946 to 1.072
2.72 0.29 to 26.06
Fall – any 5 < 0.001 < 0.001 34.7 17.0 to 56.5
54.7 49.1 to 60.6
1.206 0.726 to 1.683
0.78 0.34 to 1.41
Fall from a height
2 0.423 0.421 20.0 15.8 to 25.0
80.2 79.7 to 80.7
0.991 0.787 to 1.247
1.01 0.80 to 1.28
Dizziness 3 0.881 0.012 5.2 0.6 to 13.3
93.5 85.7 to 98.5
1.014 0.910 to 1.109
0.79 0.11 to 4.30
Coagulopathy 2 0.010 < 0.001 5.8 3.2 to 10.5
99.7 99.6 to 99.8
0.942 0.520 to 1.706
6.56 3.08 to 14.00
Assault 2 0.648 0.017 3.4 1.9 to 6.0
95.9 95.6 to 96.1
1.010 0.565 to 1.805
0.79 0.44 to 1.42
Visual symptoms
2 < 0.001 0.933 9.1 5.6 to 14.5
98.9 98.8 to 99.1
0.864 0.549 to 1.360
3.51 1.63 to 7.57
Prior neurosurgery
1 NA NA 0.7 0.2 to 2.8
99.9 99.8 to 99.9
0.994 0.984 to 1.004
5.93 1.42 to 24.81
Motor vehicle collision – pedestrian
6 < 0.001 < 0.001 19.4 9.0 to 30.2
91.9 81.7 to 96.6
0.883 0.754 to 1.043
2.32 0.75 to 6.56
Motor vehicle collision – in car
5 < 0.001 < 0.001 15.2 5.6 to 31.7
90.0 67.9 to 98.4
0.947 0.870 to 1.065
1.99 0.82 to 4.30
Motor vehicle collision with bicycle
1 NA NA 15.3 11.5 to 20.0
96.7 96.5 to 96.9
0.876 0.833 to 0.921
4.63 3.49 to 6.15
Any seizure 9 0.602 < 0.001 10.0 7.3 to 13.3
96.3 91.9 to 98.3
0.935 0.899 to 0.987
2.69 1.17 to 6.24
Any LOC 17 < 0.001 < 0.001 45.9 36.4 to 55.6
80.1 67.4 to 87.3
0.679 0.566 to 0.814
2.30 1.46 to 3.47
Any headache 14 < 0.001 < 0.001 33.9 22.9 to 47.6
73.3 62.1 to 81.3
0.905 0.784 to 1.010
1.26 0.97 to 1.61
Undefined vomiting
14 < 0.001 < 0.001 30.9 21.6 to 40.1
76.0 68.1 to 83.8
0.910 0.774 to 1.059
1.29 0.85 to 1.99
Undefined or mixed amnesia
8 < 0.001 < 0.001 33.4 17.8 to 52.4
81.4 63.1 to 93.3
0.821 0.642 to 0.998
1.82 1.00 to 3.74
Undefined or mixed amnesia
8 < 0.001 < 0.001 33.4 17.8 to 52.4
81.4 63.1 to 93.3
0.821 0.642 to 0.998
1.82 1.00 to 3.74
continued

104 Assessment of diagnostic accuracy
Of the 10 S100B studies, four were from Germany,98,115,143,149 three from Scandinavia (including one multinational project),113,145,148 and one each from Austria,144 Brazil147 and Slovakia.146 Half of the studies were derivation studies, using receiver-operating characteristic (ROC) curve analysis of the study data to derive a best-fit value for optimising sensitivity and specificity.98,113,115,143,149 The other five could be classed as validation studies, where a predefined cut-off value, based on derivation studies, was used to dichotomise patients into positive and negative for S100B.98,113,115,143–149 Only one study looked exclusively at paediatric patients (0–18 years),144 with some specifically excluding them and other authors not reporting this parameter. Patients were recruited prospectively, mostly consecutively, although in some cases it was not reported if they
Clinical characteristic
No. of studies
Heterogeneity test p-valuea Pooled estimates
Sensitivity Specificity Sensitivity95% HDR Specificity
95% HDR NLR
95% HDR PLR
95% HDR
Severe or persistent headache
5 < 0.001 < 0.001 13.5 7.8 to 21.5
94.9 81.8 to 99.3
0.916 0.872 to 0.986
4.35 1.07 to 12.35
Persistent vomiting
4 0.028 < 0.001 22.1 10.7 to 40.6
92.9 87.4 to 96.8
0.840 0.635 to 0.969
3.14 1.30 to 8.05
Anterograde or post-trauma amnesia
1 NA NA 20.9 12.8 to 32.3
93.0 89.2 to 95.5
0.851 0.401 to 1.804
2.97 1.40 to 6.29
PTS 5 0.493 0.810 8.7 4.2 to 15.7
98.0 94.5 to 99.6
0.932 0.849 to 1.004
8.49 0.93 to 31.66
Scalp laceration
3 0.002 0.051 7.4 0.1 to 33.7
89.1 83.0 to 94.7
1.040 0.782 to 1.107
0.67 0.02 to 2.27
Scalp haematoma
5 < 0.001 < 0.001 45.4 27.0 to 57.6
73.1 64.9 to 82.5
0.745 0.615 to 0.918
1.70 1.30 to 2.23
GCS < 15 12 < 0.001 < 0.001 46.3 29.6 to 64.2
89.6 81.1 to 94.7
0.602 0.418 to 0.765
4.42 2.63 to 7.66
GCS < 14 5 < 0.001 < 0.001 40.4 12.8 to 77.5
89.1 18.9 to 99.6
0.718 0.429 to 1.674
3.58 0.80 to 46.84
Focal neurological deficit
10 < 0.001 < 0.001 21.1 8.8 to 41.1
99.0 95.4 to 99.8
0.798 0.615 to 0.915
20.46 7.40 to 54.24
Depressed skull fracture
2 0.032 < 0.001 16.0 12.4 to 20.5
99.8 99.7 to 99.9
0.855 0.756 to 0.966
73.82 46.45 to 117.32
Basal skull fracture
5 < 0.001 < 0.001 17.8 7.8 to 31.7
98.7 96.5 to 99.6
0.833 0.703 to 0.929
16.90 6.13 to 32.44
Radiological skull fracture
7 < 0.001 < 0.001 48.4 40.8 to 57.3
89.3 67.7 to 97.3
0.585 0.516 to 0.708
4.55 1.64 to 15.73
NA, not applicable.a The p-value based on Q-statistic.
TABLE 15 Individual clinical characteristics in children with MHI: pooled estimates of likelihood ratios for predicting ICI (continued)

© Queen’s Printer and Controller of HMSO 2011. This work was produced by Pandor et al. under the terms of a commissioning contract issued by the Secretary of State for Health.
105 Health Technology Assessment 2011; Vol. 15: No. 27DOI: 10.3310/hta15270
had sustained an isolated head injury and presented to the hospital with GCS 13–15 and one or more additional symptoms including amnesia, LOC, nausea, vomiting, dizziness/vertigo and severe headache. These criteria were universal to all studies. Patients with focal neurological deficits, multiple injuries or a history of neurological disease were mostly excluded.
As technology has advanced, the methods for analysing blood samples for biomarkers have improved. Initial studies145,148 used the Sangtec 100 immunoradiometric assay kit (Sangtec Medical, Bromma, Sweden) with a detection limit of 0.2 µg/l. Subsequent researchers have advanced to more precise technology, such as the LIA-mat luminescence immunoassay115,149 (Byk-Sangtec Diagnostica, Dietzenbach FRG) or attempted to achieve more rapid results with the DiaSorin automated immunoluminometric Liaison assay113,115,143 (DiaSorin, Saluggia, Italy) or the Roche Elecsys S100 electrochemiluminometric assay (Roche, Basel, Switzerland).143,144,146,147 Initial studies describe a delay of up to 24 hours between injury and blood sampling,148 but more recently it has been recognised that the short half-life of protein S100B necessitates more rapid sampling and analysis. Studies report this differently, but the majority of patients had blood samples taken within 3 hours, with only the two most recent studies extending this to up to 6 hours following injury.
TABLE 16 Individual clinical characteristics in children with MHI – pooled estimates of likelihood ratios for predicting need for neurosurgery
Clinical characteristic
No. of studies
Heterogeneity test p-valuea Pooled estimates
Sensitivity Specificity Sensitivity95% HDR Specificity
95% HDR NLR
95% HDR PLR
95% HDR
GCS < 14 2 0.912 < 0.001 24.2 16.5 to 34.0
88.9 87.2 to 90.5
0.863 0.677 to 1.102
2.10 1.34 to 3.28
Any seizure 1 NA NA 33.3 4.3 to 84.6
92.3 88.7 to 94.8
0.723 0.324 to 1.610
4.31 0.83 to 22.33
PTS 1 NA NA 8.3 0.5 to 62.2
96.3 92.0 to 98.3
0.952 0.924 to 0.982
0.09 0.01 to 1.38
Any LOC 1 NA NA 16.7 1.0 to 80.6
73.9 68.7 to 78.5
1.128 0.054 to 23.748
0.64 0.03 to 13.43
Any headache 2 0.161 0.479 64.2 26.6 to 89.9
68.9 64.6 to 72.9
0.267 0.186 to 0.384
2.39 1.60 to 3.58
Undefined vomiting
2 0.638 < 0.001 55.3 24.6 to 82.4
70.4 66.1 to 74.4
0.558 0.316 to 0.986
2.36 0.96 to 5.83
Undefined or mixed amnesia
1 NA NA 16.7 1.0 to 80.6
80.0 75.2 to 84.1
1.042 0.049 to 21.976
0.83 0.04 to 17.58
Radiological skull fracture
1 NA NA 73.1 61.3 to 82.4
53.3 49.7 to 56.9
0.504 0.337 to 0.752
1.57 1.33 to 1.85
GCS < 15 2 0.298 < 0.001 45.1 35.1 to 55.4
74.3 72.0 to 76.5
0.763 0.573 to 1.015
1.71 1.24 to 2.36
NA, not available.a The p-value based on Q-statistic.

106 Assessment of diagnostic accuracy
One study115 investigating protein S100B also used separate samples to analyse NSE. This was in intoxicated adult patients presenting consecutively to the ED following symptomatic MHI, during Oktoberfest in Germany. Subjects who refused consent or had sustained extracranial injuries were excluded. Samples were taken in < 2 hours and all patients received a subsequent cranial CT. Samples were processed to citrated plasma and analysed using the fully automated electrochemiluminescence Elecsys NSE assay (Roche, Basel, Switzerland). Sample concentrations for CT-positive and CT-negative groups were compared for any statistically significant difference. A subsequent ROC curve was generated. The second study into NSE prospectively recruited 49 children, age 0–18 years, presenting within 24 hours of any severity head injury (39 mild and 10 moderate/severe) and selected patients on the basis of requiring CT. The mean time from injury to sample was around 4 hours (± 3 hours) and samples were processed using a radioimmunoassay
TABLE 17 Individual clinical characteristics in infants with MHI – pooled estimates of likelihood ratios for predicting ICI
Clinical characteristic
No. of studies
Heterogeneity test p-valuea Pooled estimates
Sensitivity Specificity Sensitivity95% HDR Specificity
95% HDR NLR
95% HDR PLR
95% HDR
Fall – any 2 0.771 0.620 66.648.3 to 81.0
24.116.8 to 33.3
1.3650.893 to 2.085
0.880.67 to 1.16
Motor vehicle collision – in car
1 NA NA 25.06.3 to 62.3
93.176.2 to 98.3
0.8060.533 to 1.216
3.630.60 to 21.86
Coagulopathy 1 NA NA 4.00.6 to 23.5
97.094.2 to 98.5
0.9900.911 to 1.075
1.330.17 to 10.16
Any seizure 2 0.858 0.017 13.72.8 to 47.2
84.369.5 to 92.7
1.0660.240 to 4.730
1.320.23 to 7.55
Any LOC 4 < 0.001 < 0.001 39.420.6 to 65.2
84.156.2 to 95.5
0.7300.519 to 0.901
2.511.23 to 5.28
Undefined vomiting
2 0.858 0.991 13.72.8 to 47.2
79.470.2 to 86.3
1.1550.583 to 2.289
0.670.12 to 3.65
PTS 1 NA NA 8.02.0 to 26.9
91.087.1 to 93.8
1.0110.896 to 1.141
0.890.22 to 3.53
Persistent vomiting
1 NA NA 13.04.5 to 32.4
87.082.6 to 90.4
1.0000.296 to 3.373
1.000.30 to 3.37
GCS < 15 3 0.004 < 0.001 51.934.4 to 75.8
84.545.8 to 95.2
0.5860.377 to 0.791
3.381.24 to 8.02
Scalp haematoma
2 0.927 0.312 65.856.9 to 73.6
56.155.1 to 57.0
0.6050.531 to 0.689
1.511.33 to 1.73
Focal neurological deficit
1 NA NA 33.34.3 to 84.6
97.189.0 to 99.3
0.6870.043 to 11.098
11.330.70 to 183.11
Radiological skull fracture
2 0.058 < 0.001 64.744.8 to 80.5
81.476.8 to 85.3
0.0510.046 to 0.057
4.513.45 to 5.88
Depressed skull fracture
1 NA NA 25.0 6.3 to 62.3
98.3 78.0 to 99.9
0.763 0.510 to 1.142
14.50 0.72 to 290.82
NA, not available.a The p-value based on Q-statistic.

© Queen’s Printer and Controller of HMSO 2011. This work was produced by Pandor et al. under the terms of a commissioning contract issued by the Secretary of State for Health.
107 Health Technology Assessment 2011; Vol. 15: No. 27DOI: 10.3310/hta15270
TAB
LE 1
8 B
ioch
emic
al m
arke
rs fo
r M
HI:
stud
y de
sign
and
pat
ient
cha
ract
eris
tics
of in
clud
ed s
tudi
es
Author, year
Derivation or validation cohort
Country
Setting
Design
Patients included, n
Mean age, years (range)
Prevalence of ICI, n
CT as inclusion? (yes/no)
Male, n
Patients with MHI, n
GCS, n
Other significant inclusion criteria
Other significant exclusion criteria
Bioc
hem
ical
mar
ker –
S10
0B o
nly
Bibe
rthal
er
et a
l. 20
0114
9
Deriv
atio
nGe
rman
yED
P, Cs
52NR
15/5
2 (2
8.8%
)No
38/5
2 (7
3%)
52/5
2 (1
00%
)NR
Isol
ated
MHI
(GCS
13–
15 o
n ad
mis
sion
) and
one
or m
ore
of a
mne
sia,
LOC
, nau
sea,
vo
miti
ng, v
ertig
o or
sev
ere
head
ache
Foca
l neu
rolo
gica
l de
ficits
Bibe
rthal
er
et a
l. 20
0214
3
Deriv
atio
nGe
rman
yED
P, NR
104
NR24
/104
(2
3.1%
)No
NR10
4/10
4 (1
00%
)NR
GCS
13–1
5, h
isto
ry o
f is
olat
ed m
inor
hea
d tra
uma,
an
d at
leas
t one
sym
ptom
: tra
nsie
nt L
OC (<
5 m
inut
es),
amne
sia
for t
he tr
aum
atic
ev
ent,
naus
ea, v
omiti
ng,
verti
go a
nd s
ever
e he
adac
he
Bibe
rthal
er
et a
l. 20
0698
Deriv
atio
nGe
rman
yTh
ree
traum
a ce
ntre
sP,
Cs13
0947
(IQR
32
–65)
93/1
309
(7.1
%)
No85
5/13
09
(65%
)13
09/1
309
(100
%)
GCS
15: 1
152/
1309
(8
8%)
GCS
14: 1
22/1
309
(9.3
%)
GCS
13: 3
5/13
09
(2.7
%)
Aged
≥ 1
8 ye
ars.
Isol
ated
he
ad tr
aum
a, a
dmitt
ed
with
in 3
hou
rs, G
CS 1
3–15
at
adm
issi
on, o
ne o
r mor
e of
: brie
f LOC
, PTA
, nau
sea,
vo
miti
ng, s
ever
e he
adac
he,
dizz
ines
s, v
ertig
o, in
toxic
atio
n,
antic
oagu
latio
n an
d ag
e >
60
year
s
Preg
nant
wom
en,
pris
oner
s an
d m
ultip
le-in
jure
d pa
tient
s
Inge
brig
tsen
et
al.
2000
145
Valid
atio
nSc
andi
navia
Neur
olog
yP,
NR18
233
(1
5–78
)10
/182
(5
.5%
)No
111
(61%
)18
2/18
2 (1
00%
)GC
S 15
: 138
/182
(7
5.8%
)
GCS
14: 3
4/18
2 (1
8.7%
)
GCS
13:1
0/18
2 (5
.5%
)
Aged
15–
80 y
ears
. He
ad in
jury
with
brie
f (≤
10
min
utes
) LOC
/am
nesi
a,
GCS
13–1
5 at
adm
issi
on, n
o fo
cal n
euro
logi
cal d
efici
ts,
patie
nt a
dmitt
ed w
ithin
12
hou
rs p
ost i
njur
y, C
T sc
an
with
in 2
4 ho
urs
post
inju
ry
Hist
ory
of
neur
olog
ical
di
seas
e
cont
inue
d

108 Assessment of diagnostic accuracy
Author, year
Derivation or validation cohort
Country
Setting
Design
Patients included, n
Mean age, years (range)
Prevalence of ICI, n
CT as inclusion? (yes/no)
Male, n
Patients with MHI, n
GCS, n
Other significant inclusion criteria
Other significant exclusion criteria
Mul
ler e
t al.
2007
113
Deriv
atio
n M
ulti-
natio
nal
(Nor
way
, UK
, Sw
itzer
land
, an
d Sw
eden
)
Neur
osur
gery
×
2, E
D ×
1,
orth
opae
dics
×
1
P, NR
226
39
(18–
92)
21/2
26
(9%
)No
168/
226
(74.
3%)
226/
226
(100
%)
GCS
15: 1
80/2
26
(78%
)
GCS
14: 3
0/22
6 (1
3%)
GCS
13: 1
6/22
6 (7
%)
Aged
≥18
yea
rs. H
ead
inju
ry,
LOC
or re
trogr
ade
amne
sia,
GC
S 13
–15,
bloo
d sa
mpl
e an
d CT
sca
n w
ithin
12
hour
s of
trau
ma
Neur
olog
ical
or
psy
chia
tric
diso
rder
, foc
al
neur
olog
ical
de
ficit,
mul
tiple
in
jurie
s re
quiri
ng
imm
edia
te
inte
rven
tion,
rena
l or
live
r dis
ease
Poli-
de-
Figu
eire
do
et a
l. 20
0614
7
Valid
atio
nBr
azil
EDP,
Cs50
NR6/
50
(12%
)No
28/5
0 (5
6%)
50/5
0 (1
00%
)GC
S 15
: 37/
50 (7
4%)
GCS
14: 1
1/50
(22%
)
GCS
13: 2
/50
(4%
)
GCS
13–1
5 an
d at
leas
t one
of
am
nesi
a, L
OC, n
ause
a,
vom
iting
, ver
tigo
or s
ever
e he
adac
he o
n ad
mis
sion
Patie
nts
with
fo
cal n
euro
logi
cal
defic
its
Rom
ner e
t al
. 200
0148
Valid
atio
nSc
andi
navia
Neur
olog
y P,
NR27
832
(1
–84)
25/2
78
(9%
)No
175/
278
(63%
)25
4/27
8 (9
1.4%
)NR
All a
ges.
Mild
, mod
erat
e an
d se
vere
pat
ient
s, w
ith:
1. h
ead
inju
ry w
ith L
OC/
amne
sia
2. b
lood
sam
ple
with
in
24 h
ours
of i
njur
y
3. C
T sc
an w
ithin
24
hour
s of
inju
ry
Hist
ory
of
neur
olog
ical
di
seas
e
TAB
LE 1
8 B
ioch
emic
al m
arke
rs fo
r M
HI:
stud
y de
sign
and
pat
ient
cha
ract
eris
tics
of in
clud
ed s
tudi
es (c
ontin
ued)

© Queen’s Printer and Controller of HMSO 2011. This work was produced by Pandor et al. under the terms of a commissioning contract issued by the Secretary of State for Health.
109 Health Technology Assessment 2011; Vol. 15: No. 27DOI: 10.3310/hta15270
Author, year
Derivation or validation cohort
Country
Setting
Design
Patients included, n
Mean age, years (range)
Prevalence of ICI, n
CT as inclusion? (yes/no)
Male, n
Patients with MHI, n
GCS, n
Other significant inclusion criteria
Other significant exclusion criteria
Mor
ocho
vic
et a
l. 20
0914
6
Valid
atio
nSl
ovak
iaED
P, Cs
102
42
(12–
84)
18/1
02
(17.
6%)
No71
(70%
)10
2/10
2
(100
%)
GCS
15: 7
6/10
2 (7
4.6%
)
GCS
14: 2
3/10
2 (2
2.5%
)
GCS
13: 3
/102
(2
.9%
)
Mild
TBI
cat
egor
y 1–
3 of
EF
NS c
lass
ifica
tion
(cat
egor
y 1:
GCS
15,
LOC
< 3
0 m
inut
es, P
TA <
1 h
our,
no
risk
fact
ors;
a cat
egor
y 2:
GC
S 15
and
risk
fact
ors;
a ca
tego
ry 3
: GCS
13–
14,
LOC
< 3
0 m
inut
es, P
TA <
1
hour
± ri
sk fa
ctor
s)a
Unkn
own
time
of in
jury
/acu
te
non-
traum
atic
in
trace
rebr
al
lesi
ons
Cate
gory
0
of E
FNS
clas
sific
atio
n
Cast
ella
ni e
t al
. 200
9144
Valid
atio
nAu
stria
Paed
iatri
cP,
Sel
109
9.5
(0.4
–17
.5)
14/1
09
(12.
8%)
Yes
73 (6
7%)
109/
109
(100
%)
GCS
15: 8
6/10
9 (7
8.9%
)
GCS
14: 1
3/10
9 (1
1.9%
)
GCS
13: 1
0/10
9 (9
.2%
)
Age
< 1
8 ye
ars,
blu
nt tr
aum
a,
mild
TBI
(GCS
13–
15 a
nd
vom
iting
, LOC
, if >
4 y
ears
–
pers
istin
g he
adac
he,
retro
grad
e am
nesi
a, v
ertig
o)
NR
Bioc
hem
ical
mar
ker –
NSE
onl
y
Frid
rikss
on
et a
l. 20
0013
0
Deriv
atio
nUS
APa
edia
tric
EDP,
NR49
NR
(0.2
–16)
22/4
9 (4
5%)
Yes
27/4
9 (5
5%)
39/4
9 (7
9.6%
)NR
Blun
t tra
uma
(with
in 2
4 ho
urs
of in
jury
) req
uirin
g he
ad C
TPe
netra
ting
traum
a, b
leed
ing
diso
rder
s, lo
nger
th
an 2
4 ho
urs
sinc
e in
jury
Bioc
hem
ical
mar
ker –
S10
0B a
nd N
SE o
nly
Mus
sack
et
al. 2
00211
5
Deriv
atio
nGe
rman
yED
P, Cs
139
36 (2
8–60
.1)
19/1
39
(13.
7%)
No10
6/13
9 (7
6.3%
)13
9/13
9 (1
00%
)GC
S 15
:
129/
139
(92.
8%),
GCS
13/1
4:
10/1
29 (7
.2%
)
Hist
ory
of tr
aum
a, G
CS 1
3–15
, at l
east
one
of f
ollo
win
g:
trans
ient
LOC
( <
5 m
inut
es),
ante
rogr
ade
or re
trogr
ade
amne
sia,
nau
sea,
vom
iting
or
ver
tigo
Thos
e w
ho
refu
sed
CT,
bloo
d-dr
awin
g or
suf
fere
d co
ncur
rent
in
jurie
s th
at
prec
lude
d CT
cont
inue
d

110 Assessment of diagnostic accuracy
Author, year
Derivation or validation cohort
Country
Setting
Design
Patients included, n
Mean age, years (range)
Prevalence of ICI, n
CT as inclusion? (yes/no)
Male, n
Patients with MHI, n
GCS, n
Other significant inclusion criteria
Other significant exclusion criteria
Bioc
hem
ical
mar
ker –
oth
er m
ultip
le m
arke
rs (C
K-BB
, nor
adre
nalin
e, a
dren
alin
e, d
opam
ine,
am
ylas
e an
d to
tal c
atec
hola
min
es)
Levit
t et a
l. 19
9515
0
Deriv
atio
nUS
AED
P, NR
107
NR9/
107
(8.4
%)
NoNR
NRNR
Evid
ence
of e
than
ol
into
xicat
ion
(odo
ur o
n br
eath
and
con
firm
ed w
ith
Alco
-sen
sor i
ntox
imet
er
read
ing,
ser
um le
vels
gav
e ex
act l
evel
s) a
nd a
ppar
ently
m
inor
hea
d tra
uma
(ext
erna
l ev
iden
ce s
uch
as la
cera
tion,
co
ntus
ion,
hae
mat
oma,
ab
rasi
on o
r his
tory
of i
njur
y by
witn
esse
s or
out
of
hosp
ital c
are
pers
onne
l)
NR
Cs, c
onse
cutiv
e; C
v, co
nven
ienc
e; E
FNS,
Eur
opea
n Fe
dera
tion
of N
euro
logi
cal S
ocie
ties;
P, p
rosp
ectiv
e; S
el, s
elec
tive;
NR,
not
repo
rted;
PTA
, pos
t-tra
umat
ic a
mne
sia.
a Ri
sk fa
ctor
s fo
r EFN
S cl
assi
ficat
ion
syst
em –
unc
lear
or a
mbi
guou
s ac
cide
nt h
isto
ry, c
ontin
ued
PTA,
retro
grad
e am
nesi
a lo
nger
than
30
min
utes
, tra
uma
abov
e th
e cl
avic
les,
sev
ere
head
ache
, vom
iting
, foc
al
neur
olog
ical
defi
cit,
seizu
re, c
oagu
latio
n di
sord
er, h
igh-
ener
gy a
ccid
ent,
into
xicat
ion
with
alc
ohol
/dru
gs.
TAB
LE 1
8 B
ioch
emic
al m
arke
rs fo
r M
HI:
stud
y de
sign
and
pat
ient
cha
ract
eris
tics
of in
clud
ed s
tudi
es (c
ontin
ued)

© Queen’s Printer and Controller of HMSO 2011. This work was produced by Pandor et al. under the terms of a commissioning contract issued by the Secretary of State for Health.
111 Health Technology Assessment 2011; Vol. 15: No. 27DOI: 10.3310/hta15270
technique. CT-positive and CT-negative group results were compared using the Student’s t-test and a subsequent ROC curve was generated.
In the only study identified investigating other biochemical markers,150 patients were recruited consecutively if they presented following a MHI (evidence of external head trauma or witnessed injury) and demonstrated evidence of alcohol intoxication (clinically or upon investigation). Serum samples were taken upon recruitment and prior to CT scan with a mean time from injury to evaluation of 1.5 ± 0.2 hours. All subjects received a CT scan, which was assessed for any acute ICI. Multiple biomarkers were tested for in each sample and results were analysed independently of CT findings. ROC curves were generated for each biomarker, with a statistically significant difference in CT-positive and CT-negative groups (unpaired t-test) and, from these, different values were calculated to optimise both sensitivity and specificity and then to achieve a sensitivity of 100%.
Quality of included studiesThe quality assessment of each included study is summarised in Figures 19 and 20. Although the patient selection criteria were consistent and clearly described across all studies, no study met all of the QUADAS criteria, as nearly all patients were chosen selectively by being symptomatic at presentation. Although an argument could be made for the fact that these biochemical markers should be used in conjunction with clinical assessment, from a quality-control perspective testing should take place in an undifferentiated sample of subjects for whom the condition has been universally applied, in this case any patient having suffered a MHI.
All patients received both the index test and reference standard, with the results being interpreted independently. Castellani et al.144 selectively included those patients undergoing CT from a larger cohort of potential subjects, contributing to patient spectrum bias. Differential verification bias was generally avoided for ICI, with no studies focusing on neurosurgical injury. Test execution was inconsistently described across all studies, particularly the details of CT scan method, although sampling and biomarker analysis were well described and repeatable from such descriptions. Positive CT scans were considered as any visible acute ICI and no definition of clinical significance or neurosurgical injury was attempted. Clinical data were available as for normal practice, but in all studies it was unclear whether there were any uninterpretable results or subject withdrawal.
Summary of test accuracy results: biochemical markersProtein S100BTables 19 and 20 show a summary of the test characteristics and raw data with calculated sensitivities, specificities and (negative and positive) likelihood ratios for each study of adults with ICI. Pooling all the raw data for meta-analysis, using dichotomised S100B results (not accounting for delay until sampling, method of biochemical analysis or cut-off value) gives an estimated sensitivity of 96.8% (95% HDR 93.8% to 98.6%) and specificity of 42.5% (95% HDR 31.0% to 54.2%). Bayesian analysis of these data gives a NLR of 0.076 (95% HDR 0.031 to 0.156) and PLR of 1.68 (95% HDR 1.40 to 2.11).
The single study identified investigating this biomarker in the paediatric population found 14 out of 109 patients with ICI and a further 22 patients with isolated skull fracture on CT. All 36 patients had elevated S100B concentrations, resulting in a sensitivity of 100% (95% CI 92% to 100%) and a negative predictive value of 100% (95% CI 90% to 100%). Only 31 subjects had a negative sample giving the 42 remaining a false-positive result. This gives a specificity of 42% (95% CI 38% to 43%). These data have not been included in the likelihood ratio calculations.

112 Assessment of diagnostic accuracy
Yes (high quality)UnclearNo (low quality)
Appropriate spectrum composition?
Selection criteria clearly described?
Reference standard adequate?
Partial verification bias avoided?
Differential verification bias avoided?
Test execution details reported?
Reference standard execution details reported?
Test review bias avoided?
Diagnostic review bias avoided?
Clinical review bias avoided?
Uninterpretable results reported?
Withdrawals accounted for?
0% 25% 50% 100%75%
FIGURE 19 Biochemical markers for MHI – methodological quality graph. Review authors’ judgements about each methodological quality item presented as percentages across all included studies.
– ++
+ +
+ +–
+ + + + + ?
?
?+
+
+
+
++
+++
+
+
? + +
+
+ + ?
+
– +
?
?+
+
–
+
+
+?
? ? +
? + +
–
+
+
+
+++
+
++
+
+
+ + +
++
+
+
+
+ +
+
–
?++
?+++
++
++
+
+ + +
+
?
+
+ +
+ ?
+
+
+ + ++?
–
? + +
+–
+
–
+ ++
? + +
++–
? + + + + – ?
?
?
?
?
?
?
–
?
?
?
?
?
++
+
Ap
pro
pria
te s
pec
trum
com
pos
ition
?
Sel
ectio
n cr
iteria
cle
arly
des
crib
ed?
Ref
eren
ce s
tand
ard
ad
equa
te?
Par
tial v
erifi
catio
n b
ias
avoi
ded
?
Diff
eren
tial v
erifi
catio
n b
ias
avoi
ded
?
Test
exe
cutio
n d
etai
ls r
epor
ted
?
Ref
eren
ce s
tand
ard
exe
cutio
n d
etai
ls r
epor
ted
?
Test
rev
iew
bia
s av
oid
ed?
Dia
gnos
tic r
evie
w b
ias
avoi
ded
?
Clin
ical
rev
iew
bia
s av
oid
ed?
Uni
nter
pre
tab
le r
esul
ts r
epor
ted
?
With
dra
wal
s ac
coun
ted
for?
Biberthaler 2001149
Biberthaler 2002143
Biberthaler et al. 200698
Castellani 2009144
Fridriksson 2000130
Ingebritsen 2000145
Levitt 1995150
Morochovic 2009146
Muller et al. 2007113
Mussack et al. 2002115
Poli-de-Figueiredo 2006147
Romner 2000148
FIGURE 20 Biochemical markers for MHI – methodological quality summary. Review authors’ judgements about each methodological quality item for each included study. Minus sign, negative score; plus sign, positive score; question mark, unclear whether item scores negatively or positively; blank space, not applicable.

© Queen’s Printer and Controller of HMSO 2011. This work was produced by Pandor et al. under the terms of a commissioning contract issued by the Secretary of State for Health.
113 Health Technology Assessment 2011; Vol. 15: No. 27DOI: 10.3310/hta15270
TAB
LE 1
9 B
ioch
emic
al m
arke
rs fo
r M
HI –
cha
ract
eris
tics
of th
e in
dex
test
s us
ed in
incl
uded
stu
dies
Auth
or, y
ear
Sam
ple
How
obt
aine
dCu
t-of
f val
ueTi
me
to
sam
ple
Anal
yser
Posi
tive
CT
(%)
TPFP
FNTN
Sens
itivi
ty (%
)Sp
ecifi
city
(%)
Adul
ts
Poli-
de-
Figu
eire
do e
t al.
2006
147
S100
B se
rum
Veno
us b
lood
sam
ple
draw
n on
ad
mis
sion
(ave
rage
82
min
utes
po
st tr
aum
a) a
nd p
roce
ssed
to
seru
m, d
eep
froze
n an
d an
alys
ed
in G
erm
any
usin
g he
tero
gene
ous
imm
unoa
ssay
[Ele
csys
201
0(R)
]
> 0
.10
µg/l
82 m
inut
esEl
ecsy
s6/
50
(12%
)6
350
910
020
.5
Bibe
rthal
er e
t al.
2006
98
S100
B se
rum
Veno
us b
lood
sam
ples
pro
cess
ed
to s
erum
and
dee
p fro
zen,
ass
ay
with
ele
ctro
chem
ilum
ines
cenc
e im
mun
oass
ay k
it (E
lecs
ys S
100)
> 0
.10
µg/l
60 m
inut
esEl
ecsy
s93
/130
9 (7
.1%
)92
855
136
198
.929
.7
Mor
ocho
vic e
t al.
2009
146
S100
B se
rum
Perip
hera
l ven
ous
sam
ples
take
n <
6 h
ours
and
sen
t to
lab.
Pro
cess
ed
on e
lect
roch
emilu
min
omet
ric
imm
unoa
ssay
by
Roch
e El
ecsy
s S1
00
> 0
.10
µg/l
< 6
hou
rsEl
ecsy
s 18
/102
(1
7.6%
)15
593
2583
.329
.8
Mul
ler e
t al.
2007
113
S100
B se
rum
Bloo
d sa
mpl
e ta
ken
with
in
12 h
ours
of i
njur
y. A
nalys
ed u
sing
fu
lly a
utom
ated
Lia
ison
sys
tem
. An
alyt
ical
sen
sitiv
ity is
0.0
13 µg
/l.
Resu
lts in
fina
l ana
lysis
not
adj
uste
d fo
r hal
f-lif
e of
S10
0B
≥ 0
.10
µg/l
< 3
hou
rsLi
aiso
n21
/226
(9
%)
2014
11
6495
.231
.2
Bibe
rthal
er e
t al.
2002
143
S100
B se
rum
Bloo
d dr
awn,
pro
cess
ed to
ser
um
and
citra
ted
plas
ma
and
stor
ed a
t –8
ºC fo
r lat
er a
nalys
is. L
IA-m
at o
r Li
aiso
n as
say
proc
edur
es
> 0
.12
ng/m
l<
2 h
ours
Liai
son
24/1
04
(23.
1%)
2443
037
100
46.3
S100
B pl
asm
aBl
ood
draw
n, p
roce
ssed
to s
erum
an
d ci
trate
d pl
asm
a re
spec
tivel
y an
d st
ored
at –
8ºC
for l
ater
an
alys
is. L
IA-m
at o
r Lia
ison
ass
ay
proc
edur
es.
> 0
.18
ng/m
l<
2 h
ours
Liai
son
24/1
04
(23.
1%)
2443
037
100
46.3
cont
inue
d

114 Assessment of diagnostic accuracy
Auth
or, y
ear
Sam
ple
How
obt
aine
dCu
t-of
f val
ueTi
me
to
sam
ple
Anal
yser
Posi
tive
CT
(%)
TPFP
FNTN
Sens
itivi
ty (%
)Sp
ecifi
city
(%)
Mus
sack
et a
l. 20
0211
5
S100
B pl
asm
aBl
ood
draw
n im
med
iate
ly af
ter
adm
issi
on p
lus
cons
ent.
Proc
esse
d to
ser
um. C
itrat
ed. F
ully
auto
mat
ed
imm
unol
umin
omet
ric a
ssay
(Lia
ison
Sa
ngte
c100
), lo
wer
det
ectio
n lim
it 0.
02 ng
/ml
> 0
.21
ng/m
l<
40
min
utes
Liai
son
19/1
39
(13.
7%)
1960
060
100
50.0
Bibe
rthal
er e
t al.
2001
149
S100
B se
rum
Bloo
d ta
ken
on a
dmis
sion
an
d pr
oces
sed
to s
erum
. Im
mun
olum
inom
etric
ass
ay (L
IA-m
at
Sang
tec)
> 0
.12
ng/m
l 75
min
utes
Liam
at15
/52
(28.
8%)
1522
015
100
40.5
Rom
ner e
t al.
2000
148
S-10
0B
seru
mSe
rum
sam
ple
draw
n im
med
iate
ly af
ter a
dmis
sion
to E
D, a
nalys
ed w
ith
imm
unor
adio
met
ric a
ssay
kit
> 0
.2 µg
/l<
24
hour
sSa
ngte
c25
/278
(9
%)
2385
216
892
66.4
Inge
brig
tsen
et
al. 2
00014
5
S-10
0B
seru
mSe
rum
sam
ple
draw
n im
med
iate
ly af
ter a
dmis
sion
to E
D,
imm
unor
adio
met
ric a
ssay
kit
[San
gtec
100
(R)].
> 0
.2 µg
/l<
12
hour
sSa
ngte
c10
/182
(5
.5%
)9
601
112
9065
.1
Child
ren
Cast
ella
ni e
t al.
2009
144
S100
B se
rum
Seru
m s
ampl
e w
ithin
6 h
ours
of
traum
a Ro
che
Mod
ular
ana
lytic
s>
0.1
6 µg
/l<
6 h
ours
Elec
sys
36/1
09
(30.
3%)
3642
031
100
42.5
TAB
LE 1
9 B
ioch
emic
al m
arke
rs fo
r M
HI –
cha
ract
eris
tics
of th
e in
dex
test
s us
ed in
incl
uded
stu
dies
(con
tinue
d)

© Queen’s Printer and Controller of HMSO 2011. This work was produced by Pandor et al. under the terms of a commissioning contract issued by the Secretary of State for Health.
115 Health Technology Assessment 2011; Vol. 15: No. 27DOI: 10.3310/hta15270
Neuron-specific enolaseTwo studies115,130 (not meta-analysable) investigated the role of NSE in triage for CT in different age groups. Mussack et al.115 analysed samples in 139 adults alongside their study on S100B, identified a cut-off value (using ROC curve data) of 12.28 ng/ml, giving a sensitivity of 100%, but a specificity of only 6.9%. The area under the curve (AUC) was 0.589, demonstrating an almost complete lack of differentiation. Fridriksson et al.130 studied 49 children aged 0–18 years, selecting patients by the need for CT scan following blunt head trauma (severity not defined). Using a different radioimmunoassay technique, they identified a cut-off value of 15.3 ng/ml from their ROC curve analysis. This resulted in a sensitivity of 77% with a specificity of 52%. These two
TABLE 20a Biochemical markers for MHI – meta-analysis of S100B biomarkers for ICI in adults
StudyNo. of patients
Observed estimates Posterior median estimatesa
Sensitivityb Specificityb Sensitivity95% HDR Specificity
95% HDR NLR
95% HDR PLR
95% HDR
Ingebrigtsen et al. 2000145
182 90.0 65.1 97.0 89.8 to 99.0
63.7 56.4 to 70.7
0.048 0.015 to 0.158
2.65 2.20 to 3.29
Romner et al. 2000148
278 92.0 66.4 97.0 89.4 to 99.1
65.3 59.4 to 71.1
0.047 0.014 to 0.162
2.78 2.35 to 3.33
Biberthaler et al. 2001149
52 100.0 40.5 96.8 93.8 to 98.7
40.9 27.6 to 55.3
0.078 0.031 to 0.170
1.64 1.33 to 2.17
Biberthaler et al. 2002143
104 100.0 46.3 96.9 93.8 to 98.7
45.8 35.6 to 56.1
0.070 0.028 to 0.141
1.78 1.50 to 2.21
Mussack et al. 2002115
139 100.0 50.0 96.9 93.4 to 98.7
49.3 40.7 to 58.0
0.065 0.026 to 0.135
1.90 1.63 to 2.31
Biberthaler et al. 200698
1309 98.9 29.7 96.7 93.4 to 98.8
29.8 27.3 to 32.4
0.110 0.040 to 0.222
1.38 1.31 to 1.44
Poli-de-Figueiredo et al. 2006147
50 100.0 20.5 96.7 92.2 to 99.1
25.0 14.3 to 37.7
0.129 0.039 to 0.405
1.29 1.11 to 1.56
Muller et al. 2007113 226 95.2 31.2 96.7 93.5 to 98.7
31.8 25.8 to 38.3
0.102 0.040 to 0.215
1.42 1.29 to 1.57
Morochovic et al. 2009146
102 83.3 29.8 96.7 93.5 to 98.6
33.9 24.8 to 44.0
0.098 0.040 to 0.219
1.46 1.27 to 1.73
a Posterior median estimates of posterior distribution for Bayesian meta-analyses.b Sensitivity and specificity estimates calculated from the observed data.
TABLE 20b Biochemical markers for MHI – meta-analysis of S100B biomarkers for ICI in adults
No. of studies
Heterogeneity test p-valuec Pooled estimates
Sensitivity Specificity Sensitivity95% HDR Specificity
95% HDR NLR
95% HDR PLR
95% HDR
9 0.334 < 0.001 96.8 93.8 to 98.6
42.5 31.0 to 54.2
0.076 0.031 to 0.156
1.68 1.40 to 2.11
a The p-value based on Q-statistic.

116 Assessment of diagnostic accuracy
studies have not been validated elsewhere, but suggest that NSE is a poor marker for predicting ICI, or the lack of, on cranial CT.
Other markersIn 1995 Levitt et al.150 studied 107 intoxicated patients following MHI, all of whom received a CT scan and had a sample of blood taken within 3 hours. Of the potential biochemical markers under investigation (CK-BB, noradrenaline, adrenaline, dopamine, amylase and total catecholamines) only adrenaline and dopamine were associated with positive CT findings. From these data, the authors generated ROC curves calculating a cut-off value of 116 pg/ml for adrenaline and 104 pg/ml for dopamine that gave a sensitivity for ICI of 100% (95% CI 66% to 100%) with an acceptable specificity of 57% (95% CI 47% to 67%) and 58% (95% CI 48% to 68%), respectively. These findings do not appear to have been validated elsewhere in the literature.
© Queen’s Printer and Controller of HMSO 2011. This work was produced by Pandor et al. under the terms of a commissioning contract issued by the Secretary of State for Health.
117 Health Technology Assessment 2011; Vol. 15: No. 27DOI: 10.3310/hta15270
Chapter 4
Review of studies evaluating diagnostic management strategies
A systematic review of the literature was undertaken to identify studies that evaluated alternative diagnostic management strategies for MHI. We sought studies that compared
the effect upon processes or outcomes for patients with MHI of two or more alternative strategies. The systematic review was undertaken in accordance with the standard guidelines published by the Cochrane Effective Practice and Organisation of Care (EPOC) Review Group (www.epoc.uottawa.ca).
Methods for reviewing management practices
Identification of studiesElectronic databasesStudies were identified by searching the following electronic databases:
■ MEDLINE (via OvidSP) 1950 to March 2010 ■ MEDLINE In-Process & Other Non-Indexed Citations (via OvidSP) 1950 to March 2010 ■ CINAHL (via EBSCO) 1981 to April 2009 ■ EMBASE (via OvidSP) 1980 to April 2009 ■ WoS (includes SCI and CPCI) (via WOK) 1899 to April 2009 ■ CENTRAL (via Cochrane Library Issue 2, 2009) ■ CDSR (via Cochrane Library Issue 2, 2009) ■ NHS DARE (via Cochrane Library Issue 2, 2009) ■ HTA Database (via Cochrane Library Issue 2, 2009) ■ ReFeR ■ NIHR databases ■ INAHTA ■ TRIP database.
Sensitive keyword strategies using free text and, where available, thesaurus terms using Boolean operators and database-specific syntax were developed to search the electronic databases. Synonyms relating to the condition (e.g. head injury) were combined with a search filter aimed at restricting results to prognostic studies (used in the searches of MEDLINE, CINAHL and EMBASE). Date limits or language restrictions were not used on any database. All resources were searched from inception to April 2009. Updated searches to March 2010 were conducted on the MEDLINE databases only. An example of the MEDLINE search strategy is provided in Appendix 1.
Other resourcesTo identify additional published, unpublished and ongoing studies, the reference lists of all relevant studies (including existing systematic reviews) were checked and a citation search of relevant articles (using the WOK’s SCI and SSCI) was undertaken to identify articles that cite the relevant articles. In addition, systematic keyword searches of the WWW were undertaken

118 Review of studies evaluating diagnostic management strategies
using the Copernic Agent Basic (version 6.12) meta-search engine and key experts in the field were contacted.
All identified citations from the electronic searches and other resources were imported into, and managed using, the Reference Manager (version 12.0) bibliographic software.
Inclusion and exclusion criteriaThe inclusion of potentially relevant articles was undertaken using the method described in Chapter 3 (see Inclusion and exclusion criteria). However, the relevance of each article was assessed according to the following criteria.
Study designRandomised controlled trials, controlled clinical trials (CCTs) and controlled before/after (CBA) studies (with a minimum of 20 patients) were included. We did not include uncontrolled before/after studies or cohort studies, but recorded when such studies were identified. Studies that compared alternative strategies in the same group of patients (i.e. by applying a new rule to existing data) and studies that compared strategies in theoretical cohorts were excluded.
Reviews of primary studies were not included in the analysis, but were retained for discussion and identification of additional studies. The following publication types were excluded from the review: animal studies, narrative reviews, editorials, opinions and non-English-language papers.
PopulationAll studies of adults and children (of any age) with MHI (defined as blunt head injury with a GCS of 13–15 at presentation) were included. Studies of patients with moderate or severe head injury (defined by a GCS ≤ 12 at presentation) or no history of injury were excluded. Studies that recruited patients with a broad range of head injury severity were included only if > 50% of the patients had MHI.
InterventionAny diagnostic management or organisational change strategy for MHI was included.
ComparatorAny alternative comparators were included.
OutcomesThe main outcomes of interest were:
■ hospital admissions ■ length of stay ■ time to neurosurgery ■ patient outcomes [e.g. quality of life (QoL), headaches].
Data abstraction strategyData abstraction was performed by one reviewer (APa) into a standardised data extraction form and independently checked for accuracy by a second (SG). Discrepancies were resolved by discussion. Where multiple publications of the same study were identified, data were extracted and reported as a single study. The authors of the relevant studies were contacted to provide further details in cases where information was missing from the articles.
The following information was extracted for all studies when reported:

© Queen’s Printer and Controller of HMSO 2011. This work was produced by Pandor et al. under the terms of a commissioning contract issued by the Secretary of State for Health.
119 Health Technology Assessment 2011; Vol. 15: No. 27DOI: 10.3310/hta15270
■ study design (RCT, CCT, CBA) ■ description of intervention ■ description of control ■ types of study participants (age, gender, patients included, hospitals included) ■ study setting (country) ■ methods (unit of allocation, unit of analysis, study power) ■ main outcome measures (process measures, patient outcomes and length of time during
which outcomes were measured after initiation of intervention) ■ results for the main outcome measures.
Quality assessment strategyThe methodological quality of each included study was assessed by one reviewer (APa) and checked by another (SG) using the quality criteria recommended by EPOC.151 Disagreements between assessors were discussed and resolved by consensus. In the case of no consensus agreement, a third reviewer (APi) was consulted.
The quality assessment criteria (as described in the EPOC data collection checklist) to assess RCTs or CCTs were: concealment of allocation, follow-up of professionals, follow-up of patients or episodes of care, blinded assessment of primary outcome(s), baseline measurement, reliable primary outcomes measure(s) and protection against contamination. The criteria to assess CBA studies were: baseline measurement, characteristics of studies using second site as control, blinded assessment of primary outcome(s), protection against contamination, reliable primary outcomes measure(s), follow-up of professionals and follow-up of patients.
Study quality was assessed, with each item scored as ‘done’, ‘not done’ or ‘not clear’. A study was judged as having a low risk of bias if all criteria were rated as done or not applicable; a moderate risk of bias was assigned if one or two criteria were not done, partially done or not clear; and a high risk of bias was assigned if three or more criteria were not done, partially done or not clear.
Methods of data synthesisThe extracted data and quality assessment variables were presented for each study, both in structured tables and as narrative description. No meta-analysis was planned owing to the anticipated limited number of studies of sufficient quality and homogeneity.
Results of the review of management practices
Studies included in the reviewThe literature searches identified 8003 citations. Of the titles and abstracts screened, 12 relevant full papers were retrieved and assessed in detail.21,22,37,136,152–159 One RCT37 comparing immediate CT during triage with observation in hospital for patients with MHI fulfilled the inclusion criteria. A flow chart describing the process of identifying relevant literature can be found in Appendix 7. Studies excluded from the review are listed in Appendix 8.
Description of included studiesThe included study37 was a large, randomised, multicentre, pragmatic, non-inferiority, controlled trial. A summary of the design and patient characteristics is presented in Table 21.
The RCT recruited 2602 patients between May 2001 and January 2004 at 36 acute hospitals in Sweden. The trial included patients aged ≥ 6 years with MHI (within 24 hours) who attended EDs. Patients were randomly assigned to immediate CT or observation in hospital.
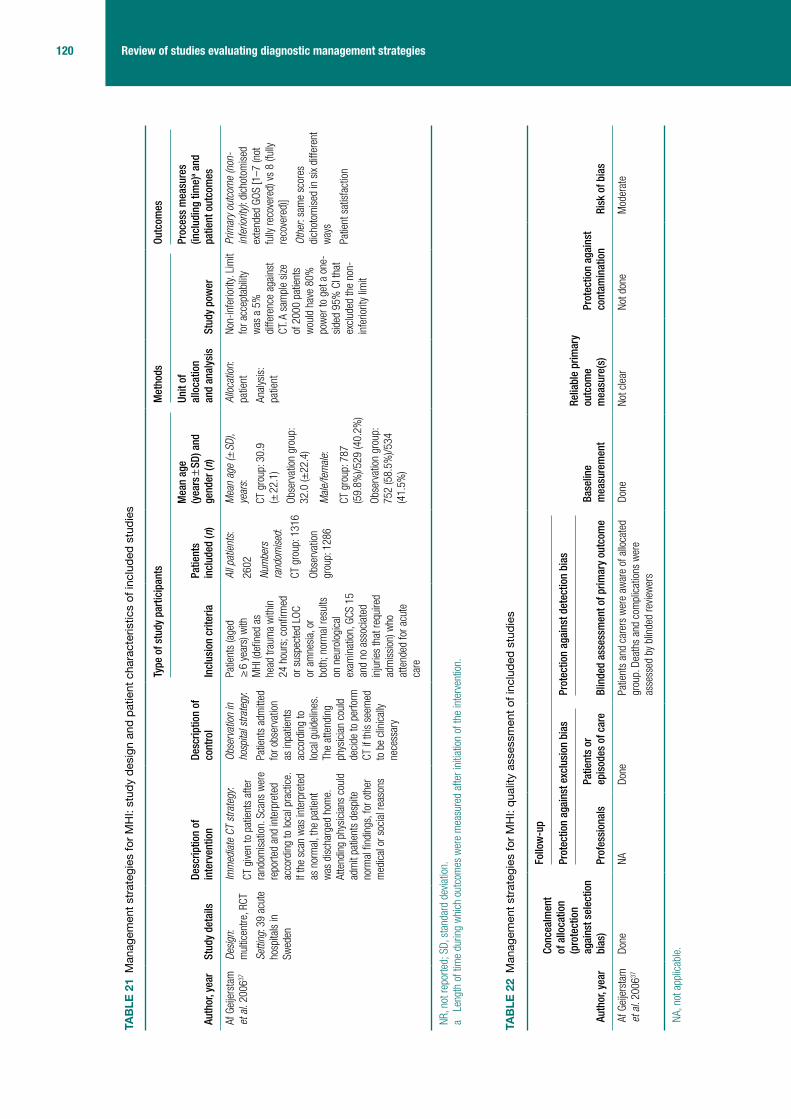
120 Review of studies evaluating diagnostic management strategies
TAB
LE 2
1 M
anag
emen
t str
ateg
ies
for
MH
I: st
udy
desi
gn a
nd p
atie
nt c
hara
cter
istic
s of
incl
uded
stu
dies
Auth
or, y
ear
Stud
y de
tails
Desc
riptio
n of
in
terv
entio
nDe
scrip
tion
of
cont
rol
Type
of s
tudy
par
ticip
ants
Met
hods
Outc
omes
Incl
usio
n cr
iteria
Patie
nts
incl
uded
(n)
Mea
n ag
e (y
ears
± S
D) a
nd
gend
er (n
)
Unit
of
allo
catio
n an
d an
alys
isSt
udy
pow
er
Proc
ess
mea
sure
s (in
clud
ing
time)
a and
pa
tient
out
com
es
Af G
eije
rsta
m
et a
l. 20
0637
Desi
gn:
mul
ticen
tre, R
CT
Setti
ng: 3
9 ac
ute
hosp
itals
in
Swed
en
Imm
edia
te C
T st
rate
gy:
CT g
iven
to p
atie
nts
afte
r ra
ndom
isat
ion.
Sca
ns w
ere
repo
rted
and
inte
rpre
ted
acco
rdin
g to
loca
l pra
ctic
e.
If th
e sc
an w
as in
terp
rete
d as
nor
mal
, the
pat
ient
w
as d
isch
arge
d ho
me.
At
tend
ing
phys
icia
ns c
ould
ad
mit
patie
nts
desp
ite
norm
al fi
ndin
gs, f
or o
ther
m
edic
al o
r soc
ial r
easo
ns
Obse
rvat
ion
in
hosp
ital s
trate
gy:
Patie
nts
adm
itted
fo
r obs
erva
tion
as in
patie
nts
acco
rdin
g to
lo
cal g
uide
lines
. Th
e at
tend
ing
phys
icia
n co
uld
deci
de to
per
form
CT
if th
is s
eem
ed
to b
e cl
inic
ally
nece
ssar
y
Patie
nts
(age
d ≥
6 y
ears
) with
M
HI (d
efine
d as
he
ad tr
aum
a w
ithin
24
hou
rs; c
onfir
med
or
sus
pect
ed L
OC
or a
mne
sia,
or
both
; nor
mal
resu
lts
on n
euro
logi
cal
exam
inat
ion,
GCS
15
and
no a
ssoc
iate
d in
jurie
s th
at re
quire
d ad
mis
sion
) who
at
tend
ed fo
r acu
te
care
All p
atie
nts:
2602
Num
bers
ra
ndom
ised
:
CT g
roup
: 131
6
Obse
rvat
ion
grou
p: 1
286
Mea
n ag
e (±
SD)
, ye
ars:
CT g
roup
: 30.
9 (±
22.
1)
Obse
rvat
ion
grou
p:
32.0
(±22
.4)
Mal
e/fe
mal
e:
CT g
roup
: 787
(5
9.8%
)/529
(40.
2%)
Obse
rvat
ion
grou
p:
752
(58.
5%)/5
34
(41.
5%)
Allo
catio
n:
patie
nt
Anal
ysis
: pa
tient
Non-
infe
riorit
y. L
imit
for a
ccep
tabi
lity
was
a 5
%
diffe
renc
e ag
ains
t CT
. A s
ampl
e si
ze
of 2
000
patie
nts
wou
ld h
ave
80%
po
wer
to g
et a
one
-si
ded
95%
CI t
hat
excl
uded
the
non-
infe
riorit
y lim
it
Prim
ary
outc
ome
(non
-in
ferio
rity)
: dic
hoto
mis
ed
exte
nded
GOS
[1–7
(not
fu
lly re
cove
red)
vs
8 (fu
lly
reco
vere
d)]
Othe
r: sa
me
scor
es
dich
otom
ised
in s
ix di
ffere
nt
way
s
Patie
nt s
atis
fact
ion
NR, n
ot re
porte
d; S
D, s
tand
ard
devia
tion.
a Le
ngth
of t
ime
durin
g w
hich
out
com
es w
ere
mea
sure
d af
ter i
nitia
tion
of th
e in
terv
entio
n.
TAB
LE 2
2 M
anag
emen
t str
ateg
ies
for
MH
I: qu
ality
ass
essm
ent o
f inc
lude
d st
udie
s
Auth
or, y
ear
Conc
ealm
ent
of a
lloca
tion
(pro
tect
ion
agai
nst s
elec
tion
bias
)
Follo
w-u
p
Base
line
mea
sure
men
t
Relia
ble
prim
ary
outc
ome
mea
sure
(s)
Prot
ectio
n ag
ains
t co
ntam
inat
ion
Risk
of b
ias
Prot
ectio
n ag
ains
t exc
lusi
on b
ias
Prot
ectio
n ag
ains
t det
ectio
n bi
as
Prof
essi
onal
s Pa
tient
s or
ep
isod
es o
f car
e Bl
inde
d as
sess
men
t of p
rimar
y ou
tcom
e
Af G
eije
rsta
m
et a
l. 20
0637
Done
NADo
nePa
tient
s an
d ca
rers
wer
e aw
are
of a
lloca
ted
grou
p. D
eath
s an
d co
mpl
icat
ions
wer
e as
sess
ed b
y bl
inde
d re
view
ers
Done
Not c
lear
Not d
one
Mod
erat
e
NA, n
ot a
pplic
able
.

© Queen’s Printer and Controller of HMSO 2011. This work was produced by Pandor et al. under the terms of a commissioning contract issued by the Secretary of State for Health.
121 Health Technology Assessment 2011; Vol. 15: No. 27DOI: 10.3310/hta15270
The study was designed to demonstrate that a management strategy based on CT and early discharge leads to similar clinical outcomes compared with observation in hospital. The primary end point was an outcome according to a dichotomised GOS-E, 3 months after the injury [8 (fully recovered) vs 1–7 (not fully recovered)]. Secondary end points were the same scores dichotomised in six other possible ways.37
Quality of included studiesThe included RCT37 was considered to be at moderate risk of bias (Table 22). Patients and carers were inevitably not blinded so subjective outcomes may have been influenced by awareness of treatment group. Individual patient randomisation in a trial of different methods of service delivery raises the possibility of bias owing to contamination of the intervention or control group. However, crossover rates were low, with only 8.9% (117/1316) of the CT group being admitted for observation and 8.6% (111/1286) of the observation group receiving CT.
Summary of management practice resultsThe main findings from this trial37 were that at 3 months 21.4% (275/1283) of patients in the CT group had not recovered completely compared with 24.2% (300/1240) admitted for observation. The difference was found to be not significant in favour of CT (95% CI –6.1% to 0.6%). The worst outcomes (mortality and severe loss of function) were similar between the groups. None of the patients with normal findings on immediate CT had complications later. The authors37 concluded that the use of CT in the management of patients with MHI is feasible and leads to similar outcomes compared with observation in hospital. An associated cost analysis36 reports a mean cost per patient of €461 (£314, US$582) in the CT group and €677 (£462, $854) in the observation group (difference €216, 95% CI –€272 to –€164; p < 0.001), leading the authors to conclude that CT is more cost-effective than hospital admission for MHI.
The single trial identified in this review provides good evidence that early CT and discharge of patients with MHI is at least as effective as hospital admission and costs less. The main limitation is that a trial can only feasibly compare a limited number of alternatives – in this case two. It is possible that other strategies, such as those using clinical decision rules to select patients for CT or hospital admission, could achieve comparable outcomes at similar cost.
Additional evidenceEleven studies were identified (two contemporaneous cohort studies152,153 and nine uncontrolled before/after studies)21,22,136,154–159 that did not fulfil the inclusion criteria of the systematic review, but are reported here as additional evidence (i.e. data presented as structured tables with a narrative description, but without a formal quality assessment). The two contemporaneous cohort studies152,153 compared alternative hospital admission policies, whereas nine uncontrolled before/after studies21,22,136,154–159 evaluated the effect of introducing guidelines for head injury management. A summary of the study and patient characteristics is presented in Table 23.
Cohort studiesTwo prospective cohort studies152,153 determined the effect of a change in admission policy in the management of MHIs. Fabbri et al.153 evaluated early home monitoring (up to 12 hours in hospital observation and early home monitoring) with in-hospital observation (24–48 hours in hospital observation followed by home monitoring). The results showed that in the in-hospital arm 1.4% (of these 0.5% after discharge) developed intracranial injuries compared with 0.7% in the early home monitoring group. No patients with previously undiagnosed intracranial injuries had a neurosurgical intervention. After 6 months, five patients (0.8%) died in the home monitoring group compared with eight patients (1.0%) in the hospital arm. No permanent disability or vegetative state was observed. The authors concluded that early home monitoring may be safely proposed to select high-risk individuals with an early negative CT, normal clinical

122 Review of studies evaluating diagnostic management strategies
TAB
LE 2
3 M
anag
emen
t str
ateg
ies
for
MH
I – s
tudy
des
ign
and
patie
nt c
hara
cter
istic
s of
oth
er s
tudi
es
Auth
or, y
ear
Stud
y de
tails
Desc
riptio
n of
in
terv
entio
nsDa
ta c
olle
ctio
n pe
riod
Type
of s
tudy
par
ticip
ants
Met
hods
Outc
omes
Incl
usio
n cr
iteria
Patie
nts
incl
uded
(n)
Mea
n ag
e (y
ears
± S
D)
and
gend
er (n
)Un
it of
allo
catio
n an
d an
alys
isSt
udy
pow
er
Proc
ess
mea
sure
s (in
clud
ing
time)
a and
/or
patie
nt o
utco
mes
Coho
rt s
tudi
es (p
rosp
ectiv
e or
retr
ospe
ctiv
e)
Brow
n et
al.
1994
152
Desi
gn:
pros
pect
ive c
ohor
t st
udy
Setti
ng: E
D of
two
teac
hing
hos
pita
ls
in S
cotla
nd, U
K
Cont
rol g
roup
(E
dinb
urgh
): no
acc
ess
to s
hort-
stay
war
d
Stud
y gr
oup
(Gla
sgow
): ac
cess
to s
hort-
stay
ob
serv
atio
n w
ard
Cont
rol g
roup
: 16
Nove
mbe
r 199
2 to
13
Dece
mbe
r 19
92
Stud
y gr
oup:
16
Nove
mbe
r 199
2 to
13
Dece
mbe
r 19
92
Patie
nts
(age
d >
13
year
s at
tim
e of
pr
esen
tatio
n) w
ith
MHI
All p
atie
nts:
48
3
Cont
rol g
roup
: 20
6
Stud
y gr
oup:
27
7
Mea
n ag
e:
NR Mal
e/fe
mal
e:
Befo
re g
roup
: NR
Afte
r gro
up: N
R
Allo
catio
n:
grou
p, a
lloca
ted
acco
rdin
g to
ho
spita
l atte
nded
Anal
ysis
: pat
ient
NRAd
mis
sion
for
obse
rvat
ion
Fabb
ri et
al.
2004
153
Desi
gn:
pros
pect
ive c
ohor
t st
udy
Setti
ng: E
D of
di
stric
t hos
pita
l, Ra
venn
a, It
aly
Cont
rol g
roup
: 24
–28
hour
s in
-ho
spita
l obs
erva
tion
follo
wed
by
hom
e m
onito
ring
Stud
y gr
oup:
up
to
12 h
ours
in-h
ospi
tal
obse
rvat
ion
and
early
ho
me
mon
itorin
g
Cont
rol g
roup
: 19
99 to
200
1
Stud
y gr
oup:
1999
to 2
001
Patie
nts
(age
d ≥
10
year
s) w
ith M
HI
with
in th
e pa
st 2
4 ho
urs
and
early
ne
gativ
e CT
sca
n
All p
atie
nts:
14
80
Cont
rol g
roup
: 64
6
Stud
y gr
oup:
83
4
Mea
n ag
e: N
R
Mal
e/fe
mal
e:
Cont
rol g
roup
: 387
(60%
)/ 25
9 (4
0%)
Stud
y gr
oup:
415
(5
0%)/4
19 (5
0%)
Allo
catio
n:
patie
nt, a
lloca
ted
acco
rdin
g to
clin
icia
n ju
dgem
ent
Anal
ysis
: pat
ient
NRPo
st-t
raum
atic
ICI
at C
T, th
e ne
ed
for n
euro
surg
ical
in
terv
entio
n an
d an
unf
avou
rabl
e ou
tcom
e (d
eath
or
disa
bilit
y)
Befo
re/a
fter s
tudi
es w
ithou
t con
curr
ent c
ontr
ol g
roup
Brow
ning
et
al. 2
00515
4
Desi
gn:
unco
ntro
lled
befo
re/a
fter s
tudy
Setti
ng: E
D of
a
paed
iatri
c te
achi
ng h
ospi
tal,
Edin
burg
h, U
K
Befo
re g
roup
: gu
idel
ines
adv
ise
skul
l ra
diog
raph
y fo
r all
Afte
r gro
up:
guid
elin
es a
dvis
e sk
ull r
adio
grap
hy o
nly
if vis
ible
evid
ence
of
hea
d in
jury
or
susp
icio
us h
isto
ry fo
r no
n-ac
cide
ntal
inju
ry
Befo
re g
roup
: 1
Augu
st 1
998
to
31 J
uly
1999
Afte
r gro
up:
1 Au
gust
200
2 to
31
Jul
y 20
03
Patie
nts
(age
d <
1 y
ear a
t tim
e of
pre
sent
atio
n or
di
agno
sis)
with
hea
d in
jury
All p
atie
nts:
37
1
Befo
re g
roup
: 18
1
Afte
r gro
up:
190
Mea
n ag
e: N
R
Mal
e/fe
mal
e:
Befo
re g
roup
: 94
(52%
)/87
(48%
)
Afte
r gro
up: 9
8 (5
2%)/9
2 (4
8%)
Allo
catio
n:
grou
p, a
lloca
ted
acco
rdin
g to
dat
e
Anal
ysis
: pat
ient
NRAd
mis
sion
s, s
kull
radi
ogra
phs,
tota
l ra
diat
ion
dose
NR

© Queen’s Printer and Controller of HMSO 2011. This work was produced by Pandor et al. under the terms of a commissioning contract issued by the Secretary of State for Health.
123 Health Technology Assessment 2011; Vol. 15: No. 27DOI: 10.3310/hta15270
Auth
or, y
ear
Stud
y de
tails
Desc
riptio
n of
in
terv
entio
nsDa
ta c
olle
ctio
n pe
riod
Type
of s
tudy
par
ticip
ants
Met
hods
Outc
omes
Incl
usio
n cr
iteria
Patie
nts
incl
uded
(n)
Mea
n ag
e (y
ears
± S
D)
and
gend
er (n
)Un
it of
allo
catio
n an
d an
alys
isSt
udy
pow
er
Proc
ess
mea
sure
s (in
clud
ing
time)
a and
/or
patie
nt o
utco
mes
Fong
et a
l. 20
0815
5
Desi
gn:
unco
ntro
lled
befo
re/a
fter s
tudy
Setti
ng: E
D of
te
rtiar
y re
ferra
l ho
spita
l, M
elbo
urne
, Au
stra
lia
Befo
re g
roup
: pre
-gu
idel
ine
Afte
r gro
up:
post
gui
delin
e (S
outh
ernh
ealth
Hea
d In
jury
Gui
delin
e, b
ased
on
CCH
R)
Befo
re g
roup
: Se
ptem
ber 2
002
to J
anua
ry 2
003
Afte
r gro
up:
Febr
uary
200
3 to
Au
gust
200
3
Patie
nts
aged
ov
er 1
6 ye
ars
who
pr
esen
ted
to th
e ED
fo
llow
ing
a no
n-tri
vial
blun
t or p
enet
ratin
g tra
uma
to th
e he
ad
N =
637
Befo
re g
roup
: n =
311
Afte
r gro
up:
n = 3
26
Mea
n ag
e:
Befo
re g
roup
: 46.
3 (±
24.
5)
Afte
r gro
up: 5
1 (±
26.
1)
Mal
e/fe
mal
e:
Befo
re g
roup
: 975
(6
4%)/5
60 (3
6%)
Afte
r gro
up: 1
248
(67%
)/619
(33%
)
Allo
catio
n:
grou
p, a
lloca
ted
acco
rdin
g to
dat
e
Anal
ysis
: pat
ient
Assu
min
g 20
%
redu
ctio
n fro
m
a 50
% b
asel
ine
head
CT
orde
ring
rate
, a
sam
ple
size
of
300
will
prov
ide
94.6
% p
ower
(α
= 0
.05)
Adm
issi
ons,
CT
rate
s, n
euro
-ob
serv
atio
ns a
n as
ympt
omat
ic
treat
men
t, ne
uros
urge
ry a
nd
deat
h
Hass
an e
t al.
2005
22
Desi
gn:
unco
ntro
lled
befo
re/a
fter s
tudy
Setti
ng: E
D of
a
teac
hing
(Nor
th
Tyne
side
) and
di
stric
t hos
pita
l (S
alfo
rd) i
n En
glan
d, U
K
Befo
re g
roup
: pre
-NI
CE 2
003
guid
elin
es
Afte
r gro
up: p
ost N
ICE
2003
gui
delin
es
Befo
re g
roup
1
(Nor
th T
ynes
ide)
: 1
Nove
mbe
r 200
2 to
30
Nove
mbe
r 20
02
Afte
r gro
up 1
: 1
May
200
3 to
31
May
200
3
Befo
re g
roup
2
(Sal
ford
): 1
May
20
03 to
31
May
20
03
Afte
r gro
up 2
: 1
Janu
ary
2004
to
31 J
anua
ry 2
004
Any
patie
nt w
ith
head
inju
ry (d
efine
d as
any
inju
ry a
roun
d th
e he
ad a
nd
uppe
r par
t of f
ace)
pr
esen
ting
to th
e ED
N =
113
0:
Befo
re
grou
p 1:
n =
276
Afte
r gro
up 1
: n =
351
Befo
re
grou
p 2:
n =
221
Afte
r gro
up 1
: n =
282
Mea
n ag
e: N
R
Mal
e/fe
mal
e:
Befo
re g
roup
1: 1
81
(66%
)/95
(34%
)
Afte
r gro
up 1
: 223
(6
4%)/1
28 (3
6%)
Befo
re g
roup
2: 1
50
(68%
)/71(
32%
)
Afte
r gro
up 2
: 18
1(64
%)/1
01 (3
6%)
Allo
catio
n:
grou
p, a
lloca
ted
acco
rdin
g to
dat
e
Anal
ysis
: pat
ient
NRRa
tes
of a
dmis
sion
, CT
and
sku
ll ra
diog
raph
y, c
osts
Kerr
et a
l. 20
0515
6
Desi
gn:
unco
ntro
lled
befo
re/a
fter s
tudy
Setti
ng: E
D of
te
achi
ng h
ospi
tal
in E
dinb
urgh
, UK
Befo
re g
roup
: pre
-SI
GN 2
000
guid
elin
es
Afte
r gro
up: p
ost S
IGN
2000
gui
delin
es
Befo
re g
roup
: 1
Nove
mbe
r 199
9 to
30
Nove
mbe
r 19
99
Afte
r gro
up: 1
May
20
01 to
31
May
20
01
All p
atie
nts
with
blu
nt
forc
e tra
uma
abov
e th
e ne
ck (i
nclu
ding
pa
tient
s w
ith fa
cial
la
cera
tions
)
N =
160
7
Befo
re g
roup
:
n = 7
88
Afte
r gro
up:
n = 8
19
Mea
n ag
e: N
R
Mal
e/fe
mal
e:
Befo
re g
roup
: 575
(7
3%)/2
13 (2
7%)
Afte
r gro
up: 5
66
(69%
)/253
(31%
)
Allo
catio
n:
grou
p, a
lloca
ted
acco
rdin
g to
dat
e
Anal
ysis
: pat
ient
NRAd
mis
sion
s fo
r ob
serv
atio
ns,
disc
harg
e
cont
inue
d

124 Review of studies evaluating diagnostic management strategies
Auth
or, y
ear
Stud
y de
tails
Desc
riptio
n of
in
terv
entio
nsDa
ta c
olle
ctio
n pe
riod
Type
of s
tudy
par
ticip
ants
Met
hods
Outc
omes
Incl
usio
n cr
iteria
Patie
nts
incl
uded
(n)
Mea
n ag
e (y
ears
± S
D)
and
gend
er (n
)Un
it of
allo
catio
n an
d an
alys
isSt
udy
pow
er
Proc
ess
mea
sure
s (in
clud
ing
time)
a and
/or
patie
nt o
utco
mes
Loro
ni e
t al.
1996
157
Desi
gn:
unco
ntro
lled
befo
re/a
fter s
tudy
Setti
ng: E
D of
di
stric
t hos
pita
l, Ra
venn
a, It
aly
Befo
re g
roup
: no
clin
ical
dia
gnos
tic
prot
ocol
Afte
r gro
up: c
linic
al
diag
nost
ic p
roto
col
with
indi
catio
ns fo
r ho
spita
l adm
issi
on a
nd
diag
nost
ic p
roce
dure
s
Befo
re g
roup
: 1
April
198
4 to
31
Mar
ch 1
985
Afte
r gro
up:
1 Ju
ne 1
988
to 3
1 De
cem
ber 1
990
Patie
nts
(age
d ≤
14
year
s at
tim
e of
pre
sent
atio
n or
di
agno
sis)
with
hea
d in
jury
N =
942
:
Befo
re g
roup
: n =
233
Afte
r gro
up:
n = 7
09
Mea
n ag
e:
Befo
re g
roup
: 5.4
(± N
R)
Afte
r gro
up: 4
.3 (±
NR)
Mal
e/fe
mal
e:
Cont
rol g
roup
:
140
(67%
)/ 93
(33%
)
Stud
y gr
oup:
456(
64%
)/253
(36%
)
Allo
catio
n:
grou
p, a
lloca
ted
acco
rdin
g to
dat
e
Anal
ysis
: pat
ient
NRAd
mis
sion
s fo
r ob
serv
atio
ns,
CT ra
tes,
sku
ll ra
diog
raph
y,
neur
osur
gica
l ad
mis
sion
Reed
et a
l. 20
0513
6
Desi
gn:
unco
ntro
lled
befo
re/a
fter s
tudy
Setti
ng: E
D of
a
paed
iatri
c te
achi
ng h
ospi
tal,
Edin
burg
h, U
K
Befo
re g
roup
: gu
idel
ines
adv
ise
skul
l ra
diog
raph
y fo
r all
Afte
r gro
up: g
uide
lines
ad
vise
no s
kull
radi
ogra
phy
Befo
re g
roup
: 1
Augu
st 1
998
to
31 J
uly
1999
Afte
r gro
up:
1 Au
gust
200
2 to
31
Jul
y 20
03
Patie
nts
(age
d be
twee
n 1
and
14 y
ears
at t
ime
of p
rese
ntat
ion
or
diag
nosi
s) w
ith h
ead
inju
ry
N =
340
2:
Befo
re g
roup
: n =
153
5
Afte
r gro
up:
n = 1
867
Mea
n ag
e: N
R
Mal
e/fe
mal
e:
Befo
re g
roup
: 975
(6
4%)/5
60 (3
6%)
Afte
r gro
up: 1
248
(67%
)/619
(33%
)
Allo
catio
n:
grou
p, a
lloca
ted
acco
rdin
g to
dat
e
Anal
ysis
: pat
ient
NRAd
mis
sion
s, s
kull
radi
ogra
phs,
CT
rate
s, to
tal r
adia
tion
dose
NR
Shra
vat e
t al.
2006
158
Desi
gn:
unco
ntro
lled
befo
re/a
fter s
tudy
Setti
ng: E
D of
di
stric
t hos
pita
l, Lo
ndon
, UK
Befo
re g
roup
: pre
-NI
CE 2
003
guid
elin
es
Afte
r gro
up: p
ost N
ICE
2003
gui
delin
es
Befo
re g
roup
: NR/
NR/2
003
Afte
r gro
up:
01 J
une
2004
to
31 A
ugus
t 200
4
All p
atie
nts
with
hea
d in
jury
pre
sent
ing
to
the
ED
N =
992
:
Befo
re g
roup
: n =
520
Afte
r gro
up:
n = 4
72
Mea
n ag
e: N
R
Mal
e/fe
mal
e:
Befo
re g
roup
: NR
Afte
r gro
up: 2
71
(57.
4%)/2
01 (4
2.6%
)
Allo
catio
n:
grou
p, a
lloca
ted
acco
rdin
g to
dat
e
Anal
ysis
: pat
ient
NRAd
mis
sion
s fo
r ob
serv
atio
ns,
CT ra
tes,
sku
ll ra
diog
raph
y, c
ost
TAB
LE 2
3 M
anag
emen
t str
ateg
ies
for
MH
I – s
tudy
des
ign
and
patie
nt c
hara
cter
istic
s of
oth
er s
tudi
es (c
ontin
ued)

© Queen’s Printer and Controller of HMSO 2011. This work was produced by Pandor et al. under the terms of a commissioning contract issued by the Secretary of State for Health.
125 Health Technology Assessment 2011; Vol. 15: No. 27DOI: 10.3310/hta15270
Auth
or, y
ear
Stud
y de
tails
Desc
riptio
n of
in
terv
entio
nsDa
ta c
olle
ctio
n pe
riod
Type
of s
tudy
par
ticip
ants
Met
hods
Outc
omes
Incl
usio
n cr
iteria
Patie
nts
incl
uded
(n)
Mea
n ag
e (y
ears
± S
D)
and
gend
er (n
)Un
it of
allo
catio
n an
d an
alys
isSt
udy
pow
er
Proc
ess
mea
sure
s (in
clud
ing
time)
a and
/or
patie
nt o
utco
mes
Sulta
n et
al.
2004
21
Desi
gn:
unco
ntro
lled
befo
re/a
fter s
tudy
Setti
ng: E
D of
te
achi
ng h
ospi
tal,
Cam
brid
ge, U
K
Befo
re g
roup
: RCS
‘G
alas
ko’ g
uide
line
(199
9)
Afte
r gro
up:
Cam
brid
ge p
roto
col
(bas
ed o
n CC
HR)
Befo
re g
roup
: 1
April
200
1 to
31
Octo
ber
2001
Afte
r gro
up:
1 Ja
nuar
y 20
02
to 3
0 Se
ptem
ber
2002
Adul
t pat
ient
s (a
ged
> 1
5 ye
ars)
with
M
HIs
pres
entin
g to
th
e ED
N =
597
Befo
re g
roup
: n =
330
Afte
r gro
up:
n = 2
67
Mea
n ag
e: N
R
Mal
e/fe
mal
e:
Befo
re g
roup
: NR
Afte
r gro
up: N
R
Allo
catio
n:
grou
p, a
lloca
ted
acco
rdin
g to
dat
e
Anal
ysis
: pat
ient
NRAd
mis
sion
s fo
r ob
serv
atio
ns, C
T ra
tes,
dis
char
ge,
skul
l rad
iogr
aphy
Thom
son
et
al. 1
99415
9
Desi
gn:
unco
ntro
lled
befo
re/a
fter s
tudy
Setti
ng: E
D of
tw
o ho
spita
ls in
No
rther
n re
gion
of
Engl
and,
UK
Befo
re g
roup
: pr
e-Gr
oup
of
Neur
osur
geon
gu
idel
ines
, 198
4
Afte
r gro
up:
post
Gro
up o
f Ne
uros
urge
on
guid
elin
es, 1
984
Befo
re g
roup
: 1
Febr
uary
198
7 to
31
May
198
7
Afte
r gro
up:
1 Fe
brua
ry 1
990
to 3
1 M
ay 1
990
Adul
t pat
ient
s (a
ged
> 1
6 ye
ars)
w
ith h
ead
inju
ries
or a
ltere
d co
nsci
ousn
ess
afte
r a
rele
vant
inju
ry o
r with
a
scal
p or
fore
head
la
cera
tion
pres
entin
g to
the
ED
N =
188
0
Befo
re
grou
p 1:
n =
533
Afte
r gro
up 1
: n =
613
Befo
re
grou
p 2:
n =
370
Afte
r gro
up 2
: n =
364
Mea
n ag
e:
Befo
re g
roup
1: 3
7.1
(± N
R)
Afte
r gro
up 1
: 38.
4 (±
NR)
Befo
re g
roup
2: 3
9.7
(± N
R)
Afte
r gro
up 2
: 38.
4 (±
NR)
Mal
e/fe
mal
e:
Befo
re g
roup
1: 3
16
(59%
)/217
(41%
)
Afte
r gro
up 1
: 402
(6
6%)/2
11 (3
4%)
Befo
re g
roup
2: 2
25
(61%
)/145
(39%
)
Afte
r gro
up 2
: 275
(7
6%)/8
9 (2
4%)
Allo
catio
n:
grou
p, a
lloca
ted
acco
rdin
g to
dat
e
Anal
ysis
: pat
ient
NRAd
mis
sion
s fo
r ob
serv
atio
ns, s
kull
radi
ogra
phy
NR, n
ot re
porte
d; R
CS, R
oyal
Col
lege
of S
urge
ons;
SD,
sta
ndar
d de
viatio
n.a
Leng
th o
f tim
e du
ring
whi
ch o
utco
mes
wer
e m
easu
red
afte
r ini
tiatio
n of
the
inte
rven
tion.

126 Review of studies evaluating diagnostic management strategies
examination and feasible home monitoring. The study was limited by allocation to intervention group being based on clinical judgement of severity and lack of power to detect rare, but serious events.
Brown et al.152 determined whether access to a short-stay ward significantly affected the threshold for admission of patients with MHIs and the implementation of head injury admission guidelines. The results showed that 49/83 (59%) patients who met accepted guidelines for hospital admission were admitted to a hospital with an observation ward, compared with 10/49 (34%) admitted to a hospital with no observation ward (p < 0.001). The authors concluded that access to a short-stay ward has a considerable bearing on whether or not a minor head-injured patient is admitted to hospital. The study involved only two hospitals, so it is uncertain whether the findings can be generalised to other hospitals.
Before/after studies without concurrent control groupThese studies have evaluated the effect of implementing guidelines and changes in policy upon hospital admission policy, use of skull radiography and/or use of CT scanning. The absence of a control group to record concurrent changes over time means that we cannot be sure that the changes observed in these studies were due to the intervention rather than to temporal trends, concurrent changes or a Hawthorne effect. They, therefore, represent very weak evidence of effectiveness.
Sultan et al.21 evaluated the effects of a protocol based on the CCHR (the Cambridge protocol) for managing MHIs compared with guidelines published by the Society of British Neurological Surgeons, 1998, and Royal College of Surgeons for England, 1999. The results showed that CT rates increased significantly from 14% to 20% (p < 0.05), and admissions for observation increased from 34% to 45% (p < 0.05). Skull radiography rates decreased considerably from 33% of all patients with head injuries in 2001 to 1.6% in 2002 (p-value not reported), without any adverse effect. The authors21 concluded that it was possible to replace the practice of risk stratification of adults with MHI based on skull radiography with a slightly modified version of the CCHR. Fong et al.155 reported a similar effect in their evaluation of a guideline based on the CCHR and the NOC for MHI (the Southernhealth Head Injury Guideline). The results showed that after implementation of the new guidelines, the CT ordering rate increased from 31.6% to 59% (p-value not reported), and admissions for observation increased from 21.9% to 27% (p = 0.08). Abnormal head CT was reported in 6.8% in the pre-guideline group compared with 5% in the post guideline group. The authors155 concluded that, although CT head scanning rates were increased, the Southernhealth Head Injury Guidelines were safe and easy to apply to major and MHIs.
Hassan et al.22 and Shravat et al.158 evaluated the effect of implementation of the NICE head injury guidance, which was also based upon the CCHR. Hassan et al.22 studied two hospitals and reported that after implementation of the NICE guidance at the teaching hospital the CT scan rate increased from 3% to 7%, the skull radiography declined from 37% to 4% and the admission rate decreased from 9% to 4%, whereas at the non-teaching hospital the CT scan rate increased from 1.4% to 9%, the skull radiography rate decreased from 19% to < 1% and the admission rate declined from 7% to 5%. Shavrat et al.158 studied one hospital and reported that the CT scan rate increased significantly, the skull radiography rate fell and the admission rate was unchanged.
Kerr et al.156 evaluated the effect of implementing the SIGN guidelines at a Scottish hospital. After guideline implementation the proportion of patients admitted to hospital increased from 20% to 26%, but there were no significant changes in the proportion of patients undergoing skull radiography or CT.

© Queen’s Printer and Controller of HMSO 2011. This work was produced by Pandor et al. under the terms of a commissioning contract issued by the Secretary of State for Health.
127 Health Technology Assessment 2011; Vol. 15: No. 27DOI: 10.3310/hta15270
Two papers from the same UK paediatric teaching hospital evaluated the effect of a policy change to restrict the use of skull radiography in infants154 and children136 with a head injury presenting to the ED between 1998–9 and 2002–3. Abandoning the use of skull radiography in children aged between 1 and 14 years did not lead to a significant increase in admission rates (10.1% vs 10.9%; p = 0.43), missed ICI (0.20% vs 0.37%; p = 0.53) or neurosurgical intervention (0% vs 0.1%; p = 0.30), but doubled the proportion of children who received a CT scan from 1.0% to 2.1% (p = 0.02).136 Limitation of skull radiography in infants led to a substantial decrease in skull radiography rates (77.3% to 29.5%; p-value not reported) with no detriment to the infant in terms of missed injury or admissions (13.8% vs 10%; p-value not reported).154
Loroni et al.157 compared the management of children (≤ 14 years) with head injury (all severities) in an Italian general hospital in two different periods (1984–5 and 1988–90), one before and one after the introduction of a protocol for the management of children with head injury (with indications for hospital admission and diagnostic procedures). The results showed that, among the clinical cases with milder symptoms of head injury, hospital admissions for observation decreased significantly from 40.3% to 27.8% (p < 0.05) and skull radiography from 86.7% to 36.1% (p < 0.05), without an increase in the number of diagnostic errors. Data on CT rates and neurosurgical admission were limited. The authors157 concluded that it was possible to reduce the number of radiographical examinations and admissions without increasing the number of diagnostic errors with a management protocol with indications for hospital admission and diagnostic procedures for children with head injury.
Thomson et al.159 compared the management of adults with head injury before and after the introduction in two hospitals of guidelines drawn up in 1984 by a group of neurosurgeons. After implementation of the guidelines the proportion receiving skull radiography increased from 49% to 60% in one hospital, but decreased from 34% to 25% in the other. The proportion admitted remained constant in one department (34% vs 36%), but decreased from 33% to 15% in the other.
Overall, these studies show that implementation of guidelines may change the management of patients with MHI, although the effects are varied and not always as anticipated. The findings may be specific to the hospitals concerned or may be owing to the potential biases outlined above.


© Queen’s Printer and Controller of HMSO 2011. This work was produced by Pandor et al. under the terms of a commissioning contract issued by the Secretary of State for Health.
129 Health Technology Assessment 2011; Vol. 15: No. 27DOI: 10.3310/hta15270
Chapter 5
Assessment of cost-effectiveness evidence
This section of the assessment focuses on the health economics of diagnostic strategies for the management of MHI. It includes a brief review of existing economic evaluations and a
detailed explanation of the methodologies and results of a de novo economic model. The section Systematic review of existing cost-effectiveness evidence, presents the results of the systematic review of economic literature. The modelling approach adopted for this study is described (see Independent economic assessment), along with the results of the analysis (see Results).
Systematic review of existing cost-effectiveness evidence
The primary objective of this review was to identify and evaluate studies exploring the cost-effectiveness of different diagnostic strategies for the management of MHI. The secondary objective was to evaluate methodologies used to inform our own economic evaluation.
Identification of studiesElectronic databasesStudies were identified by searching the following electronic databases:
■ MEDLINE (via OvidSP) 1950 to March 2010 ■ MEDLINE In-Process & Other Non-Indexed Citations (via OvidSP) 1950 to March 2010 ■ CINAHL (via EBSCO) 1981 to April 2009 ■ EMBASE (via OvidSP) 1980 to April 2009 ■ WOS (includes SCI and CPCI) (via WOK) 1899 to April 2009 ■ NHS DARE (via CRD databases) Approximately 1994 to April 2009 ■ NHS Economic Evaluation Database (NHS EED) (via CRD databases) approximately 1994
to April 2009 ■ HTA database (via CRD databases) approximately 1994 to April 2009 ■ Health Economic Evaluation Database (via Wiley InterScience) 1967 to April 2009.
Sensitive keyword strategies using free text and, where available, thesaurus terms using Boolean operators and database-specific syntax were developed to search the electronic databases. Synonyms relating to the condition (e.g. head injury) were combined with a search filter aimed at restricting results to economic and cost-related studies (used in the searches of MEDLINE, CINAHL and EMBASE). Date limits or language restrictions were not used on any database. All resources were searched from inception to April 2009. Updated searches to March 2010 were conducted on the MEDLINE databases only. An example of the MEDLINE search strategy is provided in Appendix 9.
Other resourcesTo identify additional published, unpublished and ongoing studies, the reference lists of all relevant studies were checked and a citation search of relevant articles (using the WOK’s SCI and SSCI) was undertaken to identify articles that cite the relevant articles. In addition, systematic keyword searches of the WWW were undertaken using the Copernic Agent Basic (version 6.12) meta-search engine.

130 Assessment of cost-effectiveness evidence
All identified citations from the electronic searches and other resources were imported into and managed using the Reference Manager bibliographic software (version 12.0).
Inclusion and exclusion criteriaStudies were selected for inclusion according to pre-determined inclusion and exclusion criteria. Studies were included if they reported the cost-effectiveness of diagnostic management strategies for MHI, included CT scanning in a patient management strategy and estimated the benefits in terms of life-years gained or QALYs. Studies that were considered to be methodologically unsound (including abstracts), that were not reported in sufficient detail to extract costs and outcome estimates or that did not report an estimate of cost-effectiveness (e.g. costing studies) were excluded. Papers not published in the English language were also excluded.
One reviewer (MH) independently screened all titles and abstracts. Any discrepancies were resolved by discussion, with involvement of a second reviewer (SG) when necessary. Full papers were obtained for any titles/abstracts that were considered relevant or where the title/abstract information was not sufficient to make a decision.
Quality assessment strategyThe quality of studies was assessed using a combination of key components of the Drummond and Jefferson checklist for economic evaluations,160 together with the Eddy checklist on mathematical models used in technology assessments.161 The use of the checklist ensures a consistent approach to assessing the quality of each economic evaluation.
Results of cost-effectiveness reviewThe systematic searches identified 1263 potentially relevant citations. Of the titles and abstracts screened, six relevant full-text papers were retrieved and assessed in detail. A flow chart describing the process of identifying relevant literature can be found in Appendix 10. A total of three studies162–164 were identified as meeting the inclusion criteria. Although, no UK cost-effectiveness studies were found, one study162 did repeat the analysis using UK modelling recommendations. Studies excluded from the review are listed in Appendix 11.
Cost-effectiveness reviewStein et al.163
OverviewStein et al.163 developed a decision-analytic model to compare the cost-effectiveness of six strategies for the management of mild traumatic head injury: selective CT scanning based largely on the CCHR; CT for all patients; skull radiography for all patients; prolonged ED observation; 24-hour hospital admission; and no treatment.
A decision tree approach was used to compare the strategies. Patients having no intracranial lesion were either correctly diagnosed and discharged or incorrectly diagnosed and received unnecessary treatment. Patients with an intracranial lesion were either correctly diagnosed and received prompt treatment or incorrectly diagnosed and received delayed treatment that was associated with worse outcomes. Outcomes were described by the GOS. The base case represented a 20-year-old patient with a GCS of 14 or 15. Epidemiological data were derived from a MEDLINE search. The setting of the model was the US health service with a societal perspective. The economic outcome was incremental cost per QALY discounted at 3% annually. Health-related utility values were taken from a study that used standard gamble techniques to elicit utility values for GOS outcomes 2–4 from 52 health professionals and 83 medical students.165 Utility scores of 0 and 1 were assigned to GOS 1 and GOS 5, respectively. Univariate sensitivity analysis

© Queen’s Printer and Controller of HMSO 2011. This work was produced by Pandor et al. under the terms of a commissioning contract issued by the Secretary of State for Health.
131 Health Technology Assessment 2011; Vol. 15: No. 27DOI: 10.3310/hta15270
and probabilistic sensitivity analysis (PSA) were undertaken and the analysis was repeated for patients aged 40, 60 and 80 years. In the deterministic analysis the selective CT scanning strategy dominated all other strategies, and in the PSA, for willingness-to-pay thresholds of between $50,000 and $150,000 per QALY, there was a 68–90% probability that selective CT scanning would be cost-effective. The PSA incremental cost per QALY is not reported. In the univariate analysis, the results were most sensitive to the outcome of prompt surgery; however, no parameter changes altered the conclusion. In the higher age group analysis, selective CT scanning remained dominant, although the magnitude of the incremental costs and QALYs reduced with older age.
CommentsThis appears to be a well-constructed model, parameterised by relevant data at the time. The authors acknowledged that a limitation of their model was that the risk of cancer due to CT scanning was not modelled. However, they appeared to have conducted a sensitivity analysis in which they adjusted for the published risk of cancer for a 20-year-old patient and this did not alter the conclusion.
Stein et al.164
OverviewStein and colleagues164 examined the cost-effectiveness of routinely re-scanning patients, compared with repeating the scan only after clinical deterioration, in a patient group with MHI in whom the admission CT scan revealed a non-neurosurgical lesion. A decision tree approach was used to compare the two strategies. Patients in the ‘routine repeat CT’ pathway either developed a haematoma or did not; those developing a haematoma were assumed to receive prompt surgery. In the ‘CT only if deteriorates’ pathway, patients deteriorated and received prompt surgery, deteriorated and received delayed surgery or did not deteriorate. In both pathways, patients who do not deteriorate have an uneventful recovery. The base case was a 20-year-old with mild TBI with a GCS of 14 or 15. Patient outcomes were measured by the GOS, with prompt surgery having a better outcome than delayed surgery. Epidemiology data were derived from a MEDLINE search. The setting of the model was the US health service with a societal perspective. The economic outcome was the cost/QALY discounted at 3% annually. Health-related utility values were taken from the same study used by the earlier Stein et al. study163 described above. Utility scores of 0 and 1 were assigned to GOS 1 and GOS 5, respectively. Both univariate and PSA were carried out. The incremental cost-effectiveness ratio (ICER) of routine CT scanning compared with CT scanning after deterioration was $12,670 (95% CI –$76,038 to $80,693). The study found that the ICER increased exponentially as patients’ age increased and the mean ICER at age 80 years was around $80,000. The authors concluded that there is a case for routine follow-up CT scanning; however, the uncertainty around the results was substantial.
CommentsThis evaluation satisfied the majority of items used to assess the overall quality and appeared to be well conducted using the evidence available at the time. However, as the authors remark, the mean cost per QALY had considerable uncertainty ranging from routine CT scanning dominating to being dominated. Unfortunately, the published table of results had mistakes, so the costs and QALYs that contribute to this uncertainty were not transparent and the authors did not elaborate on the possible reasons for this uncertainty. The authors acknowledged that omitting the risk of cancer from CT scanning was a limitation of their study, especially in children. The authors concluded that routine CT scanning should be considered as an option by decision-makers. We would conclude that more clarification around the considerable uncertainty is needed before this decision can be made.

132 Assessment of cost-effectiveness evidence
Smits et al.162
OverviewThis study compared the cost-effectiveness of various CT scanning strategies with CT scanning all patients with MHI. Strategies included are the NOC,27 CCHR,26 CT in Head Injury Patients (CHIP)69 and CT for no patients. A Markov model was developed to assess long-term costs and QALYs. The model was based on data from the CHIP study69 (n = 3181) and from literature reviews. The correct identification of patients with a neurosurgical lesion, a non-neurosurgical lesion or no lesion was based on the sensitivity and specificity of the decision rules. Patients with delayed surgery were estimated to have worse outcomes than patients treated without delay. Patient outcomes are measured by the GOS. QoL estimates were derived from European Quality of Life-5 Dimensions (EQ-5D) questionnaires (n = 87) administered as part of the CHIP study and converted to utilities. The perspective of the model is the Dutch health-care system; both direct health-care and direct non-health-care costs are included. The base-case analysis was a cohort of 41-year-old men, representative of the typical patient in the CHIP study. The time horizon was 1 and 25 years. Costs and benefits were discounted at 3%. Univariate and multivariate sensitivity analysis and PSA were carried out. The risk of cancer from a CT scan was included; however, the authors give no information on the parameters used. Expected value of perfect information (EVPI) for further research was undertaken. The EVPI for further research was $1759 per patient, which, for the US population, over a period of 5 years, was estimated to amount to $7B. The analysis was repeated using cost-effectiveness modelling recommendations from the UK (health-care perspective, discounting rate of 3.5% for both costs and outcomes) and the Dutch (societal perspective, costs and outcomes discounted at 4% and 1.5%, respectively). In the base-case analysis, the NOC, ‘CT all patients’ and ‘CT not performed’ strategies were dominated by the other strategies. The ICER for the CHIP rule versus CCHR was $3M. In the PSA, the probability that performing selective CT was cost-effective compared with performing CT in all patients was 0.51–0.64, depending on the willingness-to-pay threshold (maximum of $75,000). The incremental cost per QALY results from the PSA were not reported. The authors state that similar results were found when using UK and Dutch modelling recommendations. The value of information (VOI) analysis indicated that further research was justified to reduce uncertainty about long-term functional outcomes after MHI.
CommentsThis was a well-constructed model that scored highly on the assessment criteria. A particular strength of this model was that it was based on good-quality trial data with minimum input from the literature. The authors recognised that there was uncertainty around some of the rare events in the model.
Cost-effectiveness review summaryComparison of the results from the three studies is not straightforward owing to the different objectives, comparators, populations and costings used. However, both the Smits et al.162 and Stein et al.163 studies agreed that the CCHR prediction tool was cost-effective compared with other strategies, although the comparator strategies used were different in these studies.
Independent economic assessment
This section details the methods and results of our health economic model, constructed to compare CT scanning management strategies for patients with a MHI. The strategies evaluated in adults were ‘CT all’ (theoretical), abnormal arrival GCS (theoretical), CCHR (high risk),26 CCHR (high or medium risk),26 NCWFNS,72 NOC,27 NEXUS II,62 NICE1 and the Scandinavian rule.73 The decision rules evaluated in children were ‘CT all’ (theoretical), CHALICE,30 PECARN,90 UCD93 and the rule of Atabaki et al. 2008.81 The analysis was undertaken to address the lack

© Queen’s Printer and Controller of HMSO 2011. This work was produced by Pandor et al. under the terms of a commissioning contract issued by the Secretary of State for Health.
133 Health Technology Assessment 2011; Vol. 15: No. 27DOI: 10.3310/hta15270
of any published cost-effectiveness evidence from the perspective of the NHS in England and Wales. The key aim was to determine the optimal CT scanning management strategy in terms of cost-effectiveness.
Methods of independent economic analysisObjectivesThe objectives of the cost-effectiveness analysis were to:
■ estimate the cost-effectiveness of diagnostic strategies for MHI, in terms of the cost per QALY gained by each strategy
■ identify the optimal strategy for managing MHI in the NHS, defined as the most cost-effective strategy at a willingness to pay per QALY gained threshold of £30,000
■ identify the critical areas of uncertainty in the management of MHI, where future primary research would produce the most benefit.
The costs and benefits of diagnostic management of minor head injuriesThe main benefits of diagnostic management relate to rapid identification and treatment of patients with intracranial lesions that require urgent neurosurgery (neurosurgical lesions) and the identification of patients with non-neurosurgical lesions, so that they can be monitored and receive timely treatment if they subsequently deteriorate. The main disbenefit is the risk of cancer associated with CT radiation, particularly in children. The direct costs of diagnostic management include the costs of investigation, particularly CT scanning, and hospital admission for observation, and the subsequent costs of providing neurosurgical treatment, intensive care, rehabilitation and, for those with persistent disability, long-term social care. We built a model to allow us to analyse the effect of different diagnostic management strategies on these costs and benefits.
The decision-analysis model structureWe developed a decision-analysis model to estimate the costs and QALYs accrued by each potential management strategy for MHI, including a theoretical ‘zero option’ strategy of discharging all patients home without investigation. Each strategy was applied to a hypothetical cohort of patients attending the ED with MHI. We assumed that a proportion of the cohort would have an intracranial lesion requiring neurosurgery (typically an extradural haemorrhage) and another proportion would have an intracranial lesion that did not require neurosurgery. The remainder would have no intracranial haemorrhage. These proportions were estimated from the study of patients with MHI by Smits et al.166 (Table 24). This was a large study of patients with GCS 13–15 head injury in which all patients underwent CT scanning, and was thus judged to provide a reliable and relevant estimate of the prevalence of ICI. We also undertook a sensitivity analysis in which we used estimates from another study, that of Stein et al.71 This was also a large well-conducted study, but was limited to patients with GCS 14–15 and not all had CT scanning.
We assumed that the strategy would determine which patients underwent CT scanning and that the probability of detecting a neurosurgical lesion was determined by the sensitivity of the
TABLE 24 Proportion of patients with neurosurgical or non-neurosurgical injury
Author
Neurosurgical injury Non-neurosurgical injury
n % 95% CI (%) n % 95% CI (%)
Smits et al.166 17/3181 0.53 0.33 to 0.85 226/3181 7.10 6.26 to 8.05
Stein et al.71 108/7955 1.36 1.13 to 1.64 423/7955 5.32 4.85 to 5.83

134 Assessment of cost-effectiveness evidence
strategy for neurosurgical lesions. We assumed that patients with a neurosurgical lesion detected on CT would be managed promptly (before any deterioration occurred), while those who did not undergo CT according to the strategy would receive delayed treatment (after deterioration had occurred).
We assumed that a proportion of patients with a non-neurosurgical lesion would deteriorate over the following 48 hours and require intervention (critical care support and/or neurosurgery), whereas the remainder would remain well. If the strategy led to CT being performed and the lesion detected then we assumed that the patient would be admitted to hospital and would receive prompt appropriate treatment. If the strategy did not lead to CT being performed we assumed that the patient would be discharged home and would receive delayed treatment. The proportion of patients undergoing CT was determined by the sensitivity of the strategy for detecting a non-neurosurgical lesion.
We assumed that patients without an intracranial lesion remained well and did not deteriorate. These patients would not therefore benefit from investigation and treatment.
The model assigned each patient to a GOS category depending upon whether or not he or she had an intracranial lesion (neurosurgical or non-neurosurgical) and how quickly it was treated. Each patient then accrued lifetime QALYs and health-care costs according to his or her GOS category. Costs were also accrued according to whether or not the strategy resulted in the patient receiving investigation with a CT scan, hospital admission for observation, or neurosurgery. Finally, we applied a QALY decrement and additional cost to every patient who received a CT scan to reflect the potential effect of radiation exposure upon long-term health. Details of each of these processes are outlined below.
Selection of strategiesThe literature review identified a number of clinical decision rules for MHI. The national survey revealed that most hospitals used either the NICE1 or SIGN20 guidelines. Clinical decision rules for adults had been more extensively validated than those developed for children. We therefore selected clinical decision rules for adults only if they had been validated in a different cohort from the derivation cohort, whereas clinical decision rules for children were included if they had any accuracy parameters at the time we developed the model, even if they were from the derivation cohort.
The clinical decision rules were typically developed to determine whether or not patients should receive CT scanning. We therefore made the following assumptions about how they would be put into practice, based on clinical expertise:
■ patients with a neurosurgical lesion diagnosed on CT are admitted and operated on ■ patients with a non-neurosurgical lesion diagnosed on CT are admitted for observation ■ patients with a normal CT and those who do not receive a CT are discharged to the care of a
responsible adult.
We also included several theoretical strategies:
■ a ‘zero option’ of discharging all patients without CT, to determine whether or not investigation and management of MHIs is cost-effective in general
■ CT scan for all patients, to determine whether this is more cost-effective than any attempt to select patients for CT
■ a ‘high specificity’ strategy of CT scanning only patients with an abnormal GCS at presentation.

© Queen’s Printer and Controller of HMSO 2011. This work was produced by Pandor et al. under the terms of a commissioning contract issued by the Secretary of State for Health.
135 Health Technology Assessment 2011; Vol. 15: No. 27DOI: 10.3310/hta15270
The ‘discharge all’ and ‘CT all’ strategies are included as theoretical strategies to explore the overall cost-effectiveness of diagnostic testing. The former would not be considered acceptable and the latter not currently feasible. However, their inclusion allows the model to explore theoretical issues, such as whether CT scanning in itself, or attempts to select patients for scanning, are cost-effective. The last strategy was included because clinical decision rules have been developed to optimise sensitivity at the expense of specificity. Health economic modelling gave us the opportunity to test the assumption that sensitivity should always be optimised. We assumed that a strategy based on GCS alone could have reasonably high specificity, albeit with sacrifice of sensitivity.
We did not use the modelling to compare strategies that admitted patients for observation (without CT) to those that used CT. Hospital admission costs slightly more than CT and there is no theoretical reason to expect better outcomes with hospital admission on the basis of our assumptions. Indeed, as CT allows neurosurgical intervention before deterioration, whereas admission uses patient deterioration to detect neurosurgical lesions, there are strong reasons to expect CT-based strategies to be more effective and cheaper. This is supported by several primary studies that have compared CT-based strategies with skull radiography and/or admission to conclude that CT-based strategies are more likely to detect intracranial bleeding and less likely to require hospital admission.35,34 Cost analyses based upon trial data36 and modelling37 both suggest that a CT-based strategy is cheaper.
However, there are a number of circumstances in which hospital admission can be used in CT-based strategies and several questions arise:
■ Is it cost-effective to admit clinically normal patients with a normal CT scan? Patients with a MHI and a normal CT scan have a very low (0.006%) risk of deterioration,167 so it is usually considered appropriate to discharge these patients home. We used our model to test the assumption that admission is not cost-effective for these patients.
■ Is it cost-effective to admit patients with a non-neurosurgical lesion on CT scan? These patients have a significant (13.5%)18 risk of deterioration requiring critical care or neurosurgical intervention, so hospital admission is typically considered appropriate. We used our model to determine whether or not admission is cost-effective for these patients.
■ Is it cost-effective to admit patients with a normal CT scan if no responsible adult is available to care for them? We assumed in the main analysis that patients with a normal CT scan would be discharged to the care of a responsible adult and would be brought back if they deteriorated. However, some patients do not have a responsible adult available and in the worst-case scenario a patient who deteriorated after discharge might die before being brought to medical attention. We used our model to test whether hospital admission for patients with a normal CT would be cost-effective if no responsible adult was available.
Finally, leading on from the last issue, we planned a secondary analysis to determine whether the optimal strategy remained so in the absence of a responsible adult. In these circumstances the potential benefit of CT scanning is enhanced because the consequences of missed intracranial lesion are more severe. The worst-case scenario would be that any patient discharged with an intracranial lesion would die before being brought to medical attention. We used the model to determine which strategy would be most cost-effective in this situation. This analysis and the third analysis above were only undertaken for adults because it was assumed that, in the case of children, a responsible adult would always be available.
Diagnostic parameters of each strategyFor each strategy, we estimated the sensitivity for neurosurgical intracranial lesion, the sensitivity for non-neurosurgical intracranial lesion and the specificity for no lesion. In the main analysis

136 Assessment of cost-effectiveness evidence
we assumed that CT scanning was 100% accurate for identifying significant intracranial lesions and that the only relevant lesions were those related to the head injury (i.e. we did not consider incidental findings unrelated to the injury). The ‘CT all’ strategy, therefore, had 100% sensitivity for both neurosurgical and non-neurosurgical lesions and 100% specificity. The ‘zero option’ strategy had zero sensitivity and 100% specificity.
The literature review identified that most clinical decision rules for adults had estimates of diagnostic parameters from validation cohorts, although often in different settings from the derivation cohort. Decision rules would be expected to perform better in a derivation cohort and in a validation cohort from the same setting as the derivation cohort, so a validation study undertaken in a different setting could provide the most appropriate estimate of diagnostic performance. However, using different cohorts to estimate parameters for different decision rules could introduce selection bias. We therefore decided to use data from a validation study by Stein et al.71 to estimate parameters for all adult decision rules. This study reported a large, unselected cohort in which all of the main clinical decision rules were validated. All but one of them (the NWFCS rule)72 had been developed in a different population. Further details of the parameters used are provided below (see Transition possibilities).
The literature review identified that there has been very little validation of decision rules for children. We therefore used the derivation cohorts to provide estimates of diagnostic parameters for each of the decision rules for children, with the exception of Kupperman et al.,90 where we combined data from the derivation and validation cohorts. Further details are provided below (see Transition possibilities). We included decision rules only where data were available to calculate the sensitivity of the rule for neurosurgical and non-neurosurgical lesions separately, and where there were sufficient numbers of neurosurgical lesions to provide a meaningful estimate of sensitivity. The differences between the parameters reported for children’s decision rules may be due to differences in the cohorts and the reference standard used (particularly for non-neurosurgical injury) rather than performance of the rules. During the project we identified a study that had compared multiple decision rules for children in a validation cohort.89 We used the estimates of diagnostic accuracy for the UCD,93 NEXUS II62 and CHALICE30 rules from this study to undertake a sensitivity analysis using validation data. Further details of the estimated diagnostic parameters used are provided below (see Transition possibilities).
To estimate the cost-effectiveness of hospital admission compared with discharge home for clinically well patients with a normal CT scan we used data from a published review of studies that followed up patients with a MHI and a normal CT scan.167 This study reported that 4/66,121 (0.006%) patients subsequently deteriorated and required neurosurgery. We assumed that the effect of early intervention associated with admitting these patients was similar to the effect modelled in patients with a non-neurosurgical lesion on CT (see below). We therefore modelled a comparison between admission and discharge of a cohort of patients who received CT scan and then had a 0.006% probability of subsequent deterioration.
To estimate the cost-effectiveness of hospital admission compared with discharge home for patients with a non-neurosurgical lesion on CT we modelled a comparison between admission and discharge for a cohort of patients with a non-neurosurgical lesion on CT. We used data from Fabbri et al.18 to estimate the risk of subsequent deterioration and an estimate of the relative risk of adverse outcome after discharge home (details outlined below).
To estimate the cost-effectiveness of hospital admission for patients with a normal CT scan and no responsible adult we repeated the analysis used to determine the cost-effectiveness of admission in those with a normal CT, but assumed that patients who deteriorated after discharge died and accrued no QALYs.

© Queen’s Printer and Controller of HMSO 2011. This work was produced by Pandor et al. under the terms of a commissioning contract issued by the Secretary of State for Health.
137 Health Technology Assessment 2011; Vol. 15: No. 27DOI: 10.3310/hta15270
To determine the optimal strategy for adults when no responsible adult is available we repeated the main analysis, but assumed that all patients who had a missed ICI (neurosurgical or non-neurosurgical) died and accrued no QALYs.
Glasgow Outcome Score categorisationThe model allocated each patient to a GOS category according to whether they had an intracranial lesion and how quickly it was treated. This involved estimating the probabilities that patients with neurosurgical and non-neurosurgical lesions would end up in each GOS category depending on the extent of treatment delay.
Outcomes of neurosurgical lesionsAs outlined in the previous section (see Glasgow Outcome Score categorisation), we needed to estimate the effect of delayed intervention upon the probability of ending up in each GOS category after suffering a neurosurgical intracranial lesion. Treatment without significant delay should correspond to current best practice. We therefore estimated outcomes from published studies reporting GOS after operation for extradural haemorrhage in cohorts of patients exclusively or predominantly presenting with GCS 13–15. These are summarised in Table 25.
A fixed-effects meta-analysis was conducted to estimate the proportions of patients categorised into each of the five GOS categories. The outcome data from each study were assumed to come from a multinomial distribution and the same degree of heterogeneity was assumed for each of the five states. The analysis was conducted in the Bayesian software Winbugs Version 1.4 (MRC Biostatistics Unit, Cambridge, UK) using vague prior distributions. In order for the pooled proportions to add up to approximately 1, constraints similar to those used previously for relative risks and risk differences were applied.168 The results are shown in Table 26.
Estimating the effect of delay upon outcome is difficult. Studies have analysed the association between time delay before surgery and outcome, generally reporting either no association or a negative association (i.e. longer time delays are associated with lower mortality). One would expect delays before neurosurgery to be associated with higher mortality, so this
TABLE 25 Published outcomes for patients with appropriate interventions
Author, year Patients GCS score n
GOS score
5 4 3 2 1
Lee et al. 19987 All 13–15 77 63 4 3 4 3
Cheung et al. 20078 All 13–15 21 14 5 1 0 1
Cook et al. 19889 All 14–15 34 33 0 0 0 1
Gerlach et al. 200910 Children 13–15 23 23 0 0 0 0
Haselberger et al. 198811 All 8–15 22 13 7 1 0 1
TABLE 26 Estimated outcomes for patients with immediate interventions
GOS state n % 95% CrI (%)
5 146/177 81.00 74.7 to 86.1
4 16/177 9.30 5.6 to 13.9
3 5/177 3.20 1.2 to 6.3
2 4/177 2.70 0.9 to 5.5
1 6/177 3.80 1.6 to 7.9
CrI, credible interval.

138 Assessment of cost-effectiveness evidence
association is likely to be confounded by disease severity, with more severe cases receiving more urgent treatment.
We identified one study12 reporting the association between time delay and outcome where the time delay was due to long-distance interhospital transfer and thus presumably not related to disease severity. The outcomes for the patients who went directly to the neurosurgical centre (non-delayed) and those transferred before operation (delayed) are outlined in Table 27.
Using the probabilities for transferred patients directly would be problematic because of the small numbers. In particular, no transferred patients ended up in a vegetative state (GOS 2), whereas intuitively we would expect this outcome to be more common after delayed treatment. We therefore dichotomised GOS into good outcome (GOS 4 or 5) versus poor outcome (GOS 1–3) and used this to estimate the relative risk of a poor outcome following delayed treatment, which was 2.4.
Another study11 showed the association between outcome and time delay from LOC to operation. In this circumstance we would not expect confounding by disease severity to have a major influence because all patients who required neurosurgery after LOC would be treated as urgent and any delays would more likely be due to logistic factors. The results of this study are shown in Table 28.
Dichotomising the data between good outcome (GOS 4 or 5) and poor outcome (GOS 1–3) produced a relative risk for additional time delay causing an adverse outcome of 2.6, suggesting a similar effect to that calculated from the Deverill and Aitken12 data, albeit in a different scenario.
The relative risk for delay was calculated by assuming the proportion of patients with a poor outcome (GOS 1–3) was distributed binomially (and independently) for the two groups and treated as a stochastic variable in the calculations that follow. The proportions of patients in GOS categories 3, 2 and 1 above (i.e. with prompt treatment) were multiplied by the relative risk and the proportions in categories 4 and 5 were divided by the relative risk. Then the five probabilities were adjusted by dividing them by the sum of the probabilities for all categories to ensure that the proportions in each category for the delayed group added up to 1. These calculations were done in Winbugs to ensure that all variables were treated as stochastic (i.e. with uncertainty) for all calculations. The probabilities for each GOS category after delayed treatment are shown in Table 29.
The economic model of Smits et al.162 was published while we were developing our model. This used data from a study of the CHIP rule to estimate GOS outcomes after prompt treatment and historical data from Cordobés et al.169 (before the routine use of CT scanning) to estimate
TABLE 27 Deverill and Aitken12 study data comparing direct to neurosurgery with interhospital transfer
Median timea GOS 5, n (%) GOS 4, n (%) GOS 3, n (%) GOS 2, n GOS 1, n (%)
Direct 4 hours 19 minutes 16 (69.6) 5 (21.7) 2 (8.7) 0 0
Transfer 8 hours 5 minutes 30 (68.1) 5 (11.4) 4 (9.1) 0 5 (11.4)
a Presentation to operation.
TABLE 28 Haselberger et al.11 study data comparing delay of > 2 hours with delay of < 2 hours
Delay GOS 5, n (%) GOS 4, n (%) GOS 3, n (%) GOS 2, n GOS 1, n (%)
< 2 hours 6 (33.3) 6 (33.3) 3 (16.7) 0 3 (16.7)
> 2 hours 1 (6.7) 1 (6.7) 4 (26.7) 0 9 (60.0)
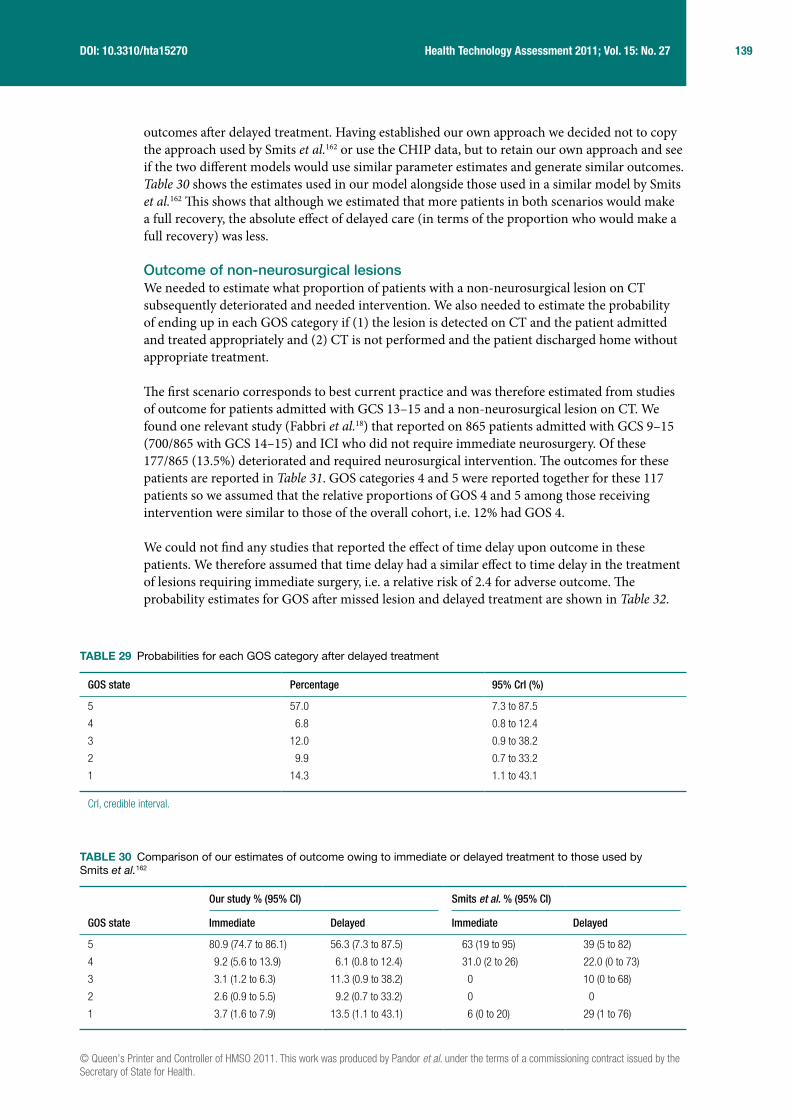
© Queen’s Printer and Controller of HMSO 2011. This work was produced by Pandor et al. under the terms of a commissioning contract issued by the Secretary of State for Health.
139 Health Technology Assessment 2011; Vol. 15: No. 27DOI: 10.3310/hta15270
outcomes after delayed treatment. Having established our own approach we decided not to copy the approach used by Smits et al.162 or use the CHIP data, but to retain our own approach and see if the two different models would use similar parameter estimates and generate similar outcomes. Table 30 shows the estimates used in our model alongside those used in a similar model by Smits et al.162 This shows that although we estimated that more patients in both scenarios would make a full recovery, the absolute effect of delayed care (in terms of the proportion who would make a full recovery) was less.
Outcome of non-neurosurgical lesionsWe needed to estimate what proportion of patients with a non-neurosurgical lesion on CT subsequently deteriorated and needed intervention. We also needed to estimate the probability of ending up in each GOS category if (1) the lesion is detected on CT and the patient admitted and treated appropriately and (2) CT is not performed and the patient discharged home without appropriate treatment.
The first scenario corresponds to best current practice and was therefore estimated from studies of outcome for patients admitted with GCS 13–15 and a non-neurosurgical lesion on CT. We found one relevant study (Fabbri et al.18) that reported on 865 patients admitted with GCS 9–15 (700/865 with GCS 14–15) and ICI who did not require immediate neurosurgery. Of these 177/865 (13.5%) deteriorated and required neurosurgical intervention. The outcomes for these patients are reported in Table 31. GOS categories 4 and 5 were reported together for these 117 patients so we assumed that the relative proportions of GOS 4 and 5 among those receiving intervention were similar to those of the overall cohort, i.e. 12% had GOS 4.
We could not find any studies that reported the effect of time delay upon outcome in these patients. We therefore assumed that time delay had a similar effect to time delay in the treatment of lesions requiring immediate surgery, i.e. a relative risk of 2.4 for adverse outcome. The probability estimates for GOS after missed lesion and delayed treatment are shown in Table 32.
TABLE 29 Probabilities for each GOS category after delayed treatment
GOS state Percentage 95% CrI (%)
5 57.0 7.3 to 87.5
4 6.8 0.8 to 12.4
3 12.0 0.9 to 38.2
2 9.9 0.7 to 33.2
1 14.3 1.1 to 43.1
CrI, credible interval.
TABLE 30 Comparison of our estimates of outcome owing to immediate or delayed treatment to those used by Smits et al.162
GOS state
Our study % (95% CI) Smits et al. % (95% CI)
Immediate Delayed Immediate Delayed
5 80.9 (74.7 to 86.1) 56.3 (7.3 to 87.5) 63 (19 to 95) 39 (5 to 82)
4 9.2 (5.6 to 13.9) 6.1 (0.8 to 12.4) 31.0 (2 to 26) 22.0 (0 to 73)
3 3.1 (1.2 to 6.3) 11.3 (0.9 to 38.2) 0 10 (0 to 68)
2 2.6 (0.9 to 5.5) 9.2 (0.7 to 33.2) 0 0
1 3.7 (1.6 to 7.9) 13.5 (1.1 to 43.1) 6 (0 to 20) 29 (1 to 76)

140 Assessment of cost-effectiveness evidence
Most patients with non-neurosurgical lesions do not deteriorate, but these patients could potentially benefit from hospital admission if this allowed structured provision of information and planning of follow-up. We searched the literature to identify studies that estimated the benefit of such an intervention. A systematic review to examine the evidence for non-surgical intervention following mild TBI revealed only 16 acceptable studies.14 The authors concluded that the evidence supported a minimal educational strategy and encouragement of early return to normal activity. Routine use of intensive assessment and intervention did not improve outcomes when compared with simple interventions. In particular, there was no evidence that hospital admission was any better or worse in the prediction of adverse outcomes in this group. The most efficient and effective intervention was explanation and education for the patient about expected symptoms, but no figures for degree of effect are quoted. We therefore assumed that patients with non-neurosurgical lesions who did not deteriorate did not benefit from detection of their lesion or hospital admission.
Modelling methodologyA decision tree model was developed using Simul8 Professional software (Simul8 Corporation, Boston, MA, USA) to explore the costs and health outcomes associated with a MHI. The analysis was conducted for patients aged 1, 10, 40 and 75 years when presenting to the ED. The model takes a lifetime horizon, with mean life expectancy based on UK interim life tables.170 The analysis did not consider males and females separately. The economic perspective of the model is the NHS in England and Wales. Figure 21 shows the treatment pathways in the model.
Baseline and comparator decision rulesThe decision rules evaluated in adults were ‘CT all’ (theoretical), ‘abnormal arrival’ GCS (theoretical), CCHR (high risk),26 CCHR (high or medium risk),26 NCWFNS,72 NOC,27 NEXUS II,62 NICE1 and Scandinavian.73 The decision rules evaluated in children were ‘CT all’ (theoretical), CHALICE,30 PECARN,90 UCD93 and the rule of Atabaki et al. 2008.81
Movement between Glasgow Outcome Score states over timeA literature review was conducted to identify studies that investigated progression and regression between GOS states over time. One study was found: Whitnall et al.171 determined the outcomes at 5–7 years compared with outcomes at 1 year of a cohort of patients (n = 219) admitted to
TABLE 31 Glasgow Outcome Score outcomes for non-neurosurgical lesions treated appropriately
GOS state n Percentage 95% CI (%)
5 95/117 81.2 73.2 to 87.2
4 13/117 11.1 6.6 to 18.1
3 8/117 6.8 3.5 to 12.9
2 0/117 0. 0 to 3.2
1 1/117 0.9 0.2 to 4.7
TABLE 32 Glasgow Outcome Score outcomes for delayed treatment
GOS state Point estimate (%) 95% CI (%)
5 55.96 7.2 to 85.8
4 8.26 1.0 to 15.7
3 27.66 2.1 to 74.1
2 2.66 0 to 15.8
1 5.46 0.2 to 24.7
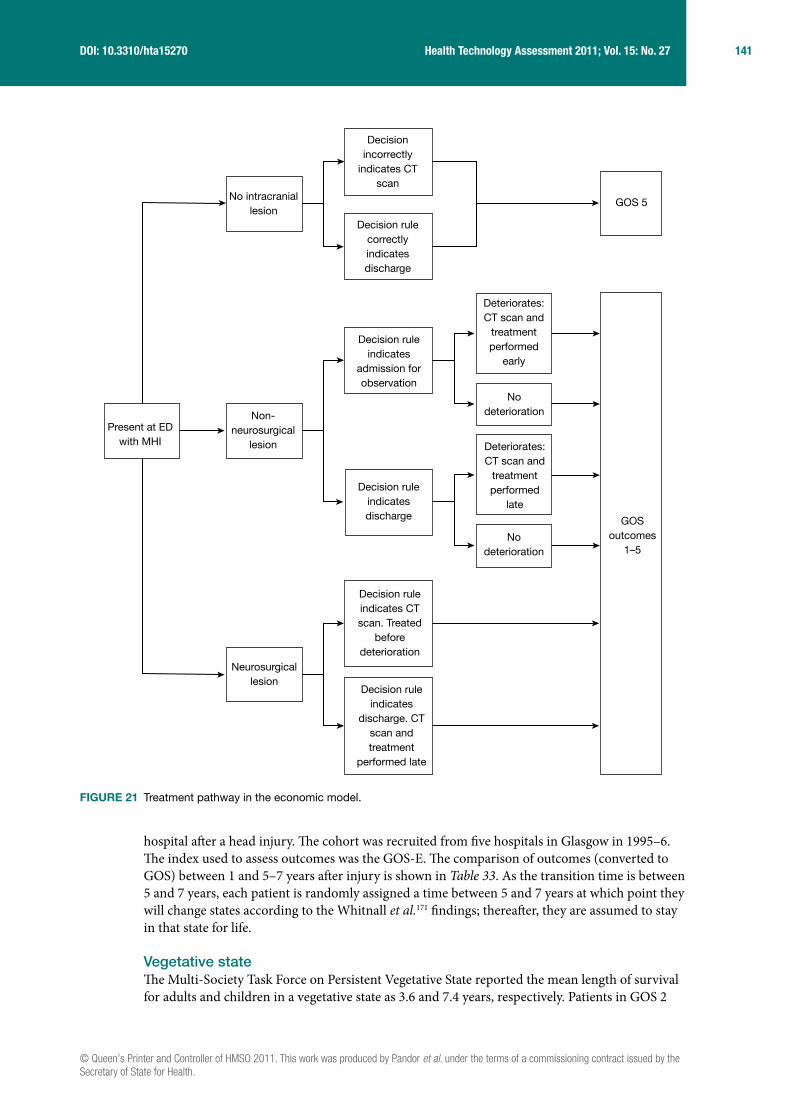
© Queen’s Printer and Controller of HMSO 2011. This work was produced by Pandor et al. under the terms of a commissioning contract issued by the Secretary of State for Health.
141 Health Technology Assessment 2011; Vol. 15: No. 27DOI: 10.3310/hta15270
hospital after a head injury. The cohort was recruited from five hospitals in Glasgow in 1995–6. The index used to assess outcomes was the GOS-E. The comparison of outcomes (converted to GOS) between 1 and 5–7 years after injury is shown in Table 33. As the transition time is between 5 and 7 years, each patient is randomly assigned a time between 5 and 7 years at which point they will change states according to the Whitnall et al.171 findings; thereafter, they are assumed to stay in that state for life.
Vegetative stateThe Multi-Society Task Force on Persistent Vegetative State reported the mean length of survival for adults and children in a vegetative state as 3.6 and 7.4 years, respectively. Patients in GOS 2
Decisionincorrectly
indicates CTscan
Decision rulecorrectlyindicatesdischarge
Decision ruleindicatesdischarge
Decision ruleindicates CTscan. Treated
beforedeterioration
Neurosurgicallesion
Decision ruleindicates
discharge. CTscan andtreatment
performed late
Decision ruleindicates
admission forobservation
Nodeterioration
GOSoutcomes
1–5
GOS 5No intracranial
lesion
Present at EDwith MHI
Non-neurosurgical
lesion
Deteriorates:CT scan and
treatmentperformed
early
Deteriorates:CT scan and
treatmentperformed
late
Nodeterioration
FIGURE 21 Treatment pathway in the economic model.

142 Assessment of cost-effectiveness evidence
accrued the costs associated with a vegetative state for this length of time and were then assumed to have died. The QoL associated with a vegetative state in our model is zero.
CostsCosts included in the model are the direct costs of diagnostic management including the costs of investigation, including CT scanning, and the subsequent costs of providing neurosurgical treatment and intensive care. A literature review was conducted to find costs for patients whose outcomes are represented by GOS states 2–5. Only one study was found. This study by the Personal Social Services Research Unit172 (PSSRU) aimed to identify the health and social care services used by young adults aged 18–25 years with acquired brain injury. The study used literature reviews, surveys and expert opinion to identify the annual incidence of acquired brain injury and then estimated likely pathways of care over a notional 12-month period. The study estimated average costs per person in four groups of patients, which correspond closely to the descriptions of GOS scores 3–5. As acknowledged in the above study, there is a ‘dearth of literature’ in this area and we have been unable to find any cost data for children or older people and have therefore assumed that the costs are the same as for age 18–25 years. The effect of differential cost by age will be tested in the sensitivity analysis. No cost data were found for patients in a vegetative state. We have, therefore, based our estimates on expert opinion.173 This estimate is based on 2 weeks in intensive care, followed by 4 months of rehabilitation and then transfer to a nursing home for the rest of the patient’s life. No nursing home care cost for children is available in the PSSRU Unit Costs of Health and Social Care 2009 and we have, therefore, assumed it is the same as for adults. Gamma distributions were used for all costs in the PSA.
Costs were discounted at an annual rate of 3.5% and were varied between 0% and 6% in the sensitivity analysis, as recommended by the NICE guide to the methods of technology appraisal).182 Costs used in the model are shown in Table 34.
Quality-of-life utility valuesA literature review was conducted to identify studies that estimated utility values for GOS scores. Two studies were found: Smits et al.162 obtained long-term GOS outcomes and QoL scores using the EQ-5D questionnaire from a subset of patients from the study of CT in head injury patients.166 These were converted to utility scores and reported in the publication. QoL data were available for 87 patients. Aoki and Kitahara165 used standard gamble methods to elicit QoL utilities for GOS states 2–5 from 140 members of staff and students at a hospital in Japan.
These studies were assessed for methodological compliance with the NICE reference case, which stipulates that utilities should be measured in patients using a generic and validated classification system for which reliable UK population reference values, elicited using a choice-based method
TABLE 33 Comparison of GOS outcome between 1 and 5–7 years after injury171
GOS state at 1 year
GOS at follow-up years 5–7 (%)
1 2 3 4 5
1 NA NA NA NA NA
2 100 0 0 0 0
3 46 0 31 16 7
4 30 0 6 41 23
5 28 0 4 14 54
NA, not applicable.
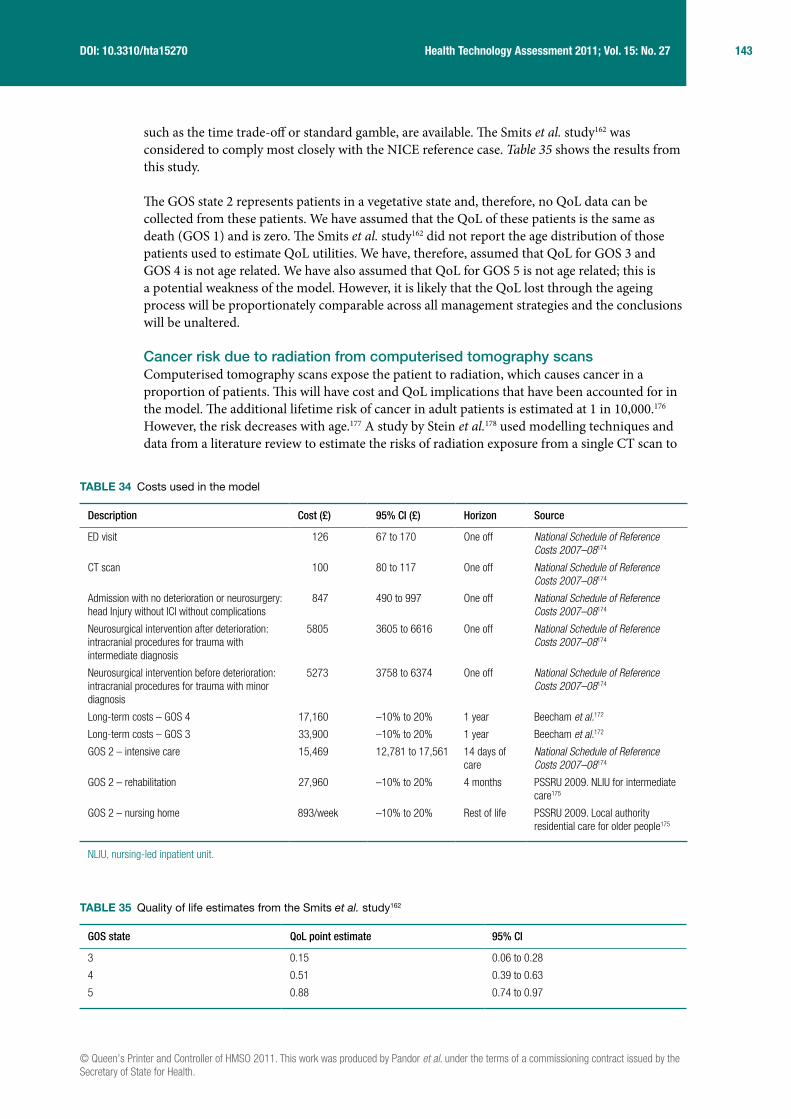
© Queen’s Printer and Controller of HMSO 2011. This work was produced by Pandor et al. under the terms of a commissioning contract issued by the Secretary of State for Health.
143 Health Technology Assessment 2011; Vol. 15: No. 27DOI: 10.3310/hta15270
such as the time trade-off or standard gamble, are available. The Smits et al. study162 was considered to comply most closely with the NICE reference case. Table 35 shows the results from this study.
The GOS state 2 represents patients in a vegetative state and, therefore, no QoL data can be collected from these patients. We have assumed that the QoL of these patients is the same as death (GOS 1) and is zero. The Smits et al. study162 did not report the age distribution of those patients used to estimate QoL utilities. We have, therefore, assumed that QoL for GOS 3 and GOS 4 is not age related. We have also assumed that QoL for GOS 5 is not age related; this is a potential weakness of the model. However, it is likely that the QoL lost through the ageing process will be proportionately comparable across all management strategies and the conclusions will be unaltered.
Cancer risk due to radiation from computerised tomography scansComputerised tomography scans expose the patient to radiation, which causes cancer in a proportion of patients. This will have cost and QoL implications that have been accounted for in the model. The additional lifetime risk of cancer in adult patients is estimated at 1 in 10,000.176 However, the risk decreases with age.177 A study by Stein et al.178 used modelling techniques and data from a literature review to estimate the risks of radiation exposure from a single CT scan to
TABLE 34 Costs used in the model
Description Cost (£) 95% CI (£) Horizon Source
ED visit 126 67 to 170 One off National Schedule of Reference Costs 2007–08174
CT scan 100 80 to 117 One off National Schedule of Reference Costs 2007–08174
Admission with no deterioration or neurosurgery: head Injury without ICI without complications
847 490 to 997 One off National Schedule of Reference Costs 2007–08174
Neurosurgical intervention after deterioration: intracranial procedures for trauma with intermediate diagnosis
5805 3605 to 6616 One off National Schedule of Reference Costs 2007–08174
Neurosurgical intervention before deterioration: intracranial procedures for trauma with minor diagnosis
5273 3758 to 6374 One off National Schedule of Reference Costs 2007–08174
Long-term costs – GOS 4 17,160 –10% to 20% 1 year Beecham et al.172
Long-term costs – GOS 3 33,900 –10% to 20% 1 year Beecham et al.172
GOS 2 – intensive care 15,469 12,781 to 17,561 14 days of care
National Schedule of Reference Costs 2007–08174
GOS 2 – rehabilitation 27,960 –10% to 20% 4 months PSSRU 2009. NLIU for intermediate care175
GOS 2 – nursing home 893/week –10% to 20% Rest of life PSSRU 2009. Local authority residential care for older people175
NLIU, nursing-led inpatient unit.
TABLE 35 Quality of life estimates from the Smits et al. study162
GOS state QoL point estimate 95% CI
3 0.15 0.06 to 0.28
4 0.51 0.39 to 0.63
5 0.88 0.74 to 0.97
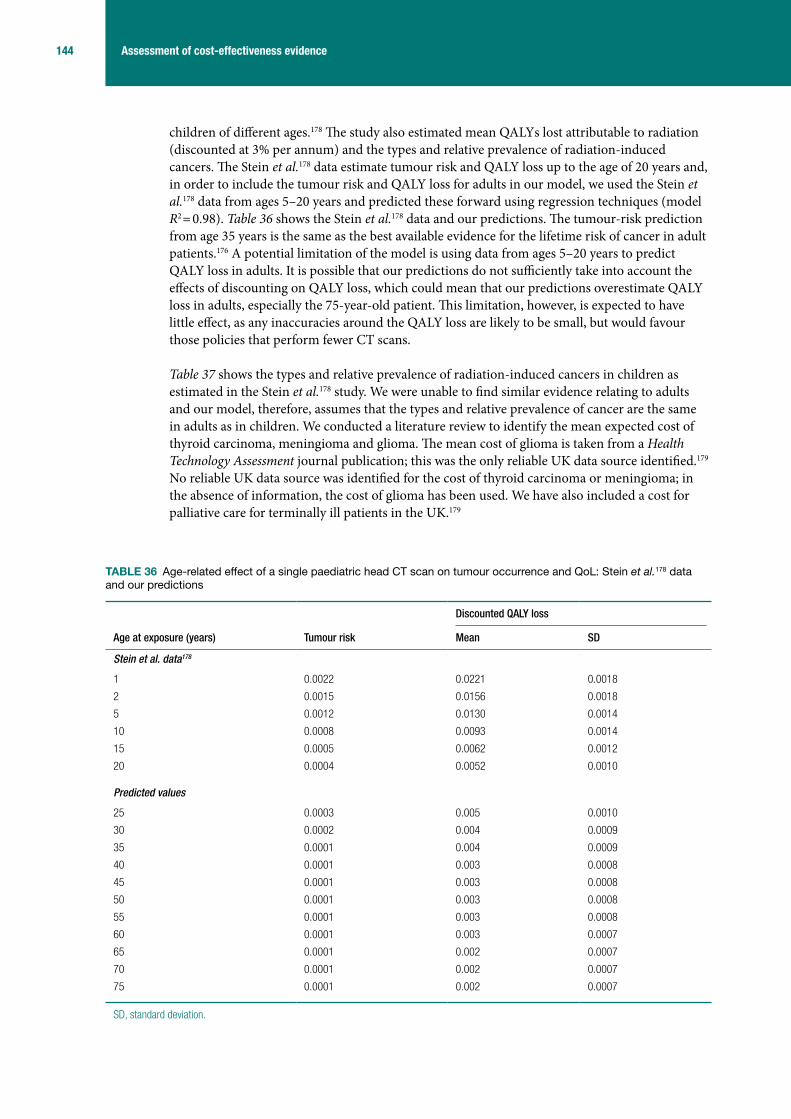
144 Assessment of cost-effectiveness evidence
children of different ages.178 The study also estimated mean QALYs lost attributable to radiation (discounted at 3% per annum) and the types and relative prevalence of radiation-induced cancers. The Stein et al.178 data estimate tumour risk and QALY loss up to the age of 20 years and, in order to include the tumour risk and QALY loss for adults in our model, we used the Stein et al.178 data from ages 5–20 years and predicted these forward using regression techniques (model R2 = 0.98). Table 36 shows the Stein et al.178 data and our predictions. The tumour-risk prediction from age 35 years is the same as the best available evidence for the lifetime risk of cancer in adult patients.176 A potential limitation of the model is using data from ages 5–20 years to predict QALY loss in adults. It is possible that our predictions do not sufficiently take into account the effects of discounting on QALY loss, which could mean that our predictions overestimate QALY loss in adults, especially the 75-year-old patient. This limitation, however, is expected to have little effect, as any inaccuracies around the QALY loss are likely to be small, but would favour those policies that perform fewer CT scans.
Table 37 shows the types and relative prevalence of radiation-induced cancers in children as estimated in the Stein et al.178 study. We were unable to find similar evidence relating to adults and our model, therefore, assumes that the types and relative prevalence of cancer are the same in adults as in children. We conducted a literature review to identify the mean expected cost of thyroid carcinoma, meningioma and glioma. The mean cost of glioma is taken from a Health Technology Assessment journal publication; this was the only reliable UK data source identified.179 No reliable UK data source was identified for the cost of thyroid carcinoma or meningioma; in the absence of information, the cost of glioma has been used. We have also included a cost for palliative care for terminally ill patients in the UK.179
TABLE 36 Age-related effect of a single paediatric head CT scan on tumour occurrence and QoL: Stein et al.178 data and our predictions
Age at exposure (years) Tumour risk
Discounted QALY loss
Mean SD
Stein et al. data178
1 0.0022 0.0221 0.0018
2 0.0015 0.0156 0.0018
5 0.0012 0.0130 0.0014
10 0.0008 0.0093 0.0014
15 0.0005 0.0062 0.0012
20 0.0004 0.0052 0.0010
Predicted values
25 0.0003 0.005 0.0010
30 0.0002 0.004 0.0009
35 0.0001 0.004 0.0009
40 0.0001 0.003 0.0008
45 0.0001 0.003 0.0008
50 0.0001 0.003 0.0008
55 0.0001 0.003 0.0008
60 0.0001 0.003 0.0007
65 0.0001 0.002 0.0007
70 0.0001 0.002 0.0007
75 0.0001 0.002 0.0007
SD, standard deviation.

© Queen’s Printer and Controller of HMSO 2011. This work was produced by Pandor et al. under the terms of a commissioning contract issued by the Secretary of State for Health.
145 Health Technology Assessment 2011; Vol. 15: No. 27DOI: 10.3310/hta15270
The cost of cancer for each person in the model is estimated by tumour risk × mean cost of cancer × number of scans received. The Stein et al.178 study reports that the latency between radiation exposure and tumour diagnosis is > 5 years in the majority of cases; based on this, we have assumed a mean latency period of 10 years and the cost of cancer is therefore discounted for this time period.
Transition probabilitiesTransition probabilities in the model are determined by the sensitivity and specificity of each decision rule. Further details are provided in Table 38 for adults and Tables 39 and 40 for children. Column ‘R’ denotes the row number for simplicity. ‘R1’ is the probability that a neurosurgical lesion is correctly identified; these patients receive prompt surgery. ‘R2’ is 1 – R1, these patients have an intracranial lesion and are discharged with a responsible adult. ‘R3’ is the probability that a non-neurosurgical lesion is correctly identified; these patients are admitted and those that deteriorate are given prompt treatment. ‘R4’ is 1 – R3; these patients are discharged and receive delayed treatment if they deteriorate. ‘R5’ is the probability that patients with no intracranial lesion are correctly identified and discharged. ‘R6’ is 1 – R5; these patients have an unnecessary CT scan. The transition probabilities for GOS outcomes are described above (see Glasgow Outcome Score categorisation).
Model stabilityThe number of patients in each model run determines the stability of the results for estimating the optimal management strategy. This instability is a result of some events having a rare occurrence and stability can only be achieved by having sufficient numbers of patients to account for these rare events. With < 100,000 patients the model results were unstable in as far as the optimal management strategy would sometimes differ. With ≥ 100,000 patients in the model run, the optimal strategy was unchanged for all age groups despite the same input data.
ResultsDeterministic resultsAdult aged 40 yearsTable 41 shows the mean costs and QALYs per patient according to whether or not the patient had an intracranial lesion, and then all cases combined. Costs and QALYs for patients with an intracranial lesion were determined by the sensitivity of the strategy for detecting lesions. Higher sensitivity was associated with higher QALYs and lower costs, the latter being due to the costs of care for those with GOS 2–4. Costs and QALYs for patients without an intracranial lesion were determined by the specificity of the strategy. Higher specificity was associated with lower costs and higher QALYs, the latter due to the effect of radiation exposure (the fewer CT scans performed, the less the radiation exposure and associated QALY loss).
Variation in specificity between the strategies leads to only small differences in the mean cost per patient for those with no intracranial lesion (about £100 per patient difference between the
TABLE 37 Types, relative prevalence and costs of radiation-induced cancers in children estimated in the Stein et al.178 study, with costs from Garside et al.179
Cancer type Relative incidence Cost (£) Assumed lower and upper bounds
Thyroid carcinoma 0.47 23,651 ± 10%
Meningioma 0.35 23,651 ± 10%
Glioma 0.19 23,651 ± 10%
Cost of palliative care 3087 ± 10%
Overall cost of cancer 26,738 ± 10%

146 Assessment of cost-effectiveness evidence
TAB
LE 3
8 S
ensi
tivity
and
spe
cific
ity o
f adu
lt C
T de
cisi
on r
ules
a
RTy
pe o
f sen
sitiv
ity o
r sp
ecifi
city
Prob
abili
ty o
f sen
sitiv
ity o
r spe
cific
ity o
f eac
h st
rate
gy (9
5% C
I)
Disc
harg
e al
l
CT a
ll, a
dmit
posi
tive,
dis
char
ge
nega
tive
Abno
rmal
ar
rival
GCS
CCHR
(hig
h ris
k)26
CCHR
(hig
h or
med
ium
ris
k)26
NCW
FNS72
NOC27
NEXU
S II62
NICE
1Sc
andi
navi
an73
1St
rate
gy s
ensi
tivity
for
NS in
jury
01
0.91
(0.8
4 to
0.9
5)
0.99
(0.9
4 to
1.0
0)
0.99
(0.9
4 to
1.0
0)
0.99
(0.9
4 to
1.0
0)
0.99
(0.9
4 to
1.0
0)
1.00
(0.9
7 to
1.0
0)
0.98
(0.9
3 to
1.0
0)
0.99
(0.9
4 to
1.0
0)
21
– se
nsiti
vity
for N
S in
jury
10
0.09
0.01
0.01
0.01
0.01
0.00
0.02
0.01
3St
rate
gy s
ensi
tivity
for
NNS
inju
ry0
10.
72
(0.6
8 to
0.7
6)
0.97
(0.9
4 to
0.9
8)
0.99
(0.9
7 to
1.0
0)
0.95
(0.9
3 to
0.9
7)
0.99
(0.9
7 to
1.0
0)
0.97
(0.9
4 to
0.9
8)
1.00
(0.9
9 to
1.0
0)
0.95
(0.9
2 to
0.9
7)
41
– se
nsiti
vity
for N
NS
inju
ry1
00.
280.
030.
010.
050.
010.
030.
000.
05
5St
rate
gy s
peci
ficity
10
0.97
(0.9
6 to
0.9
8)
0.51
(0.4
9 to
0.5
2)
0.47
(0.4
6 to
0.4
8)
0.47
(0.4
6 to
0.4
8)
0.33
(0.3
2 to
0.3
4)
0.47
(0.4
6 to
0.4
8)
0.31
(0.3
0 to
0.3
2)
0.53
(0.5
2 to
0.5
4)
61
– sp
ecifi
city
01
0.03
0.49
0.53
0.53
0.67
0.53
0.69
0.47
NNS,
non
-neu
rosu
rgic
al; N
S, n
euro
surg
ical
; R, r
ow n
umbe
r.a
All e
stim
ates
hav
e be
en e
xtra
cted
from
Ste
in e
t al.18
0
Beta
dis
tribu
tions
wer
e us
ed in
the
PSA
anal
ysis
for a
ll pa
ram
eter
s.

© Queen’s Printer and Controller of HMSO 2011. This work was produced by Pandor et al. under the terms of a commissioning contract issued by the Secretary of State for Health.
147 Health Technology Assessment 2011; Vol. 15: No. 27DOI: 10.3310/hta15270
cheapest and most expensive) compared with the cost differences between those with intracranial lesion associated with variation in sensitivity (> £6000 per patient difference). This reflects the modest cost of CT scanning compared with the substantial costs of long-term care. Similarly, the QALY differences associated with variation in specificity are small (range of 0.0034 QALYs) compared with the QALY differences associated with variation in sensitivity (range of 0.3540 QALYs). These observations mean that when all patients are examined together, sensitivity is a greater determinant of both costs and QALYs, despite the relatively low prevalence of ICI. However, the increased costs and reduced QALYs observed in patients with no intracranial lesion with the ‘CT all’ strategy are still significant enough to reduce the cost-effectiveness of this strategy compared with more selective strategies.
TABLE 39 Sensitivity and specificity of children’s CT decision rules: derivation data
RType of sensitivity or specificity
Probability of sensitivity or specificity of each strategy (95% CI)
Discharge all
CT all, admit positive, discharge negative CHALICE30 PECARN90
Atabaki et al. 200881 UCD93
1 Strategy sensitivity for NS injury
0 1 134/137
0.98 (0.94 to 0.99)
41/41
1.00 (0.91 to 1.00)
6/6
1.00 (0.61 to 1.00)
29/29
1.00 (0.88 to 1.00)
2 1 – sensitivity for NS injury
1 0 3/137
0.02
0/41
0.00
0/6
0.00
0/29
0.00
3 Strategy sensitivity for NNS injury
0 1 142/143
0.99 (0.96 to 1.00)
228/237
0.96 (0.93 to 0.98)
56/59
0.95 (0.86 to 0.98)
97/98
0.99 (0.94 to 0.99)
4 1 – sensitivity for NNS injury
1 0 1/143
0.01
9/237
0.04
3/59
0.05
1/98
0.01
5 Strategy specificity 1 0 19,558/22,491
0.87 (0.86 to 0.88)
18,454/31,416
0.59 (0.58 to 0.60)
457/935
0.49 (0.46 to 0.52)
827/1938
0.43 (0.40 to 0.45)
6 1 – specificity 0 1 2933/22,491
0.13
12,871/31,416
0.41
478/935
0.51
1111/1938
0.57
NNS, non-neurosurgical; NS, neurosurgical.Beta distributions were used in the PSA analysis for all parameters.
TABLE 40 Sensitivity and specificity of children’s CT decision rules: validation dataa
R Type of sensitivity or specificity
Probability of sensitivity or specificity of each strategy (95% CI)
Discharge allCT all, admit positive, discharge negative CHALICE30 NEXUS II62 UCD93
1 Strategy sensitivity for NS injury 0 1 1.00
(0.88–1.00)
1.00
(0.88–1.00)
1.00
(0.88–1.00)
2 1 – sensitivity for NS injury 1 0 0.00 0.00 0.00
3 Strategy sensitivity for NNS injury 0 1 0.98
(0.92–1.00)
0.96
(0.93–1.00)
0.99
(0.93–1.00)
4 1 – sensitivity for NNS injury 1 0 0.02 0.04 0.01
5 Strategy specificity 1 1 0.05
(0.03–0.07)
0.21
(0.17–0.26)
0.12
(0.09–0.16)
6 1 – specificity 0 0 0.95 0.79 0.88
NNS, non-neurosurgical; NS, neurosurgical.a All estimates from Klemetti et al.89
Beta distributions were used in the PSA analysis for all parameters.

148 Assessment of cost-effectiveness evidence
Table 42 shows the strategies ordered by ascending effectiveness (QALYs gained) and reports whether or not they are dominated by a cheaper and more effective strategy or subject to extended dominance. Where a strategy is neither dominated nor extendedly dominated an ICER is reported. The theoretical strategies (‘discharge all’, ‘CT all’ and ‘CT only if abnormal GCS’) are all clearly dominated, confirming that selective CT use based upon sensitive decision rules is likely to represent a cost-effective use of health-care resources. The NCWFNS,72 NICE,1 CCHR26 (high risk) and NOC27 strategies were all dominated. The NEXUS II62 strategy was extendedly dominated by the Scandinavian73 and CCHR26 (high or medium risk) strategies. The CCHR26 (with CT for high- and medium-risk cases) is the most cost-effective on deterministic analysis, although the differences in mean costs and QALYs between the various rules were small and determined by differences in point estimates for sensitivity that were not statistically significant in the primary data.
Adult aged 75 yearsTable 43 reports the main deterministic analysis for an adult aged 75 years. Mean QALYs and mean costs are both lower than in the analysis for a 40-year-old adult, reflecting reduced life expectancy, and thus reduced long-term costs and QALYs. However, long-term costs of care for patients with GOS 2–4 remain the main cost driver and the QALY gain from accurate identification of intracranial lesion still outweighs the proportionately reduced QALY loss from irradiation. The CCHR, therefore, remains the most cost-effective, with the theoretical strategies clearly dominated.
Child aged 10 yearsTable 44 reports the mean costs and QALYs for a child aged 10 years ‘with an intracranial lesion’, ‘without’ and ‘all patients’. Mean costs and QALYs are generally higher, reflecting longer life expectancy. However, the variation in the differences in mean costs and QALYs are only moderately greater than the variation observed in the adult case, owing to the effect of discounting. The variation in costs and QALYs for those with an intracranial lesion is again much greater than the variation in those without an intracranial lesion. So, although the potential effect of irradiation in children is greater than in adults, the costs and QALYs lost by misdiagnosis of intracranial lesion are correspondingly increased. The CHALICE30 rule dominates the other strategies by virtue of gaining more QALYs with lower costs.
TABLE 41 Mean costs and QALYs for adult aged 40 years
Strategy
Intracranial lesion No intracranial lesion All patients
Mean costs (£) Mean QALYs Mean costs (£) Mean QALYs Mean costs (£) Mean QALYs
Discharge all 41,795 12.699 126 19.1560 3305 18.6633
NICE1 35,930 13.052 196 19.1537 2923 18.6881
CT all 35,972 13.047 228 19.1526 2955 18.6868
Abnormal arrival GCS 37,635 12.970 129 19.1559 2991 18.6839
CCHR (high risk)26 36,113 13.045 176 19.1543 2918 18.6882
CCHR (high or medium risk)26 35,946 13.055 180 19.1542 2909 18.6888
NCWFNS72 35,974 13.041 180 19.1542 2911 18.6878
NOC27 35,946 13.055 194 19.1537 2922 18.6884
NEXUS II62 35,937 13.045 180 19.1542 2908 18.6880
Scandinavian73 35,974 13.041 174 19.1544 2905 18.6880
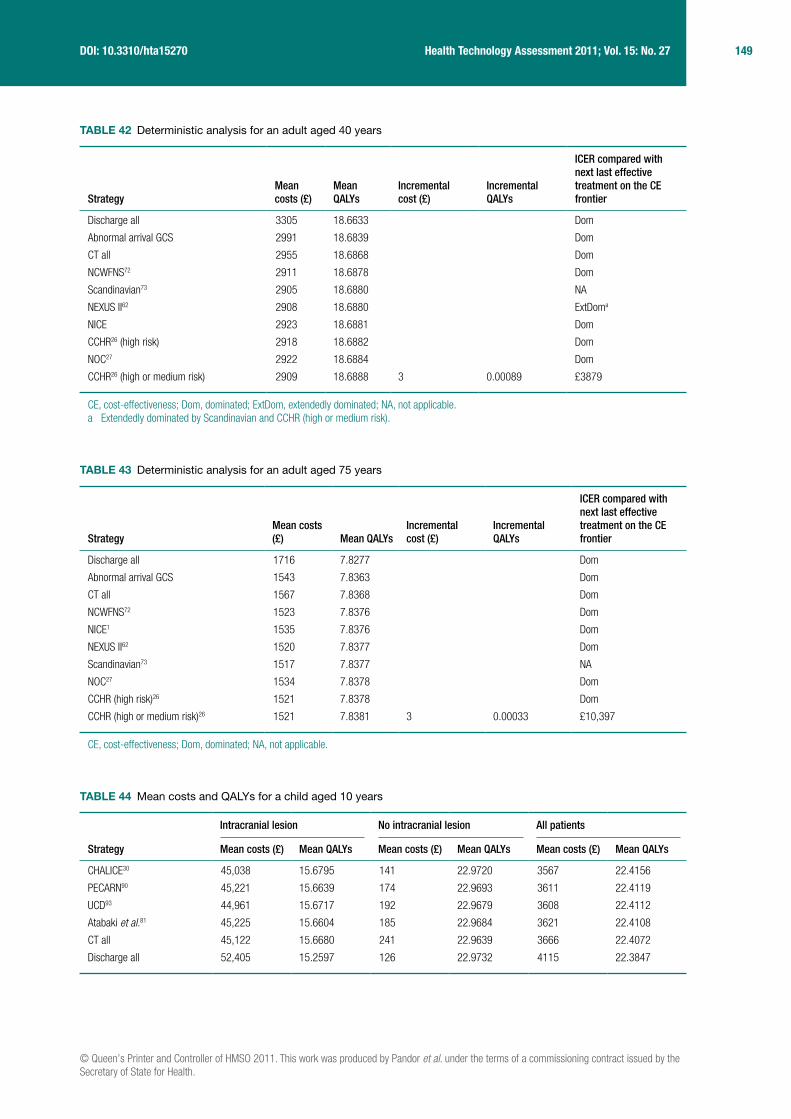
© Queen’s Printer and Controller of HMSO 2011. This work was produced by Pandor et al. under the terms of a commissioning contract issued by the Secretary of State for Health.
149 Health Technology Assessment 2011; Vol. 15: No. 27DOI: 10.3310/hta15270
TABLE 42 Deterministic analysis for an adult aged 40 years
StrategyMean costs (£)
Mean QALYs
Incremental cost (£)
Incremental QALYs
ICER compared with next last effective treatment on the CE frontier
Discharge all 3305 18.6633 Dom
Abnormal arrival GCS 2991 18.6839 Dom
CT all 2955 18.6868 Dom
NCWFNS72 2911 18.6878 Dom
Scandinavian73 2905 18.6880 NA
NEXUS II62 2908 18.6880 ExtDoma
NICE 2923 18.6881 Dom
CCHR26 (high risk) 2918 18.6882 Dom
NOC27 2922 18.6884 Dom
CCHR26 (high or medium risk) 2909 18.6888 3 0.00089 £3879
CE, cost-effectiveness; Dom, dominated; ExtDom, extendedly dominated; NA, not applicable.a Extendedly dominated by Scandinavian and CCHR (high or medium risk).
TABLE 43 Deterministic analysis for an adult aged 75 years
StrategyMean costs (£) Mean QALYs
Incremental cost (£)
Incremental QALYs
ICER compared with next last effective treatment on the CE frontier
Discharge all 1716 7.8277 Dom
Abnormal arrival GCS 1543 7.8363 Dom
CT all 1567 7.8368 Dom
NCWFNS72 1523 7.8376 Dom
NICE1 1535 7.8376 Dom
NEXUS II62 1520 7.8377 Dom
Scandinavian73 1517 7.8377 NA
NOC27 1534 7.8378 Dom
CCHR (high risk)26 1521 7.8378 Dom
CCHR (high or medium risk)26 1521 7.8381 3 0.00033 £10,397
CE, cost-effectiveness; Dom, dominated; NA, not applicable.
TABLE 44 Mean costs and QALYs for a child aged 10 years
Strategy
Intracranial lesion No intracranial lesion All patients
Mean costs (£) Mean QALYs Mean costs (£) Mean QALYs Mean costs (£) Mean QALYs
CHALICE30 45,038 15.6795 141 22.9720 3567 22.4156
PECARN90 45,221 15.6639 174 22.9693 3611 22.4119
UCD93 44,961 15.6717 192 22.9679 3608 22.4112
Atabaki et al.81 45,225 15.6604 185 22.9684 3621 22.4108
CT all 45,122 15.6680 241 22.9639 3666 22.4072
Discharge all 52,405 15.2597 126 22.9732 4115 22.3847
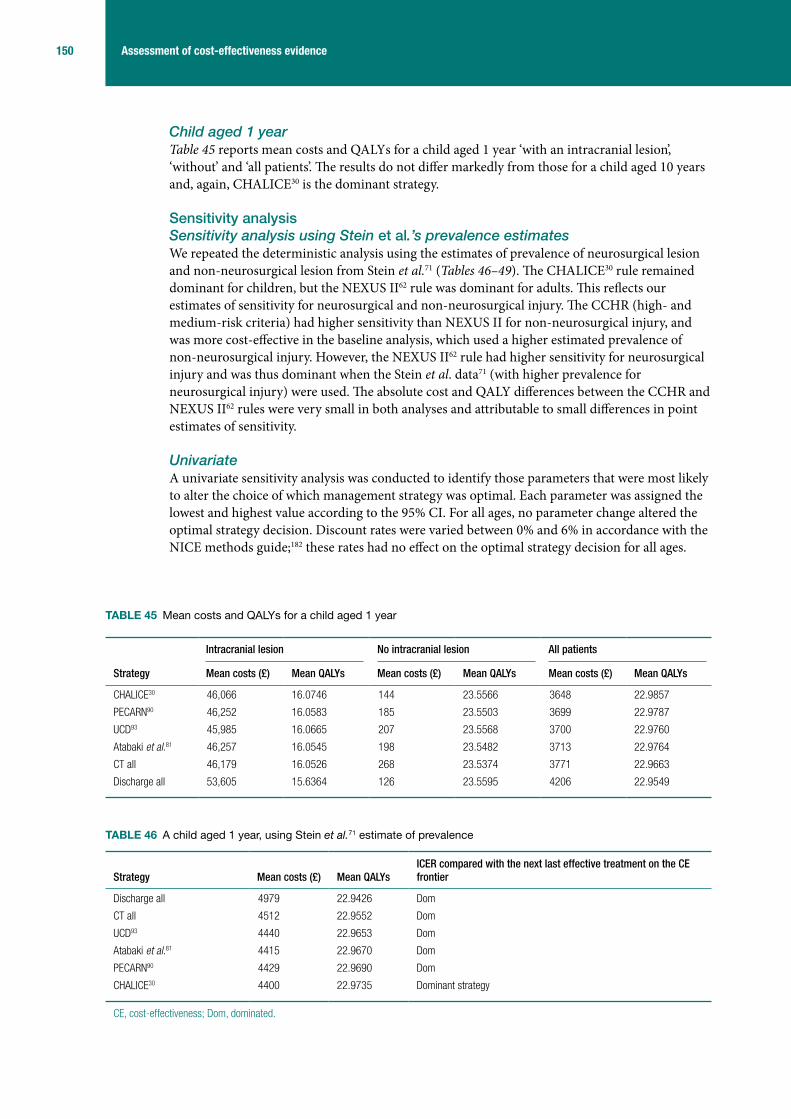
150 Assessment of cost-effectiveness evidence
Child aged 1 yearTable 45 reports mean costs and QALYs for a child aged 1 year ‘with an intracranial lesion’, ‘without’ and ‘all patients’. The results do not differ markedly from those for a child aged 10 years and, again, CHALICE30 is the dominant strategy.
Sensitivity analysisSensitivity analysis using Stein et al.’s prevalence estimatesWe repeated the deterministic analysis using the estimates of prevalence of neurosurgical lesion and non-neurosurgical lesion from Stein et al.71 (Tables 46–49). The CHALICE30 rule remained dominant for children, but the NEXUS II62 rule was dominant for adults. This reflects our estimates of sensitivity for neurosurgical and non-neurosurgical injury. The CCHR (high- and medium-risk criteria) had higher sensitivity than NEXUS II for non-neurosurgical injury, and was more cost-effective in the baseline analysis, which used a higher estimated prevalence of non-neurosurgical injury. However, the NEXUS II62 rule had higher sensitivity for neurosurgical injury and was thus dominant when the Stein et al. data71 (with higher prevalence for neurosurgical injury) were used. The absolute cost and QALY differences between the CCHR and NEXUS II62 rules were very small in both analyses and attributable to small differences in point estimates of sensitivity.
UnivariateA univariate sensitivity analysis was conducted to identify those parameters that were most likely to alter the choice of which management strategy was optimal. Each parameter was assigned the lowest and highest value according to the 95% CI. For all ages, no parameter change altered the optimal strategy decision. Discount rates were varied between 0% and 6% in accordance with the NICE methods guide;182 these rates had no effect on the optimal strategy decision for all ages.
TABLE 45 Mean costs and QALYs for a child aged 1 year
Strategy
Intracranial lesion No intracranial lesion All patients
Mean costs (£) Mean QALYs Mean costs (£) Mean QALYs Mean costs (£) Mean QALYs
CHALICE30 46,066 16.0746 144 23.5566 3648 22.9857
PECARN90 46,252 16.0583 185 23.5503 3699 22.9787
UCD93 45,985 16.0665 207 23.5568 3700 22.9760
Atabaki et al.81 46,257 16.0545 198 23.5482 3713 22.9764
CT all 46,179 16.0526 268 23.5374 3771 22.9663
Discharge all 53,605 15.6364 126 23.5595 4206 22.9549
TABLE 46 A child aged 1 year, using Stein et al.71 estimate of prevalence
Strategy Mean costs (£) Mean QALYsICER compared with the next last effective treatment on the CE frontier
Discharge all 4979 22.9426 Dom
CT all 4512 22.9552 Dom
UCD93 4440 22.9653 Dom
Atabaki et al.81 4415 22.9670 Dom
PECARN90 4429 22.9690 Dom
CHALICE30 4400 22.9735 Dominant strategy
CE, cost-effectiveness; Dom, dominated.

© Queen’s Printer and Controller of HMSO 2011. This work was produced by Pandor et al. under the terms of a commissioning contract issued by the Secretary of State for Health.
151 Health Technology Assessment 2011; Vol. 15: No. 27DOI: 10.3310/hta15270
TABLE 47 A child aged 10 years, using Stein et al.71 estimate of prevalence
Strategy Mean costs (£) Mean QALYsICER compared with the next last effective treatment on the CE frontier
Discharge all 4874 22.3725 Dom
CT all 4393 22.3965 Dom
UCD93 4333 22.4009 Dom
Atabaki et al.81 4310 22.4019 Dom
PECARN90 4326 22.4027 Dom
CHALICE30 4304 22.4038 Dominant strategy
CE, cost-effectiveness; Dom, dominated.
TABLE 48 An adult aged 40 years, using Stein et al.71 estimate of prevalence
Strategy Mean costs (£) Mean QALYsICER compared with the next last effective treatment on the CE frontier
Discharge all 3757 18.6512 Dom
Abnormal arrival GCS 3394 18.6730 Dom
CT all 3391 18.6761 Dom
NOC27 3339 18.6774 Dom
CCHR (high risk)26 3346 18.6775 Dom
NICE1 3364 18.6775 Dom
CCHR (high or medium risk)26 3326 18.6778 Dom
NCWFNS72 3350 18.6778 Dom
Scandinavian73 3344 18.6780 Dom
NEXUS II62 3312 18.6783 Dominant strategy
CE, cost-effectiveness; Dom, dominated.
TABLE 49 An adult aged 75 years, using Stein et al.71 estimate of prevalence
Strategy Mean costs (£) Mean QALYsICER compared with the next last effective treatment on the CE frontier
Discharge all 1954 7.8226 Dom
Abnormal arrival GCS 1748 7.8318 Dom
CT all 1788 7.8323 Dom
NOC27 1746 7.8332 Dom
NICE1 1757 7.8332 Dom
CCHR (high risk)26 1739 7.8333 Dom
CCHR (high or medium risk)26 1732 7.8334 Dom
NCWFNS72 1743 7.8334 Dom
Scandinavian73 1738 7.8336 Dom
NEXUS II62 1727 7.8336 Dominant strategy
CE, cost-effectiveness; Dom, dominated.

152 Assessment of cost-effectiveness evidence
Sensitivity analysis using validation data for childrenWe repeated the deterministic analysis for children using data from the study that validated the NEXUS II,62 UCD93 and CHALICE30 rules.89 The results are shown for children aged 1 year (Table 50) and children aged 10 years (Table 51). All three rules dominate the ‘CT all’ and ‘discharge all’ strategies at both ages. The CHALICE30 rule is dominated by the NEXUS II62 and UCD93 rules. The NEXUS II62 rule is more effective and more expensive than the UCD rule93 with an ICER of £3363 per QALY in the age 1 year analysis and £7471 in the age 10 years analysis. Assuming a threshold for willingness to pay of £20,000 or 30,000 per QALY, the NEXUS II62 rule is optimal.
Probabilistic sensitivity analysisTable 52 shows the parameters and distributions used in the PSA.
Probabilistic sensitivity analysis resultsTables 53–56 show the mean PSA values for ages 1, 10, 40 and 75 years, respectively. In the PSA, the CHALICE30 rule is the dominant strategy for children, as was the case in the deterministic analysis. For adults, the CCHR26 (high or medium risk) rule was the most cost-effective in the deterministic analysis, with ICERs of approximately £4000 and £10,000 for ages 40 and 75 years, respectively. However, in the PSA this decision rule dominates the other rules for both ages.
Figures 22–25 show the graphical results of the PSA for each age group. These are presented as cost-effectiveness acceptability curves,181 with the probability of each strategy being the most cost-effective plotted against values of willingness to pay for health gain ranging from £0 (where the cheapest strategy is the most cost-effective) to £50,000 per QALY. The usual threshold for decision-making is £20,000–30,000 per QALY.182
TABLE 50 A child aged 1 year, using validation data
Strategy Mean costs (£) Mean QALYs Incremental cost (£) Incremental QALYs
ICER compared with the next last effective treatment on the CE frontier
Discharge all 4206 22.955 Dom
CT all 3771 22.966 Dom
CHALICE30 3759 22.968 Dom
UCD93 3740 22.970
NEXUS II62 3749 22.972 8 0.002 £3556
CE, cost-effectiveness; Dom, dominated.
TABLE 51 A child aged 10 years, using validation data
Strategy Mean costs (£) Mean QALYs Incremental cost (£) Incremental QALYs
ICER compared with the next last effective treatment on the CE frontier
Discharge all 4115 22.3847 Dom
CT all 3666 22.4072 Dom
CHALICE30 3658 22.4073 Dom
UCD93 3641 22.4085
NEXUS II62 3651 22.4098 10 0.001 £7755
CE, cost-effectiveness; Dom, dominated.

© Queen’s Printer and Controller of HMSO 2011. This work was produced by Pandor et al. under the terms of a commissioning contract issued by the Secretary of State for Health.
153 Health Technology Assessment 2011; Vol. 15: No. 27DOI: 10.3310/hta15270
TABLE 52 Parameters and distributions used in the PSA
ParameterMean probability or per cent
95% CI probability or per cent Distribution
Clinical outcomes
NS injury 0.0053 0.0033 to 0.0085 Beta
NNS injury 0.0710 0.0626 to 0.0805 Beta
NS lesion: GOS outcomes after immediate intervention
GOS 5 81.00% 74.7% to 86.1% Dirichlet
GOS 4 9.30% 5.6% to 13.9% Dirichlet
GOS 3 3.20% 1.2% to 6.3% Dirichlet
GOS 2 2.70% 0.9% to 5.5% Dirichlet
GOS 1 3.80% 1.6% to 7.9% Dirichlet
NS lesion: GOS outcomes after late intervention
GOS 5 57.0% 7.3% to 87.5% Dirichlet
GOS 4 6.8% 0.8% to 12.4% Dirichlet
GOS 3 12.0% 0.9% to 38.2% Dirichlet
GOS 2 9.9% 0.7% to 33.2% Dirichlet
GOS 1 14.3% 1.1% to 43.1% Dirichlet
NNS lesion: GOS outcomes after immediate intervention
GOS 5 81.2% 73.2% to 87.2% Dirichlet
GOS 4 11.1% 6.6% to 18.1% Dirichlet
GOS 3 6.8% 3.5% to 12.9% Dirichlet
GOS 2 0% 0.0% to 3.2% Dirichlet
GOS 1 0.9% 0.2% to 4.7% Dirichlet
NNS lesion: GOS outcomes after late intervention
GOS 5 55.96% 7.2% to 85.8% Dirichlet
GOS 4 8.26% 1.0% to 15.7% Dirichlet
GOS 3 27.66% 2.1% to 74.1% Dirichlet
GOS 2 2.66% 0.0% to 15.8% Dirichlet
GOS 1 5.46% 0.2% to 24.7% Dirichlet
QoL utilities
GOS 3 0.15 0.06 to 0.28 Beta
GOS 4 0.51 0.39 to 0.63 Beta
GOS 5 0.88 0.74 to 0.97 Beta
Age-related effect of a single paediatric head CT scan on tumour occurrence
Age 1 year 0.0022 ± 10% Normal
Age 10 years 0.0008 ± 10% Normal
Age 40 years 0.0001 ± 10% Normal
Age 75 years 0.0001 ± 10% Normal
Age-related effect of a single paediatric head CT scan on QoL decrement
Age 1 year 0.0221 0.0185 to 0.0257 Beta
Age 10 years 0.0093 0.0066 to 0.012 Beta
Age 40 years 0.0030 0.0018 to 0.005 Beta
Age 75 years 0.0020 0.001 to 0.0035 Beta
Cancer latency (years) 10 ± 5 Normal
continued

154 Assessment of cost-effectiveness evidence
TABLE 52 Parameters and distributions used in the PSA (continued)
ParameterMean probability or per cent
95% CI probability or per cent Distribution
PVS mean survival
Age 1 and 10 years 7.4 ± 10% Normal
Age 40 and 75 years 3.59 ± 10% Normal
Costs (£) 95% CI or assumed limit
Costs
ED visit 126 £67 to 170 Gamma
CT scan 100 £80 to 117 Gamma
Admission with no deterioration or neurosurgery: head Injury without ICI without complications
847 £490 to 997 Gamma
NS intervention after deterioration: intracranial procedures for trauma with intermediate diagnosis
5805 £3605 to 6616 Gamma
NS intervention before deterioration: intracranial procedures for trauma with minor diagnosis
5273 £3758 to 6374 Gamma
Long-term costs – GOS 4 17,160 –10% to 20% Gamma
Long-term costs – GOS 3 33,900 –10% to 20% Gamma
GOS 2 – intensive care 15,469 £12,781 to 17,561 Gamma
GOS 2 – rehabilitation 27,960 –10% to 20% Gamma
GOS 2 – nursing home 893/week –10% to 20% Gamma
Cost of cancer 26,738 ± 10% Gamma
NNS, non-neurosurgical; NS, neurosurgical; PVS, persistent vegetative state.For probabilities of each strategies sensitivity and specificity see Tables 38 and 39.
TABLE 53 Mean PSA values for an age of 1 year
StrategyMean costs (£)
Mean QALYs ICER compared with next last effective treatment on the CE frontier
Discharge all 14,743 22.9599 Dom
CT all 13,046 22.9706 Dom
Atabaki et al.81 13,056 22.9804 Dom
UCD93 13,003 22.9804 Dom
PECARN90 13,014 22.9832 Dom
CHALICE30 12,936 22.9896 Dominant strategy
CE, cost-effectiveness; Dom, dominated.
TABLE 54 Mean PSA values for an age of 10 years
StrategyMean costs (£)
Mean QALYs ICER compared with the next last effective treatment on the CE frontier
Discharge all 14,403 22.3895 Dom
CT all 12,723 22.4114 Dom
Atabaki et al.81 12,746 22.4147 Dom
UCD93 12,693 22.4154 Dom
PECARN90 12,707 22.4164 Dom
CHALICE30 12,636 22.4194 Dominant strategy
CE, cost-effectiveness; Dom, dominated.

© Queen’s Printer and Controller of HMSO 2011. This work was produced by Pandor et al. under the terms of a commissioning contract issued by the Secretary of State for Health.
155 Health Technology Assessment 2011; Vol. 15: No. 27DOI: 10.3310/hta15270
TABLE 56 Mean PSA values for an age of 75 years
StrategyMean costs (£) Mean QALYs
ICER compared with the next last effective treatment on the CE frontier
Discharge all 5466 7.82941 Dom
Abnormal arrival GCS 5008 7.83736 Dom
CT all 4919 7.83823 Dom
NICE1 4891 7.83895 Dom
NOC27 4887 7.83899 Dom
NCWFNS72 4892 7.83903 Dom
Scandinavian73 4886 7.83913 Dom
NEXUS II62 4884 7.83914 Dom
CCHR (high risk)26 4880 7.83921 Dom
CCHR CT (high or medium risk)26 4874 7.83928 Dominant strategy
CE, cost-effectiveness; Dom, dominated.
TABLE 55 Mean PSA values for an age of 40 years
StrategyMean costs (£) Mean QALYs
ICER compared with the next last effective treatment on the CE frontier
Discharge all 11,540 18.6674 Dom
Abnormal arrival GCS 10,538 18.6863 Dom
CT all 10,232 18.6902 Dom
NCWFNS72 10,232 18.6911 Dom
NICE1 10,212 18.6912 Dom
Scandinavian73 10,226 18.6913 Dom
NOC27 10,205 18.6913 Dom
NEXUS II62 10,214 18.6914 Dom
CCHR (high risk)26 10,210 18.6915 Dom
CCHR (high or medium risk)26 10,192 18.6917 Dominant strategy
CE, cost-effectiveness; Dom, dominated.
Pro
bab
ility
of c
ost-
effe
ctiv
enes
s
100%
CHALICE30
Discharge allCT allPECARN90
Atabaki et al.81
Palchak et al.93
90%
80%
70%
60%
50%
40%
30%
20%
10%
0%£0 £10,000 £20,000 £30,000 £40,000 £50,000 £60,000
Willingness-to-pay threshold
FIGURE 22 Cost-effectiveness acceptability curve for a child aged 1 year.

156 Assessment of cost-effectiveness evidence
For children, the optimal management strategy is the CHALICE30 rule. For willingness-to-pay thresholds between £0 and £50,000, the probability that this management strategy is cost-effective is 75–100% for children aged 1 year and 70–100% for children aged 10 years.
For adults, the optimal management strategy is the CCHR (medium to high risk). For willingness-to-pay thresholds between £0 and £50,000, the probability that this management strategy is cost-effective is 28–42% for adults aged 40 years and 34–42% for adults aged 75 years.
Pro
bab
ility
of c
ost-
effe
ctiv
enes
s
100%
CHALICE30
Discharge allCT allPECARN90
Atabaki et al.81
Palchak et al.93
90%
80%
70%
60%
50%
40%
30%
20%
10%
0%£0 £10,000 £20,000 £30,000 £40,000 £50,000 £60,000
Willingness-to-pay threshold
FIGURE 23 Cost-effectiveness acceptability curve for a child aged 10 years.
Pro
bab
ility
of c
ost-
effe
ctiv
enes
s
100%
90%
80%
70%
60%
50%
40%
30%
20%
10%
0%£0 £10,000£5000 £20,000
X
XXXXXXXXXXX
+
+
++++++++++ +
XXXXXXXXXXX
X
£15,000 £25,000 £35,000£30,000 £40,000 £45,000 £50,000
Willingness-to-pay threshold
NICE1
Discharge allCT allAbnormal arrivalCCHR (high risk)26
CCHR (H/M risk)26
NCWFNS72
NOC27
NEXUS II62
FIGURE 24 Cost-effectiveness acceptability curve for an adult aged 40 years. H/M, high/medium.

© Queen’s Printer and Controller of HMSO 2011. This work was produced by Pandor et al. under the terms of a commissioning contract issued by the Secretary of State for Health.
157 Health Technology Assessment 2011; Vol. 15: No. 27DOI: 10.3310/hta15270
Analysis of optimal sensitivity and specificityThe CCHR (high and medium risk), with sensitivity of 99% and specificity of 47%, was the optimal strategy for adults. To explore whether this represents an appropriate trade-off between sensitivity and specificity, we undertook a secondary deterministic analysis to identify the extent to which specificity could be sacrificed to produce a more cost-effective rule with 100% sensitivity and the extent to which sensitivity could be sacrificed to produce a more cost-effective rule with markedly increased (70%) specificity. We compared a theoretical rule with 100% sensitivity and varying specificity to the CCHR, and then compared a theoretical rule with 70% specificity and varying sensitivity to the CCHR. The results are shown in Table 57.
The results show that the rule with 100% sensitivity would dominate the CCHR if specificity were ≥ 40%. It would be cost-effective with 38–39% specificity if we were willing to pay £30,000 per QALY gained, but would not be cost-effective using this threshold if specificity were ≤ 37%. The rule with 70% specificity would dominate the CCHR if sensitivity were ≥ 96%. It would be cost-effective with 94–95% specificity unless we were willing to pay more than the £30,000 per QALY threshold, but if sensitivity were ≤ 93% it would be dominated. This analysis suggests that the CCHR26 has an appropriate ratio of sensitivity to specificity and one should not be sacrificed to any great extent to optimise the other.
Admission strategiesTable 58 shows the costs, QALYs, discounted life-years gained (DLYG) and ICER for the strategy of admitting patients with a normal CT to hospital compared with discharge home with a responsible adult. Hospital admission gains a very small number of QALYs compared with discharge home, reflecting the low risk of subsequent deterioration and thus the low potential benefit from admission. Hospital admission is markedly more expensive than discharge home, so the ICER of admission is almost £39M per QALY. Hospital admission for patients with a normal CT scan would not therefore be considered a cost-effective use of health-care resources on the basis of detecting subsequent deterioration.
Table 59 shows the costs, QALYs, DLYG and ICER for the same strategy, but compared with discharge home without a responsible adult. The admission strategy gains more QALYs because it is assumed that discharged patients who deteriorate are not brought to medical attention and die.
Pro
bab
ility
of c
ost-
effe
ctiv
enes
s100%
90%
80%
70%
60%
50%
40%
30%
20%
10%
0%£0 £10,000£5000 £20,000£15,000 £25,000 £35,000£30,000 £40,000 £45,000 £50,000
Willingness-to-pay threshold
X
XXXXXXXXXXX
+
+
+++++++++++
X
XXXXXXXXXXX
NICE1
Discharge allCT allAbnormal arrivalCCHR (high risk)26
CCHR (H/M risk)26
NCWFNS72
NOC27
NEXUS II62
FIGURE 25 Cost-effectiveness acceptability curve for an adult aged 75 years. H/M, high/medium.

158 Assessment of cost-effectiveness evidence
As a result, the ICER drops to £2.5M per QALY, but is still much higher than current thresholds for willingness to pay.
Table 60 shows the costs, QALYs, DLYG and ICER for the strategy of admitting patients with a non-neurosurgical lesion on CT scan. The admission strategy gains QALYs by providing earlier treatment of patients who deteriorate. It also costs less because earlier treatment results in fewer cases requiring long-term care, which compensates for the costs of hospital admission. The admission strategy is, therefore, cheaper and more effective than discharge home.
Table 61 shows the base-case analysis for a 40-year-old adult repeated with the assumption that patients who are discharged home have no responsible adult and are, therefore, not brought to medical attention when they deteriorate. It is assumed that patients with a missed neurosurgical lesion or a missed non-neurosurgical lesion and who deteriorate will not receive treatment and die. The ‘discharge all’ strategy is therefore cheaper and less effective than in the main model and is not dominated by other strategies. The NCWFNS,72 Scandinavian,73 ‘CT all’, NEXUS II62 and NOC27 strategies are all dominated and the Abnormal arrival GCS and CCHR (high risk)26 are both extendedly dominated by the CCHR (high or medium risk)26 and the NICE1 strategies. The NICE1 strategy is therefore compared with the CCHR (high or medium risk)26 strategy and is cost-effective with an ICER of £8508.
TABLE 58 Comparison of admission versus discharge for patients with a normal CT scan
Management policy Cost (£) QALY DLYG
Incremental cost (£)
Incremental QALY ICER
Admit 467,668,501 8,706,969 10,883,914 441,432,181 11 38,997,739
Discharge 26,236,319 8,706,958 10,883,870
TABLE 59 Comparison of admission versus discharge for patients with a normal CT scan if there is no responsible adult
Management policy Cost (£) QALY DLYG
Incremental cost (£) Incremental QALY ICER
Admit 467,668,501 8,706,969 10,883,914 467,668,501 186 2,507,834
Discharge 0 8,706,783 10,883,478
TABLE 57 Secondary analysis of optimal sensitivity and specificity
Specificity of 100% sensitive rule Dominates or ICER Sensitivity of 70% specific rule Dominates or ICER
0.47 Dominates 0.99 Dominates
0.40 Dominates 0.98 Dominates
0.39 £11,288 0.97 Dominates
0.38 £29,061 0.96 Dominates
0.37 £51,828 0.95 £64,714
0.36 £82,036 0.94 £152,631
0.29 Dominated 0.93 Dominated

© Queen’s Printer and Controller of HMSO 2011. This work was produced by Pandor et al. under the terms of a commissioning contract issued by the Secretary of State for Health.
159 Health Technology Assessment 2011; Vol. 15: No. 27DOI: 10.3310/hta15270
Expected value of perfect information analysisThe EVPI is the expected outcome with perfect information minus the expected outcome without perfect information.183 Per-person EVPI for each age is shown in Table 62. An estimated 700,000 patients per year attend the ED with a MHI. Assuming a 10-year horizon for the value of further research, the maximum amount of research funding to achieve perfect information is calculated as the EVPI per person × 700,000 × 10.
The EVPI analysis appears to show that research funding will provide little value for money for children. However, this reflects failure of the model to appropriately quantify uncertainty around estimates of diagnostic accuracy for clinical decision rules in children. These estimates were obtained from large derivation studies that generated estimates of sensitivity and specificity that were precise, but arguably not accurate. Derivation studies may overestimate sensitivity and specificity. If this is the case then the CI from a large derivation study will not encompass the true value and will not reflect the uncertainty around diagnostic parameters.
For adults there appears to be a considerable sum of money available to be spent in order to remove all uncertainty from the model. However, such trials may need to be exceedingly large to remove a considerable proportion of uncertainty and may be of questionable ethical status. Formal expected value of sample information techniques185 would be an area for future research.
TABLE 60 Comparison of admission versus discharge for patients with a non-neurosurgical lesion on CT scan
Cost (£) QALY DLYG Incremental cost (£) Incremental QALY ICER
Admit 60,659,174,150 7,974,524 10,365,266 –3,387,557,645 37,543 Dominates
Discharge 64,046,731,795 7,936,981 10,317,224
TABLE 61 An age of 40 years, base-case analysis, discharged without a responsible adult
Strategy Mean cost (£) Mean QALY Incremental cost (£)
Incremental QALY
ICER compared with the next least effective treatment on the CE frontier
Discharge all 2055 18.5508
Abnormal arrival GCS 2830 18.6599 ExtDoma
NCWFNS72 2910 18.6847 Dom
Scandinavian73 2904 18.6849 Dom
CT all 2955 18.6868 Dom
CCHR (high risk) 2896 18.6868 ExtDoma
NEXUS II62 2913 18.6869 Dom
NOC27 2914 18.6872 Dom
CCHR (high or medium risk)26 2901 18.6876 846 0.13683 £6,182
NICE1 2904 18.6880 3 0.00040 £8,508
CE, cost-effectiveness; Dom, dominated; ExtDom, extendedly dominated.a Extendedly dominated by CCHR (high or medium risk)26 and NICE.1

160 Assessment of cost-effectiveness evidence
Expected value of partial perfect information analysisAn expected value of partial perfect information (EVPPI)184 analysis was not undertaken as this relies on two nested Monte Carlo simulations. The model takes approximately 1–2 hours to run a PSA of 1000 runs, depending on the processor speed. There are over 60 parameters in the model, each with 1000 PSA values. A full EVPPI analysis would therefore take approximately 90,000 (1.5 × 60 × 1000) hours, which was deemed impractical.
TABLE 62 Expected value of perfect information results
Age (years) EVPI per person (£) Maximum funding (£)
1 0 0
10 0.6 4,200,000
40 24 168,000,000
75 14.1 98,700,000

© Queen’s Printer and Controller of HMSO 2011. This work was produced by Pandor et al. under the terms of a commissioning contract issued by the Secretary of State for Health.
161 Health Technology Assessment 2011; Vol. 15: No. 27DOI: 10.3310/hta15270
Chapter 6
Survey of current NHS practice
We aimed to evaluate current NHS practice in the management of isolated MHI, review national statistics relating to head injury and then correlate these two data sources
to determine whether or not methods of service delivery are associated with differences in admission rates for head injury.
Methods of the survey
Data sourcesData were sought from two sources: (1) postal survey of the lead clinician of all major acute hospital EDs in the UK and (2) HES for England and Wales.
Questionnaire specificationA simple postal questionnaire survey was developed to identify key elements of service provision for isolated MHI. The survey was designed to be completed within 5 minutes by the lead clinician, based entirely upon his/her working knowledge of the department. The clinician was not asked to seek out data or estimate any parameters, such as proportions of patients receiving a particular form of care. The aim of this approach was to maximise response rates, data completion and reliability of responses. Two copies of the questionnaire were sent to each consultant, one for adults and one for children, except for departments known to only routinely receive adults or children. The two copies differed only in the patient group of interest. An example of the adult questionnaire is outlined in Appendix 12. Two further reminders, sent at 3-week intervals, were sent to non-responders.
Hospital Episode Statistics data requestsThe HES is a data warehouse containing details of all admissions to NHS hospitals in England and is openly accessible online (www.hesonline.org.uk). Data on all acute hospital episodes from 1998 have been collected, assembled and made available online. Data on ED attendances have recently started to be collected and are available on request. HES data were formally requested from the Health and Social Care Information Centre for all records between 2007 and 2008 containing the ED diagnosis ‘head injury’ and attendance disposal (e.g. admission or discharge) by each provider (e.g. hospital or trust) in the UK.
Data analysisThe questionnaire survey responses were entered onto a Microsoft Excel 2007 (Microsoft Corporation, Redmond, WA, USA) spreadsheet and simple descriptive analysis of proportions in each response category were undertaken. The HES data were received on a Microsoft excel spreadsheet and were also analysed descriptively. Cases were divided into children (age 0–14 years) and adults (age > 14 years) and analysed separately. The proportions of adults and children at each trust who were admitted, discharged or had an unknown disposal from the ED were calculated, and then the proportion of cases in each category was determined. The following were excluded: trusts through which all patients were admitted, all were discharged or > 50% were unknown. This was because it was suspected that such trusts were seeing a selected patient group (such as referrals), were unable to admit patients or were providing unreliable data. The median proportion of patients admitted and discharged was then estimated.

162 Survey of current NHS practice
Finally, each trust with analysable HES data was matched to an acute hospital associated with those trusts that had been sent and returned a questionnaire. Data were analysed using spss for Windows version 15.0 (SPSS Inc., Chicago, IL, USA). The median and IQR of the proportion of patients admitted between different types of service delivery were compared, and the Mann–Whitney U-test was used to assess the association between the proportions admitted and the type of service delivery. Data were presented separately for adults and children.
Results of the survey
AdultsCompleted questionnaires were returned from 174/250 hospitals (69.6%). Table 63 summarises the questionnaire responses. Nearly all hospitals had unrestricted CT access. NICE guidelines were followed by 147/174 hospitals (84.5%), although amendments had been made to 33/147 (22.4%). Of the 33 hospitals that had made modifications to formal guidelines for local use, 17 provided further details on the changes undertaken. These typically took the form of additional criteria (not specified in the NICE guidelines) for CT scanning, including immediate CT for any reduction in GCS at presentation, delayed CT for patients that make assessment difficult while under the influence of alcohol and drugs, considering CT for severe (persistent/prolonged) headache and CT indicated in patients who return to the ED within 48 hours. The admission location varied between hospitals, but most hospitals admitted adults under the ED staff, and most required approval for admission by a senior or specialist doctor.
Hospital Episode Statistics data relating to adults were available from 121 trusts. We excluded 21 from further analysis because they either recorded that all patients were discharged, all were admitted, or had no admission or discharge data for over one-half of the patients. The number of adult cases attending the remaining 100 trusts ranged from 15 to 5630 (median 1050). The proportion discharged ranged from 54% to 95% (median 80%) and the proportion admitted from 1% to 45% (median 18%).
TABLE 63 Questionnaire responses for adults
Question Response n (%)
Guidelines NICE (not specified) 12 (6.9)
NICE (2003) 7 (4.0)
NICE (2007) 128 (73.6)
Other, including SIGN 24 (13.8)
None 3 (1.7)
CT access Yes 167 (96.0)
No 6 (3.4)
Not completed 1 (0.6)
Admission location ED observation 69 (39.7)
Clinical decision unit 36 (20.7)
Formal admission 69 (39.7)
Admission team ED staff 122 (70.1)
Inpatient team 50 (28.7)
Not completed 2 (1.2)
Admission approval Any doctor 53 (30.5)
Senior doctor 94 (54.0)
Senior or specialist 11 (6.3)
Specialist 14 (8.0)
Not completed 2 (1.1)
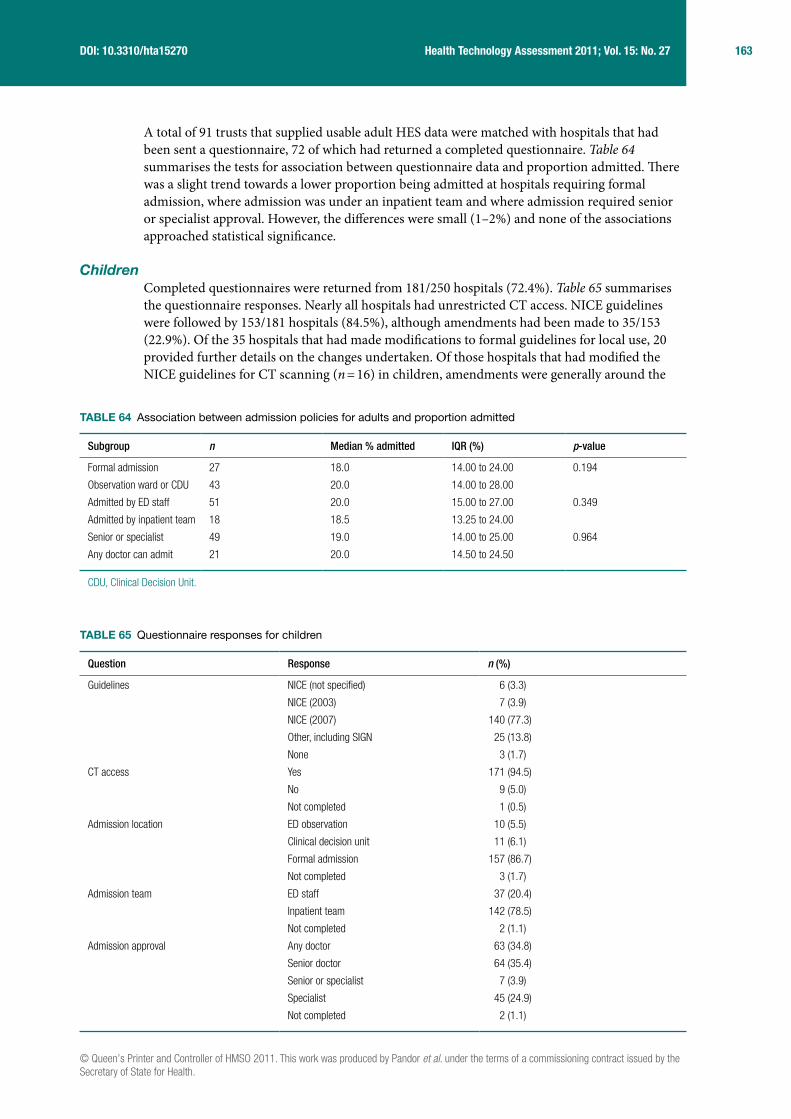
© Queen’s Printer and Controller of HMSO 2011. This work was produced by Pandor et al. under the terms of a commissioning contract issued by the Secretary of State for Health.
163 Health Technology Assessment 2011; Vol. 15: No. 27DOI: 10.3310/hta15270
A total of 91 trusts that supplied usable adult HES data were matched with hospitals that had been sent a questionnaire, 72 of which had returned a completed questionnaire. Table 64 summarises the tests for association between questionnaire data and proportion admitted. There was a slight trend towards a lower proportion being admitted at hospitals requiring formal admission, where admission was under an inpatient team and where admission required senior or specialist approval. However, the differences were small (1–2%) and none of the associations approached statistical significance.
ChildrenCompleted questionnaires were returned from 181/250 hospitals (72.4%). Table 65 summarises the questionnaire responses. Nearly all hospitals had unrestricted CT access. NICE guidelines were followed by 153/181 hospitals (84.5%), although amendments had been made to 35/153 (22.9%). Of the 35 hospitals that had made modifications to formal guidelines for local use, 20 provided further details on the changes undertaken. Of those hospitals that had modified the NICE guidelines for CT scanning (n = 16) in children, amendments were generally around the
TABLE 64 Association between admission policies for adults and proportion admitted
Subgroup n Median % admitted IQR (%) p-value
Formal admission 27 18.0 14.00 to 24.00 0.194
Observation ward or CDU 43 20.0 14.00 to 28.00
Admitted by ED staff 51 20.0 15.00 to 27.00 0.349
Admitted by inpatient team 18 18.5 13.25 to 24.00
Senior or specialist 49 19.0 14.00 to 25.00 0.964
Any doctor can admit 21 20.0 14.50 to 24.50
CDU, Clinical Decision Unit.
TABLE 65 Questionnaire responses for children
Question Response n (%)
Guidelines NICE (not specified) 6 (3.3)
NICE (2003) 7 (3.9)
NICE (2007) 140 (77.3)
Other, including SIGN 25 (13.8)
None 3 (1.7)
CT access Yes 171 (94.5)
No 9 (5.0)
Not completed 1 (0.5)
Admission location ED observation 10 (5.5)
Clinical decision unit 11 (6.1)
Formal admission 157 (86.7)
Not completed 3 (1.7)
Admission team ED staff 37 (20.4)
Inpatient team 142 (78.5)
Not completed 2 (1.1)
Admission approval Any doctor 63 (34.8)
Senior doctor 64 (35.4)
Senior or specialist 7 (3.9)
Specialist 45 (24.9)
Not completed 2 (1.1)

164 Survey of current NHS practice
timing of performing CT, i.e. immediate CT versus delayed CT. The most common features that were amended for local use included delaying CT in patients with amnesia (anterograde or retrograde) lasting > 5 minutes, and dangerous mechanism of injury or presence of bruise, swelling or laceration > 5 cm on head in children < 1 year of age, as opposed to immediate CT as indicated in the NICE guidelines. Additional criteria for considering CT scanning included LOC or amnesia and coagulopathy or severe (persistent) headache. Unlike adults, most hospitals formally admitted children under an inpatient team. Most hospitals required approval for admission by a senior or specialist doctor.
The HES data relating to children were available from 118 trusts. Data from 32 were excluded from further analysis because they recorded either that all patients were discharged or that all patients were admitted or because they had no admission or discharge data for over half the patients. The number of child cases ranged from 14 to 3202 (median 753). The proportion discharged ranged from 53% to 97% (median 90%) and the proportion admitted from 3% to 43% (median 9%).
A total of 78 trusts that supplied useable child HES data were matched with hospitals that had been sent a questionnaire, 64 of which had returned a completed questionnaire. Table 66 summarises the tests for association between questionnaire data and proportion admitted. The trend in children was the opposite of that in adults, with slightly more being admitted at hospitals requiring formal admission and/or admission under an inpatient team. However, the differences were again small and none of the associations approached statistical significance.
TABLE 66 Association between admission policies for children and proportion admitted
Subgroup n Median % admitted IQR (%) p-value
Formal admission 54 9.5 6.00 to 12.00 0.367
Observation ward or CDU 7 7.0 4.00 to 11.00
Admitted by ED staff 14 8.5 4.00 to 11.00 0.282
Admitted by inpatient team 48 10.0 6.00 to 12.00
Senior or specialist 40 8.5 6.00 to 11.00 0.559
Any doctor can admit 22 10.5 6.50 to 12.25
CDU, Clinical Decision Unit.

© Queen’s Printer and Controller of HMSO 2011. This work was produced by Pandor et al. under the terms of a commissioning contract issued by the Secretary of State for Health.
165 Health Technology Assessment 2011; Vol. 15: No. 27DOI: 10.3310/hta15270
Chapter 7
Discussion
Statement of principal findings
Diagnostic accuracy studiesClinical decision rulesClinical decision rules for adults have generally been more widely validated than those for children. The CCHR criterion26 is the most widely validated rule for adults and appears to have consistently high sensitivity for neurosurgical injury whether or not the high- and medium-risk criteria or the high-risk criteria alone are used. Specificity has been sacrificed to optimise sensitivity, but is still adequate for a substantial proportion of patients to test negative in a typical population. Sensitivity of the rule for any ICI is more variable and estimates may reflect definition and application of the reference standard. Sensitivity of the criterion26 for any ICI may be lower if the definition of any ICI includes all potentially significant CT abnormalities. Other clinical decision rules have not been as widely tested as the CCHR and/or do not perform as well.
Clinical decision rules for children following MHI have increased in number from the eight identified in the recent review by Maguire et al.186 The conclusion of Maguire et al.186 that more research is needed has been accepted, although with new rules being derived but little validation there remains substantial uncertainty. Our review has identified a number of rules with derivation and validation data for both infants and children following MHI. Four rules have now been validated,30,90,91,93 three in an independent cohort.30,91,93 All four rules have high sensitivity, but specificity is variable. The CHALICE30 rule in particular had 87% specificity in a derivation cohort30 with a limited reference standard but poor specificity in the validation study.89 Currently, the PECARN rule90 appears to have the best specificity, but this may be because it has only been validated in a cohort from the same setting as the derivation cohort and not in a new setting.
Individual characteristicsOverall, it is apparent that nearly all the individual clinical features that have diagnostic value are useful for diagnosing ICI, rather than ruling out (i.e. they have high specificity and PLR, but poor sensitivity and NLR). Thus an unstructured approach to clinical evaluation would involve identifying positive clinical findings that raise the probability of ICI.
In adults, a depressed skull fracture, basal skull fracture, radiological skull fracture, PTS, focal neurological deficit, decrease in GCS or persistent vomiting all indicate a markedly increased risk of ICI (PLR > 5), whereas fall from a height, coagulopathy, chronic alcohol abuse, age over 60 years, pedestrian MVA, GCS < 14, GCS < 15, any seizure, any vomiting, anterograde amnesia or retrograde amnesia indicate a moderately increased risk of ICI (PLR 2–5). Other features, such as LOC and headache, appear to add little diagnostic value. However, LOC is sometimes used as an inclusion criterion for studies, so its diagnostic value may be underestimated. Only a few studies report data specifically for neurosurgical injuries, so it is difficult to draw reliable conclusions; however, the diagnostic value of characteristics for neurosurgical injuries does not appear to differ markedly from that of characteristics for any injury.
In children, a depressed skull fracture, basal skull fracture, focal neurological deficit, coagulopathy or PTS all indicate a substantially increased risk of ICI (PLR > 5), whereas visual

166 Discussion
symptoms, bicycle and pedestrian MVA, any seizure, any LOC, persistent vomiting, severe or persistent headache, anterograde/retrograde amnesia, GCS < 14, GCS < 15, intoxication and radiological skull fracture indicate a moderately increased risk of ICI (PLR 2–5). Other features, such as any headache or scalp laceration or haematoma, appear to add little diagnostic value. Only two studies report data for neurosurgical injuries and examined a limited range of characteristics. As with adults, there was no clear evidence that any characteristic had different diagnostic performance for neurosurgical injury as opposed to any ICI.
In infants, a depressed skull fracture or focal neurological deficit indicates a substantially increased risk of ICI, whereas radiological skull fracture, GCS < 15 and any LOC indicate a moderately increased risk.
Clinical decision rules for MHI are based on individual clinical characteristics, with the presence of a criterion indicating the need for CT scanning (or hospital admission prior to the widespread use of CT). There is substantial variation in the criteria used by each rule and it is interesting to examine the diagnostic value of each item, as estimated in our meta-analysis.
Most adult rules use GCS < 15, focal neurological deficit, LOC, vomiting and amnesia. Our meta-analysis of these individual characteristics suggested that LOC has little diagnostic value, although this may reflect its use as a selection criterion in many studies. The other four criteria were supported by our meta-analysis, although vomiting was only useful if it was persistent. Most rules did not specify that vomiting had to be persistent. Only around half of the rules specified suspected basal or depressed skull fracture, age, seizure, decreasing GCS, mechanism of injury or coagulopathy as criteria. Our meta-analysis suggested that these were useful criteria (or at least fall from a height and bicycle or pedestrian MVA were useful with regards to mechanism of injury). Conversely, several rules used headache as a criterion, whereas our meta-analysis suggested that this was of limited diagnostic value. Interestingly, this criterion also seems to have been added to NICE guidelines1,19 by some NHS trusts. Overall it appeared that NICE guidelines1,19 matched the findings of our meta-analysis very well (perhaps better than any other decision rule) in terms of including criteria that are diagnostically useful and excluding those that are not. We found little evidence to support the application of additional criteria to the NICE guidelines.1,19
Most rules for children use LOC, GCS < 15, skull fracture, vomiting, headache and visible injury as criteria. Our meta-analysis of the individual characteristics supported the use of LOC, GCS < 15, skull fracture, vomiting and headache (if severe or persistent), but suggested that scalp laceration/haematoma or an undefined headache were of little diagnostic value. Less than half of the rules used focal neurological deficit, amnesia or seizures as criteria, few used mechanism of injury and only one used coagulopathy as criteria. Yet our meta-analysis suggested that all these criteria were potentially diagnostically useful. Overall the CHALICE30 and NEXUS II62 rules appeared to be most consistent with the findings of our meta-analysis, in terms of including criteria that are diagnostically useful and excluding those that are not.
BiomarkersThe only biomarker to be widely evaluated to date is S100B. Our meta-analysis shows that sensitivity has the potential to be clinically acceptable, whereas specificity could be adequate to significantly reduce the number of negative scans being performed. These findings are consistent with other non-systematic reviews on protein S100B. We identified more relevant studies than have previously been described and have formally assessed their quality. In general, these studies have been of high quality. However, there are some inconsistencies between the studies (see Strengths and limitation of the assessment, Clinical evaluation) in terms of timing of the sample and analyser used that may limit our ability to draw general conclusions.

© Queen’s Printer and Controller of HMSO 2011. This work was produced by Pandor et al. under the terms of a commissioning contract issued by the Secretary of State for Health.
167 Health Technology Assessment 2011; Vol. 15: No. 27DOI: 10.3310/hta15270
It is likely that S100B will need to develop a role alongside or as part of a clinical decision rule. Two studies were identified that specifically used S100B in conjunction with current clinical decision rules, with the selection of symptomatic patients based on two previously reported guidelines26,27 for cranial CT in one study98 and using the European Federation of Neurological Societies guidelines for CT in another.146 The sensitivity and specificity of a number of international decision rules published are better than those quoted for S100B alone, but these two studies provide support for an additional level of screening for intracranial abnormality.
Analysis of urine samples for elevated protein S100B has been performed in both adults and children as an alternative to blood sampling following head injury, although these data are not presented here. None of these studies has demonstrated a potential role for early urine sampling as a screening tool for cranial CT.187–189
As an objective tool in the management of MHI, protein S100B has a potential role in reducing unnecessary radiation exposure. Meta-analysis data reveal clinically significant results that would permit an acceptable reduction in the rate of CT scan use while still identifying those with intracranial trauma. Clarification is required on the optimum time following injury for testing (evidence currently suggests < 3 hours) and acceptance that a local discriminative value is necessary to ensure patient safety, dependent on which analyser and sample type is used.
Diagnostic management studiesWe found only one appropriately controlled study of alternative diagnostic management strategies for MHI.37 It showed that early CT and discharge of patients with MHI is at least as effective as hospital admission and costs less. This provides empirical evidence for one of the assumptions behind our modelling strategy – that CT scanning is cheaper and more effective than hospital admission and will, therefore, dominate a direct comparison of these two strategies. This is why we did not use modelling to directly compare CT scanning with hospital admission, but instead used the modelling to explore alternative strategies that involved selecting patients for CT scanning using a clinical decision rule or alternative admission strategies based on CT findings. The main limitation of the diagnostic management study was that it could only reasonably compare two alternative strategies, whereas modelling allows comparison of multiple alternatives.
Eleven other studies (two contemporaneous cohort studies152,153 and nine uncontrolled before/after studies)21,22,136,154–159 were identified, but not formally included in the review as they lacked adequate control groups. Overall, these studies showed that implementation of guidelines may change the management of patients with MHI, although the effects are varied and not always as anticipated. The changes identified may be due to inherent biases in studies with limited control groups and may not be generalisable to other settings.
It is perhaps surprising that there have not been more appropriately controlled studies of diagnostic management strategies in MHI, particularly of clinical decision rules. Accuracy studies may be subject to selection biases and do not show whether and how decision rules are put into practice by clinicians. Furthermore, it should not be assumed that an accurate clinical decision rule is better than an unstructured clinical assessment undertaken by a qualified and experienced clinician. Properly controlled management studies could determine whether or not the potential benefits of using clinical decision rules are realised in practice.
Economic evaluationEconomic evaluations from the perspectives of the Dutch162–164 and US162–164 health-care systems have concluded that selective CT use is more cost-effective than CT for all patients or no investigation. Our economic analysis confirmed this finding from the NHS perceptive and

168 Discussion
showed that the use of CT scanning as determined by a clinical decision rule is a cost-effective use of NHS resources. Indeed, the substantial costs of long-term care for patients with delayed treatment means that using CT selectively or in all patients is not only more effective than not investigating, but also is cheaper. Effective care for MHIs is a cost saving.
Selective CT use according to a clinical decision rule was also cost-effective compared with CT for all patients. This is because the clinical decision rules we evaluated are all highly sensitive, so using CT for all patients resulted in a substantial increase in the number of normal CT scans being performed for a small benefit in terms of additional cases detected. The disbenefit associated with increased radiation exposure offset the benefit of detecting a few extra cases and the additional costs rendered the ‘CT all’ strategy more expensive than the selective strategies. Our conclusion that selective CT use is cost-effective compared with CT for all may not hold if the strategy used to select patients is not sufficiently sensitive. The base-case analysis showed that CT for all dominated a theoretical strategy with 91% sensitivity for neurosurgical lesion, 72% sensitivity for non-neurosurgical lesion and 97% specificity.
Development of a clinical decision rule with less than perfect diagnostic accuracy will inevitably involve a trade-off between sensitivity and specificity. Established clinical decision rules typically sacrifice specificity to achieve high sensitivity (98–99%). Our analysis suggests that accepting 40–50% specificity to ensure high sensitivity provides an appropriate trade-off in terms of cost-effectiveness. It did not appear to be cost-effective to allow specificity to drop below 38% to achieve 100% sensitivity. Conversely, it did not appear to be cost-effective to allow sensitivity to drop below 94% to achieve 70% specificity. This has implications for the development of new or refined decision rules. We should continue to search for more accurate strategies, but studies need to be powered to show equivalent sensitivity to existing rules. This means they will need to recruit thousands or even tens of thousands of patients.
The most cost-effective rule for adults was the CCHR criterion26 using high- and medium-risk factors to guide CT use. The costs and outcomes associated with each rule were broadly similar, so the superiority of the CCHR26 may simply reflect a small difference in the estimate of diagnostic accuracy that was not statistically significant in the primary data.71 Indeed, sensitivity analysis using different prevalence estimates for neurosurgical and non-neurosurgical injuries suggested that the NEXUS II rule62 was more cost-effective. However, our systematic review suggested that the CCHR criterion26 is the most well-validated rule and has estimates of diagnostic accuracy that are reasonably consistent across a number of cohorts. It therefore seems appropriate to conclude that the CCHR criterion26 has the best evidence to support its use.
The picture is less clear for children because the rules are less well validated. Our main analysis used estimates of diagnostic accuracy from derivation cohorts. These may overestimate diagnostic accuracy and the estimate of specificity from the derivation cohort of the CHALICE30 rule is much higher than that from a validation cohort.89 The CHALICE30 rule appeared to be the most cost-effective rule for children in the main analysis, but this probably reflects superior estimates of diagnostic accuracy from a derivation cohort. A sensitivity analysis using data from the validation cohort89 showed that the CHALICE rule30 was dominated by the NEXUS II62 and UCD93 rules. However, in the PSA, the CHALICE rule30 was the dominant strategy.
Our analysis showed that admission of patients with a normal CT scan would not be cost-effective, with an ICER of £39M per QALY compared with discharge home with a responsible adult. If the alternative to admission is discharge home with no responsible adult then the ICER is lower, at £2.5M per QALY, but would still not be considered cost-effective. This analysis is based
© Queen’s Printer and Controller of HMSO 2011. This work was produced by Pandor et al. under the terms of a commissioning contract issued by the Secretary of State for Health.
169 Health Technology Assessment 2011; Vol. 15: No. 27DOI: 10.3310/hta15270
upon data suggesting a very low (0.006%) risk of deterioration167 and it is assumed that patients are clinically well and would not benefit from general hospital care. The conclusion that patients with a normal CT scan should not be admitted to hospital does not apply to those with, for example, repeated vomiting or significant amnesia who may benefit from symptomatic treatment, nursing care or a safe environment. However, if the patient is orientated, comfortable and able to self care then our analysis suggests that hospital admission for observation is not a cost-effective use of NHS resources, even if the alternative is discharge home without a responsible adult to observe them at home.
Hospital admission for those with a non-neurosurgical lesion on CT was cost-effective. Indeed it was cost saving, as the costs of long-term care for those who deteriorated and received late treatment outweighed the costs of hospital admission. This analysis was limited by the lack of a standard definition as to what constitutes a significant non-neurosurgical lesion on CT and the limited data relating to outcomes from non-neurosurgical lesions. The prognosis of different non-neurosurgical lesions varies markedly, so cost-effectiveness could potentially be improved by selecting those at highest risk of deterioration for admission while discharging those at lower risk. Currently, however, we do not have sufficient data to evaluate this approach.
A willingness-to-pay threshold of £30,000 was used to compare the cost-effectiveness of the strategies. However, with a lower threshold of £20,000 the results and conclusions would be the same.
Survey of current practiceThe survey of NHS EDs showed that nearly all had unrestricted access to CT scanning (adults 96%, children 94.5%). Most hospitals followed the NICE guidelines, although 22% had made their own local amendments. In adults these included immediate CT for any reduction in GCS at presentation and considering CT for severe (persistent/prolonged) headache. Our meta-analysis suggests that immediate CT for any reduction in GCS at presentation would be a reasonable amendment, with a PLR of 3.2 for ICI in adults, but that headache, even if severe or persistent, was a poor predictor of ICI.
The most common features that were amended for local use in children involved delayed instead of immediate CT for patients with amnesia lasting > 5 minutes and dangerous mechanism of injury or presence of bruising, swelling or laceration > 5 cm on heads of children < 1 year of age. Additional criteria for considering CT scanning included LOC or amnesia and coagulopathy or severe (persistent) headache. Our meta-analysis suggested that anterograde or post-traumatic amnesia (PTA) (PLR 3.0), dangerous mechanism of injury (2.0–4.6), LOC (2.2), coagulopathy (6.6) and severe or persistent headache (4.3) predicted ICI to varying degrees in children, but that the presence of scalp bruising or laceration was not very useful.
Adults were usually admitted to an observation ward or clinical decision unit (61.4%), whereas children were usually admitted to an inpatient ward (86.7%). The median proportion of attendances admitted was higher for adults (18%) than for children (9%). This difference may reflect differences in the prevalence of ICI in adults and children, or lack of a responsible adult to look after injured adults. It is conceivable that admissions practice could influence admission rates, with more accessible locations (such as observation wards or clinical decision units) being associated with higher admission rates. However, we found no evidence of an association between the proportion admitted and the admission team, location or requirement for senior or specialist approval (all p > 0.1). This may reflect inadequacies in current HES data. As these data improve there may be further opportunities to explore for associations between admission practices and the proportion admitted.
170 Discussion
Strengths and limitations of the assessment
Clinical evaluationDecision rulesThe data evaluating decision rules are strongest for adults, particularly the CCHR, which has been validated in a number of new cohorts and in different settings. Studies by Stein et al.,71 Ibanez et al.60 and Smits et al.68 have compared multiple decision rules in large cohorts to provide powerful evidence of comparative diagnostic performance. Validation of decision rules for children, by contrast, is much more limited. Where validation has been undertaken it has shown that specificity may be much lower than estimated in the derivation cohort. This could have important implications if implementation of decision rules leads to increases in unnecessary CT scanning.
Studies of clinical decision rules have inevitable limitations. Most patients with MHI do not routinely receive CT scanning. Indeed the aim of developing a decision rule is to formalise the selection process for scanning. So, although a CT scan might be considered the ideal reference standard, it is unlikely to be performed on all patients if an appropriate patient spectrum is recruited. Studies may increase the proportion receiving CT scanning by limiting patient selection, but this may lead to spectrum bias. An associated limitation is that there seems to be inconsistency in what is considered a clinically significant intracranial abnormality on CT. If liberal criteria for clinical significance are used then sensitivity will be apparently reduced, but the addition FNs may not be clinically significant. The best way of determining clinical significance is to undertake follow-up studies and identify whether or not particular lesions are associated with an adverse outcome.
These limitations are less important with regard to neurosurgical injury, where adequate clinical follow-up should identify cases regardless of CT findings. The main limitation with regard to neurosurgical injury is the small number of cases in even very large cohorts, limiting the precision with which sensitivity can be estimated. The few large cohorts of minor head-injured patients assembled have been invaluable in providing precise estimates of sensitivity for this very important outcome.
Most studies of clinical decision rules have evaluated children and adults separately. However, within the age ranges used to define children there is substantial variation from infants at one extreme to adolescents at the other. This variation will be reflected in variation in ability to express symptoms and co-operate with examination. The limitations of attempting to develop a clinical decision rule for all children need to be considered when applying findings to an individual child.
Individual clinical characteristicsThere are substantial data evaluating individual clinical characteristics in both adults and children. Frequently used clinical characteristics, such as LOC, headache and vomiting, have been widely studied, although not always clearly defined. This may be important because clinical characteristics appeared to be more diagnostically useful when they were clearly defined. Other clinical characteristics, such as decreasing GCS, visual symptoms and specific mechanisms of injury, have been less widely studied. We should be cautious about drawing conclusions from only two or three studies, particularly when the findings are inconsistent.
There was usually statistically significant heterogeneity between studies, wherever sufficient numbers of studies existed to allow analysis. It could be argued that it is inappropriate to

© Queen’s Printer and Controller of HMSO 2011. This work was produced by Pandor et al. under the terms of a commissioning contract issued by the Secretary of State for Health.
171 Health Technology Assessment 2011; Vol. 15: No. 27DOI: 10.3310/hta15270
calculate a pooled likelihood ratio in the presence of significant heterogeneity. However, not reporting a pooled estimate can make interpretation difficult and reduce the clinical value of a systematic review. The pooled estimate should, therefore, be regarded as a very general estimate of the diagnostic value of a characteristic that may actually vary substantially between settings and populations.
BiomarkersThe results of our meta-analysis appear positive and would superficially support use of this test in the MHI population described. However, care must always be taken in interpreting such meta-analysis results. These studies may appear similar, but it has been demonstrated by two groups that the results produced by the Liaison and Elecsys analysers are only moderately correlated when analysing the same samples.165,190,191 Results are not interchangeable and as concentrations increase the difference between the two analysers also increases, often with the Liaison giving higher concentration results. This would imply that the universal application of a single discriminative value, as suggested by the American College of Emergency Physicians (ACEP),39 is inappropriate.
Time delay significantly influences these results. The specificity of a higher cut-off value in early studies, measuring concentrations later after injury, positively skews the specificity when analysed in this pooled format. This improvement in specificity was at the cost of sensitivity, which would be the more appropriate value to consider for this test in its potential role as an exclusion tool, although the specificity being too low would render this biomarker clinically useless in this field. A serum measurement within 4 hours was suggested by the ACEP report. Six of the studies took their samples within 3 hours and achieved a sensitivity ranging from 95% to 100% and a specificity of 20% to 50%, two analysing plasma concentrations on the Liaison, two analysing sera on the Liaison and two analysing sera on the Elecsys.
Diagnostic management studiesThe single RCT identified by our review provides powerful evidence that CT scanning is more clinically effective and cost-effective than hospital admission for MHI. However, it can only compare two alternatives and does not estimate the clinical effectiveness or cost-effectiveness of selective strategies based on a decision rule. The other studies mentioned, but not formally included in the review, have clear methodological limitations described in the relevant section and should not be used to draw general conclusions.
Economic evaluationThe economic analysis used current best practice to develop the model and followed recommendations produced by NICE.182 We included aspects of intervention, such as the benefits of treating non-neurosurgical intracranial lesions and the disbenefit associated with radiation exposure, that have not always been included in previous models. However, economic models are inevitably limited by the need to make assumptions in developing the model and by the limitations of the primary data.
Estimating the benefit of treating neurosurgical and non-neurosurgical lesions was inevitably difficult and relied upon observational data with small numbers. Experienced neurosurgeons and emergency physicians checked our estimates and felt that they were appropriate, but it is almost impossible to determine whether they are accurate. In particular, the probabilities of GOS 2 or 3 are subject to substantial uncertainty and have a potentially powerful effect upon cost-effectiveness. The expectation that delayed treatment will increase the probability of GOS 2 or 3 seems intuitively reasonable, but is very difficult to prove empirically.

172 Discussion
As discussed previously, the potential benefit of treating non-neurosurgical intracranial lesions is uncertain and probably dependent on the definition used. We assumed that benefit was related to the risk of subsequent deterioration. However, this risk will depend upon the type and extent of injury. Conversely, we assumed that hospital admission and treatment provided no benefit for patients with a non-neurosurgical lesion that did not deteriorate or those with a normal CT scan. This was based upon our literature search finding no clear evidence of benefit. However, absence of evidence of benefit does not equate to evidence of absence of benefit. Further research would be helpful to determine whether early intervention helps to reduce persistent symptoms in patients with non-neurosurgical lesions or even those with normal CT scans.
Limitations of the primary data were particularly important in children, in whom there has been very little validation of clinical decision rules. The cost-effectiveness of each decision rule was determined by its diagnostic parameters, yet these (especially specificity) varied between the derivation data and (admittedly very limited) validation data. The conclusions regarding the optimal decision rule for children are, therefore, much less clear than for adults.
There were insufficient data for us to model strategies for specific patient groups, such as those receiving anticoagulant medication. These patients represent an increasing group with MHI. They have a higher risk of ICI and have a higher risk of adverse outcome, but the potential benefits of neurosurgery are less certain. Development of a specific model for these patients may be helpful when better data are available.
The model assumed that patients in GOS states maintained the associated utility throughout the modelling horizon. This could mean that those in GOS 5 have a higher utility than the average person of that age. This limitation, however, is expected to have little bias as the effects of discounting will mean any inaccuracies are small, but would favour those policies that provided treatment more promptly.
Finally, a potential limitation is the method used to estimate QALY loss in adults owing to the risk of cancer from performing a CT scan. This limitation, however, is expected to have little effect as any inaccuracies around the QALY loss are likely to be small, but would favour those policies that perform fewer CT scans.
Survey of current practiceMost of the hospitals surveyed (70%) responded, ensuring that the survey was reasonably representative of NHS practice. However, it is possible that hospitals that did not follow the guidelines or lacked a lead clinician with interest in management of MHI were under-represented. Furthermore, the survey could only determine what the respondent thought was supposed to happened, not what actually happened in practice. In particular, the estimate of CT availability may be an overestimate and the survey may be a poor reflection of what actually happens out of normal working hours.
The HES data were limited and often poor quality, so the absence of any association between reported practice and proportion of patients admitted may reflect data quality rather than absence of any such association. This was the first year that such data were available from HES, so, hopefully, data quality will improve as more hospitals record and report their ED data. We would have liked to use the survey and HES data to explore whether or not differences in admissions practice could be explained by characteristics of the hospitals, but unfortunately the data were inadequate for this purpose.

© Queen’s Printer and Controller of HMSO 2011. This work was produced by Pandor et al. under the terms of a commissioning contract issued by the Secretary of State for Health.
173 Health Technology Assessment 2011; Vol. 15: No. 27DOI: 10.3310/hta15270
Uncertainties
The main uncertainties identified in this report are:
■ How do clinical decision rules for children perform outside their derivation setting? ■ What is the prognosis of different non-neurosurgical injuries? ■ Does S100B provide useful diagnostic information when used alongside clinical decision rules? ■ How do diagnosis and outcomes of MHI in anticoagulated patients differ from the
general population? ■ What is the clinical effect (and cost-effectiveness) of implementing guidelines, decision rules
and diagnostic management strategies?
Clinical decision rules for children have only received very limited validation. Where this has occurred it has raised concerns about the specificity of the rules. Our analysis suggests that optimising sensitivity is more important than optimising specificity. However, if specificity is too low then the radiation exposure and costs associated with normal CT scanning will reduce cost-effectiveness. Evaluation of clinical decision rules for children (CHALICE,30 PECARN,90 UCD93 and NEXUS II62) in a large representative cohort presenting to the ED with MHI would provide valuable validation and more reliable estimates of diagnostic accuracy for ICI. Planning such a study will require careful consideration of inclusion criteria, reference standard and outcome definition. It will need to be very large to provide precise estimates of sensitivity.
Our economic model was limited by uncertainties surrounding the benefit of treatment for patients with non-neurosurgical injury. Benefits are clearly likely for patients who deteriorate if their deterioration can be predicted, prevented or treated. Research is required to better estimate the risk of deterioration with different non-neurosurgical injuries and the benefit of different treatments for these injuries. This research would be helpful for determining the definition of a clinically significant injury on CT and, thus, defining the important outcomes for future studies of decision rules. Research is also required to determine what benefits, if any, patients with non-neurosurgical injury can gain from treatment even if they do not deteriorate. These patients often have significant and persistent symptoms, yet we were unable to find any strong evidence of treatment benefit.
Our meta-analysis suggested that S100B might have a role in ruling out ICI and reducing CT use. It is unlikely to be cost-effective when used as a single test because clinical decision rules can already reduce CT use without compromising sensitivity excessively and without incurring significant additional costs. However, S100B may have a role in further reducing CT use after application of (or as part of) a clinical decision rule. Defining this role would require evaluation of S100B alongside a widely used and well-validated clinical decision rule in a representative cohort of patients with MHI. This cohort would need to be large enough to estimate sensitivity with a high degree of precision.
An increasing number of patients with MHI have been prescribed anticoagulants to reduce their thromboembolic risk. We found that coagulopathy was associated with an increased likelihood of ICI. Beyond this finding there was very little research into the value of clinical assessment, use of diagnostic tests and outcome of MHI in this patient group. Research is required to determine the diagnostic accuracy of clinical characteristics, decision rules and biomarkers in patients receiving anticoagulants, the prognosis associated with different CT appearances (including normal) and the risks and benefits of different approaches to treatment, including reversal of anticoagulation and neurosurgery.

174 Discussion
We found only one acceptable quality study evaluating the implementation of alternative strategies for managing MHI.37 We identified a number of studies that did not meet our inclusion criteria and were only able to draw limited conclusions. Implementation studies are challenging to undertake, but can provide valuable insights and powerful evidence of the real-practice effects of management strategies. The implementation of NICE head injury guidance may not have had the anticipated effect of reducing hospital admissions.24 This may be owing to cautious framing or interpretation of guidance. Studies of guideline implementation would provide valuable insights into their intended and unintended consequences. Furthermore, there have been no studies comparing structured clinical care following guidelines, decision rules or diagnostic strategies to unstructured care based on clinician assessment of the individual patient.
Assessment of factors relevant to the NHS and other parties
Management of MHI in the NHS is subject to guidance issued by NICE in 200319 and was updated in 2007.1 Our national survey found that most NHS EDs follow NICE guidance, albeit with some local modifications. A previous analysis of HES admissions data suggested that head injury admissions had increased following the introduction of NICE guidance and questioned whether or not this represented cost-effective care.24 Our analyses, and in particular the economic analysis, generally support the guidance provided by NICE,1 although the implementation of NICE guidance in practice has not yet been subject to a detailed evaluation.
Selection of patients for CT scanning in the NICE guidance for adults is based on the CCHR criterion.26 We found that the criteria for CT scanning are supported by meta-analysis showing that these criteria are all useful predictors of ICI. The CCHR criterion26 is the most widely validated decision rule, with high sensitivity and acceptable specificity for ICI, and appears to be the most cost-effective strategy.
The NICE criteria for CT scanning for children generally correspond to the features that were found to be most useful in our meta-analysis, although there were a few exceptions. Our meta-analysis suggested that severe or persistent headache and coagulopathy may be useful additional criteria. The NICE criteria1 were based on the CHALICE rule30 and an economic analysis using derivation cohort data, which suggested that this was the optimal strategy. However, analysis based on validation data89 suggested that the CHALICE rule30 was dominated by the NEXUS II62 and UCD93 rules. Further research is required to determine the diagnostic parameters of these rules in large validation studies, which could then be used to refine our model.
The NICE guidelines1 suggest that patients with new clinically significant abnormalities on imaging should be admitted. Our economic analysis suggests that admission for patients with non-neurosurgical injury is not only cost-effective, but also cost saving. However, further research is required to determine which non-neurosurgical injuries are clinically significant, thus refining admissions policies.
The NICE guidance1 states that with ‘Normal imaging of the head: clinician may conclude risk is low enough to allow discharge if patient has returned to GCS 15, no other factors warrant admission and there are appropriate support structures for safe transfer and subsequent care’. Our economic analysis suggested that admission for patients with a normal CT scan represents very poor value for money for the health service, assuming that admission is to observe for deterioration rather than provide symptom control or general care. The results of this analysis would support a clear statement in clinical guidance that hospital admission is not recommended for those with a normal CT scan unless they are unable to self-care or require treatment of symptoms.

© Queen’s Printer and Controller of HMSO 2011. This work was produced by Pandor et al. under the terms of a commissioning contract issued by the Secretary of State for Health.
175 Health Technology Assessment 2011; Vol. 15: No. 27DOI: 10.3310/hta15270
Chapter 8
Conclusions
Implications for service provision
The CCHR is the most well-validated rule in adults and, when high- and medium-risk criteria are used, has high sensitivity and acceptable specificity. The CCHR and related NICE guideline are based upon the clinical characteristics that our meta-analysis suggests are the most powerful predictors of ICI. The use of headache as an additional criterion for CT scanning (as used in some hospitals) was not supported by our meta-analysis. Decision rules for children have not been widely validated, so conclusions are less clear. Three rules have been validated in a different setting from the derivation cohort and one in the same setting. Specificity appears to be worse in validation cohorts. The CHALICE and NEXUS II rules appeared to be based on characteristics that our meta-analysis suggested were the most powerful predictors of ICI.
Our economic analysis confirms that the recent extension of access to CT scanning for MHI is appropriate. Liberal use of CT scanning based on a high-sensitivity decision rule is not only effective, but also a cost saving. The cost of CT scanning is very small compared with the estimated cost of caring for patients with brain injury worsened by delayed treatment. The analysis supports the view that all hospitals receiving patients with MHI should have unrestricted access to CT scanning. Our survey suggests that this is achieved by around 95% of NHS EDs.
High-sensitivity clinical decision rules that selected patients for CT were more cost-effective than CT for all. We found that the CCHR (high or medium criteria) was the optimal rule for adults. The optimal rule for children was less certain, with either the CHALICE or NEXUS II rules appearing optimal, but based on very limited validation data. Attempts to improve the specificity of decision rules for MHI would be worthwhile, but must not compromise sensitivity. Although promising, there is currently insufficient evidence to recommend the use of S100B and other biomarkers for patients with MHI outside appropriately designed and powered research studies.
Hospital admission appears to be cost-effective for patients with an intracranial lesion on CT scanning, but not for those with a normal CT. It might be hoped that more liberal CT use would lead to less need for hospital admission, but this does not seem to be the case. The reasons for this are not clear and routine data sources are not yet sufficient to allow detailed investigation of admission rates and associations with different methods of service delivery. However, there is clearly potential for more cost-effective practice in relation to hospital admission for MHI and further research in this area could represent a worthwhile investment for the NHS. Moreover, not all intracranial lesions are likely to benefit from hospital admission and research is needed to identify those that do.

176 Conclusions
Suggested research priorities
The main research priorities suggested by this report are:
1. Evaluation of the diagnostic accuracy for clinically significant ICI of the CHALICE,30 PECARN,90 NEXUS II62 and UCD93 decision rules for children in a large representative cohort presenting to the ED with MHI.
2. Evaluation of the effects (and cost-effectiveness) of implementing guidelines, decision rules and diagnostic management strategies, including comparison to unstructured clinical care.
3. Evaluation of the outcomes of intracranial injuries identified on CT that do not require immediate neurosurgery, in terms of risk of subsequent deterioration leading to neurosurgical or critical care intervention, persistent symptoms, return to normal activities and QoL. This could involve development of definitions of what constitutes clinically significant injury and adverse outcome.
4. Evaluation of the diagnostic accuracy of S100B alongside validated clinical decision rules to determine whether it can improve decision rule specificity without compromising specificity.
5. Evaluation of the diagnostic performance of clinical characteristics, decision rules and biomarkers, along with the prognostic value of a normal CT scan and outcomes of MHI in anticoagulated patients.
These research priorities mostly require a large patient cohort and thus substantial funding. Where possible attempts should be made to address multiple objectives in the same cohort, i.e. data and blood samples should be collected to allow comparison of all potentially worthwhile decision rules and biomarkers. Decision rules for adults are reasonably accurate, well validated and cost-effective, so any research to further develop or refine diagnostic strategies for adults may benefit from expected value of sample information analysis using our model to determine whether the benefits of further research justify the costs.

© Queen’s Printer and Controller of HMSO 2011. This work was produced by Pandor et al. under the terms of a commissioning contract issued by the Secretary of State for Health.
177 Health Technology Assessment 2011; Vol. 15: No. 27DOI: 10.3310/hta15270
Acknowledgements
We would like to thank the following people for their help with this project:
Professor Timothy J Coats, Academic Unit of Emergency Medicine, Leicester University, Leicester, UK.
Dr David Hughes, Department of Neuroradiology, Hope Hospital, Salford, UK.
Dr Fiona Lecky, Trauma Audit and Research Network, University of Manchester, Manchester, UK.
Tim Pigott, Walton Centre for Neurology and Neurosurgery, Fazakerley, Liverpool, UK.
Jake Timothy, Department of Neurosurgery, Leeds General Infirmary, Leeds, UK, for providing clinical expertise.
Professor Alex Sutton, Department of Health Sciences, University of Leicester, Leicester, UK, for providing statistical advice.
Thanks also to Joanne Turner for clerical assistance.
Contributions of authors
Abdullah Pandor (Research Fellow) co-ordinated the review and was responsible for the acquisition of data, analysis and interpretation of data (for the systematic reviews and postal survey of UK hospitals) and drafting/revising of the final report.
Steve Goodacre (Professor of Emergency Medicine) was responsible for conception and design, acquisition of data, analysis and interpretation of data (for the systematic reviews, postal survey of UK hospitals and health economic evaluations) and drafting/revising the final report.
Sue Harnan (Research Associate) was responsible for the acquisition of data, analysis and interpretation of data (for the systematic reviews) and drafting/revising the final report.
Mike Holmes (Operational Research Analyst) was responsible for the acquisition of data, analysis and interpretation of data (for the health economic evaluations) and drafting/revising the final report.
Alastair Pickering (Clinical Lecturer in Emergency Medicine) was responsible for the acquisition of data, analysis and interpretation of data (for the systematic reviews) and drafting/revising the final report.
Patrick Fitzgerald (Research Fellow in Health Economics) provided statistical support and undertook the meta-analyses.
Angie Rees (Information Specialist) was responsible for the development and undertaking of the electronic literature searches.

178 Acknowledgements
Matt Stevenson (Mathematical Modeller) oversaw the modelling and reviewed the final report.
Publications
Goodacre SW, Pandor A, Pickering A. Management of isolated minor head injury in the UK. Emerg Med J 2010;27:856–9.
Pickering A, Harnan S, Fitzgerald P, Pandor A, Goodacre S. Clinical decision rules for children with minor head injury: a systematic review. Arch Dis Child 2011;96:414–21.

© Queen’s Printer and Controller of HMSO 2011. This work was produced by Pandor et al. under the terms of a commissioning contract issued by the Secretary of State for Health.
179 Health Technology Assessment 2011; Vol. 15: No. 27DOI: 10.3310/hta15270
References
1. National Institute for Health and Clinical Excellence (NICE). Head injury – triage, assessment, investigation and early management of head injury in infants, children and adults. NICE Clinical Guideline no. 56. London: NICE; 2007.
2. Kay A, Teasdale G. Head injury in the United Kingdom. World J Surg 2001;25:1210–20.
3. Jennett B. Epidemiology of head injury. J Neurol Neurosurg Psychiatry 1996;60:362–9.
4. Tennant A. Admission to hospital following head injury in England: incidence and socio-economic associations. BMC Public Health 2005;5:21.
5. Yates PJ, Williams WH, Harris A, Round A, Jenkins R. An epidemiological study of head injuries in a UK population attending an emergency department. J Neurol Neurosurg Psychiatry 2006;77:699–701.
6. Swann IJ, Teasdale GM. Current concepts in the management of patients with so-called ‘minor’ or ‘mild’ head injury. Trauma 1999;1:143–55.
7. Lee EJ, Hung YC, Wang LC, Chung KC, Chen HH. Factors influencing the functional outcome of patients with acute epidural hematomas: analysis of 200 patients undergoing surgery. J Trauma 1998;45:946–52.
8. Cheung PSY, Lam MY, Yeung JHH, Graham CA, Rainer TH. Outcome of traumatic extradural haematoma in Hong Kong. Injury 2007;38:76–80.
9. Cook RJD, Dorsch NWC, Fearnside MR, Chaseling R. Outcome prediction in extradural haematomas. Acta Neurochir 1988;95:90–4.
10. Gerlach R, Dittrich S, Schneider W, Ackermann H, Seifert V, Kieslich M. Traumatic epidural hematomas in children and adolescents outcome analysis in 39 consecutive unselected cases. Pediatr Emerg Care 2009;25:164–9.
11. Haselsberger K, Pucher R, Auer LM. Prognosis after acute subdural or epidural haemorrhage. Acta Neurochir 1988;90:111–16.
12. Deverill J, Aitken LM. Treatment of extradural haemorrhage in Queensland: interhospital transfer, preoperative delay and clinical outcome. Emerg Med Australasia 2007;19:325–32.
13. Hannan ELF, Farell LS, Cooper A, Henry M, Simon B, Simon R. Physiologic trauma triage criteria in adult trauma patients: are they effective in saving lives by transporting patients to trauma centers? J Am Coll Surg 2005;200:584–92.
14. Borg J, Holm L, Peloso PM, Cassidy JD, Carroll LJ, von Holst H, et al. D. Non-surgical intervention and cost for mild traumatic brain injury: results of the WHO Collaborating Centre Task Force on Mild Traumatic Brain Injury. J Rehab Med 2004;36:76–83.
15. Ponsford J, Willmott C, Rothwell A, Cameron P, Kelly AM, Nelms R, et al. Impact of early intervention on outcome following mild head injury in adults. J Neurol Neurosurg Psychiatry 2002;73:330–2.
16. Ponsford J, Willmott C, Rothwell A, Cameron P, Ayton G, Nelms R, et al. Impact of early intervention on outcome after mild traumatic brain injury in children. Pediatrics 2001;108:1297–303.
17. Andersson E, Emanuelson I, Bjorklund R, Stalhammar DA. Mild traumatic brain injuries: the impact of early intervention on late sequelae. A randomized controlled trial. Acta Neurochir 2007;149:151–9.
180 References
18. Fabbri A, Servadei F, Marchesini G, Stein SC, Vandelli A. Observational approach to subjects with mild-to-moderate head injury and initial non-neurosurgical lesions. J Neurol Neurosurg Psychiatry 2008;79:1180–5.
19. National Institute for Health and Clinical Excellence (NICE). Head injury – triage, assessment, investigation and early management of head injury in infants, children and adults. NICE Clinical Guideline No. 4. London: NICE; 2003.
20. Scottish Intercollegiate Guidelines Network (SIGN). Early management of patients with a head injury. SIGN Publication No. 110. Edinburgh: SIGN; 2009.
21. Sultan HY, Boyle A, Pereira M, Antoun N, Maimaris C. Application of the Canadian CT head rules in managing minor head injuries in a UK emergency department: implications for the implementation of the NICE guidelines. Emerg Med J 2004;21:420–5.
22. Hassan Z, Smith M, Littlewood S, Bouamra O, Hughes D, Biggin C, et al. Head injuries: a study evaluating the impact of the NICE head injury guidelines. Emerg Med J 2005;22:845–9.
23. Shravat BP, Hynes KA. The impact of NICE guidelines for the management of head injury on the workload of the radiology department. Emerg Med J 2004;21:521–2.
24. Goodacre S. Hospital admissions with head injury following publication of NICE guidance. Emerg Med J 2008;25:556–7.
25. Dunning J, Stratford-Smith P, Lecky F, Batchelor J, Hogg K, Browne J, et al. A meta-analysis of clinical correlates that predict significant intracranial injury in adults with minor head trauma. J Neurotrauma 2004;21:877–85.
26. Stiell IG, Wells GA, Vandemheen K, Clement C, Lesiuk H, Laupacis A, et al. The Canadian CT Head Rule for patients with minor head injury. Lancet 2001;357:1391–6.
27. Haydel MJ, Preston CA, Mills TJ, Luber S, Blaudeau E, DeBlieux MC. Indications for computed tomography in patients with minor head injury. N Engl J Med 2000;343:100–5.
28. Richless LK, English K, Heller MB, Rachlin J, McClean P, Auble TE. A prospective evaluation of radiologic criteria for head injury patients in a community emergency department. Am J Emerg Med 1993;11:327–30.
29. Miller EC, Holmes JF, Derlet RW. Utilizing clinical factors to reduce head CT scan ordering for minor head trauma patients. J Emerg Med 1997;15:453–7.
30. Dunning J, Daly JP, Lomas JP, Lecky F, Batchelor J, Mackway-Jones. Derivation of the children’s head injury algorithm for the prediction of important clinical events decision rule for head injury in children. Arch Dis Child 2006;91:885–91.
31. Hofman PA, Nelemans P, Kemerink, GJ, Wilmink JT. Value of radiological diagnosis of skull fracture in the management of mild head injury: meta-analysis. J Neurol Neurosurg Psychiatry 2000;68:416–22.
32. Dunning J, Batchelor J, Stratford-Smith P, Teece S, Browne J, Sharpin C, et al. A meta-analysis of variables that predict significant intracranial injury in minor head trauma. Arch Dis Child 2004;89:653–9.
33. Kelly AB, Zimmerman RD, Snow RB, Gandy SE, Heier LA, Deck MD. Head trauma: comparison of MR and CT – experience in 100 patients. AJNR Am J Neuroradiol 1988;9:699–708.
34. Ingebrigtsen T, Romner B. Routine early CT-scan is cost saving after minor head injury. Acta Neurol Scand 1996;93:207–10.

© Queen’s Printer and Controller of HMSO 2011. This work was produced by Pandor et al. under the terms of a commissioning contract issued by the Secretary of State for Health.
181 Health Technology Assessment 2011; Vol. 15: No. 27DOI: 10.3310/hta15270
35. Af Geijerstam JL, Oredsson S, Britton M, Octopus Study Investigators. Medical outcome after immediate computed tomography or admission for observation in patients with mild head injury: randomised controlled trial. BMJ 2006;333:465.
36. Norlund A, Marke LA, af Geijerstam JL, Oredsson S, Britton M. Immediate computed tomography or admission for observation after mild head injury: cost comparison in randomised controlled trial. BMJ 2006;333:469.
37. Af Geijerstam J-L, Britton M, Marke L-A. Mild head injury: observation or computed tomography? Economic aspects by literature review and decision analysis. Emerg Med J 2004;21:54–8.
38. Savola O, Pyhtinen J, Leino TK, Siitonen S, Niemela O, Hillbom M, et al. Effects of head and extracranial injuries on serum protein S100B levels in trauma patients. J Trauma 2004;56:1229–34.
39. Jagoda AS, Bazarian JJ, Bruns JJ Jr, Cantrill SV, Gean AD, Howard PK, et al. Clinical policy: neuroimaging and decision-making in adult mild traumatic brain injury in the acute setting. J Emerg Nurs 2009;35:e5–40.
40. Centre for Reviews and Dissemination (CRD). Systematic reviews: CRD’s guidance for undertaking reviews in health care. CRD Report No. 4. 3rd edn. York: University of York; 2008.
41. Leeflang MM, Deeks JJ, Gatsonis C, Bossuyt PM, Cochrane Diagnostic Test Accuracy Working Group. Systematic reviews of diagnostic test accuracy. Ann Intern Med 2008;149:889–97.
42. Deeks JJ, Bossuyt PM, Gatsonis C (editors). Cochrane handbook for systematic reviews of diagnostic test accuracy, version 1.0. 2009. URL: http://srdta.cochrane.org
43. Stiell IG, Wells GA. Methodologic standards for the development of clinical decision rules in emergency medicine. Ann Emerg Med 1999;33:437–47.
44. Ryu WH, Feinstein A, Colantonio A, Streiner DL, Dawson D. Regional variability in the use of CT for patients with suspected mild traumatic brain injury. Can J Neurol Sci 2009;36:42–6.
45. Stiell IG, Wells GA, Vandemheen K, Laupacis A, Brison R, Eisenhauer MA, et al. Variation in ED use of computed tomography for patients with minor head injury. Ann Emerg Med 1997;30:14–22.
46. Stiell IG, Clement CM, Rowe BH, Schull MJ, Brison R, Cass D. Comparison of the Canadian CT head rule and the New Orleans criteria in patients with minor head injury. JAMA 2005;294:1511–18.
47. Whiting P, Rutjes AW, Reitsma JB, Bossuyt PM, Kleijnen J. The development of QUADAS: a tool for the quality assessment of studies of diagnostic accuracy included in systematic reviews. BMC Med Res Methodol 2003;3:25.
48. Juni P, Witschi A, Bloch R, Egger M. The hazards of scoring the quality of clinical trials for meta-analysis. JAMA 1999;282:1054–60.
49. Whiting P, Harbord R, Kleijnen J. No role for quality scores in systematic reviews of diagnostic accuracy studies. BMC Med Res Methodol 2005;5:19.
50. Review Manager (RevMan). Version 5.0. 2008. Copenhagen: The Nordic Cochrane Centre, The Cochrane Collaboration; 2008.
51. Deeks JJ, Altman DG. Diagnostic tests 4: likelihood ratios. BMJ 2004;329:168–9.

182 References
52. DerSimonian R, Laird N. Meta-analysis in clinical trials. Clin Trials 1986;7:177–88.
53. Reitsma JB, Glas AS, Rutjes AW, Scholten RJ, Bossuyt PM, Zwinderman AH. Bivariate analysis of sensitivity and specificity produces informative summary measures in diagnostic reviews. J Clin Epidemiol 2005;58:982–90.
54. Arienta C, Caroli M, Balby S. Management of head-injured patients in the emergency department: a practical protocol. Surg Neurol 1997;48:213–19.
55. Borczuk P. Predictors of intracranial injury in patients with mild head trauma. Ann Emerg Med 1995;25:731–6.
56. Duus BR, Lind B, Christensen H, Nielsen OA. The role of neuroimaging in the initial management of patients with minor head injury. Ann Emerg Med 1994;23:1279–83.
57. Fabbri A, Servadei F, Marchesini G, Dente M, Lervese T, Spada M, et al. Clinical performance of NICE recommendations versus NCWFNS proposal in patients with mild head injury. J Neurotrauma 2005;22:1419–27.
58. Falimirski ME, Gonzalez R, Rodriguez A, Wilberger J. The need for head computed tomography in patients sustaining loss of consciousness after mild head injury. J Trauma 2003;55:1–6.
59. Holmes JF, Baier ME, Derlet RW. Failure of the Miller criteria to predict significant intracranial injury in patients with a Glasgow Coma Score of 14 after minor head trauma. Acad Emerg Med 1997;4:788–92.
60. Ibanez J, Arikan F. Reliability of clinical guidelines in the detection of patients at risk following mild head injury: results of a prospective study. J Neurosurg 2004;100:825–34.
61. Madden C, Witzkc DB, Arthur, Sanders B, Valente J, Fritz M, et al. High-yield selection criteria for cranial computed tomography after acute trauma. Acad Emerg Med 1995;2:248–53.
62. Mower WRH, Hoffman HJ, Herbert M, Wolfson AB, Pollack CV, Zucker MI, et al. Developing a decision instrument to guide computed tomographic imaging of blunt head injury patients. J Trauma 2005;59:954–9.
63. Ono K, Wada K, Takahara T, Shirotani T. Indications for computed tomography in patients with mild head injury. Neurol Med Chir 2007;47:291–7.
64. Reinus WR, Wippold FJ, Erickson, KK. Practical selection criteria for noncontrast cranial computed tomography in patients with head trauma. Ann Emerg Med 1993;22:1148–55.
65. Rosengren D, Rothwell S, Brown AF, Chu K, Rosengren D, Rothwell S. The application of North American CT scan criteria to an Australian population with minor head injury. Emerg Med Australas 2004;16:195–200.
66. Saadat S, Ghodsi SM, Naieni KH, Firouznia K, Hosseini M, Kadkhodaie HR, et al. Prediction of intracranial computed tomography findings in patients with minor head injury by using logistic regression. J Neurosurg 2009;111:688–94.
67. Saboori M, Ahmadi J, Farajzadegan Z. Indications for brain CT scan in patients with minor head injury. Clin Neurol Neurosurg 2007;109:399–405.
68. Smits M, Dippel DW, de Haan GG, Dekker HM, Vos PE, Nederkoorn PJ, et al. External validation of the Canadian Head Rule and the New Orleans Criteria for CT scanning in patients with minor head injury. JAMA 2005;294:1519–25.

© Queen’s Printer and Controller of HMSO 2011. This work was produced by Pandor et al. under the terms of a commissioning contract issued by the Secretary of State for Health.
183 Health Technology Assessment 2011; Vol. 15: No. 27DOI: 10.3310/hta15270
69. Smits M, Dippel DW, Steyerberg EW, de Haan GG, Dekker HM, Vos PE, et al. Predicting intracranial traumatic findings on computed tomography in patients with minor head injury: the CHIP prediction rule. Ann Intern Med 2007;146:397–405.
70. Smits M, Dippel DW, Steyerberg EW, de Haan GG, Dekker HM, Vos PE, et al. Minor head injury: Guidelines for the use of CT: a multicenter validation study. Radiology 2007;245:831–8.
71. Stein SC, Fabbri A, Servadei F, Glick HA. A critical comparison of clinical decision instruments for computed tomographic scanning in mild closed traumatic brain injury in adolescents and adults. Ann Emerg Med 2009;53:180–8.
72. Servadei F, Teasdale G, Merry G, Neurotraumatology Committee of the World Federation of Neurosurgical Societies. Defining acute mild head injury in adults: a proposal based on prognostic factors, diagnosis, and management. J Neurotrauma 2001;18:657–64.
73. Ingebrigtsen T, Romner B, Kock-Jensen C. Scandinavian guidelines for initial management of minimal, mild, and moderate head injuries. The Scandinavian Neurotrauma Committee. J Trauma 2000;48:760–6.
74. Stein SC. Management of minor closed head injury. Neurosurg Quart 1996;6:108–15.
75. Tomei G, Brambilla GL, Delfini R, Servadei F, Ambrosio A, Acampora S, et al. Guidelines for minor head injured patient’s management in adult age. J Neurosurg Sci 1996;40:11–15.
76. Lapierre F. [Guide-lines for head injured patients management in adult age. Neurosurgical Society of France.] Neurochirurgie 1998;44:55–6.
77. Murshid WR. Management of minor head injuries: admission criteria, radiological evaluation and treatment of complications. Acta Neurochir 1998;140:56–64.
78. Teasdale G, Gentleman D, Andrews P. Early management of patients with head injury. SIGN Publication No. 46. Edinburgh: SIGN; 2000.
79. Vos PE, Battistin L, Birbamer G, Gerstenbrand F, Potapov A, Prevec T, et al. EFNS guideline on mild traumatic brain injury: report of an EFNS task force. Eur J Neurol 2002;9:207–19.
80. Whiting P, Rutjes AW, Reitsma JB, Glas AS, Bossuyt PM, Kleijnen J. Sources of variation and bias in studies of diagnostic accuracy: a systematic review. Ann Intern Med 2004;140:189–202.
81. Atabaki SM, Stiell IG, Bazarian JJ, Daow KE, Vu TT, Camarca MA, et al. A clinical decision rule for cranial computed tomography in minor pediatric head trauma. Arch Pediatr Adolesc Med 2008;162:439–45.
82. Buchanich JM. A clinical decision-making rule for mild head injury in children less than three years old. PhD thesis. Pittsburg, PA: University of Pittsburgh; 2007.
83. Da Dalt L, Marchi AG, Laudizi L, Crichiutti G, Messi G, Pavanello L, et al. Predictors of intracranial injuries in children after blunt head trauma. Eur J Pediatr 2006;165:142–8.
84. Dietrich AM, Bowman MJ, Ginn-Pease ME, Kosnik E, King, D.R. Pediatric head injuries: can clinical factors reliably predict an abnormality on computed tomography? Ann Emerg Med 1993;22:1535–40.
85. Greenes DS, Schutzman SA. Clinical indicators of intracranial injury in head-injured infants. Pediatrics 1999;104:861–7.
86. Greenes DS, Schutzman SA. Clinical significance of scalp abnormalities in asymptomatic head-injured infants. Pediatr Emerg Care 2001;17:88–92.
184 References
87. Guzel A, Hicdonmez T, Temizoz O, Aksu B, Aylanc H, Karasalihoglu S. Indications for brain computed tomography and hospital admission in pediatric patients with minor head injury: how much can we rely upon clinical findings? Pediatr Neurosurg 2009;45:262–70.
88. Haydel MJ, Shembekar AD. Prediction of intracranial injury in children aged five years and older with loss of consciousness after minor head injury due to nontrivial mechanisms. Ann Emerg Med 2003;42:507–14.
89. Klemetti S, Uhari M, Pokka T, Rantala H. Evaluation of decision rules for identifying serious consequences of traumatic head injuries in pediatric patients. Pediatr Emerg Care 2009;25:811–15.
90. Kuppermann N, Holmes JF, Dayan PS, Hoyle JD Jr, Atabaki SM, Holubkov R, et al. Identification of children at very low risk of clinically important brain injuries after head trauma: a prospective cohort study. Lancet 2009;374:1160–70.
91. Oman JAC. Performance of a decision rule to predict need for computed tomography among children with blunt head trauma. Pediatrics 2006;117:e238–46.
92. Osmond MH, Klassen TP, Stiell IG, Correll R. The CATCH Rule: a clinical decision rule for the computed tomography of the head in children with minor head injury. Acad Emerg Med 2006; 13:S11(Abstract). Presented at the Society for Academic Emergency Medicine, May 2006, San Francisco, CA, USA.
93. Palchak MJ, Holmes JF, Vance CW, Gelber RE, Schauer BA, Harrison MJ, et al. A decision rule for identifying children at low risk for brain injuries after blunt head trauma. Ann Emerg Med 2003;42:492–506.
94. Quayle KS, Jaffe DM, Kuppermann N, Kaufman BA, Lee BC, Park TS, et al. Diagnostic testing for acute head injury in children: when are head computed tomography and skull radiographs indicated? Pediatrics 1997;9:E1–8.
95. Sun BCH, Hoffman JR, Mower WR. Evaluation of a modified prediction instrument to identify significant pediatric intracranial injury after blunt head trauma. Ann Emerg Med 2007;49:325–32.
96. Royal College of Surgeons of England (RCSENG). Report of the working party on the management of patients with head injury. London: RCSENG Council; 1999.
97. Mehta S. Neuroimaging for paediatric minor closed head injuries. Paediatr Child Health 2007;12:482–4.
98. Biberthaler P, Linsenmeier U, Pfeifer K, Kroetz M, Mussack T, Kanz K, et al. Serum S-100B concentration provides additional information for the indication of computed tomography in patients after minor head injury a prospective multicenter study. Shock 2006;25:446–53.
99. Chan HC, Adnan WA, Jaalam K, Abdullah MR, Abdullah, J. Which mild head injured patients should have follow-up after discharge from an accident and emergency ward? A study in a university hospital setting in Kelantan, Malaysia. Southeast Asian J Trop Med Public Health 2005;36:982–93.
100. Cook LS, Levitt MA, Simon B, Williams VL. Identification of ethanol-intoxicated patients with minor head trauma requiring computed tomography scans. Acad Emerg Med 1994;1:227–34.
101. Dunham CM, Coates S, Cooper C. Compelling evidence for discretionary brain computed tomographic imaging in those patients with mild cognitive impairment after blunt trauma. J Trauma 1996;41:679–86.

© Queen’s Printer and Controller of HMSO 2011. This work was produced by Pandor et al. under the terms of a commissioning contract issued by the Secretary of State for Health.
185 Health Technology Assessment 2011; Vol. 15: No. 27DOI: 10.3310/hta15270
102. Feuerman T, Wackym PA, Gade GF, Becker DP. Value of skull radiography, head computed tomographic scanning, and admission for observation in cases of minor head injury. Neurosurgery 1988;22:449–53.
103. Gomez PA, Lobato RD, Ortega JM. Mild head injury: differences in prognosis among patients with a Glasgow Coma Scale score of 13 to 15 and analysis of factors associated with abnormal CT findings. Br J Neurosurg 1996;10:453–60.
104. Harad FT, Kerstein MD. Inadequacy of bedside indicators in identifying intracranial injury in trauma patients. J Trauma 1992;32:359–61.
105. Hsiang JN, Yeung T, Yu AL, Poon WS. High-risk mild head injury. J Neurosurg 1997;87:234–8.
106. Hung CC, Chiu WT, Lee LS, Lin LS, Shih CJ. Risk factors predicting surgically significant intracranial hematomas in patients with head injuries. J Formos Med Assoc 1996;95:294–7.
107. Jeret JS, Mandell M, Anzistka B. Clinical predictors of abnormality disclosed by computed tomography after mild head trauma. Neurosurgery 1993;32:9–15.
108. Livingston DH, Lavery RF, Passanannte MR. Emergency department discharge of patients with a negative cranial computed tomography scan after minimal head injury. Ann Surg 2000;232:126–32.
109. Livingston DH, Loder PA, Koziol J, Hunt CD. The use of CT scanning to triage patients requiring admission following minimal head injury. J Trauma 1991;31:483–9.
110. Mack LR, Chan SB, Silva JC, Hogan TM. The use of head computed tomography in elderly patients sustaining minor head trauma. J Emerg Med 2003;24:157–62.
111. Miller EC, Derlet RW, Kinser D. Minor head trauma: is computed tomography always necessary? Ann Emerg Med 1996;27:290–4.
112. Moran SG, McCarthy MC, Uddin DE, Poelstra RJ. Predictors of positive CT scans in the trauma patient with minor head injury. Am Surg 1994;60:533–5.
113. Muller K, Townend W, Biasca N, Unden J, Waterloo K, Romner B, et al. S100B serum level predicts computed tomography findings after minor head injury. J Trauma 2007;62:1452–6.
114. Murshid WR. Role of skull radiography in the initial evaluation of minor head injury: a retrospective study. Acta Neurochir 1994;129:11–14.
115. Mussack T, Biberthaler P, Kanz KG, Heckl U, Gruber R, Linsenmaier U, et al. Immediate S-100B and neuron-specific enolase plasma measurements for rapid evaluation of primary brain damage in alcohol-intoxicated, minor head-injured patients. Shock 2002;18:395–400.
116. Nelson JB, Bresticker MA, Nahrwold DL. Computed tomography in the initial evaluation of patients with blunt trauma. J Trauma 1992;33:722–7.
117. Rosenorn J, Duus B, Nielsen K, Kruse K, Boesen T. Is a skull X-ray necessary after milder head trauma? Br J Neurosurg 1991;5:135–9.
118. Schynoll W, Overton D, Krome R, Wesolowski D, Wang AM, Wilson A, et al. A prospective study to identify high-yield criteria associated with acute intracranial computed tomography findings in head-injured patients. Am J Emerg Med 1993;11:321–6.
119. Shackford SR, Wald SL, Rose SE. The clinical utility of computed tomographic scanning and neurologic examinations in the management of patients with minor head injuries. J Trauma 1992;33:385–94.
120. Sharma P, Dahiya RS, Dass B, Dewan Y, Arora AL, Sharma P, et al. How important is history of unconsciousness in head injury patients? J Indian Med Assoc 2001;99:81–3.

186 References
121. Stein SC, Ross SE. Mild head injury: a plea for routine early CT scanning. J Trauma 1992;33:11–13.
122. Stein SC, Ross SE. The value of computed tomographic scans in patients with low-risk head injuries. Neurosurgery 1990;26:638–40.
123. Tender GC, Awasthi D. Risk stratification in mild head injury patients: the head injury predictive index. J La State Med Soc 2003;155:338–42.
124. Thiruppathy SP, Muthukumar N. Mild head injury: revisited. Acta Neurochir 2004;146:1075–83.
125. Tsai EA. Value of emergency room computed tomography brain scan in mild head injury patients. J Surg Assoc Repub China 1994;27:2278–82.
126. Vilke GM, Chan TC, Guss DA, Vilke GM. Use of a complete neurological examination to screen for significant intracranial abnormalities in minor head injury. Am J Emerg Med 2000;18:159–63.
127. Chan KH, Mann KS, Yue CP, Fan YW, Cheung M. The significance of skull fracture in acute traumatic intracranial hematomas in adolescents: a prospective study. J Neurosurg 1990;72:189–94.
128. Boran BO, Boran P, Barut N, Akgun C, Celikoglu E, Bozbuga M. Evaluation of mild head injury in a pediatric population. Pediatr Neurosurg 2006;42:203–7.
129. Davis RL, Mullen N, Makela M, Taylor JA, Cohen W, Rivara FP. Cranial computed tomography scans in children after minimal head injury with loss of consciousness. Ann Emerg Med 1994;24:640–5.
130. Fridriksson T, Kini N, Walsh-Kelly C, Hennes H. Serum neuron-specific enolase as a predictor of intracranial lesions in children with head trauma: A pilot study. Acad Emerg Med 2000;7:816–20.
131. Hahn YS, McLone DG. Risk factors in the outcome of children with minor head injury. Pediatr Neurosurg 1993;19:135–42.
132. Keskil IS, Baykaner MK, Ceviker N, Kaymaz M. Assessment of mortality associated with mild head-injury in the pediatric age group. Childs Nerv Syst 1995;11:467–73.
133. Mandera M, Wencel T, Bazowski P, Krauze J. How should we manage children after mild head injury? Childs Nerv Syst 2000;16:156–60.
134. Ng SM, Toh EM, Sherrington CA. Clinical predictors of abnormal computed tomography scans in paediatric head injury. J Paediatr Child Health 2002;38:388–92.
135. Ramundo ML, McKnight T, Kempf J, Satkowiak L. Clinical predictors of computed tomographic abnormalities following pediatric traumatic brain injury. Pediatr Emerg Care 1995;11:1–4.
136. Reed MJ, Browning JG, Wilkinson AG, Beattie T. Can we abolish skull x-rays for head injury? Arch Dis Child 2005;90:859–64.
137. Schunk JE, Rodgerson JD, Woodward GA. The utility of head computed tomographic scanning in pediatric patients with normal neurologic examination in the emergency department. Pediatr Emerg Care 1996;12:160–5.
138. Simon B, Letourneau P, Vitorino E, McCall J. Pediatric minor head trauma: Indications for computed tomographic scanning revisited. J Trauma 2001;51:231–8.
139. Stein SC, Doolin EJ. Management of minor closed head injury in children and adolescents. Pediatr Surg Int 1995;10:465–71.

© Queen’s Printer and Controller of HMSO 2011. This work was produced by Pandor et al. under the terms of a commissioning contract issued by the Secretary of State for Health.
187 Health Technology Assessment 2011; Vol. 15: No. 27DOI: 10.3310/hta15270
140. Wang MY, Griffith P, Sterling J, McComb J, Levy M. A prospective population-based study of pediatric trauma patients with mild alterations in consciousness (Glasgow Coma Scale score of 13–14). Neurosurgery 2000;46:1093–9.
141. Fisher JD. Symptomatic blunt head injury in children: a prospective, single-investigator study. Clin Pediatr 1997;36:461–5.
142. Halley MK, Silva PD, Foley J, Rodarte A. Loss of consciousness: when to perform computed tomography? Pediatr Crit Care Med 2004;5:230–3.
143. Biberthaler P, Mussack T, Wiedemann E, Kanz KG, Mutschler W, Linsenmaier U, et al. Rapid identification of high-risk patients after minor head trauma (MHT) by assessment of S-100B: ascertainment of a cut-off level. Eur J Med Res 2002;7:164–70.
144. Castellani C, Bimbashi P, Ruttenstock E, Sacherer P, Stojakovic T, Weinberg AM. Neuroprotein S-100B: a useful parameter in paediatric patients with mild traumatic brain injury? Acta Pediatr 2009;98:1607–12.
145. Ingebrigtsen T, Romner B, Marup-Jensen S, Dons M, Lundqvist C, Bellner J, et al. The clinical value of serum S-100 protein measurements in minor head injury: a Scandinavian multicentre study. Brain Injury 2000;14:1047–55.
146. Morochovic R, Racz O, Kitka M, Pingorova S, Cibur P, Tomkova D, et al. Serum S100B protein in early management of patients after mild traumatic brain injury. Eur J Neurol 2009;16:1112–17.
147. Poli-de-Figueiredo LF, Biberthaler P, Simao, Filho C, Hauser C, Mutschler W, et al. Measurement of S-100B for risk classification of victims sustaining minor head injury: first pilot study in Brazil. Clinics 2006;61:41–6.
148. Romner B, Ingebrigtsen T, Kongstad P, Borgesen SE. Traumatic brain damage: Serum S-100 protein measurements related to neuroradiological findings. J Neurotrauma 2000;17:641–7.
149. Biberthaler P, Mussack T, Wiedemann E, Kanz K, Koelsch M, Gippner-Steppert C, et al. Evaluation of S-100b as a specific marker for neuronal damage due to minor head trauma. World J Surg 2001;25:93–7.
150. Levitt MA, Cook LA, Simon BC, Williams V, Levitt MA, Cook LA, et al. Biochemical markers of cerebral injury in patients with minor head trauma and ethanol intoxication. Acad Emerg Med 1995;2:675–80.
151. Cochrane Effective Practice and Organisation of Care Group. Data collection checklist. 2010. URL: www.epoc.cochrane.org/Files/Website%20files/Documents/Reviewer%20Resources/datacollectionchecklist.pdf
152. Brown SR, Raine C, Robertson CE, Swann IJ. Management of minor head injuries in the accident and emergency department: the effect of an observation ward. J Accident Emerg Med 1994;11:144–8.
153. Fabbri A, Servadei F, Marchesini G, Dente M, Iervese T, Spada M, et al. Which type of observation for patients with high-risk mild head injury and negative computed tomography? Eur J Emerg Med 2004;11:65–9.
154. Browning JG, Reed MJ, Wilkinson AG, Beattie, T. Imaging infants with head injury: effect of a change in policy. Emerg Med J 2005;22:33–6.
155. Fong C, Chong W, Villaneuva E, Segal AY. Implementation of a guideline for computed tomography head imaging in head injury: a prospective study. Emerg Med Australas 2008;20:410–19.

188 References
156. Kerr J, Smith R, Gray S, Beard D, Robertson CE. An audit of clinical practice in the management of head injured patients following the introduction of the Scottish Intercollegiate Guidelines Network (SIGN) recommendations. Emerg Med J 2005;22:850–4.
157. Loroni L, Ciucci G, Piccinini G, Cuscini M, Scorza P, Piola C, et al. Approach to head trauma in childhood in a district general hospital. Eur J Emerg Med 1996;3:141–8.
158. Shravat BP, Huseyin TS, Hynes KA. NICE guideline for the management of head injury: an audit demonstrating its impact on a district general hospital, with a cost analysis for England and Wales. Emerg Med J 2006;23:109–13.
159. Thomson R, Gray J, Madhok R, Mordue A, Mendelow AD. Effect of guidelines on management of head injury on record keeping and decision making in accident and emergency departments. Qual Health Care 1994;3:86–91.
160. Drummond MF, Jefferson TO. Guidelines for authors and peer reviewers of economic submissions to the BMJ. The BMJ Economic Evaluation Working Party. BMJ 1996;313:275–83.
161. Eddy DM (editor). Technology assessment: the role of mathematical modelling. In Assessing Medical Technology. Washington, DC: National Academy Press; 1985.
162. Smits M, Dippel DW, Nederkoorn PJ, Dekker HM, Vos PE, Kool DR, et al. Minor head injury: CT-based strategies for management: a cost-effectiveness analysis. Radiology 2010;254:532–40.
163. Stein SC, Burnett MG, Glick HA. Indications for CT scanning in mild traumatic brain injury: a cost-effectiveness study. J Trauma 2006;61:558–66.
164. Stein SC, Fabbri A, Servadei F. Routine serial computed tomographic scans in mild traumatic brain injury: when are they cost-effective? J Trauma 2008;65:66–72.
165. Aoki N, Kitahara T. Management of unruptured intracranial aneurysm in Japan: a Markovian decision analysis with utility measurements based on the Glasgow Outcome Scale. Med Decis Making 1998;18:357–64.
166. Smits M, Dippel DW, Nederkoorn PJ, Dekker HM. Predicting intracranial traumatic findings on computed tomography in patients with minor head injury: the CHIP prediction rule. Ann Intern Med 2007;146:397–405.
167. Af Geijerstam JL, Britton M. Mild head injury: reliability of early computed tomographic findings in triage for admission. Emerg Med J 2005;22:103–7.
168. Warn DE, Thompson SG, Spiegelhalter DJ. Bayesian random effects meta-analysis of trials with binary outcomes: methods for the absolute risk difference and relative risk scales. Stat Med 2002;21:1601–23.
169. Cordobés F, Lobato RD, Rivas JJ, Muñoz MJ, Chillón D, Portillo J, et al. Observations on 82 patients with extradural haematoma: comparison of results before and after the advent of computerized tomography. J Neurosurg 1981;54:179–86.
170. Office for National Statistics (ONS). United Kingdom, interim life tables 1980–82 to 2006–2008. London: ONS; 2008.
171. Whitnall L, McMillan TM, Murray GD, Teasdale GM. Disability in young people and adults after head injury: 5–7 year follow up of a prospective cohort study. J Neurol Neurosurg Psychiatry 2006;77:640–5.
172. Beecham J, Perkins M, Snell T, Knapp M. Treatment paths and costs for young adults with acquired brain injury in the United Kingdom. Brain Injury 2009;23:30–8.

© Queen’s Printer and Controller of HMSO 2011. This work was produced by Pandor et al. under the terms of a commissioning contract issued by the Secretary of State for Health.
189 Health Technology Assessment 2011; Vol. 15: No. 27DOI: 10.3310/hta15270
173. Duport, S. Royal Hospital for Neuro Disability, 8 May 2010, personal communication.
174. Department of Health. National schedule of reference costs 2007–08 for NHS trusts. London: Department of Health; 2010.
175. Curtis L. Unit Costs of Health and Social Care 2009. Personal Social Services Research Unit (PSSRU): University of Kent; 2009.
176. National Radiological Protection Board (NRPB). X-rays, how safe are they? Oxon: NRPB; 2001.
177. Berrington de González A, Darby S. Risk of cancer from diagnostic X-rays: estimates for the UK and 14 other countries. Lancet 2004;363:345–51.
178. Stein SC, Hurst RW, Sonnad SS. Meta-analysis of cranial CT scans in children. A mathematical model to predict radiation-induced tumors. Pediatr Neurosurg 2008;44:448–57.
179. Garside R, Pitt M, Anderson R, Rogers G, Dyer M, Mealing S, et al. The effectiveness and cost-effectiveness of carmustine implants and temozolomide for the treatment of newly diagnosed high-grade glioma: a systematic review and economic evaluation. Health Technol Assess 2007;11(45).
180. Stein SC, Fabbri A, Servadei F. A critical comparison of clinical decision instruments for computed tomographic scanning in mild closed traumatic brain injury in adolescents and adults. Ann Emerg Med 2009;53:180–8.
181. Fenwick E, Claxton K, Sculpher M. Representing uncertainty: the role of cost-effectiveness acceptability curves. Health Econ 2001;10:779–87.
182. National Institute for Health and Clinical Excellence. Guide to the methods of technology appraisal. 2008. URL: www.nice.org.uk/media/B52/A7/TAMethodsGuideUpdatedJune2008.pdf
183. Claxton K, Posnett J. An economic approach to clinical trial design and research priority-setting. Health Econ 1996;5:513–24.
184. Felli JC, Hazen GB. Sensitivity analysis and the expected value of perfect information. Med Decis Making 1998;18:95–109.
185. Ades AE, Lu G, Claxton K. Expected value of sample information calculations in medical decision modeling. Med Decis Making 2004;24:207–27.
186. Maguire JL, Boutis K, Uleryk EM, Laupacis A, Parkin PC. Should a head-injured child receive a head CT scan? A systematic review of clinical prediction rules. Pediatrics 2009;124:e145–54.
187. Berger RP, Kochanek PM. Urinary S100B concentrations are increased after brain injury in children: a preliminary study. Pediatr Crit Care Med 2006;7:557–61.
188. Pickering A, Carter J, Hanning I, Townend W. Emergency department measurement of urinary s100B in children following head injury: can extracranial injury confound findings? Emerg Med J 2008;25:88–9.
189. Schultke E, Sadanand V, Kelly ME, Griebel RW, Juurlink BH. Can admission S-100beta predict the extent of brain damage in head trauma patients? Can J Neurol Sci 2009;36:612–16.
190. Muller K, Elverland A, Romner B, Waterloo K, Langbakk B, Unden J, et al. Analysis of protein S-100B in serum: a methodological study. Clin Chem Lab Med 2006;44:1111–14.
191. Hallen M, Carlhed R, Karlsson M, Hallgren T, Bergenheim M. A comparison of two different assays for determining S-100B in serum and urine. Clin Chem Lab Med 2008;46:1025–9.

190 References
192. Adams J, Frumiento C, Shatney-Leach L, Vane DW. Mandatory admission after isolated mild closed head injury in children: is it necessary? J Pediatr Surg 2001;36:119–21.
193. Andronikou S, Kilborn T, Patel M, Fieggen AG. Skull fracture as a herald of intracranial abnormality in children with mild head injury: is there a role for skull radiographs? Australas Radiol 2003;47:381–5.
194. Anglin D, Hutson HR, Luftman J, Qualls S, Moradzadeh D. Intracranial hemorrhage associated with tangential gunshot wounds to the head. Acad Emerg Med 1998;5:672–8.
195. Anonymous. Which of the following selection criteria predict positive results on computed tomography scans for patients with traumatic head injury? Focal neurologic deficit. Alcohol intoxication. Depressed sensorium. Can Fam Physician 1994;40:1540–3.
196. Anonymous. Clinical criteria predict serious head injury risk in kids. J Fam Pract 2007;56:16.
197. Ariel VH, Guillermo PC, Guillermo PC. Optimización de la tomografía computarizada de crbneo en el trauma craneoencefalico leve. Rev Mex Neuroci 2006;7:194–9.
198. Atif, MKS, Qureshi NA. Post-traumatic vomiting: a predictor of severity of head injury. J Coll Physicians Surg Pak 2001;11:349–51.
199. Baglaj M, Czernik J, Ladogorska J. [Minor head injuries in children: are radiological examinations and hospitalization necessary in every case?] Pol J Surg 2005;77:672–89.
200. Balla JI, Elstein AS. Skull X-ray assessment of head injuries: a decision-analytic approach. Methods Inf Med 1984;23:135–8.
201. Bamvita JM, Lavoie A, Clas D, Demers J, Trottier E, Bergeron E, Centre de Recherche de l’Hopital Charles-LeMoyne. [The use of head CT scan in adult trauma victims: an algorithm.] Ann Chir 2006;131:250–5.
202. Bazarian JJ, Beck C, Blyth B, von Ahsen N, Hasselblatt M. Impact of creatine kinase correction on the predictive value of S-100B after mild traumatic brain injury. Restor Neurol Neurosci 2006;24:163–72.
203. Beaudin M, Saint-Vil D, Ouimet A, Mercier C, Crevier L. Clinical algorithm and resource use in the management of children with minor head trauma. J Pediatr Surg 2007;42:849–52.
204. Benito Fernández J, Mintegui Raso S, Sánchez Echániz J, Martinez González MJ, Fernández Cuesta MA. [Head injuries in children: can clinical features identify patients with high or low risk for intracranial injury?] An Esp Pediatr 1998;48:122–6.
205. Berger RP, Pierce MC, Wisniewski S, Adelson P, Kochanek P. Serum S100B concentrations are increased after closed head injury in children: A preliminary study. J Neurotrauma 2002;19:1405–9.
206. Bernard C, Noiret A, Oswald P, Hoeffel JC, Bernard C, Noiret A, et al. [What is the value of emergency cranial radiography in craniofacial injuries?] Sem Hop 1983;59:2567–9.
207. Biberthaler P, Mussack T, Wiedemann E, Gilg T, Soyka M, Koller G, et al. Elevated serum levels of S-100B reflect the extent of brain injury in alcohol intoxicated patients after mild head trauma. Shock 2001;16:97–101.
208. Biberthaler P, Mussack T, Kanz KG, Linsenmaier U, Pfeifer KJ, Mutschler W, et al. [Identification of high-risk patients after minor craniocerebral trauma. Measurement of nerve tissue protein S 100.] Unfallchirurg 2004;107:197–202.
209. Block R. A decision rule with 7 clinical criteria identified patients with minor head injury who did not need computed tomography. Evid-Based Med 2001;6:62.

© Queen’s Printer and Controller of HMSO 2011. This work was produced by Pandor et al. under the terms of a commissioning contract issued by the Secretary of State for Health.
191 Health Technology Assessment 2011; Vol. 15: No. 27DOI: 10.3310/hta15270
210. Boran BO, Barut N, Akgun C, Celikoglu E, Bozbuga M. [Indications for computed tomography in patients with mild head injuries.] Ulusal Travma ve Acil Cerrahi Dergisi 2005;11:218–24.
211. Bouvier D, Oddoze C, Ben Haim D, Moustafa F, Legrand A, Alazia M, et al. [Interest of S100B protein blood level determination for the management of patients with minor head trauma.] Ann Biol Clin (Paris) 2009;67:425–31.
212. Chan KH, Yue CP, Mann KS. The risk of intracranial complications in pediatric head injury. Results of multivariate analysis. Childs Nerv Syst 1990;6:27–9.
213. Chan HC, Aasim WA, Abdullah NM, Naing NN, Abdullah JM, Saffari MH, Osman A. Characteristics and clinical predictors of minor head injury in children presenting to two Malaysian accident and emergency departments. Singapore Med J 2005;46:219–23.
214. Clement CM, Stiell IG, Schull MJ, Rowe BH, Brison R, Lee JS, et al. Clinical features of head injury patients presenting with a Glasgow Coma Scale Score of 15 and who require neurosurgical intervention. Ann Emerg Med 2006;48:245–51.
215. Cummins BH. The management of minor head injuries. Curr Orthop 1992;6:240–4.
216. Dahl-Grove DL, Chande VT, Barnoski A. Closed head injuries in children: Is hospital admission always necessary? Pediatr Emerg Care 1995;11:86–8.
217. de Andrade AF, de Almeida AN, Bor-Seng-Shu E, Lourenco L, Mandel M, Marino R Jr. The value of cranial computed tomography in high-risk, mildly head-injured patients. Surg Neurol 2006;65(Suppl. 1):13.
218. de Boussard CN, Lundin A, Karlstedt D, Edman G, Bartfai A, Borg J. S100 and cognitive impairment after mild traumatic brain injury. J Rehab Med 2005;37:53–7.
219. de Boussard CN, Bellocco R, af Geijerstam JLA, Borg J, Adami J. Delayed intracranial complications after concussion. J Trauma 2006;61:577–81.
220. Dunning J, Daly JP, Malhotra R, Stratford-Smith P, Lomas JP, Lecky F, et al. The implications of NICE guidelines on the management of children presenting with head injury. Arch Dis Child 2004;89:763–7.
221. Duus BR, Boesen T, Kruse KV, Nielsen KB. Prognostic signs in the evaluation of patients with minor head injury. Br J Surg 1993;80:988–91.
222. Edna TH. Acute traumatic intracranial haematoma and skull fracture. Acta Chir Scand 1983;149:449–51.
223. Edna TH. Risk factors in traumatic head injury. Acta Neurochir 1983;69:15–21.
224. Edna TH, Cappelen J. Hospital admitted head injury. A prospective study in Trondelag, Norway, 1979–80. Scand J Soc Med 1984;12:7–14.
225. Espersen JO, Petersen OF, Espersen JO, Petersen OF. Computerized tomography (CT) in patients with head injuries. Assessment of outcome based upon initial clinical findings and initial CT scans. Acta Neurochir 1982;65:81–91.
226. Fabbri A, Servadei F, Marchesini G. Prospective validation of a proposal for diagnosis and management of patients attending the emergency department for mild head injury. J Neurol Neurosurg 2004;75:410–16.
227. Geyer C, Ulrich A, Grafe G, Stach B, Till H. Diagnostic value of S100B and neuron-specific enolase in mild pediatric traumatic brain injury. J Neurosurg 2009;4:339–44.
228. Gonzalez IC, Hernandez JAF. Analysis of minor head injuries treated in an Accident & Emergency Department. Emergencias 2007;19:21–4.

192 References
229. Gorelick MH, Atabaki SM, Hoyle J, Dayan DS, Holmes JF, Holubkov R, et al. Interobserver agreement in assessment of clinical variables in children with blunt head trauma. Acad Emerg Med 2008;15:812–18.
230. Greenes DS, Schutzman SA. Occult intracranial injury in infants. Ann Emerg Med 1998;32:680–6.
231. Gruskin KD, Schutzman SA, Gruskin KD, Schutzman SA. Head trauma in children younger than 2 years: are there predictors for complications? Arch Pediatr Adolesc Med 1999;153:15–20.
232. Gupta R, Taha MD, McCarroll K, Blair H, Wu J. Head CT evaluation in clinically stable motor vehicle collision patients. Emerg Radiol 2005;11:328–35.
233. Gutman MB, Moulton RJ, Sullivan I, Hotz G, Tucker WS, Muller PJ. Risk-factors predicting operable intracranial hematomas in head-injury. J Neurosurg 1992;77:9–14.
234. Harris OA, Bruce CA, Reid M, Cheeks R, Easley K, Surles MC, et al. Examination of the management of traumatic brain injury in the developing and developed world: focus on resource utilization, protocols, and practices that alter outcome. J Neurosurg 2008;109:433–8.
235. Hoffmann ME, Ma J, Gaddis G. Utility of an initial d-dimer assay in screening for traumatic or spontaneous intracranial hemorrhage. Acad Emerg Med 2001;8:859–65.
236. Hollingworth W, Vavilala M, Jarvik S. The use of repeated head computed tomography in pediatric blunt head trauma: Factors predicting new and worsening brain injury. Pediatr Crit Care Med 2007;8:348–56.
237. Holsti M, Kadish HA, Sill BL, Firth SD, Nelson DS. Pediatric closed head injuries treated in an observation unit. Pediatr Emerg Care 2005;21:639–44.
238. Benito Fernández J, Mintegui Raso S, Sanchez Echaniz J, Martinez Gonzales MJ, Fernandez Cuesta MA. Pediatric head trauma: Can clinical features predict the presence of an intracranial injury? An Esp Pediatr 1998;48:122–6.
239. Jones PA, Chambers IR, Minns RA, Lo TY, Myles LM, Steers AJ. Are head injury guidelines changing the outcome of head injured children? A regional investigation. Acta Neurochir 2008;102:S81–4.
240. Kahraman S, Kayali H, Atabey C, Acar F, Gocmen S. The accuracy of near-infrared spectroscopy in detection of subdural and epidural hematomas. J Trauma 2006;61:1480–3.
241. Kakarieka A, Braakman R, Schakel EH. Clinical significance of the finding of subarachnoid blood on CT scan after head injury. Acta Neurochir 1994;129:1–5.
242. Kavalci C, Pekdemir M, Durukan P, Ilhan N, Yildiz M, Serhatlioglu S, et al. The value of serum tau protein for the diagnosis of intracranial injury in minor head trauma. Am J Emerg Med 2007;25:391–5.
243. King J, Haddock G. Neonatal head injuries revisited. Scottish Med J 2009;54:34–6.
244. Knuckey NW, Gelbard S, Epstein MH. The management of ‘asymptomatic’ epidural hematomas. A prospective study. J Neurosurg 1989;70:392–6.
245. Kuhne CA, Homann M, Ose C, Waydhas C, Nast-Kolb D, Ruchholtz S. [Emergency room patients.] Unfallchirurg 2003;106:380–6.
246. Kuppermann N, Holmes JF, Dayan PS, Hoyle JD, Atabaki S, Dean DM, et al. and PECARN. Blunt head trauma in the Pediatric Emergency Care Applied Research Network (PECARN). Acad Emerg Med 2007;14:S94–5.

© Queen’s Printer and Controller of HMSO 2011. This work was produced by Pandor et al. under the terms of a commissioning contract issued by the Secretary of State for Health.
193 Health Technology Assessment 2011; Vol. 15: No. 27DOI: 10.3310/hta15270
247. Lehmann U, Regel G, Ellendorf B, Rickels E, Lorenz M, Becker H, et al. [Initial cranial CT for evaluating the prognosis of craniocerebral trauma.] Unfallchirurg 1997;100:705–10.
248. Levi L, Guilburd JN, Linn S, Feinsod M. The association between skull fracture, intracranial pathology and outcome in pediatric head injury. Br J Neurosurg 1991;5:617–25.
249. Livingston DH, Loder PA, Hunt CD. Minimal head injury: is admission necessary? Am Surg 1991;57:14–17.
250. Lloyd DA, Carty H, Patterson M, Butcher CK, Roe D. Predictive value of skull radiography for intracranial injury in children with blunt head injury. Lancet 1997;349:821–4.
251. Lucchi S, Giua G, Bettinelli A, Farabola M, Sina C, Mangiagalli E. The role of computerized tomography in the management of mild head injury patients. Riv Neuroradiol 1995;8:415–28.
252. Mahmood KSA. Post-traumatic vomiting: a predictor of severity of head injury. Med Forum 2000;11:1–5.
253. Mandera M, Zralek C, Zycinski A, Wencel T, Bazowski P. Surgery or conservative treatment in children with traumatic intracerebral haematoma. Childs Nerv Syst 1999;15:267–9.
254. Markle J, Cayten CG, Byrne DW, Murphy JG. Comparison between TRISS and ASCOT methods in controlling for injury severity. J Trauma 1992;33:326–32.
255. Marshall LF, Maas AI, Marshall SB, Bricolo A, Fearnside M, Iannotti F, et al. A multicenter trial on the efficacy of using tirilazad mesylate in cases of head injury. J Neurosurg 1998;89:519–25.
256. Marti-Fabregas J, Belvis R, Guardia E, Cocho D, Munoz J, Marruecos L, et al. Prognostic value of Pulsatility Index in acute intracerebral hemorrhage. Neurology 2003;61:1051–6.
257. Martinot A, Chartier A, Hue V, Dubos F. Performance of decision rules to predict need for computed tomography among children with blunt head trauma. Arch Pediatr 2008;15:721–3.
258. Massaro F, Lanotte M, Faccani G, Triolo C. One hundred and twenty-seven cases of acute subdural haematoma operated on: correlation between CT scan findings and outcome. Acta Neurochir 1996;138:185–91.
259. Masters SJ. Evaluation of head trauma: efficacy of skull films. AJR Am J Roentgenol 1980;135:539–47.
260. Matsumoto M, Sanpei K, Nishikawa H, Seki T, Shibata I, Terao H. [Characteristics of traumatic intracerebral hematomas in children.] Neurol Med Chir 1988;28:1081–8.
261. Mattox KL, Bickell W, Pepe PE, Burch J, Feliciano D. Prospective MAST study in 911 patients. J Trauma 1989;29:1104–11.
262. Meier EM. Evaluating head trauma in infants and children. MCN Am J Matern Child Nurs 1983;8:54–7.
263. Memon ZI, Altura BT, Benjamin JL, Cracco RQ, Altura BM. Predictive value of serum ionized but not total magnesium levels in head injuries. Scand J Clin Lab Invest 1995;55:617–77.
264. Mendelow AD, Teasdale GM, Barer D, Fernandes HM, Murray GD, Gregson BA. Outcome assignment in the International Surgical Trial of Intracerebral Haemorrhage. Acta Neurochir 2003;145:679–81.
265. Mendelow AD. Timothy J, Steers JW, Lecky F, Yates D, Bouamra O, et al. Management of patients with head injury. Lancet 2008;372:685–7.
266. Menon D, Harrison, D. Prognostic modelling in traumatic brain injury. BMJ 2008;336:397–8.

194 References
267. Meyer P, Ducrocq S, Baugnon T, Thelot B, Orliaguet G, Carli P, et al. [Head injury in children less than 2 years of age.] Arch Pediatr 2006;13:737–40.
268. Mikhail MG, Levitt MA, Christopher TA, Sutton MC. Intracranial injury following minor head trauma. Am J Emerg Med 1992;10:24–6.
269. Miller JD, Murray LS, Teasdale GM, Miller JD, Murray LS, Teasdale GM. Development of a traumatic intracranial hematoma after a ‘minor’ head injury. Neurosurgery 1990;27:669–73.
270. Mohanty SK, Thompson W, Rakower S. Are CT scans for head injury patients always necessary? J Trauma 1991;31:801–4.
271. Murgio A, Herrera EJ, Mutluer S, Fong D. Mild closed head injury in children and adolescents. SAGGI Child Dev Disabil 2003;29:3.
272. Mussack T, Biberthaler P, Wiedemann E, Kanz KG, Englert A, Gippner-Steppert C, et al. S-100b as a screening marker of the severity of minor head trauma (MHT): a pilot study. Acta Neurochir 2000;76:S393–6.
273. Muszynski CA, Hayman LA, Weingarten K, Prow HW, Cole JW, Contant CF. Conservative management of extra-axial hematomas diagnosed by CT. Neuroradiology 1999;41:875–81.
274. Muthukumar N, Srinivasan US, Sampathkumar M, Gajendran R. Prognosis in-patients with post-traumatic intracerebral hemorrhage vs contusion. In: Nakamura N, Hashimoto T, Yasue M, editors. Recent advances in neurotraumatology. Tokyo: Springer–Verlag; 1993. pp. 345–8.
275. Naeimi ZS, Weinhofer A, Sarahrudi K, Heinz T, Vecsei V. Predictive value of S-100B protein and neuron specific-enolase as markers of traumatic brain damage in clinical use. Brain Inj 2006;20:463–8.
276. Nagy KK, Joseph KT, Krosner SM. The utility of computed tomography after minimal head injury. J Trauma 1999;46:268–70.
277. Oertel M, Kelly DF, McArthur D, Boscardin WJ, Glenn TC, Lee JH, et al. Progressive hemorrhage after head trauma: predictors and consequences of the evolving injury. J Neurosurg 2002;96:109–16.
278. Oh EJ, Kim YM, Jegal DW, Kahng J, Park YJ, Han K. Diagnostic value of Elecsys S100 as a marker of acute brain injury in the emergency department. J Clin Lab Anal 2007;21:387–92.
279. Orrison WW, Gentry LR, Stimac GK,Tarrel RM, Espinosa MC, Cobb LC. Blinded comparison of cranial CT and MR in closed head injury evaluation. Am J Neuroradiol 1994;15:351–6.
280. Ortiz HJL, Guerra P, Sanchez G. Las fracturas lineales de crbneo como factor de riesgo en pacientes con traumatismo craneoencefblico menor. Rev Chil Neurocirug 2006;26:38–43.
281. Ortiz HJL, Paneque GS. Valor pronstico del sexo y la edad en el traumatismo craneoencefblico no grave del adulto [Prognostic value of the age and gender in the mild head trauma of the adult]. Rev Chil Neuropsiquiatr 2005;25:48–52.
282. Owings JT, Wisner DH, Battistella FD. Isolated transient loss of consciousness is an indicator of significant injury. Arch Surg 1998;133:941–6.
283. Palchak MJ, Holmes JF, Kuppermann N. Clinician judgment versus a decision rule for identifying children at risk of traumatic brain injury on computed tomography after blunt head trauma. Pediatr Emerg Care 2009;25:61–5.
284. Pasman P, Twijnstra A, Wilmink J, Leffers P. The value of skull radiography in patients with head trauma. J Belge Radiol 1995;78:169–71.

© Queen’s Printer and Controller of HMSO 2011. This work was produced by Pandor et al. under the terms of a commissioning contract issued by the Secretary of State for Health.
195 Health Technology Assessment 2011; Vol. 15: No. 27DOI: 10.3310/hta15270
285. Pretto Flores L, De Almeida CS, Casulari LA. Positive predictive values of selected clinical signs associated with skull base fractures. J Neurosurg Sci 2000;44:77–82.
286. Rathlev NK, Medzon R, Lowery D, Pollack C, Bracken M, Barest G, et al. Intracranial pathology in elders with blunt head trauma. Acad Emerg Med 2006;13:3027.
287. Reinus WR, Zwemer FLJ. Clinical prediction of emergency cranial computed tomography results. Ann Emerg Med 1994;23:1271–8.
288. Rivas JJ, Lobato RD, Sarabia R. Extradural hematoma: analysis of factors influencing the courses of 161 patients. Neurosurgery 1988;23:44–51.
289. Sainsbury CPQ, Sibert JR. How long do we need to observe head injuries in hospital? Arch Dis Child 1984;59:856–9.
290. Sanus GZ, Tanriverdi T, Alver I, Aydin S, Uzan MT. Evolving traumatic brain lesions: Predictors and results of ninety-eight head-injured patients. Neurosurg Quart 2004;14:97–104.
291. Savastio G, Golfieri R, Pastore, Trossello M, Venturoli L. [Cranial trauma: the predictability of the presentation symptoms as a screening for radiologic study.] Radiol Med 1991;82:769–75.
292. Servadei F, Faccani G, Roccella P, Seracchioli A, Godano U, Ghadirpor R, et al. Asymptomatic extradural haematomas. Results of a multicenter study of 158 cases in minor head injury. Acta Neurochir 1989;96:39–45.
293. Shane SA, Fuchs SM. Skull fractures in infants and predictors of associated intracranial injury. Pediatr Emerg Care 1997;13:198–203.
294. Sifri ZC, Homnick AT, Vaynman A, Lavery R, Liao W, Mohr A, et al. A prospective evaluation of the value of repeat cranial computed tomography in patients with minimal head injury and an intracranial bleed. J Trauma 2006;61:862–7.
295. Smits M, Hunink MG, Nederkoorn PJ, Dekker HM, Vos PE, Kool DR, et al. A history of loss of consciousness or post-traumatic amnesia in minor head injury: ‘Conditio sine qua non’ or one of the risk factors? J Neurol Neurosurg Psychiatry 2007;78:1359–64.
296. Stein SC, Spettell C, Young G, Ross SE. Limitations of neurological assessment in mild head injury. Brain Inj 1993;7:425–30.
297. Taheri PA, Karamanoukian H, Gibbons K. Can patients with minor head injuries be safely discharged home? Arch Surg 1993;128:289–92.
298. Teasdale GM, Murray G, Anderson E, Mendelow AD, MacMillan R, Jennett B, et al. Risks of acute traumatic intracranial haematoma in children and adults: implications for managing head injuries. BMJ 1990;300:363–7.
299. Turedi S, Hasanbasoglu A, Gunduz A, Yandi M. Clinical decision instruments for CT scan in minor head trauma. J Emerg Med 2008;34:253–9.
300. Velmahos GC, Gervasini A, Petrovick L, Dorer DJ, Doran ME, et al. Routine repeat head CT for minimal head injury is unnecessary. J Trauma 2006;60:494–9.
301. Vogelbaum MA, Kaufman BA, Park TS, Winthrop AL. Management of uncomplicated skull fractures in children: Is hospital admission necessary? Pediatr Neurosurg 1998;29:96–101.
302. Voss M, Knottenbelt JD, Peden MM. Patients who reattend after head injury: a high risk group. BMJ 1995;311:1395–8.
303. Willis AP, Latif SAA, Chandratre S, Stanhope B, Johnson K. Not a NICE CT protocol for the acutely head injured child. Clin Radiol 2008;63:165–9.
196 References
304. Yamamoto T, Ogata M. [Intraventricular hemorrhage in blunt head injury (author’s translation).] Nippon Geka Hokan 1981;50:526–33.
305. Yanagawa Y, Tsushima Y, Tokumaru A, Un-no Y, Sakamoto T, Okada Y, et al. A quantitative analysis of head injury using T2*-weighted gradient-echo imaging. J Trauma 2000;49:272–7.
306. Zimmerman RA, Bilaniuk LT, Hackney DB, Goldberg HI, Grossman RI. Head injury: Early results of comparing CT and high-field MR. Am J Roentgenol 1986;147:1212–22.
307. Burnett MG, Stein SC, Mickel HS. Safety and cost-effectiveness of common management strategies for treating mild closed head injuries: should all patients be evaluated with the use of computed tomography? Neurosurgery 2002;51:542–95.
© Queen’s Printer and Controller of HMSO 2011. This work was produced by Pandor et al. under the terms of a commissioning contract issued by the Secretary of State for Health.
197 Health Technology Assessment 2011; Vol. 15: No. 27DOI: 10.3310/hta15270
Health Technology Assessment programme
Director,Professor Tom Walley, CBE,Director, NIHR HTA programme, Professor of Clinical Pharmacology, University of Liverpool
Deputy Director,Professor Hywel Williams,Professor of Dermato-Epidemiology,Centre of Evidence-Based Dermatology,University of Nottingham
Prioritisation GroupMembers
Chair,Professor Tom Walley, CBE,Director, NIHR HTA programme, Professor of Clinical Pharmacology, University of Liverpool
Professor Imti Choonara, Professor in Child Health, Academic Division of Child Health, University of NottinghamChair – Pharmaceuticals Panel
Dr Bob Coates,Consultant Advisor – Disease Prevention Panel
Dr Andrew Cook,Consultant Advisor – Intervention Procedures Panel
Dr Peter Davidson,Director of NETSCC, Health Technology Assessment
Dr Nick Hicks,Consultant Adviser – Diagnostic Technologies and Screening Panel, Consultant Advisor–Psychological and Community Therapies Panel
Ms Susan Hird,Consultant Advisor, External Devices and Physical Therapies Panel
Professor Sallie Lamb,Director, Warwick Clinical Trials Unit, Warwick Medical School, University of WarwickChair – HTA Clinical Evaluation and Trials Board
Professor Jonathan Michaels,Professor of Vascular Surgery, Sheffield Vascular Institute, University of SheffieldChair – Interventional Procedures Panel
Professor Ruairidh Milne,Director – External Relations
Dr John Pounsford,Consultant Physician, Directorate of Medical Services, North Bristol NHS TrustChair – External Devices and Physical Therapies Panel
Dr Vaughan Thomas,Consultant Advisor – Pharmaceuticals Panel, Clinical Lead – Clinical Evaluation Trials Prioritisation Group
Professor Margaret Thorogood,Professor of Epidemiology, Health Sciences Research Institute, University of WarwickChair – Disease Prevention Panel
Professor Lindsay Turnbull,Professor of Radiology, Centre for the MR Investigations, University of HullChair – Diagnostic Technologies and Screening Panel
Professor Scott Weich,Professor of Psychiatry, Health Sciences Research Institute, University of WarwickChair – Psychological and Community Therapies Panel
Professor Hywel Williams,Director of Nottingham Clinical Trials Unit, Centre of Evidence-Based Dermatology, University of NottinghamChair – HTA Commissioning BoardDeputy HTA Programme Director
HTA Commissioning BoardChair,Professor Hywel Williams,Professor of Dermato-Epidemiology, Centre of Evidence-Based Dermatology, University of Nottingham
Deputy Chair,Professor Jon Deeks,Department of Public Health and Epidemiology, University of Birmingham
Professor Tom Walley, CBE,Professor of Clinical Pharmacology, Director, NIHR HTA programme, University of Liverpool
Members
Professor Ann Ashburn,Professor of Rehabilitation and Head of Research, Southampton General Hospital
Professor Peter Brocklehurst,Professor of Women's Health, Institute for Women's Health, University College London
Professor Jenny Donovan,Professor of Social Medicine, University of Bristol
Professor Jonathan Green,Professor and Acting Head of Department, Child and Adolescent Psychiatry, University of Manchester Medical School
Professor John W Gregory,Professor in Paediatric Endocrinology, Department of Child Health, Wales School of Medicine, Cardiff University
Professor Steve Halligan,Professor of Gastrointestinal Radiology, University College Hospital, London
Professor Freddie Hamdy,Professor of Urology, Head of Nuffield Department of Surgery, University of Oxford
Professor Allan House,Professor of Liaison Psychiatry, University of Leeds
Dr Martin J Landray,Reader in Epidemiology, Honorary Consultant Physician, Clinical Trial Service Unit, University of Oxford
Professor Stephen Morris,Professor of Health Economics, University College London, Research Department of Epidemiology and Public Health, University College London
Professor Irwin Nazareth,Professor of Primary Care and Head of Department, Department of Primary Care and Population Sciences, University College London
Professor E Andrea Nelson,Professor of Wound Healing and Director of Research, School of Healthcare, University of Leeds
Professor John David Norrie,Chair in Clinical Trials and Biostatistics, Robertson Centre for Biostatistics, University of Glasgow
Dr Rafael Perera,Lecturer in Medical Statisitics, Department of Primary Health Care, University of Oxford

Current and past membership details of all HTA programme ‘committees’ are available from the HTA website (www.hta.ac.uk)
198 Health Technology Assessment programme
Professor Barney Reeves,Professorial Research Fellow in Health Services Research, Department of Clinical Science, University of Bristol
Professor Martin Underwood,Professor of Primary Care Research, Warwick Medical School, University of Warwick
Professor Marion Walker,Professor in Stroke Rehabilitation, Associate Director UK Stroke Research Network, University of Nottingham
Dr Duncan Young,Senior Clinical Lecturer and Consultant, Nuffield Department of Anaesthetics, University of Oxford
Observers
Dr Tom Foulks,Medical Research Council
Dr Kay Pattison,Senior NIHR Programme Manager, Department of Health
HTA Commissioning Board (continued)
HTA Clinical Evaluation and Trials BoardChair,Professor Sallie Lamb, Director, Warwick Clinical Trials Unit, Warwick Medical School, University of Warwick and Professor of Rehabilitation, Nuffield Department of Orthopaedic, Rheumatology and Musculoskeletal Sciences, University of Oxford
Deputy Chair,Professor Jenny Hewison,Professor of the Psychology of Health Care, Leeds Institute of Health Sciences, University of Leeds
Programme Director, Professor Tom Walley, CBE, Director, NIHR HTA programme, Professor of Clinical Pharmacology, University of Liverpool
Members
Professor Keith Abrams,Professor of Medical Statistics, Department of Health Sciences, University of Leicester
Professor Martin Bland,Professor of Health Statistics, Department of Health Sciences, University of York
Professor Jane Blazeby,Professor of Surgery and Consultant Upper GI Surgeon, Department of Social Medicine, University of Bristol
Professor Julia M Brown,Director, Clinical Trials Research Unit, University of Leeds
Professor Alistair Burns,Professor of Old Age Psychiatry, Psychiatry Research Group, School of Community-Based Medicine, The University of Manchester & National Clinical Director for Dementia, Department of Health
Dr Jennifer Burr,Director, Centre for Healthcare Randomised trials (CHART), University of Aberdeen
Professor Linda Davies,Professor of Health Economics, Health Sciences Research Group, University of Manchester
Professor Simon Gilbody,Prof of Psych Medicine and Health Services Research, Department of Health Sciences, University of York
Professor Steven Goodacre,Professor and Consultant in Emergency Medicine, School of Health and Related Research, University of Sheffield
Professor Dyfrig Hughes,Professor of Pharmacoeconomics, Centre for Economics and Policy in Health, Institute of Medical and Social Care Research, Bangor University
Professor Paul Jones,Professor of Respiratory Medicine, Department of Cardiac and Vascular Science, St George‘s Hospital Medical School, University of London
Professor Khalid Khan,Professor of Women’s Health and Clinical Epidemiology, Barts and the London School of Medicine, Queen Mary, University of London
Professor Richard J McManus,Professor of Primary Care Cardiovascular Research, Primary Care Clinical Sciences Building, University of Birmingham
Professor Helen Rodgers,Professor of Stroke Care, Institute for Ageing and Health, Newcastle University
Professor Ken Stein,Professor of Public Health, Peninsula Technology Assessment Group, Peninsula College of Medicine and Dentistry, Universities of Exeter and Plymouth
Professor Jonathan Sterne,Professor of Medical Statistics and Epidemiology, Department of Social Medicine, University of Bristol
Mr Andy Vail, Senior Lecturer, Health Sciences Research Group, University of Manchester
Professor Clare Wilkinson,Professor of General Practice and Director of Research North Wales Clinical School, Department of Primary Care and Public Health, Cardiff University
Dr Ian B Wilkinson,Senior Lecturer and Honorary Consultant, Clinical Pharmacology Unit, Department of Medicine, University of Cambridge
Observers
Ms Kate Law,Director of Clinical Trials, Cancer Research UK
Dr Morven Roberts,Clinical Trials Manager, Health Services and Public Health Services Board, Medical Research Council

© Queen’s Printer and Controller of HMSO 2011. This work was produced by Pandor et al. under the terms of a commissioning contract issued by the Secretary of State for Health.
199 Health Technology Assessment 2011; Vol. 15: No. 27DOI: 10.3310/hta15270
Diagnostic Technologies and Screening PanelMembers
Chair,Professor Lindsay Wilson Turnbull,Scientific Director of the Centre for Magnetic Resonance Investigations and YCR Professor of Radiology, Hull Royal Infirmary
Professor Judith E Adams,Consultant Radiologist, Manchester Royal Infirmary, Central Manchester & Manchester Children’s University Hospitals NHS Trust, and Professor of Diagnostic Radiology, University of Manchester
Mr Angus S Arunkalaivanan,Honorary Senior Lecturer, University of Birmingham and Consultant Urogynaecologist and Obstetrician, City Hospital, Birmingham
Dr Diana Baralle,Consultant and Senior Lecturer in Clinical Genetics, University of Southampton
Dr Stephanie Dancer,Consultant Microbiologist, Hairmyres Hospital, East Kilbride
Dr Diane Eccles,Professor of Cancer Genetics, Wessex Clinical Genetics Service, Princess Anne Hospital
Dr Trevor Friedman,Consultant Liason Psychiatrist, Brandon Unit, Leicester General Hospital
Dr Ron Gray,Consultant, National Perinatal Epidemiology Unit, Institute of Health Sciences, University of Oxford
Professor Paul D Griffiths,Professor of Radiology, Academic Unit of Radiology, University of Sheffield
Mr Martin Hooper,Public contributor
Professor Anthony Robert Kendrick,Associate Dean for Clinical Research and Professor of Primary Medical Care, University of Southampton
Dr Nicola Lennard,Senior Medical Officer, MHRA
Dr Anne Mackie,Director of Programmes, UK National Screening Committee, London
Mr David Mathew,Public contributor
Dr Michael Millar,Consultant Senior Lecturer in Microbiology, Department of Pathology & Microbiology, Barts and The London NHS Trust, Royal London Hospital
Mrs Una Rennard,Public contributor
Dr Stuart Smellie,Consultant in Clinical Pathology, Bishop Auckland General Hospital
Ms Jane Smith,Consultant Ultrasound Practitioner, Leeds Teaching Hospital NHS Trust, Leeds
Dr Allison Streetly,Programme Director, NHS Sickle Cell and Thalassaemia Screening Programme, King’s College School of Medicine
Dr Matthew Thompson,Senior Clinical Scientist and GP, Department of Primary Health Care, University of Oxford
Dr Alan J Williams,Consultant Physician, General and Respiratory Medicine, The Royal Bournemouth Hospital
Observers
Dr Tim Elliott,Team Leader, Cancer Screening, Department of Health
Dr Joanna Jenkinson,Board Secretary, Neurosciences and Mental Health Board (NMHB), Medical Research Council
Professor Julietta Patnick,Director, NHS Cancer Screening Programme, Sheffield
Dr Kay Pattison,Senior NIHR Programme Manager, Department of Health
Professor Tom Walley, CBE,Director, NIHR HTA programme, Professor of Clinical Pharmacology, University of Liverpool
Dr Ursula Wells,Principal Research Officer, Policy Research Programme, Department of Health
Disease Prevention PanelMembers
Chair,Professor Margaret Thorogood,Professor of Epidemiology, University of Warwick Medical School, Coventry
Dr Robert Cook,Clinical Programmes Director, Bazian Ltd, London
Dr Colin Greaves,Senior Research Fellow, Peninsula Medical School (Primary Care)
Mr Michael Head, Public contributor
Professor Cathy Jackson,Professor of Primary Care Medicine, Bute Medical School, University of St Andrews
Dr Russell Jago,Senior Lecturer in Exercise, Nutrition and Health, Centre for Sport, Exercise and Health, University of Bristol
Dr Julie Mytton,Consultant in Child Public Health, NHS Bristol
Professor Irwin Nazareth,Professor of Primary Care and Director, Department of Primary Care and Population Sciences, University College London
Dr Richard Richards, Assistant Director of Public Health, Derbyshire County Primary Care Trust
Professor Ian Roberts,Professor of Epidemiology and Public Health, London School of Hygiene & Tropical Medicine
Dr Kenneth Robertson,Consultant Paediatrician, Royal Hospital for Sick Children, Glasgow
Dr Catherine Swann,Associate Director, Centre for Public Health Excellence, NICE
Mrs Jean Thurston,Public contributor
Professor David Weller,Head, School of Clinical Science and Community Health, University of Edinburgh
Observers
Ms Christine McGuire,Research & Development, Department of Health
Dr Kay Pattison,Senior NIHR Programme Manager, Department of Health
Professor Tom Walley, CBE,Director, NIHR HTA programme, Professor of Clinical Pharmacology, University of Liverpool

Current and past membership details of all HTA programme ‘committees’ are available from the HTA website (www.hta.ac.uk)
200 Health Technology Assessment programme
External Devices and Physical Therapies PanelMembers
Chair,Dr John Pounsford,Consultant Physician North Bristol NHS Trust
Deputy Chair,Professor E Andrea Nelson,Reader in Wound Healing and Director of Research, University of Leeds
Professor Bipin Bhakta,Charterhouse Professor in Rehabilitation Medicine, University of Leeds
Mrs Penny Calder,Public contributor
Dr Dawn Carnes,Senior Research Fellow, Barts and the London School of Medicine and Dentistry
Dr Emma Clark,Clinician Scientist Fellow & Cons. Rheumatologist, University of Bristol
Mrs Anthea De Barton-Watson,Public contributor
Professor Nadine Foster,Professor of Musculoskeletal Health in Primary Care Arthritis Research, Keele University
Dr Shaheen Hamdy,Clinical Senior Lecturer and Consultant Physician, University of Manchester
Professor Christine Norton,Professor of Clinical Nursing Innovation, Bucks New University and Imperial College Healthcare NHS Trust
Dr Lorraine Pinnigton,Associate Professor in Rehabilitation, University of Nottingham
Dr Kate Radford,Senior Lecturer (Research), University of Central Lancashire
Mr Jim Reece,Public contributor
Professor Maria Stokes,Professor of Neuromusculoskeletal Rehabilitation, University of Southampton
Dr Pippa Tyrrell,Senior Lecturer/Consultant, Salford Royal Foundation Hospitals’ Trust and University of Manchester
Dr Nefyn Williams,Clinical Senior Lecturer, Cardiff University
Observers
Dr Kay Pattison,Senior NIHR Programme Manager, Department of Health
Dr Morven Roberts,Clinical Trials Manager, Health Services and Public Health Services Board, Medical Research Council
Professor Tom Walley, CBE,Director, NIHR HTA programme, Professor of Clinical Pharmacology, University of Liverpool
Dr Ursula Wells,Principal Research Officer, Policy Research Programme, Department of Health
Interventional Procedures PanelMembers
Chair,Professor Jonathan Michaels,Professor of Vascular Surgery, University of Sheffield
Deputy Chair,Mr Michael Thomas, Consultant Colorectal Surgeon, Bristol Royal Infirmary
Mrs Isabel Boyer,Public contributor
Mr Sankaran Chandra Sekharan, Consultant Surgeon, Breast Surgery, Colchester Hospital University NHS Foundation Trust
Professor Nicholas Clarke, Consultant Orthopaedic Surgeon, Southampton University Hospitals NHS Trust
Ms Leonie Cooke,Public contributor
Mr Seumas Eckford, Consultant in Obstetrics & Gynaecology, North Devon District Hospital
Professor Sam Eljamel,Consultant Neurosurgeon, Ninewells Hospital and Medical School, Dundee
Dr Adele Fielding,Senior Lecturer and Honorary Consultant in Haematology, University College London Medical School
Dr Matthew Hatton, Consultant in Clinical Oncology, Sheffield Teaching Hospital Foundation Trust
Dr John Holden, General Practitioner, Garswood Surgery, Wigan
Dr Fiona Lecky,Senior Lecturer/Honorary Consultant in Emergency Medicine, University of Manchester/Salford Royal Hospitals NHS Foundation Trust
Dr Nadim Malik, Consultant Cardiologist/Honorary Lecturer, University of Manchester
Mr Hisham Mehanna, Consultant & Honorary Associate Professor, University Hospitals Coventry & Warwickshire NHS Trust
Dr Jane Montgomery, Consultant in Anaesthetics and Critical Care, South Devon Healthcare NHS Foundation Trust
Professor Jon Moss,Consultant Interventional Radiologist, North Glasgow Hospitals University NHS Trust
Dr Simon Padley, Consultant Radiologist, Chelsea & Westminster Hospital
Dr Ashish Paul, Medical Director, Bedfordshire PCT
Dr Sarah Purdy, Consultant Senior Lecturer, University of Bristol
Dr Matthew Wilson,Consultant Anaesthetist, Sheffield Teaching Hospitals NHS Foundation Trust
Professor Yit Chiun Yang, Consultant Ophthalmologist, Royal Wolverhampton Hospitals NHS Trust
Observers
Dr Kay Pattison,Senior NIHR Programme Manager, Department of Health
Dr Morven Roberts,Clinical Trials Manager, Health Services and Public Health Services Board, Medical Research Council
Professor Tom Walley, CBE,Director, NIHR HTA programme, Professor of Clinical Pharmacology, University of Liverpool
Dr Ursula Wells,Principal Research Officer, Policy Research Programme, Department of Health

© Queen’s Printer and Controller of HMSO 2011. This work was produced by Pandor et al. under the terms of a commissioning contract issued by the Secretary of State for Health.
201 Health Technology Assessment 2011; Vol. 15: No. 27DOI: 10.3310/hta15270
Pharmaceuticals PanelMembers
Chair,Professor Imti Choonara,Professor in Child Health, University of Nottingham
Deputy Chair,Dr Yoon K Loke,Senior Lecturer in Clinical Pharmacology, University of East Anglia
Dr Martin Ashton-Key,Medical Advisor, National Commissioning Group, NHS London
Dr Peter Elton,Director of Public Health, Bury Primary Care Trust
Dr Ben Goldacre,Research Fellow, Epidemiology London School of Hygiene and Tropical Medicine
Dr James Gray,Consultant Microbiologist, Department of Microbiology, Birmingham Children’s Hospital NHS Foundation Trust
Dr Jurjees Hasan,Consultant in Medical Oncology, The Christie, Manchester
Dr Carl Heneghan,Deputy Director Centre for Evidence-Based Medicine and Clinical Lecturer, Department of Primary Health Care, University of Oxford
Dr Dyfrig Hughes,Reader in Pharmacoeconomics and Deputy Director, Centre for Economics and Policy in Health, IMSCaR, Bangor University
Dr Maria Kouimtzi,Pharmacy and Informatics Director, Global Clinical Solutions, Wiley-Blackwell
Professor Femi Oyebode,Consultant Psychiatrist and Head of Department, University of Birmingham
Dr Andrew Prentice,Senior Lecturer and Consultant Obstetrician and Gynaecologist, The Rosie Hospital, University of Cambridge
Ms Amanda Roberts,Public contributor
Dr Gillian Shepherd,Director, Health and Clinical Excellence, Merck Serono Ltd
Mrs Katrina Simister,Assistant Director New Medicines, National Prescribing Centre, Liverpool
Professor Donald Singer,Professor of Clinical Pharmacology and Therapeutics, Clinical Sciences Research Institute, CSB, University of Warwick Medical School
Mr David Symes,Public contributor
Dr Arnold Zermansky,General Practitioner, Senior Research Fellow, Pharmacy Practice and Medicines Management Group, Leeds University
Observers
Dr Kay Pattison,Senior NIHR Programme Manager, Department of Health
Mr Simon Reeve,Head of Clinical and Cost-Effectiveness, Medicines, Pharmacy and Industry Group, Department of Health
Dr Heike Weber,Programme Manager, Medical Research Council
Professor Tom Walley, CBE,Director, NIHR HTA programme, Professor of Clinical Pharmacology, University of Liverpool
Dr Ursula Wells,Principal Research Officer, Policy Research Programme, Department of Health
Psychological and Community Therapies PanelMembers
Chair,Professor Scott Weich,Professor of Psychiatry, University of Warwick, Coventry
Deputy Chair,Dr Howard Ring, Consultant & University Lecturer in Psychiatry, University of Cambridge
Professor Jane Barlow,Professor of Public Health in the Early Years, Health Sciences Research Institute, Warwick Medical School
Dr Sabyasachi Bhaumik,Consultant Psychiatrist, Leicestershire Partnership NHS Trust
Mrs Val Carlill,Public contributor
Dr Steve Cunningham, Consultant Respiratory Paediatrician, Lothian Health Board
Dr Anne Hesketh, Senior Clinical Lecturer in Speech and Language Therapy, University of Manchester
Dr Peter Langdon,Senior Clinical Lecturer, School of Medicine, Health Policy and Practice, University of East Anglia
Dr Yann Lefeuvre, GP Partner, Burrage Road Surgery, London
Dr Jeremy J Murphy, Consultant Physician and Cardiologist, County Durham and Darlington Foundation Trust
Dr Richard Neal,Clinical Senior Lecturer in General Practice, Cardiff University
Mr John Needham, Public contributor
Ms Mary Nettle, Mental Health User Consultant
Professor John Potter, Professor of Ageing and Stroke Medicine, University of East Anglia
Dr Greta Rait, Senior Clinical Lecturer and General Practitioner, University College London
Dr Paul Ramchandani, Senior Research Fellow/Cons. Child Psychiatrist, University of Oxford
Dr Karen Roberts, Nurse/Consultant, Dunston Hill Hospital, Tyne and Wear
Dr Karim Saad, Consultant in Old Age Psychiatry, Coventry and Warwickshire Partnership Trust
Dr Lesley Stockton,Lecturer, School of Health Sciences, University of Liverpool
Dr Simon Wright, GP Partner, Walkden Medical Centre, Manchester
Observers
Dr Kay Pattison,Senior NIHR Programme Manager, Department of Health
Dr Morven Roberts,Clinical Trials Manager, Health Services and Public Health Services Board, Medical Research Council
Professor Tom Walley, CBE,Director, NIHR HTA programme, Professor of Clinical Pharmacology, University of Liverpool
Dr Ursula Wells,Principal Research Officer, Policy Research Programme, Department of Health

Current and past membership details of all HTA programme ‘committees’ are available from the HTA website (www.hta.ac.uk)
202 Health Technology Assessment programme
Expert Advisory NetworkMembers
Professor Douglas Altman,Professor of Statistics in Medicine, Centre for Statistics in Medicine, University of Oxford
Professor John Bond,Professor of Social Gerontology & Health Services Research, University of Newcastle upon Tyne
Professor Andrew Bradbury,Professor of Vascular Surgery, Solihull Hospital, Birmingham
Mr Shaun Brogan,Chief Executive, Ridgeway Primary Care Group, Aylesbury
Mrs Stella Burnside OBE,Chief Executive, Regulation and Improvement Authority, Belfast
Ms Tracy Bury,Project Manager, World Confederation of Physical Therapy, London
Professor Iain T Cameron,Professor of Obstetrics and Gynaecology and Head of the School of Medicine, University of Southampton
Professor Bruce Campbell,Consultant Vascular & General Surgeon, Royal Devon & Exeter Hospital, Wonford
Dr Christine Clark,Medical Writer and Consultant Pharmacist, Rossendale
Professor Collette Clifford,Professor of Nursing and Head of Research, The Medical School, University of Birmingham
Professor Barry Cookson,Director, Laboratory of Hospital Infection, Public Health Laboratory Service, London
Dr Carl Counsell,Clinical Senior Lecturer in Neurology, University of Aberdeen
Professor Howard Cuckle,Professor of Reproductive Epidemiology, Department of Paediatrics, Obstetrics & Gynaecology, University of Leeds
Professor Carol Dezateux,Professor of Paediatric Epidemiology, Institute of Child Health, London
Mr John Dunning, Consultant Cardiothoracic Surgeon, Papworth Hospital NHS Trust, Cambridge
Mr Jonothan Earnshaw,Consultant Vascular Surgeon, Gloucestershire Royal Hospital, Gloucester
Professor Martin Eccles,Professor of Clinical Effectiveness, Centre for Health Services Research, University of Newcastle upon Tyne
Professor Pam Enderby,Dean of Faculty of Medicine, Institute of General Practice and Primary Care, University of Sheffield
Professor Gene Feder,Professor of Primary Care Research & Development, Centre for Health Sciences, Barts and The London School of Medicine and Dentistry
Mr Leonard R Fenwick,Chief Executive, Freeman Hospital, Newcastle upon Tyne
Mrs Gillian Fletcher,Antenatal Teacher and Tutor and President, National Childbirth Trust, Henfield
Professor Jayne Franklyn,Professor of Medicine, University of Birmingham
Mr Tam Fry,Honorary Chairman, Child Growth Foundation, London
Professor Fiona Gilbert,Consultant Radiologist and NCRN Member, University of Aberdeen
Professor Paul Gregg,Professor of Orthopaedic Surgical Science, South Tees Hospital NHS Trust
Bec Hanley,Co-director, TwoCan Associates, West Sussex
Dr Maryann L Hardy,Senior Lecturer, University of Bradford
Mrs Sharon Hart,Healthcare Management Consultant, Reading
Professor Robert E Hawkins,CRC Professor and Director of Medical Oncology, Christie CRC Research Centre, Christie Hospital NHS Trust, Manchester
Professor Richard Hobbs,Head of Department of Primary Care & General Practice, University of Birmingham
Professor Alan Horwich,Dean and Section Chairman, The Institute of Cancer Research, London
Professor Allen Hutchinson,Director of Public Health and Deputy Dean of ScHARR, University of Sheffield
Professor Peter Jones,Professor of Psychiatry, University of Cambridge, Cambridge
Professor Stan Kaye,Cancer Research UK Professor of Medical Oncology, Royal Marsden Hospital and Institute of Cancer Research, Surrey
Dr Duncan Keeley,General Practitioner (Dr Burch & Ptnrs), The Health Centre, Thame
Dr Donna Lamping,Research Degrees Programme Director and Reader in Psychology, Health Services Research Unit, London School of Hygiene and Tropical Medicine, London
Professor James Lindesay,Professor of Psychiatry for the Elderly, University of Leicester
Professor Julian Little,Professor of Human Genome Epidemiology, University of Ottawa
Professor Alistaire McGuire,Professor of Health Economics, London School of Economics
Professor Neill McIntosh,Edward Clark Professor of Child Life and Health, University of Edinburgh
Professor Rajan Madhok,Consultant in Public Health, South Manchester Primary Care Trust
Professor Sir Alexander Markham,Director, Molecular Medicine Unit, St James’s University Hospital, Leeds
Dr Peter Moore,Freelance Science Writer, Ashtead
Dr Andrew Mortimore,Public Health Director, Southampton City Primary Care Trust
Dr Sue Moss,Associate Director, Cancer Screening Evaluation Unit, Institute of Cancer Research, Sutton
Professor Miranda Mugford,Professor of Health Economics and Group Co-ordinator, University of East Anglia
Professor Jim Neilson,Head of School of Reproductive & Developmental Medicine and Professor of Obstetrics and Gynaecology, University of Liverpool
Mrs Julietta Patnick,Director, NHS Cancer Screening Programmes, Sheffield
Professor Robert Peveler,Professor of Liaison Psychiatry, Royal South Hants Hospital, Southampton
Professor Chris Price,Director of Clinical Research, Bayer Diagnostics Europe, Stoke Poges
Professor William Rosenberg,Professor of Hepatology and Consultant Physician, University of Southampton
Professor Peter Sandercock,Professor of Medical Neurology, Department of Clinical Neurosciences, University of Edinburgh
Dr Philip Shackley, Senior Lecturer in Health Economics, Sheffield Vascular Institute, University of Sheffield
Dr Eamonn Sheridan,Consultant in Clinical Genetics, St James’s University Hospital, Leeds
Dr Margaret Somerville,Director of Public Health Learning, Peninsula Medical School, University of Plymouth
Professor Sarah Stewart-Brown,Professor of Public Health, Division of Health in the Community, University of Warwick, Coventry
Dr Nick Summerton, GP Appraiser and Codirector, Research Network, Yorkshire Clinical Consultant, Primary Care and Public Health, University of Oxford
Professor Ala Szczepura,Professor of Health Service Research, Centre for Health Services Studies, University of Warwick, Coventry
Dr Ross Taylor,Senior Lecturer, University of Aberdeen
Dr Richard Tiner,Medical Director, Medical Department, Association of the British Pharmaceutical Industry
Mrs Joan Webster,Consumer Member, Southern Derbyshire Community Health Council
Professor Martin Whittle,Clinical Co-director, National Co-ordinating Centre for Women’s and Children’s Health, Lymington

This version of the monograph does not include the appendices. This is to save download time from the HTA website.
The printed version also excludes the appendices.
View/download the appendices

NETSCC, Health Technology Assessment Alpha HouseUniversity of Southampton Science Park Southampton SO16 7NS, UKEmail: [email protected] ISSN 1366-5278
Feedback
The HTA programme and the authors would like to know your views about this report.
The Correspondence Page on the HTA website (www.hta.ac.uk) is a convenient way to publish your
comments. If you prefer, you can send your comments to the address below, telling us whether you would like
us to transfer them to the website.
We look forward to hearing from you.