Diagnostic Assessment of Greek Banks - Bank of Greece · Diagnostic Assessment of Greek Banks ......
104
Diagnostic Assessment of Greek Banks Excerpt from Report Submitted on December 30, 2011
Transcript of Diagnostic Assessment of Greek Banks - Bank of Greece · Diagnostic Assessment of Greek Banks ......

Diagnostic Assessment of Greek
Banks
Excerpt from Report Submitted on December 30, 2011
| Bank of Greece
Contents
Engagement Summary 2
Group A Banks – AQR and Modeling Overview 6
Group B Banks – AQR and Modeling Overview 9
Macroeconomic Assumptions 12
Residential Mortgage Loans - AQR 14
Residential Mortgage Loans - Methodology 21
Credit Card Loans - AQR 34
Auto Loans - AQR 39
Other Consumer Loans - AQR 44
Consumer Loan Products - Methodology 51
Corporate Loans (excluding CRE and Shipping Loans) - AQR 61
Corporate Loans - Methodology 63
Small and Medium Enterprise (SME) - AQR 74
SME - Methodology 81
Small Business and Professional Loans (SBP) - AQR 83
SBP - Methodology 88
Commercial Real Estate (CRE) Loans - AQR 90
CRE - Methodology 93
Shipping Loans – AQR 97
Shipping Loans - Methodology 100
Disclaimer 103
2 | Bank of Greece
Engagement Summary
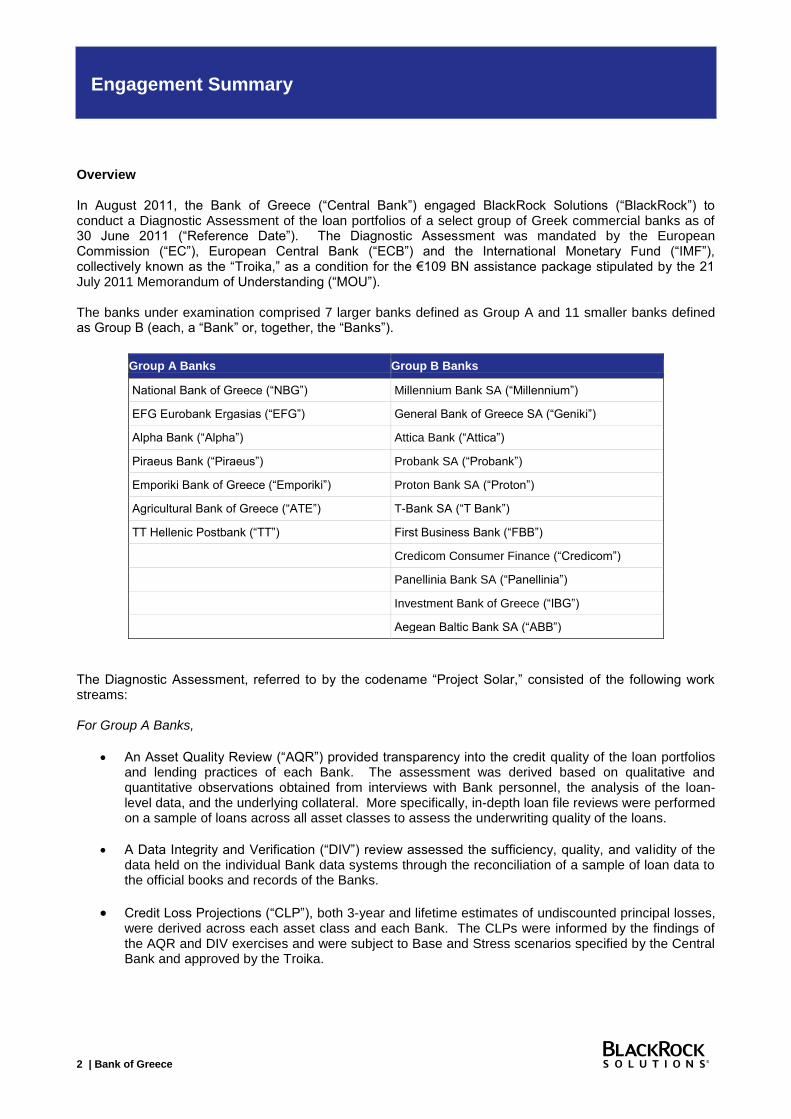
Overview In August 2011, the Bank of Greece (“Central Bank”) engaged BlackRock Solutions (“BlackRock”) to conduct a Diagnostic Assessment of the loan portfolios of a select group of Greek commercial banks as of 30 June 2011 (“Reference Date”). The Diagnostic Assessment was mandated by the European Commission (“EC”), European Central Bank (“ECB”) and the International Monetary Fund (“IMF”), collectively known as the “Troika,” as a condition for the €109 BN assistance package stipulated by the 21 July 2011 Memorandum of Understanding (“MOU”). The banks under examination comprised 7 larger banks defined as Group A and 11 smaller banks defined as Group B (each, a “Bank” or, together, the “Banks”). The Diagnostic Assessment, referred to by the codename “Project Solar,” consisted of the following work streams: For Group A Banks,
An Asset Quality Review (“AQR”) provided transparency into the credit quality of the loan portfolios and lending practices of each Bank. The assessment was derived based on qualitative and quantitative observations obtained from interviews with Bank personnel, the analysis of the loan-level data, and the underlying collateral. More specifically, in-depth loan file reviews were performed on a sample of loans across all asset classes to assess the underwriting quality of the loans.
A Data Integrity and Verification (“DIV”) review assessed the sufficiency, quality, and validity of the data held on the individual Bank data systems through the reconciliation of a sample of loan data to the official books and records of the Banks.
Credit Loss Projections (“CLP”), both 3-year and lifetime estimates of undiscounted principal losses, were derived across each asset class and each Bank. The CLPs were informed by the findings of the AQR and DIV exercises and were subject to Base and Stress scenarios specified by the Central Bank and approved by the Troika.
Group A Banks Group B Banks
National Bank of Greece (“NBG”) Millennium Bank SA (“Millennium”)
EFG Eurobank Ergasias (“EFG”) General Bank of Greece SA (“Geniki”)
Alpha Bank (“Alpha”) Attica Bank (“Attica”)
Piraeus Bank (“Piraeus”) Probank SA (“Probank”)
Emporiki Bank of Greece (“Emporiki”) Proton Bank SA (“Proton”)
Agricultural Bank of Greece (“ATE”) T-Bank SA (“T Bank”)
TT Hellenic Postbank (“TT”) First Business Bank (“FBB”)
Credicom Consumer Finance (“Credicom”)
Panellinia Bank SA (“Panellinia”)
Investment Bank of Greece (“IBG”)
Aegean Baltic Bank SA (“ABB”)
3 | Bank of Greece
A Loan Loss Provision (“LLP”) review created a side-by-side comparison of each Bank’s provision levels
1 with the BlackRock CLPs, for each asset class analyzed.
For Group B Banks,
A high-level AQR was performed which consisted of an evaluation of the written information submitted by Banks, management due diligence sessions, and a comparison to the key findings from the review of the Group A Banks. An important distinction between the Group A and Group B Bank AQR was that none of the Group B Banks were subject to individual loan file reviews or re-underwriting. Additionally, BlackRock did not schedule specific asset-class focused Deep Dive meetings nor were in-depth data gap and error reviews held.
A DIV review was not performed for Group B Banks.
CLPs, both 3-year and lifetime estimates of undiscounted principal losses, were derived by leveraging the modeling framework developed for the Group A Banks including the Base and Stress scenarios specified by the Central Bank and approved by the Troika.
An LLP review created a side-by-side comparison of each Bank’s provision levels with the BlackRock CLPs on an asset class basis.
For the purposes of this report, Asset Classes were generally defined as follows:
As an overlay to the Commercial Loans, the following designations were applied for purposes of the
Diagnostic Assessment. These categories are subsets of the Commercial Loans; as such, they are not
mutually exclusive from the Asset Classes listed above, or with each other.
1 Based on Greek IFRS
2 Excludes Shipping and Commercial Real Estate loans, which are separately defined
Asset Class Description
Co
ns
um
er
Lo
an
s
Residential Mortgages Loans that are residential mortgage loans or renovation loans
Consumer Loan Products Non-mortgage related consumer loans further divided into:
Credit Cards
Auto Loans
Other Personal Loans, including Term and Revolving Loans
Co
mm
erc
ial
Lo
an
s
Corporate Loans Commercial loans to Corporate borrowers with an annual turnover of €25 MM or greater
2
Small and Medium Enterprises (“SME”)
Commercial loans to borrowers having an annual turnover of between €2 and 25 MM
Small Business and Professional (“SBP”) Loans
Small business loans to borrowers having an annual turnover of less than €2 MM
Commercial Real Estate (“CRE”) Loans
Commercial loans collateralized by commercial real estate property, including CRE loans issued by Greek leasing subsidiaries
Shipping Loans Commercial loans collateralized by shipping vessels
4 | Bank of Greece
Process Summary BlackRock entered into a contract for services with the Central Bank, dated 11 August 2011, which covered the aforementioned work streams. The principal work stream scope was summarized in Schedule A to the Advisory Agreement (“Agreement”). The Diagnostic Assessment was performed over the course of four months from mid-August to mid-December, which was an ambitious timeframe given the breadth of the project and the number of Banks included in the scope of the analysis. Further detail on the scope, by asset class and work stream, were laid out in an Implementation Memorandum (attached in Exhibit A), which was initially submitted on 30 September 2011 and refined throughout the course of the project. With respect to the AQR, CLP, and LLP components of Project Solar, BlackRock engaged a large internal team comprising product-specific and Bank-specific teams, with an overall project management and oversight structure. To supplement the AQR process, particularly the extraction of credit data on a subset of loans selected for in-depth file review, BlackRock engaged external vendors with specific product expertise. For the Residential Mortgages and Consumer Loan Products review, BlackRock engaged Clayton Euro Risk Management (“Clayton”) to assist with loan underwriting. For SME and SBP, BlackRock engaged Ernst & Young (“E&Y”) to perform loan file reviews. For the DIV exercise, as reviewed and approved by the Central Bank, BlackRock also engaged three accounting firms with local presence – E&Y, KPMG Advisors AE (“KPMG”), and PricewaterhouseCoopers Business Solutions S.A. (“PwC”) – to perform specific reviews across each of the Banks according to a consistent protocol and set of procedures. The accounting firms were selected and assigned to Banks following a review of credentials, staffing capabilities, and an assessment of independence from prior conflicts as judged and determined by the Central Bank. E&Y assisted BlackRock with central DIV coordination and was assigned to review Alpha Bank, ATE, EFG, and TT; KPMG was assigned to review Emporiki and Piraeus; and PwC to review NBG. E&Y also served a supporting role in various capacities including project management, bank relationship management, and product support by supplementing the BlackRock team with local knowledge and language assistance. BlackRock also engaged two legal firms, Karatzas & Partners Law Firm and PotamitisVekris to advise on relevant legal matters related to the Greek lending environment.
3 Credit Guaranteed Fund for Small Business and Professional Enterprises
Asset Class Overlays Description
Co
mm
erc
ial
Lo
an
s
Large Loans Commercial exposures greater than €25 MM at the borrower group level, including funded, unfunded committed and unfunded uncommitted exposures
State-Related Loans Commercial loans with Greek state-related exposures as defined by the following categories:
1a) Explicitly Guaranteed Large Loans – Loans to large state-owned companies or
entities which are explicitly guaranteed by the State, as evidenced by a Joint Ministerial Decision (KYA)
1b) Explicitly Guaranteed Credit Support Programs – Loans to private sector companies which are explicitly guaranteed by TEMPME
3 or directly by the State
through a KYA decision
2) State Ownership/Affiliation - Loans to entities controlled and/or (partially) owned by the State, materially dependent on the State, or with some public purpose
3) State Related Collateral – Loans secured by Greek Government Bonds (“GGB”),
subsidies, or other receivables from the State or State-related entities
“Public Loans” refer to loans in Categories 1a and 2 above
5 | Bank of Greece
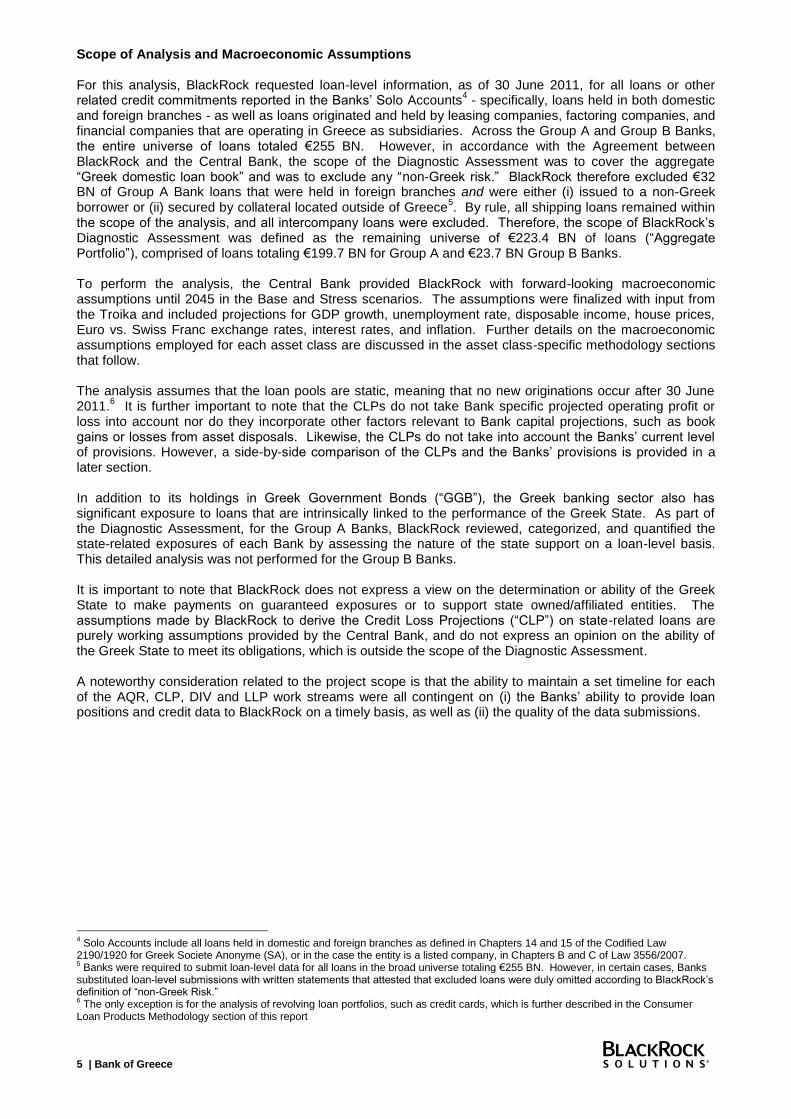
Scope of Analysis and Macroeconomic Assumptions For this analysis, BlackRock requested loan-level information, as of 30 June 2011, for all loans or other related credit commitments reported in the Banks’ Solo Accounts
4 - specifically, loans held in both domestic
and foreign branches - as well as loans originated and held by leasing companies, factoring companies, and financial companies that are operating in Greece as subsidiaries. Across the Group A and Group B Banks, the entire universe of loans totaled €255 BN. However, in accordance with the Agreement between BlackRock and the Central Bank, the scope of the Diagnostic Assessment was to cover the aggregate “Greek domestic loan book” and was to exclude any “non-Greek risk.” BlackRock therefore excluded €32 BN of Group A Bank loans that were held in foreign branches and were either (i) issued to a non-Greek borrower or (ii) secured by collateral located outside of Greece
5. By rule, all shipping loans remained within
the scope of the analysis, and all intercompany loans were excluded. Therefore, the scope of BlackRock’s Diagnostic Assessment was defined as the remaining universe of €223.4 BN of loans (“Aggregate Portfolio”), comprised of loans totaling €199.7 BN for Group A and €23.7 BN Group B Banks.
To perform the analysis, the Central Bank provided BlackRock with forward-looking macroeconomic assumptions until 2045 in the Base and Stress scenarios. The assumptions were finalized with input from the Troika and included projections for GDP growth, unemployment rate, disposable income, house prices, Euro vs. Swiss Franc exchange rates, interest rates, and inflation. Further details on the macroeconomic assumptions employed for each asset class are discussed in the asset class-specific methodology sections that follow. The analysis assumes that the loan pools are static, meaning that no new originations occur after 30 June 2011.
6 It is further important to note that the CLPs do not take Bank specific projected operating profit or
loss into account nor do they incorporate other factors relevant to Bank capital projections, such as book gains or losses from asset disposals. Likewise, the CLPs do not take into account the Banks’ current level of provisions. However, a side-by-side comparison of the CLPs and the Banks’ provisions is provided in a later section. In addition to its holdings in Greek Government Bonds (“GGB”), the Greek banking sector also has significant exposure to loans that are intrinsically linked to the performance of the Greek State. As part of the Diagnostic Assessment, for the Group A Banks, BlackRock reviewed, categorized, and quantified the state-related exposures of each Bank by assessing the nature of the state support on a loan-level basis. This detailed analysis was not performed for the Group B Banks. It is important to note that BlackRock does not express a view on the determination or ability of the Greek State to make payments on guaranteed exposures or to support state owned/affiliated entities. The assumptions made by BlackRock to derive the Credit Loss Projections (“CLP”) on state-related loans are purely working assumptions provided by the Central Bank, and do not express an opinion on the ability of the Greek State to meet its obligations, which is outside the scope of the Diagnostic Assessment. A noteworthy consideration related to the project scope is that the ability to maintain a set timeline for each of the AQR, CLP, DIV and LLP work streams were all contingent on (i) the Banks’ ability to provide loan positions and credit data to BlackRock on a timely basis, as well as (ii) the quality of the data submissions.
4 Solo Accounts include all loans held in domestic and foreign branches as defined in Chapters 14 and 15 of the Codified Law
2190/1920 for Greek Societe Anonyme (SA), or in the case the entity is a listed company, in Chapters B and C of Law 3556/2007. 5 Banks were required to submit loan-level data for all loans in the broad universe totaling €255 BN. However, in certain cases, Banks
substituted loan-level submissions with written statements that attested that excluded loans were duly omitted according to BlackRock’s definition of “non-Greek Risk.” 6 The only exception is for the analysis of revolving loan portfolios, such as credit cards, which is further described in the Consumer
Loan Products Methodology section of this report
6 | Bank of Greece
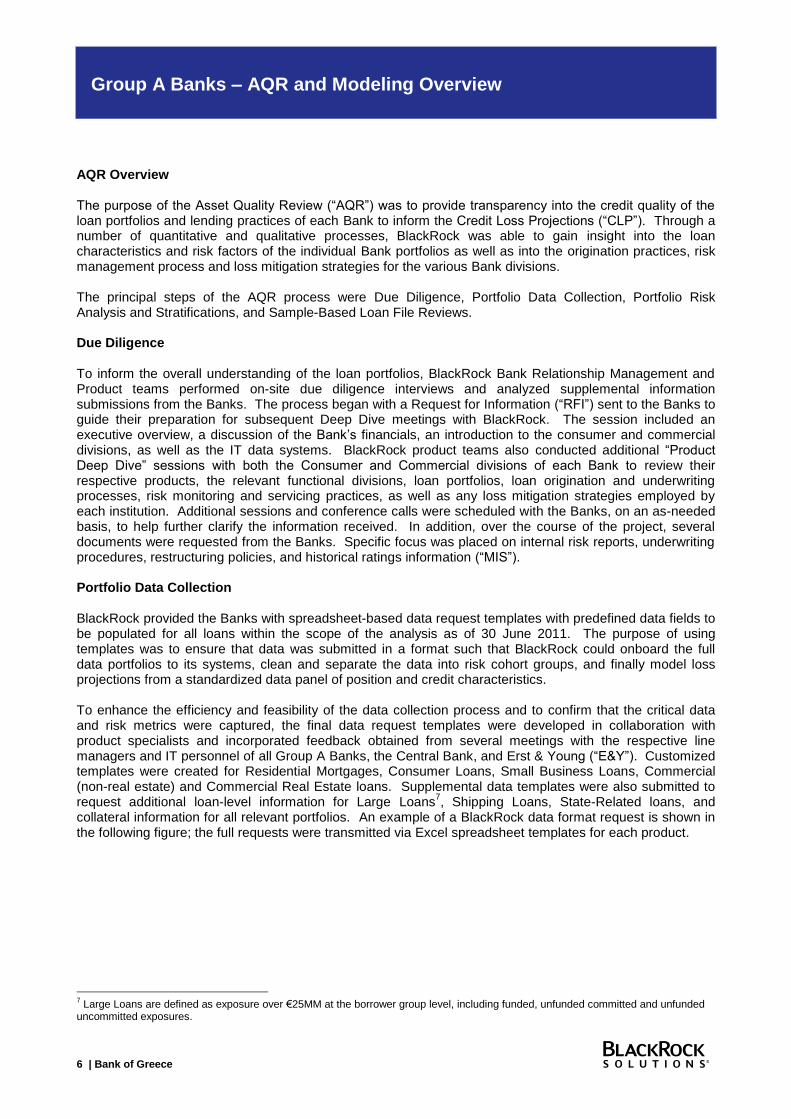
Group A Banks – AQR and Modeling Overview
AQR Overview The purpose of the Asset Quality Review (“AQR”) was to provide transparency into the credit quality of the loan portfolios and lending practices of each Bank to inform the Credit Loss Projections (“CLP”). Through a number of quantitative and qualitative processes, BlackRock was able to gain insight into the loan characteristics and risk factors of the individual Bank portfolios as well as into the origination practices, risk management process and loss mitigation strategies for the various Bank divisions. The principal steps of the AQR process were Due Diligence, Portfolio Data Collection, Portfolio Risk Analysis and Stratifications, and Sample-Based Loan File Reviews. Due Diligence To inform the overall understanding of the loan portfolios, BlackRock Bank Relationship Management and Product teams performed on-site due diligence interviews and analyzed supplemental information submissions from the Banks. The process began with a Request for Information (“RFI”) sent to the Banks to guide their preparation for subsequent Deep Dive meetings with BlackRock. The session included an executive overview, a discussion of the Bank’s financials, an introduction to the consumer and commercial divisions, as well as the IT data systems. BlackRock product teams also conducted additional “Product Deep Dive” sessions with both the Consumer and Commercial divisions of each Bank to review their respective products, the relevant functional divisions, loan portfolios, loan origination and underwriting processes, risk monitoring and servicing practices, as well as any loss mitigation strategies employed by each institution. Additional sessions and conference calls were scheduled with the Banks, on an as-needed basis, to help further clarify the information received. In addition, over the course of the project, several documents were requested from the Banks. Specific focus was placed on internal risk reports, underwriting procedures, restructuring policies, and historical ratings information (“MIS”). Portfolio Data Collection BlackRock provided the Banks with spreadsheet-based data request templates with predefined data fields to be populated for all loans within the scope of the analysis as of 30 June 2011. The purpose of using templates was to ensure that data was submitted in a format such that BlackRock could onboard the full data portfolios to its systems, clean and separate the data into risk cohort groups, and finally model loss projections from a standardized data panel of position and credit characteristics. To enhance the efficiency and feasibility of the data collection process and to confirm that the critical data and risk metrics were captured, the final data request templates were developed in collaboration with product specialists and incorporated feedback obtained from several meetings with the respective line managers and IT personnel of all Group A Banks, the Central Bank, and Erst & Young (“E&Y”). Customized templates were created for Residential Mortgages, Consumer Loans, Small Business Loans, Commercial (non-real estate) and Commercial Real Estate loans. Supplemental data templates were also submitted to request additional loan-level information for Large Loans
7, Shipping Loans, State-Related loans, and
collateral information for all relevant portfolios. An example of a BlackRock data format request is shown in the following figure; the full requests were transmitted via Excel spreadsheet templates for each product.
7 Large Loans are defined as exposure over €25MM at the borrower group level, including funded, unfunded committed and unfunded
uncommitted exposures.

7 | Bank of Greece
Figure 1: Excerpt from BlackRock Data Request Template
The entire data collection was an iterative process that took place over a period of ten weeks whereby Banks provided data and information to facilitate data clarification, reconciliation, and quality control. To that end, BlackRock received over 100 loan tapes across the 18 Banks, of which a substantial portion was due to re-submissions or modifications to previously submitted data. While there was some inconsistency in the timing of the receipt of data sets across Banks and asset classes, in general, BlackRock received sufficient data over the course of the allotted time frame to perform a robust analysis. Where BlackRock was not able to receive key model input data, certain qualifying assumptions were made to address these gaps, all of which are set forth in detail in the methodology sections for the specific asset classes. The key drivers of challenges and data delays across the Banks and individual asset classes were generally characterized as follows:
Banks submitted multiple iterations of the same data files, which necessitated repeated database updates, quality control and integrity checks. While re-submissions are expected in a project of this nature, the number of Banks, breadth of asset classes, and compressed timeframe for the Diagnostic made data collection challenging.
The logic used to link the loan exposure files with the collateral data files varied across multiple asset classes and Banks
Differences in definitions and naming conventions existed across the Banks for industry classifications and other fields
Different loan rating systems across Banks as well as multiple loan ratings systems within a Bank
Product set and credit metrics definitions varied across the Banks as a whole and across various verticals within each Bank. The latter was particularly true for the SBP, SME and Commercial Real Estate exposures.
Multiple data platforms (in some cases associated with individual lending business verticals and/or servicing platforms within the institutions);
Lack of availability of certain digitized data, which was often only available in the primary source documents
To address practical data management considerations, including confidentiality concerns, BlackRock worked with the Central Bank to contract with IntraLinks for data storage and transmission capabilities. Via this engagement, a virtual repository was established into which the Banks could upload data and make it available to BlackRock and other vendors on a permissioned basis.
Field Number Field Name Field Name (translation) Field Definition
CORP_07 Borrower Type Τύπος δανειολήπτηType of borrower (private company,
self employed, etc.)
CORP_10 Current Internal RatingΤρέχουσα εσωτερική διαβάθμιση
πιστοληπτικής ικανότηταςCurrent Internal rating of the borrower
CORP_16 Industry Sector - ExternalΚλάδος δραστηριότητας (εξωτερική
κωδικοποίηση)External industry classification
CORP_34 Loan or Product Type Είδος δανείου ή προιόντοςLoan or product classification or
code (Term, Revolving, LG, etc.)
CORP_17 Loan Origination Date Ημερομηνία έναρξης δανείου Date the loan was originated
CORP_19 Expiration/Maturity date (Current) Ημερομηνία λήξηςContractual maturity of the loan,
including auto extension options.
CORP_20 Original Total Limit Αρχικό συνολικό όριο Loan Balance or Limit at origination
CORP_22 Current Funded Balance Τρέχων χρηματοδοτούμενο υπόλοιπο Funded Balance as of June 30, 2011
CORP_28 Current Interest Rate Τρέχων επιτόκιο Current interest rate on the loan
CORP_29 Interest Rate Type Τύπος επιτοκίου Fixed vs. Floating
CORP_32 Secured/Unsecured Flag'Ενδειξη εξασφαλίσεων / μη
εξασφαλίσεων
Bank's internal code classifying loan
as secured or unsecured
CORP_126 Greek Government Guaranteed Εγγύηση Ελληνικού Δημοσίου
Yes or No (whether the Bank relied
on a Greek State guarantee as an
additional source of repayment upon
credit approval)
CORP_42 Loan Status Κατάσταση δανείου
Unique code for status of the loan
(i.e., current, default, contamination,
repossession, etc.)
Commercial (non-CRE) Loan Data Tape

8 | Bank of Greece
Portfolio Risk Analysis and Stratification As part of the iterative data process with the Banks, BlackRock organized the loan-level data into summary stratification tables. These tables were supplied by BlackRock to each of the Banks in a standard output format for confirmation/verification of loan balances and other key data fields. This allowed the Banks to confirm that the output of the data supplied to BlackRock was consistent in size and characteristics with the Banks’ understanding of their respective portfolios. Any inconsistencies were addressed by both the Banks and BlackRock to the extent practical in the given timeframe during which this analysis was conducted. Specific attention was given to consistently excluding “non-Greek Risk” across the Banks. BlackRock, in alignment with the Bank of Greece, defined “non-Greek Risk” as loans that were held in foreign branches and were either (i) issued to a non-Greek borrower or (ii) secured by collateral located outside of Greece. Additionally, all shipping loans remained within the scope of the analysis, and all intercompany loans were excluded. Banks were required to submit loan-level data for all loans in domestic and foreign branches and foreign subsidiaries. BlackRock’s Bank Relationship Mangers and Analytical Data Specialists worked closely with the Banks to ensure that loans with “non-Greek Risk” were systematically identified and consistently excluded across Banks. In certain cases, Banks substituted loan-level submissions with written statements that attested that the excluded loans were duly omitted according to BlackRock’s definition of “non-Greek Risk.” This was most common where Banks had systems limitations that resulted in significant difficulties to obtain the loan-level information from their foreign branches within the timeframe allotted. Across the 7 Group A Banks, BlackRock onboarded a total of €231 BN in funded exposure. After excluding “non-Greek Risk,” BlackRock analyzed a total of €200 BN in loan exposure divided between Residential Mortgages (€65 BN), non-Mortgage Consumer Loan Products (€26 BN), and Commercial Loans (€109 BN). In total 2,981 loan files were manually reviewed, as described in the subsequent sections. The stratification of the portfolio data also allowed BlackRock to gain a better understanding of the key risk factors of the individual portfolios and to organize the data into risked-based “cohorts” for the purposes of modeling loss projections. Cohorting is a modeling technique used to group together loans predicted to exhibit similar credit characteristics and performance behavior; its role in modeling is discussed in further detail in the individual asset class methodology sections. Sample-based Underwriting and Loan File Reviews For Group A Banks only, BlackRock performed in-depth manual reviews of a sample of loans within each asset class to help inform the CLP models. These assessments informed BlackRock’s view of the credit quality of each Bank’s portfolio and are described in further detail within the individual asset class methodology sections. A summary of the sample of files reviewed are presented in the ensuing sections. Modeling Overview The model methodologies employed for the Group A Banks are described in detail in each of the individual asset class methodology sections that follow.

9 | Bank of Greece
Group B Banks – AQR and Modeling Overview
Overview The purpose of the Asset Quality Review (“AQR”) was to provide transparency into the composition and credit quality of the loan portfolios of each Bank to inform the Credit Loss Projections (“CLP”). For Group B Banks, the review consisted of an evaluation of the submitted portfolio information, management information sessions, and a comparison to the key findings from the review of the Group A Banks. The Group B AQR process was less rigorous than that performed for the Group A Banks. The most notable distinction from the Group A analysis was that manual loan file reviews were not performed for the Group B loan portfolios. Due Diligence To inform an overall understanding of the loan portfolios, BlackRock Bank Relationship Managers and Product teams performed due diligence information sessions and analyzed supplemental information submissions from the Banks. The process began with a Request for Information sent to the Banks to guide their preparation for a subsequent Deep Dive meeting with BlackRock. The session included an executive overview, a discussion of the Bank’s financials, an introduction to the consumer and commercial divisions, as well as the IT data systems. Calls were scheduled with Banks, on an as-needed basis, to help clarify information. Over the course of the project, additional documents and information were requested from the Banks on a situational basis to clarify understanding of the portfolio data. Portfolio Data Collection BlackRock sent the Banks spreadsheet-based data request templates with predefined data fields to be populated for all loans within the scope of the analysis as of 30 June 2011. The purpose of using templates was to ensure that data was submitted in a format that could be efficiently analyzed and modeled by BlackRock. For Residential and Consumer loans, BlackRock requested loan portfolio datasets from the Group B Banks which included either i) loan-level data for portfolios with combined residential and consumer balances greater than €500 MM; or ii) risk-cohort level data (“Rep Line”) for portfolios less than €500 MM. Where loan-level data was requested, the same Residential and Consumer templates were used for both Group A and Group B Banks. For Commercial loans, BlackRock requested loan-level information from all Group B Banks using an abridged version of the template used for Group A Banks. This request was further supplemented by a request for consolidated collateral information, and a request for stratified portfolio data, by asset class segment.

10 | Bank of Greece
A summary of the data requests is shown in the following figure.
Figure 2: Group B Data Request Summary Highlighted boxes indicate loan-level data requested
Residential Mortgages
Consumer Commercial
Millennium
Geniki
Attica
Probank
T Bank
Proton
FB Bank
Credicom
Panellinia
IBG
AB Bank
An example of a BlackRock request for Rep Line data is shown in the figure below; full requests were transmitted via excel spreadsheet templates for each product.
Figure 3: Excerpt from BlackRock Group B Residential “Rep Line” Request
As with the Group A Banks, BlackRock used IntraLinks for data storage and transmission for Group B Banks. Specific Bank Notes Two Group B Banks were analyzed in specific contexts:
As of 17 December 2011, T-Bank was put in liquidation. The analysis in this document refers to the status of T-Bank as of 30 June 2011.
Proton Bank was split into an “old bank” and “new bank” on 10 October 2011. BlackRock analyzed the loans identified by the Bank’s management as the loans as of 30 June 2011 that were later transferred into the “new bank.”
Portfolio Risk Analysis and Modeling Overview
Across the 11 Group B institutions, BlackRock analyzed a total of €23.7 BN in funded balance, comprised of Commercial Loans (€15.8 BN) and Residential and Consumer Loans (€7.9 BN).
Residential Mortgages
Weighted Average Seasoning (i.e. number of months since loan was originated)
Weighted Average Indexed LTV*
Weighted Average % CHF (Swiss Franc) Denominated
Weighted Average % Restructured
Weighted Average % Rescheduled
Weighted Average % Ever in Forbearance
Weighted Average % Still in Forbearance
Weighted Average End Date for Loans in Forbearance
Weighted Average % Government Guaranteed
Weighted Average % Property in Athens

11 | Bank of Greece
A. Consumer Loan Portfolios For the 5 Group B Banks that provided loan-level data - Millennium, Credicom, Geniki, Attica, and T Bank – the approach was broadly similar to that taken with respect to the Group A Banks. BlackRock organized the loan-level data into summary stratification tables, allowing for a better understanding of the key risk factors of the individual portfolios and the separation of data into risked-based cohorts for the purposes of modeling loss projections. The cohorts were subsequently run through the cash flow models in the same way as for the Group A Banks, which is described in detail in the following asset class sections. For the remaining 5 Banks with Consumer portfolios, the models were based off of the Rep Lines provided to BlackRock. The Rep Lines in effect acted as a single cohort and were run through the cash flow models in the same way as for the Group A Banks, which is described in detail in the following asset class sections.
B. Commercial Loan Portfolios Utilizing consolidated portfolio segmentation, delinquency, and collateral coverage information provided by the Group B Banks, BlackRock extrapolated loss estimates based on the Group A Bank loss results. For each portfolio segment (Corporate/SME combined, CRE, Leasing, Factoring, SBP, State-Related), BlackRock cohorted the loan segments into four categories:
Current, Secured
Current, Unsecured
Non-Current (90+ days past due), Secured
Non-Current (90+ days past due), Unsecured BlackRock then applied the weighted-average Group A loss results by segment and cohort to each Group B Bank exposure. Similar to the Group A analysis, BlackRock assumed that:
Exposure = 100% of the Current Funded Balance 10% of the Unfunded Committed Exposure 5% of the Unfunded Uncommitted Exposure
For the Shipping segment of the Group B Bank portfolios, BlackRock applied two different tiers of loss rates from the Group A Banks. For ABB, the Bank with a sole focus on shipping finance, BlackRock applied weighted average loss rate estimates from the NBG, EFG, and Alpha (“Tier 1”; Group A Banks with lower loss rates). Due to the transfer of exposures into the “old bank” by Proton, BlackRock applied Tier 1 loss rates to the shipping portfolio retained by Proton. For all other Group B Banks with shipping loan exposure, weighted average loss rates from Piraeus and Emporiki (“Tier 2”; Group A Banks with higher loss rates) were applied. For the State-Related loan segment, BlackRock categorized approximately half of the loans as state-related category 1b, and half of the loans as state-related category 2, which was consistent with the proportion of 1b to 2 loans observed in Group A Banks. The Group A Bank weighted average loss rates for these state-related segments were applied to the corresponding Group B Bank exposures.
12 | Bank of Greece
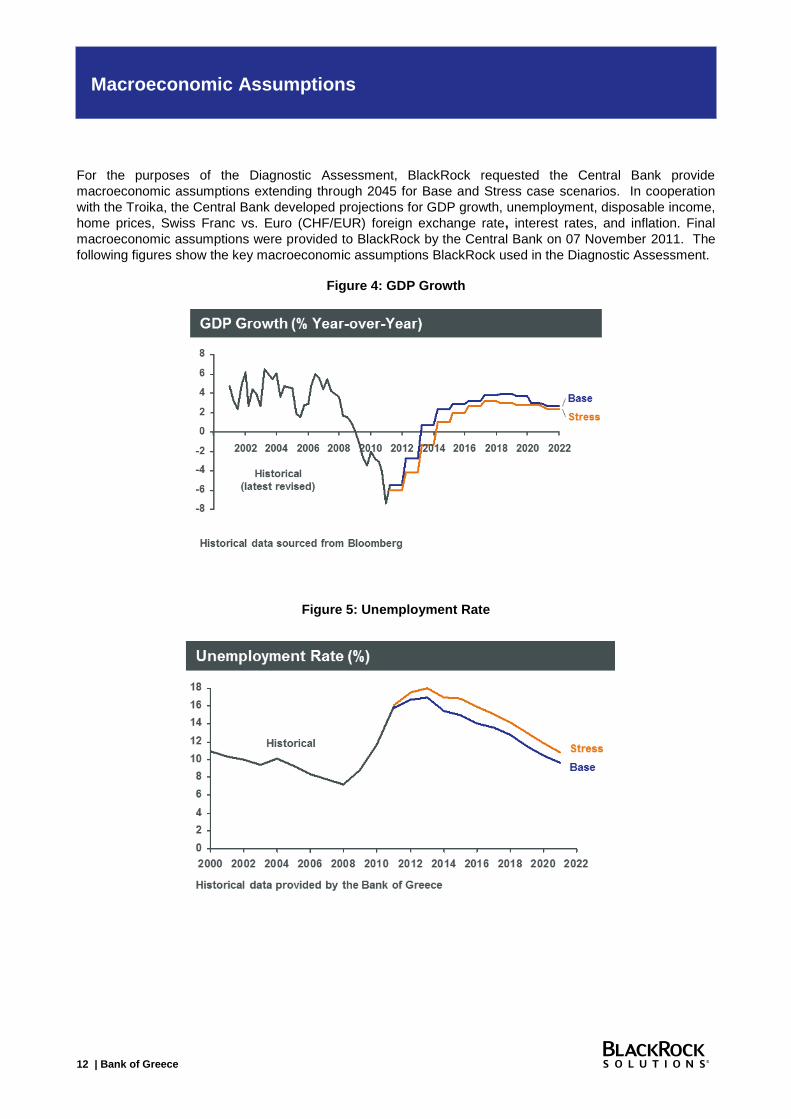
Macroeconomic Assumptions
For the purposes of the Diagnostic Assessment, BlackRock requested the Central Bank provide
macroeconomic assumptions extending through 2045 for Base and Stress case scenarios. In cooperation
with the Troika, the Central Bank developed projections for GDP growth, unemployment, disposable income,
home prices, Swiss Franc vs. Euro (CHF/EUR) foreign exchange rate, interest rates, and inflation. Final
macroeconomic assumptions were provided to BlackRock by the Central Bank on 07 November 2011. The
following figures show the key macroeconomic assumptions BlackRock used in the Diagnostic Assessment.
Figure 4: GDP Growth
Figure 5: Unemployment Rate
13 | Bank of Greece
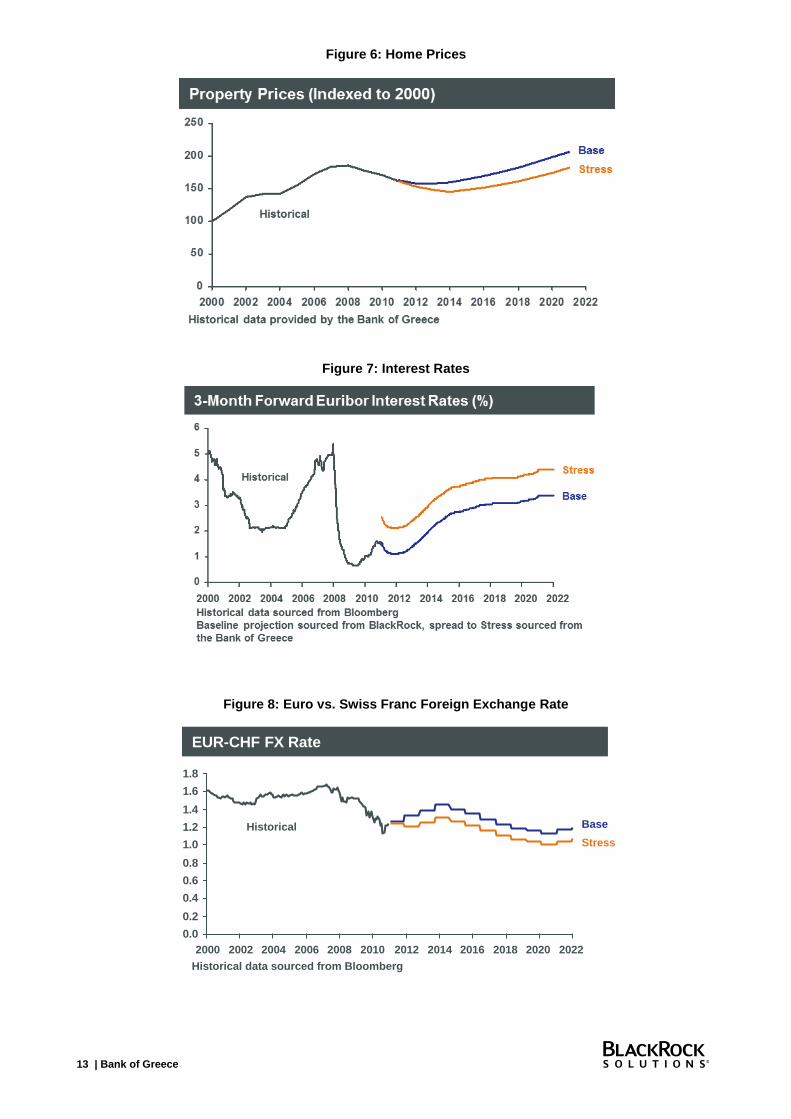
Figure 6: Home Prices
Figure 7: Interest Rates
Figure 8: Euro vs. Swiss Franc Foreign Exchange Rate
EUR-CHF FX Rate
0.0
0.2
0.4
0.6
0.8
1.0
1.2
1.4
1.6
1.8
Base
Stress
Historical data sourced from Bloomberg
Historical
2000 2002 2004 2006 2008 2010 2012 2014 2016 2018 2020 2022
14| Bank of Greece
Residential Mortgage Loans - AQR
Due Diligence The process to assess asset quality in residential mortgages combined qualitative and quantitative reviews and included the analysis of portfolio data, historic portfolio performance, and lending and collection operations. BlackRock’s review covered the following:
i) Management and Business due diligence meetings and interviews conducted across the 7 Group A Banks. In particular, the review encompassed the Banks’ lending practices, including historical origination and underwriting, as well as loan collection processes and procedures.
ii) Additional review of the Banks’ loss mitigation practices and products, including their forbearance, rescheduling, refinancing and restructuring practices and policies.
iii) Research related to the enforceability of pre-notations and the residential auction process in Greece, including the associated costs.
This blend of qualitative and quantitative components served as an additional input to inform models developed to generate CLP results. Management / Business Due Diligence Meetings & Interviews Meetings and interviews were held with business unit managers covering origination practices, underwriting, and collections (targeting loss mitigation practices). Topics addressed during these interviews included:
Background and Lender Profile
Origination Strategy and Product Composition
Collateral Valuation
Underwriting Guidelines and Criteria
Compliance, Quality Control, and Risk Management
Systems and Technology
Servicing/Collections and Arrears Management
Loss Mitigation Strategies, Practices, and Procedures
Loan Denouncement and the Auction process The purpose of the meetings was to gain an understanding of the origination and underwriting philosophies and practices at each Bank, in addition to their relative level of preparedness to address servicing challenges precipitated by the crisis, the moratorium against auctions of foreclosed properties, and coincident decline of housing stock values. Initial meetings were held with each of the 7 Group A Banks between 29 August and 7 September 2011. Follow-up meetings focusing specifically on the residential mortgage and consumer loan portfolios were held with each of the 7 Group A Banks between 8 September and 29 September 2011. These meetings frequently included detailed presentations prepared by the Banks to address the above topics. Loss Mitigation/Debt Management Sessions In addition to the above meetings, further sessions were held in October and November with each of the 7 Group A Banks to focus solely on each Bank’s forbearance, rescheduling, refinancing and restructuring practices. These additional meetings were held to ensure that BlackRock had an accurate understanding of each Bank’s loss mitigation policies.

15| Bank of Greece
Portfolio Data Collection Data was supplied by each of the Banks in a format stipulated by BlackRock as of 30 June 2011. The data format itself was developed in consultation with the Banks during a series of data meetings held with their data and IT personnel in August and September. This process had the advantage of ensuring that the data supplied was directly comparable across institutions, with (broadly) the same field definitions applied for each submitted data set. The data was onboarded by BlackRock in a system facilitating the development of loan stratification and data gap reports as well as a number of data overrides and assumptions. PORTFOLIO STRATIFICATIONS AND RISK ANALYSIS Data Gap and Error Process to Confirm Balances and Key Characteristics Detailed stratification tables in a standard output format were supplied by BlackRock to each of the Banks for confirmation and verification of balances and other portfolio characteristics. This allowed each Bank to confirm that the data supplied to BlackRock was consistent in size and characteristics with the Bank’s understanding of its own respective portfolio. Data gap reports testing for missing data, errors, and field boundaries were also shared with the Banks to aid in this iterative process. In addition to sharing these reports with the Banks, BlackRock held calls and engaged in additional correspondence with each Bank between October and December to review and discuss the reports and identify potential issues and errors. Identified inconsistencies and issues were addressed by the Banks via data submission supplements to the extent practical given the compressed time frame during which this analysis was conducted. Data fields reviewed during this process included, among others, funded, unfunded, and limit balances; delinquency status, including 90+ and 180+ days past due; LTV; percentage of loans with loss mitigation; interest rates; geographic location; seasoning and remaining terms; borrower occupation; loan currency; credit scores; government guaranteed balances; OEK; and percentage of loans with IO or flexible payment terms at origination. Data Assumptions The Banks’ data submission varied in completeness and quality of the requested data. In order to cope with missing or potentially erroneous data, BlackRock made certain assumptions on a case-by-case basis, as partly detailed below:
Figure 9: Data Gap Assumptions and Related Calculations
Field Data Assumption
Origination date missing Assigned Bank's mean origination date
LTV is missing
Where both the LTV field and property valuation fields were missing from the data files, BlackRock reviewed Bank's weighted average (“WA”) LTV distribution by vintage and then assigned WA LTVs to use for indexing. Stratifications may have been used to calculate and assign WA LTVs (e.g., WA LTV for Gov't Guaranteed vs. WA for Non-Gov't Guaranteed)
Postal code is missing Assigned to Geographic Location "Other" category
End date for loans Still in Forbearance missing
Assigned to Bank's WA Forbearance End Date or assigned based on information learned during restructuring review meetings
End date for loans Still in IO missing For loans still missing end dates after review with Banks, assigned to 2011.
Maturity date missing Assigned a 30 year term from origination date
Current interest rate missing Assigned Bank's WA coupon
Interest rate type missing Assigned to Floating
Employment type Categorizing into high-level categories provided directly by Banks or combined by BlackRock when not available.
Internal origination credit score missing No assumption made. Model allowed for missing credit scores.
16| Bank of Greece
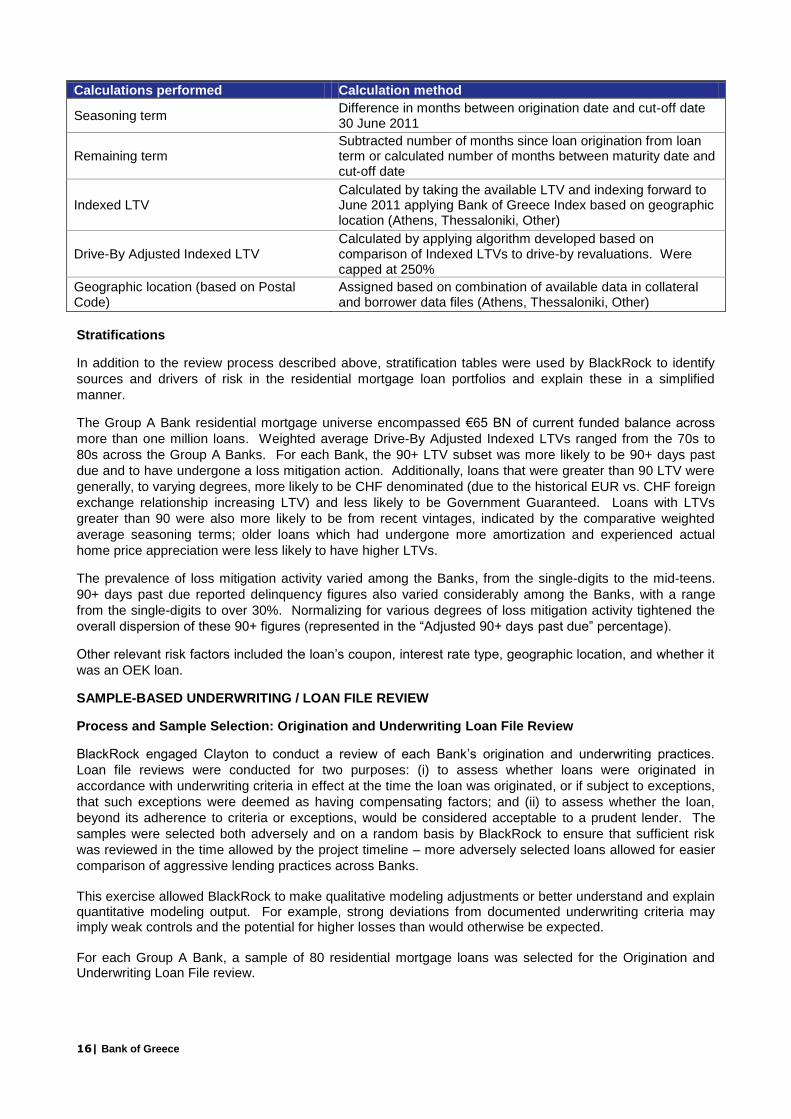
Calculations performed Calculation method
Seasoning term Difference in months between origination date and cut-off date 30 June 2011
Remaining term Subtracted number of months since loan origination from loan term or calculated number of months between maturity date and cut-off date
Indexed LTV Calculated by taking the available LTV and indexing forward to June 2011 applying Bank of Greece Index based on geographic location (Athens, Thessaloniki, Other)
Drive-By Adjusted Indexed LTV Calculated by applying algorithm developed based on comparison of Indexed LTVs to drive-by revaluations. Were capped at 250%
Geographic location (based on Postal Code)
Assigned based on combination of available data in collateral and borrower data files (Athens, Thessaloniki, Other)
Stratifications
In addition to the review process described above, stratification tables were used by BlackRock to identify
sources and drivers of risk in the residential mortgage loan portfolios and explain these in a simplified
manner.
The Group A Bank residential mortgage universe encompassed €65 BN of current funded balance across
more than one million loans. Weighted average Drive-By Adjusted Indexed LTVs ranged from the 70s to
80s across the Group A Banks. For each Bank, the 90+ LTV subset was more likely to be 90+ days past
due and to have undergone a loss mitigation action. Additionally, loans that were greater than 90 LTV were
generally, to varying degrees, more likely to be CHF denominated (due to the historical EUR vs. CHF foreign
exchange relationship increasing LTV) and less likely to be Government Guaranteed. Loans with LTVs
greater than 90 were also more likely to be from recent vintages, indicated by the comparative weighted
average seasoning terms; older loans which had undergone more amortization and experienced actual
home price appreciation were less likely to have higher LTVs.
The prevalence of loss mitigation activity varied among the Banks, from the single-digits to the mid-teens.
90+ days past due reported delinquency figures also varied considerably among the Banks, with a range
from the single-digits to over 30%. Normalizing for various degrees of loss mitigation activity tightened the
overall dispersion of these 90+ figures (represented in the “Adjusted 90+ days past due” percentage).
Other relevant risk factors included the loan’s coupon, interest rate type, geographic location, and whether it
was an OEK loan.
SAMPLE-BASED UNDERWRITING / LOAN FILE REVIEW
Process and Sample Selection: Origination and Underwriting Loan File Review
BlackRock engaged Clayton to conduct a review of each Bank’s origination and underwriting practices.
Loan file reviews were conducted for two purposes: (i) to assess whether loans were originated in
accordance with underwriting criteria in effect at the time the loan was originated, or if subject to exceptions,
that such exceptions were deemed as having compensating factors; and (ii) to assess whether the loan,
beyond its adherence to criteria or exceptions, would be considered acceptable to a prudent lender. The
samples were selected both adversely and on a random basis by BlackRock to ensure that sufficient risk
was reviewed in the time allowed by the project timeline – more adversely selected loans allowed for easier
comparison of aggressive lending practices across Banks. This exercise allowed BlackRock to make qualitative modeling adjustments or better understand and explain quantitative modeling output. For example, strong deviations from documented underwriting criteria may imply weak controls and the potential for higher losses than would otherwise be expected. For each Group A Bank, a sample of 80 residential mortgage loans was selected for the Origination and Underwriting Loan File review.
17| Bank of Greece
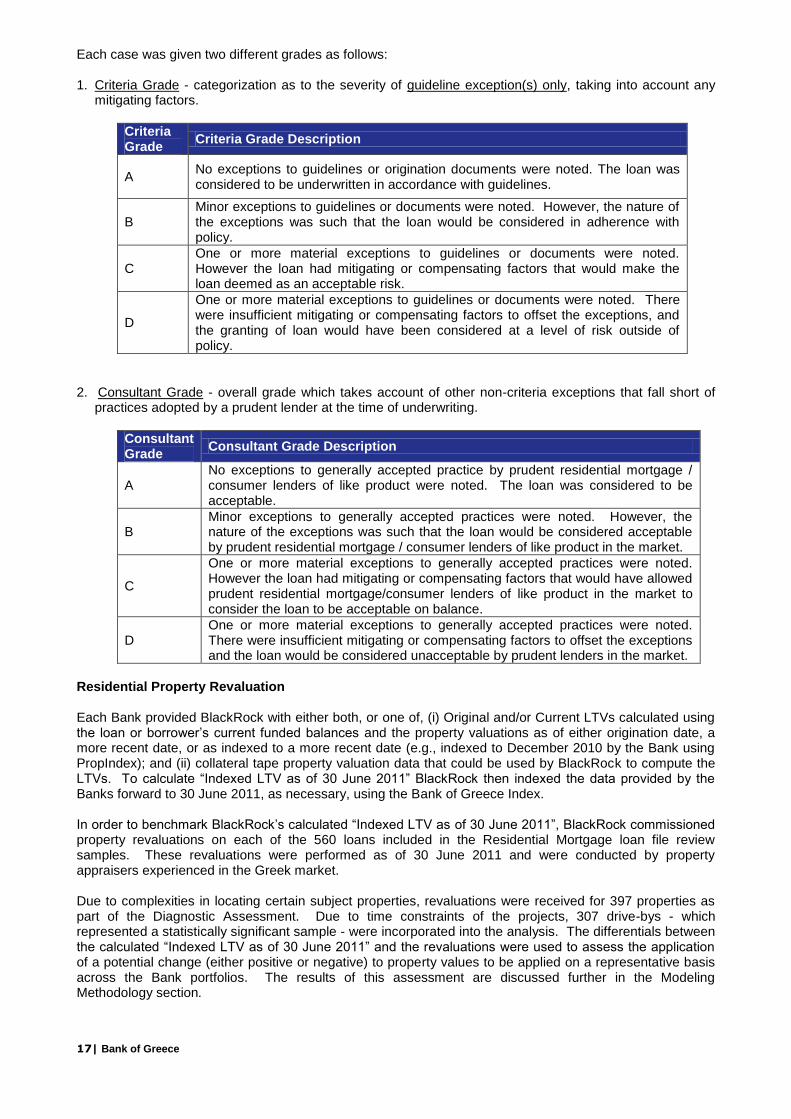
Each case was given two different grades as follows: 1. Criteria Grade - categorization as to the severity of guideline exception(s) only, taking into account any
mitigating factors.
Criteria Grade
Criteria Grade Description
A No exceptions to guidelines or origination documents were noted. The loan was considered to be underwritten in accordance with guidelines.
B Minor exceptions to guidelines or documents were noted. However, the nature of the exceptions was such that the loan would be considered in adherence with policy.
C One or more material exceptions to guidelines or documents were noted. However the loan had mitigating or compensating factors that would make the loan deemed as an acceptable risk.
D
One or more material exceptions to guidelines or documents were noted. There were insufficient mitigating or compensating factors to offset the exceptions, and the granting of loan would have been considered at a level of risk outside of policy.
2. Consultant Grade - overall grade which takes account of other non-criteria exceptions that fall short of
practices adopted by a prudent lender at the time of underwriting.
Consultant Grade
Consultant Grade Description
A No exceptions to generally accepted practice by prudent residential mortgage / consumer lenders of like product were noted. The loan was considered to be acceptable.
B Minor exceptions to generally accepted practices were noted. However, the nature of the exceptions was such that the loan would be considered acceptable by prudent residential mortgage / consumer lenders of like product in the market.
C
One or more material exceptions to generally accepted practices were noted. However the loan had mitigating or compensating factors that would have allowed prudent residential mortgage/consumer lenders of like product in the market to consider the loan to be acceptable on balance.
D One or more material exceptions to generally accepted practices were noted. There were insufficient mitigating or compensating factors to offset the exceptions and the loan would be considered unacceptable by prudent lenders in the market.
Residential Property Revaluation Each Bank provided BlackRock with either both, or one of, (i) Original and/or Current LTVs calculated using the loan or borrower’s current funded balances and the property valuations as of either origination date, a more recent date, or as indexed to a more recent date (e.g., indexed to December 2010 by the Bank using PropIndex); and (ii) collateral tape property valuation data that could be used by BlackRock to compute the LTVs. To calculate “Indexed LTV as of 30 June 2011” BlackRock then indexed the data provided by the Banks forward to 30 June 2011, as necessary, using the Bank of Greece Index. In order to benchmark BlackRock’s calculated “Indexed LTV as of 30 June 2011”, BlackRock commissioned property revaluations on each of the 560 loans included in the Residential Mortgage loan file review samples. These revaluations were performed as of 30 June 2011 and were conducted by property appraisers experienced in the Greek market. Due to complexities in locating certain subject properties, revaluations were received for 397 properties as part of the Diagnostic Assessment. Due to time constraints of the projects, 307 drive-bys - which represented a statistically significant sample - were incorporated into the analysis. The differentials between the calculated “Indexed LTV as of 30 June 2011” and the revaluations were used to assess the application of a potential change (either positive or negative) to property values to be applied on a representative basis across the Bank portfolios. The results of this assessment are discussed further in the Modeling Methodology section.
18| Bank of Greece
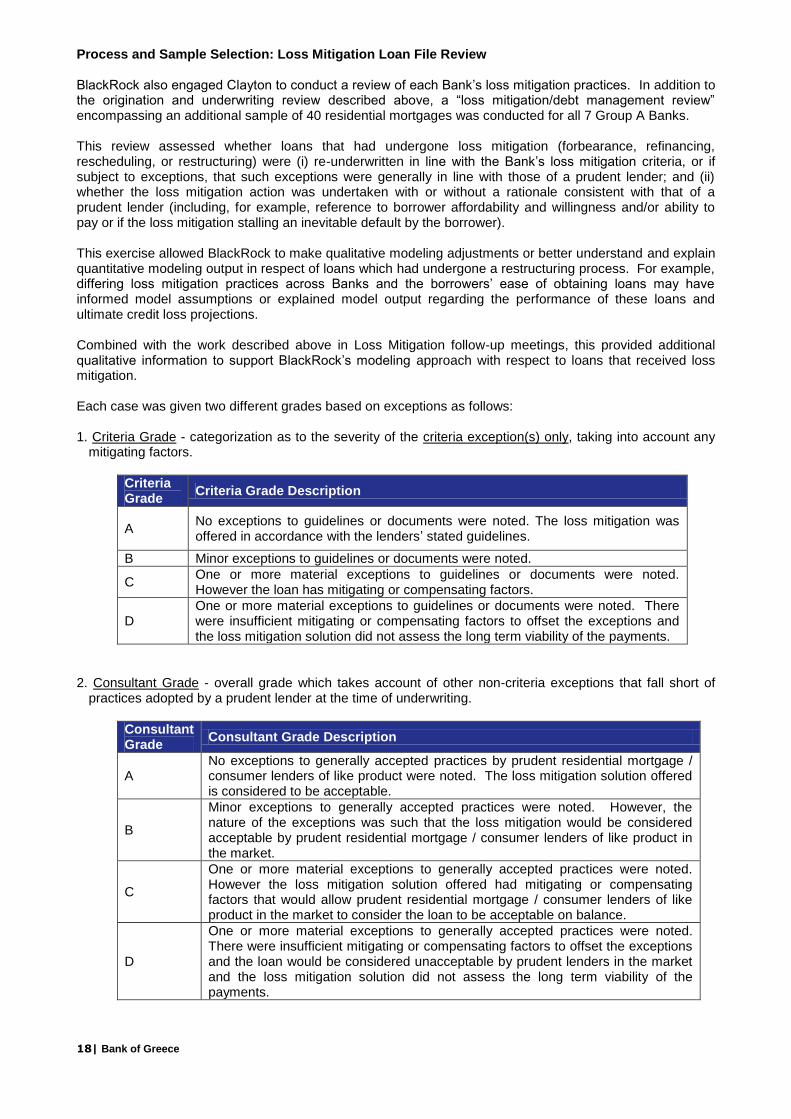
Process and Sample Selection: Loss Mitigation Loan File Review BlackRock also engaged Clayton to conduct a review of each Bank’s loss mitigation practices. In addition to the origination and underwriting review described above, a “loss mitigation/debt management review” encompassing an additional sample of 40 residential mortgages was conducted for all 7 Group A Banks. This review assessed whether loans that had undergone loss mitigation (forbearance, refinancing, rescheduling, or restructuring) were (i) re-underwritten in line with the Bank’s loss mitigation criteria, or if subject to exceptions, that such exceptions were generally in line with those of a prudent lender; and (ii) whether the loss mitigation action was undertaken with or without a rationale consistent with that of a prudent lender (including, for example, reference to borrower affordability and willingness and/or ability to pay or if the loss mitigation stalling an inevitable default by the borrower). This exercise allowed BlackRock to make qualitative modeling adjustments or better understand and explain quantitative modeling output in respect of loans which had undergone a restructuring process. For example, differing loss mitigation practices across Banks and the borrowers’ ease of obtaining loans may have informed model assumptions or explained model output regarding the performance of these loans and ultimate credit loss projections. Combined with the work described above in Loss Mitigation follow-up meetings, this provided additional qualitative information to support BlackRock’s modeling approach with respect to loans that received loss mitigation. Each case was given two different grades based on exceptions as follows: 1. Criteria Grade - categorization as to the severity of the criteria exception(s) only, taking into account any
mitigating factors.
Criteria Grade
Criteria Grade Description
A No exceptions to guidelines or documents were noted. The loss mitigation was offered in accordance with the lenders’ stated guidelines.
B Minor exceptions to guidelines or documents were noted.
C One or more material exceptions to guidelines or documents were noted. However the loan has mitigating or compensating factors.
D One or more material exceptions to guidelines or documents were noted. There were insufficient mitigating or compensating factors to offset the exceptions and the loss mitigation solution did not assess the long term viability of the payments.
2. Consultant Grade - overall grade which takes account of other non-criteria exceptions that fall short of
practices adopted by a prudent lender at the time of underwriting.
Consultant Grade
Consultant Grade Description
A No exceptions to generally accepted practices by prudent residential mortgage / consumer lenders of like product were noted. The loss mitigation solution offered is considered to be acceptable.
B
Minor exceptions to generally accepted practices were noted. However, the nature of the exceptions was such that the loss mitigation would be considered acceptable by prudent residential mortgage / consumer lenders of like product in the market.
C
One or more material exceptions to generally accepted practices were noted. However the loss mitigation solution offered had mitigating or compensating factors that would allow prudent residential mortgage / consumer lenders of like product in the market to consider the loan to be acceptable on balance.
D
One or more material exceptions to generally accepted practices were noted. There were insufficient mitigating or compensating factors to offset the exceptions and the loan would be considered unacceptable by prudent lenders in the market and the loss mitigation solution did not assess the long term viability of the payments.

19| Bank of Greece
Summary Findings: Origination and Underwriting Loan File Review
When assigned a grade on their overall adherence to stated guidelines, 72% of the sample loans in the 7
Group A Banks received a Criteria grading of either A or B, indicating that the Banks tended to have
procedures whereby the policy criteria was adhered to. This, however, was offset by the fact that 18% of the
sample loans had exceptions far outside of the policies such that they would be deemed unacceptable. In
addition, when looked at from a risk perspective of a prudent lender, it was noted that less than 45% of the
sample loans received a Consultant grade of either A or B for being underwritten in accordance with prudent
lending standards. The propensity of risk was further illustrated by an equal amount of the sample loans
(45%) receiving a Consultant grade of D for having been originated outside of those risks that a prudent
lender might take.
Summary Findings: Loss Mitigation Loan File Review
When assigned a Criteria grade on their overall adherence to loss mitigation guidelines, 88% of the sample
loans in the 7 Group A Banks received a grading of either A or B, indicating that the Banks did tend to
adhere to stated loss mitigation procedures. However, this was offset by the fact that over 90% of the
sample loans that had received loss mitigation workouts were deemed outside of the prudent lending
standards such that they would be deemed unacceptable. A general theme in the loss mitigation review was
that the majority of the cases across all 7 Group A Banks at times allowed for loss mitigation solutions
without consideration for borrower affordability or long term viability of the loan. The use of loss mitigation
solutions across the 7 Group A Banks was viewed as a delay to inevitable non-performing status and
denouncement of the loan.
Group B Banks
Due to the compressed timeline afforded to perform the Diagnostic Assessment, BlackRock employed a modified approach to evaluating the Group B Bank portfolios. Additional due diligence meetings and loan file sample reviews were not performed for these Banks. The Group B Bank AQR process focused on an introductory due diligence meeting and a modified data management and stratification process.
Group B Due Diligence
An initial Deep Dive meeting was held with business unit managers covering origination channels, product
design, underwriting, and servicing practices for each Group B Bank during September. The goal of this
meeting was to acquaint BlackRock with each Bank’s portfolios and practices. Topics broadly addressed
during the meetings included:
Background and Lender Profile
Origination Strategy and Product Composition
Collateral Valuation
Underwriting Guidelines and Criteria
Compliance, Quality Control, and Risk Management
Systems and Technology
Servicing/Collections and Arrears Management
Loss Mitigation Strategies, Practices, and Procedures
Loan Denouncement and the Auction Process
Group B Portfolio Data Collection
Data was supplied by each of the Banks in a format stipulated by BlackRock as of the 30 June 2011 reference date. This request took one of two forms, depending on the size of the Bank’s combined residential mortgage and consumer loan portfolios. Of the 11 Group B Banks, 5 were requested to provide loan-level data in the same format as the Group A Banks, as these Banks had aggregate consumer products portfolio exposure in excess of €500 MM. Each of these Banks was also asked to submit basic balance reconciliation data to aid BlackRock in confirming the general accuracy of data file balances. These 5 Banks were: Millennium, Credicom, Geniki, Attica, and T Bank. Five Banks were requested to provide a single aggregate portfolio representation per asset class, or “Rep Line”, for each relevant portfolio of residential mortgages, credit cards, auto loans, and other consumer

20| Bank of Greece
loans. The data included weighted average and other portfolio characteristics selected by BlackRock to be used as CLP model inputs. These 5 Banks were: FBB, Panellenia, Probank, Proton, and Investment Bank of Greece. AB Bank was not requested to provide any data as this Bank had no consumer products exposure. Meetings and conference calls were held, and emails exchanged, with all 10 relevant Group B Banks, as necessary, to address questions or issues concerning the specific data requests between October and December.
Group B Portfolio Stratification and Risk Analysis
Summary stratification tables in a standard output format were produced by BlackRock for each of the 5 Group B Banks providing loan-level data. These reports were reviewed and used by BlackRock to identify portfolio characteristics and risk drivers. Because of time constraints, these reports were not separately shared with the Group B Banks. Separate stratification and data gap reports were not produced for the 5 Banks providing only single aggregate portfolio representations per asset class. Where necessary, communications were made or calls held with each Bank to seek clarification regarding specific inconsistencies or other issues identified by BlackRock. These concerns were addressed by the Banks to the extent practical given the compressed time frame during which this analysis was conducted.
Group B Data Assumptions
The Banks’ data submission varied in completeness and quality of the requested data. In order to cope with missing or potentially erroneous data, BlackRock made assumptions in instances where data was missing on a case-by-case basis. Assumptions made for Group B Banks are similar to those made for Group A Banks, and were often based on Bank portfolio weighted averages, or in some cases, were based on universe weighted averages for all Banks.
21| Bank of Greece
Residential Mortgage Loans - Methodology
Group A Banks Methodology Overview BlackRock’s Residential Mortgage methodology employed a suite of econometric behavioral models calibrated to Greek economic factors and Greek loan portfolio data. The objective of the modeling framework was to project cash flows and principal losses based on expectations for borrower prepayment, delinquency, default, and ultimate loss severity. BlackRock was provided with loan-level data files for Residential Mortgage Loans by all Group A Banks as of the 30 June 2011 reference date (“Cross-Sectional Data”). As shown in Figure 10 on the following page, BlackRock’s Residential Mortgage Model was based on statistical relationships inferred from Cross-Sectional Data, historical loan data (as provided by three of the Group A Banks), and non-performing loan (“NPL”) information provided by the Central Bank. For the purposes of developing a behavioral prepayment model, publicly-available information from securitizations was used. The Cross-Sectional Data was analyzed and used to populate a database of collateral attributes, which formed the basis of a cross-sectional regression-based statistical analysis that derived model coefficients for those borrower-specific and loan-specific attributes with the greatest predictive power.
8
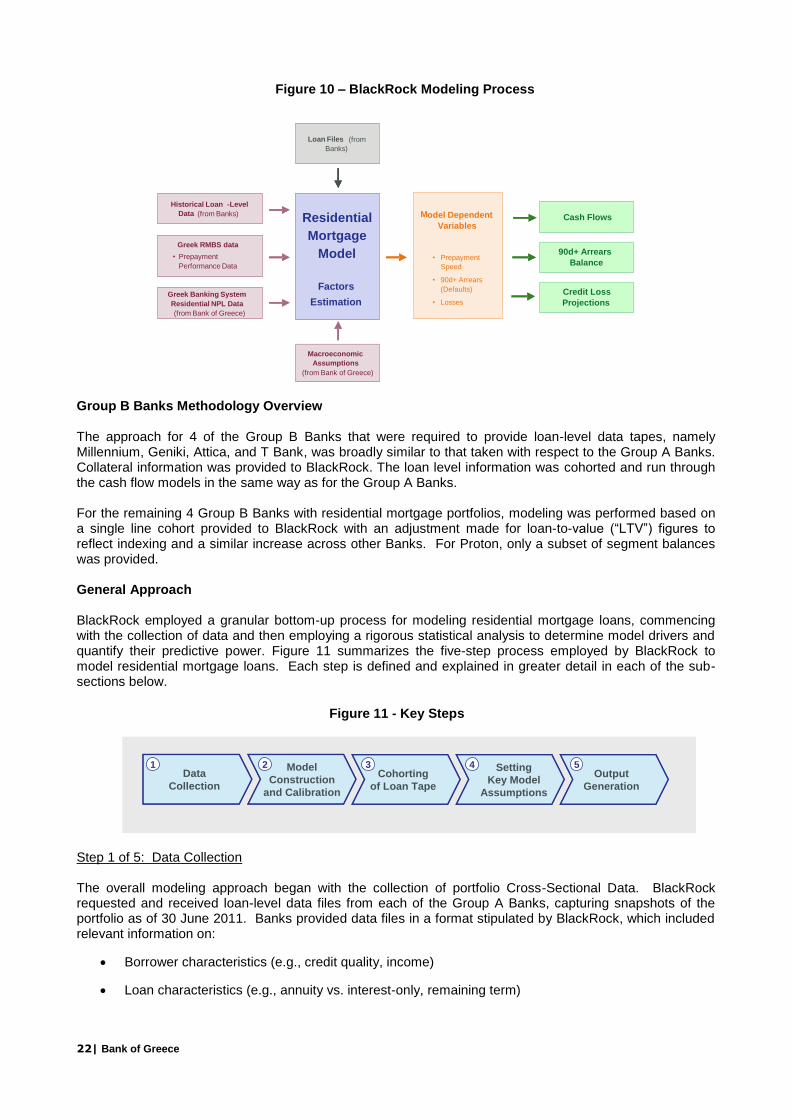
Given low Variance Inflation Factors (VIF statistics used to test for multicollinearity) across the Residential model coefficients, the historical loan data provided by 3 of the Banks were ultimately not used to derive model coefficients. In conjunction with the NPL information supplied by Bank of Greece, these datasets were used to determine the impact of macroeconomic factors – mainly rates of GDP growth and unemployment - on loan performance. All factors included in the models exhibited economic and statistical significance, and these significant factors differed by asset type and also by economic circumstances. Each Bank’s data extract (i.e., the data file containing the list of loans to be analyzed) was prepared for analysis via a cohorting process. Cohorting allows the models to operate more efficiently by reducing the number of discrete line items that need to be processed, while maintaining the integrity and granularity of model outputs. These cohorts were subsequently run through a cash flow model coded with the outputs from the regression analysis and the forward-looking macroeconomic assumptions provided by Bank of Greece in order to project cash flows and losses. The following diagram depicts a high-level schematic of BlackRock’s Residential Mortgage modeling process. The following pages delve into greater detail on each step of this modeling process.
8 The model factors derived through statistical techniques do not denote causality. Rather, the factors relay information relating to the
propensity of a borrower to behave in a certain way. In other words, it is not because a borrower has a high LTV loan that she will default – the cause may be something else such as unemployment or divorce. Rather, the fact that the borrower has a high LTV loan increases her chances of defaulting relative to another borrower who has a lower LTV loan (and therefore has other options).
22| Bank of Greece
Group B Banks Methodology Overview
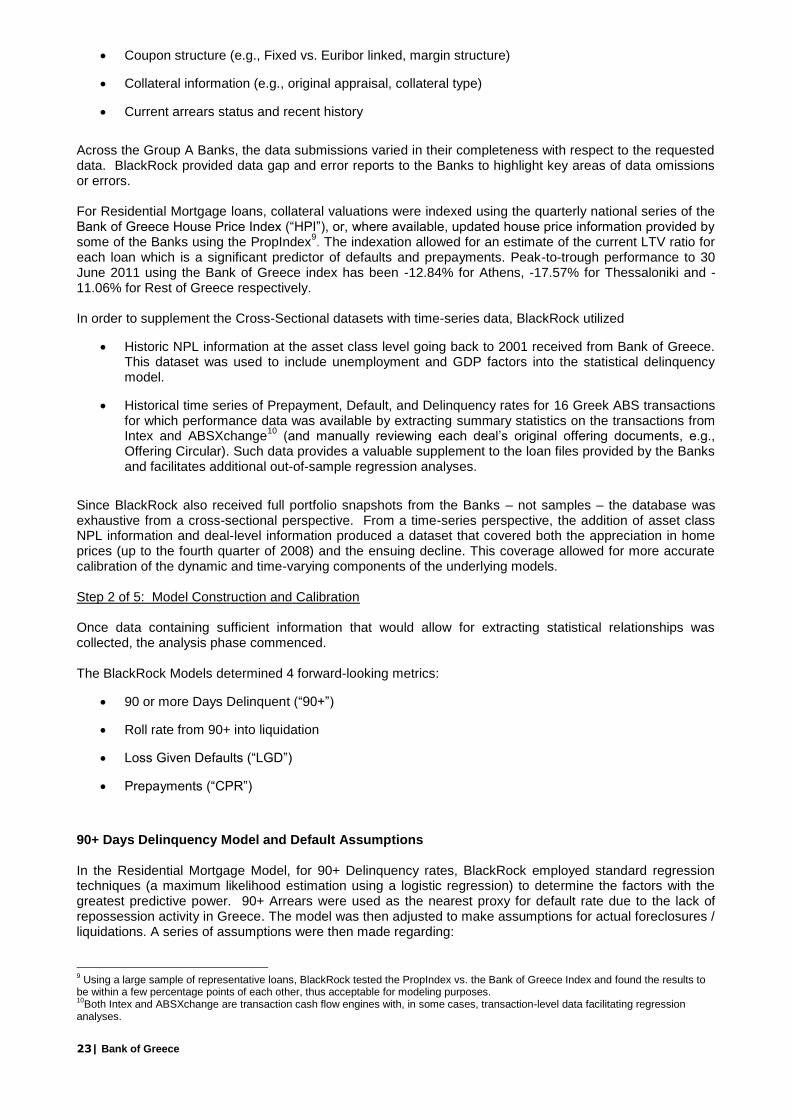
The approach for 4 of the Group B Banks that were required to provide loan-level data tapes, namely Millennium, Geniki, Attica, and T Bank, was broadly similar to that taken with respect to the Group A Banks. Collateral information was provided to BlackRock. The loan level information was cohorted and run through the cash flow models in the same way as for the Group A Banks. For the remaining 4 Group B Banks with residential mortgage portfolios, modeling was performed based on a single line cohort provided to BlackRock with an adjustment made for loan-to-value (“LTV”) figures to reflect indexing and a similar increase across other Banks. For Proton, only a subset of segment balances was provided. General Approach BlackRock employed a granular bottom-up process for modeling residential mortgage loans, commencing with the collection of data and then employing a rigorous statistical analysis to determine model drivers and quantify their predictive power. Figure 11 summarizes the five-step process employed by BlackRock to model residential mortgage loans. Each step is defined and explained in greater detail in each of the sub-sections below.
Step 1 of 5: Data Collection The overall modeling approach began with the collection of portfolio Cross-Sectional Data. BlackRock requested and received loan-level data files from each of the Group A Banks, capturing snapshots of the portfolio as of 30 June 2011. Banks provided data files in a format stipulated by BlackRock, which included relevant information on:
Borrower characteristics (e.g., credit quality, income)
Loan characteristics (e.g., annuity vs. interest-only, remaining term)
Historical Loan -Level
Data (from Banks)
Greek Banking System
Residential NPL Data
(from Solar)
Loan Files (from
Banks)
Macroeconomic
Assumptions
(from Solar)
Model Dependent
Variables
• Prepayment
Speed
• 90d+ Arrears
(Defaults)
• Losses
Greek RMBS data
Residential
Mortgage
Model
Factors
Estimation
• Prepayment
Performance Data
Cash Flows
90d+ Arrears
Balance
Credit Loss
Projections
Historical Loan -Level
Data (from Banks)
Greek Banking System
Residential NPL Data
(from Bank of Greece)
Loan Files (from
Banks)
Macroeconomic
Assumptions
(from Bank of Greece)
Model Dependent
Variables
• Prepayment
Speed
• 90d+ Arrears
(Defaults)
• Losses
Greek RMBS data
Residential
Mortgage
Model
Factors
Estimation
• Prepayment
Performance Data
Cash Flows
90d+ Arrears
Balance
Credit Loss
Projections
Figure 10 – BlackRock Modeling Process
Data
Collection
1 Model
Construction
and Calibration
2Cohorting
of Loan Tape
3 Setting
Key Model
Assumptions
4Output
Generation
5
Figure 2 – Key Steps
Data
Collection
1Data
Collection
1 Model
Construction
and Calibration
2 Model
Construction
and Calibration
2Cohorting
of Loan Tape
3Cohorting
of Loan Tape
3 Setting
Key Model
Assumptions
4 Setting
Key Model
Assumptions
4Output
Generation
5Output
Generation
5
Figure 2 – Key Steps Figure 11 - Key Steps
23| Bank of Greece
Coupon structure (e.g., Fixed vs. Euribor linked, margin structure)
Collateral information (e.g., original appraisal, collateral type)
Current arrears status and recent history
Across the Group A Banks, the data submissions varied in their completeness with respect to the requested data. BlackRock provided data gap and error reports to the Banks to highlight key areas of data omissions or errors. For Residential Mortgage loans, collateral valuations were indexed using the quarterly national series of the Bank of Greece House Price Index (“HPI”), or, where available, updated house price information provided by some of the Banks using the PropIndex
9. The indexation allowed for an estimate of the current LTV ratio for
each loan which is a significant predictor of defaults and prepayments. Peak-to-trough performance to 30 June 2011 using the Bank of Greece index has been -12.84% for Athens, -17.57% for Thessaloniki and -11.06% for Rest of Greece respectively. In order to supplement the Cross-Sectional datasets with time-series data, BlackRock utilized
Historic NPL information at the asset class level going back to 2001 received from Bank of Greece. This dataset was used to include unemployment and GDP factors into the statistical delinquency model.
Historical time series of Prepayment, Default, and Delinquency rates for 16 Greek ABS transactions for which performance data was available by extracting summary statistics on the transactions from Intex and ABSXchange
10 (and manually reviewing each deal’s original offering documents, e.g.,
Offering Circular). Such data provides a valuable supplement to the loan files provided by the Banks and facilitates additional out-of-sample regression analyses.
Since BlackRock also received full portfolio snapshots from the Banks – not samples – the database was exhaustive from a cross-sectional perspective. From a time-series perspective, the addition of asset class NPL information and deal-level information produced a dataset that covered both the appreciation in home prices (up to the fourth quarter of 2008) and the ensuing decline. This coverage allowed for more accurate calibration of the dynamic and time-varying components of the underlying models. Step 2 of 5: Model Construction and Calibration Once data containing sufficient information that would allow for extracting statistical relationships was collected, the analysis phase commenced. The BlackRock Models determined 4 forward-looking metrics:
90 or more Days Delinquent (“90+”)
Roll rate from 90+ into liquidation
Loss Given Defaults (“LGD”)
Prepayments (“CPR”)
90+ Days Delinquency Model and Default Assumptions In the Residential Mortgage Model, for 90+ Delinquency rates, BlackRock employed standard regression techniques (a maximum likelihood estimation using a logistic regression) to determine the factors with the greatest predictive power. 90+ Arrears were used as the nearest proxy for default rate due to the lack of repossession activity in Greece. The model was then adjusted to make assumptions for actual foreclosures / liquidations. A series of assumptions were then made regarding:
9 Using a large sample of representative loans, BlackRock tested the PropIndex vs. the Bank of Greece Index and found the results to
be within a few percentage points of each other, thus acceptable for modeling purposes. 10
Both Intex and ABSXchange are transaction cash flow engines with, in some cases, transaction-level data facilitating regression analyses.
24| Bank of Greece
The lifting of the auction moratorium starting in January 2012, an assumption made in agreement with the Central Bank (and in the absence of information to the contrary at the time of the analysis)
The rolling of 90+ Arrears into actual defaults (repossessions)
The future timing and frequency of liquidations
These assumptions are detailed further in Step 4. The regression based model construction included several stages: 1. An in-depth cross-sectional analysis of the Residential Mortgage universe (330,000 loans analyzed) as
of 30 June 2011, to construct a 90+ delinquency model for using NBG data as representative of the entire universe. The set of portfolio specific factors determined to be statistically significant is detailed later in this section.
11
2. An analysis of the aggregate NPL data provided by Bank of Greece, to derive the coefficients for macro
factors such as rates of unemployment and GDP growth. 3. A simple re-estimation of the model using the full universe of loans from all Group A Banks thus
confirming regression variable independence and Bank-specific factors. Specifically, because measures of probability are always between 0 and 100%, model outputs were fitted using a logistic regression which assumed that relevant data were used to fit to a logistic function or curve as per the following formula:
f(z) = 1 / (1 + exp(-z))
z = β0 + β1x1 + βx2 + β3x3 + … + βnxn
where β1… βn are the regression coefficients of the independent factor variables x1… xn
This statistical modeling technique – essential to developing predictive models of the type used by BlackRock for this project - is a standard technique in BlackRock’s suite of US, UK and Irish mortgage models. Although the above relationship appears very different from a linear regression, the interpretation is similar. In addition to always being between 0 and 100%, the other difference between the above and a linear relationship, is that the factors have multiplicative (instead of additive) effects on the dependent variable. In addition to finding sensitivities, the process that estimated the relationship above also produced standard error and covariance estimates, which allowed BlackRock to perform tests of parameter significance and model stability. The following table lists the factors that were found to be both statistically and economically significant for predicting borrower behavior for Residential Mortgage Loans. If the factor was relevant for the given model, the sign of influence (correlation) is provided. Detailed descriptions of the factors are provided in the Residential Loan Supplemental Information section.
11
Note the large number of loans in and of itself provides a strong foundation for predictive models that are relatively robust – introducing historical data marginally strengthens model predictive power. Note also the variables in each predictive model are said to follow a ‘power law’ with some variables exhibiting disproportionate predictive power relative to others.
25| Bank of Greece
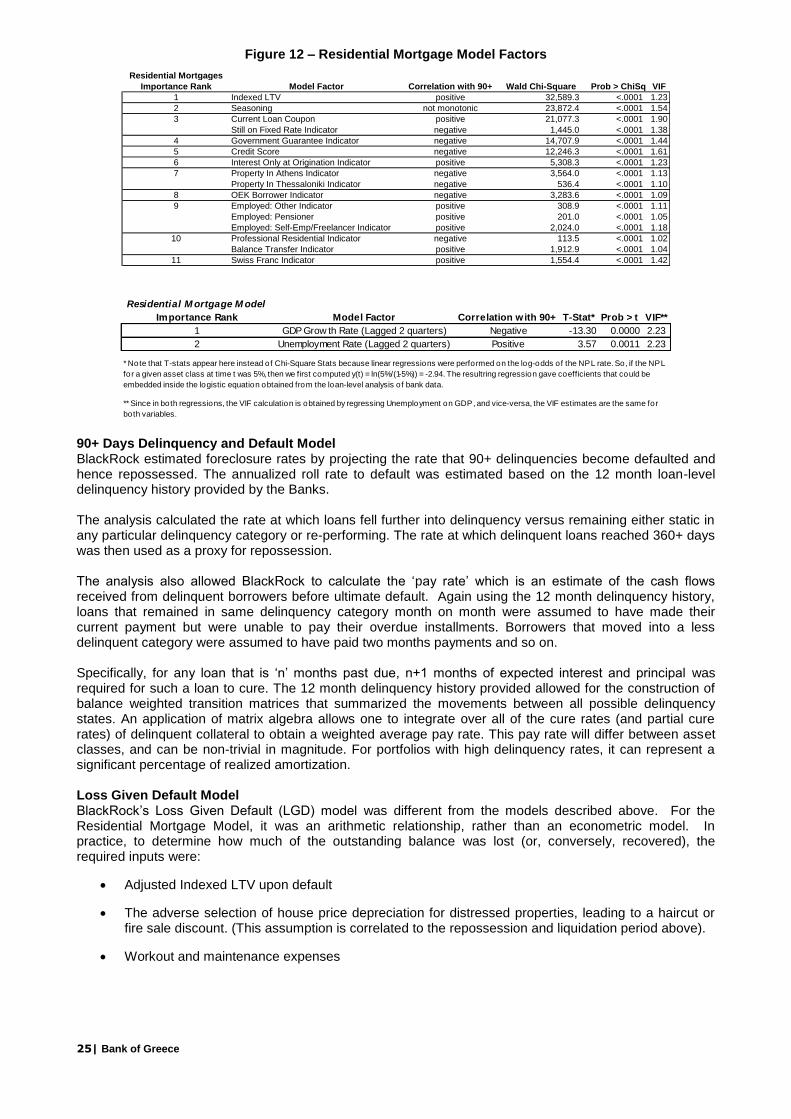
Figure 12 – Residential Mortgage Model Factors
90+ Days Delinquency and Default Model BlackRock estimated foreclosure rates by projecting the rate that 90+ delinquencies become defaulted and hence repossessed. The annualized roll rate to default was estimated based on the 12 month loan-level delinquency history provided by the Banks. The analysis calculated the rate at which loans fell further into delinquency versus remaining either static in any particular delinquency category or re-performing. The rate at which delinquent loans reached 360+ days was then used as a proxy for repossession. The analysis also allowed BlackRock to calculate the ‘pay rate’ which is an estimate of the cash flows received from delinquent borrowers before ultimate default. Again using the 12 month delinquency history, loans that remained in same delinquency category month on month were assumed to have made their current payment but were unable to pay their overdue installments. Borrowers that moved into a less delinquent category were assumed to have paid two months payments and so on. Specifically, for any loan that is ‘n’ months past due, n+1 months of expected interest and principal was required for such a loan to cure. The 12 month delinquency history provided allowed for the construction of balance weighted transition matrices that summarized the movements between all possible delinquency states. An application of matrix algebra allows one to integrate over all of the cure rates (and partial cure rates) of delinquent collateral to obtain a weighted average pay rate. This pay rate will differ between asset classes, and can be non-trivial in magnitude. For portfolios with high delinquency rates, it can represent a significant percentage of realized amortization. Loss Given Default Model BlackRock’s Loss Given Default (LGD) model was different from the models described above. For the Residential Mortgage Model, it was an arithmetic relationship, rather than an econometric model. In practice, to determine how much of the outstanding balance was lost (or, conversely, recovered), the required inputs were:
Adjusted Indexed LTV upon default
The adverse selection of house price depreciation for distressed properties, leading to a haircut or fire sale discount. (This assumption is correlated to the repossession and liquidation period above).
Workout and maintenance expenses
Residential Mortgages
Importance Rank Model Factor Correlation with 90+ Wald Chi-Square Prob > ChiSq VIF
1 Indexed LTV positive 32,589.3 <.0001 1.23
2 Seasoning not monotonic 23,872.4 <.0001 1.54
3 Current Loan Coupon positive 21,077.3 <.0001 1.90
Still on Fixed Rate Indicator negative 1,445.0 <.0001 1.38
4 Government Guarantee Indicator negative 14,707.9 <.0001 1.44
5 Credit Score negative 12,246.3 <.0001 1.61
6 Interest Only at Origination Indicator positive 5,308.3 <.0001 1.23
7 Property In Athens Indicator negative 3,564.0 <.0001 1.13
Property In Thessaloniki Indicator negative 536.4 <.0001 1.10
8 OEK Borrower Indicator negative 3,283.6 <.0001 1.09
9 Employed: Other Indicator positive 308.9 <.0001 1.11
Employed: Pensioner positive 201.0 <.0001 1.05
Employed: Self-Emp/Freelancer Indicator positive 2,024.0 <.0001 1.18
10 Professional Residential Indicator negative 113.5 <.0001 1.02
Balance Transfer Indicator positive 1,912.9 <.0001 1.04
11 Swiss Franc Indicator positive 1,554.4 <.0001 1.42
Residential M ortgage M odel
Importance Rank Model Factor Correlation with 90+ T-Stat* Prob > t VIF**
1 GDP Grow th Rate (Lagged 2 quarters) Negative -13.30 0.0000 2.23
2 Unemployment Rate (Lagged 2 quarters) Positive 3.57 0.0011 2.23
* Note that T-stats appear here instead of Chi-Square Stats because linear regressions were performed on the log-odds of the NPL rate. So, if the NPL
for a given asset class at time t was 5%, then we first computed y(t) = ln(5%/(1-5%)) = -2.94. The resultring regression gave coefficients that could be
embedded inside the logistic equation obtained from the loan-level analysis of bank data.
** Since in both regressions, the VIF calculation is obtained by regressing Unemployment on GDP, and vice-versa, the VIF estimates are the same for
both variables.
26| Bank of Greece
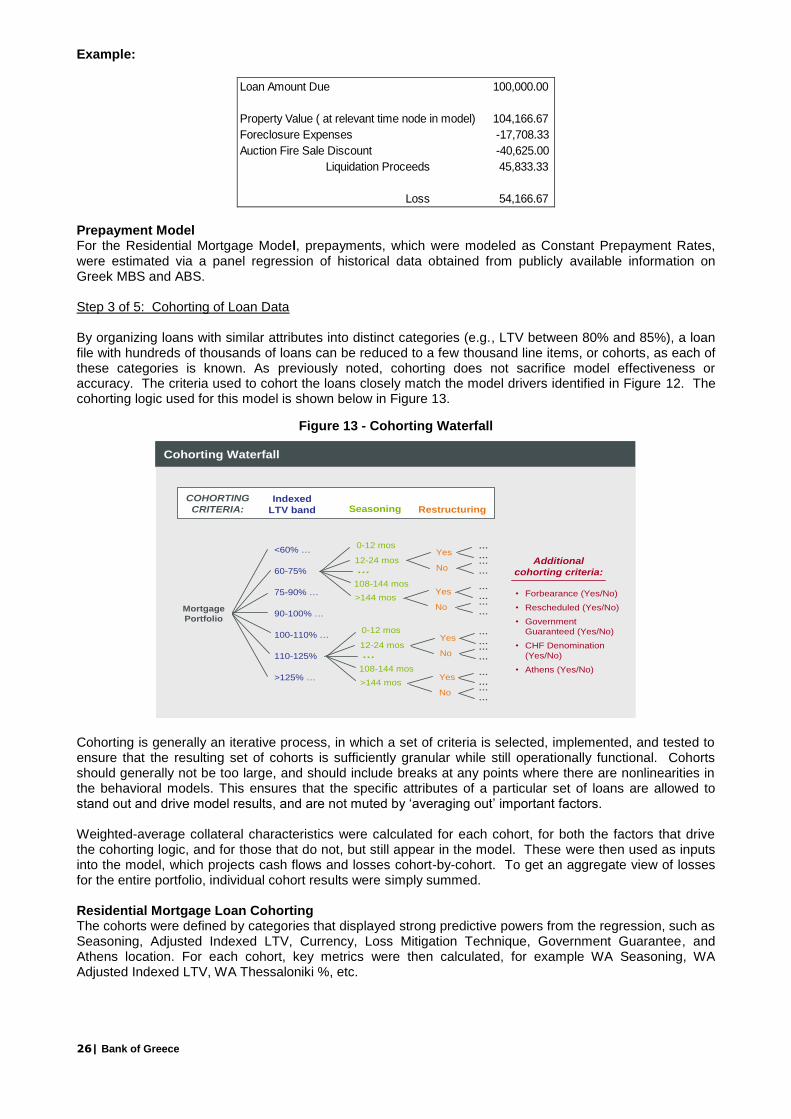
Example:
Loan Amount Due 100,000.00
Property Value ( at relevant time node in model) 104,166.67
Foreclosure Expenses -17,708.33
Auction Fire Sale Discount -40,625.00
Liquidation Proceeds 45,833.33
Loss 54,166.67 Prepayment Model For the Residential Mortgage Model, prepayments, which were modeled as Constant Prepayment Rates, were estimated via a panel regression of historical data obtained from publicly available information on Greek MBS and ABS. Step 3 of 5: Cohorting of Loan Data By organizing loans with similar attributes into distinct categories (e.g., LTV between 80% and 85%), a loan file with hundreds of thousands of loans can be reduced to a few thousand line items, or cohorts, as each of these categories is known. As previously noted, cohorting does not sacrifice model effectiveness or accuracy. The criteria used to cohort the loans closely match the model drivers identified in Figure 12. The cohorting logic used for this model is shown below in Figure 13.
Figure 13 - Cohorting Waterfall
Cohorting is generally an iterative process, in which a set of criteria is selected, implemented, and tested to ensure that the resulting set of cohorts is sufficiently granular while still operationally functional. Cohorts should generally not be too large, and should include breaks at any points where there are nonlinearities in the behavioral models. This ensures that the specific attributes of a particular set of loans are allowed to stand out and drive model results, and are not muted by ‘averaging out’ important factors. Weighted-average collateral characteristics were calculated for each cohort, for both the factors that drive the cohorting logic, and for those that do not, but still appear in the model. These were then used as inputs into the model, which projects cash flows and losses cohort-by-cohort. To get an aggregate view of losses for the entire portfolio, individual cohort results were simply summed. Residential Mortgage Loan Cohorting The cohorts were defined by categories that displayed strong predictive powers from the regression, such as Seasoning, Adjusted Indexed LTV, Currency, Loss Mitigation Technique, Government Guarantee, and Athens location. For each cohort, key metrics were then calculated, for example WA Seasoning, WA Adjusted Indexed LTV, WA Thessaloniki %, etc.
Mortgage
Portfolio
60-75%
110-125%
Cohorting Waterfall
Yes
Indexed
LTV band RestructuringSeasoningCOHORTING
CRITERIA:
<60% …
90-100% …
100-110% …
75-90% …
>125% …
0-12 mos
12-24 mos
…
108-144 mos
>144 mos
0-12 mos
12-24 mos
…
108-144 mos
>144 mos
No
Yes
No
Yes
No
Yes
No
………
…
…
………
…
………
………
…
Additional
cohorting criteria:
• Forbearance (Yes/No)
• Rescheduled (Yes/No)
• Government
Guaranteed (Yes/No)
• CHF Denomination
(Yes/No)
• Athens (Yes/No)
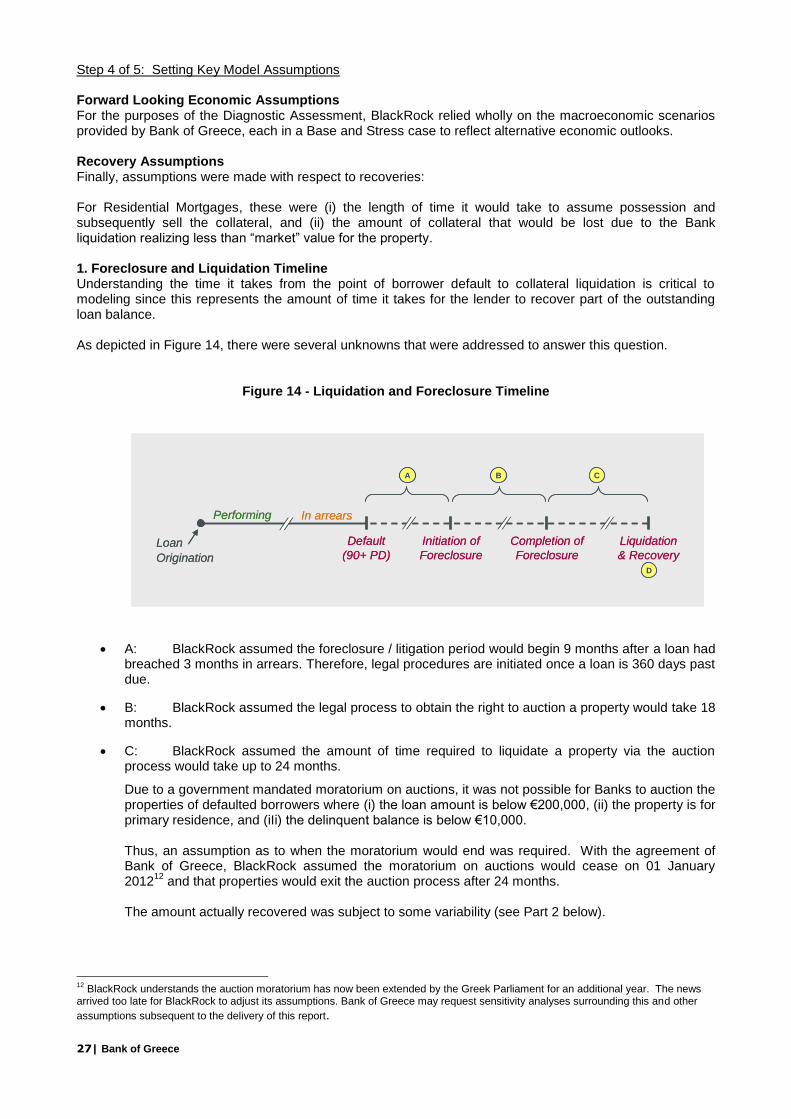
27| Bank of Greece
Step 4 of 5: Setting Key Model Assumptions Forward Looking Economic Assumptions For the purposes of the Diagnostic Assessment, BlackRock relied wholly on the macroeconomic scenarios provided by Bank of Greece, each in a Base and Stress case to reflect alternative economic outlooks. Recovery Assumptions Finally, assumptions were made with respect to recoveries: For Residential Mortgages, these were (i) the length of time it would take to assume possession and subsequently sell the collateral, and (ii) the amount of collateral that would be lost due to the Bank liquidation realizing less than “market” value for the property. 1. Foreclosure and Liquidation Timeline Understanding the time it takes from the point of borrower default to collateral liquidation is critical to modeling since this represents the amount of time it takes for the lender to recover part of the outstanding loan balance. As depicted in Figure 14, there were several unknowns that were addressed to answer this question.
Figure 14 - Liquidation and Foreclosure Timeline
A: BlackRock assumed the foreclosure / litigation period would begin 9 months after a loan had breached 3 months in arrears. Therefore, legal procedures are initiated once a loan is 360 days past due.
B: BlackRock assumed the legal process to obtain the right to auction a property would take 18 months.
C: BlackRock assumed the amount of time required to liquidate a property via the auction process would take up to 24 months.
Due to a government mandated moratorium on auctions, it was not possible for Banks to auction the properties of defaulted borrowers where (i) the loan amount is below €200,000, (ii) the property is for primary residence, and (iIi) the delinquent balance is below €10,000. Thus, an assumption as to when the moratorium would end was required. With the agreement of Bank of Greece, BlackRock assumed the moratorium on auctions would cease on 01 January 2012
12 and that properties would exit the auction process after 24 months.
The amount actually recovered was subject to some variability (see Part 2 below).
12
BlackRock understands the auction moratorium has now been extended by the Greek Parliament for an additional year. The news arrived too late for BlackRock to adjust its assumptions. Bank of Greece may request sensitivity analyses surrounding this and other
assumptions subsequent to the delivery of this report.
Figure X – Key Assumptions
Performing
Loan
Origination
In arrears
Default
(90+ PD)
Initiation of
Foreclosure
Completion of
Foreclosure
Liquidation
& Recovery
A B C
D
Figure X – Key Assumptions
Performing
Loan
Origination
In arrears
Default
(90+ PD)
Initiation of
Foreclosure
Completion of
Foreclosure
Liquidation
& Recovery
A B C
D
Performing
Loan
Origination
In arrears
Default
(90+ PD)
Initiation of
Foreclosure
Completion of
Foreclosure
Liquidation
& Recovery
A B C
D
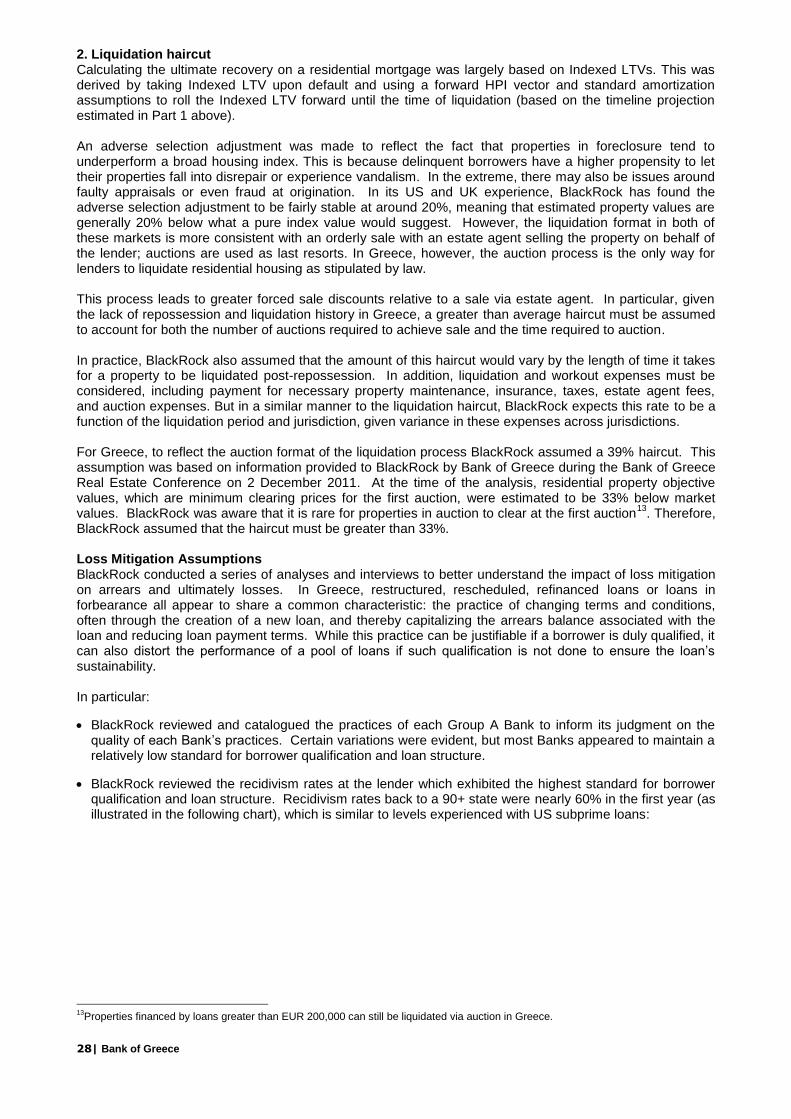
28| Bank of Greece
2. Liquidation haircut Calculating the ultimate recovery on a residential mortgage was largely based on Indexed LTVs. This was derived by taking Indexed LTV upon default and using a forward HPI vector and standard amortization assumptions to roll the Indexed LTV forward until the time of liquidation (based on the timeline projection estimated in Part 1 above). An adverse selection adjustment was made to reflect the fact that properties in foreclosure tend to underperform a broad housing index. This is because delinquent borrowers have a higher propensity to let their properties fall into disrepair or experience vandalism. In the extreme, there may also be issues around faulty appraisals or even fraud at origination. In its US and UK experience, BlackRock has found the adverse selection adjustment to be fairly stable at around 20%, meaning that estimated property values are generally 20% below what a pure index value would suggest. However, the liquidation format in both of these markets is more consistent with an orderly sale with an estate agent selling the property on behalf of the lender; auctions are used as last resorts. In Greece, however, the auction process is the only way for lenders to liquidate residential housing as stipulated by law. This process leads to greater forced sale discounts relative to a sale via estate agent. In particular, given the lack of repossession and liquidation history in Greece, a greater than average haircut must be assumed to account for both the number of auctions required to achieve sale and the time required to auction. In practice, BlackRock also assumed that the amount of this haircut would vary by the length of time it takes for a property to be liquidated post-repossession. In addition, liquidation and workout expenses must be considered, including payment for necessary property maintenance, insurance, taxes, estate agent fees, and auction expenses. But in a similar manner to the liquidation haircut, BlackRock expects this rate to be a function of the liquidation period and jurisdiction, given variance in these expenses across jurisdictions. For Greece, to reflect the auction format of the liquidation process BlackRock assumed a 39% haircut. This assumption was based on information provided to BlackRock by Bank of Greece during the Bank of Greece Real Estate Conference on 2 December 2011. At the time of the analysis, residential property objective values, which are minimum clearing prices for the first auction, were estimated to be 33% below market values. BlackRock was aware that it is rare for properties in auction to clear at the first auction
13. Therefore,
BlackRock assumed that the haircut must be greater than 33%. Loss Mitigation Assumptions BlackRock conducted a series of analyses and interviews to better understand the impact of loss mitigation on arrears and ultimately losses. In Greece, restructured, rescheduled, refinanced loans or loans in forbearance all appear to share a common characteristic: the practice of changing terms and conditions, often through the creation of a new loan, and thereby capitalizing the arrears balance associated with the loan and reducing loan payment terms. While this practice can be justifiable if a borrower is duly qualified, it can also distort the performance of a pool of loans if such qualification is not done to ensure the loan’s sustainability. In particular:
BlackRock reviewed and catalogued the practices of each Group A Bank to inform its judgment on the quality of each Bank’s practices. Certain variations were evident, but most Banks appeared to maintain a relatively low standard for borrower qualification and loan structure.
BlackRock reviewed the recidivism rates at the lender which exhibited the highest standard for borrower qualification and loan structure. Recidivism rates back to a 90+ state were nearly 60% in the first year (as illustrated in the following chart), which is similar to levels experienced with US subprime loans:
13
Properties financed by loans greater than EUR 200,000 can still be liquidated via auction in Greece.
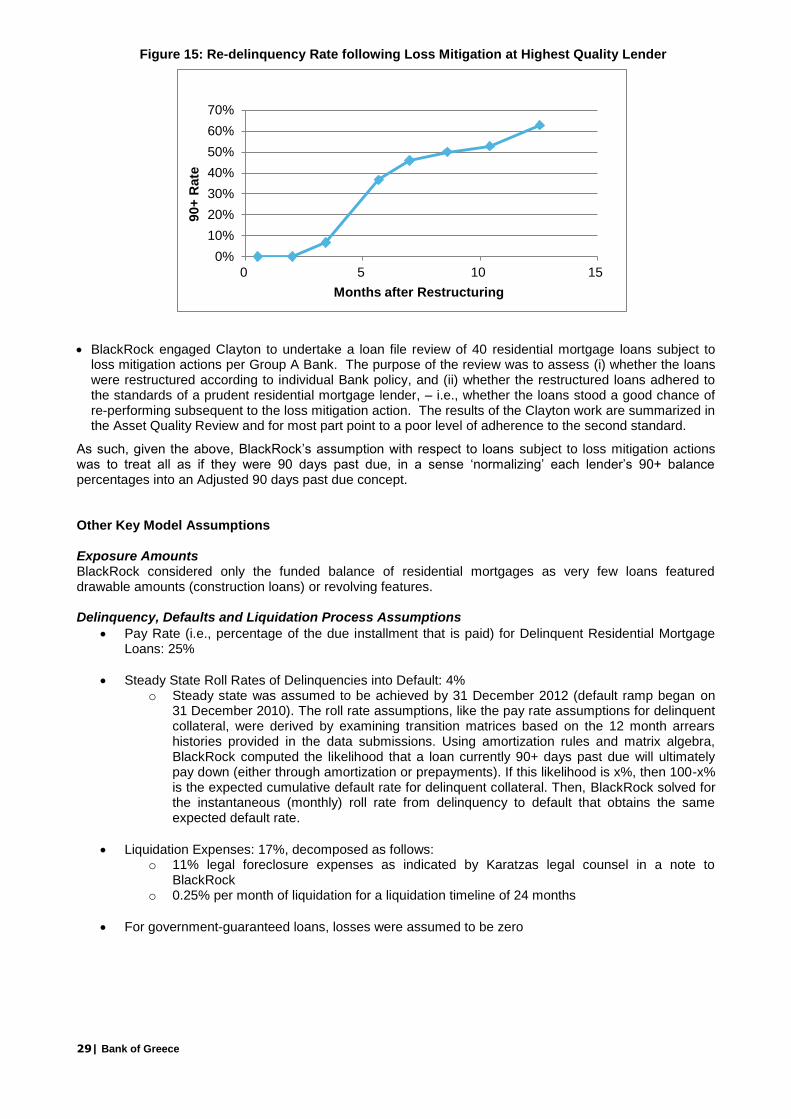
29| Bank of Greece
Figure 15: Re-delinquency Rate following Loss Mitigation at Highest Quality Lender
BlackRock engaged Clayton to undertake a loan file review of 40 residential mortgage loans subject to loss mitigation actions per Group A Bank. The purpose of the review was to assess (i) whether the loans were restructured according to individual Bank policy, and (ii) whether the restructured loans adhered to the standards of a prudent residential mortgage lender, – i.e., whether the loans stood a good chance of re-performing subsequent to the loss mitigation action. The results of the Clayton work are summarized in the Asset Quality Review and for most part point to a poor level of adherence to the second standard.
As such, given the above, BlackRock’s assumption with respect to loans subject to loss mitigation actions was to treat all as if they were 90 days past due, in a sense ‘normalizing’ each lender’s 90+ balance percentages into an Adjusted 90 days past due concept. Other Key Model Assumptions Exposure Amounts BlackRock considered only the funded balance of residential mortgages as very few loans featured drawable amounts (construction loans) or revolving features. Delinquency, Defaults and Liquidation Process Assumptions
Pay Rate (i.e., percentage of the due installment that is paid) for Delinquent Residential Mortgage Loans: 25%
Steady State Roll Rates of Delinquencies into Default: 4% o Steady state was assumed to be achieved by 31 December 2012 (default ramp began on
31 December 2010). The roll rate assumptions, like the pay rate assumptions for delinquent collateral, were derived by examining transition matrices based on the 12 month arrears histories provided in the data submissions. Using amortization rules and matrix algebra, BlackRock computed the likelihood that a loan currently 90+ days past due will ultimately pay down (either through amortization or prepayments). If this likelihood is x%, then 100-x% is the expected cumulative default rate for delinquent collateral. Then, BlackRock solved for the instantaneous (monthly) roll rate from delinquency to default that obtains the same expected default rate.
Liquidation Expenses: 17%, decomposed as follows: o 11% legal foreclosure expenses as indicated by Karatzas legal counsel in a note to
BlackRock o 0.25% per month of liquidation for a liquidation timeline of 24 months
For government-guaranteed loans, losses were assumed to be zero
0%
10%
20%
30%
40%
50%
60%
70%
0 5 10 15
90+
Rate
Months after Restructuring
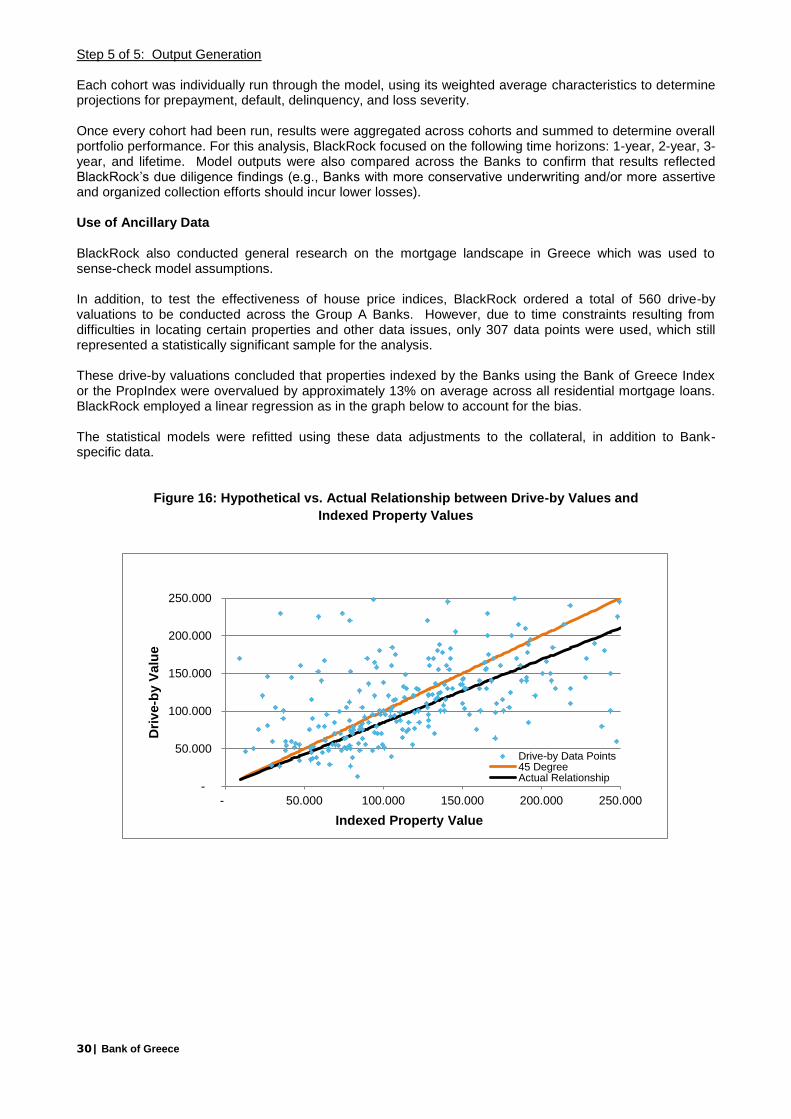
30| Bank of Greece
Step 5 of 5: Output Generation Each cohort was individually run through the model, using its weighted average characteristics to determine projections for prepayment, default, delinquency, and loss severity. Once every cohort had been run, results were aggregated across cohorts and summed to determine overall portfolio performance. For this analysis, BlackRock focused on the following time horizons: 1-year, 2-year, 3-year, and lifetime. Model outputs were also compared across the Banks to confirm that results reflected BlackRock’s due diligence findings (e.g., Banks with more conservative underwriting and/or more assertive and organized collection efforts should incur lower losses). Use of Ancillary Data BlackRock also conducted general research on the mortgage landscape in Greece which was used to sense-check model assumptions. In addition, to test the effectiveness of house price indices, BlackRock ordered a total of 560 drive-by valuations to be conducted across the Group A Banks. However, due to time constraints resulting from difficulties in locating certain properties and other data issues, only 307 data points were used, which still represented a statistically significant sample for the analysis. These drive-by valuations concluded that properties indexed by the Banks using the Bank of Greece Index or the PropIndex were overvalued by approximately 13% on average across all residential mortgage loans. BlackRock employed a linear regression as in the graph below to account for the bias. The statistical models were refitted using these data adjustments to the collateral, in addition to Bank-specific data.
Figure 16: Hypothetical vs. Actual Relationship between Drive-by Values and
Indexed Property Values
-
50.000
100.000
150.000
200.000
250.000
- 50.000 100.000 150.000 200.000 250.000
Dri
ve-b
y V
alu
e
Indexed Property Value
Drive-by Data Points45 DegreeActual Relationship
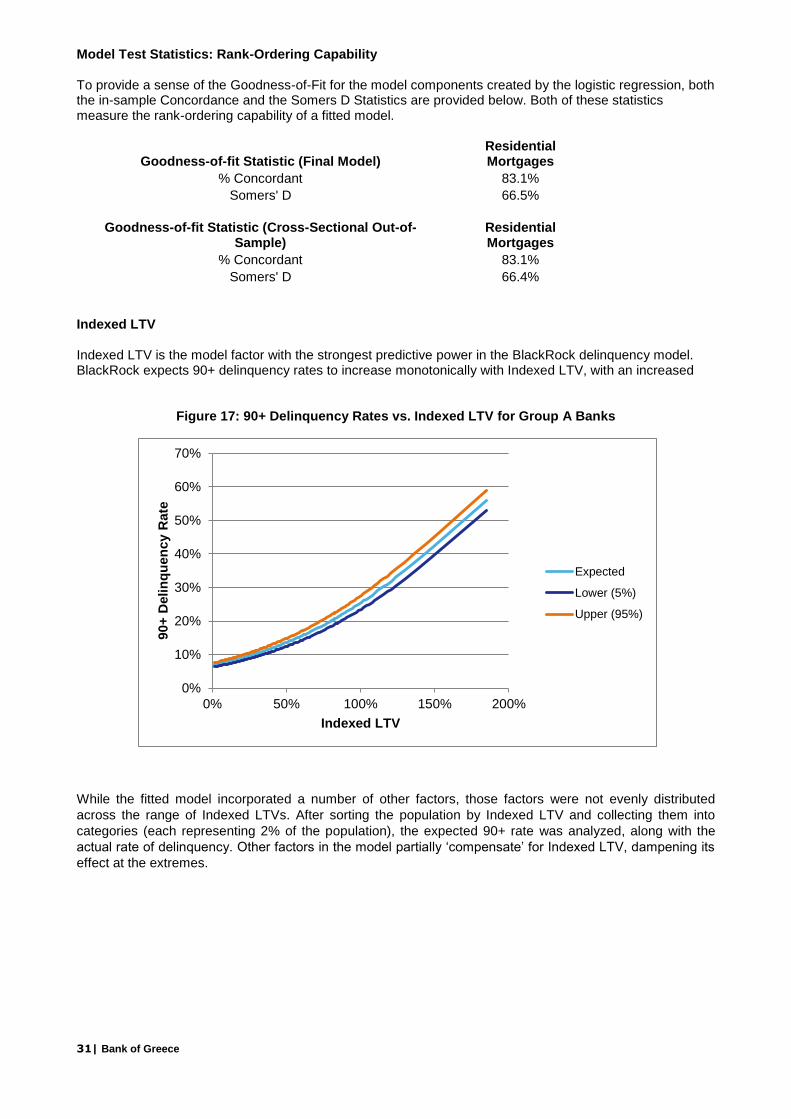
31| Bank of Greece
Model Test Statistics: Rank-Ordering Capability To provide a sense of the Goodness-of-Fit for the model components created by the logistic regression, both the in-sample Concordance and the Somers D Statistics are provided below. Both of these statistics measure the rank-ordering capability of a fitted model.
Goodness-of-fit Statistic (Final Model) Residential Mortgages
% Concordant 83.1%
Somers' D 66.5%
Goodness-of-fit Statistic (Cross-Sectional Out-of-
Sample) Residential Mortgages
% Concordant 83.1%
Somers' D 66.4%
Indexed LTV Indexed LTV is the model factor with the strongest predictive power in the BlackRock delinquency model. BlackRock expects 90+ delinquency rates to increase monotonically with Indexed LTV, with an increased
Figure 17: 90+ Delinquency Rates vs. Indexed LTV for Group A Banks
While the fitted model incorporated a number of other factors, those factors were not evenly distributed
across the range of Indexed LTVs. After sorting the population by Indexed LTV and collecting them into
categories (each representing 2% of the population), the expected 90+ rate was analyzed, along with the
actual rate of delinquency. Other factors in the model partially ‘compensate’ for Indexed LTV, dampening its
effect at the extremes.
0%
10%
20%
30%
40%
50%
60%
70%
0% 50% 100% 150% 200%
90+
Deli
nq
uen
cy R
ate
Indexed LTV
Expected
Lower (5%)
Upper (95%)
32| Bank of Greece
Residential Mortgage Loans – Supplementary Information
Indexed Loan-to-Value (LTV) Ratio: LTV is typically calculated at origination as the loan’s principal balance divided by the property’s appraised market value. Over time, both the numerator and denominator change as the loan balance amortizes and property value fluctuates. To calculate the Indexed LTV measure, the Bank of Greece Index was used to update the value of the property to 30 June 2011 from the most recent value provided by the Banks (whether original, updated, or partially indexed already).
Indexed LTV features prominently in the residential behavioral models because it provides a measure of the amount of equity a borrower has in a property and a signal incorporating the borrower’s level of indebtedness. A lower LTV implies a greater incentive and ability to continue paying a mortgage (resulting in lower delinquencies and default), a greater ability to prepay (high LTV product has disappeared from the market), and a thicker cushion against losses in the case of borrower default. Note that a home price index is only reliable if the index is based on an unbiased and statistically significant number of data points. Given the importance of the factor in the models, due diligence on these price indices is vital. As part of its due diligence, BlackRock ordered ‘drive-by’ valuations to be performed on 80 properties for each of the 7 Group A Bank for a total of 560 properties (397 drive-by valuations were returned, of which 307 were used due to time constraints). These drive-bys assessed whether the indexation predicted valuations were reliable or whether further adjustments to collateral valuations were warranted. These results led to an adjustment to the Indexed LTV described in the modeling section for Residential Mortgages.
Seasoning: The amount of time that the loan has been outstanding is a significant factor in all of the models. Unlike all of the other factors listed here, the correlation between seasoning and each of the performance measures changes through time. Loans may begin at fixed or discounted coupon rates. As such, delinquency, default, and prepayment rates naturally all start at low levels. As time passes, loans age into delinquency and some ultimately default. At a certain point the propensity to become delinquent begins to reduce as the remaining borrowers have by then expended significant time and money servicing the loan. Existing delinquent loans are purged through time. All of these effects combined imply a hump-shaped seasoning vs. default curve.
Current Loan Coupon: The rate of interest paid by a borrower is a factor in the model for two broad reasons: i) Affordability is likely to be lower for a higher loan rate, all else being equal; and ii) the perceived ‘riskiness’ of a borrower is reflected in the higher interest rate and as such is a proxy for credit risk.
Fixed Rate: Loans on fixed rates have more certainty on their monthly payments and thus typically exhibit slightly lower delinquency rates than floating rate loans. However as loans end their fixed rate period this factor will fall out of the model.
Government Guarantee Indicator: Government Guaranteed loans typically have more favorable terms than standard loans. Additionally they are often offered to borrowers affected by natural disasters or other unforeseen circumstances (e.g., earthquakes and bush fires), thus the borrower does not represent a higher credit risk than normal (unlike OEK Guaranteed Loans, see below).
Credit Score: The Banks’ own internal credit scores at origination attempt to capture the credit risk of a borrower and are thus unsurprisingly a strong indicator.
Employment Status: The type of employment is a factor in all of the consumer models. Borrowers who are state employees or pensioners are negatively correlated to delinquencies with all other employment types being positively correlated. This relationship reflects the increased job security enjoyed by the public sector and the lower unemployment levels suffered to date, given the continued weak economic conditions.
Athens Indicator: Geographical location is a factor in the model with properties based in Athens showing a negative correlation with delinquency. The greater Athens area is the most densely populated, wealthiest and economically active part of Greece. Thus borrowers are likely to be better equipped to withstand the current economic conditions than those living elsewhere in the country.

33| Bank of Greece
Balance Transfer: Mortgage refinancing where a borrower moves from one lender to another is relatively uncommon in Greece compared to other European Countries. The normal incentive is to obtain a lower or sometimes fixed interest rate from the new lender. Switching lenders in this way could be masking affordability issues and/or involving debt consolidation, resulting in a higher delinquency rate
OEK Guarantee Indicator: OEK Guaranteed loans such as direct government guaranteed loans have more favorable terms (lower interest rates) than standard loans. In the case of OEK, the loans are offered to low income families, which represent a slightly higher credit risk. As a result, the negative correlation with delinquency is lower.
Interest Only At Origination Indicator: The majority of Greek Mortgage loans are repayment but a small proportion have an interest only period.
Swiss Franc Indicator: A number of Greek Banks offered Swiss Franc denominated loans to take advantage of the difference between Eurozone and Swiss interest rates. The exchange rate has subsequently moved against the borrowers meaning that their mortgage balance (when converted to Euros) is now substantially higher. This is offset by exceptionally low Swiss interest rates meaning that net-net monthly mortgage payments for these borrowers (in Euros) have not increased. This is therefore a weak correlation.

34| Bank of Greece
Credit Card Loans - AQR
Due Diligence The process to assess asset quality in credit cards combined qualitative and quantitative reviews and refinement of portfolio data, historic portfolio performance, and lending and collection operations. BlackRock’s review covered the following:
i) Management and Business meetings and interviews conducted across the 7 Group A Banks. In particular, the review encompassed the Banks’ lending practices, including historical origination and underwriting, as well as loan collection processes and procedures.
ii) Additional review specifically of the Banks’ loss mitigation practices and products, including their forbearance, rescheduling, refinancing and restructuring practices and policies.
This blend of qualitative and quantitative components served as an additional input to inform models developed to generate CLP results.
Management / Business Due Diligence Meetings & Interviews
Meetings and interviews were held with business unit managers covering origination practices, underwriting, and collections (targeting loss mitigation practices). Topics addressed during these interviews included:
Background and Lender Profile
Origination Strategy and Product Composition
Collateral Valuation
Underwriting Guidelines and Criteria
Compliance, Quality Control, and Risk Management
Systems and Technology
Servicing/Collections and Arrears Management
Loss Mitigation Strategies, Practices, and Procedures
Loan Denouncement The purpose of the meetings was to gain an understanding of the origination and underwriting philosophies and practices at each Bank, in addition to their relative level of preparedness to address servicing challenges precipitated by the crisis. Initial meetings were held with each of the 7 Group A Banks between 29 August and 7 September 2011. Follow-up meetings focusing specifically on the residential mortgage and consumer loan portfolios were held with each of the 7 Group A Banks between 8 September and 29 September 2011. These meetings frequently included detailed presentations prepared by the Banks to address the above topics.
Loss Mitigation/Debt Management Sessions
In addition to the above meetings, further sessions were held in October and November with each of the 7 Group A Banks to focus solely on each Bank’s forbearance, rescheduling, refinancing and restructuring practices. These additional meetings were held to ensure that BlackRock accurately understood each Bank’s loss mitigation policies.
Portfolio Data Collection Data was supplied by each of the Banks in a format stipulated by BlackRock as of 30 June 2011. The data format itself was developed in consultation with the Banks during a series of data meetings held with their data and IT personnel in August and September. This process had the advantage of ensuring data supplied was directly comparable across institutions, with (broadly) the same field definitions applied for each
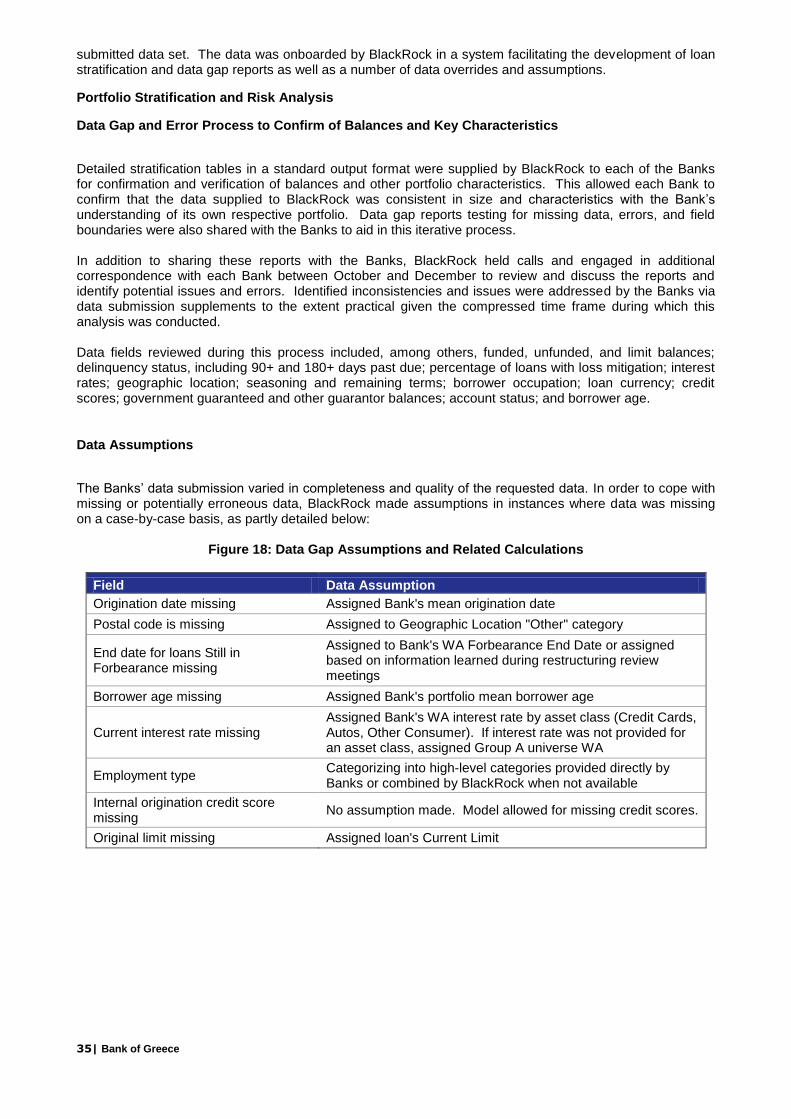
35| Bank of Greece
submitted data set. The data was onboarded by BlackRock in a system facilitating the development of loan stratification and data gap reports as well as a number of data overrides and assumptions.
Portfolio Stratification and Risk Analysis
Data Gap and Error Process to Confirm of Balances and Key Characteristics
Detailed stratification tables in a standard output format were supplied by BlackRock to each of the Banks for confirmation and verification of balances and other portfolio characteristics. This allowed each Bank to confirm that the data supplied to BlackRock was consistent in size and characteristics with the Bank’s understanding of its own respective portfolio. Data gap reports testing for missing data, errors, and field boundaries were also shared with the Banks to aid in this iterative process. In addition to sharing these reports with the Banks, BlackRock held calls and engaged in additional correspondence with each Bank between October and December to review and discuss the reports and identify potential issues and errors. Identified inconsistencies and issues were addressed by the Banks via data submission supplements to the extent practical given the compressed time frame during which this analysis was conducted. Data fields reviewed during this process included, among others, funded, unfunded, and limit balances; delinquency status, including 90+ and 180+ days past due; percentage of loans with loss mitigation; interest rates; geographic location; seasoning and remaining terms; borrower occupation; loan currency; credit scores; government guaranteed and other guarantor balances; account status; and borrower age.
Data Assumptions
The Banks’ data submission varied in completeness and quality of the requested data. In order to cope with missing or potentially erroneous data, BlackRock made assumptions in instances where data was missing on a case-by-case basis, as partly detailed below:
Figure 18: Data Gap Assumptions and Related Calculations
Field Data Assumption
Origination date missing Assigned Bank's mean origination date
Postal code is missing Assigned to Geographic Location "Other" category
End date for loans Still in Forbearance missing
Assigned to Bank's WA Forbearance End Date or assigned based on information learned during restructuring review meetings
Borrower age missing Assigned Bank's portfolio mean borrower age
Current interest rate missing Assigned Bank's WA interest rate by asset class (Credit Cards, Autos, Other Consumer). If interest rate was not provided for an asset class, assigned Group A universe WA
Employment type Categorizing into high-level categories provided directly by Banks or combined by BlackRock when not available
Internal origination credit score missing
No assumption made. Model allowed for missing credit scores.
Original limit missing Assigned loan's Current Limit
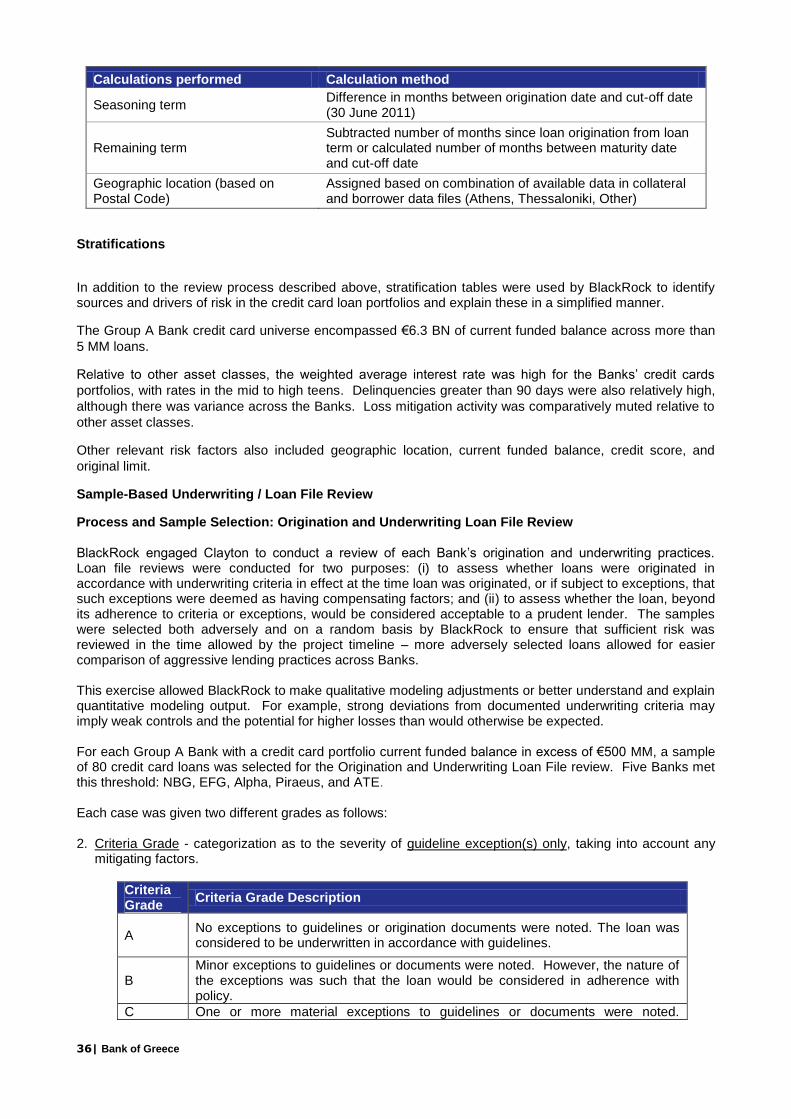
36| Bank of Greece
Calculations performed Calculation method
Seasoning term Difference in months between origination date and cut-off date (30 June 2011)
Remaining term Subtracted number of months since loan origination from loan term or calculated number of months between maturity date and cut-off date
Geographic location (based on Postal Code)
Assigned based on combination of available data in collateral and borrower data files (Athens, Thessaloniki, Other)
Stratifications
In addition to the review process described above, stratification tables were used by BlackRock to identify sources and drivers of risk in the credit card loan portfolios and explain these in a simplified manner.
The Group A Bank credit card universe encompassed €6.3 BN of current funded balance across more than
5 MM loans.
Relative to other asset classes, the weighted average interest rate was high for the Banks’ credit cards
portfolios, with rates in the mid to high teens. Delinquencies greater than 90 days were also relatively high,
although there was variance across the Banks. Loss mitigation activity was comparatively muted relative to
other asset classes.
Other relevant risk factors also included geographic location, current funded balance, credit score, and
original limit.
Sample-Based Underwriting / Loan File Review
Process and Sample Selection: Origination and Underwriting Loan File Review BlackRock engaged Clayton to conduct a review of each Bank’s origination and underwriting practices. Loan file reviews were conducted for two purposes: (i) to assess whether loans were originated in accordance with underwriting criteria in effect at the time loan was originated, or if subject to exceptions, that such exceptions were deemed as having compensating factors; and (ii) to assess whether the loan, beyond its adherence to criteria or exceptions, would be considered acceptable to a prudent lender. The samples were selected both adversely and on a random basis by BlackRock to ensure that sufficient risk was reviewed in the time allowed by the project timeline – more adversely selected loans allowed for easier comparison of aggressive lending practices across Banks. This exercise allowed BlackRock to make qualitative modeling adjustments or better understand and explain quantitative modeling output. For example, strong deviations from documented underwriting criteria may imply weak controls and the potential for higher losses than would otherwise be expected. For each Group A Bank with a credit card portfolio current funded balance in excess of €500 MM, a sample of 80 credit card loans was selected for the Origination and Underwriting Loan File review. Five Banks met this threshold: NBG, EFG, Alpha, Piraeus, and ATE. Each case was given two different grades as follows: 2. Criteria Grade - categorization as to the severity of guideline exception(s) only, taking into account any
mitigating factors.
Criteria Grade
Criteria Grade Description
A No exceptions to guidelines or origination documents were noted. The loan was considered to be underwritten in accordance with guidelines.
B Minor exceptions to guidelines or documents were noted. However, the nature of the exceptions was such that the loan would be considered in adherence with policy.
C One or more material exceptions to guidelines or documents were noted.
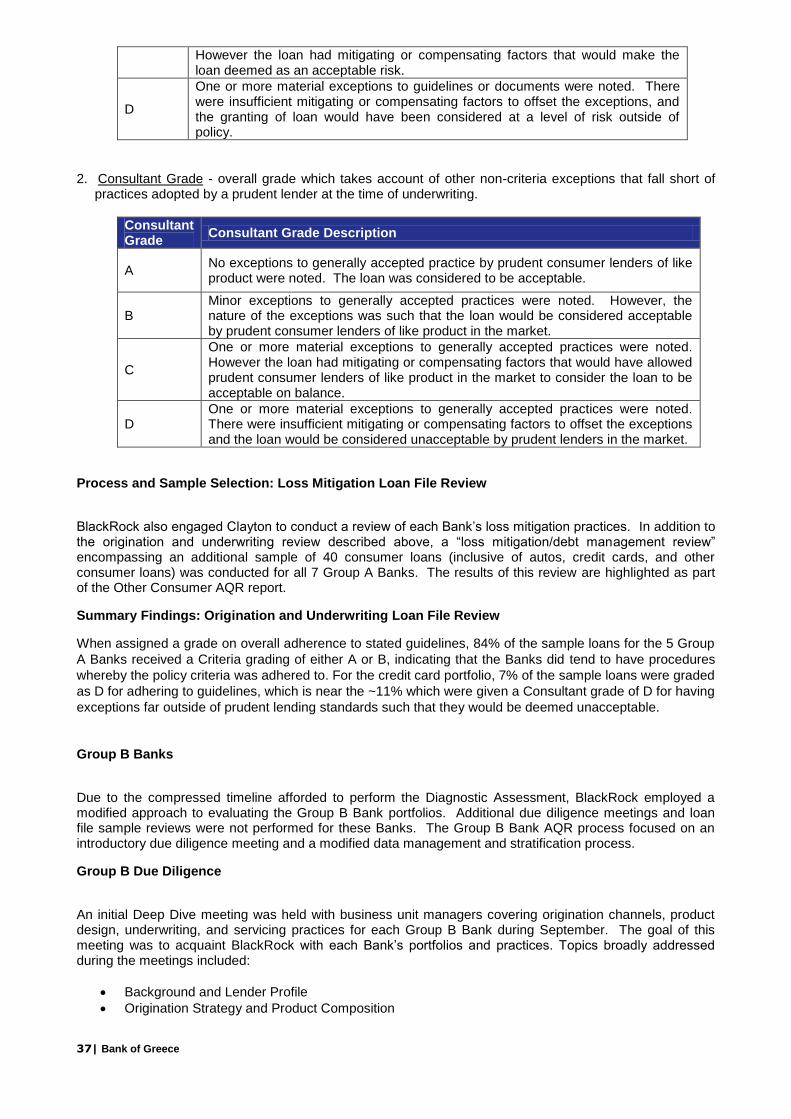
37| Bank of Greece
However the loan had mitigating or compensating factors that would make the loan deemed as an acceptable risk.
D
One or more material exceptions to guidelines or documents were noted. There were insufficient mitigating or compensating factors to offset the exceptions, and the granting of loan would have been considered at a level of risk outside of policy.
2. Consultant Grade - overall grade which takes account of other non-criteria exceptions that fall short of
practices adopted by a prudent lender at the time of underwriting.
Consultant Grade
Consultant Grade Description
A No exceptions to generally accepted practice by prudent consumer lenders of like product were noted. The loan was considered to be acceptable.
B Minor exceptions to generally accepted practices were noted. However, the nature of the exceptions was such that the loan would be considered acceptable by prudent consumer lenders of like product in the market.
C
One or more material exceptions to generally accepted practices were noted. However the loan had mitigating or compensating factors that would have allowed prudent consumer lenders of like product in the market to consider the loan to be acceptable on balance.
D One or more material exceptions to generally accepted practices were noted. There were insufficient mitigating or compensating factors to offset the exceptions and the loan would be considered unacceptable by prudent lenders in the market.
Process and Sample Selection: Loss Mitigation Loan File Review
BlackRock also engaged Clayton to conduct a review of each Bank’s loss mitigation practices. In addition to the origination and underwriting review described above, a “loss mitigation/debt management review” encompassing an additional sample of 40 consumer loans (inclusive of autos, credit cards, and other consumer loans) was conducted for all 7 Group A Banks. The results of this review are highlighted as part of the Other Consumer AQR report.
Summary Findings: Origination and Underwriting Loan File Review
When assigned a grade on overall adherence to stated guidelines, 84% of the sample loans for the 5 Group
A Banks received a Criteria grading of either A or B, indicating that the Banks did tend to have procedures
whereby the policy criteria was adhered to. For the credit card portfolio, 7% of the sample loans were graded
as D for adhering to guidelines, which is near the ~11% which were given a Consultant grade of D for having
exceptions far outside of prudent lending standards such that they would be deemed unacceptable.
Group B Banks
Due to the compressed timeline afforded to perform the Diagnostic Assessment, BlackRock employed a modified approach to evaluating the Group B Bank portfolios. Additional due diligence meetings and loan file sample reviews were not performed for these Banks. The Group B Bank AQR process focused on an introductory due diligence meeting and a modified data management and stratification process.
Group B Due Diligence
An initial Deep Dive meeting was held with business unit managers covering origination channels, product design, underwriting, and servicing practices for each Group B Bank during September. The goal of this meeting was to acquaint BlackRock with each Bank’s portfolios and practices. Topics broadly addressed during the meetings included:
Background and Lender Profile
Origination Strategy and Product Composition
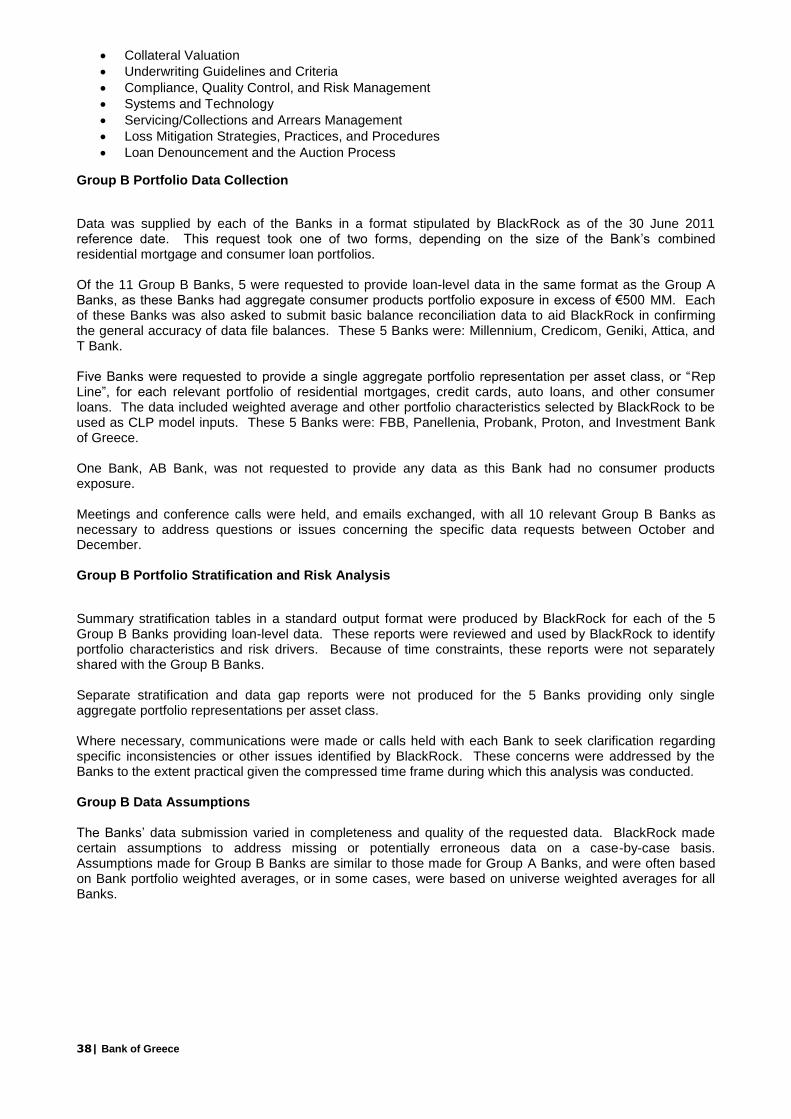
38| Bank of Greece
Collateral Valuation
Underwriting Guidelines and Criteria
Compliance, Quality Control, and Risk Management
Systems and Technology
Servicing/Collections and Arrears Management
Loss Mitigation Strategies, Practices, and Procedures
Loan Denouncement and the Auction Process
Group B Portfolio Data Collection
Data was supplied by each of the Banks in a format stipulated by BlackRock as of the 30 June 2011 reference date. This request took one of two forms, depending on the size of the Bank’s combined residential mortgage and consumer loan portfolios. Of the 11 Group B Banks, 5 were requested to provide loan-level data in the same format as the Group A Banks, as these Banks had aggregate consumer products portfolio exposure in excess of €500 MM. Each of these Banks was also asked to submit basic balance reconciliation data to aid BlackRock in confirming the general accuracy of data file balances. These 5 Banks were: Millennium, Credicom, Geniki, Attica, and T Bank. Five Banks were requested to provide a single aggregate portfolio representation per asset class, or “Rep Line”, for each relevant portfolio of residential mortgages, credit cards, auto loans, and other consumer loans. The data included weighted average and other portfolio characteristics selected by BlackRock to be used as CLP model inputs. These 5 Banks were: FBB, Panellenia, Probank, Proton, and Investment Bank of Greece. One Bank, AB Bank, was not requested to provide any data as this Bank had no consumer products exposure. Meetings and conference calls were held, and emails exchanged, with all 10 relevant Group B Banks as necessary to address questions or issues concerning the specific data requests between October and December. Group B Portfolio Stratification and Risk Analysis
Summary stratification tables in a standard output format were produced by BlackRock for each of the 5 Group B Banks providing loan-level data. These reports were reviewed and used by BlackRock to identify portfolio characteristics and risk drivers. Because of time constraints, these reports were not separately shared with the Group B Banks. Separate stratification and data gap reports were not produced for the 5 Banks providing only single aggregate portfolio representations per asset class. Where necessary, communications were made or calls held with each Bank to seek clarification regarding specific inconsistencies or other issues identified by BlackRock. These concerns were addressed by the Banks to the extent practical given the compressed time frame during which this analysis was conducted. Group B Data Assumptions The Banks’ data submission varied in completeness and quality of the requested data. BlackRock made certain assumptions to address missing or potentially erroneous data on a case-by-case basis. Assumptions made for Group B Banks are similar to those made for Group A Banks, and were often based on Bank portfolio weighted averages, or in some cases, were based on universe weighted averages for all Banks.

39| Bank of Greece
Auto Loans - AQR
Due Diligence The process to assess asset quality in auto loans combined qualitative and quantitative reviews and refinement of portfolio data, historic portfolio performance, and lending and collection operations. BlackRock’s review covered the following:
i) Management and Business meetings and interviews conducted across the 7 Group A Banks. In particular, the review encompassed the Banks’ lending practices, including historical origination and underwriting, as well as loan collection processes and procedures.
ii) Additional review specifically of the Banks’ loss mitigation practices and products, including their forbearance, rescheduling, refinancing and restructuring practices and policies.
This blend of qualitative and quantitative components served as an additional input to inform models developed to generate CLP results.
Management / Business Due Diligence Meetings & Interviews
Meetings and interviews were held with business unit managers covering origination practices, underwriting, and collections (targeting loss mitigation practices). Topics addressed during these interviews included:
Background and Lender Profile
Origination Strategy and Product Composition
Collateral Valuation
Underwriting Guidelines and Criteria
Compliance, Quality Control, and Risk Management
Systems and Technology
Servicing/Collections and Arrears Management
Loss Mitigation Strategies, Practices, and Procedures
Loan Denouncement The purpose of the meetings was to gain an understanding of the origination and underwriting philosophies and practices at each Bank, in addition to their relative level of preparedness to address servicing challenges precipitated by the crisis. Initial meetings were held with each of the 7 Group A Banks between 29 August and 7 September 2011. Follow-up meetings focusing specifically on the residential mortgage and consumer loan portfolios were held with each of the 7 Group A Banks between September 8 and 29 September 2011. These meetings frequently included detailed presentations prepared by the Banks to address the above topics.
Loss Mitigation/Debt Management Sessions
In addition to the above meetings, further sessions were held in October and November with each of the 7 Group A Banks to focus solely on each Bank’s forbearance, rescheduling, refinancing and restructuring practices. These additional meetings were held to ensure that BlackRock held an accurate understanding of each Bank’s loss mitigation policies.
Portfolio Data Collection Data was supplied by each of the Banks in a format stipulated by BlackRock as of 30 June 2011. The data format itself was developed in consultation with the Banks during a series of meetings held with their data and IT personnel in August and September. This process had the advantage of ensuring data supplied were directly comparable across institutions, with (broadly) the same field definitions applied for each
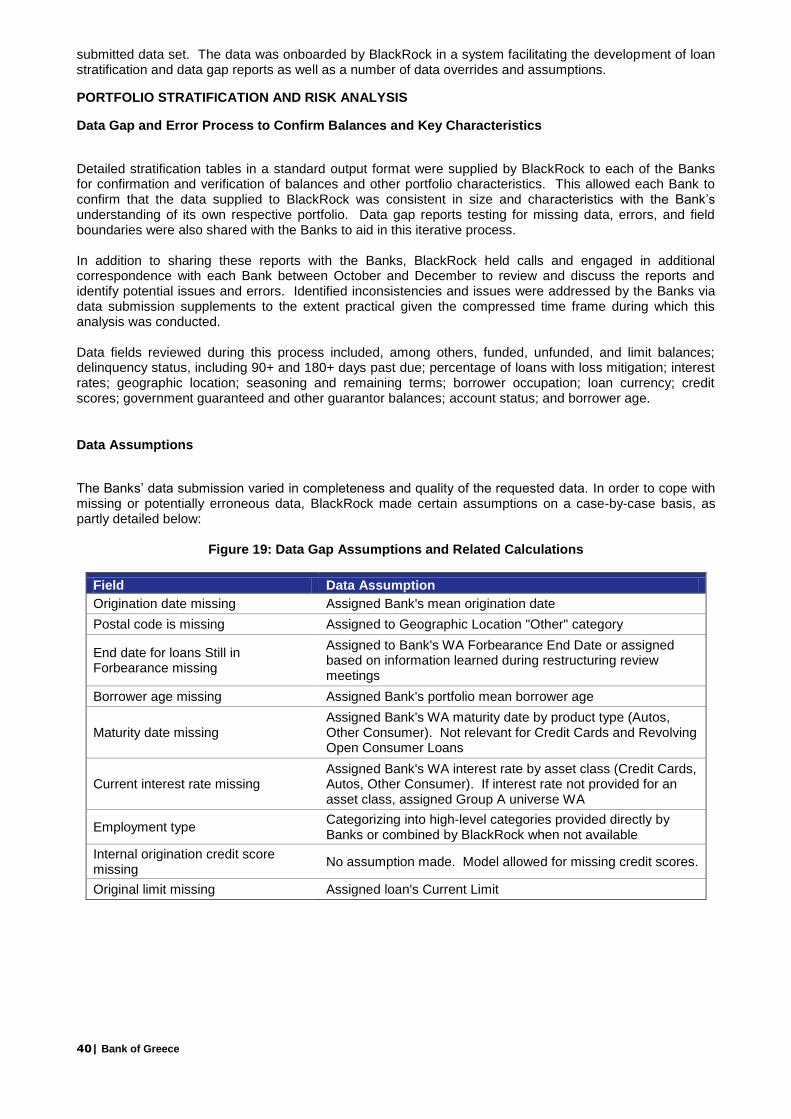
40| Bank of Greece
submitted data set. The data was onboarded by BlackRock in a system facilitating the development of loan stratification and data gap reports as well as a number of data overrides and assumptions.
PORTFOLIO STRATIFICATION AND RISK ANALYSIS
Data Gap and Error Process to Confirm Balances and Key Characteristics
Detailed stratification tables in a standard output format were supplied by BlackRock to each of the Banks for confirmation and verification of balances and other portfolio characteristics. This allowed each Bank to confirm that the data supplied to BlackRock was consistent in size and characteristics with the Bank’s understanding of its own respective portfolio. Data gap reports testing for missing data, errors, and field boundaries were also shared with the Banks to aid in this iterative process. In addition to sharing these reports with the Banks, BlackRock held calls and engaged in additional correspondence with each Bank between October and December to review and discuss the reports and identify potential issues and errors. Identified inconsistencies and issues were addressed by the Banks via data submission supplements to the extent practical given the compressed time frame during which this analysis was conducted. Data fields reviewed during this process included, among others, funded, unfunded, and limit balances; delinquency status, including 90+ and 180+ days past due; percentage of loans with loss mitigation; interest rates; geographic location; seasoning and remaining terms; borrower occupation; loan currency; credit scores; government guaranteed and other guarantor balances; account status; and borrower age.
Data Assumptions
The Banks’ data submission varied in completeness and quality of the requested data. In order to cope with missing or potentially erroneous data, BlackRock made certain assumptions on a case-by-case basis, as partly detailed below:
Figure 19: Data Gap Assumptions and Related Calculations
Field Data Assumption
Origination date missing Assigned Bank's mean origination date
Postal code is missing Assigned to Geographic Location "Other" category
End date for loans Still in Forbearance missing
Assigned to Bank's WA Forbearance End Date or assigned based on information learned during restructuring review meetings
Borrower age missing Assigned Bank's portfolio mean borrower age
Maturity date missing Assigned Bank's WA maturity date by product type (Autos, Other Consumer). Not relevant for Credit Cards and Revolving Open Consumer Loans
Current interest rate missing Assigned Bank's WA interest rate by asset class (Credit Cards, Autos, Other Consumer). If interest rate not provided for an asset class, assigned Group A universe WA
Employment type Categorizing into high-level categories provided directly by Banks or combined by BlackRock when not available
Internal origination credit score missing
No assumption made. Model allowed for missing credit scores.
Original limit missing Assigned loan's Current Limit

41| Bank of Greece
Calculations performed Calculation method
Seasoning term Difference in months between origination date and cut-off date 30 June 2011
Remaining term Subtracted number of months since loan origination from loan term or calculated number of months between maturity date and cut-off date
Geographic location (based on Postal Code)
Assigned based on combination of available data in collateral and borrower data files (Athens, Thessaloniki, Other)
Stratifications
In addition to the review process described above, stratification tables were used by BlackRock to identify sources and drivers of risk in the auto loan portfolios and explain these in a simplified manner.
The Group A Bank auto loan universe encompassed €1.7 BN of current funded balance across over almost
280,000 loans.
Compared to other consumer asset classes, 90+ adjusted delinquency levels for auto loans were generally
low. Just as significantly, the secured nature of autos led to comparatively lower projected losses for the
asset class as well. Within each Bank, more seasoned loans tended to exhibit poorer performance and
were more likely to be delinquent relative to more recent issuance.
SAMPLE-BASED UNDERWRITING / LOAN FILE REVIEW
Process and Sample Selection: Origination and Underwriting Loan File Review
BlackRock engaged Clayton to conduct a review of each Bank’s origination and underwriting practices. Loan file reviews were conducted for two purposes: (i) to assess whether loans were originated in accordance with underwriting criteria in effect at the time loan was originated, or if subject to exceptions, that such exceptions were deemed as having compensating factors; and (ii) to assess whether the loan, beyond its adherence to criteria or exceptions, would be considered acceptable to a prudent lender. The samples were selected both adversely and on a random basis by BlackRock to ensure that sufficient risk was reviewed in the time allowed by the project timeline – more adversely selected loans allowed for easier comparison of aggressive lending practices across the Banks. This exercise allowed BlackRock to make qualitative modeling adjustments or better understand and explain quantitative modeling output. For example, strong deviations from documented underwriting criteria may imply weak controls and the potential for higher losses than would otherwise be expected. For each Group A Bank with an auto loan portfolio current funded balance in excess of €500 MM, a sample of 80 auto loans was selected for the Origination and Underwriting Loan File review. Each case was given two different grades as follows:
1. Criteria Grade - categorization as to the severity of guideline exception(s) only, taking into account any mitigating factors.
Criteria Grade
Criteria Grade Description
A No exceptions to guidelines or origination documents were noted. The loan was considered to be underwritten in accordance with guidelines.
B Minor exceptions to guidelines or documents were noted. However, the nature of the exceptions was such that the loan would be considered in adherence with policy.
C One or more material exceptions to guidelines or documents were noted. However the loan had mitigating or compensating factors that would make the loan deemed as an acceptable risk.
D One or more material exceptions to guidelines or documents were noted. There
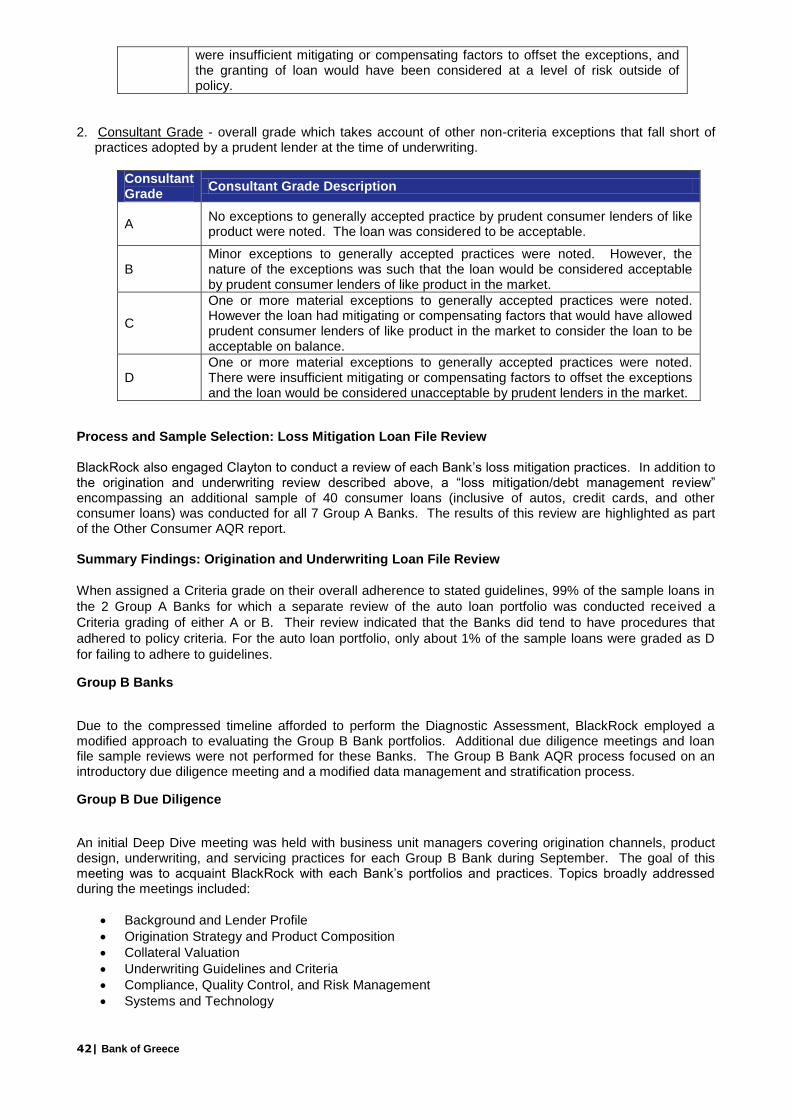
42| Bank of Greece
were insufficient mitigating or compensating factors to offset the exceptions, and the granting of loan would have been considered at a level of risk outside of policy.
2. Consultant Grade - overall grade which takes account of other non-criteria exceptions that fall short of
practices adopted by a prudent lender at the time of underwriting.
Consultant Grade
Consultant Grade Description
A No exceptions to generally accepted practice by prudent consumer lenders of like product were noted. The loan was considered to be acceptable.
B Minor exceptions to generally accepted practices were noted. However, the nature of the exceptions was such that the loan would be considered acceptable by prudent consumer lenders of like product in the market.
C
One or more material exceptions to generally accepted practices were noted. However the loan had mitigating or compensating factors that would have allowed prudent consumer lenders of like product in the market to consider the loan to be acceptable on balance.
D One or more material exceptions to generally accepted practices were noted. There were insufficient mitigating or compensating factors to offset the exceptions and the loan would be considered unacceptable by prudent lenders in the market.
Process and Sample Selection: Loss Mitigation Loan File Review BlackRock also engaged Clayton to conduct a review of each Bank’s loss mitigation practices. In addition to the origination and underwriting review described above, a “loss mitigation/debt management review” encompassing an additional sample of 40 consumer loans (inclusive of autos, credit cards, and other consumer loans) was conducted for all 7 Group A Banks. The results of this review are highlighted as part of the Other Consumer AQR report. Summary Findings: Origination and Underwriting Loan File Review
When assigned a Criteria grade on their overall adherence to stated guidelines, 99% of the sample loans in
the 2 Group A Banks for which a separate review of the auto loan portfolio was conducted received a
Criteria grading of either A or B. Their review indicated that the Banks did tend to have procedures that
adhered to policy criteria. For the auto loan portfolio, only about 1% of the sample loans were graded as D
for failing to adhere to guidelines.
Group B Banks
Due to the compressed timeline afforded to perform the Diagnostic Assessment, BlackRock employed a modified approach to evaluating the Group B Bank portfolios. Additional due diligence meetings and loan file sample reviews were not performed for these Banks. The Group B Bank AQR process focused on an introductory due diligence meeting and a modified data management and stratification process.
Group B Due Diligence
An initial Deep Dive meeting was held with business unit managers covering origination channels, product design, underwriting, and servicing practices for each Group B Bank during September. The goal of this meeting was to acquaint BlackRock with each Bank’s portfolios and practices. Topics broadly addressed during the meetings included:
Background and Lender Profile
Origination Strategy and Product Composition
Collateral Valuation
Underwriting Guidelines and Criteria
Compliance, Quality Control, and Risk Management
Systems and Technology

43| Bank of Greece
Servicing/Collections and Arrears Management
Loss Mitigation Strategies, Practices, and Procedures
Loan Denouncement and the Auction Process
Group B Portfolio Data Collection
Data was supplied by each of the Banks in a format stipulated by BlackRock as of 30 June 2011 reference date. This request took one of two forms, depending on the size of the Bank’s residential mortgage and consumer loan portfolios. Of the 11 Group B Banks, 5 were requested to provide loan-level data in the same format as the Group A Banks, as these Banks had aggregate consumer products portfolio exposure in excess of €500 MM. Each of these Banks was also asked to submit basic balance reconciliation data to aid BlackRock in confirming the general accuracy of data file balances. These 5 Banks were: Millennium, Credicom, Geniki, Attica, and T Bank. Five Banks were requested to provide a single aggregate portfolio representation per asset class, or “Rep Line”, for each relevant portfolio of residential mortgages, credit cards, auto loans, and other consumer loans. The data included weighted average and other portfolio characteristics selected by BlackRock to be used as CLP model inputs. Meetings and conference calls were held, and emails exchanged, with all 10 relevant Group B Banks as necessary to address questions or issues concerning the specific data requests between October and December. Group B Portfolio Stratification and Risk Analysis Summary stratification tables in a standard output format were produced by BlackRock for each of the 5 Group B Banks providing loan level data. These reports were reviewed and used by BlackRock to identify portfolio characteristics and risk drivers. Because of time constraints, these reports were not separately shared with the Group B Banks. Separate stratification and data gap reports were not produced for the 5 Banks providing only single aggregate portfolio representations per asset class. Where necessary, communications were made or calls held with each Bank to seek clarification regarding specific inconsistencies or other issues identified by BlackRock. These concerns were addressed by the Banks to the extent practical given the compressed time frame during which this analysis was conducted. Group B Data Assumptions The Banks’ data submission varied in completeness and quality of the requested data. In order to cope with missing or potentially erroneous data, BlackRock made certain assumptions to address missing or potentially erroneous data on a case-by-case basis. Assumptions made for Group B Banks were similar to those made for Group A Banks, and were often based on Bank portfolio weighted averages, or in some cases, may be based on universe weighted averages for all Banks.

44| Bank of Greece
Other Consumer Loans - AQR
Due Diligence The process to assess asset quality in other consumer loans combined qualitative and quantitative reviews and refinement of portfolio data, historic portfolio performance, and lending and collection operations. BlackRock’s review covered the following:
i) Management and Business meetings and interviews conducted across the 7 Group A Banks. In particular, the review encompassed the Banks’ lending practices, including historical origination and underwriting, as well as loan collection processes and procedures.
ii) Additional review specifically of the Banks’ loss mitigation practices and products, including their forbearance, rescheduling, refinancing and restructuring practices and policies.
This blend of qualitative and quantitative components served as an additional input to inform models developed to generate CLP results.
Management / Business Due Diligence Meetings & Interviews
Meetings and interviews were held with business unit managers covering origination practices, underwriting, and collections (targeting loss mitigation practices). Topics addressed during these interviews included:
Background and Lender Profile
Origination Strategy and Product Composition
Collateral Valuation
Underwriting Guidelines and Criteria
Compliance, Quality Control, and Risk Management
Systems and Technology
Servicing/Collections and Arrears Management
Loss Mitigation Strategies, Practices, and Procedures
Loan Denouncement The purpose of the meetings was to gain an understanding of the origination and underwriting philosophies and practices at each Bank, in addition to their relative level of preparedness to address servicing challenges precipitated by the crisis. Initial meetings were held with each of the 7 Group A Banks between 29 August and 7 September 2011. Follow-up meetings focusing specifically on the residential mortgage and consumer loan portfolios were held with each of the 7 Group A Banks between 8 September and 29 September 2011. These meetings frequently included detailed presentations prepared by the Banks to address the above topics.
Loss Mitigation/Debt Management Sessions
In addition to the above meetings, further sessions were held in October and November with each of the 7 Group A Banks to focus solely on each Bank’s forbearance, rescheduling, refinancing and restructuring practices. These additional meetings were held to ensure that BlackRock held an accurate understanding of each Bank’s loss mitigation policies.
Portfolio Data Collection Data was supplied by each of the Banks in a format stipulated by BlackRock as of 30 June 2011. The data format itself was developed in consultation with the Banks during a series of meetings held with their data and IT personnel in August and September. This process had the advantage of ensuring data supplied was directly comparable across institutions, with (broadly) the same field definitions applied for each submitted
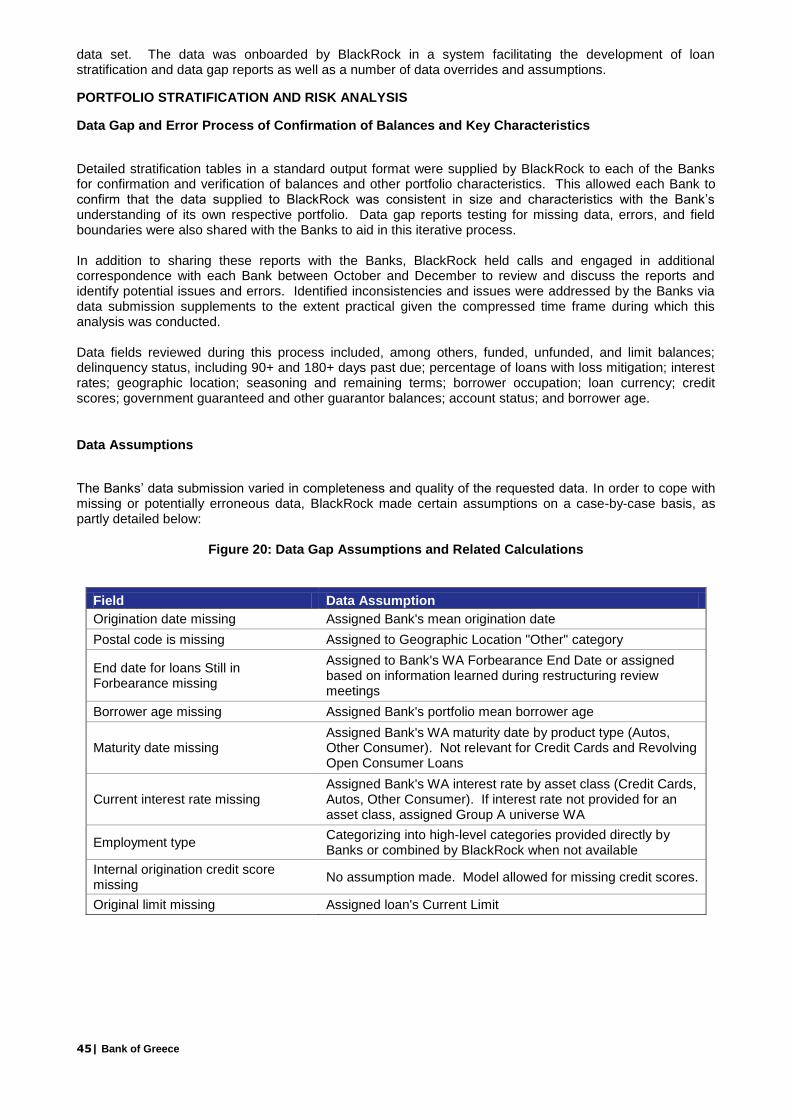
45| Bank of Greece
data set. The data was onboarded by BlackRock in a system facilitating the development of loan stratification and data gap reports as well as a number of data overrides and assumptions.
PORTFOLIO STRATIFICATION AND RISK ANALYSIS
Data Gap and Error Process of Confirmation of Balances and Key Characteristics
Detailed stratification tables in a standard output format were supplied by BlackRock to each of the Banks for confirmation and verification of balances and other portfolio characteristics. This allowed each Bank to confirm that the data supplied to BlackRock was consistent in size and characteristics with the Bank’s understanding of its own respective portfolio. Data gap reports testing for missing data, errors, and field boundaries were also shared with the Banks to aid in this iterative process. In addition to sharing these reports with the Banks, BlackRock held calls and engaged in additional correspondence with each Bank between October and December to review and discuss the reports and identify potential issues and errors. Identified inconsistencies and issues were addressed by the Banks via data submission supplements to the extent practical given the compressed time frame during which this analysis was conducted. Data fields reviewed during this process included, among others, funded, unfunded, and limit balances; delinquency status, including 90+ and 180+ days past due; percentage of loans with loss mitigation; interest rates; geographic location; seasoning and remaining terms; borrower occupation; loan currency; credit scores; government guaranteed and other guarantor balances; account status; and borrower age.
Data Assumptions
The Banks’ data submission varied in completeness and quality of the requested data. In order to cope with missing or potentially erroneous data, BlackRock made certain assumptions on a case-by-case basis, as partly detailed below:
Figure 20: Data Gap Assumptions and Related Calculations
Field Data Assumption
Origination date missing Assigned Bank's mean origination date
Postal code is missing Assigned to Geographic Location "Other" category
End date for loans Still in Forbearance missing
Assigned to Bank's WA Forbearance End Date or assigned based on information learned during restructuring review meetings
Borrower age missing Assigned Bank's portfolio mean borrower age
Maturity date missing Assigned Bank's WA maturity date by product type (Autos, Other Consumer). Not relevant for Credit Cards and Revolving Open Consumer Loans
Current interest rate missing Assigned Bank's WA interest rate by asset class (Credit Cards, Autos, Other Consumer). If interest rate not provided for an asset class, assigned Group A universe WA
Employment type Categorizing into high-level categories provided directly by Banks or combined by BlackRock when not available
Internal origination credit score missing
No assumption made. Model allowed for missing credit scores.
Original limit missing Assigned loan's Current Limit
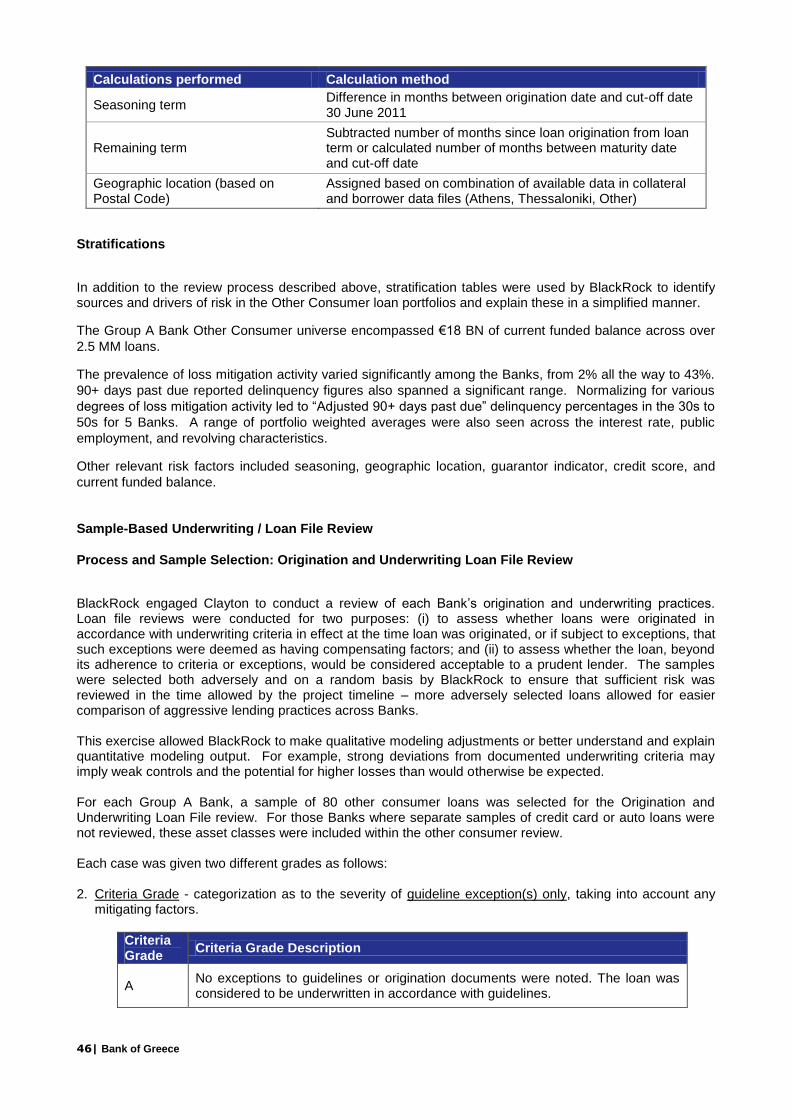
46| Bank of Greece
Calculations performed Calculation method
Seasoning term Difference in months between origination date and cut-off date 30 June 2011
Remaining term Subtracted number of months since loan origination from loan term or calculated number of months between maturity date and cut-off date
Geographic location (based on Postal Code)
Assigned based on combination of available data in collateral and borrower data files (Athens, Thessaloniki, Other)
Stratifications
In addition to the review process described above, stratification tables were used by BlackRock to identify sources and drivers of risk in the Other Consumer loan portfolios and explain these in a simplified manner.
The Group A Bank Other Consumer universe encompassed €18 BN of current funded balance across over
2.5 MM loans.
The prevalence of loss mitigation activity varied significantly among the Banks, from 2% all the way to 43%.
90+ days past due reported delinquency figures also spanned a significant range. Normalizing for various
degrees of loss mitigation activity led to “Adjusted 90+ days past due” delinquency percentages in the 30s to
50s for 5 Banks. A range of portfolio weighted averages were also seen across the interest rate, public
employment, and revolving characteristics.
Other relevant risk factors included seasoning, geographic location, guarantor indicator, credit score, and
current funded balance.
Sample-Based Underwriting / Loan File Review
Process and Sample Selection: Origination and Underwriting Loan File Review
BlackRock engaged Clayton to conduct a review of each Bank’s origination and underwriting practices. Loan file reviews were conducted for two purposes: (i) to assess whether loans were originated in accordance with underwriting criteria in effect at the time loan was originated, or if subject to exceptions, that such exceptions were deemed as having compensating factors; and (ii) to assess whether the loan, beyond its adherence to criteria or exceptions, would be considered acceptable to a prudent lender. The samples were selected both adversely and on a random basis by BlackRock to ensure that sufficient risk was reviewed in the time allowed by the project timeline – more adversely selected loans allowed for easier comparison of aggressive lending practices across Banks. This exercise allowed BlackRock to make qualitative modeling adjustments or better understand and explain quantitative modeling output. For example, strong deviations from documented underwriting criteria may imply weak controls and the potential for higher losses than would otherwise be expected. For each Group A Bank, a sample of 80 other consumer loans was selected for the Origination and Underwriting Loan File review. For those Banks where separate samples of credit card or auto loans were not reviewed, these asset classes were included within the other consumer review. Each case was given two different grades as follows: 2. Criteria Grade - categorization as to the severity of guideline exception(s) only, taking into account any
mitigating factors.
Criteria Grade
Criteria Grade Description
A No exceptions to guidelines or origination documents were noted. The loan was considered to be underwritten in accordance with guidelines.
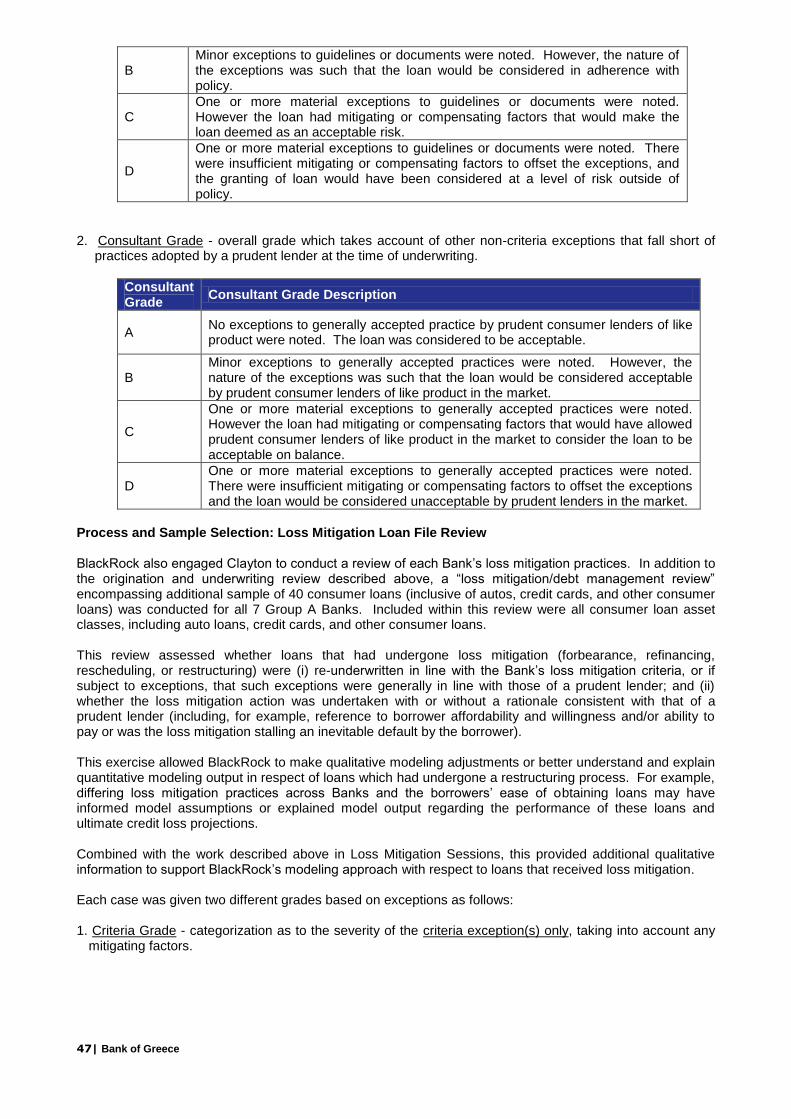
47| Bank of Greece
B Minor exceptions to guidelines or documents were noted. However, the nature of the exceptions was such that the loan would be considered in adherence with policy.
C One or more material exceptions to guidelines or documents were noted. However the loan had mitigating or compensating factors that would make the loan deemed as an acceptable risk.
D
One or more material exceptions to guidelines or documents were noted. There were insufficient mitigating or compensating factors to offset the exceptions, and the granting of loan would have been considered at a level of risk outside of policy.
2. Consultant Grade - overall grade which takes account of other non-criteria exceptions that fall short of
practices adopted by a prudent lender at the time of underwriting.
Consultant Grade
Consultant Grade Description
A No exceptions to generally accepted practice by prudent consumer lenders of like product were noted. The loan was considered to be acceptable.
B Minor exceptions to generally accepted practices were noted. However, the nature of the exceptions was such that the loan would be considered acceptable by prudent consumer lenders of like product in the market.
C
One or more material exceptions to generally accepted practices were noted. However the loan had mitigating or compensating factors that would have allowed prudent consumer lenders of like product in the market to consider the loan to be acceptable on balance.
D One or more material exceptions to generally accepted practices were noted. There were insufficient mitigating or compensating factors to offset the exceptions and the loan would be considered unacceptable by prudent lenders in the market.
Process and Sample Selection: Loss Mitigation Loan File Review
BlackRock also engaged Clayton to conduct a review of each Bank’s loss mitigation practices. In addition to the origination and underwriting review described above, a “loss mitigation/debt management review” encompassing additional sample of 40 consumer loans (inclusive of autos, credit cards, and other consumer loans) was conducted for all 7 Group A Banks. Included within this review were all consumer loan asset classes, including auto loans, credit cards, and other consumer loans. This review assessed whether loans that had undergone loss mitigation (forbearance, refinancing, rescheduling, or restructuring) were (i) re-underwritten in line with the Bank’s loss mitigation criteria, or if subject to exceptions, that such exceptions were generally in line with those of a prudent lender; and (ii) whether the loss mitigation action was undertaken with or without a rationale consistent with that of a prudent lender (including, for example, reference to borrower affordability and willingness and/or ability to pay or was the loss mitigation stalling an inevitable default by the borrower). This exercise allowed BlackRock to make qualitative modeling adjustments or better understand and explain quantitative modeling output in respect of loans which had undergone a restructuring process. For example, differing loss mitigation practices across Banks and the borrowers’ ease of obtaining loans may have informed model assumptions or explained model output regarding the performance of these loans and ultimate credit loss projections. Combined with the work described above in Loss Mitigation Sessions, this provided additional qualitative information to support BlackRock’s modeling approach with respect to loans that received loss mitigation. Each case was given two different grades based on exceptions as follows: 1. Criteria Grade - categorization as to the severity of the criteria exception(s) only, taking into account any
mitigating factors.
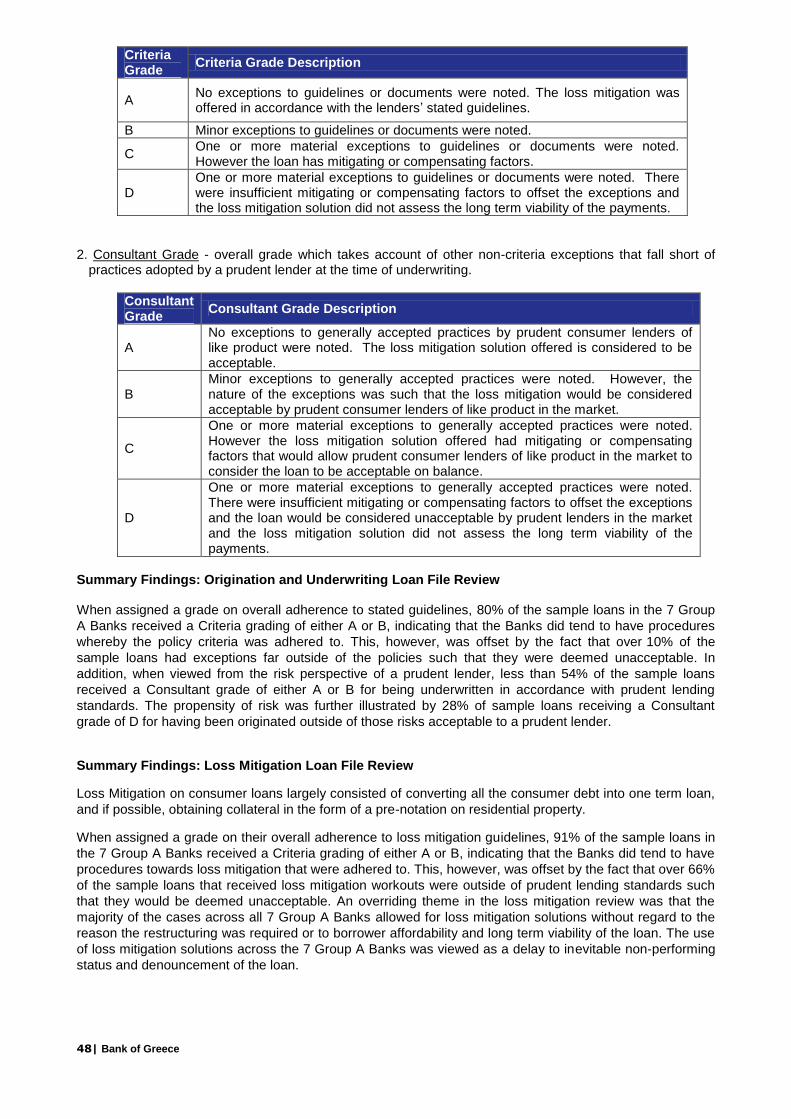
48| Bank of Greece
Criteria Grade
Criteria Grade Description
A No exceptions to guidelines or documents were noted. The loss mitigation was offered in accordance with the lenders’ stated guidelines.
B Minor exceptions to guidelines or documents were noted.
C One or more material exceptions to guidelines or documents were noted. However the loan has mitigating or compensating factors.
D One or more material exceptions to guidelines or documents were noted. There were insufficient mitigating or compensating factors to offset the exceptions and the loss mitigation solution did not assess the long term viability of the payments.
2. Consultant Grade - overall grade which takes account of other non-criteria exceptions that fall short of
practices adopted by a prudent lender at the time of underwriting.
Consultant Grade
Consultant Grade Description
A No exceptions to generally accepted practices by prudent consumer lenders of like product were noted. The loss mitigation solution offered is considered to be acceptable.
B Minor exceptions to generally accepted practices were noted. However, the nature of the exceptions was such that the loss mitigation would be considered acceptable by prudent consumer lenders of like product in the market.
C
One or more material exceptions to generally accepted practices were noted. However the loss mitigation solution offered had mitigating or compensating factors that would allow prudent consumer lenders of like product in the market to consider the loan to be acceptable on balance.
D
One or more material exceptions to generally accepted practices were noted. There were insufficient mitigating or compensating factors to offset the exceptions and the loan would be considered unacceptable by prudent lenders in the market and the loss mitigation solution did not assess the long term viability of the payments.
Summary Findings: Origination and Underwriting Loan File Review
When assigned a grade on overall adherence to stated guidelines, 80% of the sample loans in the 7 Group
A Banks received a Criteria grading of either A or B, indicating that the Banks did tend to have procedures
whereby the policy criteria was adhered to. This, however, was offset by the fact that over 10% of the
sample loans had exceptions far outside of the policies such that they were deemed unacceptable. In
addition, when viewed from the risk perspective of a prudent lender, less than 54% of the sample loans
received a Consultant grade of either A or B for being underwritten in accordance with prudent lending
standards. The propensity of risk was further illustrated by 28% of sample loans receiving a Consultant
grade of D for having been originated outside of those risks acceptable to a prudent lender.
Summary Findings: Loss Mitigation Loan File Review
Loss Mitigation on consumer loans largely consisted of converting all the consumer debt into one term loan,
and if possible, obtaining collateral in the form of a pre-notation on residential property.
When assigned a grade on their overall adherence to loss mitigation guidelines, 91% of the sample loans in
the 7 Group A Banks received a Criteria grading of either A or B, indicating that the Banks did tend to have
procedures towards loss mitigation that were adhered to. This, however, was offset by the fact that over 66%
of the sample loans that received loss mitigation workouts were outside of prudent lending standards such
that they would be deemed unacceptable. An overriding theme in the loss mitigation review was that the
majority of the cases across all 7 Group A Banks allowed for loss mitigation solutions without regard to the
reason the restructuring was required or to borrower affordability and long term viability of the loan. The use
of loss mitigation solutions across the 7 Group A Banks was viewed as a delay to inevitable non-performing
status and denouncement of the loan.

49| Bank of Greece
Group B Banks
Due to the compressed timeline afforded to perform the Diagnostic Assessment, BlackRock employed a modified approach to evaluating the Group B Bank portfolios. Additional due diligence meetings and loan file sample reviews were not performed for these Banks. The Group B Bank AQR process focused on an introductory due diligence meeting and a modified data management and stratification process.
Group B Due Diligence
An initial Deep Dive meeting was held with business unit managers covering origination channels, product design, underwriting, and servicing practices for each Group B Bank during September. The goal of this meeting was to acquaint BlackRock with each Bank’s portfolios and practices. Topics broadly addressed during the meetings included:
Background and Lender Profile
Origination Strategy and Product Composition
Collateral Valuation
Underwriting Guidelines and Criteria
Compliance, Quality Control, and Risk Management
Systems and Technology
Servicing/Collections and Arrears Management
Loss Mitigation Strategies, Practices, and Procedures
Loan Denouncement and the Auction Process
Group B Portfolio Data Collection
Data was supplied by each of the Banks in a format stipulated by BlackRock as of 30 June 2011 reference date. This request took one of two forms, depending on the size of the Bank’s residential mortgage and consumer loan portfolios. Of the 11 Group B Banks, 5 were requested to provide loan-level data in the same format as the Group A Banks, as these Banks had aggregate consumer products portfolio exposure in excess of €500 MM. Each of these Banks was also asked to submit basic balance reconciliation data to aid BlackRock in confirming the general accuracy of data file balances. These 5 Banks were: Millennium, Credicom, Geniki, Attica, and T Bank. Five Banks were requested to provide a single aggregate portfolio representation per asset class, or “Rep Line”, for each relevant portfolio of residential mortgages, credit cards, auto loans, and other consumer loans. The data included weighted average and other portfolio characteristics selected by BlackRock to be used as CLP model inputs. Meetings and conference calls were held, and emails exchanged, with all 10 relevant Group B Banks as necessary to address questions or issues concerning the specific data requests between October and December.
Group B Portfolio Stratification and Risk Analysis
Summary stratification tables in a standard output format were produced by BlackRock for each of the 5 Group B Banks providing loan-level data. These reports were reviewed and used by BlackRock to identify portfolio characteristics and risk drivers. Because of time constraints, these reports were not separately shared with the Group B Banks. Separate stratification and data gap reports were not produced for the 5 Banks providing only single aggregate portfolio representations per asset class. Where necessary, communications were made or calls held with each Bank to seek clarification regarding specific inconsistencies or other issues identified by BlackRock. These concerns were addressed by the Banks to the extent practical, given the compressed time frame during which this analysis was conducted.

50| Bank of Greece
Group B Data Assumptions
The Banks’ data submission varied in completeness and quality of the requested data. In order to cope with
missing or potentially erroneous data, BlackRock made assumptions in instances where data was missing
on a case-by-case basis. Assumptions made for Group B Banks were similar to those made for Group A
Banks, and were often based on Bank portfolio weighted averages, or in some cases, may be based on
universe weighted averages for all Banks.
51| Bank of Greece
Consumer Loan Products - Methodology
Group A Banks Methodology Overview BlackRock’s Consumer Products methodology employed a suite of econometric behavioral models calibrated to Greek economic factors and Greek loan portfolio data. The objective of the modeling framework was to project cashflows and principal losses based on expectations for borrower prepayment, delinquency, default, and ultimate loss severity. BlackRock was provided with loan-level data files for Consumer Products portfolios from all Group A Banks as of the 30 June 2011 reference date (“Cross-Sectional Data”). The Consumer Products model can be considered as comprising 3 sub-models:
o Credit Cards
o Auto Loans
o Other Consumer Loans
As shown in Figure 21 on the following page, BlackRock’s Consumer Product Model was based on statistical relationships inferred from Cross-Sectional Data, historical loan data (as provided by three of the Group A Banks), and non-performing loan (“NPL”) information provided by the Central Bank. The Cross-Sectional Data was analyzed and used to populate a database of collateral attributes, which formed the basis of a cross sectional regression-based statistical analysis that derived model coefficients for those borrower-specific and loan-specific attributes with the greatest predictive power.
14
Given low Variance Inflation Factors (VIF statistics used to test for multicollinearity) across the Consumer model coefficients, the historical loan data provided by 3 of the Banks ultimately was not used to derive model coefficients. All factors included in the models exhibited economic and statistical significance, and these significant factors differed by asset type. Each Bank’s data extract (i.e., the data file containing the list of loans to be analyzed) was prepared for analysis via a cohorting process. This step allowed the models to operate more efficiently by reducing the number of discrete line items that needed to be processed, while maintaining the integrity and granularity of the model. These cohorts were subsequently analyzed through an asset specific cashflow model loaded with the outputs from the regression analysis and forward looking macroeconomic assumptions in order to project cashflows and losses. The following diagram depicts the high-level schematic of BlackRock’s Consumer Products modeling process. The following pages delve into greater detail on each step of this modeling process.
14
The model factors derived through statistical techniques do not denote causality. Rather, the factors relay information relating to the propensity of a borrower to behave in a certain way. In other words, it is not because a borrower is a private sector worker that he will default – the cause may be something else such as unemployment or divorce. Rather, the fact that the borrower is a private sector worker does increase his chances of defaulting relative to another borrower who is a public sector worker.
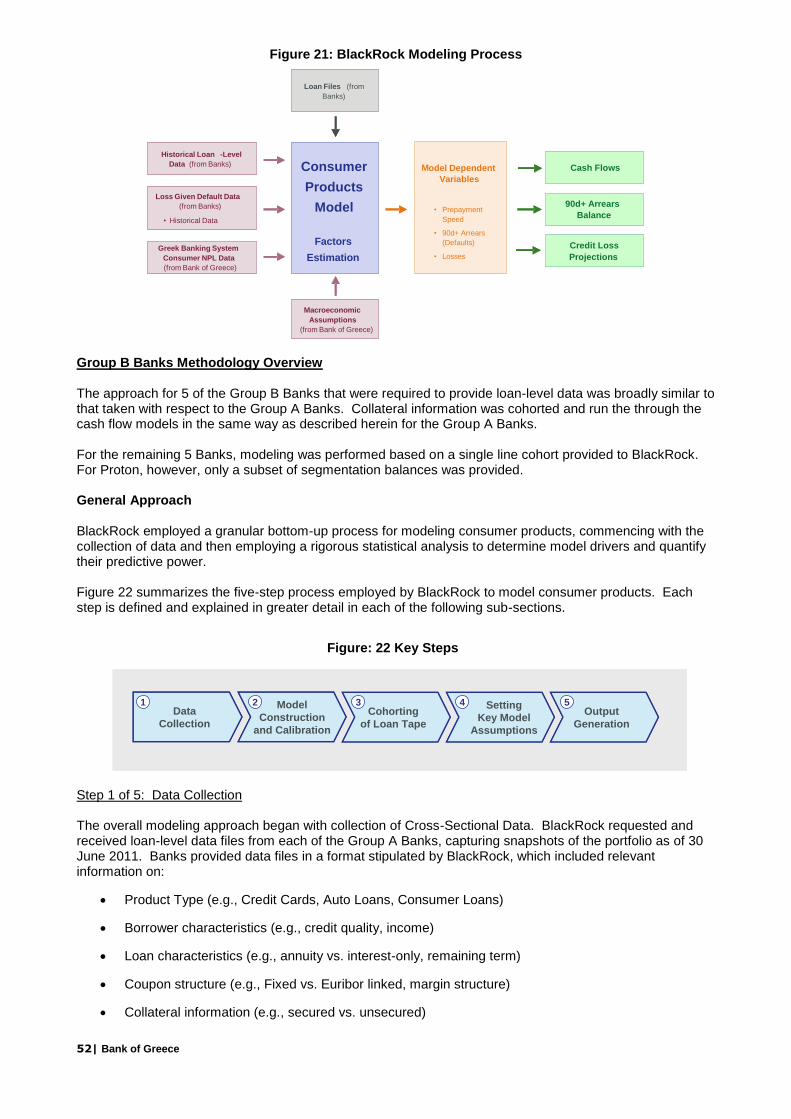
52| Bank of Greece
Figure 21: BlackRock Modeling Process
Group B Banks Methodology Overview The approach for 5 of the Group B Banks that were required to provide loan-level data was broadly similar to that taken with respect to the Group A Banks. Collateral information was cohorted and run the through the cash flow models in the same way as described herein for the Group A Banks. For the remaining 5 Banks, modeling was performed based on a single line cohort provided to BlackRock. For Proton, however, only a subset of segmentation balances was provided. General Approach BlackRock employed a granular bottom-up process for modeling consumer products, commencing with the collection of data and then employing a rigorous statistical analysis to determine model drivers and quantify their predictive power. Figure 22 summarizes the five-step process employed by BlackRock to model consumer products. Each step is defined and explained in greater detail in each of the following sub-sections.
Step 1 of 5: Data Collection The overall modeling approach began with collection of Cross-Sectional Data. BlackRock requested and received loan-level data files from each of the Group A Banks, capturing snapshots of the portfolio as of 30 June 2011. Banks provided data files in a format stipulated by BlackRock, which included relevant information on:
Product Type (e.g., Credit Cards, Auto Loans, Consumer Loans)
Borrower characteristics (e.g., credit quality, income)
Loan characteristics (e.g., annuity vs. interest-only, remaining term)
Coupon structure (e.g., Fixed vs. Euribor linked, margin structure)
Collateral information (e.g., secured vs. unsecured)
Historical Loan -Level
Data (from Banks)
Greek Banking System
Consumer NPL Data
(from Solar)
Loan Files (from
Banks)
Macroeconomic
Assumptions
(from Solar)
Model Dependent
Variables
• Prepayment
Speed
• 90d+ Arrears
(Defaults)
• Losses
Loss Given Default Data
(from Banks)
Consumer
Products
Model
Factors
Estimation
• Historical Data
Cash Flows
90d+ Arrears
Balance
Credit Loss
Projections
Historical Loan -Level
Data (from Banks)
Greek Banking System
Consumer NPL Data
(from Bank of Greece)
Loan Files (from
Banks)
Macroeconomic
Assumptions
(from Bank of Greece)
Model Dependent
Variables
• Prepayment
Speed
• 90d+ Arrears
(Defaults)
• Losses
Loss Given Default Data
(from Banks)
Consumer
Products
Model
Factors
Estimation
• Historical Data
Cash Flows
90d+ Arrears
Balance
Credit Loss
Projections
Data
Collection
1 Model
Construction
and Calibration
2Cohorting
of Loan Tape
3 Setting
Key Model
Assumptions
4Output
Generation
5
Figure 2 – Key Steps
Data
Collection
1Data
Collection
1 Model
Construction
and Calibration
2 Model
Construction
and Calibration
2Cohorting
of Loan Tape
3Cohorting
of Loan Tape
3 Setting
Key Model
Assumptions
4 Setting
Key Model
Assumptions
4Output
Generation
5Output
Generation
5
Figure 2 – Key StepsFigure: 22 Key Steps
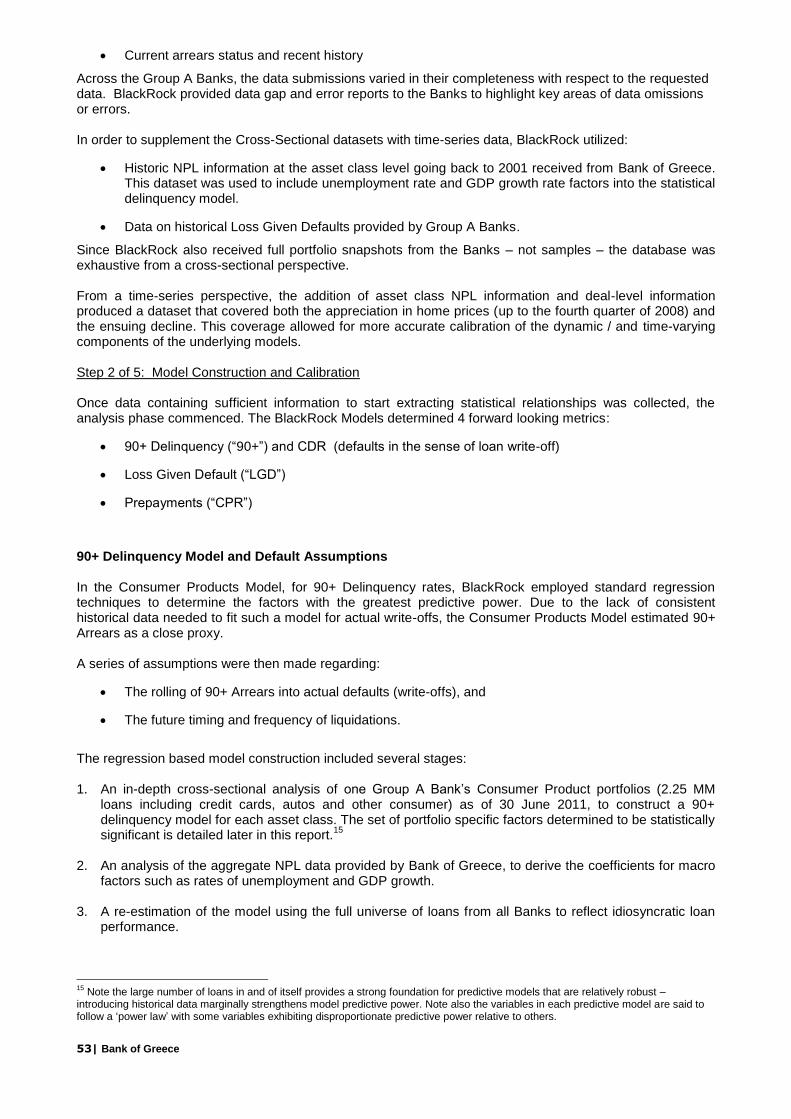
53| Bank of Greece
Current arrears status and recent history
Across the Group A Banks, the data submissions varied in their completeness with respect to the requested data. BlackRock provided data gap and error reports to the Banks to highlight key areas of data omissions or errors. In order to supplement the Cross-Sectional datasets with time-series data, BlackRock utilized:
Historic NPL information at the asset class level going back to 2001 received from Bank of Greece. This dataset was used to include unemployment rate and GDP growth rate factors into the statistical delinquency model.
Data on historical Loss Given Defaults provided by Group A Banks.
Since BlackRock also received full portfolio snapshots from the Banks – not samples – the database was exhaustive from a cross-sectional perspective. From a time-series perspective, the addition of asset class NPL information and deal-level information produced a dataset that covered both the appreciation in home prices (up to the fourth quarter of 2008) and the ensuing decline. This coverage allowed for more accurate calibration of the dynamic / and time-varying components of the underlying models. Step 2 of 5: Model Construction and Calibration Once data containing sufficient information to start extracting statistical relationships was collected, the analysis phase commenced. The BlackRock Models determined 4 forward looking metrics:
90+ Delinquency (“90+”) and CDR (defaults in the sense of loan write-off)
Loss Given Default (“LGD”)
Prepayments (“CPR”)
90+ Delinquency Model and Default Assumptions In the Consumer Products Model, for 90+ Delinquency rates, BlackRock employed standard regression techniques to determine the factors with the greatest predictive power. Due to the lack of consistent historical data needed to fit such a model for actual write-offs, the Consumer Products Model estimated 90+ Arrears as a close proxy. A series of assumptions were then made regarding:
The rolling of 90+ Arrears into actual defaults (write-offs), and
The future timing and frequency of liquidations.
The regression based model construction included several stages: 1. An in-depth cross-sectional analysis of one Group A Bank’s Consumer Product portfolios (2.25 MM
loans including credit cards, autos and other consumer) as of 30 June 2011, to construct a 90+ delinquency model for each asset class. The set of portfolio specific factors determined to be statistically significant is detailed later in this report.
15
2. An analysis of the aggregate NPL data provided by Bank of Greece, to derive the coefficients for macro
factors such as rates of unemployment and GDP growth. 3. A re-estimation of the model using the full universe of loans from all Banks to reflect idiosyncratic loan
performance.
15
Note the large number of loans in and of itself provides a strong foundation for predictive models that are relatively robust – introducing historical data marginally strengthens model predictive power. Note also the variables in each predictive model are said to follow a ‘power law’ with some variables exhibiting disproportionate predictive power relative to others.
54| Bank of Greece
Specifically, because these measures are always between 0 and 100%, model outputs were fitted using a logistic regression which assumed that relevant data were fitted to a logistic function or curve as per the following formula:
f(z) = 1 / (1 + exp(-z))
z = β 0 + β1x1 + βx2 + β3x3 + … + βnxn
where β1… βn are the regression coefficients of the independent factor variables x1… xn
This statistical modeling technique - key to developing predictive models of the sort used by BlackRock in this project - is a standard technique in BlackRock’s suite of US, UK and Irish mortgage and consumer models. Although the above relationship appears very different from a linear regression, the interpretation is similar. In addition to always being between 0 and 100%, the other difference between the above and a linear relationship, is that the factors have multiplicative (instead of additive) effects on the dependent variable. In addition to finding sensitivities, the process that estimated the relationship above also produced standard error and covariance estimates, which allowed BlackRock to perform tests of parameter significance and model stability. The following figure lists the factors that were found to be both statistically and economically significant for predicting borrower behavior for Credit Cards, Auto Loans and Other Consumer Loans. If the factor was relevant for the given model, the sign of influence (correlation) was provided. As one would expect there was a large amount of overlap between the asset classes although the strength of the indicating factor was not always constant. The following table provides detailed description of the factors:
Figure 23: Consumer Loan Model Factors
Credit Cards
Importance Rank Model Factor Correlation with 90+ Wald Chi-Square Prob > ChiSq VIF
1 Seasoning not monotonic 181,460.9 <.0001 1.09
2 Original Limit negative 146,608.8 <.0001 1.73
3 Current Funded Balance positive 46,642.3 <.0001 1.73
4 Employed: Pensioner Indicator positive 5,595.6 <.0001 1.07
Employed: Other Employment positive 1,117.2 <.0001 1.14
Employed: Self-Emp/Freelancer Indicator positive 14,474.7 <.0001 1.19
5 Credit Score negative 12,035.4 <.0001 1.12
6 Borrower In Athens Indicator negative 4,189.9 <.0001 1.17
Borrower In Thessaloniki Indicator negative 201.6 <.0001 1.15
7 Guarantee Indicator (non-government) negative 232.8 <.0001 1.02
Auto Loans
Importance Rank Model Factor Correlation with 90+ Wald Chi-Square Prob > ChiSq VIF
1 Seasoning positive 19,210.6 <.0001 1.12
2 Current Funded Balance positive 11,147.1 <.0001 1.07
3 Employed: Public Sector Indicator negative 411.2 <.0001 1.31
Employed: Other Indicator positive 140.9 <.0001 1.32
Employed: Self-Emp/Freelancer Indicator positive 118.3 <.0001 1.38
Employed: Pensioner Indicator positive 11.9 0.0006 1.31
4 Borrower Age negative 642.0 <.0001 1.28
5 Guarantee Indicator (non-government) negative 533.4 <.0001 1.08
6 Credit Score negative 207.5 <.0001 1.14
Other Consumer Loans
Importance Rank Model Factor Correlation with 90+ Wald Chi-Square Prob > ChiSq VIF
1 Current Funded Balance positive 21,308.4 <.0001 1.50
2 Credit Score negative 11,900.5 <.0001 1.14
3 Employed: Public Sector Indicator negative 3,440.3 <.0001 1.29
Employed: Other Employment positive 3,304.1 <.0001 1.24
Employed: Self-Emp/Freelancer Indicator positive 7,931.3 <.0001 1.28
4 Revolving Loan negative 8,458.4 <.0001 1.13
5 Guarantee Indicator (non-government) negative 6,525.5 <.0001 1.12
6 Secured Loan positive 4,407.6 <.0001 1.53
7 Borrower In Athens Indicator negative 2,389.7 <.0001 1.02
Consumer Loans M odel
Importance Rank Model Factor Correlation with 90+ T-Stat* Prob > t VIF**
1 GDP Grow th Rate (Lagged 1 quarter) Negative -16.17 0.0000 2.23
2 Unemployment Rate (Lagged 1 quarter) Positive 6.59 0.0000 2.23
* Note that T-stats appear here instead of Chi-Square Stats because linear regressions were performed on the log-odds of the NPL rate. So, if the NPL
for a given asset class at time t was 5%, then we first computed y(t) = ln(5%/(1-5%)) = -2.94. The resultring regression gave coefficients that could be
embedded inside the logistic equation obtained from the loan-level analysis of bank data.
** Since in both regressions, the VIF calculation is obtained by regressing Unemployment on GDP, and vice-versa, the VIF estimates are the same for
both variables.
55| Bank of Greece
Default Assumptions BlackRock estimated default rates by projecting the rate that 90+ delinquencies become written off. The annualized roll rate to default was estimated based on the 12 month loan-level delinquency history provided by the Banks. The analysis calculated the rate at which loans fell further into delinquency versus remaining either static in any particular delinquency category or re-performing. The rate at which delinquent loans reached 360+ days was then used as a proxy for write-off. The analysis also allowed BlackRock to calculate the ‘Pay rate’ which is an estimate of the cashflows received from delinquent borrowers before ultimate default. Again using the 12 month delinquency history, the loans that remained in the same delinquency category, month on month, were assumed to have made their current payment but were unable to pay their overdue installments. Borrowers that move into a less delinquent category were assumed to have paid two months payments and so on. Specifically, for any loan that is ‘n’ months past due, n+1 months of expected interest and principal was required for such a loan to cure. The 12 month delinquency history provided allowed for the construction of balance weighted transition matrices that summarize the movements between all possible delinquency states. A simple application of matrix algebra allows one to integrate over all of the cure rates (and partial cure rates) of delinquent collateral to obtain a weighted average pay rate. This pay rate will differ between asset classes, and can be non-trivial in magnitude. For portfolios with high delinquency rates, it can represent a significant percentage of realized amortization. Loss Given Default Model
For Consumer Products, the level of recovery is predominantly a function of the Bank’s collection efforts and the borrower’s willingness and ability to repay. As a result, BlackRock requested that the Group A Banks provide historical recovery rate data for each sub-asset class. The consumer loan model predicts ‘realized defaults’ i.e., those loans that have passed the point of no return and are ultimately terminated and written off. Therefore the recovery data needed to be provided based on a similar loan universe excluding recoveries from both:
Re-performing loans
Restructured and Rescheduled loans
Given that there is no concept of foreclosure for unsecured consumer loans the Banks provided data for loans that had passed a particular delinquency point. This was typically 180+ days past due and coincided with the point where the loan was ‘denounced’ or the loan was declared immediately due and payable. Prepayment Assumptions For the Consumer Products Model, prepayments (modeled as Constant Prepayment Rates, CPR) were assumed for Auto Loans and Other Consumer Term Loans. Step 3 of 5: Cohorting of Cutoff Loan Tape By organizing loans with similar attributes into distinct categories, a loan file with hundreds of thousands of loans can be reduced to a few thousand line items, or cohorts, as each of these categories is known, without sacrificing model effectiveness or accuracy. As shown in Figure 24 below, the criteria used to cohort the loans closely matches the model drivers identified in the previous section.

56| Bank of Greece
Cohorting is generally an iterative process, in which a set of criteria is selected, implemented, and tested to ensure that the resulting set of cohorts is sufficiently granular while still operationally functional. Cohorts should generally not be too large, and should include breaks at any points where there are nonlinearities in the behavioral models. This ensures that the specific attributes of a particular set of loans are allowed to stand out and drive model results, and are not muted by ‘averaging out’ important factors. Weighted-average collateral characteristics were calculated for each cohort, for both the factors that drive the cohorting logic, and for those that do not but still appear in the model. These were then used as inputs into the model, which projected cashflows and losses cohort-by-cohort. To get an aggregate view of losses for the entire portfolio, individual cohort results were summed. Consumer Loan Cohorting Within the product specific submodels, cohorts were defined by categories for Revolving (Yes or No), Secured (Yes or No), Employment Type, Seasoning, Current Funded balance, and Loss Mitigation Technique. For each cohort, key metrics were then calculated, including for example WA Seasoning, WA Interest Rate, WA Thessaloniki %, etc. Step 4 of 5: Setting Key Model Assumptions Forward Looking Economic Assumptions For the purposes of the Diagnostic Assessment, BlackRock relied wholly on the macroeconomic scenarios provided by Bank of Greece, each in a Base and a Stress Case to reflect alternative economic outlooks. Recovery Assumptions Usable Recovery data was provided by 4 Banks in the form of annual cohorts stating both the defaulting balance in each year and the realized recoveries observed for each year thereafter. The years covered ranged from 2005 to 2010. An example of the process for Credit Cards is shown below:
Figure 24: Consumer Cohorting Waterfall
Consumer
Portfolio
Consumer Sub Asset Class Cohorting Waterfall
Revolving
Debt
COHORTING
CRITERIA:
Yes
No
Yes
No
Additional
cohorting criteria:
• Seasoning (6 month
buckets)
• Restructured (Yes/No)
• Rescheduled (Yes/No)
• Forbeared (Yes/No)
• Current Funded
Balance (Bucketed by
Notional)
SecuredPublic
Employee
Yes
No
Yes
NoYes
No
Yes
No
Yes
No
Yes
No
Yes
No
Yes
No
Yes
No
Yes
No
Yes
No…
…
…
…
…
…
…
…
…
…
…
…
…
…
…
…
…
…
…
…
…
…
…
…
…
…
…
…
…
…
…
…
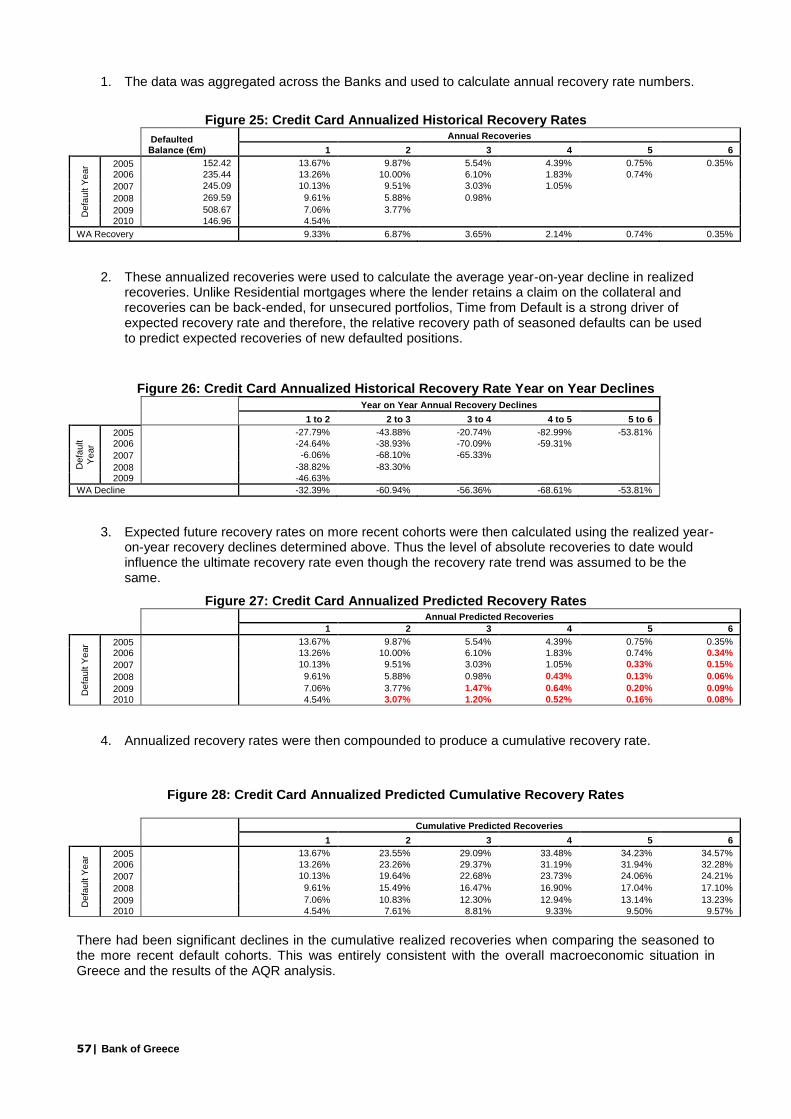
57| Bank of Greece
1. The data was aggregated across the Banks and used to calculate annual recovery rate numbers.
Figure 25: Credit Card Annualized Historical Recovery Rates
Defaulted Balance (€m)
Annual Recoveries
1 2 3 4 5 6
Defa
ult Y
ear 2005 152.42 13.67% 9.87% 5.54% 4.39% 0.75% 0.35%
2006 235.44 13.26% 10.00% 6.10% 1.83% 0.74%
2007 245.09 10.13% 9.51% 3.03% 1.05%
2008 269.59 9.61% 5.88% 0.98%
2009 508.67 7.06% 3.77%
2010 146.96 4.54%
WA Recovery 9.33% 6.87% 3.65% 2.14% 0.74% 0.35%
2. These annualized recoveries were used to calculate the average year-on-year decline in realized recoveries. Unlike Residential mortgages where the lender retains a claim on the collateral and recoveries can be back-ended, for unsecured portfolios, Time from Default is a strong driver of expected recovery rate and therefore, the relative recovery path of seasoned defaults can be used to predict expected recoveries of new defaulted positions.
Figure 26: Credit Card Annualized Historical Recovery Rate Year on Year Declines
Year on Year Annual Recovery Declines
1 to 2 2 to 3 3 to 4 4 to 5 5 to 6
Defa
ult
Year
2005 -27.79% -43.88% -20.74% -82.99% -53.81%
2006 -24.64% -38.93% -70.09% -59.31%
2007 -6.06% -68.10% -65.33%
2008 -38.82% -83.30%
2009 -46.63%
WA Decline -32.39% -60.94% -56.36% -68.61% -53.81%
3. Expected future recovery rates on more recent cohorts were then calculated using the realized year-on-year recovery declines determined above. Thus the level of absolute recoveries to date would influence the ultimate recovery rate even though the recovery rate trend was assumed to be the same.
Figure 27: Credit Card Annualized Predicted Recovery Rates
Annual Predicted Recoveries
1 2 3 4 5 6
Defa
ult Y
ear 2005 13.67% 9.87% 5.54% 4.39% 0.75% 0.35%
2006 13.26% 10.00% 6.10% 1.83% 0.74% 0.34%
2007 10.13% 9.51% 3.03% 1.05% 0.33% 0.15%
2008 9.61% 5.88% 0.98% 0.43% 0.13% 0.06%
2009 7.06% 3.77% 1.47% 0.64% 0.20% 0.09%
2010 4.54% 3.07% 1.20% 0.52% 0.16% 0.08%
4. Annualized recovery rates were then compounded to produce a cumulative recovery rate.
Figure 28: Credit Card Annualized Predicted Cumulative Recovery Rates
Cumulative Predicted Recoveries
1 2 3 4 5 6
Defa
ult Y
ear 2005 13.67% 23.55% 29.09% 33.48% 34.23% 34.57%
2006 13.26% 23.26% 29.37% 31.19% 31.94% 32.28%
2007 10.13% 19.64% 22.68% 23.73% 24.06% 24.21%
2008 9.61% 15.49% 16.47% 16.90% 17.04% 17.10%
2009 7.06% 10.83% 12.30% 12.94% 13.14% 13.23%
2010 4.54% 7.61% 8.81% 9.33% 9.50% 9.57%
There had been significant declines in the cumulative realized recoveries when comparing the seasoned to the more recent default cohorts. This was entirely consistent with the overall macroeconomic situation in Greece and the results of the AQR analysis.
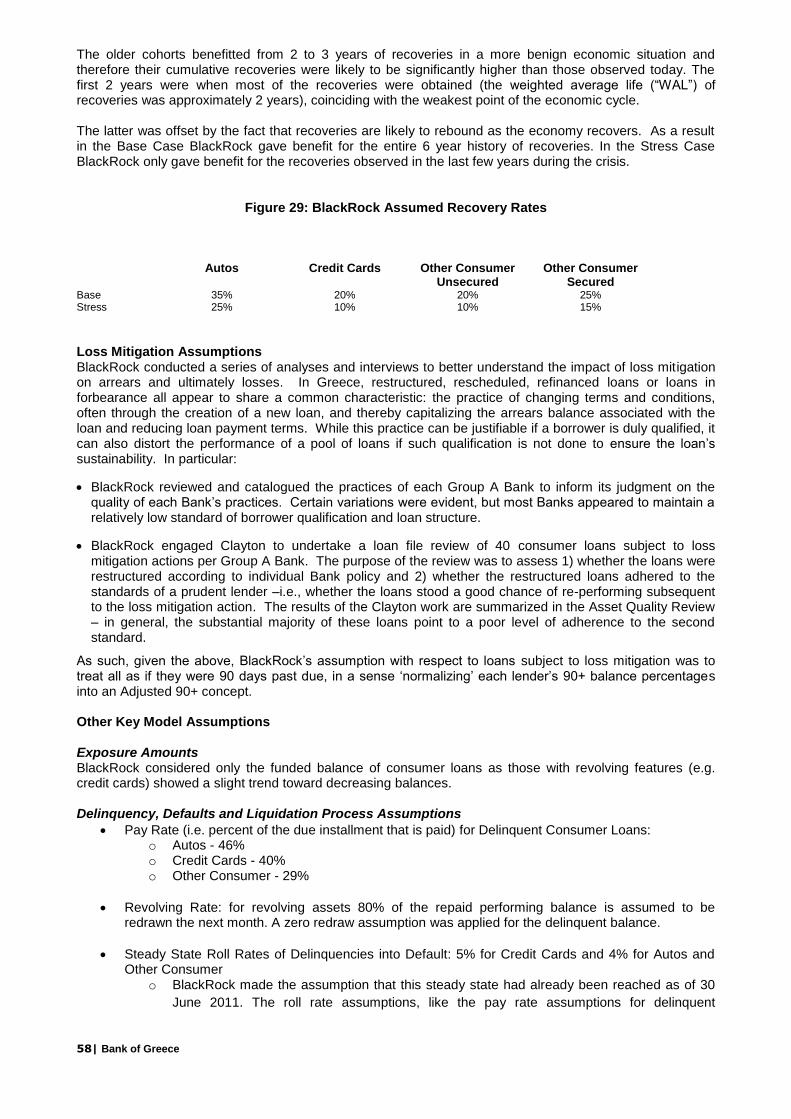
58| Bank of Greece
The older cohorts benefitted from 2 to 3 years of recoveries in a more benign economic situation and therefore their cumulative recoveries were likely to be significantly higher than those observed today. The first 2 years were when most of the recoveries were obtained (the weighted average life (“WAL”) of recoveries was approximately 2 years), coinciding with the weakest point of the economic cycle. The latter was offset by the fact that recoveries are likely to rebound as the economy recovers. As a result in the Base Case BlackRock gave benefit for the entire 6 year history of recoveries. In the Stress Case BlackRock only gave benefit for the recoveries observed in the last few years during the crisis.
Figure 29: BlackRock Assumed Recovery Rates
Autos Credit Cards Other Consumer Unsecured
Other Consumer Secured
Base 35% 20% 20% 25% Stress 25% 10% 10% 15%
Loss Mitigation Assumptions BlackRock conducted a series of analyses and interviews to better understand the impact of loss mitigation on arrears and ultimately losses. In Greece, restructured, rescheduled, refinanced loans or loans in forbearance all appear to share a common characteristic: the practice of changing terms and conditions, often through the creation of a new loan, and thereby capitalizing the arrears balance associated with the loan and reducing loan payment terms. While this practice can be justifiable if a borrower is duly qualified, it can also distort the performance of a pool of loans if such qualification is not done to ensure the loan’s sustainability. In particular:
BlackRock reviewed and catalogued the practices of each Group A Bank to inform its judgment on the quality of each Bank’s practices. Certain variations were evident, but most Banks appeared to maintain a relatively low standard of borrower qualification and loan structure.
BlackRock engaged Clayton to undertake a loan file review of 40 consumer loans subject to loss mitigation actions per Group A Bank. The purpose of the review was to assess 1) whether the loans were restructured according to individual Bank policy and 2) whether the restructured loans adhered to the standards of a prudent lender –i.e., whether the loans stood a good chance of re-performing subsequent to the loss mitigation action. The results of the Clayton work are summarized in the Asset Quality Review – in general, the substantial majority of these loans point to a poor level of adherence to the second standard.
As such, given the above, BlackRock’s assumption with respect to loans subject to loss mitigation was to treat all as if they were 90 days past due, in a sense ‘normalizing’ each lender’s 90+ balance percentages into an Adjusted 90+ concept. Other Key Model Assumptions Exposure Amounts BlackRock considered only the funded balance of consumer loans as those with revolving features (e.g. credit cards) showed a slight trend toward decreasing balances. Delinquency, Defaults and Liquidation Process Assumptions
Pay Rate (i.e. percent of the due installment that is paid) for Delinquent Consumer Loans: o Autos - 46% o Credit Cards - 40% o Other Consumer - 29%
Revolving Rate: for revolving assets 80% of the repaid performing balance is assumed to be redrawn the next month. A zero redraw assumption was applied for the delinquent balance.
Steady State Roll Rates of Delinquencies into Default: 5% for Credit Cards and 4% for Autos and Other Consumer
o BlackRock made the assumption that this steady state had already been reached as of 30
June 2011. The roll rate assumptions, like the pay rate assumptions for delinquent

59| Bank of Greece
collateral, were derived by examining transition matrices based on the 12 month arrears
histories provided in the data submissions. Using amortization rules and matrix algebra,
BlackRock computed the likelihood that a loan, currently 90+ days past due, will ultimately
pay down (either through amortization or prepayments). If this likelihood is x%, then 100-x%
is the expected cumulative default rate for delinquent collateral. Then, BlackRock solved for
the instantaneous (monthly) roll rate from delinquency to default that obtains the same
expected default rate.
Step 5 of 5: Output Generation
Each cohort was individually run through the model, using its weighted average characteristics to determine projections for prepayment, default, delinquency, and loss severity. Once every cohort was run, results were aggregated across cohorts and summed to determine overall portfolio performance. For this analysis, BlackRock focused on the following time horizons: 1-year, 2-year, 3-year, and lifetime. Model output was compared across the Banks to confirm that results reflect BlackRock’s due diligence findings (e.g., Banks with more conservative underwriting and/or more assertive and organised collection efforts should incur lower losses). Model Test Statistics: Rank-Ordering Capability To provide a sense of the Goodness-of-Fit for the model components created by the logistic regression, both the in-sample Concordance and the Somers D Statistics are provided below. Both of these statistics measure the rank-ordering capability of a fitted model:
Goodness-of-fit Statistic (Final Model) Credit Cards
Auto Loans
Other Consumer
% Concordant 80.8% 81.0% 73.4%
Somers' D 62.0% 62.5% 47.0%
Goodness-of-fit Statistic (Cross-Sectional
Out-of-Sample) Credit Cards
Auto Loans
Other Consumer
% Concordant 80.8% 80.7% 73.3%
Somers' D 61.9% 61.9% 46.9% Consumer Loans – Supplemental Information
Seasoning: The amount of time that the loan has been outstanding is a significant factor in all of the consumer models. Unlike all of the other factors listed here, the correlation between seasoning and each of the performance measures changes through time. Loans may begin at fixed or discounted coupon rates. As such, delinquency, default, and prepayment rates naturally start at low levels. As time passes, loans age into delinquency and some ultimately default. At a certain point the propensity to become delinquent begins to reduce as the remaining borrowers have by then expended significant time and money servicing the loan. Existing delinquent loans are purged through time. All of these effects combined imply hump-shaped seasoning vs. default curves.
Current Loan Coupon: The rate of interest paid by a borrower is a factor in the model for two broad reasons. The first is simply that affordability is likely to be lower for a higher loan rate, all else being equal. Secondly, the perceived ‘riskiness’ of a borrower is reflected in the higher interest rate and as such is a proxy for credit risk.
Fixed Rate: Loans on fixed rates have more certainty on their monthly payments and thus typically exhibit slightly lower delinquency rates than floating loans. However as loans end their fixed rate period this factor will fall out of the model.
Credit Scores: The Banks’ own internal credit scores at origination attempt to capture the credit risk of a borrower and are thus unsurprisingly a strong indicator.
Employment Status: The type of employment is a factor in all of the consumer models. Borrowers who are state employees or pensioners are negatively correlated to delinquency with all other employment types positively correlated. This relationship reflects the increased job security enjoyed

60| Bank of Greece
by the public sector and the lower unemployment levels suffered to date given the continued weak economic conditions
Athens Indicator: Geographical location is a factor in the model with borrowers based in Athens or large cities such as Thessaloniki, showing a negative correlation with delinquency. The greater Athens area is the most densely populated, wealthiest and economically active part of Greece. Thus borrowers are likely to be better equipped to withstand the current economic conditions than those living elsewhere in the country.
Original Limit – (Cards) is a negative factor in the model. The original limit offered by a Bank on a credit card is linked to a number of factors, including the annual income and credit score of the borrower. Thus a lower limit indicates a weaker borrower credit.
Current Funded Balance (All) – Current Funded Balance is a positive factor in all of the consumer models and is particularly strong for Autos. For revolving facilities such as credit cards a high utilization rate generally indicates weaker fundamentals as the borrower has to tap his credit card in order to fund their outgoing. In the case of Autos/Other Consumer, the Current Funded Balance is likely to be a driver of delinquency given the resulting higher debt service levels required. In Residential lending this effect is likely overwhelmed by the effect of LTV.
61| Bank of Greece
Corporate Loans (excluding CRE and Shipping Loans) - AQR
Process Overview
BlackRock’s approach to reviewing asset quality and projecting credit losses for the Corporate loan portfolios included the following processes:
i) On-site due diligence meetings with Bank management to conduct a high-level review of the corporate portfolio and a survey of the Bank’s organizational structure, origination practices and strategies, underwriting standards, and loan monitoring practices.
ii) A loan-level review of portfolio data for Group A Banks and a portfolio-level review of Group B Bank exposures, both as of the reference date 30 June 2011.
iii) In-depth manual re-underwriting of a total of 177 borrower exposures representing €14.6 BN of funded balance or €19.0 BN on a total limit basis (“Large Loan Underwriting”). This review included evaluating the quality of the credit files made available to BlackRock, fundamental debt capacity analysis of each of the borrowers in the sample, and discussions with relationship managers at the Banks for the purpose of: (i) clarifying any questions on specific credits, and (ii) forming a qualitative assessment of the relationship managers’ knowledge of their respective credit exposures.
iv) An analysis of historical ratings migration data submitted by the Group A Banks. The resulting ratings migration matrices formed the basis for BlackRock’s transition to default matrices, which were used to project probabilities of default for the CLPs.
v) A review of a wide array of external research and data sources in order to selectively calibrate and inform model projections.
Due Diligence
BlackRock conducted all-day due diligence sessions at each one of the Group A Banks, focusing on the Banks’ Corporate divisions. The objectives of the due diligence meetings were to better understand how these loan portfolios were constructed (internal origination teams, reliance on other Banks’ syndicate desks, divisional or industry focus, geographical focus), the Banks’ credit underwriting philosophy (relationship-driven, credit-driven), credit risk management and monitoring capabilities, and workout/restructuring practices and procedures. The following subjects were specifically addressed during these sessions:
Overall composition and quality of the entire Corporate loan portfolio
Purpose and focus of each lending division
Overall composition and quality of the portfolio for each lending division
Origination, underwriting and credit management policies and procedures and how they differed among different lending divisions, if applicable
Internal credit rating process, credit rating scale and ratings migration history
Discussion of the largest and the most challenging credits within each lending division Additional on-site meetings and telephone interviews were conducted with Bank personnel at each of the lenders on an as-needed basis to assess the relative conservativeness of origination and underwriting practices across the Banks. Additional topics addressed included each Bank’s level of preparedness to address workout/restructuring challenges borne by the economic crisis. BlackRock’s assessment of each Bank’s Corporate loan origination and risk management practices was then cross-checked with information and insight obtained from the Large Loan Underwriting process.
Data Management
Loan-level data as of the 30 June 2011 reference date was supplied by each of the Banks in a format stipulated by BlackRock. Employing a standardized template and format for data submissions ensured that the data supplied was directly comparable across institutions, with (broadly) the same field definitions

62| Bank of Greece
applied for each submitted data field. Data tapes were downloaded from a secure online data exchange (IntraLinks) and on-boarded by BlackRock to a database system. The database system facilitated the organization and harmonization of data across various output formats (e.g., .txt, .xls), the creation of portfolio stratifications and data gap reports, and the implementation of data overrides and assumptions.
Stratifications
Detailed stratification tables in a standard output format were produced by BlackRock and supplied to each of the Banks for confirmation and verification of balances and other key risk factors. This process allowed the Banks to confirm that the data supplied to BlackRock was consistent in size and characteristics with the Banks’ own understanding of their respective portfolios. Inconsistencies were addressed by BlackRock and the Banks to reconcile differences to the extent practical in the limited timeframe during which the analysis was conducted. In addition, the stratification tables enabled BlackRock to identify sources and drivers of risk in the Corporate portfolio and cohort these risk characteristics in a simplified manner. This stratification process also allowed BlackRock to segment the portfolio into broad asset classes for the purposes of analysis and credit loss modeling. In order to apply product-specific loss drivers to each segment of the portfolio, BlackRock separated Commercial Real Estate (“CRE”) and Shipping Loans from other Corporate Loans. The total limit exposure of the Corporate portfolios (exclusive of CRE and Shipping) across all Group A Banks amounted to €41.7 BN, of which €26.2 BN represented funded balances.
Data - Gaps and Errors The data submissions varied in their completeness with respect to the requested data across the Banks. BlackRock provided data gap reports to the Banks to highlight key areas of data incompleteness. BlackRock also provided the Banks with Data Error reports which enabled the Banks to address data errors or omissions in a focused manner. Large Loan Underwriting BlackRock conducted a fundamental credit file review on a selected sample of borrowers across the combined Corporate, Shipping, and CRE portfolios, including State-related exposures, by re-underwriting the individual borrower exposures. The process and the results of this review are further described in the following section.
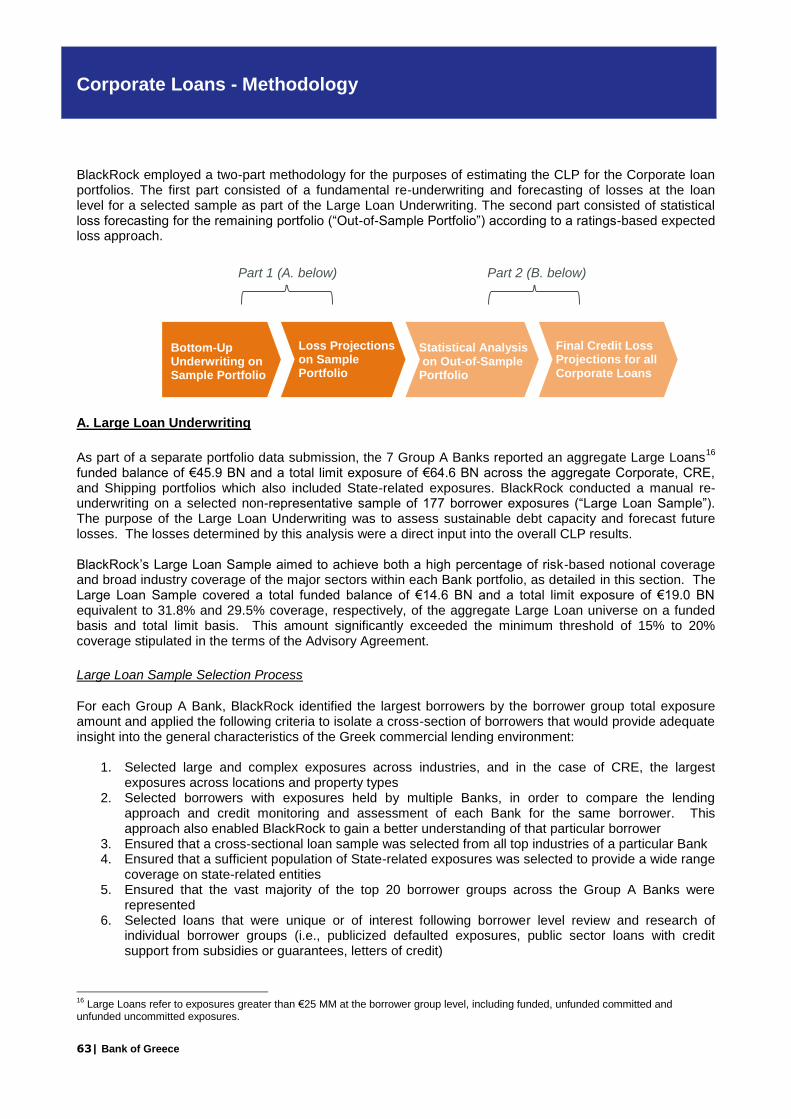
63| Bank of Greece
Corporate Loans - Methodology
BlackRock employed a two-part methodology for the purposes of estimating the CLP for the Corporate loan portfolios. The first part consisted of a fundamental re-underwriting and forecasting of losses at the loan level for a selected sample as part of the Large Loan Underwriting. The second part consisted of statistical loss forecasting for the remaining portfolio (“Out-of-Sample Portfolio”) according to a ratings-based expected loss approach.
A. Large Loan Underwriting
As part of a separate portfolio data submission, the 7 Group A Banks reported an aggregate Large Loans16
funded balance of €45.9 BN and a total limit exposure of €64.6 BN across the aggregate Corporate, CRE, and Shipping portfolios which also included State-related exposures. BlackRock conducted a manual re-underwriting on a selected non-representative sample of 177 borrower exposures (“Large Loan Sample”). The purpose of the Large Loan Underwriting was to assess sustainable debt capacity and forecast future losses. The losses determined by this analysis were a direct input into the overall CLP results. BlackRock’s Large Loan Sample aimed to achieve both a high percentage of risk-based notional coverage and broad industry coverage of the major sectors within each Bank portfolio, as detailed in this section. The Large Loan Sample covered a total funded balance of €14.6 BN and a total limit exposure of €19.0 BN equivalent to 31.8% and 29.5% coverage, respectively, of the aggregate Large Loan universe on a funded basis and total limit basis. This amount significantly exceeded the minimum threshold of 15% to 20% coverage stipulated in the terms of the Advisory Agreement.
Large Loan Sample Selection Process
For each Group A Bank, BlackRock identified the largest borrowers by the borrower group total exposure amount and applied the following criteria to isolate a cross-section of borrowers that would provide adequate insight into the general characteristics of the Greek commercial lending environment:
1. Selected large and complex exposures across industries, and in the case of CRE, the largest exposures across locations and property types
2. Selected borrowers with exposures held by multiple Banks, in order to compare the lending approach and credit monitoring and assessment of each Bank for the same borrower. This approach also enabled BlackRock to gain a better understanding of that particular borrower
3. Ensured that a cross-sectional loan sample was selected from all top industries of a particular Bank 4. Ensured that a sufficient population of State-related exposures was selected to provide a wide range
coverage on state-related entities 5. Ensured that the vast majority of the top 20 borrower groups across the Group A Banks were
represented 6. Selected loans that were unique or of interest following borrower level review and research of
individual borrower groups (i.e., publicized defaulted exposures, public sector loans with credit support from subsidies or guarantees, letters of credit)
16
Large Loans refer to exposures greater than €25 MM at the borrower group level, including funded, unfunded committed and unfunded uncommitted exposures.
Statistical Analysis on Out-of-Sample Portfolio
Loss Projections on Sample Portfolio
Bottom-Up Underwriting on Sample Portfolio
Final Credit Loss Projections for all Corporate Loans
Part 1 (A. below) Part 2 (B. below)

64| Bank of Greece
7. Selected smaller loans (still over €25 MM) from industries less well-represented among the largest exposures (e.g., retail/malls, car dealerships)
8. Selected a mix of performing and non-performing exposures BlackRock’s re-underwriting process included a comprehensive review of the physical (and in some instances, electronic) files made available by the Banks. The files typically included the Bank’s credit reviews, borrower financial information, loan facility and security documents, and relevant third-party collateral valuation reports. BlackRock’s underwriters had the opportunity to engage with the respective relationship manager at the Bank if clarification or further information on selected credits was required. Follow-up discussions were frequently held with the relationship manager via email or in-person. To support the analysis, BlackRock’s underwriters also reviewed publicly available information regarding the borrower. Various sources of industry and market research were employed in supplementing the information provided by the Banks to form an informed opinion with respect to the borrower. Specifically, BlackRock’s re-underwriting process including the following analyses:
• Evaluation of business fundamentals, including current and historical operating performance • Financial projections for the underlying business • Preliminary review of relationship to the State, including state ownership and terms of guarantee
agreements (if applicable) • Estimation of sustainable debt capacity on the basis of estimated free cash flow • Review of the capital structure and comparison of leverage to the estimated sustainable EBITDA
and free cash flow • Analysis of the key risks inherent for each borrower, including financial and operational risks • Review of comparable companies in terms of leverage multiples, enterprise values and pricing,
where available • Liquidation analysis based on collateral value (for exposures which were not deemed a going
concern) • For stressed or distressed credits, an effort was made to understand the Banks’ workout and
restructuring approach • Projection of credit losses, including timing of losses • Compilation of one-page summary credit reports and a BlackRock rating of the exposure. When
more than one Group A Bank was a lender to a particular borrower, a comparison was conducted of the Banks’ respective lending and portfolio management approaches, as well as their respective understanding of the overall credit
For each borrower that was re-underwritten, BlackRock estimated the timing and magnitude of expected
losses. In addition, BlackRock re-rated each borrower exposure based on what it estimated to be the
appropriate current rating, referencing the Moody’s Corporate rating scale. This rating was then compared to
the Banks’ internal credit rating17
for each borrower.
The Banks made available physical files for each borrower in a data room located at the respective Bank’s premises. BlackRock assigned one underwriter as the primary lead for each borrower and was responsible for the underwriting from start to finish. Each underwriting result was then “peer reviewed” by the Commercial team’s leadership committee and the entire underwriting team. Problem credits were further reviewed by a broader team to ensure thoroughness of analysis and quality control. The BlackRock underwriting team consisted of 8 underwriters, each with approximately 10 years of experience in corporate lending, leveraged loans and/or workout and restructuring of distressed portfolios.
17
BlackRock mapped each Banks’ internal rating scale to Moody’s on a highly preliminary basis to provide a comparable reference point for the notch difference to BlackRock’s re-ratings
65| Bank of Greece
B. Statistical Loss Forecasting Ratings-Based Expected Loss Methodology For Out-of-Sample Corporate loans, BlackRock employed a ratings-based expected loss approach, which incorporates exposure at default (“EAD”), probability of default (“PD”) and loss-given-default (“LGD”) as the main parameters in estimating losses over time. The CLP on an individual corporate loan is calculated as follows:
CLP = EAD * PD * LGD For each Group A Bank portfolio, BlackRock derived the PD from five-year default matrices generated from a transition analysis of historical rating migration data provided by the Banks. The default matrices were rebased to the macroeconomic forecasts provided by the Central Bank using estimated coefficients from the historical statistical relationship of GDP to corporate insolvency rates and were also subject to a through-the-cycle adjustment (as further described below). The LGD was derived through a comprehensive bottom-up analysis of tangible collateral data provided at the borrower level as part of a separate data submission by the Banks. Exposure at Default (EAD) The exposure at default represents the entire funded balance exposure and an assessment of the likelihood of future draws on existing Bank commitments in the loan portfolio. In determining the EAD assumptions, BlackRock considered the funded, unfunded-committed and unfunded-uncommitted exposures. The EAD was calculated as follows:
EAD = 100% of the Current Funded Balance + 10% of the Unfunded Committed Balance + 5% of the Unfunded Uncommitted Balance
In addition, if an exposure was currently in default, no further draws on the unfunded balances were assumed Unfunded Committed Balance was defined as an unfunded exposure where the Bank had a commitment to provide funds under the terms of the contract either upon request of the borrower, or, in the case of letter of credits or guarantees, upon request of the beneficiary. Alternatively, Unfunded Uncommitted Balance was defined as an exposure where disbursement of funds is completely at the discretion of the Bank. Furthermore, BlackRock incorporated amortization assumptions based on loan type into the EAD calculation. Specifically, based on loan product analysis, the following amortization assumptions were used:
Corporate, CRE, Leasing and Factoring Loans: 3% per year in the Base case, 2% in Stress case
SME: 2% per annum in the Base case, 1% in the Stress case
Shipping: 6% per year in the Base case, 4% in the Stress case Furthermore, for revolving exposures with missing maturity dates, BlackRock assumed the earliest maturity date of any other term loan extended to the same borrower. For instances where maturity dates were missing altogether, a maturity assumption of 2014 was applied. Probability of Default Analysis BlackRock used a multi-step approach to construct ratings-based probability of default matrices specific to each Bank’s loan portfolio. BlackRock (i) collected and analyzed historical ratings migration data submissions from each Group A Bank, (ii) derived single period ratings transition matrices, (iii) applied normalization adjustments based on an analysis of a reputable third party data provider’s historical default rates for the Greek market and a bank-by-bank comparison of rating processes, (iv) applied a macroeconomic overlay (based on macroeconomic forecasts provided by the Central Bank) to projected ratings transitions and derived Base and Stress transition matrices for each forecast year and (v) derived cumulative and marginal PD matrices in Base and Stress scenarios for each rating category.
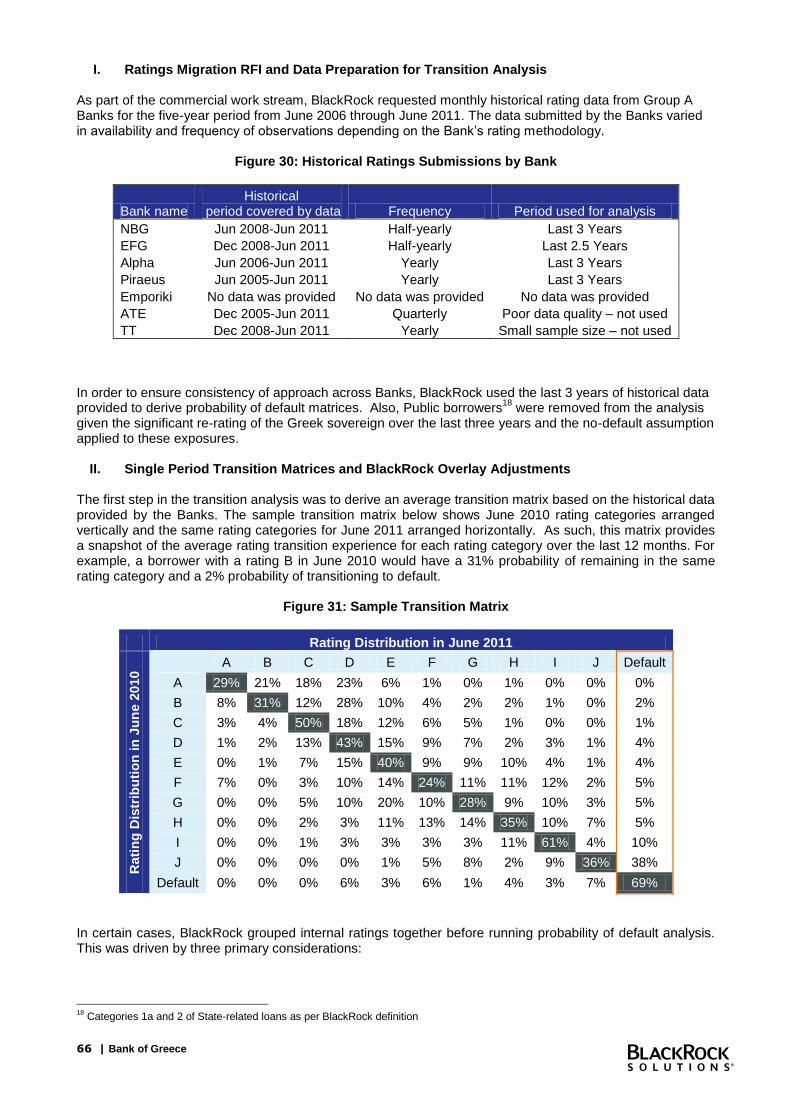
66 | Bank of Greece
I. Ratings Migration RFI and Data Preparation for Transition Analysis
As part of the commercial work stream, BlackRock requested monthly historical rating data from Group A Banks for the five-year period from June 2006 through June 2011. The data submitted by the Banks varied in availability and frequency of observations depending on the Bank’s rating methodology.
Figure 30: Historical Ratings Submissions by Bank
Bank name Historical
period covered by data Frequency Period used for analysis
NBG Jun 2008-Jun 2011 Half-yearly Last 3 Years
EFG Dec 2008-Jun 2011 Half-yearly Last 2.5 Years
Alpha Jun 2006-Jun 2011 Yearly Last 3 Years
Piraeus Jun 2005-Jun 2011 Yearly Last 3 Years
Emporiki No data was provided No data was provided No data was provided
ATE Dec 2005-Jun 2011 Quarterly Poor data quality – not used
TT Dec 2008-Jun 2011 Yearly Small sample size – not used
In order to ensure consistency of approach across Banks, BlackRock used the last 3 years of historical data provided to derive probability of default matrices. Also, Public borrowers
18 were removed from the analysis
given the significant re-rating of the Greek sovereign over the last three years and the no-default assumption applied to these exposures.
II. Single Period Transition Matrices and BlackRock Overlay Adjustments The first step in the transition analysis was to derive an average transition matrix based on the historical data provided by the Banks. The sample transition matrix below shows June 2010 rating categories arranged vertically and the same rating categories for June 2011 arranged horizontally. As such, this matrix provides a snapshot of the average rating transition experience for each rating category over the last 12 months. For example, a borrower with a rating B in June 2010 would have a 31% probability of remaining in the same rating category and a 2% probability of transitioning to default.
Figure 31: Sample Transition Matrix
Rating Distribution in June 2011
Rati
ng
Dis
trib
uti
on
in
Ju
ne 2
010
A B C D E F G H I J Default
A 29% 21% 18% 23% 6% 1% 0% 1% 0% 0% 0%
B 8% 31% 12% 28% 10% 4% 2% 2% 1% 0% 2%
C 3% 4% 50% 18% 12% 6% 5% 1% 0% 0% 1%
D 1% 2% 13% 43% 15% 9% 7% 2% 3% 1% 4%
E 0% 1% 7% 15% 40% 9% 9% 10% 4% 1% 4%
F 7% 0% 3% 10% 14% 24% 11% 11% 12% 2% 5%
G 0% 0% 5% 10% 20% 10% 28% 9% 10% 3% 5%
H 0% 0% 2% 3% 11% 13% 14% 35% 10% 7% 5%
I 0% 0% 1% 3% 3% 3% 3% 11% 61% 4% 10%
J 0% 0% 0% 0% 1% 5% 8% 2% 9% 36% 38%
Default 0% 0% 0% 6% 3% 6% 1% 4% 3% 7% 69%
In certain cases, BlackRock grouped internal ratings together before running probability of default analysis. This was driven by three primary considerations:
18
Categories 1a and 2 of State-related loans as per BlackRock definition

67 | Bank of Greece
i. Ensuring sufficient number of observations in each rating category to derive statistically robust results
ii. Comparing transition experience for each category, potentially grouping categories with the same default experience
iii. Correcting anomalies where a lower rated category had lower default transitions than a better-rated category
In order to ensure consistency across all Banks, the default category was considered an “absorption state”. This means that BlackRock assumed no cure from the default category. The default category included all borrowers classified as defaulted or NPL by the Banks as well as all borrowers which were 90 days plus delinquent, crossed at the borrower level
19 (“BlackRock Adjusted NPL”). BlackRock also reviewed the
concepts of “regulatory” and “loan officer” ratings. A detailed analysis of each Bank’s rating practices showed that Banks do not automatically classify borrowers which are 3 months delinquent as non-performing. Instead, such classification is often at the discretion of the loan or relationship officer and requires the approval of a review committee. In order to account for differences in approach across Banks, BlackRock rebased the transitions to default by a “Default Adjustment”. The “Default Adjustment” was calculated as a ratio of “BlackRock Adjusted NPL” to the Bank Reported NPL category. Bank Reported NPL represents the funded balance of the bank’s default rating bucket only, crossed at the borrower level: In addition to the “Default Adjustment”, BlackRock also applied a through-the-cycle adjustment to account for the fact that the last 3 years experienced elevated levels of default and that default matrices derived from this dataset were likely to overstate future defaults. In order to quantify this adjustment, BlackRock used a third party provider’s historical default data for Greece, which was requested as part of the Diagnostics Assessment. The through-the-cycle adjustment was calculated by taking the ratio of 2000-2010 average default rates to the average default rate for the years of 2008-2010. The resulting ratio of 0.72 was then used to rebase the transitions to default in each Bank’s average transition matrix leading to lower probabilities of default overall. One bank provided only 2.5 years of data. As such, its through-the-cycle adjustment was amended accordingly. The default adjustment and the through-the-cycle adjustment were combined to derive a Total Adjustment Factor applied to the default transitions in each Bank’s transition matrix:
19
All subsequent tables with 90 days + delinquency for the Commercial analysis show the 90+ days delinquency crossed at the borrower level
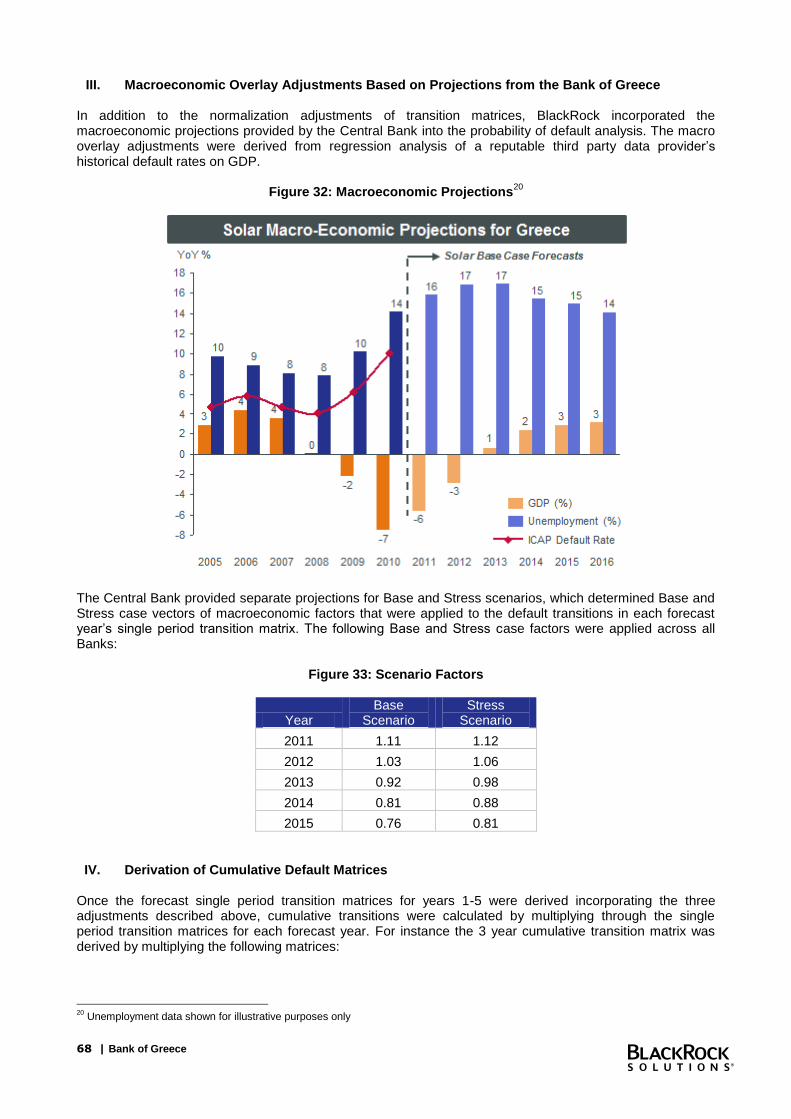
68 | Bank of Greece
III. Macroeconomic Overlay Adjustments Based on Projections from the Bank of Greece In addition to the normalization adjustments of transition matrices, BlackRock incorporated the macroeconomic projections provided by the Central Bank into the probability of default analysis. The macro overlay adjustments were derived from regression analysis of a reputable third party data provider’s historical default rates on GDP.
Figure 32: Macroeconomic Projections20
The Central Bank provided separate projections for Base and Stress scenarios, which determined Base and Stress case vectors of macroeconomic factors that were applied to the default transitions in each forecast year’s single period transition matrix. The following Base and Stress case factors were applied across all Banks:
Figure 33: Scenario Factors
Year Base
Scenario Stress
Scenario
2011 1.11 1.12
2012 1.03 1.06
2013 0.92 0.98
2014 0.81 0.88
2015 0.76 0.81
IV. Derivation of Cumulative Default Matrices
Once the forecast single period transition matrices for years 1-5 were derived incorporating the three adjustments described above, cumulative transitions were calculated by multiplying through the single period transition matrices for each forecast year. For instance the 3 year cumulative transition matrix was derived by multiplying the following matrices:
20
Unemployment data shown for illustrative purposes only
69 | Bank of Greece
Cumulative 3 Year Transition Matrix = Single Period Transition Matrix for Forecast Year 1 x Single Period Transition Matrix for Forecast Year 2 x Single Period Transition Matrix for Forecast Year 3
The cumulative probability of default matrices were derived by taking the probability of transition to the default category in each forecast year’s cumulative transition matrix. The aforementioned default matrices provide default probabilities over the next 5 years. Beyond Year 5, the incremental PD is assumed to be constant until maturity using the Year 5 marginal PD. Loss Given Default (LGD) BlackRock’s analysis focused primarily on tangible collateral, such as real estate, receivables, cash and cash-like financial instruments, which could be liquidated in a borrower event of default. The following section describes the process for the classification and valuation of tangible collateral. A brief discussion of the assumptions relating to guarantees and unsecured exposures follows. Tangible Collateral Valuation BlackRock used a number of information sources to assess the quality of the collateral valuations presented by the Banks. This included a review of internal Bank documentation and manuals, Deep Dive meetings, interviews with loan officers and detailed reviews of loan files selected for the AQR and Large Loan Underwriting processes. BlackRock performed a comprehensive analysis to estimate tangible collateral coverage by borrower, which was used as a direct determinant of LGD. To arrive at tangible collateral coverage, BlackRock performed an analysis to link collateral type and collateral values from the collateral data tape submissions to each contract and borrower from the loan data tape submissions, taking into consideration Bank-specific cross-default mechanism and allocation algorithms. Resulting aggregate values by collateral type were confirmed with each Group A Bank. BlackRock then undertook a value re-basing of real estate -related collateral based on the year the property was last valued by the Bank in order to align collateral values with current market levels. Furthermore, BlackRock applied projected forward value curves to real estate-related collateral value to account for further declines in market valuations anticipated in the next few years. Non real estate-related collateral was subject to haircuts in line with market and Bank practice. Lastly, BlackRock capped the forward value of collateral linked to each contract to the EAD of that contract to derive borrower-specific collateral coverage ratios. The specific steps in assessing tangible collateral values are discussed in more detail below:
I. Linking Tangible Collateral to Each Borrower
Total gross collateral value based on Bank valuations including personal and corporate guarantees and excluding shipping amounted to €261.8 BN as of the 30 June 2011 reference date. Group A Banks held a combined €99.8 BN of tangible collateral for Commercial Loans (ex SBP and Shipping Loans) based on gross Bank values (excluding personal, corporate guarantees) against their total exposure. BlackRock employed an allocation algorithm to link collateral type and collateral values to each contract and borrower, taking into consideration the often-times cross-collateralized nature of borrower exposures. BlackRock then confirmed total aggregate collateral values with each Group A Bank,
BlackRock mapped available collateral data for Commercial Loans (ex SBP and Shipping Loans) to 12 categories to ensure consistency and comparability across the Group A Banks.
II. Rebasing Collateral Values to Current Market Values and Applying Forward Valuation
Haircuts
The Bank-reported real estate collateral values were rebased to current market levels to account for valuation changes since the last appraisal was conducted and were also subject to forward valuation haircuts. In addition, collateral values were further adjusted for syndications, 2
nd liens and double counting.
Gross Group A Bank values of tangible collateral of €99.8 BN were rebased to €71.8 BN by BlackRock. For residential real estate, the historic information from PropIndex was used to rebase values from prior to 2011. To project residential real estate values and determine forward valuation haircuts, home price forecasts provided by the Central Bank were adopted.
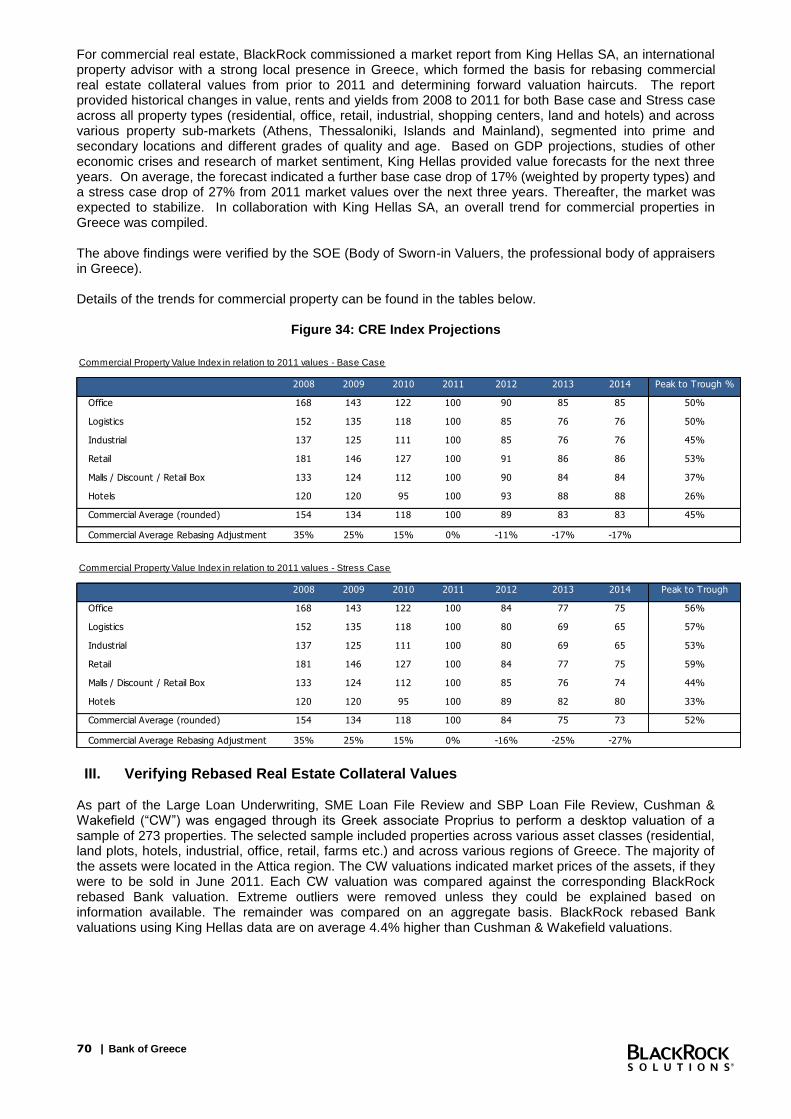
70 | Bank of Greece
For commercial real estate, BlackRock commissioned a market report from King Hellas SA, an international property advisor with a strong local presence in Greece, which formed the basis for rebasing commercial real estate collateral values from prior to 2011 and determining forward valuation haircuts. The report provided historical changes in value, rents and yields from 2008 to 2011 for both Base case and Stress case across all property types (residential, office, retail, industrial, shopping centers, land and hotels) and across various property sub-markets (Athens, Thessaloniki, Islands and Mainland), segmented into prime and secondary locations and different grades of quality and age. Based on GDP projections, studies of other economic crises and research of market sentiment, King Hellas provided value forecasts for the next three years. On average, the forecast indicated a further base case drop of 17% (weighted by property types) and a stress case drop of 27% from 2011 market values over the next three years. Thereafter, the market was expected to stabilize. In collaboration with King Hellas SA, an overall trend for commercial properties in Greece was compiled. The above findings were verified by the SOE (Body of Sworn-in Valuers, the professional body of appraisers in Greece). Details of the trends for commercial property can be found in the tables below.
Figure 34: CRE Index Projections
III. Verifying Rebased Real Estate Collateral Values As part of the Large Loan Underwriting, SME Loan File Review and SBP Loan File Review, Cushman & Wakefield (“CW”) was engaged through its Greek associate Proprius to perform a desktop valuation of a sample of 273 properties. The selected sample included properties across various asset classes (residential, land plots, hotels, industrial, office, retail, farms etc.) and across various regions of Greece. The majority of the assets were located in the Attica region. The CW valuations indicated market prices of the assets, if they were to be sold in June 2011. Each CW valuation was compared against the corresponding BlackRock rebased Bank valuation. Extreme outliers were removed unless they could be explained based on information available. The remainder was compared on an aggregate basis. BlackRock rebased Bank valuations using King Hellas data are on average 4.4% higher than Cushman & Wakefield valuations.
Commercial Property Value Index in relation to 2011 values - Base Case
2008 2009 2010 2011 2012 2013 2014 Peak to Trough %
Office 168 143 122 100 90 85 85 50%
Logistics 152 135 118 100 85 76 76 50%
Industrial 137 125 111 100 85 76 76 45%
Retail 181 146 127 100 91 86 86 53%
Malls / Discount / Retail Box 133 124 112 100 90 84 84 37%
Hotels 120 120 95 100 93 88 88 26%
Commercial Average (rounded) 154 134 118 100 89 83 83 45%
Commercial Average Rebasing Adjustment 35% 25% 15% 0% -11% -17% -17%
Commercial Property Value Index in relation to 2011 values - Stress Case
2008 2009 2010 2011 2012 2013 2014 Peak to Trough
Office 168 143 122 100 84 77 75 56%
Logistics 152 135 118 100 80 69 65 57%
Industrial 137 125 111 100 80 69 65 53%
Retail 181 146 127 100 84 77 75 59%
Malls / Discount / Retail Box 133 124 112 100 85 76 74 44%
Hotels 120 120 95 100 89 82 80 33%
Commercial Average (rounded) 154 134 118 100 84 75 73 52%
Commercial Average Rebasing Adjustment 35% 25% 15% 0% -16% -25% -27%

71 | Bank of Greece
IV. Collateral Haircuts Summary BlackRock rebased collateral valuations to current market levels in order to (i) account for value declines since the last valuation was performed for real estate related collateral and to (ii) estimate realizable market values for non-real estate related collateral. Real estate collateral values were also subject to forward valuation haircuts and haircuts to account for preferred claims and liquidation & enforcement costs. It should be noted that the haircuts are cumulative:
Base Case Cumulative Haircut = 1 – (1 - Rebase) x (1 – Forward Adjustment) x (1 – Preferred
Claims/Liquidation & Enforcement Costs)
For example, the value of a commercial real estate property last valued in 2008 or earlier, was haircut by 35% to account for the estimated historical drop in market value and was further haircut by 17% to account for anticipated value declines. An additional 30% haircut was applied for preferred claims and liquidation & enforcement costs likely to be incurred in a corporate work-out scenario.
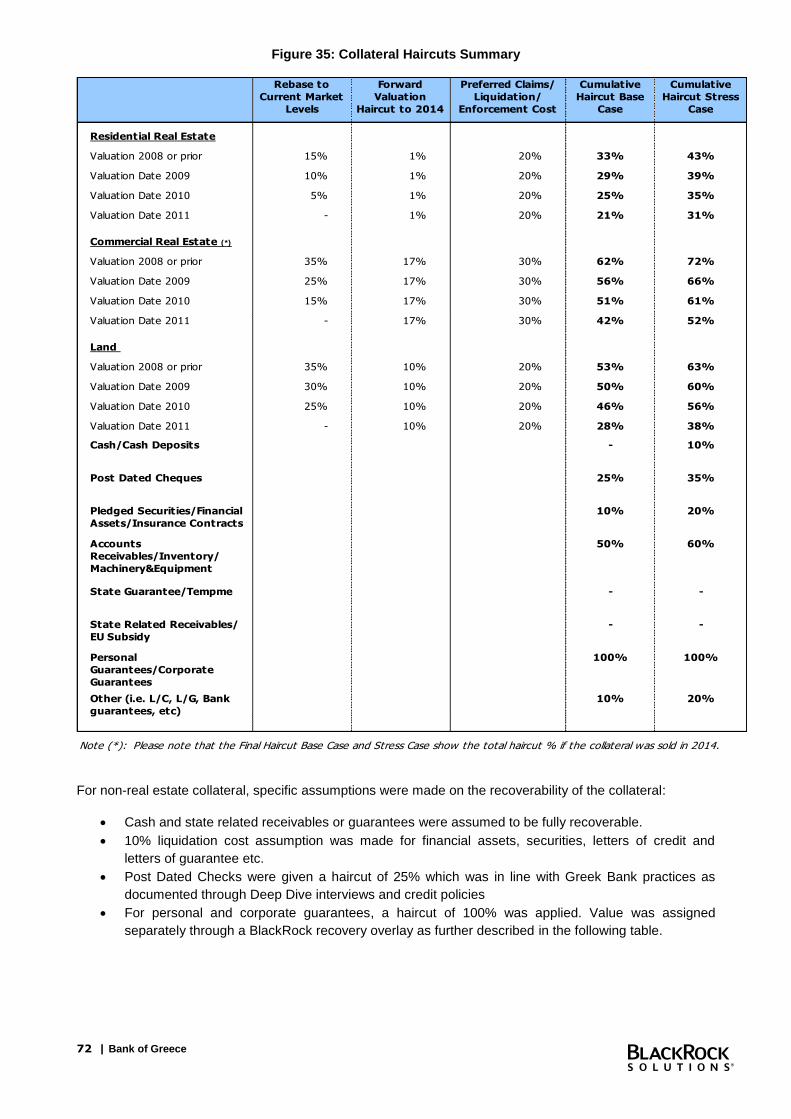
72 | Bank of Greece
Figure 35: Collateral Haircuts Summary
Rebase to
Current Market
Levels
Forward
Valuation
Haircut to 2014
Preferred Claims/
Liquidation/
Enforcement Cost
Cumulative
Haircut Base
Case
Cumulative
Haircut Stress
Case
Residential Real Estate
Valuation 2008 or prior 15% 1% 20% 33% 43%
Valuation Date 2009 10% 1% 20% 29% 39%
Valuation Date 2010 5% 1% 20% 25% 35%
Valuation Date 2011 - 1% 20% 21% 31%
Commercial Real Estate ( *)
Valuation 2008 or prior 35% 17% 30% 62% 72%
Valuation Date 2009 25% 17% 30% 56% 66%
Valuation Date 2010 15% 17% 30% 51% 61%
Valuation Date 2011 - 17% 30% 42% 52%
Land
Valuation 2008 or prior 35% 10% 20% 53% 63%
Valuation Date 2009 30% 10% 20% 50% 60%
Valuation Date 2010 25% 10% 20% 46% 56%
Valuation Date 2011 - 10% 20% 28% 38%
Cash/Cash Deposits - 10%
Post Dated Cheques 25% 35%
Pledged Securities/Financial
Assets/Insurance Contracts
10% 20%
Accounts
Receivables/Inventory/
Machinery&Equipment
50% 60%
State Guarantee/Tempme - -
State Related Receivables/
EU Subsidy
- -
Personal
Guarantees/Corporate
Guarantees
100% 100%
Other (i.e. L/C, L/G, Bank
guarantees, etc)
10% 20%
Note (*): Please note that the Final Haircut Base Case and Stress Case show the total haircut % if the collateral was sold in 2014.
For non-real estate collateral, specific assumptions were made on the recoverability of the collateral:
Cash and state related receivables or guarantees were assumed to be fully recoverable.
10% liquidation cost assumption was made for financial assets, securities, letters of credit and
letters of guarantee etc.
Post Dated Checks were given a haircut of 25% which was in line with Greek Bank practices as
documented through Deep Dive interviews and credit policies
For personal and corporate guarantees, a haircut of 100% was applied. Value was assigned
separately through a BlackRock recovery overlay as further described in the following table.
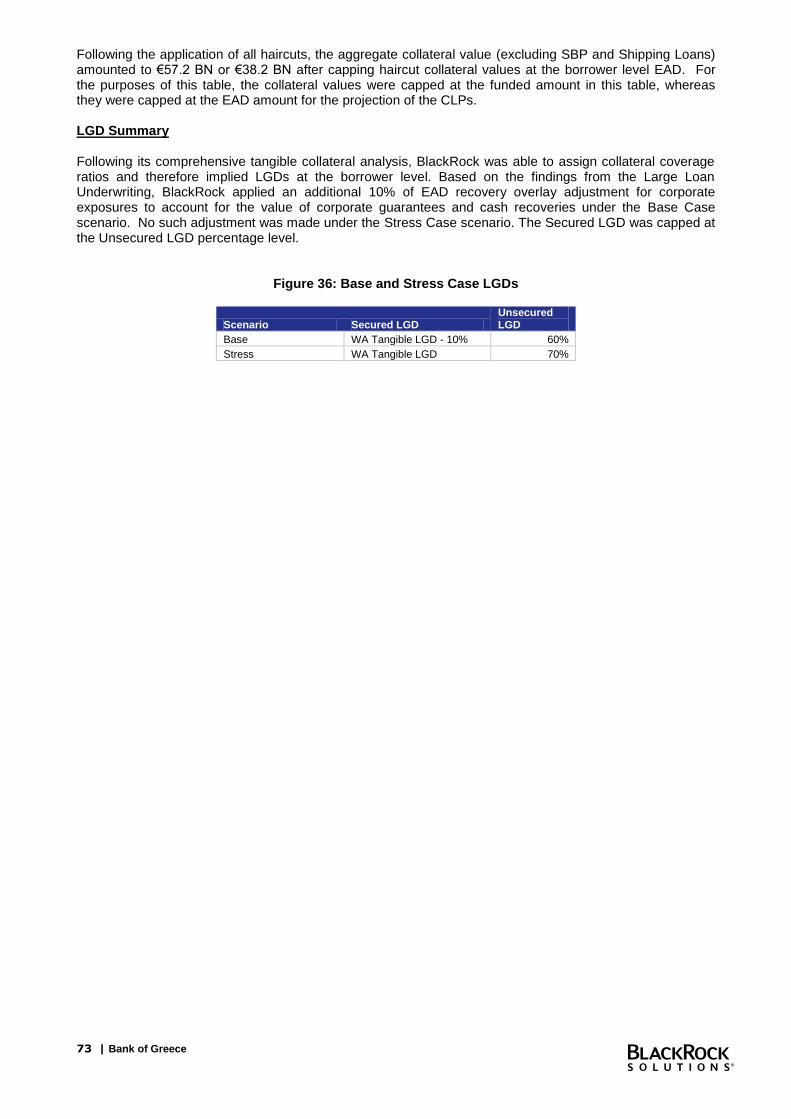
73 | Bank of Greece
Following the application of all haircuts, the aggregate collateral value (excluding SBP and Shipping Loans) amounted to €57.2 BN or €38.2 BN after capping haircut collateral values at the borrower level EAD. For the purposes of this table, the collateral values were capped at the funded amount in this table, whereas they were capped at the EAD amount for the projection of the CLPs. LGD Summary Following its comprehensive tangible collateral analysis, BlackRock was able to assign collateral coverage ratios and therefore implied LGDs at the borrower level. Based on the findings from the Large Loan Underwriting, BlackRock applied an additional 10% of EAD recovery overlay adjustment for corporate exposures to account for the value of corporate guarantees and cash recoveries under the Base Case scenario. No such adjustment was made under the Stress Case scenario. The Secured LGD was capped at the Unsecured LGD percentage level.
Figure 36: Base and Stress Case LGDs
Scenario Secured LGD Unsecured LGD
Base WA Tangible LGD - 10% 60%
Stress WA Tangible LGD 70%

74 | Bank of Greece
Small and Medium Enterprise (SME) - AQR
Process Overview BlackRock’s review of the Small and Medium-Sized Enterprise (“SME”) segment of the Greek banking sector included:
i) On-site due diligence meetings with Bank management to review SME exposure by industry; credit grade and geography; historical origination; and underwriting practices. These meetings provided further insight into the Banks’ current portfolio management, risk management, restructuring and collateral valuation processes.
ii) A loan-level review of portfolio data for Group A Banks and a portfolio-level review of Group B Bank exposures, both as of the reference date 30 June 2011
iii) A loan file review conducted by Ernst & Young (“E&Y”) of a sample across portfolios of Group A Banks, except for TT Postbank, using loan file review templates tailored to Greek market conditions by BlackRock (“SME Loan File Review”). The sample for this review was selected by BlackRock to cover exposures across the main industry sectors and credit quality.
iv) A wide array of external research and data sources was reviewed to calibrate and inform model projections
Due Diligence BlackRock conducted due diligence to: i) generate a qualitative assessment of loan origination practices, credit monitoring policies and loan servicing & procedures for collections and ii) review collateral valuation practices and procedures. In particular, the process was used to:
Gain insight into the relative level of conservativeness of origination practices over the most recent credit cycle
Gauge the accuracy of internal risk grades
Understand the level of preparedness of each Bank and the relevant divisions to address the substantial restructuring that the SME sector was expected to undergo in the coming years
Review and benchmark collateral values provided in the portfolio data tape submissions to support LGD assumptions as part of the credit loss projections
For each Group A Bank, BlackRock conducted one-day Deep Dive sessions focusing on the different types of commercial loans within the SME portfolios. The process entailed interviews with Bank Management, relevant business unit managers, as well as their product, collateral management, risk and data specialists. To assess the Banks’ collateral valuations, BlackRock hired external appraisers to perform desktop valuations of a selected sample of Group A Bank real estate collaterals. The results of the real estate collateral valuation review are further described in the Corporate section. For Group B Banks, one-day meetings were held across all consumer and commercial asset classes, and no further diligence was performed. These interviews and one-day meetings supplemented electronic data submissions and loan file reviews, addressing:
Reporting structure and business lines
Background and lending profile
Origination process and practices
Rating and credit monitoring practices (internal rating models, external rating providers)
Collections and loss mitigation (arrears management procedures and loan payment status reporting procedures and methodologies)

75 | Bank of Greece
Rescheduling and loan modification procedures
Default and loss mitigation practices (restructuring and liquidation processes, key statistics)
Review of collateral valuation (processes and methodology by collateral type, robustness of data used for valuations, quality controls, revaluation frequency, etc.)
Qualitative and quantitative findings from the due diligence process as well as the SME Loan File Review were used to develop modeling parameters. Portfolio Data Collection Portfolio data as of 30 June 2011 was supplied by each of the Banks in a data template stipulated by BlackRock. The Group A Bank data template included more information parameters than that supplied to the Group B Banks. Bank data submissions covered, at a minimum:
Origination channel
Borrower characteristics (unique identifier, borrower type, region of risk, industry sector)
Loan characteristics (unique identifier, facility type, drawn balance, undrawn balance, total limit, term)
Collateral information (unique identifier, collateral type, collateral value, date of last Bank valuation, lien information)
Current credit performance (internal rating, current status, arrears balance, specific provisions) Data regarding SME exposures was downloaded from a secure online website and loaded by BlackRock into a database from which portfolio stratifications were produced. BlackRock engaged the Banks in a data gap and error remediation process for verification purposes and to produce more complete data sets for the analysis. Portfolio Stratification and Risk Analysis Data – Gaps and Errors
Data submissions from the Banks varied in completeness and accuracy. The data gap and error remediation process allowed for the verification, correction, and further population of Bank data sets. A typical error found within data submissions was that loan maturity dates were set prior to the 30 June 2011 reference date. Data gaps were simply fields that had not been populated by the Bank. Where data was unobtainable, BlackRock applied conservative and reasonable assumptions for use in the modeling process. In particular, for all instances where the maturity date of the loan was left blank, BlackRock assumed the loans matured on 30 June 2014. Stratifications
Detailed stratification tables in a standard output format were supplied by BlackRock to each of the Group A Banks for confirmation / verification of balances and other risk factors. A less detailed portfolio stratification was performed for most Group B Banks with the same objectives. This allowed the Banks to confirm that the data supplied to BlackRock was consistent in size and characteristics with the Banks’ understanding of their respective portfolios. Any inconsistencies were addressed by the Banks to the extent practical in the limited timeframe during which the analysis was conducted. In addition, stratification tables have allowed BlackRock to identify sources and drivers of risk in the SME portfolio and explain these in a simplified manner. The total exposure of SME portfolios across all Group A Banks amounted to €42.8 BN, of which €32.8 BN
represented the funded balance.
76 | Bank of Greece
SME Loan File Reviews General Overview BlackRock engaged E&Y to review a sample of SME loan files selected by BlackRock to further inform on potential risk factors that could impact credit loss projections. The purpose of the loan file reviews was to complement the above-mentioned due diligence process, in particular:
Determine appropriateness of Banks’ loan status assessment
Review security and lien position of collaterals
Develop a view on Bank origination, credit sanctioning and portfolio management practices (e.g., rescheduling activity)
The selection criteria for the SME sample were as follows:
Attika/Athens area only; including the suburbs (selected for practical reasons)
Top 5 Industries by Bank
Loans with funded balance above €1 and up to €15 MM
Approximately 50% in NPL/Restructured category and 50% in Performing category
When relevant, inclusion of selected factoring and public sector files The SME Loan File Review was based on a review template, adapted to the Greek market conditions, which was developed and agreed between BlackRock and E&Y and covered the following areas: (i) summary of financial statements including P&L, balance sheet, sustainable business position, leverage statistics when available; (ii) summary of facilities information; (iii) summary of real estate and other collateral securing the Bank exposures; (iv) credit performance and (v) an overall engagement and key risk summary report.
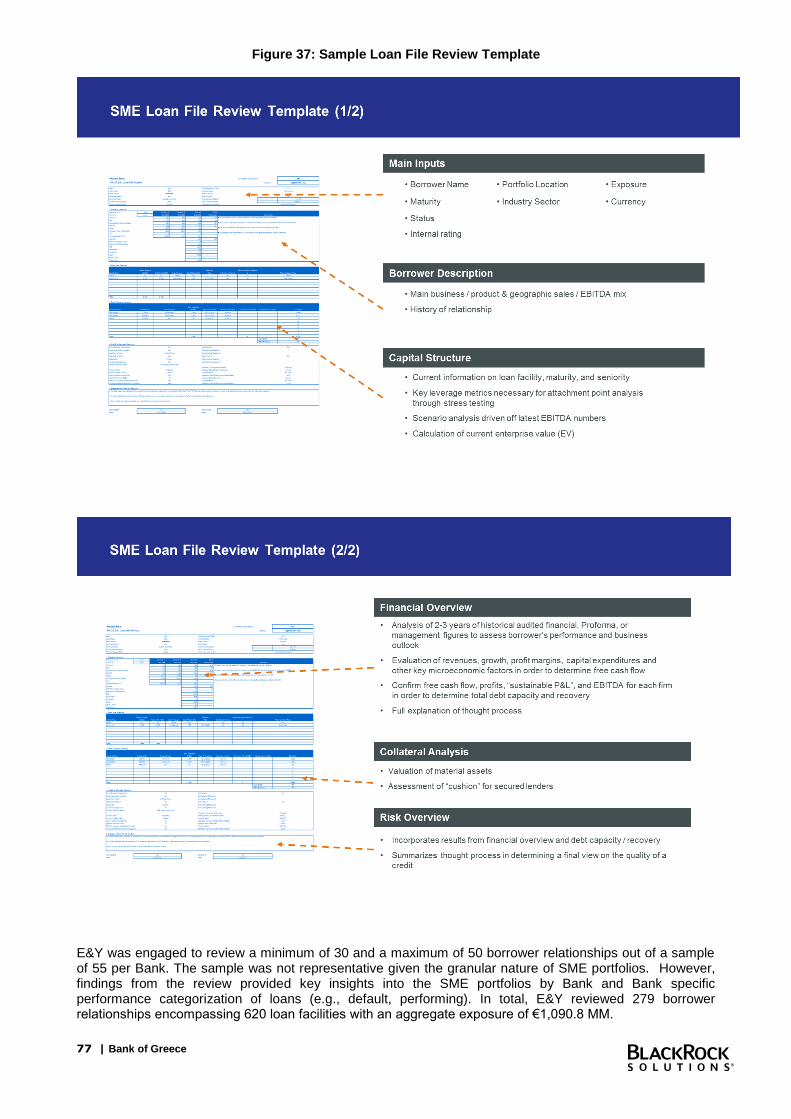
77 | Bank of Greece
Figure 37: Sample Loan File Review Template
E&Y was engaged to review a minimum of 30 and a maximum of 50 borrower relationships out of a sample of 55 per Bank. The sample was not representative given the granular nature of SME portfolios. However, findings from the review provided key insights into the SME portfolios by Bank and Bank specific performance categorization of loans (e.g., default, performing). In total, E&Y reviewed 279 borrower relationships encompassing 620 loan facilities with an aggregate exposure of €1,090.8 MM.
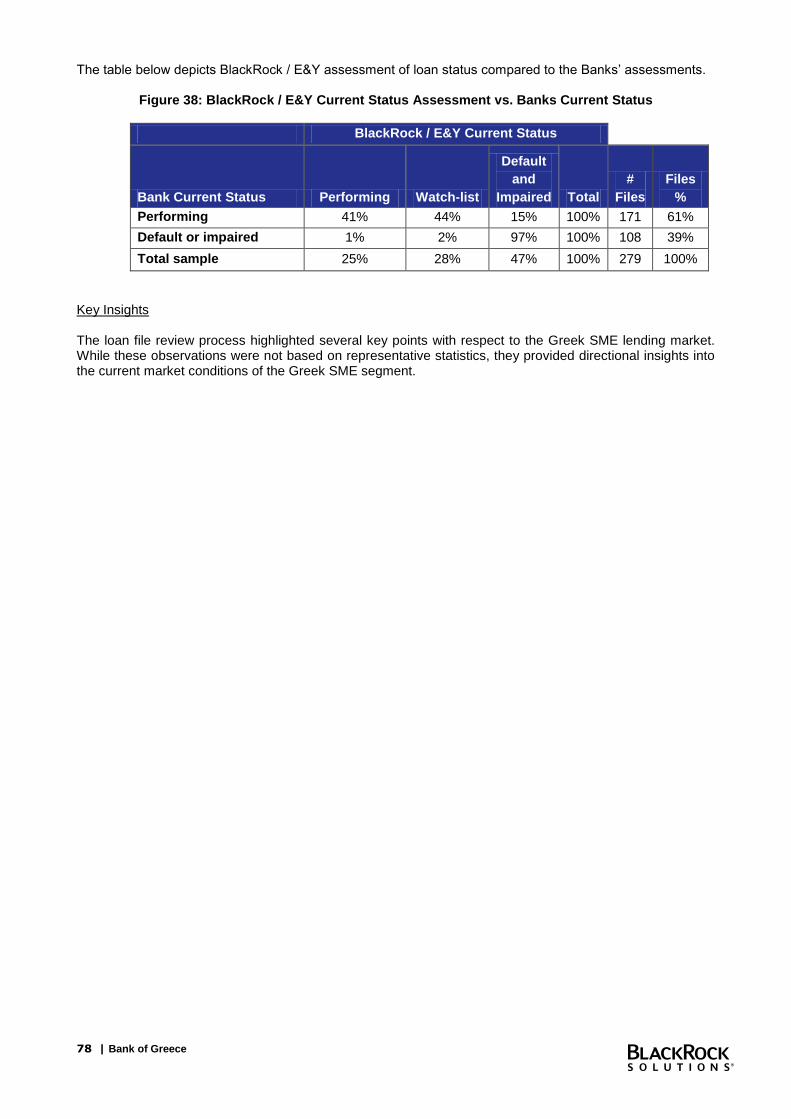
78 | Bank of Greece
The table below depicts BlackRock / E&Y assessment of loan status compared to the Banks’ assessments.
Figure 38: BlackRock / E&Y Current Status Assessment vs. Banks Current Status
BlackRock / E&Y Current Status
Bank Current Status Performing Watch-list
Default
and
Impaired Total
#
Files
Files
%
Performing 41% 44% 15% 100% 171 61%
Default or impaired 1% 2% 97% 100% 108 39%
Total sample 25% 28% 47% 100% 279 100%
Key Insights The loan file review process highlighted several key points with respect to the Greek SME lending market. While these observations were not based on representative statistics, they provided directional insights into the current market conditions of the Greek SME segment.
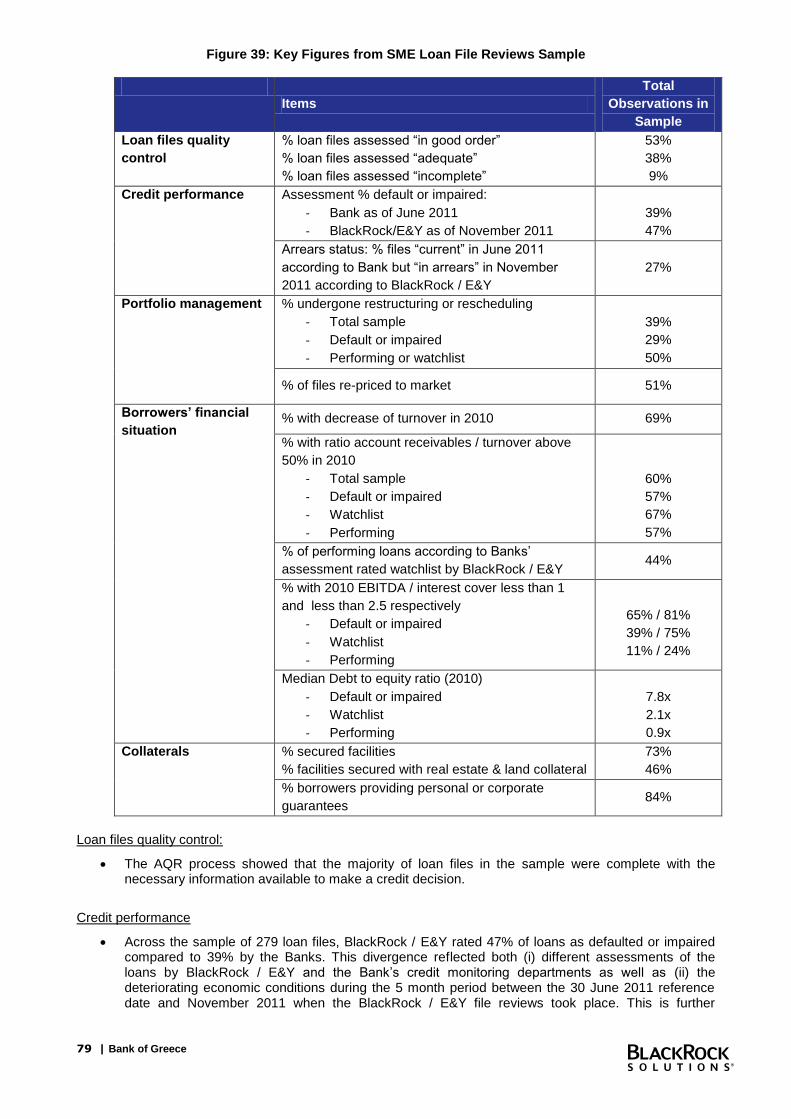
79 | Bank of Greece
Figure 39: Key Figures from SME Loan File Reviews Sample
Items
Total
Observations in
Sample
Loan files quality
control
% loan files assessed “in good order”
% loan files assessed “adequate”
% loan files assessed “incomplete”
53%
38%
9%
Credit performance Assessment % default or impaired:
- Bank as of June 2011
- BlackRock/E&Y as of November 2011
39%
47%
Arrears status: % files “current” in June 2011
according to Bank but “in arrears” in November
2011 according to BlackRock / E&Y
27%
Portfolio management % undergone restructuring or rescheduling
- Total sample
- Default or impaired
- Performing or watchlist
39%
29%
50%
% of files re-priced to market 51%
Borrowers’ financial
situation % with decrease of turnover in 2010 69%
% with ratio account receivables / turnover above
50% in 2010
- Total sample
- Default or impaired
- Watchlist
- Performing
60%
57%
67%
57%
% of performing loans according to Banks’
assessment rated watchlist by BlackRock / E&Y 44%
% with 2010 EBITDA / interest cover less than 1
and less than 2.5 respectively
- Default or impaired
- Watchlist
- Performing
65% / 81%
39% / 75%
11% / 24%
Median Debt to equity ratio (2010)
- Default or impaired
- Watchlist
- Performing
7.8x
2.1x
0.9x
Collaterals % secured facilities
% facilities secured with real estate & land collateral
73%
46%
% borrowers providing personal or corporate
guarantees 84%
Loan files quality control:
The AQR process showed that the majority of loan files in the sample were complete with the necessary information available to make a credit decision.
Credit performance
Across the sample of 279 loan files, BlackRock / E&Y rated 47% of loans as defaulted or impaired compared to 39% by the Banks. This divergence reflected both (i) different assessments of the loans by BlackRock / E&Y and the Bank’s credit monitoring departments as well as (ii) the deteriorating economic conditions during the 5 month period between the 30 June 2011 reference date and November 2011 when the BlackRock / E&Y file reviews took place. This is further
80 | Bank of Greece
supported by the arrears statistic, which shows that 27% of the loan files that were “current” in June 2011 moved into the “arrears” categories by November 2011.
Portfolio management
Banks have, in general, been engaged in significant restructuring and rescheduling activity (39% of loan file sample
21), mostly in the form of a grace period, rescheduled repayment terms, or facility
restructuring (e.g., conversion of a working capital facility into a term loan with extended maturity).
Approximately half of loans in the sample have been re-priced.
Borrower’s financial situation
Overall, SME borrowers in the sample face a stressed economic situation with decreasing turnover (69% with a turnover decrease in 2010 – consistent across ratings) and elevated levels of accounts receivables. More than 60% of borrowers had a ratio of receivables to turnover of above 50%. Furthermore, the file reviews revealed that borrowers had, in most cases, fully drawn their committed facilities, partially as a result of the Banks aggressively cutting limits over the past three years. Approximately half of the facilities were used to finance working capital. While all sectors were affected by the stressed economic situation, the construction sector seemed more heavily impacted.
The loan file review revealed that a significant percentage of SMEs relied on shareholder support to fund working capital and, potentially, also to meet debt service obligations. In particular, 44% of loans rated performing by Banks have been rated watchlist by BlackRock / E&Y. This group, while mostly current and facing reasonable debt to equity ratio (median of 2.1), had low EBITDA / interest cover ratios (39% below one and 75% below 2.5) and were at risk in terms of their future ability to fully repay their debt obligations.
Collaterals
The significance of secured loans was largely confirmed in the loan file review with 46% of facilities secured with real estate / land collaterals and with a total of 73% of facilities secured by tangible collateral. In addition, for 84% of the sample, shareholders provided a personal or corporate guarantee. However, the realizable value of personal guarantees is currently restricted by laws preventing seizure of primary residence, which is generally the guarantor’s main realizable asset.
21
The percentage of restructured, rescheduling and re-pricing activities is higher in the sample than in the total portfolio stratifications.
This can be explained by 1) the date of BlackRock / E&Y review as of November, 2011 compared to the Bank data tape submission date of 30 June 2011, 2) timing difference whereby “older” vintages of restructured or rescheduled loans were not flagged as such in the portfolio data submissions as of 30 June 2011 and 3) some Banks not comprehensively flagging restructured and rescheduled activity, for instance, interest arrears refinancings may not be consistently flagged as rescheduled loans
81 | Bank of Greece
SME - Methodology
Ratings Based Expected Loss Methodology The BlackRock SME valuation methodology employed a ratings based expected loss approach which incorporated exposure at default (“EAD”), probability of default (“PD”) and loss-given-default (“LGD”) as the main parameters in estimating losses over time, with credit loss projections (“CLP”) calculated as follows:
CLP = EAD * PD * LGD For each Group A Bank portfolio, BlackRock derived the PD from five-year default matrices generated from a transition analysis of historical rating migration data provided by the Banks. The default matrices were rebased to the macroeconomic forecasts provided by the Central Bank using estimated coefficients from the historical statistical relationship of GDP to corporate insolvency rates and were also subject to a through-the-cycle adjustment (as further described in the Corporate Section). The LGD was derived through a comprehensive bottom-up analysis of tangible collateral data provided at the borrower level as part of a separate data submission by the Banks. Exposure at Default (EAD) The exposure at default represents the entire funded balance exposure and an assessment of the likelihood of future draws on existing Bank commitments in the loan portfolio. In determining the EAD assumptions, BlackRock considered the funded, unfunded-committed and unfunded-uncommitted exposures. The EAD was calculated as follows:
EAD = 100% of the Current Funded Balance + 10% of the Unfunded Committed Balance + 5% of the Unfunded Uncommitted Balance
In addition, if an exposure was currently in default, no further draws on the unfunded balances were assumed. Unfunded Committed Balance was defined as an unfunded exposure where the Bank had a contractual commitment to provide funds either upon request of the borrower, or, in the case of letter of credits or guarantees, upon request of the beneficiary. Alternatively, Unfunded Uncommitted Balance was defined as an exposure where disbursement of funds was entirely at the discretion of the Bank. Furthermore, for revolving exposures with missing maturity dates, BlackRock assumed the earliest maturity date of any other term loan extended to the same borrower. For instances where maturity dates were missing altogether, a maturity assumption of 2014 was applied.
Base case: 2% per annum
Stress case: 1% per annum For revolving exposures with missing maturity dates, BlackRock assumed the earliest maturity date of any other term loan to the same borrower. Probability of Default Analysis For SME, BlackRock applied the same methodology as for Corporate (see Corporate section). However, in order to derive cumulative default matrices, BlackRock used historical rating data of the SME portfolio universe only. The aforementioned default matrices provide default probabilities over the next 5 years. Beyond Year 5, the incremental PD was assumed to be constant until maturity using the Year 5 marginal PD.

82 | Bank of Greece
Loss Given Default (LGD) For SME, BlackRock applied the same methodology to determine borrower level LGDs as for Corporate. LGD Summary
Following its comprehensive tangible collateral analysis, BlackRock was able to assign collateral coverage ratios and therefore implied LGDs at the SME borrower level. Based on the findings from the SME Loan File Review, BlackRock applied an additional 5% of EAD recovery overlay adjustment for SME exposures to account for the value of corporate and/or personal guarantees as well as cash recoveries under the Base Case scenario. No such adjustment was made under the Stress Case scenario. The Secured LGD was capped at the Unsecured LGD percentage level.
Figure 40: Base and Stress Case LGDs
Scenario Secured LGD Unsecured LGD
Base WA Tangible LGD + 5-% 75%
Stress WA Tangible LGD 85%
83 | Bank of Greece
Small Business and Professional Loans (SBP) - AQR
Process Overview BlackRock’s review of the small business and professional loans (“SBP”) segment of the Greek banking sector included:
i) On-site due diligence meetings with Bank management to review SBP exposure segmentation; historical origination; and underwriting practices. These meetings provided further insight into the current portfolio management, risk management, restructuring and collateral valuation processes
ii) A loan-level review of portfolio data for Group A Banks and a portfolio-level review of Group B Bank exposures, both as of the reference date 30 June 2011
iii) A loan file review conducted by Ernst & Young (“E&Y”) of a sample across portfolios of Group A Banks, except for TT Postbank, using loan file review templates tailored to Greek market conditions by BlackRock (“SBP Loan File Review”). The sample for this review was selected by BlackRock and aimed to cover exposures across the main industry sectors and credit quality
iv) A wide array of external research and data sources was reviewed to calibrate and inform model projections
Due Diligence BlackRock conducted due diligence to: i) generate a qualitative assessment of loan origination practices, credit monitoring policies and loan servicing & procedures for collections; and ii) review collateral valuation practices and procedures. In particular, the process was used to:
Gain insight into the relative level of conservativeness of origination practices over the most recent credit cycle
Gauge the accuracy of internal risk grades
Understand how well-prepared each Bank and the relevant divisions were to address the substantial restructuring that the SBP sector was expected to undergo in the coming years.
Review and benchmark collateral values provided in the portfolio data tape submissions to support LGD assumptions as part of the credit loss projections
For each Group A Bank, BlackRock conducted one-day Deep Dive session focusing on the different types of commercial loans among within the SBP portfolios. The process entailed interviews with Bank Management, relevant business unit managers, as well as their product, collateral management, risk and data specialists. To assess the Banks’ collateral valuations, BlackRock hired external appraisers to perform desktop valuations of a selected sample of Group A Bank real estate collaterals. The results of the real estate collateral valuation review are further described in the Corporate section of the report. For Group B Banks, one-day meetings were held across all consumer and commercial asset classes, and no further diligence was performed. These interviews and one-day meetings supplemented electronic data submissions and loan file reviews, addressing:
Reporting structure and business lines
Background and lending profile
Origination processes and practices
Rating and credit monitoring practices (internal credit scoring models)

84 | Bank of Greece
Collections and loss mitigation efforts (arrears management procedures and loan payment status reporting procedures & methodologies)
Rescheduling and loan modification procedures
Default and loss mitigation practices (restructuring and liquidation processes, key statistics)
Review of collateral valuation (processes and methodology by collateral type, robustness of data used for valuations, quality controls, revaluation frequency, etc.)
Qualitative and quantitative findings from the due diligence process, as well as the SBP Loan File Review, were used to develop modeling parameters.
Portfolio Data Collection Portfolio data as of 30 June 2011 was supplied by each of the Banks in a data template stipulated by BlackRock. The Group A Bank data template included more information parameters than that supplied to the Group B Banks. The data files received from the Banks covered, at a minimum:
Origination channel
Borrower characteristics (unique identifier, borrower type, region of risk, industry sector)
Loan characteristics (unique identifier, facility type, drawn balance, undrawn balance, total limit, term)
Collateral information (unique identifier, collateral type, collateral value, date of last Bank valuation, lien information)
Current credit performance (internal rating, current status, arrears balance, specific provisions) Data regarding SBP exposures was downloaded from a secure online website and loaded by BlackRock into a database from which portfolio stratifications were produced. BlackRock engaged the Banks in a data gap and error remediation process for verification purposes and to produce more complete data sets for the analysis.
Portfolio Stratification and Risk Analysis Data – Gaps and Errors
Data submissions from the Banks varied in completeness and accuracy. The data gap and error remediation process allowed for the verification, correction, and further population of Bank data sets. A typical error found within data submissions related to loan maturity dates set prior to the reference date of 30 June 2011. Data gaps were simply fields that had not been populated by the Bank. Where data was unobtainable, BlackRock applied conservative and reasonable assumptions for use in the modeling process. In particular, for all instances where the maturity date of the loan was left blank, BlackRock assumed the loans matured on 30 June 2014, reasoning that the loans were either revolving facilities or term loans. Stratifications
Detailed stratification tables in a standard output format were supplied by BlackRock to each of the Group A Banks for confirmation / verification of balances and other risk factors. A less detailed portfolio stratification was performed for most Group B Banks with the same objectives. This allowed the Banks to confirm that the data supplied to BlackRock was consistent in size and characteristics with the Banks’ understanding of their respective portfolios. Any inconsistencies were addressed by the Banks to the extent practical in the limited timeframe during which the analysis was conducted. In addition, stratification tables have allowed BlackRock to identify sources and drivers of risk in the SBP portfolio and explain these in a simplified manner. The total exposure SBP portfolios across all Group A Banks amounted to € 27.2 BN, of which € 23.5 BN represented the funded balance.
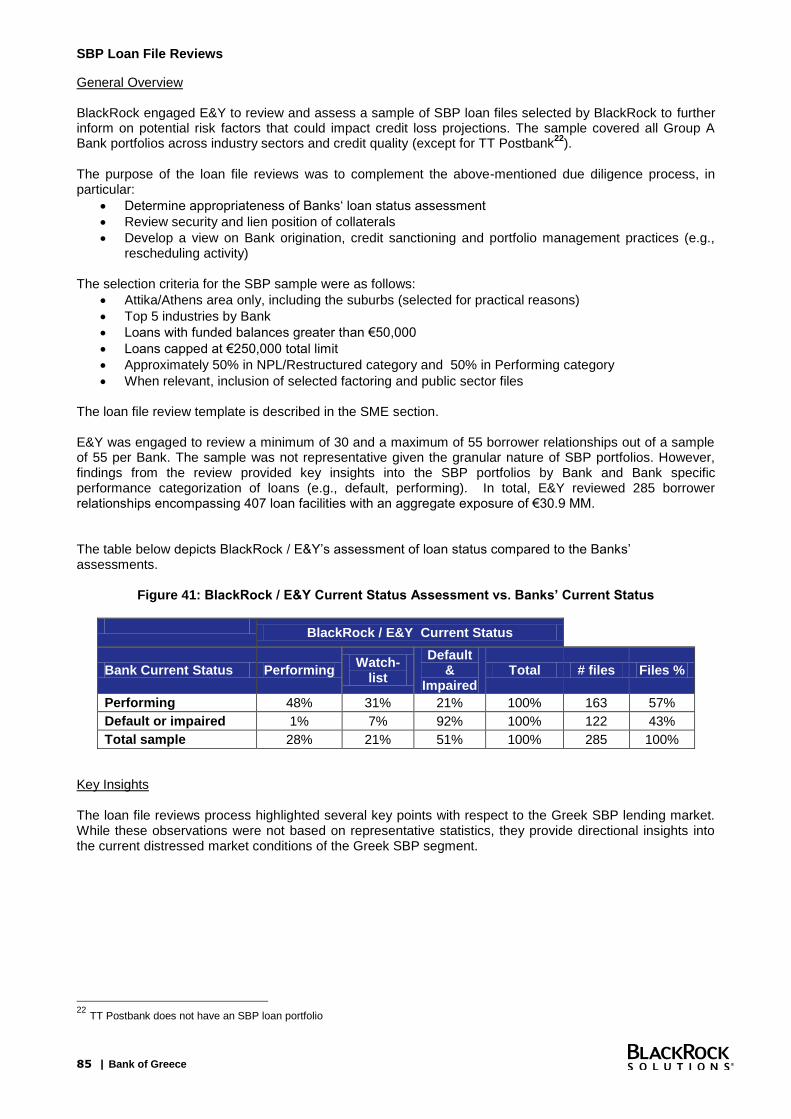
85 | Bank of Greece
SBP Loan File Reviews
General Overview BlackRock engaged E&Y to review and assess a sample of SBP loan files selected by BlackRock to further inform on potential risk factors that could impact credit loss projections. The sample covered all Group A Bank portfolios across industry sectors and credit quality (except for TT Postbank
22).
The purpose of the loan file reviews was to complement the above-mentioned due diligence process, in particular:
Determine appropriateness of Banks‘ loan status assessment
Review security and lien position of collaterals
Develop a view on Bank origination, credit sanctioning and portfolio management practices (e.g., rescheduling activity)
The selection criteria for the SBP sample were as follows:
Attika/Athens area only, including the suburbs (selected for practical reasons)
Top 5 industries by Bank
Loans with funded balances greater than €50,000
Loans capped at €250,000 total limit
Approximately 50% in NPL/Restructured category and 50% in Performing category
When relevant, inclusion of selected factoring and public sector files The loan file review template is described in the SME section. E&Y was engaged to review a minimum of 30 and a maximum of 55 borrower relationships out of a sample of 55 per Bank. The sample was not representative given the granular nature of SBP portfolios. However, findings from the review provided key insights into the SBP portfolios by Bank and Bank specific performance categorization of loans (e.g., default, performing). In total, E&Y reviewed 285 borrower relationships encompassing 407 loan facilities with an aggregate exposure of €30.9 MM. The table below depicts BlackRock / E&Y’s assessment of loan status compared to the Banks’ assessments.
Figure 41: BlackRock / E&Y Current Status Assessment vs. Banks’ Current Status
BlackRock / E&Y Current Status
Bank Current Status Performing Watch-
list
Default &
Impaired Total # files Files %
Performing 48% 31% 21% 100% 163 57%
Default or impaired 1% 7% 92% 100% 122 43%
Total sample 28% 21% 51% 100% 285 100%
Key Insights The loan file reviews process highlighted several key points with respect to the Greek SBP lending market. While these observations were not based on representative statistics, they provide directional insights into the current distressed market conditions of the Greek SBP segment.
22
TT Postbank does not have an SBP loan portfolio

86 | Bank of Greece
Figure 42: Key Figures from SBP Loan File Reviews sample
Loan files quality control
The AQR process showed that the loan files were incomplete in 14% of cases.
In most cases, financial information was either incomplete or not available (e.g., 50% in the sample did not have 2010 turnover information) which was expected. The Banks’ credit decision was usually based on a combination of different information sources including, business financials, tax returns, Tiresias Black reports and payment behavior.
Credit performance
Across the entire sample, BlackRock / E&Y rated 51% of loans as defaulted or impaired compared to 43% by the Banks. This divergence reflected both (i) different assessments of the loans by BlackRock / E&Y and the Bank’s credit monitoring departments as well as (ii) the deteriorating economic conditions during the 5 month period between the 30 June 2011 reference date and November 2011 when the BlackRock / E&Y file reviews took place. This was further supported by the arrears statistics, which showed that 29% of the loan files that were “current” on 30 June 2011 moved into the “arrears” category by November 2011.
Portfolio Management
Banks had, in general, been engaged in some restructuring and rescheduling activity (27% of loan file sample
23), mostly in the form of term extension, payment rescheduling or grace periods
23
The percentage of restructured, rescheduling and repricing activities is higher in the sample than in the total portfolio stratifications.
This can be explained by 1) the date of BlackRock / E&Y review as of November 2011 compared to the Bank data tape submission date of 30 June 2011, 2) timing difference whereby “older” vintages of restructured or rescheduled loans are not flagged as such in the
Items
Total Observations in
Sample
Loan Files Quality Control
% loan files assessed “in good order” % loan files assessed “adequate” % loan files assessed “incomplete”
39% 47% 14%
% files with no 2010 financial information 50%
Credit Performance Assessment % default or impaired: - Bank as of June 2011 - BlackRock/E&Y as of November 2011
43% 51%
Arrears status: % files “current” in June 2011 according to Bank but in arrears in November 2011according to BlackRock / E&Y
29%
Portfolio Management % undergone restructuring or rescheduling
- Total Sample - Default or Impaired - Performing or Watchlist
27% 29% 26%
% of files re-priced to market 45%
Borrowers’ Financial Situation
% financial status of borrower assessed “weak” by BlackRock / E&Y
- Total sample - Default or impaired - Watchlist - Performing
57% 90% 47% 4%
% loan purpose working capital financing 81%
% of performing loans according to Banks’ assessment rated watchlist by BlackRock / E&Y
31%
Collaterals % secured facilities % facilities with real estate & land collateral
63% 31%
% borrowers providing personal guarantees 92%

87 | Bank of Greece
45% of the loans in the sample had been re-priced.
Borrower’s financial situation
Overall SBP borrowers in the sample faced a stressed economic situation. File reviews showed that the borrowers had, in most cases, fully drawn their facilities (partially as a result of the Banks cutting limits aggressively over the past three years). Over 80% of the facilities reviewed were used to finance working capital.
31% of loans rated Performing by Banks had been rated Watchlist by BlackRock / E&Y. The financial situation of borrowers in this group was assessed “weak” for almost half of them. Over 80% of the borrowers with a “weak” financial situation in the sample were rated default or impaired. These statistics highlight the risk of currently non-defaulted borrowers migrating into default in the near term.
Collaterals
The significance of secured loans was largely confirmed in the loan file review with 31% of facilities secured with real estate / land collaterals and with a total of 63% of facilities secured by tangible collateral. In addition, 92% of the borrowers in the sample provided a personal guarantee. However, the realizable value of such personal guarantees is currently restricted by laws preventing the seizure of primary residence, which is generally the guarantor’s main realizable asset.
portfolio data submissions as of June, 2011 and 3) some Banks not comprehensively flagging restructured and rescheduled activity, for instance, interest arrears refinancings may not be consistently flagged as rescheduled loans
88 | Bank of Greece
SBP - Methodology
The BlackRock SBP valuation methodology employed quantitative and qualitative approaches to derive the projected exposure at default (“EAD”), probability of default (“PD”) and loss-given-default (“LGD”) as the main parameters in estimating credit loss projections (“CLP”) over time, calculated as follows:
CLP = PD * EAD * LGD
Exposure at Default The exposure at default represents the entire funded balance exposure and an assessment of the likelihood of future draws on existing Bank commitments in the loan portfolio. In determining the EAD assumptions, BlackRock considered the funded, unfunded committed and unfunded uncommitted exposures. The EAD is calculated as follows:
EAD = 100% of the Current Funded Balance + 10% of the Unfunded Committed Balance + 5% of the Unfunded Uncommitted Balance
In addition, if an exposure was currently in default, no further draws on the unfunded balances were assumed. Unfunded Committed Balance is defined as an unfunded exposure where the Bank has a contractual commitment to provide funds upon request of the borrower. Alternatively, Unfunded Uncommitted Balance is defined as an exposure where disbursement of funds is entirely at the discretion of the Bank. Furthermore, BlackRock assumed no amortization for SBP loans. For loans which were revolving with no maturity or where no maturity was indicated, BlackRock assumed a 3 year term. Probability of Default PD was calculated using a non-linear multi-factor regression model derived from the loan portfolios of each Group A Bank, as of the June 30 2011 reference date. For the purposes of the regression analysis, loans were organized into three categories: 1) ATE Bank loans, which were largely issued to farmers; 2) non-ATE Bank loans with current exposure of less than €150,000; 3) non-ATE Bank loans with current exposure greater than or equal to €150,000. The three categories were fitted into three separate regression equations to account for differences among the three groups of loans.
By analyzing the portfolios of SBP loans of the Group A Banks, BlackRock determined the factors that have the greatest ability to predict the probability of default. For the purposes of this model, a loan was considered “defaulted” if it was either 90+ days past due, or considered by the Bank as being non-performing or defaulted on 30 June 2011. For all loans that the Banks indicated as being “restructured” or “rescheduled,” BlackRock assumed a 90% PD. For all other loans, model outputs were produced to predict PD using a logistic regression, which fits the relevant data to a curve within the range of 0% and 100%. Below we have listed some of the factors that were found to be statistically significant for predicting borrower behavior. All data was as of 30 June 2011:
Bank-Specific Current Default Ratio
Industry of the Borrower
Athens and Thessaloniki Indicators
Revolving Credit Facility vs. Term Loan BlackRock performed the following key steps to arrive at the default amount for each loan:
PD was calculated for each loan based on the key factors listed above
Total default amount was calculated for each loan using the specific EAD and PD for such loan.
89 | Bank of Greece
To calculate the timing of the losses, the total default amount was divided into different amounts for each of the next three years by applying annual default factors. Similar to the Corporate and SME methodologies, the annual PDs were rebased using a combination of the macroeconomic forecasts provided by the Central Bank and the estimated coefficients calculated from the historical statistical relationship of GDP to corporate insolvency rates.
All default amounts for each loan were aggregated to provide the total default amount for each Bank, for each year.
Loss Given Default BlackRock’s LGD analysis focused primarily on tangible collateral which could be liquidated in the event of borrower default (such as property, receivables, cash, and cash-like financial instruments). For SBP loans, the LGD of the secured loans represented realized losses after collateral liquidations or write-offs. BlackRock mapped available collateral to 12 collateral categories and confirmed aggregate collateral values with each Group A Bank. Each collateral type was subject to haircuts, in line with market practice. For property-related collateral, the following haircuts were applied:
Rebasing collateral valuations to current market levels in order to account for changes in value since the last valuation date
Forward valuation haircuts to account for projected further declines in market valuations
Additional haircuts to account for liquidation costs and preferred claims
The haircut matrix applied is listed in the Corporate section. BlackRock split each portfolio into loans secured by tangible collateral and unsecured loans. For secured loans, the collateral coverage ratio and therefore the implied LGD at the portfolio level was derived from the ratio between the sum of the haircut collateral for each loan capped at the borrower EAD and the sum of the EAD of the secured loans, plus an additional 5% of EAD recovery overlay to account for the value of personal guarantees as well as cash recoveries. For unsecured loans, an LGD of either 90% or 95% was assumed depending on BlackRock’s assessment of the recovery experience of the Bank. The Secured LGD was capped at the Unsecured LGD percentage level. For TEMPME loans, an LGD of 15% was applied. Stress case LGD was derived by increasing Base case LGD by 10% and capping it at 100%.

90 | Bank of Greece
Commercial Real Estate (CRE) Loans - AQR
Commercial Real Estate (“CRE”) Lending Overview CRE lending in the Greek market primarily consists of two forms of lending:
SPV-based Lending: A traditional form of commercial real estate asset-backed lending, with cashflows from rental income used to service interest and principal payments. The asset is owned by the borrower/sponsor, and the lender has recourse to the asset in the event of a default or other such adverse scenario.
Commercial Real Estate Leasing: In this form of lending, the lending institution grants a financial lease to the borrower/sponsor over the asset that secures the loan. The borrower/sponsor becomes the lessee and the lender becomes the lessor. The Lender owns the asset and the asset is returned to the borrower/sponsor on successful repayment of the loan
BlackRock has observed a broadly even distribution of both forms of lending in the Group A Banks’ CRE loan universe (“CRE Lending”). A segmentation of each type of lending by institution is provided below (balances shown are funded balances). It should be noted that the above segmentation does not include corporate loans granted to CRE companies. A number of CRE related corporate loans, however, were included in the Large Loan review to enhance the coverage of CRE across Banks and property types. Process Overview BlackRock’s approach to reviewing asset quality for CRE loans included the following processes:
A detailed due diligence of all seven Group A Banks with CRE loan exposures, including reviews of: o The CRE lending organizational structure and relevant functions (different divisions that
originate, manage, and value loans); o The composition of portfolios within each division; o The Banks’ origination practices, underwriting standards; o The loan monitoring and risk management capabilities and practices of the Banks.
BlackRock undertook an in-depth manual re-underwriting of 27 borrowers, as detailed on the following table. The re-underwriting of exposures classified as CRE Lending represented approximately 21.6% of the total Group A Banks’ Large Loan CRE exposure.
A fundamental financial analysis of each of the borrowers in the re-underwritten sample, discussions with Bank relationship managers and loan officers to further clarify ambiguities regarding certain credits, and an assessment of the Banks’ borrower familiarity and monitoring practices.
An evaluation of the quality of the credit files made available to BlackRock.

91 | Bank of Greece
Re-Underwritten Sample of CRE Large Loans for Group A Banks
The re-underwritten sample of CRE large loans consists of 20 CRE Lending loans (CRE SPV and CRE Leasing loans) and 7 additional corporate loans which were considered as CRE related:
Due Diligence BlackRock’s due diligence was designed to assess the processes employed over the life of a CRE loan, including origination and underwriting, on-going asset management, servicing and risk management, as well as the modification, workout and loss mitigation processes where necessary. The due diligence further informed a qualitative assessment of the Banks’ management teams and their ability to monitor and manage the credit risk associated with their CRE loan portfolios. Management and Business Interviews In-person meetings were conducted with members of each Bank’s senior management, followed by on-site Deep Dive meetings. Additionally, telephone interviews were conducted with senior personnel at each of the lending divisions responsible for CRE financing. The following subjects were addressed during these interviews:
Overall composition and quality of the CRE loan portfolio
Purpose and focus of each lending division
Overall composition and quality of the portfolio for each lending division
Discussion of the largest and the most challenging credits within each lending division
Origination, underwriting and credit management policies and how (if at all) they differed among different lending divisions
Collateral valuation procedures and frequencies
Rescheduling and restructuring strategies
Internal ratings procedures, ratings scale, and re-rating process The purpose of the interviews was to gain an understanding of the relative conservativeness of the origination and underwriting practices across Banks, in addition to each Bank’s relative level of preparedness to address workout and restructuring challenges borne by the crisis. The insight gained through these interviews was cross-validated through the loan file reviews and manual re-underwriting of loans. Data Management Loan-level data as of the 30 June 2011 reference date was supplied by each of the Banks in a format stipulated by BlackRock. Employing a standardized template and format for data submissions ensured that the data supplied was directly comparable across institutions, with (broadly) the same field definitions applied for each submitted data field. The data requested included historical loan performance data concerning delinquencies, defaults and recoveries, in addition to other information such as historical credit rating migrations for each loan over the past 5 years. Data containing CRE exposures were downloaded from a secure online data exchange (IntraLinks) and on-boarded by BlackRock to a database system. The database system facilitated the organization and harmonization of data across various output formats (e.g., .txt, .xls), the development of portfolio stratifications and data gap reports, and the implementation of data overrides and assumptions. Data Sample and Analysis The data submissions varied in their completeness with respect to the requested data across the Banks. BlackRock provided data gap reports to the Banks to highlight key areas of data incompleteness. BlackRock also provided the Banks with Data Error reports which enabled the Banks to address data errors or omissions in a focused manner. An example of a data error is a loan maturity date which takes place earlier than the 30 June 2011 reference date or is missing (i.e., the field appears blank in the data file). Stratifications Detailed stratification tables in a standard output format were produced by BlackRock and supplied to each of the Banks for confirmation and verification of balances and other key risk factors. This process allowed the Banks to confirm that the data supplied to BlackRock was consistent in size and characteristics with the Banks’ own understanding of their respective portfolios. Inconsistencies were addressed by BlackRock and the Banks to reconcile differences to the extent practical in the limited timeframe during which the analysis

92 | Bank of Greece
was conducted. These stratification tables have also allowed BlackRock to define risk cohorts for modeling and qualitative review. Missing Data Approach and Assumptions BlackRock made certain modeling assumptions for missing data which were consistent across Banks as well as with the assumptions made for other segments of the Commercial portfolio.

93 | Bank of Greece
CRE - Methodology
BlackRock employed a two-part methodology for the purposes of estimating the CLPs for the CRE loan portfolios. The first part consisted of a fundamental loan re-underwriting and forecasting of losses for a selected sample of loans as part of the Large Loan Underwriting (“Large Loan Sample”). The second part consisted of statistical loss forecasting for the remaining portfolio (“Out of Sample Portfolio”) according to a ratings-based expected loss approach. Both steps incorporated several CRE-specific factors, including guarantees, interest reserves, estimated workout costs, and projected liquidation haircuts. This approach was collectively supported by findings from: (i) due diligence meetings with Bank management; (ii) review of loan collateral valuation practices; (iii) sample based loan file reviews; iv) external desktop valuation on a sample of real estate assets backing the loans; (v) review and analysis of historical performance and credit ratings migration data, and; (vi) external historical and projected research for real estate market performance, which were then approved by SOE (Body of Sworn-in Valuers, the professional body of appraisers in Greece). These qualitative findings helped inform BlackRock’s modeling assumptions and strengthened the robustness of both the deterministic and statistical outputs.
A. Manual Re-Underwriting for Large Loan Sample Portfolio BlackRock conducted a detailed fundamental credit underwriting on a sample of loans (“Large Loan Sample Portfolio”). The Sample Portfolio was selected by BlackRock from exposures greater than €25 MM at the Borrower Group level. Specific loans were selected in order to gain insight into the general characteristics of the Greek CRE market and insight into the accuracy of each Bank’s internal ratings and ratings process. The total funded exposure underwritten as part of the Sample Portfolio was €944 MM. Emporiki did not provide CRE loans in its Large Loan submission. For this Sample Portfolio, BlackRock estimated the timing and magnitude of expected losses from individual loans and borrower groups. For each loan in the Sample, losses derived directly from the underwriting analysis were used in the final analysis. In addition to estimating losses for the Sample Portfolio, BlackRock also estimated what it believed to be the appropriate current credit ratings based on the Moody’s rating scale for each loan in the portfolio. This provided a level of uniformity in ratings across Banks to allow for a comparison of relative loan quality with estimated credit loss projections.
The BlackRock CRE underwriting team consisted of 4 staff members (two of which were RICS qualified), each with 5-10 years of experience in CRE financing and/or workout and restructuring of distressed CRE portfolios. The physical files for each loan were made available by the Banks in a physical data room located at the respective Bank’s premises. One underwriter was assigned to each loan and was responsible for the underwriting from start to finish. Each underwriting was “peer reviewed” by the leadership committee of the CRE team and the team of underwriters.
Bottom - up Underwriting
Loss Projections
Estimate of Moody ’ s Ratings
Final Analysis – Manually underwritten losses used
Bottom-up Re-Underwriting and Fundamental Analysis
Formulation of NOI and Property Value Forecasts
Estimated Loss and Loss Timing Projections, Ratings Estimates
Large Loan Sample Portfolio Losses Incorporated Into Final Results
Statistical Analysis on Out-of-Sample Portfolio
Loss Projections on Sample Portfolio
Bottom-Up Underwriting on Sample Portfolio
Final Credit Loss Projections for all CRE Loans
Part 1 (A. below) Part 2 (B. below)

94 | Bank of Greece
BlackRock re-underwriting included a comprehensive review of the physical (and in a few cases, electronic) files made available by the Banks. The files typically included the original credit memorandum and underwriting analysis as well as original and updated appraisals, borrower financials, and information regarding any guarantees, cross-collateralization or other structural loan features. To the extent any clarification or further information was required specific to a loan, the underwriters sent their questions to the respective relationship manager for that exposure within the Bank. A follow-up discussion was then held with the relationship manager either electronically or via conference calls or in-person meetings. In addition to reviewing the loan files, BlackRock performed a physical inspection of each property located within the Attica region. Cushman and Wakefield was appointed to perform desktop valuations for the majority of the collateral securing the CRE loans to obtain additional data points. Through the review of this information, BlackRock was able to develop an asset summary report (“ASR”) template and evaluate overall borrower strength and payment capacity. Additionally, the underwriters searched for and reviewed publicly available information about each of the borrowers to incorporate in their analysis. Various industry and external market research resources were employed in creating an informed opinion on the loan exposures. BlackRock created a summary of CRE market trends and projections using various sources of market and industry research and commentary. Finally, BlackRock developed asset value projections by property type and region for the fundamental analysis and loan loss model. Once the individual loans were reviewed and market data was collected, BlackRock derived the net operating income (“NOI”) for each property, projecting future cash flows based on market lease rates and occupancy assumptions. BlackRock used these derived NOIs to forecast debt service coverage ratios (“DSCRs”) for each property. Additionally, BlackRock derived the current and projected property valuations to calculate loan-to-value ratios (“LTV”). Large Loan Sample Portfolio - Loss Projections
BlackRock derived bespoke credit losses as well as timing of losses for each CRE loan in the Sample
Portfolio for each Group A Bank. These losses were incorporated in the aggregate expected losses per
Bank.
B. Statistical Loss Forecasting for Out of Sample CRE Loan Portfolio For the loans which were not part of the Large Loan Sample Portfolio and were not manually re-underwritten (the “Out of Sample” Portfolio), BlackRock employed a ratings based expected loss approach. This approach incorporates exposure at default (“EAD”), probability of default (“PD”) and loss-given-default (“LGD”) as the main parameters in estimating losses over time. The CLP on an individual CRE loan is calculated as follows:
CLP = EAD * PD * LGD Exposure at Default (EAD) The exposure at default represents the entire funded balance exposure and an assessment of the likelihood of future draws on existing Bank commitments. In determining the EAD assumptions, BlackRock considered the funded, unfunded-committed and unfunded-uncommitted exposures. The EAD is calculated as follows:
EAD = 100% of the Current Funded Balance + 10% of the Unfunded Committed Balance + 5% of the Unfunded Uncommitted Balance
In addition, if an exposure was currently in default, no further draws on the unfunded balances were assumed Furthermore, BlackRock incorporated amortization assumptions into the EAD calculations. For CRE loans identified as amortizing, BlackRock assumed amortization of 3% per year in the base case, and 2% in the stress case. Probability of Default (PD)
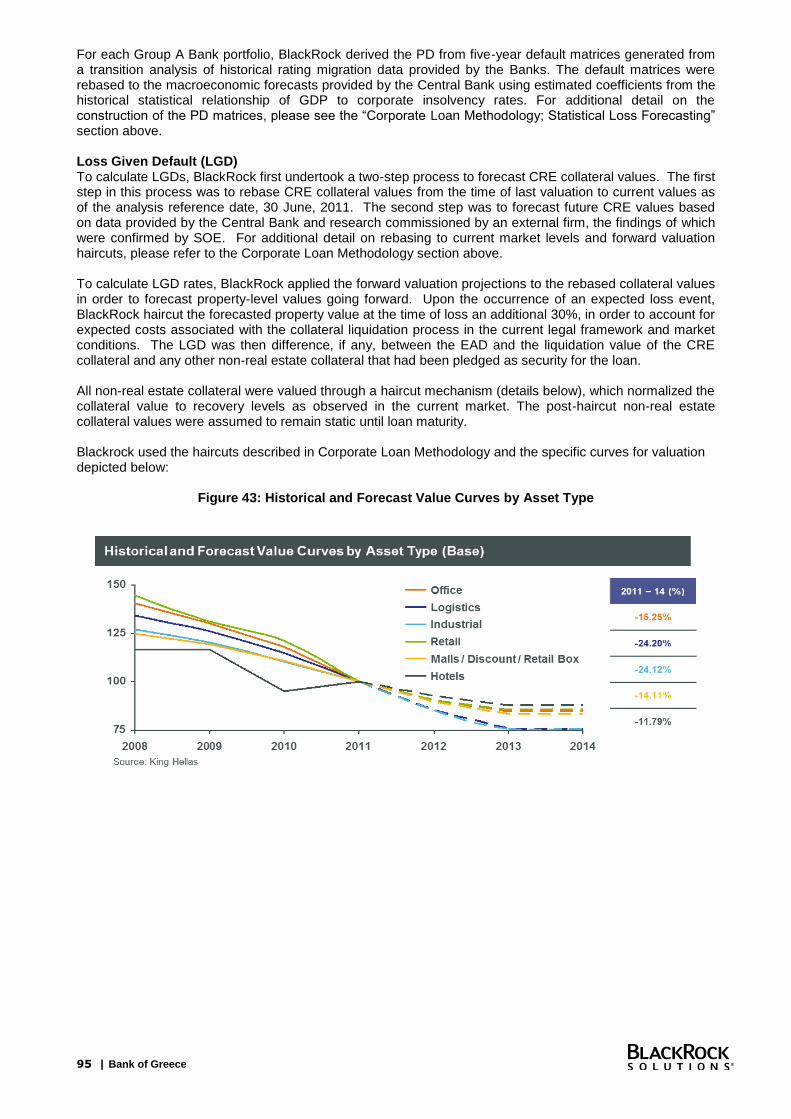
95 | Bank of Greece
For each Group A Bank portfolio, BlackRock derived the PD from five-year default matrices generated from a transition analysis of historical rating migration data provided by the Banks. The default matrices were rebased to the macroeconomic forecasts provided by the Central Bank using estimated coefficients from the historical statistical relationship of GDP to corporate insolvency rates. For additional detail on the construction of the PD matrices, please see the “Corporate Loan Methodology; Statistical Loss Forecasting” section above. Loss Given Default (LGD) To calculate LGDs, BlackRock first undertook a two-step process to forecast CRE collateral values. The first step in this process was to rebase CRE collateral values from the time of last valuation to current values as of the analysis reference date, 30 June, 2011. The second step was to forecast future CRE values based on data provided by the Central Bank and research commissioned by an external firm, the findings of which were confirmed by SOE. For additional detail on rebasing to current market levels and forward valuation haircuts, please refer to the Corporate Loan Methodology section above. To calculate LGD rates, BlackRock applied the forward valuation projections to the rebased collateral values in order to forecast property-level values going forward. Upon the occurrence of an expected loss event, BlackRock haircut the forecasted property value at the time of loss an additional 30%, in order to account for expected costs associated with the collateral liquidation process in the current legal framework and market conditions. The LGD was then difference, if any, between the EAD and the liquidation value of the CRE collateral and any other non-real estate collateral that had been pledged as security for the loan. All non-real estate collateral were valued through a haircut mechanism (details below), which normalized the collateral value to recovery levels as observed in the current market. The post-haircut non-real estate collateral values were assumed to remain static until loan maturity. Blackrock used the haircuts described in Corporate Loan Methodology and the specific curves for valuation depicted below:
Figure 43: Historical and Forecast Value Curves by Asset Type

96 | Bank of Greece
Figure 44: Aggregate Real Estate Valuation Projections (Base and Stress)
Aggregate Real Estate Valuation Projections (Base and Stress)
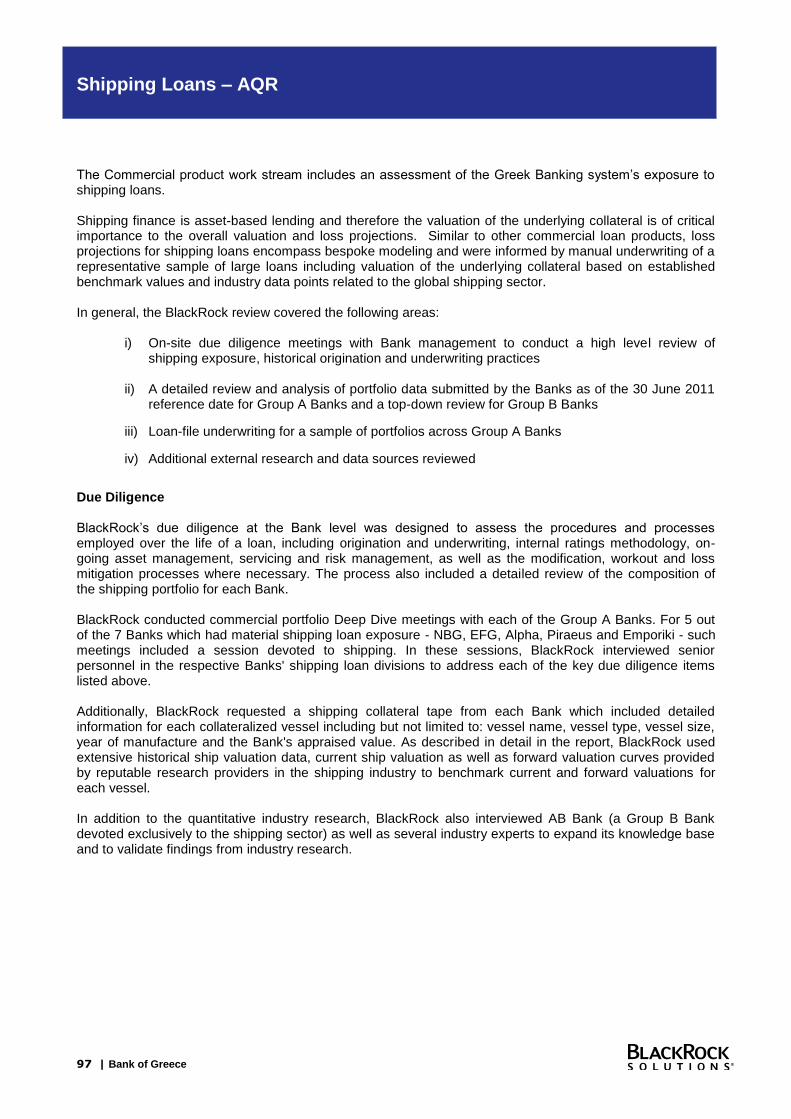
97 | Bank of Greece
Shipping Loans – AQR
The Commercial product work stream includes an assessment of the Greek Banking system’s exposure to shipping loans. Shipping finance is asset-based lending and therefore the valuation of the underlying collateral is of critical importance to the overall valuation and loss projections. Similar to other commercial loan products, loss projections for shipping loans encompass bespoke modeling and were informed by manual underwriting of a representative sample of large loans including valuation of the underlying collateral based on established benchmark values and industry data points related to the global shipping sector. In general, the BlackRock review covered the following areas:
i) On-site due diligence meetings with Bank management to conduct a high level review of shipping exposure, historical origination and underwriting practices
ii) A detailed review and analysis of portfolio data submitted by the Banks as of the 30 June 2011 reference date for Group A Banks and a top-down review for Group B Banks
iii) Loan-file underwriting for a sample of portfolios across Group A Banks
iv) Additional external research and data sources reviewed
Due Diligence BlackRock’s due diligence at the Bank level was designed to assess the procedures and processes employed over the life of a loan, including origination and underwriting, internal ratings methodology, on-going asset management, servicing and risk management, as well as the modification, workout and loss mitigation processes where necessary. The process also included a detailed review of the composition of the shipping portfolio for each Bank. BlackRock conducted commercial portfolio Deep Dive meetings with each of the Group A Banks. For 5 out of the 7 Banks which had material shipping loan exposure - NBG, EFG, Alpha, Piraeus and Emporiki - such meetings included a session devoted to shipping. In these sessions, BlackRock interviewed senior personnel in the respective Banks' shipping loan divisions to address each of the key due diligence items listed above. Additionally, BlackRock requested a shipping collateral tape from each Bank which included detailed information for each collateralized vessel including but not limited to: vessel name, vessel type, vessel size, year of manufacture and the Bank's appraised value. As described in detail in the report, BlackRock used extensive historical ship valuation data, current ship valuation as well as forward valuation curves provided by reputable research providers in the shipping industry to benchmark current and forward valuations for each vessel. In addition to the quantitative industry research, BlackRock also interviewed AB Bank (a Group B Bank devoted exclusively to the shipping sector) as well as several industry experts to expand its knowledge base and to validate findings from industry research.

98 | Bank of Greece
Stratifications The chart below shows some of the key stratifications observed across the Group A Banks.
Figure 45: Vessel Count by Age
0 to 4 5 to 9 10 to 14 15 to 24 25+ Total
Bulk Carrier 130 62 62 73 40 367
Capesize 45 16 3 17 2 83
Handymax 31 20 16 24 21 112
Handysize 21 8 8 11 15 63
Panamax 21 17 35 21 1 95
SMALL 12 1 1 14
Container 27 8 15 23 10 83
Container 27 8 15 23 10 83
Passenger 4 14 47 30 45 140
Passenger 4 14 47 30 45 140
Specialized 11 4 3 9 19 46
Specialized 11 4 3 9 19 46
Tanker 133 90 27 74 16 340
Aframax 14 17 3 34
Handy-Product 8 16 5 1 30
MR-Product 42 8 4 14 3 71
Panamax 18 28 8 18 1 73
SMALL 27 14 11 20 11 83
Suezmax 19 3 3 10 35
VLCC 5 4 1 4 14
Grand Total 305 178 154 209 130 976 Sample Selection and File Reviews The total shipping exposure – defined as the total funded balance - for the 5 Group A Banks involved in ship lending amounts to €7.5 BN. €5.5 BN represent large loan exposures. To assess the quality of the shipping loans, BlackRock conducted on-site loan file reviews and manually re-underwrote a selected sample of 39 large loans, equivalent to €1.9 BN of funded balance. BlackRock also assessed detailed information received from the 5 Banks in terms of loan and collateral data tapes.
Manual Re-underwriting Methodology
The re-underwriting of the sample shipping loans primarily relied on the assessment of Loan-to-appraised Vessel value (“LTV”). The likelihood of default is determined by evaluating the LTV on a current and forward looking basis, the long-term employment of the vessel including charter status, the borrowers’ financial strength and their ability to meet their obligations as well as the presence of corporate/personal guarantees. Collateral valuation was a critical component of this analysis. BlackRock engaged a reputable international ship appraisers (“Provider A”) to value a subset of the underlying vessels collateralizing the loans. BlackRock received current valuations for 51 different vessels representing various ship types and age categories. In addition, BlackRock engaged a leading provider of shipping analytical services (“Provider B”) to gain an understanding of expected future values for various ship types and age categories. This forecast was used by BlackRock to inform the construction of forward valuation curves. More detailed information on this is provided in a later section.

99 | Bank of Greece
For calculating current value of collateral for each loan in the sample, BlackRock used the charter-free valuation provided by Provider A for the specific vessel where available. In other cases, proxy values based on valuation of similar vessels were used.

100 | Bank of Greece
Shipping Loans - Methodology
Loss Projection Methodology Loan-level losses were calculated based on the relationship:
CLP = EAD x PD x LGD Calculation of Total Exposure The current funded balance was used for the total exposure at Year 0. It was observed during the large loan underwriting process that the remaining unfunded exposure was generally of high quality. Several commitments for building new ships which were out-of-the-money had been cancelled or restructured to bring the exposure in line with the current market valuation. As a result, for modeling purposes it was deemed inappropriate to assume draws on the unfunded amounts without a corresponding increase in collateral valuation. Additionally, a principal amortization rate of 6% per year was used across the Banks. This was consistent with the amortization rates observed during the large loan underwriting exercise. Calculation of Probability of Default BlackRock applied the findings from the Large Loan Underwriting across the remaining shipping portfolio to extrapolate loss estimates. Specifically, for the re-underwritten sample, BlackRock mapped the internal rating for each Bank to the Moody’s rating scale. BlackRock then calculated the average difference between the mapped internal ratings of each Bank and the ratings determined by BlackRock’s re-underwriting process to arrive at Bank-specific BlackRock Portfolio Rating Adjustments. BlackRock applied this Adjustment across the exposures that were not part of the manual re-underwriting sample. The adjusted ratings were, through the application of Moody’s idealized corporate default matrix, used to generate PD for the shipping loans. Calculation of Loss Given Default
The Loss Given Default (LGD) for all loans was determined by the LTV of the collateral at the time of default. In order to determine collateral value, BlackRock categorized each of the vessels into one of 15 different vessel types and 6 different age categories. This categorization (shown in Figure 46 below) covered the entire universe of vessels financed by each of the Banks.
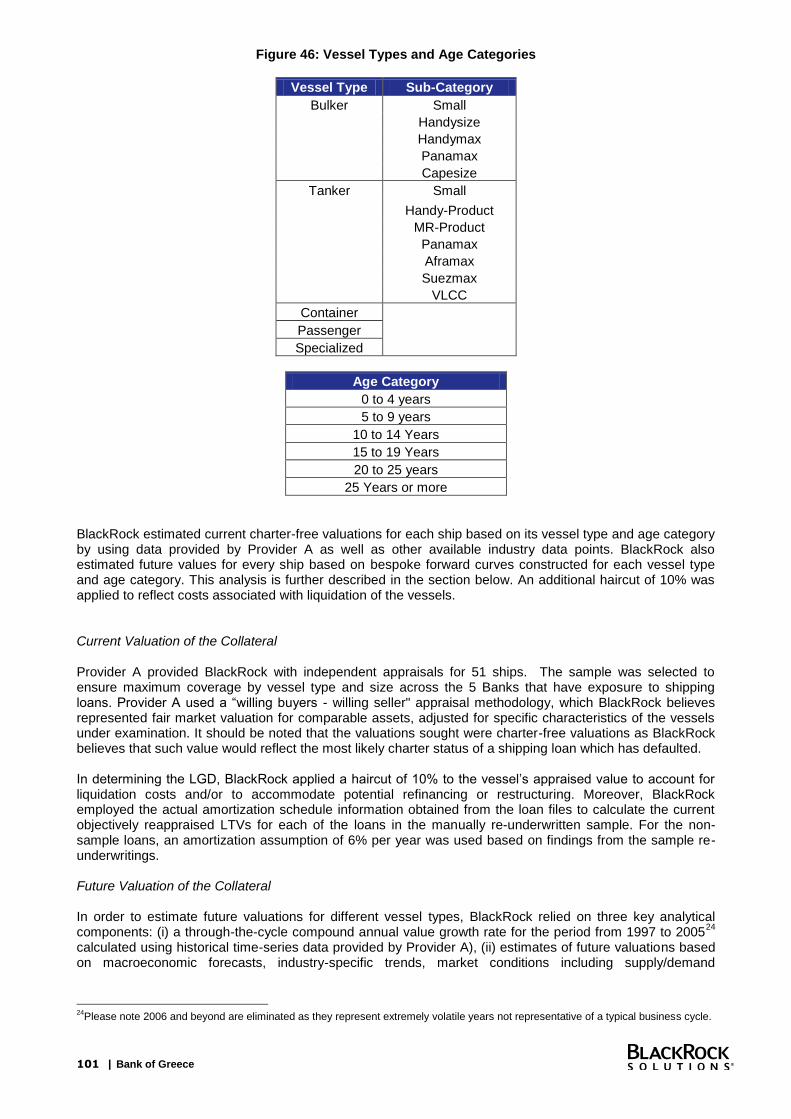
101 | Bank of Greece
Figure 46: Vessel Types and Age Categories
Vessel Type Sub-Category
Bulker Small
Handysize
Handymax
Panamax
Capesize
Tanker Small
Handy-Product
MR-Product
Panamax
Aframax
Suezmax
VLCC
Container
Passenger
Specialized
Age Category
0 to 4 years
5 to 9 years
10 to 14 Years
15 to 19 Years
20 to 25 years
25 Years or more
BlackRock estimated current charter-free valuations for each ship based on its vessel type and age category by using data provided by Provider A as well as other available industry data points. BlackRock also estimated future values for every ship based on bespoke forward curves constructed for each vessel type and age category. This analysis is further described in the section below. An additional haircut of 10% was applied to reflect costs associated with liquidation of the vessels.
Current Valuation of the Collateral Provider A provided BlackRock with independent appraisals for 51 ships. The sample was selected to ensure maximum coverage by vessel type and size across the 5 Banks that have exposure to shipping loans. Provider A used a “willing buyers - willing seller" appraisal methodology, which BlackRock believes represented fair market valuation for comparable assets, adjusted for specific characteristics of the vessels under examination. It should be noted that the valuations sought were charter-free valuations as BlackRock believes that such value would reflect the most likely charter status of a shipping loan which has defaulted. In determining the LGD, BlackRock applied a haircut of 10% to the vessel’s appraised value to account for liquidation costs and/or to accommodate potential refinancing or restructuring. Moreover, BlackRock employed the actual amortization schedule information obtained from the loan files to calculate the current objectively reappraised LTVs for each of the loans in the manually re-underwritten sample. For the non-sample loans, an amortization assumption of 6% per year was used based on findings from the sample re-underwritings. Future Valuation of the Collateral In order to estimate future valuations for different vessel types, BlackRock relied on three key analytical components: (i) a through-the-cycle compound annual value growth rate for the period from 1997 to 2005
24
calculated using historical time-series data provided by Provider A), (ii) estimates of future valuations based on macroeconomic forecasts, industry-specific trends, market conditions including supply/demand
24
Please note 2006 and beyond are eliminated as they represent extremely volatile years not representative of a typical business cycle.

102 | Bank of Greece
imbalances provided by Provider B; and (iii) annual depreciation factors for various vessel types (calculated using historical time-series data provided by Provider A). BlackRock created forward valuation curves for 15 different ship categories across 6 different age categories. Two distinct forward curves were created for each category – one based on historical time series data and the other based on Provider B analytics. For the Base case analysis, the arithmetic average of the two curves was used to construct the BlackRock base curve. In the stress case, the BlackRock base case curve was adjusted downwards by the delta between the Provider B base and Stress case curves for each category. The collateral valuation curve hence obtained was used to calculate current and forward LGDs under both base and stress case scenarios.
Key Loss Drivers The relative difference in the loss profile for the 5 Banks was largely explained by the LTV distribution of the underlying portfolio for each Bank. It should be noted that even though forward values were generally expected to decline, the adverse impact of projected value declines was to a certain extent offset by the 6% annual amortization assumption.

103 | Bank of Greece
Disclaimer
This material was prepared solely for the exclusive use of the Bank of Greece, is not intended to be relied upon by any other party or persons, and should not be relied upon by any other party or persons. Accordingly, BlackRock accepts no liability or responsibility to any other party or person in connection with this material or work product. Any analysis or projections contained in this work product are advisory and estimated in nature and are based on assumptions and models. The information and opinions contained in this material are derived from proprietary and non-proprietary sources deemed by BlackRock to be reliable, are not necessarily all inclusive and are not guaranteed as to accuracy. This draft is not intended to make any recommendations or solicit any actions on the part of the reader. Any reliance on this draft is taken at the risk of the reader. This material is not intended to be relied upon as a forecast, research or investment advice, and is not a recommendation, offer or solicitation to buy or sell any securities or to adopt any investment strategy. ©2012 BlackRock Financial Management, Inc., All Rights Reserved.