Diagnosing the intbalance of Glaciar Santa Rosa ... · Journal oJ Glaciolog)', Vol. 42, "Vo. 141....
7
Journal oJ Glaciolog)', Vol. 42, "Vo. 1 41. 1 996 Diagnosing the intbalance of Glaciar Santa Rosa, Cordillera Raura, Peru AL CID ES A\I ES D il , isioll de Glaciologia de Electro/Jeru, Huaraz, Allcas/z, Peru STEFAN H ASTEi'\RATH De/Jarlmen t oJ AlmosjJheric and Oceanic S ciences, Unive rsilJl ll 'iscollsill -j \;[adisoll, 1 225 ll 'esl D (l)llolI Street, Nf adisoll, l1 'iscoIIsin 53706-1490, U.S.A. ABSTRACT . For Gl ac ia l' Santa R osa, in the Cordillera Raura, Pe ru , the ex tent and \'01 u m e are determ i ned [or 1980 a nd 196 1 fr om to pog ra phi c ma ppi ng, a nd for (\\'0 und a ted ea rlier stages U\1E and r-IAX from mora in es . Th e reg im e of the glacier in terms of ice fl o \\" and mass balance is eva lu a ted for th e 1 977- 83 period. :-Iore than half of th e \\ 'a ter di sc harge fro m the glacier is not renewed by pr ecipit at ion but s uppli ed by the ice thinnin g. Th e rate of surf ace lowe ring of 2 m a 1 liquid-wa ter eq uivalent co rr es po nd ' to an en ergy amount for melting of 22 \V m- 2 Sensiti\' it y anal yses o[ Glaciar Yanamar ey in the nearby Co rdill era Bl anca show th at such a decrease of energy ava ila bl e for me ltin g co uld be pro du ced by a cl o udin ess in crease o[ one-tenth, an a ir te mp erature decrease o[ more than 2°C, a decrease in spec ifi c humidi ty o[ I g kg I, or so me co mbin ation of h ea t-b ud get processes. Such chan ges in the at mos ph e ri c enviro nm e nt would be req uired to tabilize the glacier a t its recent vo lume. As ano th er ind i ca tion o[ the r ece nt imb alance, the maximum \'olu me flu x is found abo ut l OO m b el ow the equilibrium-lin e altitude. U nd er con tinu a ti on of recent clima ti c co nditions, the gl ac ier may di sa pp ea r wi thin a f ew decad es . T hese inf erences co rr oborate a recent as essment [or the neigh boring Co rdill era Bl anca. 1. INTRODUCTION Mo unt a in glaciers are se nsiti\'e indi ca tors of clima ti c \'a ri a ti ons, and th eir role is genera ll y recog ni ze d in interna ti onal efforts to s tud y global change. Sustained glaciologi ca l obser va ti on pr ogra ms are, however, ex tr e- mel y r are in th e tropi ca l ha lf of the Ea rth (H ae be rli a nd Hoelzle, 1993; Haeberli a nd o th ers, 1993 ). With this bac kgro und , the field obsen'a ti ons ma int ained ove r ex te nd ed pe ri ods in the And es of no rth e rn Peru are particularly \'a lu able (Am es a nd ot hes, 1988). In two recen t papers (Haste nr a th and Ames, 1995a, b) we analyzed the long-term glaciological rec ord of Glaciar Yanamarey in Peru's Cordillera Bl an ca . Expanding on that effo rt , \\ 'e now s tud y a glacier in a neighboring mo unt a in region o[ Pe ru. Th e obse rva tions on Glaciar Sa nt a R osa in th e Cordillera Raura span 6 years and are evalua ted here to assess the mode of opera ti on of this tropi ca l glacier in the co n tex t of th e on go in g dr astic ice recess io n. 2. OBSERVATIONS Th e obsen 'a ti onal basis for t hi s stud y consists of ma ppin g of the ice-s urf ace to p og ra ph y, net ba lance measureme nt s at a net wor k of stakes a nd determina ti on of surface ice- 2 12 fl ow ve locity from repeated s ur veys of th ese sta kes . Th e s urf ace topography of the glacier was mapped by terr es trial triang ul a ti on on 27 M ay 1980, a t sca le 1 : 5000 and with a contour sp ac in g of 5 m. Th e technique co nsisted of double th eodo li te t ri a ng ul a ti on fr om prec- isio n- sur\'eyed control po int s on rock outside th e glacier. Th ese ref ere n ce points are ti ed in to the UTM: coo rdinate system (In s titut o Geogra fi co Militar, 1969, 1972). A sim p lifi ed map at reduced sca le is reproduced in Fi g ur e I. T olerance is estimated at be tt er than I III in th e ve rti ca l. A map wi th date 16 O ct obe r 196 1 at th e sa m e sca le and with the same conto ur spacing was pro du ced by Geomecani ca, Lim a, by ster eo -ph otogra mm etric analys is of hi sto ri ca l vertical air ph otog raphs (AF - 60 -1 7, VV- AS T- 9, 1370 PMW -1\ 17, fr a m es 779 to 78 1) a nd usin g identified te rr ain-co ntr ol po in ts. Tolerance in vertical topography is es timated at a few meter s. Al so ava ila bl e are the o fli cial I : 25 000 top ogr ap hi c shee ts ( In s titu to Geogra fi co Milit ar, 1969, 1972 ). In to these, the m ora in es id ent ifi ed in the 1 96 1 a ir ph otographs were plotted a nd th en tr ansposed into the map (Fig. I). l'i et balan ce h as bee n m eas u red at a ne twork of stakes ri"o m Sept e mb er 1977 t hr ough Decembe r 1983. Density measureme nt s in represe nt a ti ve ly located pit s pe rmitt ed th e co n ve rsion of readings of height changes int o liquid- wa ter eq ui va le nt s. Th e stake netl· \'o rk \'a ried over the measureme nt pe ri od, with in co mplete cover age in the
Transcript of Diagnosing the intbalance of Glaciar Santa Rosa ... · Journal oJ Glaciolog)', Vol. 42, "Vo. 141....

Journal oJ Glaciolog)', Vol. 42, "Vo. 141. 1996
Diagnosing the intbalance of Glaciar Santa Rosa, Cordillera Raura, Peru
ALCIDES A\IES
Dil,isioll de Glaciologia de Electro/Jeru, Huaraz, Allcas/z, Peru
STEFAN H ASTEi'\RATH
De/Jarlment oJ AlmosjJheric and Oceanic Sciences, UniversilJl ~f l l'iscollsill-j\;[adisoll, 1225 l l'esl D (l)llolI Street, Nf adisoll, l1 'iscoIIsin 53706-1490, U.S.A.
ABSTRACT. For Gl ac ia l' Santa R osa, in the Cordill era R a ura, Peru , th e ex tent and \'01 u m e are determ i ned [or 1980 a nd 196 1 from to pogra phi c ma ppi ng, a nd for (\\'0 und a ted earlier stages U\1E and r-IAX from mora ines . Th e regime of th e g lac ier in terms of ice fl o\\" and mass ba lance is evalua ted for the 1977- 83 period. :-Io re th an half of th e \\'a te r discha rge fro m the glacier is no t renewed by precipitat ion but suppli ed by the ice thinning. The ra te of surface lowering of 2 m a 1 liquid-wa ter eq uivalent correspond ' to an energy amount for m elting of 22 \ V m- 2 Sensiti\'ity a na lyses o[ Glacia r Ya namarey in th e nea rby Cordill era Blanca show tha t such a d ec rease of energy availa bl e for melting co uld be produced by a cloudin ess increase o[ o ne-tenth , an air tempera ture dec rease o[ more th a n 2°C, a decrease in spec ifi c humidi ty o[ I g kg I , or some combina tion of hea t- b udge t processes. Su ch cha nges in the atmosph eri c environment would be req ui red to tabilize the glacier a t its recent vo lum e. As anoth er ind ica tion o[ the recen t imbalance, th e max imum \'o lu me flu x is found a bo ut l OO m below the equilibrium-lin e altitude. U nd er con tinu a ti o n of recent clima ti c conditions, the glac ier may disappear wi thin a few d ecades . T hese inferences co rrobora te a recent as essment [or the neig h boring Cordillera Blanca.
1. INTRODUCTION
Mountain glac iers a re se nsiti \'e indi ca tors of clim a ti c \'a ri a ti o ns, and th eir ro le is generall y recogni zed in intern a tional efforts to stud y globa l cha nge. Susta ined glac io logical observa tion programs a re, h owever, ex tremel y rare in th e tropical ha lf of the Earth (H ae berli a nd Hoelzle, 1993; Hae berli a nd others, 1993 ) . With thi s backg round , the field o bse n 'a ti ons m a intained ove r ex tend ed periods in the Andes of northern Peru a re pa rti cul a rly \'aluable (Ames and othes, 1988). In two recen t p a pers (H as tenra th a nd Ames, 1995a, b) we ana lyzed the long-term g lac iologica l record of Glacia r Yana m a rey in Peru 's Cordill era Bl anca . E xpanding on tha t effo rt , \\'e now study a glacier in a neighboring mounta in region o[ Peru. Th e obse rva tions on Glac ia r Santa R osa in the Cordill era Raura spa n 6 yea rs and a re eva lu a ted here to assess th e mode of op era ti on of this tropica l g lacier in the con tex t of the ongoing drastic ice recess ion.
2. OBSERVATIONS
The obsen 'a ti onal basis fo r thi s stud y consists of mapping of th e ice-surface to pogra ph y, net bala nce measurements a t a ne twork of sta kes a nd d ete rmina tio n of surface ice-
212
fl ow veloc ity from repea ted surveys of these sta kes . The surface topograph y o f the glacier was m a pped by
terres tri a l tri a ngula ti on on 27 M ay 1980, a t scale 1 : 5000 and with a contour spacing of 5 m. The technique consisted of d ouble theod oli te tri a ngula ti on from precision-sur\'eyed con trol points on rock outsid e the glacier. These reference points are tied in to the UTM: coordinate system (Instituto Geog ra fi co Mili tar, 1969, 1972) . A sim plifi ed m ap a t reduced sca le is reproduced in Figure I . T olerance is es tima ted a t be tte r th an I III in the ve rti ca l.
A map wi th da te 16 O c tober 196 1 at the same sca le a nd with th e same con tour spacing was produ ced by Geomecanica, Lima, by ste reo-photogrammetri c ana lysis of histo ri cal verti cal air p hotograp hs (AF -60-1 7, VVAST-9, 1370 PMW -1\17, fr a m es 779 to 78 1) a nd using identifi ed terrain-control poin ts. T olerance in vertica l to pography is es tima ted a t a few meters.
Also availa bl e are the o fli cia l I : 25 000 topograp hic shee ts (Institu to Geografi co Milita r, 1969, 1972 ). In to these, the moraines identifi ed in the 196 1 air photographs were plo tted a nd th en tra nsposed into the m a p (Fig. I) .
l'i et balance has been meas u red a t a network of stakes ri"om September 1977 through D ecember 1983. Density measurements in representa ti ve ly loca ted pits permitted th e conversion of readings of height changes into liquidwa ter eq uiva lents. The sta ke netl·\'o rk \'ari ed over the meas urement peri od, with in complete coverage in the

HUARAZ "-o CORDILLERA
RAURA )
LIMA ! BOW 70W
(;
8.840.000 N (;
8.839.000 N -
J ./
-- -'- - MAX - -
:l ilies alld Haslenralli: imbalance oJ Glacial' Sanla Rosa
5000
(;
./
./ (;
/
/
/
/
I I .
0 m 500
310.000 E 311.000 E
Fig . i . . I/a/) oJGlaciar Sallla ROJa. 27 ,1/a,.1' 1980. COl/lollr lines are al50 11/ J/Jarillg . a/HI/triangles del/ale terrain-conlrol /Joillls . and rirdes Ihe loealioll ol"fl balance alld lIIol ion slakes. /Uso elllered i.1 a {'mlmllollgiludillal line u'ilh lick marks at 100 III inlen'als (see FigJ' 2 and 3) . T hin brokeJI lille indicates lIte /96/ bOIlIlr/a t) ' It'here diJIeren l from 1980. An earlier ll1a.lilllllll1 e.l/enl inferred Ji-OIl1 huge lI10raineJ is indiraled ~J ' he({1~JI solid lille ( L IfE ) . . -I .Yel earlier moraine s),J lem is showlI ~J' he{{/~I' broken lille and denoled a:, .If.-l.\'. Scale / : 25000. insel ill II/!/Jer Idi corner is localion of Cordilfera Raul'{t within Peru .
uppe r reac h es o f th e g lac ie r d uring pan o f th e peri od. i'\ o obsen'a tio ns a rc a\'a il a ble a bo \'(' 5200 m . Th e m a p (Fig. I ) shows th e di stributi o n of stakes in 1982. \ 'a lues a rc
a \'a il a bl e as geomet ri c he ig ht differences a nd as liquid
wa ter eq u i va len ts. Veloc it y m eas urem ents were obra in ed b y repeated
su n 'eys of th e sta ke pos i ti o ns. Obser\ 'a ri o ns \\ '(' re less
nu me ro us in some years th a n o th ers, but a considera ble
sa mpling o f th e veloc ity fi e ld 1I'<1S ob tained OW l' th e 6 yea r
peri od. Disp lace ments in rh e X a nd y coo rdina tes wc re
d e te rmin ed fo r a ll s ta kes, yie ldin g th e ho ri zo nta l com ponents of surface fl ow. In add iti on, 10 1' so me of rh e
sta ti ons th e a bso lu te d e\'a ti o n of a fl xeclm a rk o n th e sta ke
( top of th e stake) was a lso dete rmin ed , thus yielding
measurem en ts o f th e ve rti ca l fl o\\' com po n e n l.
3. DATA ANALYSIS
As a refe ren ce fo r th e a n a lyses a centra l lo ng itudina l line
\\'as chose n w ith lo ngitudin a l di stance counted d O\\'n from
rhe highest part o f th e g lac ie r. This centra l re fe re n ce li ne is show n in Fig ure I a nd is used as lo n g i tudina l
coo rdin a te in Fig ures 2 a nd 3 . The g lac ie r is divided
into 100 m w id e b a nd s, bound ed b y lin es perpendi c ul a r to th e centra l lo n g itudin al lin e .
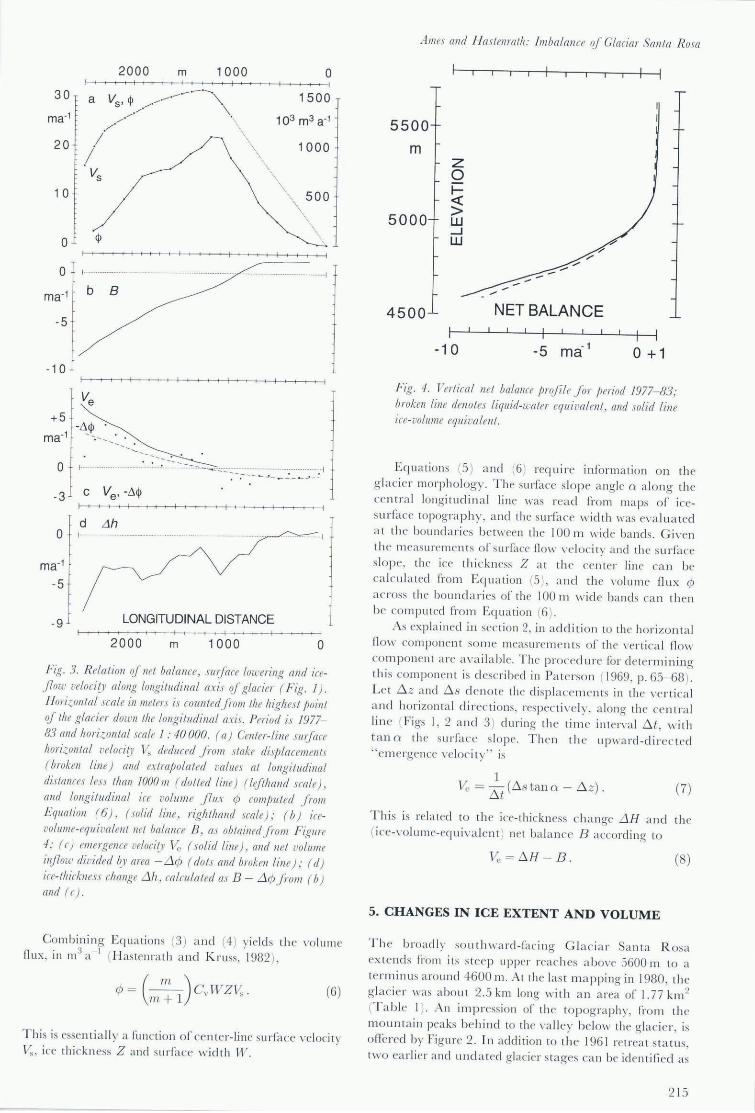
In the cons tructi on of th e represe n ta ti\'e \ 'erti ca l ne t
ba la nce pro fil e, bo rh th e lac k o f readings in th e upper
reaches o r th e g lac ier and th e \'a ri a ti ons from yea r to yea r ha \'e to be ta ken into account. For O c to ber 1977
D ecember 1983, th e net ba la n ce was e\'a lu a ted eve ry
25 m from 4575 m up wa rd . Fo r each of th ese " sta nd a rd "
e le\'a ri ons, th e liquid -wa ter-eq uiva le n t net ba la n ce \\'as a veraged ove r a ll m eas ured vea rs, idea ll y 6 yea rs, th oug h
fewer in th e upper reac hes o f th e glac ier . V a lu es a bo\'e
5200 m a re crud e es tim a tes fi·om ex tra po la tio n. The
res ulta nt (Ii q uid-wa (er-equi \'a le nr ) I'erri ca l n e t ba la nce
pro fil e is di sp layed by th e b ro ken line in Fig ure 4 . 1\ fultipli ca tion b y 1.1 2 yields th e ice-\'o lume-equi\ 'a lent
net ba lance p lo tted in Figure 4 as a solid li ne .
2 13

Journal ~/ Glaeiology
I I 1 f 1 1 1 I
5500
m
5000
I 1 1
----80 61 LME
------- . MAX
~"0.:\ BEDROCK
1 1 1 1 1 1 1 I
.--- .- . - --.- --
---.-4500
LME IMAX I 1 1 1 11 1 1 I 1 1 I 1 I 1 1 1 1 1 1 I
4000 3000 2000 1000 o
Fig. 2. Longitudillal-verlical cross-sectioll along cenlral fine ( Fig. 1) . Cross-hatching denotes bedrock; dash -dolled, dolled, broken and solid lines dellole t/ie ice sUllace topograJ)/I)IJor ,\fAX, LlIJE , 1961 alld /980, respeclive0'. r ntieal tick marks show lerminus l)osiliol1S Jor these dates. Scale 1: 25000. )\'0 verlical exaggeration .
In an elTo rt to cope with tb e uneven co\'Crage of velocity measurements and interannual fl ow "ari ability, it \I'as essenti a l to preserve the characteristic dO\l'I1stream " a ri ation or the fl ow whi le acco unting ror the "ariations in iceflow ,'elocity from yea r to yea r. To tha t end , individu al velocity meas urements rrom nearby stakes were projccted onto the centra l lin e (sce Figs 1- 3) , For each yea r, " a lues at 25 m intervals along this central line ,~'e re ob ta in ed by linear in terpolation between the measured points. For each yea r, these eq uidi sta nt ,'alues were a,'eraged over the 25 points from 1000 to 2500 m longitudina l distance, common to all years, and the "alues a t 25 m spacing were expressed as dcpartures rrom the 1000- 2500 m mean. An overa ll ave rage was th en rormed from th e averages for th e indi,'idual years. The depa rture va lues pre" iously calcula ted for th e individual years were added to thi s Q\'erall mean , so as to obtain six new longitudinal profiles or a bsol u te "eloci t y. These \I'ere th en a ,'eraged to yield a representative longitudina l " elocity profil e.
Fo r the 100 m wide bands d efin ed by the equidistant points a long the centra l longitudina l line (see Fig. I ) , th e va lu es of (ice-volum e-eq ui va lent ) net ba lance were compiled from th e ve rti ca l net ba la nce profi le (Fig . 4 ). Net ba lance, surface lowering a nd velocity were a ll expressed as ra tes per year ( m a- I) .
4. ICE DYNAMICS
The fo llowing treatment or ice-flow d ynamics is based on H astenra th ( 1989 ) a nd on a series or earli er papers (Budd , 1969; Bhatt a nd o thers, 1981; H astenra th a nd Kruss, 1982; Kruss, 1984; Hastenra th a nd Ames, 1995a) . Direc tl y pertinent here a re only th e relationships, desc ribed below in Equations (5) a nd (6), between longitudina l volume flu x cp, center-line surface "elocity 1/,;, ice thi ckness Z, surrace width W , surface slope angle ex a nd various parameters . These param eters a re the constants n a nd k in a power fl ow law, stress-sha pe ractor s, cross-
2 14
section, veloci ty ra ti o Cv, a nd va lley power m. Except ro r k a ll are dimension less. These are introduced in the following equ ations, Supported by ex pe riences w ith similar g laciers (Kruss, 1984), onl y thc dero rma tion a l ve locity is considered h ere and not the sliding , ·elocity. Also, interes t fo cuses on annual mea n conditions rathe r th an seasona l ,'ariations.
I n a power fl ow law, th e , 'erti cally ave raged deforma ti onal velocity
(1)
where Tb is th e cen tcr-line basal shear stress and Z is th e ice thickness. The stress-sha pe racLOr s is introd uced by (Nye 1965 )
Tc = spgZ sin ex (2)
where To ~ Tb is the cen ter-line downs lope stress, p is the ice d e nsity (900 kg m 3), and 9 is the gravitational acce lcration (9.8 III S- 2 ) .
The cross-sectional area is represen ted by:
n =~wz. m+l
Th e cross-sec tion ,'e1oci ty rat io
where 11 is th e cross-scc tion mean velocity.
(3)
(4)
As exp la ined in Kruss ( 1984) for a simila r glacier, the constant s used a re n = 2, k= 0.16bar 2a I, C" = 0 .7, s = 0,9 a nd m = 2. The center-linc surface , 'e loc ity (Bh a tt and others, 1981 ) ,
~= (: : Dk(SpgSin exrzn+1 (5)
or esse nti a ll y a runction o r ice thi ckn ess Z and surrace slope a ng le Q.
2000 m 1000 0 I I I I I , 1
1500
103 m3 a- 1
30 a Vs' ~.//././.--- .- .-..\\. ./ . . /
1000 / .I
20
Vs
1 0 500
0 <P I I I 1 I 1
0 I · .... ··········1
ma-1 b 8
-5
- 1 0 I I 1 I I I I I
Ve
+5
ma-1 -Ll..<P
~--
- '
0 I · · . -~ ___ ................... ············ ········ ··1 - .--- '"-.J_..-':_&...-J __
-3 c Ve , -,t';<P 1 I I I I I
d 6.h 0 I···
ma-1
-5
-9 LONGITUDINAL DISTANCE
2000 m 1000 o
Fig. 3. RP/alioll oJ 111'1 balancl'. s/IIJare lowering alld ireflolL' 1'eloci~) 1 alollg IOllgiludillal ({\is of glacier ( Fig. I ) . / /ori::,ollta/ scale ill lIIelers is roullledjiom Ih e /lI~[{ltesl /Joilll oJ Ihe glacin dowlI Ihe 10llgitudinal alis. Period is 1977 83 alld hori::,olllal swle I .- 40000. ( a) Cenler- fille sur/are hori::,olllal l'eloriO' 11,; deduced Jiom slake dis/Jlacelllenls ( broken fille ) alld e.llra/Jolaled m/lies al LOllgiludillal dislallces less Ihall 1000 III ( dol/I'd line) ( left/wild scale). alld 10llgiludillal ire l'olllme JlIII c/J rom/Jllled ji'olll Equalioll ( 6). (solid lille. rigltlhand swle) ; ( b) irel'olllllle-eqllil'Ct/CIII lIel balance B , as oblained Jrom Figure 4: (e) cmngeJICf l'eloeiO' Vr (soLid lille ) . and 111'1 l'o LlIme i,!/701.(' divided ~J' area - 6. cp ( dols alld brokell lille ) : ( d) ire-thicklless challge 6.h. ralCIIlaled as B - 6.CP.frOIll ( b) alld (c) .
Combining Equations (3) and (+) yields the \ 'o lume flu x, in m3 a 1 ( H as tenra th and Kruss. 1982 ).
(6)
This is essenti a ll y a funClion o f' center- line surface \"(' Ioc it y
v". ice thickness Z and surf'ace w idth lV.
AmI'S and Haslenralh : Imbalanre ~/ Glacial' Sallta R osa
5500 m
5000
4500
z 0 f-or::( > W -l W
-10
NET BALANCE
I
'"
0+1
Fig . ..J. ['erllcal 111'1 balance /Jrojlle Jor /miod 1977- 83: broken lille dei/Oi l'S Iiqllid-l1'aler eqllil'alelll. alld solid lille ice-volllllle eqllil'all'lll.
Equations (5 ) a nd (6) require inf'ormation o n the g lac ie r morphology . The surface slope angle 0' a long lhe centra l longitudin a l line \"as read from maps of' icesurface topog raph y, and th e surface w idth \I' as e\'a lu aled al the boundarie.· between th e 100 m \,·id e bands. G i\'en the measur('ments of'surface flo\, ' \ 'c\oei l\' and the surface slope, the ice thickness Z at th e center line ca n be ca lculated from Equation (5) , a nd the vo lum e flu x <p
across th e boundaries o f' th e 100 III wide bands can th en be computed fro m Equation (6) .
As exp la in ed ill sec tion 2, in add iti on to the horizontal fl o\,' component so m(' meas urem e nlS of the vert ica l fl oll' componen t a rc a\·ai lablc. The procedure fo r determining thi s component is desc ribed in Palcrson ( 1969. p.65- 68 ) . L et D. z and D.s de note the di spla cc lllents in th e \'e rtical a nd horizonta l directions. res pen i\'C ly, a long th e central lin e ( Figs I. 2 a nd 3) during th e lil11 e inten 'a l D. t , with
tanCl' th e surf'ac e slope . Then th e up"'ard-d irected "e l11ergence "eloci l y" is
1 11,. = D.t (t:. s tan a - D. z ) . (7)
Thi s is rela ted to th e ice-thickness c ha nge f'lH and th e (ice-\'olum e-equi\'alent ) nel ba lance B accord ing to
11" = t:.H - B. (8)
5. CHANGES IN ICE EXTENT AND VOLUME
The broadly so uthll'ard -fac in g Gla c iar Sa nta R osa ex tends from its Sleep upper reac h es abOl'C 5600111 to a terminus a round 4600 m. At the last l11apping in 1980, th e g lac ie r lI'as a boul 2 .5km long with an area or 1. 77 kI11 2
(Table I) . An il11press ion of't he topograp hy, from th e mountain peaks behind to th e "alley below th e g lac ie r , is ofTe red by Figu re 2. I n add i tion to the 196 I ret rea 1 sta l us, t\\'o ea rli er and undaled glac ier stages ca n be identified as
2 15

J Ollmal of Glaciology
Table 1. Length, terminlls elevation, area and total volume of Glaciar Sallta Rosa at maximum extent ( MAX) , last maximum e,\lent ( Lill! E) and 011 16 October 1961 and 27 May 1980
MAX LME 196/ 1980
Length (m ) 3900 3320 2600 2500 T erminus (m ) 4308 4435 4570 4580 Area ( 103 m2
) 2679 2186 1826 1774 6 3 Volume ( 10 m ) 331 132 78 73
explained in sec tion 2, nam ely a " maximum ex tent" here d enoted as MAX, and a " Iast maximum ex tent" referred to as L~IE (see Figs I and 2; Table I ).
In addition to the maps of hi g h precision for 1980 and 1961 , it pro\'ed possible to es timate from the m a pping of the mora ines of stages MAX and L:,'IE not only the lateral ice ex tent but also the ice-surface topography. For long itudinal distances beyond 1300 m for LME, a nd beyond 2200 m for MAX , thi s was taken as eq ual to th e eleva tion of the crest of th e latera l moraine, read at 100 m inten ·a ls. Assuming that conditions remained unchanged at the upper ice ma rgin , values for the upper pa rt of the glacier \,'ere obta ined by lin ea r interpolation betweeen, respec tivel y, 0 and 1300 m , and 0 and 2200 m longitudina l distance. Uncertainties in ice-surface topography a re es tim a ted as a few meters fOI- lVIAX up to 2200 m and for LME up to 1300 m longitudinal distan ce, with tolerances substantially large r above those limits.
Table I summarizes the changing ice ex tent and volume for the four mapping states . Frol11 lengths of 3900111 at MAX and 3320 m at LME, th e glacier retreated to 2600 m by 1961 , with a further sho rtening to 2500111 by 1980. Accompanying the retrea t of the g lacier tongue a re a rise of the terminus and massive shrinkages in area and volume from ~lAX to Ll\JE and 196 1, followed by more modest changes over th e presumably mu ch shorter interval 196 1-80. The calculation of the absolute ice volume in 1980 is described in sec ti on 6. In Table I, unce rtainti es are estim ated at a few mete rs for leng th a nd terminus ele\'a tion, about 105 m2 for a rea and about 20 x 106 m3
for the 1980, 1961 and LME volumes, with tol erances as large as 60 x 106 m3 for MAX.
The reconstructed ice-surface topography along the central longitudinal line for fvIAX, LME, 1961 a nd 1980 is shown in Fig ure 2, along with the bedrock topograph y. For the longitudinal distances up to 2500 m the ice thickness and thus th e b edrock topography were calculated from Equa tion (5) using as input th e 6 yea r mea n center- line surface ve locity (Fig. 3a) and the 1980 ice-surface topogra ph y (Fi g. 1) . Tolera n ces in th e calculated ice thickne s Z are estimated as less than 10 m.
6. ICE FLOW AND MASS CONTINUITY
Th e m'Crage functioning of Glaciar Santa Rosa is summa rized in Figure 3. Th e center-line surface velocity (Fig. 3a) peaks around 1300 m longitudinal dis tance with
216
more than 31 m al. This is es ta bli shed by the measuremen ts between 1000 a nd 2500 m longitudina l distance as di scussed in sections 2 and 3, while values upward of 1000 m were obtained b y extrapola tion to zero \'elocity at the upper boundary of the glacier. The surface \'elociti es a t equidistant points a long the central line in Figure 3a, a long with readings of surface slope, se rved as input to Equation (5) to obtain ice-thi ckuess es tim a tes. These are combined with th e 1980 surface topography in th e longi tudina l profil e in Figure 2 to construct the bedrock topography. Figure 2 shows a maximum ice thickness of a bout lOOm at longitudinal distances of 1700- 2000m.
Values of ice thi ckness Z, having thus been crea ted , were used together vvith the measured center-line surface velocity 11,; and width W to ca lcul a te the volume flux cP from Eq uation (6) . Th e resultant long i tudinal profile in Figure 2 exhibits a maximum of 1090 x 103 m3 a 1 at a longi tudinal distance of' 1200 m . Differenti a ting wi th respect to longitudin a l di stance , or forming the difference of volume flu x across successi\'e bounda ries, yields the net outflow or inflow to each 100 m wide band . For mass continuity, this volume-flux divergence would have to be compensated by th e net ba lance minus the cha nge in surface elevation, integra ted over the respecti ve band.
The net ba lance for these ba nds, obtained from the stake network, as d escribed in sec tion 3, is plotted in Fig ures 3b and 4. Net balance is p ositive onl y abo\'e 5000 m, changing to progress i\'ely large r nega tive valu es in th e lower glacier, so that va lu es around - 9m a- I a re fo und nea r the terminus (Fig. 3b) .
The cOI1\'e rgen ce of volume flux calculated from Fig ure 3a by spati a l differentiatio n , and di\·ided by a rea, - 6 cP, is plotted in Figure 3c. The sca tter of points is related to small irregula riti es in th e long itudinal profile of cP shown in Figure 3a. The smooth broken line drawn through th ese points illustra tes dive rge nce of volume flux upwa rd from the volume-flux maxim UJ11 near 1200 J11
longitudin al di stance (Fig. 3a), g iving way to convergen ce fa rther down the glacier. As d escribed in section 4, - 6 cP should be compared to the em e rgence velocity Ve, likewise plotted in Figure 3c . Both curves show the charac teri sti c change towards la rge r positi\'e values down-glacier and overall similar magnitude. However , Vc is in ge nera l som e\"'ha r larger , presumabl y because it represents condi tions at the cen ter lin e rather than a rea ave rages over bands.
Th e ra te of thi ckn ess chan ge by 100 m bands, obtained from th e ne t ba lance (Fi g. 3b) a nd the volume-flux convergen ce (Fig. 3c) , is plotted in Figure 3d. IlTegul ariti es in this cun'e reflect those of -6cP (Fig . 3c) a nd thus stem from derails in the longitudina l profile of the volume flux cP in Figure 3a. Overall , however , Figure 3d shows the realisti c p a ttern of ice-thinning increasing from near zero at 700 m longitudinal dista nce to values of more th a n 5 m a 1 near the terminus. For th e glac ier as a whole the ra te of volume change is -3163 X 103 m3 a I, which with a 1980 area of 1774 x 103 m 2
a mounts to a glacie r-average ra te of ice- thi ckn ess change of - I. 78 m al.
Figure 3 synth es izes the genera l mode of operation of Glaciar Santa Rosa. From th e nature of the observation se t it is diffi cult to estimate the uncertainti es in th e various e lem enrs. The present appraisa l follows the considerations

in a stud y ofGl acia r Yana ma rey (H as tenrat h a nd Ames, 1995a). As representa ti\ 'C o f the multi- yea r ave rage conditi ons, surface i ce-O o '~1 ve loc i ty v" may be ca ptured a t better th a n 10% . Because o f the cubi c rela ti o nship in Equa ti on (5 ), ice thi ckn ess is fo rma ll y constra ined more narrowl y, but as a model res ult no error m a rg in much be tter tha n 10% should be cla imed . From such to le ra nccs fo r Vs a nd Z, the uncertainty in the volume flu x cjJ comes closer to 20%. A gain , as representa ti ve of multi- a nnua l m ean conditio n s, to lera nces of a bout 10 % may be assigned to ne t ba la nce B . The surface-lowering ra tc - !:::.h a nd th e em erge nce \'eloc it y v" may be eve n less well d etermined. E stima tes of a ll elem ents a re p a rti cul a rl y un ce rta in fo r th e poorl y obse rved upper reaches of th e glac ier.
R egardin g th e age of th e ice \\'ithin Glac ia r Sa nta Rosa, a n ave rage residence tim e can be calcul a ted by dividing th e \'o lume of th e upper glacier by th e o utfl o\\' ra te. T o th a t e nd , a n es tima te o f the a bsolute ice thickn ess a nd volume in 1980 was d eri ved as follows. A ssuming pa raboli c sha p e, the center-li ne d epth com pu ted from Equa ti on (6) a nd plo tted in Fig ure 2, along with the o bse n 'ed width , d efin e th e bedrock to pogra ph y a lo ng th e lin es placed a t 50 m intervals perpendicul a r to th e centra l line. These va l ues were di g i t ized a t 100 m spac i ng, a nd interpola ted o nto a rec ta ng ul a r g rid with 2 m ce ll size . Ice thi ckn ess a nd vo l ume (or thc 100 m wide ba nds we re th en eva lu a ted dig ita ll y. Th e 1980 \ 'olum es for th e d o m a ins upwa rd a nd d O\\'nwa rd fr o m 1200 m lo n g itudin a l di sta nce a nd th e g lacier as a who le wcre thus es tim a ted as 35, 38 a nd 73 x 106 m3
, res pec ti\ 'C ly, As sho wn by Figure 3a, th e m a ximum \'01 um e fl ux is 1090 x 10:1 m 3 a 1
a t 1200 m lo ngitudin al dista nce. Di"iding th e vo lume a bol'C th e 1200 m cross-sec ti o n b y this "flu shing ra te" yields a n " a\ 'e rage res id ence tim e" of ice in th e upper g lac ie r of a bo ut 32 years. By \\'ay of compa ri so n , a n average res id ence tim e of a bo ut 42 yea rs \\'as es tim a ted for Glacial' Ya na m a rey in Peru 's C o rdill era Bl a nca (H astenra th a nd Am es, 1995a ), II'h e re ice 0011' is subs ta nti a ll y sloll·e r.
7. CLIMATIC FORCING AND WATER BUDGET
Hy drolog ica l a nd climatic implica ti ons of the results of sec tion 6 a rc consid ered in thi s sec ti on.
R ega rding th e liquid-lI'a ter budge t of th e g lacie r as a whole, wc can write for a nnu a l mean conditio ns, and neglec ting th e m ass loss by e \ 'a pora ti on a nd direc t sublimation ,
AP - AB* = R (9)
\,·here A in m 2 is th e a rea of th e g lac ier. P a nd B* in m a 1
a re (liquid-wa te r- equ ivalent ) prec ipitati o n a nd ne t ba la nce, res pec ti vcl y, and R in m 3 a 1 is the wa ter runoff from the g lacie r. Th e a na lysis in scc ti on 6 lead s to es tima tes of th e ra te of liquid-wa ter-equi\'a lent volum e cha nge of 3542 x 103 m3 ai, a nd o f the glac ie r-ave rage ra te of ice-th ic kn ess cha nge o f -2.0 m a l. Prec i pi La ti on was measured during 1970- 77 in a site a t 4900 m a bout 5 km from th e g la cier. The a ve rage annua l prec ipita ti on oye r th ese 8 yea rs was 1200 mm , a ll of whi ch fe ll in solid
Anus alld Has/m ralh: Imbalance oJ Glacial' Sail/a R osa
form . T oge ther w'itb the above es tima te of ice-thi ckn ess cha nge, thi s yields a n a nnual mean wa ter disc ha rge fro m th e g lac ier of 180 I s i , a nd of thi s tota l a bout 110 I s 1
stem s from the m ass loss of the g lac ie r. This means th a t more th an half o f th e wa ter discha rge from th e glacie r is no t a t present renew ed by precipita ti o n but is supplied by th e progressive thinning of the glaeie r.
The ra te of surface-lowering indi ca ted in Fig ure 3d corres ponds to a glac ie r-ave rage I iq u id-wa ter-eq ui va le nt d efi cit of 2.0 111 a I . T o sta bili ze th e g lacier a t its present " olum e would req uire a substanti a l shirt of th e "erti ca l n e t ba la nce profil e (Fig . 4 ) a lo ng- it s \'e rti ca l a nd /o r ho ri zontal axes. C o m plica ti ons du e to th e cha nging icefl ow pa ttern a nd g lac ie r morph o logv a rc disregard ed h ere. Instead , lI'e es tima te in th e fo llowing the typica l m agnitudes of cha nges in the c lim a ti c conditi ons th a t wo uld account fo r th e observed g lacier- ave rage liquidwa te r-eq ui\'a len t ne t ba la nce defi c i t o f 2.0111 al .
Least plausible \, 'ould be a cha nge of solid precipita ti o n by thi s la rge a mount, which exceed s th e actual a nnu a l prec ipita ti on. i\ lo re pertinent a re p rocesses affectin g th e g lac ier energy budge t. With a la te nt hea t of melting LIlI = 33 X 10 1 g kg- I, th e liquid-wa te r-equivalent 2.0 m a 1
corres ponds to 22 \V m 2 In a recent stud y for Gl ac ia r Yan a ma rey in the nea rh y Cordill era Bla nca (H as ten ra th a nd Ames, 1995a, b ) , we found corresp onding imba la nces of 1.5 m a 1 and 16 \\' m 2, and calcul a ted th e hea t-budge t forc ings th a t co uld produce such a difference in energy suppl y . Based on th ese res ults, a d ec rease of ene rgy ava il a ble for meltin g of 22 \\' m 2 could be accounted for by a cloudiness in crease of one-tr nth , a n a ir-tempera ture d ec rease ofl11 ore th a n 2 C. a dec rease in specifi c humidity of I g kg I, or so me co mbina ti on of th ese fa cto rs.
As a furth er ind ica ti o n of im ba la n ce, note th a t fo r a n equilibrium glac ie r th e max imum \ 'o lume nu x coin c id es with th e equilibrium-lin e a ltitude (ELA). By contras t , a t Gl ac ia r Santa Rosa in its recent sta te th e maximum vo lum e Dux is nea rl y 4900 m (Figs 2 a nd 3a ), o r w ell be low th e EtA a t 5000 m (Fig. 4 ) . W e (o und a simil a r di sc re pa ncy of a I)o ut 100 m in our recen t stud y of Gl acia l' Ya nam a rey (Has te nra th a nd Ames, 1995a).
P a ra ll el to o u I' s tud y fo r Gla c ia l' Ya na m a r ey (H as tenra th and Am es, 1995a). infe rence is also d es ired on how long th e g lac ie r co uld sun·i,·e under continu a ti o n of th e recent clim a ti c co nditions. Th e ice \'olume a bO\'e 1200 m longitudin a l di sta nce was es tima ted at 35 x 1 06 m ~\ a nd net ba la nce in the upper glacier adds up to a loss of 332 x 103
ITl3 al . The ou tflow would d ec rease fro m its recent \'a lu e (Fig . 3a) to ze ro when th e g lac ie r di sa ppea rs, so th a t th e a rithm e ti c m ea n of 545 x 103 m :l a 1 l11 ay be a d o pted as representa ti vc. Thus ne t ba la nce and outflow wo uld depl e te til e , 'olul11 e of' th e uppe r g lacier within a bo ut 40 yea rs. The "olume o f th e lower g lacier, below 1200111 long itudina l di stance, \ovas es tim a ted a t 38 x 1 06 m ~ . Net balance would with th e presen t a rea add up to a loss o f 2955 x 103 m 3 a l . Co nsidering the prog ressi\'C shrinkage in a rea a \'a lue o f abo ut 15 X 106 m3 a 1 m ay be ta ken a s representa tive. Co mbining th e es tim a tes [i-om net ba la nce a nd influx, the recent \'olul11 e of th e lo \,'er glac ie r could be consum ed within a bout 4 1 yea rs. Sh ortcomings of th ese calcul a ti o ns ha ve been pointed o ut in an earli e r paper (Hastenra th a nd Ames, 1995a) : th e es tima tes o f th e recent \'o lume a rc
2 17

J ournal of GlacioLogy
crude: ice near the center line is thi cker a nd may persist longer; surface lowering res ults in more n egative net balance even vvithout cha nges of clim ate; and ch a nging flow d yna mics complica te the developme nt. For the upper glac ier , th e reduced o utflow ra te is counterac ted by the mo re nega tive net bal a nce. Wi th these resen 'ation s, we es timate th a t under th e recent c lim a ti c co nditio ns Gl ac ia r Sa nta R osa may las t a no th er 40 yea rs. This \'alue is simil a r to the es tim a te o bta ined for Glac ia r Y a nama rey (H as tenrath a nd Am es, 1995a ).
8. SUMMARY AND CONCLUSIONS
The present inves tiga ti on into th e mode of opera ti on of Glaciar Sa n ta Rosa in th e Cordillera Raura of Peru expands on our recent stud y ofGlaciar Yanamarey in the neigh boring Cordillera Bl a nca (H as tenra th a nd Amcs, 1995a, b) . A ra re accompli shm ent for the tropical half of th e Ea rth , multi-year measurem ent progra m s have been maimained o n these glaciers in the Peruvia n Andes, inviting a n evaluation for their clim a ti c-inform a ti on content. It proved possible to reconstruct th e ice extent and volum e for t\\·o und a ted moraine stages, 1\IIAX and L~IE , a nd 1961 a nd 1980, th e dates of the most recent topogra phi c m a p of Glacia r Santa R osa . These revea led massive shrinkage from the earl y mora in e stages to 1961 and more m odest changes ove l- the nex t two d ecades . For the period 19 77-83 of th e m ontioring progra m , the measurem e n ts of ice-surrace flow \'elocity a nd net ba lance were evaluated in the fra m ework of a n ice-d yna mi cs model of flow along th e cen tra l line of th e glacier.
Th e verti cal net balance profile ofGl acia r Santa R osa is ch a rac terized by positi\'e val ues above a bou t 5000 m, and nega tive \'alues increasing to around - 9 m a- I nea r the terminus. Surface lowering is es tima ted a t a bout 2 m a I fo r th e g lacier as a whole , with values nearly twice as large near th e terminus. The vo lume flu x p eaks with 1090 x 103 m 3 a I nea r a lo ng i tudinal distan ce of 1200 m from the uppe r edge, \I·here th e surface ice-flow velocity also reaches its maximum of 3 1 m a I. Th e ice thickn ess increases fro m around 30 m in th e upper to more th an 90 m in th e lo wer glac ier.
Based on this appraisa l of th e fun cti oning of the glacier. some inferences can he offered on th e \\'a ter budge t and climatic forcing . The annual mean wa ter discharge from the glacier is a bout 200 I Si, and more than half of this stems from th e thinning of th e ice and is not repl aced by solid precipita ti on. For Glac ia l' Santa Rosa to stabili ze a t its recent \'olul11 e, the glacier-a verage (l iquid-wa ter-equivalent) net ba la nce would ha \'e to be 2 m a I large r. This corres ponds to a reducti on of th e hea t a\'ail a ble for melting by about 22 W 111-
2 A dec rease of the energy suppl y for melting by this amount could be accounted for by a
cloudiness in crease of one-tenth , a n a ir tempe ra ture d ec rease of more th a n 2°G, a dec rease in specifi c humidity of I g kg I, or som e combination o f th ese and oth er facto rs. A s a furth er m eas ure of th e rece nt imba la nce, th e maximum \'o lum e nux is found som e 100 m below the ELA. Under the recent cl im ati c conditions, the glacier m ay survive another 40 yea rs. Overall , this in ves tiga ti o n of Glacia r Sa nta R osa in rh e Cordill era R a ura corro bo ra tes our inferences for a no ther glac ier in a neigh boring regio n of the i\' orth Peruvia n And es .
ACKNOWLEDGEMENTS
This stud y \\'as supported by U. S. National Scie nce Found ati on grant EAR-92 172 11. At the Uni\'e rsil), of vVi sconsin , L . Greisc ha r a nd D . Polzin assisted with th e d a ta processing and g raphics .
REFERENCES
Ames, i\ . and i olizers. 1988. 1II/'eIllario de glacial'"> del Pmi. H ua raz, Peru. U nidad de Glac io logia e Hid rologia.
Bh a tt . :'\ ., S. H as tenra th and P. D. K r uss. 198 1. I ce thi ckness d c tcrmi na li o n a t Lell' is Glacier. ~\l o u n t Kenya: se ismo logy, gra \'imctr \" d yna mics. ,(. Glelscherkd. Gla;:.ialgeo!. , 16(2), 2 I 3 228.
Budd , 11'. 1969. The d ynamics of ice masses .. I.URE Sei. Rei) .. Sec .. -1. Glariol. 108.
H aeberli , 11'. and i'd . H oelzlr, rOIll/}s. 1993. Fluelualiolls DJ glaeim 1985 1990 ( )·ol. l'I ). , I rOlltribulioll 10 Ihe Global ElIl'irolllllenlal Jiollitorillg .~I " lelll
( GE,\lS) al/d lize i lltemaliol/al I-£rdrological Progralllme. \\ 'a llingfo rd , O xfords hire, Inte rnat iona l Assoc iat io n of' H yd rologica l Sc iences, IAH S Press; Na iro bi , United :'\ a ti ons E I1\·ironment P rog ra mm e: Pa ri s, U:,\ESCO .
H acbe rl i, \\'., E. H crren and ;\\. Hoclzle. eds. 1993. Glacier .l/ass Balallre B I/llelill. Bulletill . \ '0 . 2 (1990 1991 ) . Paris, !AHS ICS ! ), L:NE P. liK ESCO.
H astenrat h. S. 1989 . lee fl oll' and mass cha nges of Le" is Glac ier. ~! ou nt K enya , East Afri ca: obsc l'I'ations 197 '1- 86, model ling, and pred ictions to the yca r 2000 .\ .n. J. (;Lacio!., 35 ( I 2 1). 325-332 .
H as tenrath. S. a nd A. Amcs. 1993a. Di agnos ing the im ba la nce of' Ya namarc\, Glacier in the Cordill era Blanca of Peru. ]. Geol}/~l·S. Res .. 10003.5105-5 11 2.
H as tenrath, S. and A . A mes. 1993b. R ecess ion of Yanama rey G lac ier in Cordill cr" Blanca . P e ru . d uring the 20 th century.]' Glaciol., 41 ( 137 \. 19 1 196.
H as tenra ,h , S. a nd P . Kruss. 1982. On the sec ular \'a ri a ti on DJ' ice nO\,\'elocit), at Le\\'is G lacie r. i'd ouIH Kenya , K enya. ]. Glariol .. 28 99 , 333 339.
Ins,ituto Geografico \Iili tar. Peru. 1969. e r/wc Chaw. Li ma , lnsti tuto G eogritfico ~Iilit ar. (Carta :'Iiac io n a l hojo 21 -j-I- N O , Sca le I : 2j,000 .)
I ns titu lO Gcografico ~rilita r. Peru. 1972 .. \ 'et'ado Raura . Lima, InstitulO Geografico il lili ta r. (Ca rt" \ aciona l hojo 2 1-j ,II-S0 . Scale 1:25,000. 1
Kmss. P. 198+. T erm inus response of LCII' i, Glacier, \l oul1 t K enya . K enya to sin usoida l nct- balance fo rcing. J. Glariol., 30 105 , 2 12 2 17.
K ye.J. F. 1965. The n O\\' ofa glacie r in a cha nnel of rec tangula r, ell ip tic o r paraboli c cross-sec ti on. ]. Glariol .. 5 (4 1).66 1 690.
P a tcrso ll . 11' . S. B. 1969. The 1}1~)'si(s oJ glaciers . Oxford , etc .. Pe rga mon Press .
NIS received 28 N ovember 1994 and accepted il1 revised fo rm 24 October 1995
2 18