Diabetic Dyslipidemia and Atherosclerosis Henry Ginsberg, MD.
24
Diabetic Dyslipidemia and Diabetic Dyslipidemia and Atherosclerosis Atherosclerosis Henry Ginsberg, MD Henry Ginsberg, MD
-
Upload
carol-booth -
Category
Documents
-
view
226 -
download
1
Transcript of Diabetic Dyslipidemia and Atherosclerosis Henry Ginsberg, MD.

Diabetic Dyslipidemia and Diabetic Dyslipidemia and
AtherosclerosisAtherosclerosis
Henry Ginsberg, MDHenry Ginsberg, MD

Interrelation Between Atherosclerosis Interrelation Between Atherosclerosis and Insulin Resistanceand Insulin Resistance
HypertensionHypertension
ObesityObesity
HyperinsulinemiaHyperinsulinemia
DiabetesDiabetes
HypertriglyceridemiaHypertriglyceridemia
Small, dense LDLSmall, dense LDL
Low HDLLow HDL
HypercoagulabilityHypercoagulability
InsulinInsulinResistanceResistance
InsulinInsulinResistanceResistance AtherosclerosisAtherosclerosisAtherosclerosisAtherosclerosis

Abdominal obesity
TG + HDL-C
Glucose intolerance
Hypertension
Atherosclerosis
Ethnicity
Insulin Resistance and Hyperinsulinemia: Insulin Resistance and Hyperinsulinemia: Clinical CluesClinical Clues

Elevated total TG
Reduced HDL-C
Small, dense LDL-C
Dyslipidemia in the Insulin Resistance Dyslipidemia in the Insulin Resistance SyndromeSyndrome
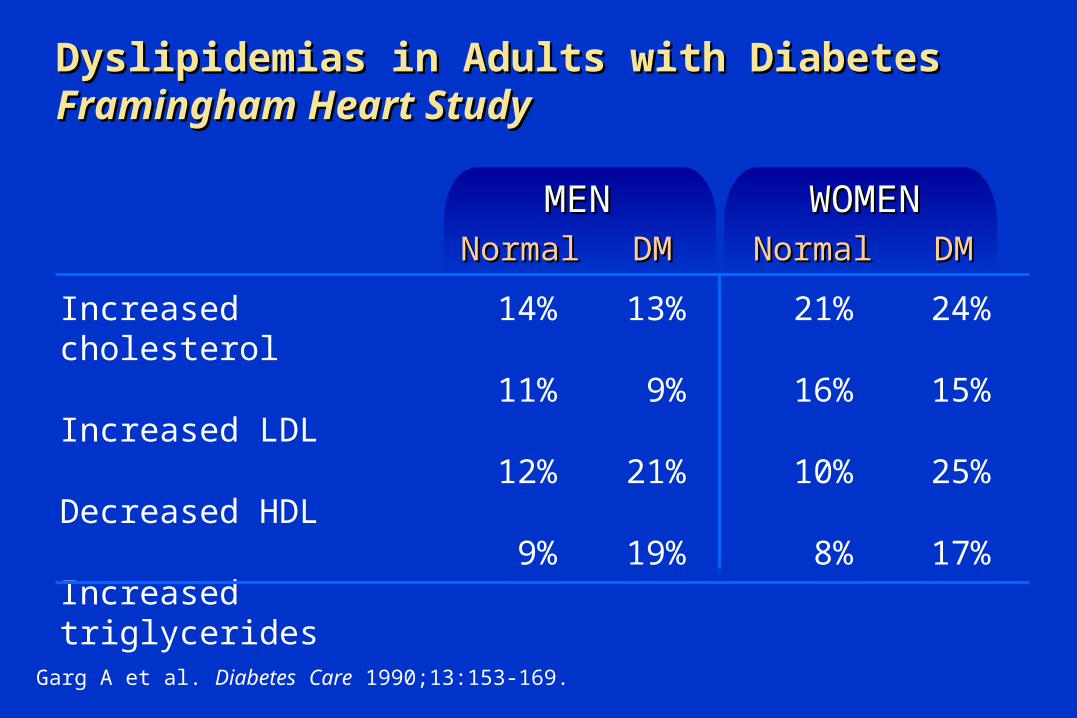
Dyslipidemias in Adults with DiabetesDyslipidemias in Adults with DiabetesFramingham Heart StudyFramingham Heart Study
Increased cholesterol
Increased LDL
Decreased HDL
Increased triglycerides
NormalNormal DMDM NormalNormal DMDM
14%
11%
12%
9%
13%
9%
21%
19%
MENMEN WOMENWOMEN
21%
16%
10%
8%
24%
15%
25%
17%
Garg A et al. Diabetes Care 1990;13:153-169.

Mean Plasma Lipids at Diagnosis of Mean Plasma Lipids at Diagnosis of Type 2 Diabetes - Type 2 Diabetes - UKPDSUKPDS
Number of Pts
TC (mg/dl)
LDL-C (mg/dl)
HDL-C (mg/dl)
TG (mg/dl)
Type 2Type 2 ControlControlMENMEN
UKPDS Group. Diabetes Care 1997;20:1683-1687.
* P<0.001, ** P<0.02 comparing type 2 vs. controll
2139
213
139
39**
159*
52
205
132
43
103
Type 2Type 2 ControlControlWOMENWOMEN
1574
224
151*
43*
159*
143
217
135
55
95

Relation Between Insulin Resistance and Relation Between Insulin Resistance and HypertriglyceridemiaHypertriglyceridemia
Olefsky JM et al. Am J Med. 1974;57:551-560.
* Total area under 3-hour response curve (mean of 2 tests).
625
500
400
300
200
100
100 200 300 400 500 600Insulin Response to Oral Glucose*
Pla
sma T
G (
mg
/dL)
r = 0.73P < 0.0001
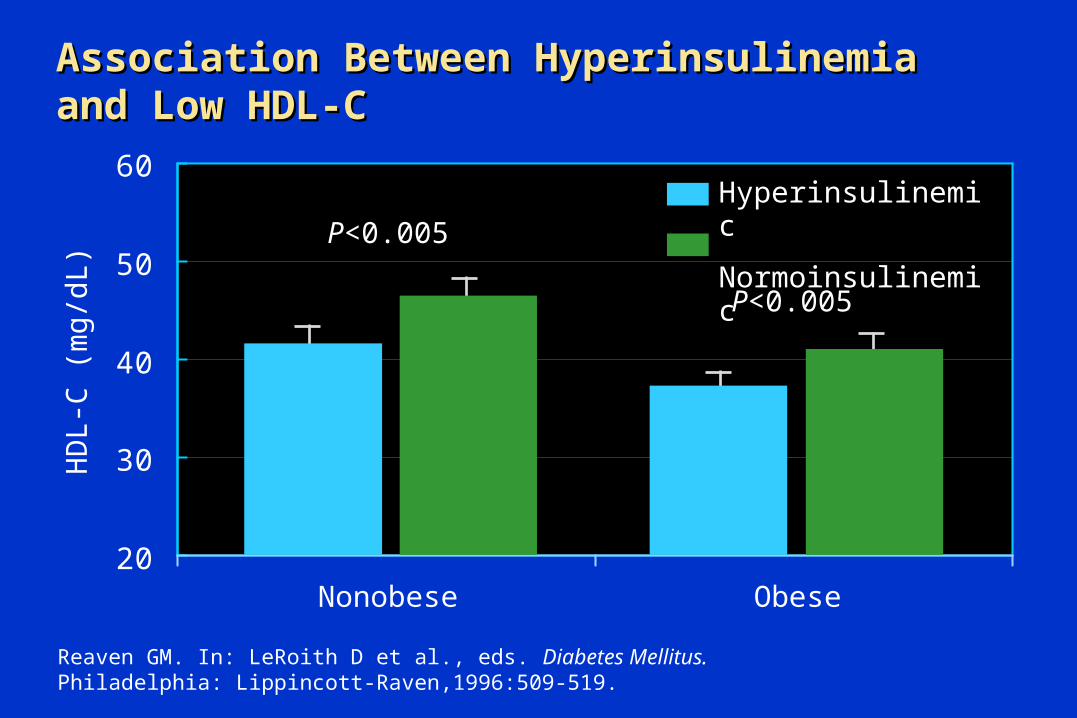
Association Between Hyperinsulinemia Association Between Hyperinsulinemia and Low HDL-Cand Low HDL-C
20
30
40
50
60
HD
L-C
(m
g/d
L)
Reaven GM. In: LeRoith D et al., eds. Diabetes Mellitus. Philadelphia: Lippincott-Raven,1996:509-519.
Nonobese
Hyperinsulinemic
Normoinsulinemic
Obese
P<0.005
P<0.005
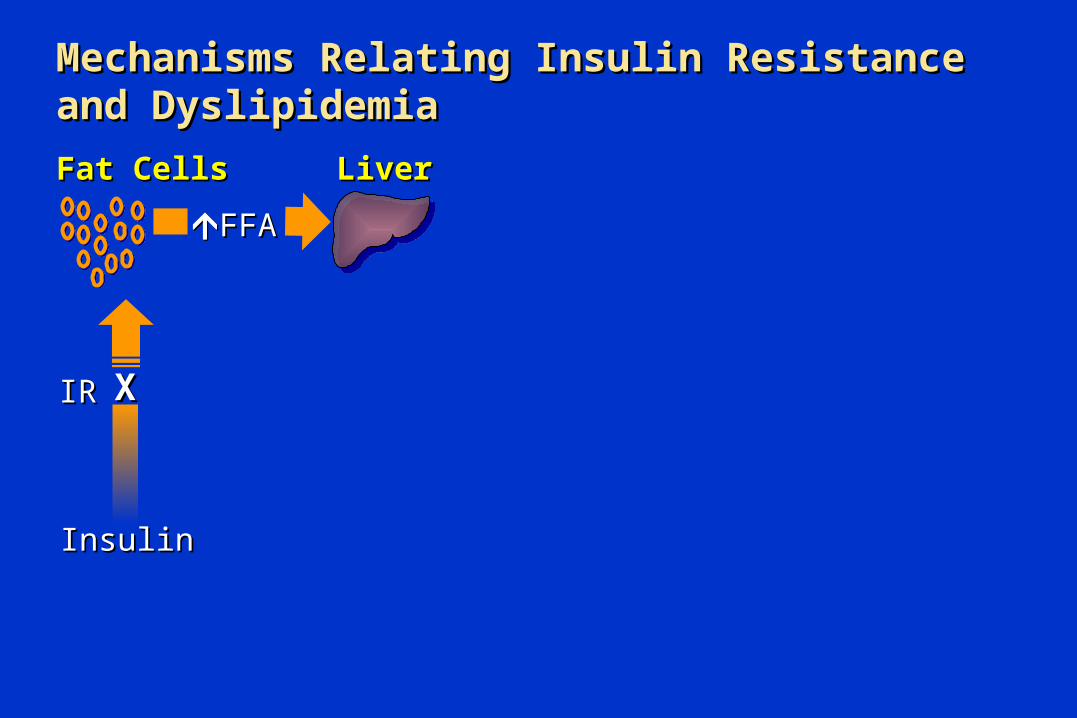
Mechanisms Relating Insulin Resistance Mechanisms Relating Insulin Resistance and Dyslipidemiaand Dyslipidemia
Fat CellsFat Cells LiverLiver
InsulinInsulin
IRIR XX
FFAFFA

Mechanisms Relating Insulin Resistance Mechanisms Relating Insulin Resistance and Dyslipidemiaand Dyslipidemia
Fat CellsFat Cells LiverLiver
InsulinInsulin
IRIR XX
TGTG Apo BApo B VLDLVLDL
VLDLVLDL
FFAFFA

(hepatic(hepaticlipase)lipase)
Mechanisms Relating Insulin Resistance Mechanisms Relating Insulin Resistance and Dyslipidemiaand Dyslipidemia
Fat CellsFat Cells LiverLiver
KidneyKidneyInsulinInsulin
IRIR XX
(CETP)(CETP)
CECE
TGTG Apo BApo B VLDLVLDL
VLDLVLDL HDLHDL
TGTGApo A-1Apo A-1
FFAFFA

(hepatic(hepaticlipase)lipase)
Mechanisms Relating Insulin Resistance Mechanisms Relating Insulin Resistance and Dyslipidemiaand Dyslipidemia
Fat CellsFat Cells LiverLiver
KidneyKidneyInsulinInsulin
IRIR XX
(CETP)(CETP)
CECE
TGTG Apo BApo B VLDLVLDL
(CETP)(CETP)
VLDLVLDL HDLHDL
(lipoprotein or hepatic lipase)(lipoprotein or hepatic lipase)
SDSDLDLLDL
LDLLDL
TGTGApo A-1Apo A-1
TGTGCECE
FFAFFA

IncreasedIncreased
Dyslipidemia in DiabetesDyslipidemia in Diabetes
DecreasedDecreased
Triglycerides
VLDL
LDL and small dense LDL
Apo B
HDL
Apo A-I

LDL Subclass Phenotypes in LDL Subclass Phenotypes in Diabetes MellitusDiabetes Mellitus
Men*Men* Diabetic Nondiabetic
Women**Women** Diabetic Nondiabetic
** Selby JV et al. Circulation 1993; 88:381-387.
IntInt BB
* Feingold KR et al. Arterioscler Thromb 1992; 12:1496-1502.
2987
54543
2847
3485
2129
309
5124
366
LDL SubclassLDL Subclass
nn AA
PercentPercent

Increased susceptibility to oxidation
Increased vascular permeability
Conformational change in apo B
Decreased affinity for LDL receptor
Association with insulin resistance syndrome
Association with high TG and low HDL
Small Dense LDL and CHD: Small Dense LDL and CHD: Potential Atherogenic MechanismsPotential Atherogenic Mechanisms
Austin MA et al. Curr Opin Lipidol 1996;7:167-171.
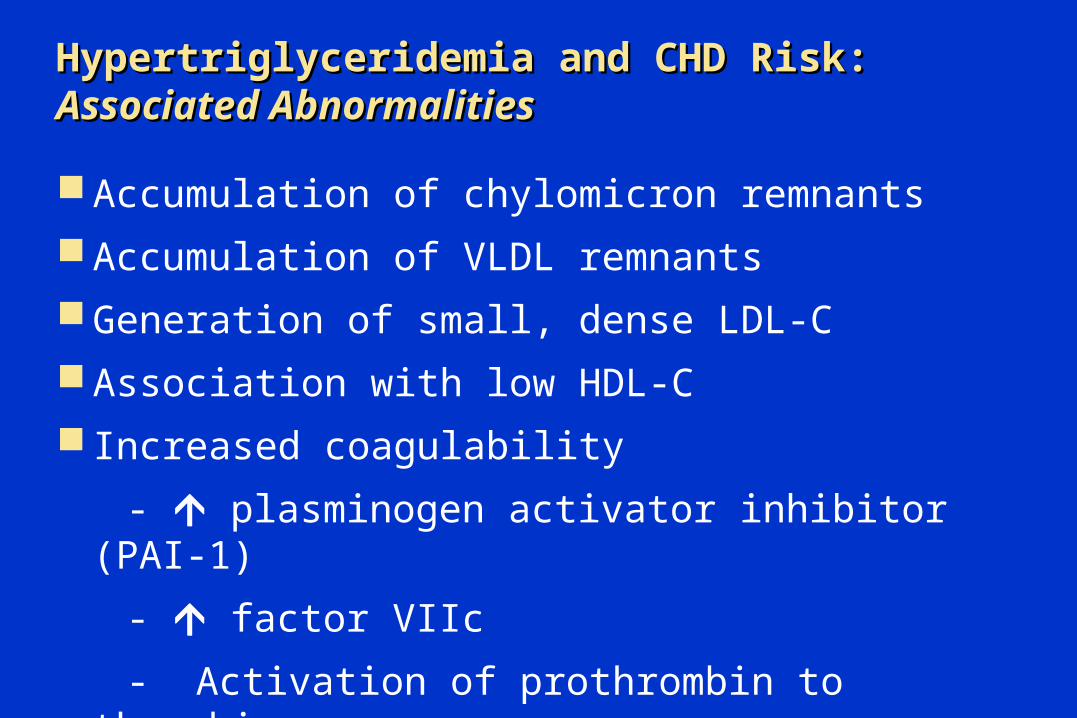
Accumulation of chylomicron remnants
Accumulation of VLDL remnants
Generation of small, dense LDL-C
Association with low HDL-C
Increased coagulability
- plasminogen activator inhibitor (PAI-1)
- factor VIIc
- Activation of prothrombin to thrombin
Hypertriglyceridemia and CHD Risk: Hypertriglyceridemia and CHD Risk: Associated AbnormalitiesAssociated Abnormalities

TG Metabolism in CHD: TG Metabolism in CHD: Studies in theStudies in the Postprandial StatePostprandial State
400
300
200
100
0
TG
(m
g/d
L)
UncorrectedUncorrectedCorrected for Fasting Corrected for Fasting
TG Level*TG Level*
Hours after Test Meal
300
200
100
0
Patsch JR et al. Arterioscler Thromb 1992;12:1336-1345.
0 2 4 6 8 0 2 4 6 8
CHD Cases
Controls
Controls
Error bars = SEM
CHD Cases
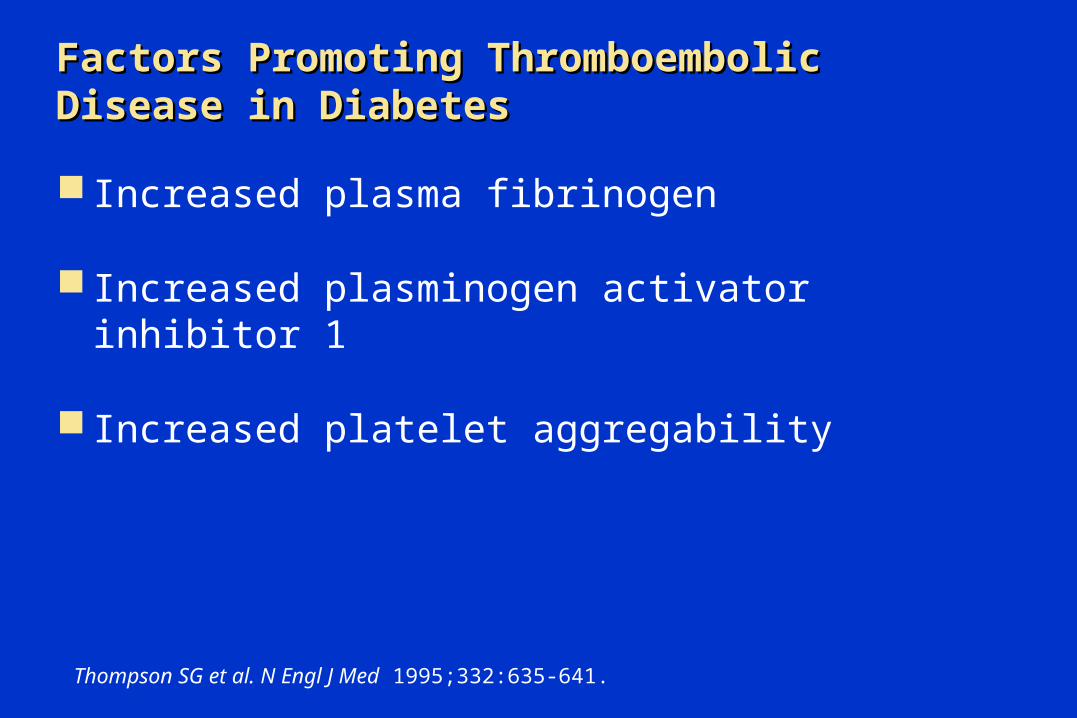
Increased plasma fibrinogen
Increased plasminogen activator inhibitor 1
Increased platelet aggregability
Factors Promoting Thromboembolic Factors Promoting Thromboembolic Disease in DiabetesDisease in Diabetes
Thompson SG et al. N Engl J Med 1995;332:635-641.
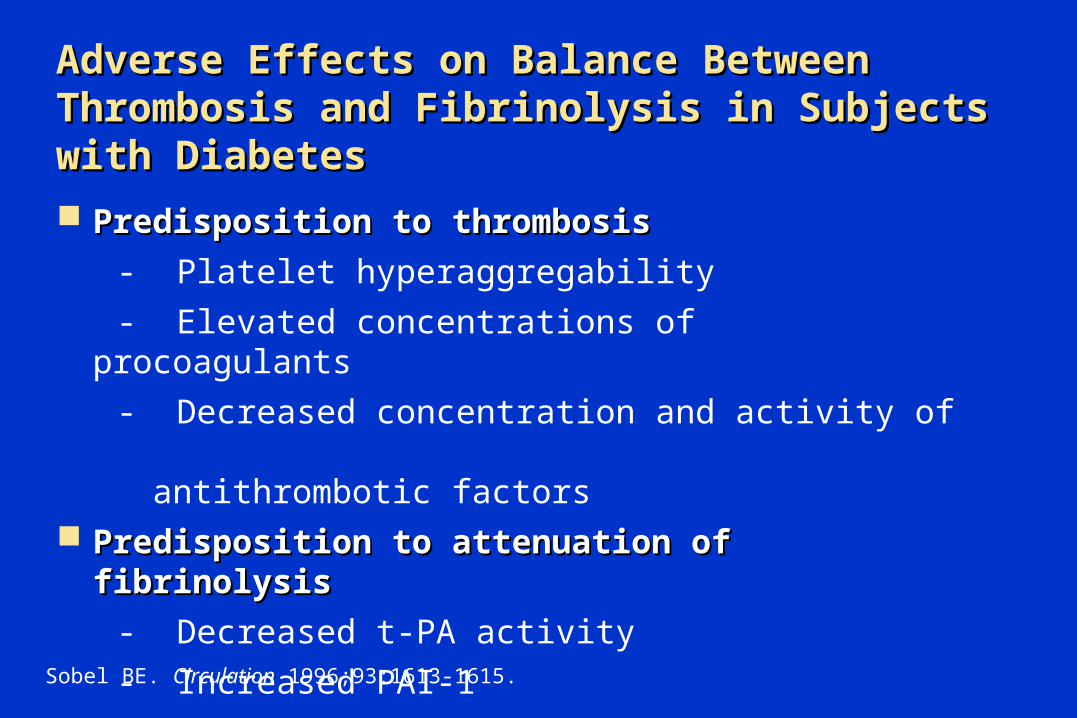
Predisposition to thrombosisPredisposition to thrombosis
- Platelet hyperaggregability
- Elevated concentrations of procoagulants
- Decreased concentration and activity of antithrombotic factors
Predisposition to attenuation of fibrinolysisPredisposition to attenuation of fibrinolysis
- Decreased t-PA activity
- Increased PAI-1
- Decreased concentrations of 2-antiplasmin
Adverse Effects on Balance Between Adverse Effects on Balance Between Thrombosis and Fibrinolysis in Subjects Thrombosis and Fibrinolysis in Subjects with Diabeteswith Diabetes
Sobel BE. Circulation 1996;93:1613-1615.

PAI-1 Activity in Blood in Patients with PAI-1 Activity in Blood in Patients with Type 2 DiabetesType 2 Diabetes
0
5
10
15
20
PA
I-1 A
ctiv
ity (
AU
/mL)
McGill JB et al. Diabetes. 1994;43:104-109.
Lean
No Diabetes
Diabetes
Obese
PAI-1 = plasminogen activator inhibitor type 1
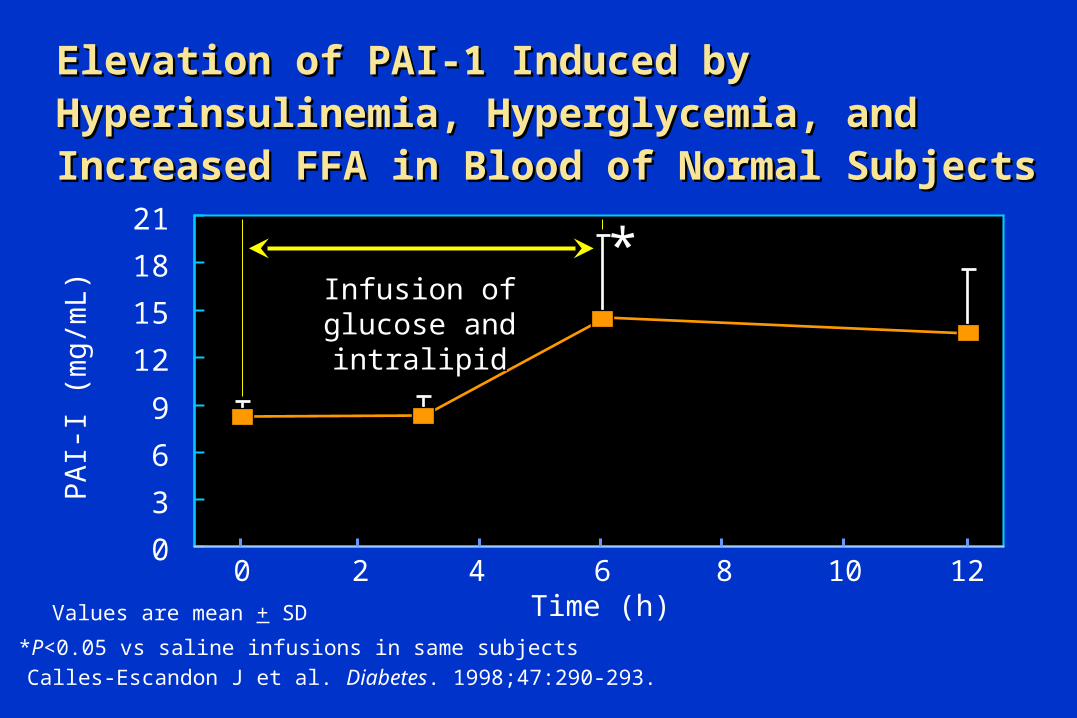
Elevation of PAI-1 Induced by Elevation of PAI-1 Induced by Hyperinsulinemia, Hyperglycemia, and Hyperinsulinemia, Hyperglycemia, and Increased FFA in Blood of Normal SubjectsIncreased FFA in Blood of Normal Subjects
Calles-Escandon J et al. Diabetes. 1998;47:290-293.*P<0.05 vs saline infusions in same subjects
Values are mean + SD
0
3
6
9
12
15
18
21
PA
I-I (m
g/m
L)
0 2 4 6 8 12Time (h)
10
*Infusion of glucose Infusion of glucose
and intralipidand intralipid

First-line agentsFirst-line agents
HMG CoA reductase inhibitorHMG CoA reductase inhibitor
Fibric acid derivativeFibric acid derivative
Second-line agentsSecond-line agents
Bile acid binding resinsBile acid binding resins
Nicotinic acidNicotinic acid
Pharmacologic Agents for Treatment of Pharmacologic Agents for Treatment of DyslipidemiaDyslipidemia
American Diabetes Association. Diabetes Care 2000;23(suppl 1):S57-S60.
In diabetic patients, nicotinic acid should be restricted to <2g/day. Short-acting nicotinic acid is preferred.
Effect on lipoprotein
LDL HDL Triglyceride
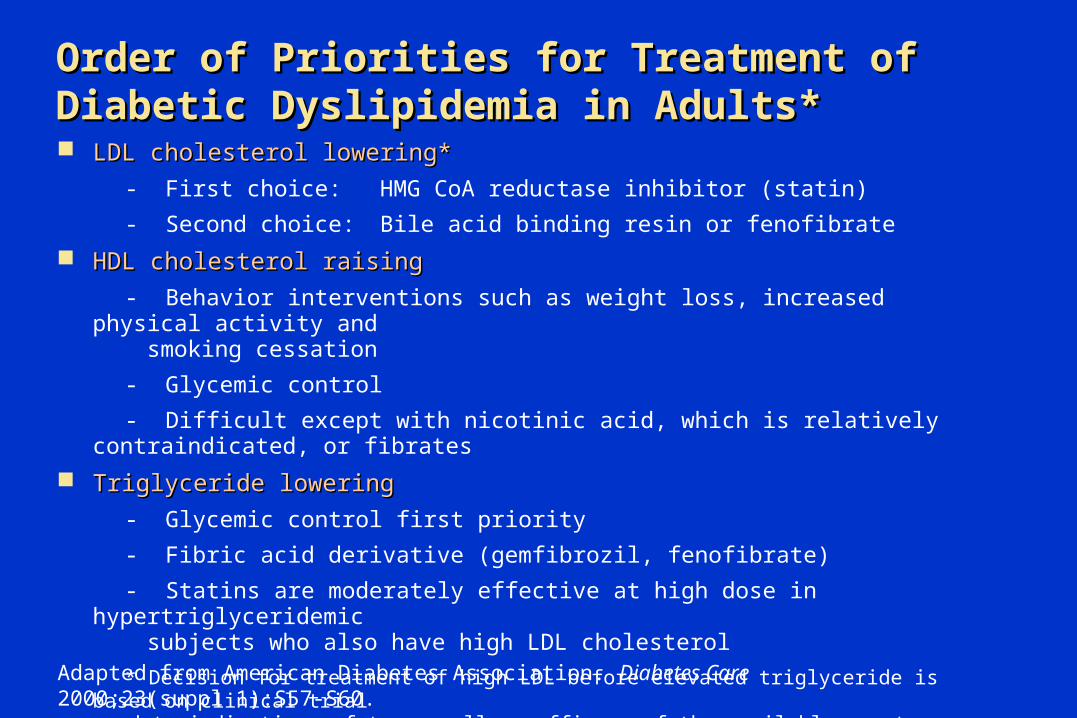
LDL cholesterol lowering*LDL cholesterol lowering*
- First choice: HMG CoA reductase inhibitor (statin)
- Second choice: Bile acid binding resin or fenofibrate
HDL cholesterol raisingHDL cholesterol raising
- Behavior interventions such as weight loss, increased physical activity and smoking cessation
- Glycemic control
- Difficult except with nicotinic acid, which is relatively contraindicated, or fibrates
Triglyceride loweringTriglyceride lowering
- Glycemic control first priority
- Fibric acid derivative (gemfibrozil, fenofibrate)
- Statins are moderately effective at high dose in hypertriglyceridemic subjects who also have high LDL cholesterol
* Decision for treatment of high LDL before elevated triglyceride is based on clinical trial data indicating safety as well as efficacy of the available agents.
Order of Priorities for Treatment of Order of Priorities for Treatment of Diabetic Dyslipidemia in Adults*Diabetic Dyslipidemia in Adults*
Adapted from American Diabetes Association. Diabetes Care 2000;23(suppl 1):S57-S60.


![Treating Diabetes and Dyslipidemia: Achieving …1]Part_2_Treating... · Treating Diabetes and Dyslipidemia: Achieving Therapeutic Targets: Goals for Diabetes and Dyslipidemia Treatment](https://static.fdocuments.in/doc/165x107/5bc182c709d3f2c7178dc2a1/treating-diabetes-and-dyslipidemia-achieving-1part2treating-treating.jpg)