Diabetes Tele-Education Programs Virginia Center for Diabetes Professional Education University of...
19
Diabetes Tele-Education Programs Virginia Center for Diabetes Professional Education University of Virginia Health System 2008 - 2013 J. Terry Saunders, Ph.D. Joyce Green Pastors, M.S., R.D., C.D.E.
-
Upload
rachel-booth -
Category
Documents
-
view
215 -
download
0
Transcript of Diabetes Tele-Education Programs Virginia Center for Diabetes Professional Education University of...

Diabetes Tele-Education Programs
Virginia Center for Diabetes Professional EducationUniversity of Virginia Health System
2008 - 2013
J. Terry Saunders, Ph.D.Joyce Green Pastors, M.S., R.D., C.D.E.

Virginia - Percentage of Adults (aged 18 years or older) with Diagnosed Diabetes, 1994 – 2010

Estimated Diabetes Prevalence in Virginia, 2010
2,145,074 11,443
4,868
312,568
531,366
PrediabetesGestationalChildren, Adolescents (<20 yrs)Undiagnosed AdultsDiagnosed Adults
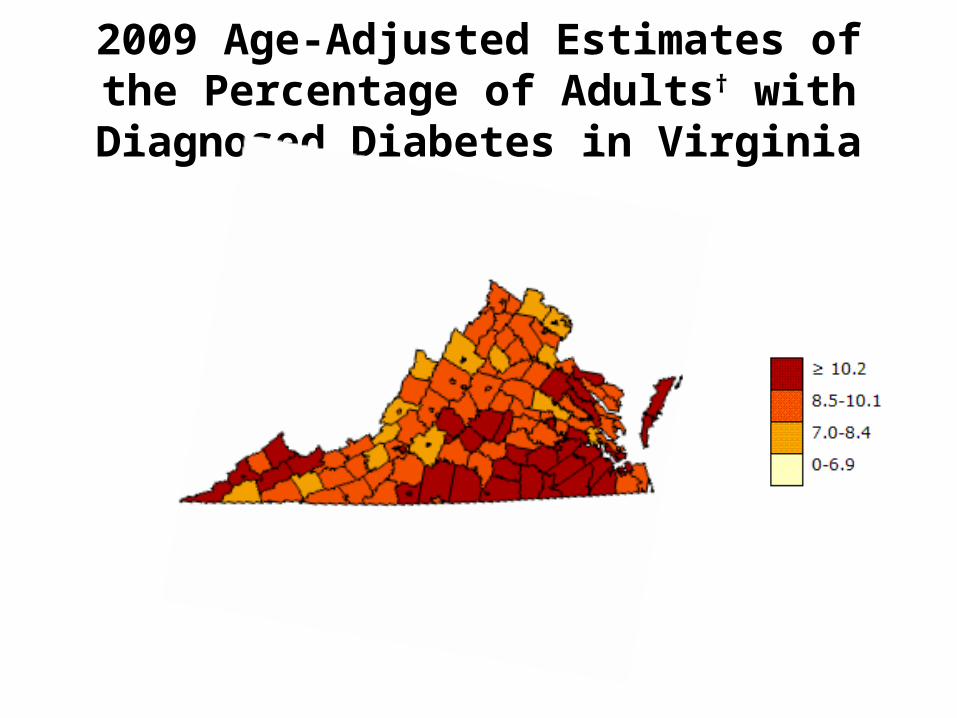
2009 Age-Adjusted Estimates of the Percentage of Adults† with Diagnosed Diabetes in Virginia

Virginia - Percentage of Adults(aged 18 years or older) with Diabetes Ever Attending a Diabetes Self-Management Class, 2000 – 2010


Rationale for Diabetes Tele-Education
• Epidemic of diabetes statewide• It is estimated that only 60% of those who have diabetes in
Virginia have had ANY education (BRFSS data)• Shortage of diabetes educators and ADA recognized education
programs in rural and underserved areas of the state• Lack of adequate reimbursement for diabetes patient education• Difficulty and expense of providing face-to-face professional
education• Efficiency of using existing telemedicine equipment for
education

Diabetes Tele-education Partners, 2012
• University of Virginia Diabetes Education and Management Program
• University of Virginia Office of Telemedicine• Virginia Department of Health, Office of Minority
Health and Health Equity• Virginia Information Technology Agency (VITA)• Harry L. Coomes Recreation Center, Abingdon, VA

Comparison of Participation by Type of Site, 2008-2012Total Number of Sites: 43
2008 2009 2010 2011 20120
2
4
6
8
10
12
14
16
Critical Access/Small Rural HospitalsCommunity Health CentersHealth DepartmentsFree ClinicsSenior CentersLibraries
Num
ber o
f Site
s Pa
rtici
patin
g
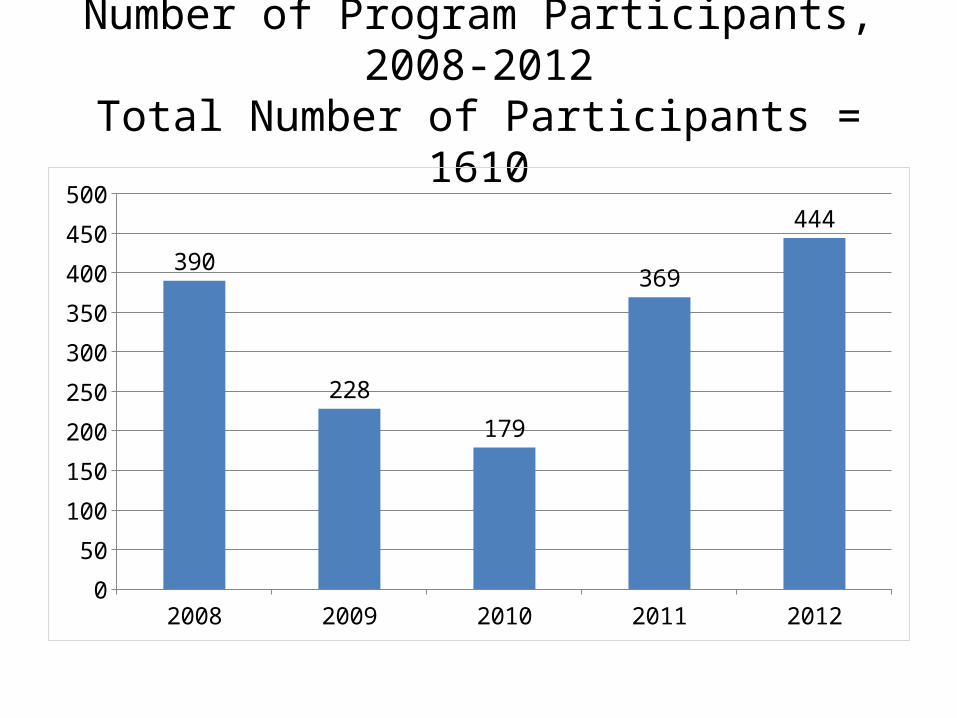
Number of Program Participants, 2008-2012Total Number of Participants = 1610
2008 2009 2010 2011 20120
50
100
150
200
250
300
350
400
450
500
390
228
179
369
444

Review of Accomplishments for 2012

Nottoway
Cumber-land
AmeliaAppomattox
Charlotte
CharlesCity
NewKent
Henrico
KingAnd
Queen
JamesCity
YorkSurry
Gloucester (7)PrinceGeorge
Essex
Hanover
Richmond &TappahannockFree Clinic (36)
KingGeorge
Northumberland (8)
Buckingham
Blue Ridge Medical Center (65)
Rockbridge
Powhatan
Goochland
Rockingham
Greene
Rappa-hannock
Page
Culpeper
Henry/Martinsville (20)
Albemarle
Hampton
Mathews
VirginiaBeachSuffolk
Louisa
Fairfax
PrinceWilliam
Fauquier
Loudoun
Warren
Alleghany
BedfordRoanoke
Clarke
GreensvilleMecklenburg
Franklin
Patrick
MontgomeryBland
Wise (32)
Lee (4)
Frederick
Shenandoah
Madison StaffordHighland
AugustaOrange
Spotsylvania
Bath Community Hospital (1)
Caroline
Fluvanna
AmherstBotetourt
Craig
Chesterfield Northampton
BuchananGiles
CampbellDickenson
DinwiddiePulaski
Russell
Pittsylvania
FloydLunenburg SussexWythe
BrunswickCarrollGrayson
Sites Participating in 2012Health Districts and Number of Patients Per Site
Lancaster
KingWilliam
Onley (140)
Petersburg (7)
Southampton
Prince Edward (33)
Halifax
Health Wagon (4)
Washington
Tri-Area CHC (55)
Smyth
Scott
Tazewell
Highland MedicalCenter (1)
Chesapeake
Middlesex
Northumberland
Westmoreland
Nottoway Public Library (40)
Lenowisco Mount Rogers West Piedmont Piedmont Crater
Eastern Shore
Three Rivers
Thomas Jefferson
Central Shenandoah

Total Number of Participants by Site
0 20 40 60 80 100 120 140 160
165
7140
720
440
3336
14
5532Wise Co HD
Tri-Area Comm Hlth CntrHealth Wagon (Wise)Highland Med CntrRichmond Co HDPrince Edward Co HDNottoway Co HDLee Co HDHenry/Martinsville HDGloucester Co HDOnley Comm Hlth CntrPetersburg HDBlue Ridge Med CntrBath Community Hospital
Number of Participants

Number of Participants Attending Each Broadcast
17-Apr 25-Apr 15-May 29-May 19-Jun 26-Jun 17-Jul 24-Jul 21-Aug 28-Aug 18-Sep 25-Sep 16-Oct 23-Oct 20-Nov 27-Nov0
10
20
30
40
50
60

Summary Attendance Statistics for 2012
• 444 program participants• 238 individual participants
– Average age: 66.7 y.o.– 169 females, 69 males
• 1.87 average classes per participant• 117 participants (49.2%) took one class• 62 participants (26.1%) took 2 classes• 36 participants (15.1%) took 3 classes• 19 participants (8.0%) took 4 classes• 4 participants (1.7%) took 5 classes• 21 participants were awarded certificates for attending all 4 classes
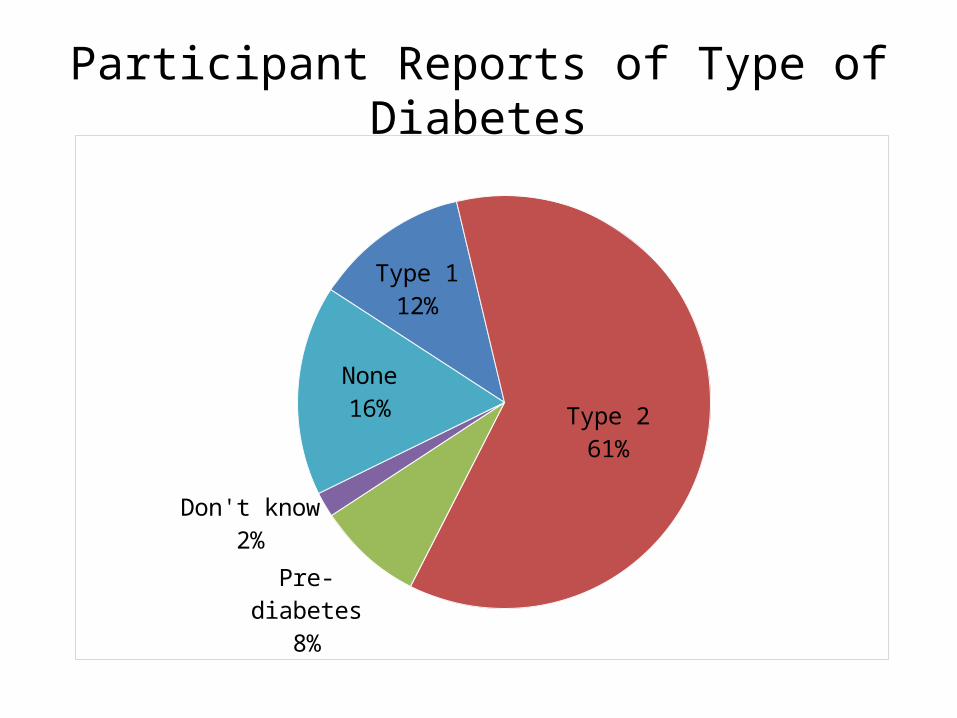
Participant Reports of Type of Diabetes
Type 112%
Type 261%
Pre-diabetes8%
Don't know2%
None16%

Participant Ratings of Usefulness of Classes
Living Well_x000d_with Diabetes
I Have Diabetes_x000d_Now
What Do I Eat?
Improve Your Blood Glucose,_x000d_Get Ac-
tive,_x000d_Manage Your Stress
Eat Smart1.00
1.50
2.00
2.50
3.00
3.50
4.00
4.50
5.00
4.28 4.32 4.254.43
Leve
l of U
sefu
lnes
s (1
-5)

2013 Schedule of Classes *
* All classes scheduled from 1-3 pm

Plans for 2013
• Improvement in group facilitation at participating sites; provided regional facilitator trainings for sites in January
• Addition of libraries and use of health information specialists; provided training to librarians in Southside Virginia in February
• Use of recorded sessions in addition to live, interactive sessions to offer flexibility in timing and to reach more people
• Additional evaluation data - intent to change behavior; pilot data for behavior change outcomes