Diabetes Mellitus and Life Insurance - AAIM · DIABETES MELLITUS AND LIFE INSURANCE Anthony F....
54
50 JOURNAL OF INSURANCE MEDICINE Copyright 2001 Journal of Insurance Medicine J Insur Med 2001;33:50–103 EVIDENCE BASED MEDICINE DIABETES MELLITUS AND LIFE INSURANCE Anthony F. Milano, MD, MPH A comprehensive review of the literature of diabetes mellitus, its progression and complications is written with respect to the life insurance industry. Address: Business Men’s Assurance Co of America, PO Box 419076, Kansas City, MO 64141-6076. Correspondence: Anthony F. Mil- ano, MD, MPH, Reinsurance Medi- cal Director and Vice President. Key words: Diabetes mellitus, life insurance. Received: August 29, 2000 Accepted: October 20, 2000 DEFINITION Diabetes is a complex metabolic disease with differing causes, treatments, prognosis, complications and morbid multi-system end- outcomes characterized by inappropriate hy- perglycemia and impaired metabolism of sugar and other energy-yielding foods, hav- ing distinct genetic and pathogenic mecha- nisms linked to defects in insulin secretion, insulin utilization or both. CLASSIC SIGNS AND SYMPTOMS Abrupt or insidious onset of: hyperglyce- mia and glucosuria (elevated blood and urine sugar); polydipsia, polyuria, polyphagia, (ex- cessive thirst, urination and hungar); weak- ness, weight change and blurred vision. EPIDEMIOLOGY OF DIABETES MELLITUS 1,2,3 Incidence: 798,000 new cases diagnosed per year in the United States, Overall Prevalence: Overall total: 15.7 million (5.9% of the Unit- ed States population) Diagnosed: 10.3 million people Undiagnosed: 5.4 million people Prevalence by age: Age 65 or older: 6.3 million; 18.4% of all people in this age group, Age 20 or older: 15.6 million; 8.2% of all people in this age group, Under age 20: 123,000; 0.16% of all people in this age group. Prevalence by gender in adults (20-years old): Men: 7.5 million; 8.2% of all men have di- abetes, Women: 8.1 million; 8.2% of all women. Prevalence in children and teenagers: 123,000 in the United States.
Transcript of Diabetes Mellitus and Life Insurance - AAIM · DIABETES MELLITUS AND LIFE INSURANCE Anthony F....

50
JOURNAL OF INSURANCE MEDICINECopyright � 2001 Journal of Insurance MedicineJ Insur Med 2001;33:50–103
EVIDENCE BASED MEDICINE
DIABETES MELLITUS AND LIFE INSURANCEAnthony F. Milano, MD, MPH
A comprehensive review of the literature of diabetes mellitus, itsprogression and complications is written with respect to the lifeinsurance industry.
Address: Business Men’s AssuranceCo of America, PO Box 419076,Kansas City, MO 64141-6076.
Correspondence: Anthony F. Mil-ano, MD, MPH, Reinsurance Medi-cal Director and Vice President.
Key words: Diabetes mellitus, lifeinsurance.
Received: August 29, 2000
Accepted: October 20, 2000
DEFINITION
Diabetes is a complex metabolic diseasewith differing causes, treatments, prognosis,complications and morbid multi-system end-outcomes characterized by inappropriate hy-perglycemia and impaired metabolism ofsugar and other energy-yielding foods, hav-ing distinct genetic and pathogenic mecha-nisms linked to defects in insulin secretion,insulin utilization or both.
CLASSIC SIGNS AND SYMPTOMS
Abrupt or insidious onset of: hyperglyce-mia and glucosuria (elevated blood and urinesugar); polydipsia, polyuria, polyphagia, (ex-cessive thirst, urination and hungar); weak-ness, weight change and blurred vision.
EPIDEMIOLOGY OF DIABETESMELLITUS1,2,3
Incidence:
798,000 new cases diagnosed per year inthe United States,
Overall Prevalence:
Overall total: 15.7 million (5.9% of the Unit-ed States population)
Diagnosed: 10.3 million peopleUndiagnosed: 5.4 million people
Prevalence by age:
Age 65 or older: 6.3 million; 18.4% of allpeople in this age group,
Age 20 or older: 15.6 million; 8.2% of allpeople in this age group,
Under age 20: 123,000; 0.16% of all peoplein this age group.
Prevalence by gender in adults (�20-yearsold):
Men: 7.5 million; 8.2% of all men have di-abetes,
Women: 8.1 million; 8.2% of all women.
Prevalence in children and teenagers:
123,000 in the United States.

MILANO—DIABETES MELLITUS AND LIFE INSURANCE
51
Prevalence by race/ethnicity in adults:
Non-Hispanic whites: 11.3 million; 7.8% ofall non-Hispanic whites,
Non-Hispanic blacks: 2.3 million; 10.8% ofall non-Hispanic blacks,
Mexican Americans: 1.2 million; 10.6% ofall Mexican Americans,
Other Hispanic/Latino Americans: �15%,Native Hawaiians: twice the diagnosed
prevalence of white Hawaiians,American Indians and Alaska natives:
prevalence varies by tribes, bands, pueblosand villages,
Asian Americans and Pacific Islanders;twice the prevalence of white Hawaiians.
General population mortality amongpersons with diabetes:
1993: 400,000 all-cause deaths among dia-betics �25 years old,
1994: 7th leading cause; whites, blacks, Chi-nese, Philippine,
4th leading cause; females and American In-dians,
5th leading cause Hawaiians6th leading cause; Japanese
CLASSIFICATION OF DIABETES4
1. Type 1 diabetes: (usual age onset: 0–19);also called insulin dependent diabetes melli-tus, IDDM, juvenile onset diabetes; consti-tutes 5% to 10% of all diagnosed cases.
2. Type 2 diabetes: (usual age onset: � 20years); non-insulin dependent diabetes,NIDDM, adult onset diabetes (AOD); consti-tute 90% to 95% of all diagnosed cases, insid-ious onset, milder symptoms and ketosis re-sistant.
Risk Factor Summary: Older age, probablepolygenetic disorders5, obesity6, positive familyhistory, history of gestational diabetes, im-paired glucose tolerance, physical inactivity7,race/ethnicity. African Americans, Hispanic/Latino Americans, American Indians, andsome Asian Americans and Pacific Islandersare at particularly high risk for type 2 diabetes.
MODY8,9: Maturity-onset Diabetes of the
Young. These are rare cases of NIDDM thatmost commonly develops in thin adolescentsand is associated with autosomal dominantinheritance and diminished or deranged in-sulin secretion. In the RW pedigree, poly-morphic markers on chromosome 20q appearto determine the early abnormalities of in-sulin secretion, and not insulin resistance inpersons predisposed to MODY10
3. Gestational diabetes:11,12 Pregnancy-on-set glucose intolerance develops in 2% to 5%of pregnancies but disappears when preg-nancy is over. Even with mild, asymptomatichyperglycemia, rigorous treatment, oftenwith insulin is required to protect against fe-tal morbidity and mortality. Risk Factors: Oc-curs more frequently in the obese, AfricanAmericans, Hispanic/Latino Americans,American Indians, and persons with a familyhistory of diabetes. Women who have hadgestational diabetes have about a 40% in-creased risk for developing type 2 diabeteswithin 5 to 10 years.
4. Secondary diabetes: Accounts for 1% to2% of all diagnosed cases of diabetes.
Risk Factors: Genetic Syndromes: lipodystro-phy, myotonic dystrophy, ataxia, telangecta-sia; Pharmaceuticals: thiazides, steroids,phenytoin; Malnutrition: anorexia, starvation;Pancreatic Disease: hemochromatosis, pancre-atectomy, pancreatic surgery; Hormonal:Cushing’s syndrome, pheochromocytoma, ac-romegaly, gigantism.
5. Impaired glucose tolerance: A new diag-nostic category characterized by fasting plasmaglucose values of 110 to 125 mg/dl. This wasformerly referred to as borderline, latent, sub-clinical, and chemical diabetes. It is estimatedthat 13.4 million persons, 7.0% of the popula-tion, have IGT; however one-third eventuallydevelop type 2 diabetes. These patients are notat risk for most long term diabetic complica-tions, but they are at risk for cardiovascular(macrovascular) complications.
THE NEW DIAGNOSTIC CRITERIA FORDIABETES13
1. Overnight Fasting Plasma Glucose:● Routine diagnostic screening test;

JOURNAL OF INSURANCE MEDICINE
52
Table 1. Short Term Death Rates-DCCT Findings23
NIDDM Subset &Macrovascular Disease
� Death Rate(%/y)
Newly diagnosed diabetes 1–3Known duration � 5–20 y 5–8Previous myocardial infarction 8–10Previous amputation 10–12Stroke 16
● Normal fasting plasma glucose: �110 mg/dL
● Impaired glucose tolerance: 110 to 125 mg/dL
● Diabetes mellitus: confirmed fasting plas-ma glucose �126 mg/dL.
● (Confirmation by repeat testing anotherday)
2. Random Plasma Glucose
● �200 mg/dL is diagnostic in the presenceof classic symptoms of diabetes
3. 2-Hour Oral Glucose Tolerance Test
● �200 mg/dL, (diagnostic if confirmed onanother day) performed according toWorld Health Organization standards
4. High Risk Pregnant Women*
● �25 years of age● Greater than normal body weight● Positive family history● High prevalence ethnic group● *Test for gestational diabetes during the
24th to 28th week
5. Glycosuria
Although glycosuria strongly suggests di-abetes, urine testing should never be used ex-clusively because some persons have a lowrenal threshold for glucose.
LABORATORY MARKERS FOR THEDEGREE OF DIABETES CONTROL14
The objective of treatment is to regulate theblood glucose to as close to normal as pos-
sible to prevent or slow the development ofacute and chronic complications and tertiaryend-points of diabetes mellitus listed below.
Degree of control is the average level ofblood glucose over time-elapsed
For underwriting, assessment of the degreeof control over time-elapsed involves the fol-lowing tests:
1. Glycated hemoglobin (Hemoglobin A1c,HbA1c, glycosylated hemoglobin,glycohemoglobin)15,16
Measures: glucose-hemoglobin combina-tion is the clinical ‘‘gold standard’’ and pri-mary indicator of degree of control. Reflectsthe average plasma glucose value during theprior 12 weeks. It is highly sensitive.
2. Fructosamine (glycated proteins)17,18
Measures: glucose-serum albumin combi-nation; Reflects average daily serum glucoselevels during the prior 2–4 weeks; Highly spe-cific.
3. Fasting Plasma Glucose (fasting bloodsugar, FBS)Plasma glucose obtained after an overnight
fastA current FBS that is substantially worse
than historical levels may indicate a worsen-ing in the disease and should be underwrit-ten cautiously
4. Random or postprandial (PP) glucoseNon-fasting plasma glucoseLittle underwriting value
5. Urine glucose (glycosuria)Little underwriting value due to differing
renal thresholds
OVERVIEW OF MORTALITY, MORBIDITY,AND BURDENS OF DIABETES IN THE
UNITED STATES19,20,21,22 (see Table 1)Metabolic
Diabetic ketoacidosis (DKA); indicates anacute insulin deficiency requiring exogenous-

MILANO—DIABETES MELLITUS AND LIFE INSURANCE
53
ly administered insulin for survival; a shift tofat metabolism and difficult to manage ‘‘brit-tle’’ disease.
Hyperglycemia (high blood sugar); indi-cates poor compliance or inadequate treat-ment
Hypoglycemia (low blood sugar); indicatesexcessive medication or insufficient caloric in-take
Macrovascular
Cardiac, cerebral and peripheral vascularcomplications secondary to the accelerateddevelopment of atherosclerotic disease in thelarge arteries resulting in angina, myocardialinfarction, stroke, claudication with 7,000 am-putations per year in the United States, anddeath rates 2 to 4 or more times higher thannormal populations
Microvascular
Nephropathy and retinopathy secondary todamaged small vessels and other tissues byglucose metabolic products resulting in 40%new cases end-stage renal disease (ESRD)yearly and 12,000 to 24,000 new cases blind-ness per year
Neuropathic
Autonomic neuropathy, and orthostatic hy-potension: mild to severe peripheral in 60%to 70% of diabetics resulting in impaired sen-sation, extremity pain, slowed digestion ordiarrhea. Currently, there is no cure for dia-betic neuropathy.
Hypertension
60% to 65% of diabetics are hypertensive;the coexistence of hypertension is a very un-favorable prognostic factor with mortality ator greater than 3 times that of normotensivediabetics;
Dental disease
Periodontal disease occurs in 30% type 1diabetics age 19 or older.
Complications of pregnancy
Congenital malformation rate: preconcep-tion care � 0% to 5%, no preconception care� 10%.
Intra-uterine mortality rate: non-diabetic �1.5%, diabetic � 3% to 5%.
Other complications
Hyperosmolar non-ketotic coma, acutelylife-threatening,
All-cause illness susceptibility and prema-ture mortality to influenza, pneumonia, etc.
Cost (United States, 1992);
Total (direct and indirect): $98.2 billion. Di-rect medical costs: $44.1 billion; Indirect $54.1billion (disability, work loss, mortality etc).
PATTERNS OF SURVIVAL AND EXCESSMORTALITY
Objectives
1. Diabetes mellitus outcome indicators ofpremature mortality, morbidity, and short-ened survival examined and analyzed in thissection are: age of onset, disease duration,gender, degree of metabolic control, intensityof care, micro & macrovascular, neuropathic& infectious complications, and, co-morbidrisk factors including alcohol abuse, build,hyperlipidemia, hypertension, & smoking.
2. Specifically reviewed are relevant histor-ical and current clinical & statistical follow-up studies to:
Discern the basic mortality and survival as-sociated with uncomplicated diabetes melli-tus compared to defined populations.
3. Determine the additional mortality im-pact of co-morbid conditions on diabetic sub-groups.
Historical Survey of Mortality & Survivalby Age of Onset, Disease Duration, andGender
Natural History of Diabetes Mellitus andthe Determination of Basic Mortality: The

JOURNAL OF INSURANCE MEDICINE
54
Table 2. Distribution by Age & Sex
Age group (y) 0–19 20–39 40–59 60–79 80 up Total
Male 252 305 832 467 17 1871Female 247 299 811 695 29 1982Total number 499 505 1643 30.1 46 3853Percent (%) 13.0 13.1 42.6 30.1 1.2 100.0
milestone Joslin Clinic, Equitable Life andLincoln National multi-year prospective stud-ies on select diabetic populations are histori-cally reviewed and systematically comparedwith abbreviated meta-analysis in the searchto discern inherent patterns of survival andmortality:
1. Joslin Clinic Study: 1939–196324
Subjects Studied and Follow-up
3,853 patients (white Massachusetts resi-dents—all others excluded) in five cohortswith early diagnosis of diabetes mellituswithin one year of first Joslin Clinic Visit,
‘‘Index years’’ of entry: July 1, 1939; 1944;1949; 1954; Clinical follow-up every 18-months, 92.6% follow-up to October 1, 1993(see Tables 2 through 4).
SUMMARY
● Age 0–20: excess mortality far higher thanall other age groups combined; Hazard Ra-tio � 4.3,
● Age 20–79: mortality ratios decrease, butEDRs increase in both sexes,
● All Age Groups: female mortality is muchhigher than male mortality.
● EDRs increase with increasing disease du-ration.
● Cumulative Survival Ratios progressivelydecrease with increasing duration
2. Equitable Life Study: 1951–197025
Purposes, Subjects Studied & Follow-up
● Analyze survival of uncomplicated diabe-tes by duration in applicants & policyhol-ders
● 20-year follow-up on DECLINED as well asISSUED applicants,
● 2,900 diagnosed diabetic applicants issuedsubstandard policies,
● 7,633 diagnosed diabetic applicants weredeclined insurance,
● 9,919 out of 10,538 applicants (94.1%) weresuccessfully traced to 1971 (see Tables 5through 9)
CONCLUSIONS
MRs, as a measure of severity, tend to in-crease with disease duration,● Declined group; 20-yr Cum MR � 395%● Issued group; 20-yr Cum MR � 167%● Proportional hazard; 2.4● MRs, for a particular duration; more favor-
able for older age groups,EDRs for all durations vary within narrow
limits:● Issued group: average EDR � 1.4 to 3.2/
1,000/year● Declined group: average EDR � 8.7 to 16/
1,000/year● Proportional hazard; 5.0
Build
● Underweight: highest MR; 485%● Overweight: lowest mortality ratios; 260 &
290%● Standard build: MR � 310%; EDRs—no
significant variation by build class,
Hypertension
● All categories, higher MRs and EDRs● Systolic hypertension is a more ominous
predictor of mortality than diastolic

MILANO—DIABETES MELLITUS AND LIFE INSURANCE
55
Table 3. RESULTS: Mortality Analysis by Age, Sex and Time Elapsed (Duration) Since Diagnosis:(adapted from Singer & Levinson)*
AgeInterval
(y)
Cumulative MR
Male(%)
Female(%)
Average(%)
Cumulative SR
Male(%)
Female(%)
Average(%)
EDR
Male(%)
Female(%)
Average(%)
0–19 0–5 192 1360 776 99.6 96.9 98.3 0.8 6.2 3.55–10 315 1070 693 97.7 95.5 96.6 3.8 3.0 3.4
10–15 275 840 558 97.4 95.0 96 0.7 1.0 0.915–20 465 1090 776 88.6 86.9 87.6 19 18 1920–25 490 1080 785 82.4 82.6 82.5 14 10 120–25 490 1080 785 82.4 82.6 82.5 4.2 5.9 5.1
20–39 0–5 103 520 312 100 96.9 98.5 0.1 6.7 3.45–10 142 350 246 98.5 95.7 97.1 2.9 1.9 2.4
10–15 139 355 247 97.4 91.9 94.7 2.1 7.9 515–20 175 300 238 89.8 91.1 90.5 16 1.4 8.720–25 168 285 227 88.4 88.3 88.4 2.9 5.4 4.20–25 168 285 227 88.4 88.3 88.4 3.5 4.9 4.2
40–59 0–5 140 168 154 97.1 96.7 96.9 5.9 6.5 6.25–10 147 190 169 91.7 89.3 90.5 12 15 13.5
10–15 152 197 175 83.2 78.7 81.0 19 23 2115–20 152 205 179 73.5 63.5 68.5 22 45 33.520–25 152 205 179 68.0 54.5 61.3 31 28 300–25 152 205 179 68.0 54.5 61.3 12 16 14
60–79 0–5 109 168 139 98.4 88.4 93.4 4.4 24 14.25–10 120 167 144 86.8 74.8 80.8 24 31 27.5
10–15 119 162 141 79.8 60.8 70.3 16 33 24.515–20 120 163 142 63.4 38.2 50.8 38 73 55.50–20 120 163 142 63.4 38.2 50.8 13 29 21
* (Basis of expected mortality: Massachusetts Life Tables)
Table 4. CONCLUSIONS: 0–25 year CumulativeMortality (%) & Excess Death Rate Rate/1,000
Age atDiagnosis
Mortality Ratios
M* F* Av.
Excess Death Rates
M F Av.
0–19 490 1080 785 4.2 5.9 5.120–39 168 285 227 3.5 4.9 4.240–59 152 205 179 12 16 1460–79 120 163 142 13 29 21
Key: M* � male F* � female
3. Lincoln National 4th Major ReinsuranceStudy on Diabetes & Mortality: 1976–199526
Purpose: Compare the current (1976–1995)diabetes underwriting outcome mortality ex-perience to the prior studies of 1975, 1971 and1961.
Subjects Studied and Follow-upIssue years: 1965–1984Number of policies: 11,176Number of claims: 790Policy years of exposure: 72,840Maximum exposure per policy in years: 26Average policy duration in years: 6.5
Classification of Insured Cases
● General cases: Treated diabetics withoutcomplication or comorbidity,
● Complicated cases: Treated diabetes withcomplications or comorbidities,
● Miscellaneous cases: Two categories;● Diabetics treated with diet & insulin plus
an oral hypoglycemic agent,● Applicants not classifiable as general or
complicated cases,● Selected cases: General cases treated by

JOURNAL OF INSURANCE MEDICINE
56
Table 5
Age at Application �30 30–39 40–49 50–59 60 up Total Av. Age-y
Numbered issued 472 776 940 616 96 2900 41.2Numbered declined 1615 1514 2001 1773 735 7638 42.2Total number 2087 2290 2941 2389 831 10,538 41.9Percent (%) 19.8 21.7 27.9 22.7 7.9 100.0
Table 6. RESULTS: Mortality by Age and DiabetesDuration Prior to Application; (Issued & Declined
Cases)*
Age atAppli-cation
Dura-tion (y) MR (%)
Est. 7-ySurv. Rate EDR
1–19 All 450 .9725 3.120–29 0–5 595 .9578 5.1
5–10 985 .9335 8.810–15 1770 .8791 1715–20 1590 .8917 1520 up 1640 .8853 16All Dur. 1090 .9246 10
30–39 0–5 315 .9536 4.65–10 370 .9417 6.210–15 820 .8791 1615–20 905 .8695 1820 up 1130 .8386 23All Dur. 545 .9187 9.8
40–49 0–5 295 .8993 9.95–10 340 .8808 1310–15 335 .8803 1315–20 400 .8565 1620 up 415 .8597 16All Dur. 325 .8876 12
50–59 0–5 210 .8567 115–10 320 .7829 2410–15 405 .7573 2915–20 425 .7242 3420 up 420 .7523 30All Dur. 235 .8224 16
60–69 0–5 210 .7667 205–10 235 .7263 2510–15 330 .6338 4415–20 395 .5749 5720 up 260 .7451 25All Dur. 240 .7344 25
* (basis of expected mortality: Equitable Life Select& Ultimate Mortality Tables 1958–1963)
diet and insulin, good control, no risk fac-tors (see Table 10).
COMMENT
The impact of diabetes is markedly higherin the 0–19 age category representing the se-verity of juvenile diabetes as compared to allother age groups. Mortality ratios successive-ly diminish with increasing age-onset to age60-years; At age 60 & up, mortality increasesmoderately (see Table 11).
COMMENT
● Above table reflects disease severity at anyage at diagnosis
● Persistent mortality patterns are noted foreach treatment regimen
● Rx by diet alone produced the lowest mor-tality
● Rx by diet & insulin—the highest mortality● Rx by diet plus an oral agent—mortality
intermediate between the above two*( ) indicates actual number of claims (seeTable 12)
COMMENT
● Rx by diet-alone: mortality crests & stabi-lizes at 12-years duration
● Rx by diet plus insulin: mortality crests &stabilizes at 12-years duration
● Rx by diet plus oral agent: mortality be-comes catastrophic beyond the 12-yearmark suggesting that disease duration con-tributes to severity by the development ofcomplications in this category (see Table13)

MILANO—DIABETES MELLITUS AND LIFE INSURANCE
57
Table 7. 20-year Cumulative Mortality & Survival Analyses by Disease Duration & Insurance Action at theTime of Application
Basis of expected mortality: Equitable Life Select and Ultimate Mortality Tables 1958–1963
Interval-y
Issued Group
MR% EDR 7-y Surv Rate
Declined Group
MR% EDR 7-y Surv Rate
0–5 128 1.4 .9561 300 12 .87685–10 210 5.6 .9279 385 15 .8675
10–15 265 6.1 .9337 635 22 .831615–20 255 6.6 .9258 645 25 .810920 up 235 5.8 .9313 665 24 .8204All 167 3.2 .9453 395 16 .8589
Table 8. 20-year Cumulative Mortality & Survival Analyses by Post-Application Duration of Follow-Up
Interval-y
Issued Group
MR% EDR SR%
Declined Group
MR% EDR SR%
0–2 167 1.4 99.7 440 8.7 98.32–5 130 0.5 99.6 410 14.0 94.35–10 152 3.9 97.7 420 21.0 84.9
10–15 168 9.0 93.3 405 24.0 75.015–20 167 8.1 89.6 395 18 68.5All 0–20 167 3.2 89.6 395 16 68.5
COMMENT
● Mortality, reflecting treatment-dependentseverity, is stable in the 1st interval,
● Mortality rises in successive durations in-dicating rapid blunting of the effects of riskselection
● Mortality continue to rise differentially inthe diet/insulin treated group after the 15th
year (see Table 14)
COMMENT
● Mortality is the highest in the underweightvs. normal weight sub-group (345% vs.220%)
● Mortality is minimally more in the over-weight vs. normal weight (238% vs. 220%)(see Table 15)
COMMENT
● Highest excess mortality: extreme builds &renal complications (albuminuria),
● Rx with oral agents & insulin reflect severedisease: 601% mortality.
Summary: Three-Study Comparison ofMortality & Survival by Age-onset,Duration, and Sex
AGE ONSET
Joslin Clinic: 25-year clinical follow-up● Disease severity measured by age onset &
duration since diagnosis,● Below age 20, excess mortality far exceeds
that of all other age groups,● Female mortality was significantly greater
& long-term survival significantly less thanmales in almost all age/duration catego-ries,
From Age 20–79
● Mortality ratios decrease but excess deathrates increase with advancing age,

JOURNAL OF INSURANCE MEDICINE
58
Table 9. Comparative Experience by Build andBlood Pressure (Issued and Declined Cases, All Ages
and Durations Combined)
Category MR% EDR
7-ySurv.Rate Hazard
Standard Build 310 11 .8955Underweight 485 12 .8981 1.5610–20% overweight 260 12 .870821% overweight up 290 13 .8660
Blood PressureS�140, D�90 265 8.2 .9122S 140–159, D�90 335 18 .8296 1.26S�160, D�90 505 39 .7046 1.91S�140, D 90–99 375 15 .8625 1.42S 140–159, D 90–99 420 23 .8048 1.58S�160, D�90–99 460 37 .7100 1.74S�160, D�100 275 12 .8796 1.04S�160, D�100 580 33 .7502 2.19
BP SummaryNormotensive 265 8.2 .9122Av. All HTN (S, D,
Both) 421 25.3 .7916 1.59
Table 10. RESULTS: Mortality by Age at Diagnosis—General Cases*
Age atDiagnosis Mortality Ratio (%)
0–19 52420–29 41230–39 20240–49 23650–59 17660 & up 215
* Basis of expected mortality: 1975–80 Select and Ul-timate Tables
Table 11. Mortality by Age at Diagnosis & Treatment Type—General Cases
Age at Dx Diet Alone Diet & Oral Agent Diet & Insulin All
�40 118% (11)* 326% (24) 426% (98) 335% (133)40–49 153% (34) 303% (52) 366% (20) 236% (106)50 & up 138% (45) 242% (71) — (4) 185% (120)All 140% (90) 273% (147) 390% (122) 240% (359)
● Survival ratios inordinately decrease withadvancing age,
● Progressively better prognosis in both sex-es with advancing age.
Equitable Life: 20-plus years follow-up
● Study included both issued and declinedapplicants for life insurance,
● Below age 30, excess mortality exceeds thatof all other age groups,
● Mortality ratios decrease but excess deathrates tend to increase with advancing ageat application,
● 20-year cumulative survival:Issued: 89.6%; declined: 68.5% (indicating
the value of risk selection),
Lincoln National Reinsurance: 20-yearfollow-up
● Disease severity measured by age onset:● Below age 20, excess mortality far exceeds
that of all other age groups,● Mortality decreases with advancing age of
diagnosis to age 60 when a moderate in-crease occurs.
DURATION
Joslin Clinic● Mortality remained level with time elapsed
(increasing duration) from diagnosis,● Excess death rates significantly increase
with both disease duration and advancingage,
● Female mortality, both mortality ratios andexcess death rates, exceeds that of males,
● Cumulative survival progressively decreas-es with increasing disease duration.

MILANO—DIABETES MELLITUS AND LIFE INSURANCE
59
Table 12. Mortality by Duration at Issue & Treatment Type—General Cases
Durationat Issue Diet Alone Diet & Oral Agent Diet & Insulin All
0–6 139% (67) 250% (91) 355% (33) 203% (191)7–12 143% (17) 245% (31) 423% (36) 255% (84)13 & up 143% (6) 523% (25) 392% (53) 374% (84)All 140% (90) 273% (147) 390% (122) 240% (359)
Table 13. Mortality by Policy Duration & Treatment Type—General Cases
PolicyDuration Diet Alone Diet & Oral Agent Diet & Insulin All
1–5 96% (19) 249% (40) 220% (23) 177% (82)6–10 164% (34) 323% (51) 335% (34) 255% (119)11–15 178% (25) 346% (38) 587% (33) 313% (96)16 up 123% (12) 164% (18) 629% (32) 240% (62)All 140% (90) 273% (147) 390% (122) 240% (359)
Table 14. Mortality by Relative Weight and Treatment Type—General Cases
RelativeWeight* Diet Alone Diet & Oral Agent Diet & Insulin All
Underweight 188% (11) 318% (14) 497% (34) 345% (54)Normal 123% (43) 266% (74) 329% (63) 220% (180)Overweight 154% (36) 273% (59) 470% (25) 238% (120)All 140% (90) 273% (143) 390% (122) 240% (359)
Table 15. Mortality in Complicated and MiscellaneousCases
ComplicationMortalityRatio (%) Number
Hypertension, current or history 248 110Circulatory impairment 253 34Albuminuria 388 19General or extreme builds 426 51Endocrine, nervous, other 331 42Multiple conditions indicated 311 77All 297 333
Miscellaneous CasesDiabetes merely suspected 170 15History only of diabetes 149 16Oral medication & insulin 601 10Cases not classified 315 57
Equitable Life
Mortality and survival by age & duration prior toapplication● Issued Group: MRs increased from 128%
to 265% up to 15-years prior to application,EDRs increased from 1.4 to 6.6 extra deathsper 1,000 over 15-years,
● Declined Group: MRs are consistently 2.5to 3.0 times greater on declined casesEDRs increased to about 25 extra deathsper 1,000 over 20-years,
Mortality and survival by post insuranceduration of follow-up
● Issued Group: Cumulative mortality (MRs)remained stable at 167% over 20-years,

JOURNAL OF INSURANCE MEDICINE
60
Table 16. Authors Abbreviated Meta-analysis of Historical Mortality by Age at Dx & Disease Duration
Age Study 0–5 6–10 11–15 16–20 �20
0–19 Joslin 776 693 558 776 785Equitable 450 450 450 450 450Lincoln 355 423 392 (390) (390)*Average 527 522 467 613 618
20–39 Joslin 312 350 247 238 227Equitable 455 — — — —Lincoln 203 335 335 374 374Average 323 343 291 306 300
40–59 Joslin 154 169 175 179 179Equitable 253 339 370 413 418Lincoln 211 211 (523) (523) 273Average 206 237 273 296 290
60–79 Joslin 139 144 141 142 142Equitable 210 235 330 395 260Lincoln 185 185 (523) (523) 273Average 178 188 236 269 225
* figures in parenthesis not used in calculation
EDRs increased modestly to 8.1 deaths per1,000 at 29-years,SRs decreased from 99.7% to 89.6% withfollow-up duration to 20-years.
● Declined Group: Higher initial MRs &EDRs remained stable,SRs diminished to 68.5%.
Lincoln National ReinsuranceMortality by disease duration at issue & treatmenttype (general cases)
1. Diet alone: Lowest mortality, stable inthree successive intervals, average 140%,
2. Diet & insulin: Highest mortality overall,MRs increase to 12-years duration, then sta-bilize, Average mortality is 390%,
3. Diet & oral agent: Stable mortality to 12-years (245%), 523% mortality ratio after 12th
year, Increases abruptly to 523% by 13th yearof disease duration,
(NOTA BENE: Advancing duration is as-sociated with increasingly higher mortality &morbidity in this treatment category)
Mortality by policy duration and treatmenttype (general cases)
1. Diet alone: Mortality increased with du-ration but overall was stable at 140%
2. Diet & oral agent: Mortality increasedfrom 249% to 346% at 15 years, Overall 20-year mortality averaged 273%,
3. Diet & insulin: Mortality rose from aninitial 220% to 629% at 16-years & beyond.Beneficial effects of selection dissipate rapidlyin this Rx category (see Table 16 and 17).
Current Age, Sex & Duration-specificSMRs for Diabetes Mellitus: Berger 199927
OBJECTIVE: analyze the incidence, preva-lence and mortality of diabetes in a popula-tion of 280,539 inhabitants and determineStandardized Mortality Ratios (SMRs)
STUDY DESIGN: the incidence, prevalence,and deaths from diabetes at all ages of a pro-spectively followed population in the countyof Skaraborg, Sweden, since 1991 (see Table18).
RESULTS
1. Annual incidence of diabetes per 100,000inhabitants (mean � 95% CI) in 1991–1995:● Type 1 diabetes; 14.7 � 3.2diagnosed at
24.1 � 2.2 years of age,● Type 2 diabetes; 265.6 � 16.1 diagnosed at
66.6 � 0.6 years of age.

MILANO—DIABETES MELLITUS AND LIFE INSURANCE
61
Table 17. Three-Study Composite Relative Risk(%) Associated with Oral Agent or Insulin-treatedDiabetes Mellitus by: Age at Diagnosis & Disease
Duration
Experience of the Joslin Clinic 1939–1963; Equitable Life1951–1970; Lincoln National 1976–1995*
AgeOnset
Disease Duration (years)
0–5 6–10 11–15 16–20 20 up All
0–19 427 422 367 513 518 44920–39 223 243 191 206 200 21340–59 106 137 173 196 190 16060–79 78 88 136 169 125 119
* Excess Mortality of Diabetes Mellitus Controlledby Diet Alone � 40%
Table 18. OUTCOMES: Relative mortality risk (SMRs) for diabetics by sex, age at diagnosis, and actual age
Actual Age(years)
Age at diagnosis (years)
0–19 20–39 40–59 60–79 80–99
0–19 7.1 (2.2–22.1)M 3.6 (0.5–26.2)F 12.7 (3.1–52.0)
20–39 5.6 (2.6–11.9) 5.7 (2.3–13.8)M 3.4 (1.1–10.8) 3.3 (0.8–13.4)F 10.4 (3.8–28.5) 10.8 (3.4–34.3)
40–59 7.8 (5.2–11.7) 3.1 (2.0–4.7) 3.5 (2.7–4.6)M 7.3 (4.3–12.2) 3.2 (1.9–5.2) 3.3 (2.4–4.5)F 8.3 (4.3–16.2) 2.6 (1.2–5.8) 3.6 (2.2–5.9)
60–79 3.4 (1.9–6.1) 2.8 (2.0–3.8) 1.7 (1.5–1.9) 1.6 (1.5–1.8)M 3.3 (1.6–6.8) 2.5 (1.7–3.7) 1.4 (1.2–1.6) 1.5 (1.3–1.7)F 3.3 (1.2–9.0) 3.0 (1.8–4.9) 2.0 (1.7–2.4) 1.8 (1.3–2.1)
80 � 0.7 (0.2–3.0) 1.2 (0.9–1.6) 0.9 (0.8–0.9) 1.1 (0.9–1.2)M 1.0 (0.7–1.5) 1.0 (0.7–1.5) 0.8 (0.7–0.9) 1.0 (0.8–1.1)F 1.3 (0.2–10.8) 1.4 (0.9–2.0) 0.9 (0.8–1.0) 1.1 (1.0–1.3)
Total mean 6.0 (4.5–8.0) 3.1 (2.4–3.9) 2.1 (1.9–2.4) 1.2 (1.2–1.3) 1.1 (0.9–1.2)M 4.4 (3.0–6.5) 2.4 (1.8–3.1) 1.9 (1.7–2.1) 1.1 (1.0–1.2) 1.0 (0.8–1.1)F 8.7 (5.5–13.6) 4.4 (3.0–6.5) 2.3 (2.0–2.7) 1.4 (1.2–1.5) 1.1 (1.0–1.3)
Data are means (95% Confidence Intervals)
● Incidence of type 2 was significantly higherin men (P � 0.001),
● No significant change in the age at diag-nosis,2. Prevalence of diabetes increased by 6%
each year (although the incidence & age at Dxwere constant).
3. Relative mortality risk for diabetic pa-tients:
● Almost four times higher than expected,● Median age at death; increased significantly
from 77.2 to 80.2 years (P � 0.05)
CONCLUSIONS
Prevalence but not incidence of diabetes in-creased from 1991–1995,Although diabetics showed a high relativemortality, increased survival apparently ex-plains the increase in prevalence of diabetesin Skaraborg, Sweden.
COMMENTS
● The difference between age ’age at diag-nosis’ and ‘actual age’ is an indicator of DMduration,
● Relative risk for death by age at diagnosis,actual age (marker for disease duration)and sex, pattern the order of magnitude ofthe composite relative risk developed in theabbreviated meta-analysis of the JoslinClinic, Equitable Life, and Lincoln NationalLife studies above.

JOURNAL OF INSURANCE MEDICINE
62
Prognosis of Type 1 DM28
1. Life expectancy continues to improve &survival is longer since the 1940s and earlier,
2. Epidemiologic data are available to 1980but at this point, continuing prospective studiesmust continue another 40-years and beyond to ul-timately and scientifically validate the bene-ficial results of current therapies.
3. The goal of good control has now a verydefinitive objective with precise tools: Dailycapillary blood sugar with measurement ofglycated hemoglobin.
4. The DCCT for type 1 and UKPDS fortype 2 clinical studies: Recently scientificallyvalidated the view that intensive insulin treat-ment, regular measurement of glycohemoglo-bin and daily use of capillary blood sugar ef-fect good glycemic control & exerts positiveeffect on limiting microangiopathy, its asso-ciated morbidity & mortality, & enhancementof quality of life.
5. Increasing experience of healthy long-term survivors, after 40–50 years of type 1diabetes.
Prognosis of Type 2 DM
1. With disease onset after age 60 and nocomplications, comorbidities or risk factors,diabetes has little effect on longevity.
2. The UKPDS clinical study: Additionalsecondary risk factors of obesity, atheroscle-rosis, and dyslipidemia can also benefit, al-though to a lesser degree, from modern ap-proaches to secondary prevention.
MORTALITY & SURVIVAL ASSOCIATEDWITH DEGREE OF CONTROL,
COMPLICATIONS ANDCOMORBIDITIES
General: A similar spectrum of metabolic,microvascular, macrovascular, neuropathicand other complications accompany all formsof diabetes mellitus to greater or lesser de-gree. However the morbidity and mortalityrisk of co-morbid cardiac, peripheral & cere-brovascular, and other impairments associat-ed with diabetes is profound when compared
to their underlying risk in the general popu-lation.
Laboratory Markers of Control and Gly-cemic Goals: Monitoring and control of gly-cemic status is the capstone of diabetes care.Since hyperglycemia is the defining hallmarkof the diabetic state, determinations of meanor average fasting glucose levels over weeksand months provide the patient and healthcare team with an objective measure of gly-cemia over an extended period of time usefulfor assessing the efficacy of therapy and tomake adjustments in diet, exercise, and med-ications to achieve the best possible glucosecontrol.
Glycated hemoglobin (GHb) testing29,also commonly referred to as glycosylatedhemoglobin, glycohemoglobin, HbA1c, orHbA1, is a term used to describe a stable he-moglobin-glucose chemical bond, which is di-rectly proportional to the ambient glucoseconcentration. The level of GHb in a bloodsample provides a glycemic history of theprevious 120 days, the average red blood celllifespan.
Clinical implications of hyperglycemia30
1. Potential for tissue hypoxia and resultantdiabetic microangiopathy caused by the in-creased affinity and binding of oxygen byglycohemoglobin.
2. Routine use of GHb testing is recom-mended in all diabetic patients as a surrogateof mean blood glucose determination for tworeasons:
3. Determine the degree of glucose controlat initial assessment,
4. Facilitate routine continuing care.Glycated serum proteins (GSPs), fructo-
samine31, measures the chemical combination(glycation) of glucose molecules with serumalbumin. Fructosamine determinations reflecttime-integrated average glucose concentra-tions over the 2- to 4-week half life of theseserum proteins.
Sensitivity and Specificity of GHbs andGSPs32 Subjects Studied, Follow-up, Results andConclusions: In a study of a sample populationof 1,000 consecutive HbA1c reflexes at HORL

MILANO—DIABETES MELLITUS AND LIFE INSURANCE
63
Table 19. Reference Ranges for Glycemic Control:Glycated Protein Testing33
Diabetic Population: HbA1c Values � Average FastingPlasma Glucose Levels.�
HbA1cFPGmg% mM/L HbA1c
FPGmg% mM/l
6 106 5.83 14 338 18.597 135 7.425 15 367 20.1858 164 9.02 16 396 21.789 193 10.615 17 425 23.375
10 222 12.21 18 454 18.5911 251 13.805 19 483 26.56512 280 15.4 20 512 28.1613 309 16.995
� This analysis is for 400 diabetic patients. Thesamples were collected in a clinic and analyzed byCRL. The line is: Y � a � b(X); a � �68, b � 29.
Table 20. Insurance Population: Fasting and Non-Fasting Plasma Glucose�
HbA1cPl. Glu-cose% mM/L HbA1c
Pl. Glu-cose% mM/L
6 121 6.655 14 313 17.2157 145 7.975 15 337 18.5358 169 9.295 16 361 19.8559 193 10.615 17 385 21.175
10 217 11.935 18 409 22.49511 241 13.255 19 433 23.81512 265 14.575 20 457 25.135
� This analysis is based on 8,000 HbA1c values:The line is: Y � a � b(X); a � �23, b � 24
Table 21. Measures of Control—Comparative Parameters34,35
Indicator Normal
HbA1c % �6.0 6.1–8.0 8.1–9 9.1–10 �10Fructosamine mmol/l �2.1 2.2–2.5 2.6–2.9 3.0–3.3 �3.3FBS mg/dl �110 111–164 165–193 194–222 �222
(Home Office Reference Laboratory, Lenexa,Kansas), the following results were noted:
1. 771 samples had an elevated glucose re-sult (�115 mg/dl to age 55, and �125 mg/dl over age 55).
2. Of these 771 samples, only 31.5% (243)also had elevated HbA1c.
3. 466 specimens had elevated fructosami-ne (�2.1 mM/L); of these, 57.7% (269) hadelevated HbA1c.
4. There were 229 HbA1c reflexes that werethe result of an elevation in fructosaminealone.
5. Sixty-one resulted in an elevated HbA1c.
CONCLUSION
1. In the short term, using HbA1c as themost sensitive indicator of glycemic control,fructosamine was almost twice as specific asglucose in detecting this state.
2. The overall correlation between fructo-samine and HbA1c was 78.5%.
3. The correlation between glucose levelsand HbA1c was only 41% (see Table 19through 21).
Glycohemoglobin Assay Methods36,37
In keeping with the need to standardizeglycohemoglobin test results so that clinicallaboratory results are comparable to those re-ported in the Diabetes Control and Compli-cations Trial (DCCT) where relationships tomean blood glucose and risk for vascularcomplications have been established, ClinicalReference Laboratory, Lenexa, Kansas usedassay methods based primarily on structuraldifferences as approved by NGSP (Immuno-assay, BMC Tina Quant). Occasionally, ap-proved methods based on charge differences(Ion-exchange HPLC, Bio-Rad Diamat) werealso used.

JOURNAL OF INSURANCE MEDICINE
64
Table 22. RESULTS: Proportional Hazards models for a 1% baseline change in HbA1c; Hazard Ratios (HR)at the 95% confidence limit (CI) as follows
�30-year old: Underlying cause of death (diabetes): HR � 1.25; (CI, 1.13 to 1.38),Ischemic heart disease: HR � 1.18; (CI, 1.00 to 1.40),All causes: HR � 1.12; (CI, 1.04 to 1.21),
�30-year old: Diabetes: HR � 1.32; (CI, 1.21 to 1.43),Ischemic heart disease: HR � 1.10; (CI, 1.04 1.17),Stroke: HR � 1.17; (CI, 1.05 to 1.30),Cancer: HR � 0.99; (CI, 0.88 to 1.10).All causes: HR � 1.12; (CI, 1.08 to 1.16).
Hyperglycemia as a Risk Factor for Death:Is there a glycemic threshold for mortalityrisk?
Moss et al38 reported on a cohort-designbased in a primary care setting. Participatingwere:
1. 996 diabetics younger than 30-years old(median follow-up 10-years); Mean HbA1c �12.6%,
2. 1,370 diabetics, age 30-years or older(median follow-up 8.3-years); Mean HbA1c �11.1%.
3. The main outcome measure was cause-specific mortality as determined from deathcertificates (see Table 22).
CONCLUSIONS: Glycosylated hemoglobinlevels are significantly related to mortalityfrom diabetes.
Balkau et al39 have recently provided cur-rent 1998 information on the relationship ofglycemia to mortality in initially non-diabeticadults in a 20-year mortality study of non-diabetic, working men, age 44–55 years, inthree European cohorts known as the:● Whitehall Study (n � 10,025),● Paris Prospective Study (n � 6,629),● Helsinki Policeman Study (n � 631).These men were identified by their 2-h glu-cose levels following an oral glucose tolerancetest and by the absence of a prior diagnosisof diabetes. As the protocol for the oral glu-cose tolerance test and methods for measur-ing glucose differed between studies, mortal-ity was analyzed according to the percentilesof the 2-h and fasting glucose distributions,using the Cox’s proportional hazards model.
RESULTS: Men in the upper 20% of the 2-h glucose distributions and those in the up-per 2.5% for fasting glucose had a signifi-cantly higher risk of all-cause mortality incomparison with men in the lower 80% ofthese distributions, with age-adjusted hazardratios of 1.6 (95% CI 1.4–1.9) and 2.0 (1.6–2.6)for the upper 2.5%. For death from cardio-vascular and CHD, men in the upper 2.5% ofthe 2-h and fasting glucose distributions wereat higher risk, with age-adjusted hazard ra-tios for CHD of 1.8 (1.4–2.4) and 2.7 (1.7–4.4),respectively.
CONCLUSIONS: If early intervention aimedat lowering blood glucose concentrations canbe shown to reduce mortality, it may be jus-tified to lower the levels of both 2-h and fast-ing glucose, which define diabetes.
IN SUM: Harris and Eastman40 comment-ing on this investigation found this to be verylarge and long term study indicating that gly-cemia can be implicated as a risk factor onlyfor all-cause mortality in men in the highest2.5th percentile of fasting glucose, for heartdisease mortality in men in the highest 2.5th
percentile of 2-h glucose, and for all-causeand cancer mortality in the �20th percentileof 2-h glucose.
Hyperglycemia: Risk for MicrovascularComplications & MortalityDiabetes Control & Complications TrialResearch Group, Type I DM and Degree ofControl41
The DCCT is a 10-year study conducted bythe National Institutes of Health involving

MILANO—DIABETES MELLITUS AND LIFE INSURANCE
65
Table 23. Risk for Development & Progression of Long-term Complications of Diabetes with Intensiveversus Conventional Therapy
Complications
Primary Prevention
ConRxrate/100
IntRxpt-yr
Risk Red%
Secondary Intervention
Con Rxrate/100
IntRxpt-yr
Risk Red%
Both CohortsRisk
Reduction%
Retinopathy 4.7 1.2 76 7.8 3.7 54 63
Urine Alb Excretion�40 mg/24 hr 3.4 2.2 34 5.7 3.6 43 39�300 mg/24 hr 0.3 0.2 44 1.4 0.6 56 54
Clinical neuropa-thy (5 years) 9.8 3.1 69 16.1 7.0 57 60Macrovascular Dis. 0.8 0.5 41 (albeit not significantly)
1,441 volunteers ages 13–39 with insulin–de-pendent diabetes mellitus (IDDM) at 29 med-ical centers in the United States and Canada,which demonstrated that the maintenance ofnear-normal blood glucose levels was the keyfactor in the salutary effect of intensive ther-apy (versus conventional therapy) for thecontrol of microvascular complicationscaused by the development of microangio-pathy.
The DCCT quantitatively defined the re-lationship between GHb and average glycem-ia. Since GHb assays are not standardizedamong laboratories, however, it is not yetpossible for health care providers to relate theGHb test result to average blood glucose ex-cept in a general way. If it were only a ques-tion of normal versus abnormal test values,standardization of GHb assays would not benearly so important: each laboratory couldestablish a non-diabetic reference range as‘‘normal’’ or ‘‘abnormal.’’ Instead, GHb val-ues in patients with diabetes are a continuum. . . ranging from normal in a small percent-age of patients, whose average blood glucoseis normal or close to normal, to markedly el-evated values . . . reflecting an extreme degreeof chronic hyperglycemia.
DCCT general guidelines in relating GHbto mean blood glucose are as follows:● Highly correlated (r � 0.80, P � 0.0001),
linear relationship between average gly-cemia and GHb.
● Roughly, each 1% increase in GHb was re-lated to a 30 mg/dl (1.99 mM/L) increasein average blood glucose.The DCCT was not able to study the dose-
response of blood glucose levels on the oc-currence of complications; rather, the risk fordevelopment and progression of the chronicmicrovascular complications of diabetes—ret-inopathy, nephropathy, and neuropathy—exists ona continuum closely related to the degree ofglycemic control, as measured by glycohem-oglobin (GHb) determinations.
DCCT Results: See Table 23.
CONCLUSIONS OF THE DCCT STUDY
1. The relation between the rate of devel-opment of retinopathy and glycemic expo-sure, expressed as the HbA1c value over timeshowed a continuously increasing risk of sus-tained progression with increasing mean gly-cosylated hemoglobin values.
2. Similarly, the risk of severe hypoglyce-mia increased continuously with lowermonthly glycosylated hemoglobin values.
3. Secondary analyses do not support theexistence of a specific target value for glyco-sylated hemoglobin at which the benefits ofintensive therapy are maximized and therisks minimized.
4. Although patients with non-insulin-de-pendent diabetes mellitus (NIDDM) were notstudied, other reports indicate that hypergly-

JOURNAL OF INSURANCE MEDICINE
66
Table 24. RESULTS: Lifetime (Relative) Risk for Blindness and End-Stage Renal Disease by HbA1c Level
%HbA1c
Age Onset of Diabetes∗ �
45 years
Bl ESRD
55 years
Bl ESRD
65 years
Bl ESRD
75 years
Bl ESRD
7 0.3 2.0 0.1 0.9 �0.1 0.3 �0.1 0.18 1.1 2.7 0.5 1.3 0.2 0.5 �0.1 0.19 2.6 3.5 1.2 1.6 0.5 0.6 0.1 0.1
10 5.0 4.3 2.5 2.1 1.0 0.8 0.3 0.211 7.9 5.0 4.4 2.5 1.9 0.9 0.5 0.2
∗ transition probability from retinopathy to blindness� transition probability from proteinuria to end-stage renal disease
cemia is associated with the presence or pro-gression of complications in NIDDM.
5. Diminished cumulative risk for micro-vascular complications with optimized gly-cemic control:
Mean glucose values of �155 mg/dl (�8.5mmol/L);
Normal FBS � �110 mg/dL or 6.05mmol/l;
Hemoglobin A1c levels of �7.2%, (�6.05%� normal).
Vijan Markovian Model and Type IIDiabetes Mellitus42
Vijan describes a Markovian model thatwas constructed to analyze the risk for reti-nopathy and nephropathy in patients withType 2 diabetes as defined in the DCCT. Thesimulated patients progressed sequentiallythrough increasingly severe disease states;death could occur in any disease state.
Blindness: defined as corrected visual acuityof 20/200 or worse and was restricted toblindness caused by retinopathy or its se-quelae (for example, macular edema).
Microalbuminuria: defined as an albuminlevel of 30 to 300 mg/g of creatinine;
Proteinuria: defined as a protein level great-er than 300 mg/g of creatinine;
End-stage Renal Disease: defined as renaldisease requiring dialysis or transplantation(see Table 24).
Results for Patients Who Become Blind
Age onset 45 years; average time spentblind was 11 years;
Age onset 55 years; average time spentblind was 8.3 years;
Age onset 65 years; average time spentblind was 5.2 years;
Age onset 75 years; average time spentblind was 3.2 years.
Results for Patients Who Develop End-stage Renal Disease
Age onset 45 years; average time spent inthis disease state was 5.2 years;
Age onset 55 years; average time spent inthis disease state was 4.6 years;
Age onset 65 years; average time spent inthis disease state was 4.0 years;
Age onset 75 years; average time spent inthis disease state was 2.7 years.
CONCLUSIONS: Highest risk for developingend-stage outcomes:
1. Younger age onset diabetes,2. Poor glycemic control: HbA1c level
�8.0%.
Hyperglycemia: Risk for MacrovascularComplications & Mortality
Andersson and Svardsudd43 studied the in-fluence of long-term glycemic control on ma-

MILANO—DIABETES MELLITUS AND LIFE INSURANCE
67
crovascular mortality in a cohort totaling 441newly detected type II diabetic individualsdiagnosed between 1972 and 1987 and fol-lowed until 31 December 1989.
METHODS: Mortality rates were age-stan-dardized against the Swedish national pop-ulation of 31 December 1986 using 5-year ageintervals. Survival analyses were performedusing the Cox proportional hazards regres-sion method with P values �5% accepted asindicating significance.
RESULTS: The levels of characteristics sig-nificantly related to mortality, together withother clinical characteristics, are shown in Ta-ble 13 for the surviving and deceased type 2diabetic patients (see Tables 25 and 26):
CONCLUSIONS: Mortality and Morbidity
1. There was no obvious threshold leveldistinguishing good from poor FBG values,
2. The lower the FBG levels, the better theoutcome.
3. Diabetic subjects with average long-termFBG �7.8 mmol/l (141mg/dl)
4. All-cause mortality rate (Relative Risk)of 1.4, and, Cardiovascular Relative Risk of1.6;
5. 5% & 60% respectively higher mortalityversus diabetic subjects with average FBG �7.8 mmol/l.
6. All-cause and cardiovascular mortalityrose with less long-term metabolic control inall age groups independent of sex and treat-ment modalities.
7. Using Pitman’s nonparametric permuta-tion test, the results showed a significant pos-itive correlation between average FBG andsurvival whether or not confounders presentat baseline—(age at diagnosis, heart disease,cerebrovascular disease, or kidney disease)—were taken into account (P � 0.0001).
8. Long-term Survival Analysis (incidentcases):
Average FBG �6.7 mmol/l: 10-year surviv-al �72%
Average FBG �10.0 mmol/l: 10-year sur-vival �62%.
Impact of Impaired Glucose Tolerance onCardiac Function44
The importance of the Celentano study isthat it was the first to provide data on abnor-mal cardiac function and structure in patientswith only minor abnormalities of glucose ho-meostasis—impaired glucose tolerance(IGT)—using well standardized diagnosticcriteria. Specifically, they found that left ven-tricular end-systolic dimension, indexed tobody surface area, was greater in those withNIDDM (p � 0.05) and in those with im-paired glucose tolerance (p � 0.05) with re-spect to normo-glycemic persons (1.94 � 0.29versus 1.76 � 0.31) independent of the con-founding role of myocardial ischemia, bodyweight, and blood pressure.
Metabolic Syndrome X (InsulinResistance)45,46
The combination of insulin resistance, abnormalglucose tolerance, dyslipidemia and hypertensionhas been termed metabolic syndrome X. Despresand colleagues47 have concluded that highfasting insulin concentrations appear to be anindependent predictor of ischemic heart dis-ease but evidence does not demonstrate con-clusively that improved glucose tolerancelowers the risk of CHD. Regenauer48 dis-cussed the epidemiology and prognostic as-pects of syndrome X concluding that extramortality rates of the individual impairmentsshould not be applied on a purely additivebasis. At this time prudent risk assessment shouldconsider the adequate control and stability of theindividual impairments while also assessing thestatus of the cardiovascular system.
UKPDS and Degree of Control (Summaryof Results)49,50,51,52,53,54,55,56,57,58
● No patients with NIDDM were included inthe DCCT.
● The United Kingdom Prospective DiabetesStudy (UKPDS) was organized to evaluatethe effect of intensive therapy on outcomesin Type 2 diabetes.

JOURNAL OF INSURANCE MEDICINE
68
Table 25. Clinical Characteristics of Type 2 Diabetics by Vital Status
Survivors Deceased
Number 250 161Men (%) 50.0 (43.8–56.2) 52.2 (44.5–59.9)Age at diagnosis (years) 62.9 (61.5–64.4) 71.8 (70.3–73.3)Mean follow-up time (years) 8.6 (8.1–9.2) 5.6 (5.0–6.1)Average FBG (mmol/l) 8.2 (7.9–8.4) 8.8 (8.5–9.2)Average BMI (kg/m-squared) 28.9 (28.3–29.5) 27.7 (27.4–28.1)
Diagnosis (%)Cardiovascular disease 44.4 (38.2–50.6) 80.7 (74.6–86.8)Cerebrovascular disease 10.0 (6.3–13.7) 23.0 (16.5–29.5)Peripheral vascular disease 5.6 (2.8–8.4) 9.9 (5.3–14.5)Nephropathy 5.6 (2.8–8.4) 12.4 (7.3–17.5)Hypertension 66.0 (60.1–71.9) 58.4 (50.8–66.0)
Type of diabetes treatment (%)Diet only 50.0 (43.8–56.2) 46.8 (39.0–54.6)Tablets 44.4 (38.2–50.6) 48.1 (40.3–55.9)Insulin 5.6 (2.8–8.4) 5.1 (1.6–8.6)
95% CIs are given in parentheses. Average FBG and BMI denote values recorded during the whole study period.A diagnosis of concomitant disease denotes any recording of the disease during the study period.(8.2 mmol/l�149 mg glucose/dl; 8.8 mmol/l �160 mg/dl).
OVERALL RESULTS
1. The type 2 group with its additional sec-ondary risk factors—obesity, atherosclerosis,dyslipidemia—also benefit, although to alesser degree, from the modern approaches tosecondary prevention,
2. Standardized mortality ratios for 5,071patients recently diagnosed with NIDDMcompared with general population indicatepoorer prognosis with disease duration inmales and females59 (see Table 27),
In the Steno type 2 randomized study60
(Steno Diabetes Centre, Copenhagen, Den-mark), Gaede and co-workers carried out arandomized, open, parallel trial of stepwiseintensive treatment or standard treatment ofmultifactorial risk factors in microalbuminur-ic patients with NIDDM, mean age 55.1years. This included behavior modificationand pharmacological therapy targeting hy-perglycemia, hypertension, dyslipidemia, andmicroalbuminuria with 3.8 years clinical fol-low-up.
RESULTS
Multifactorial intensive therapy group ver-sus the standard group had significantly low-er rates of progression to:
Nephropathy: odds ratio 0.27 (95% CI, 0–10–0.75)
Retinopathy: odds ratio 0.45 (95% CI, 0.21–0.95)
Autonomic neuropathy: odds ratio 0.32(95% CI, 0.12–0.78)
CONCLUSION
Intensified multifactorial intervention inpatients with type 2 diabetes and microal-buminuria has beneficial effects on long-termcomplications.
UKPDS Mortality
CAUSE-SPECIFIC: Myocardial Infarction-specific Mortality Associated with NIDDM:Turner and colleagues61 evaluated baselinerisk factors for coronary artery disease and

MILANO—DIABETES MELLITUS AND LIFE INSURANCE
69
Table 26. Stratifying All-cause Mortality for Ageat Diagnosis and Glycemic Control
Age atDiabetes
Diagnosis
Average FBG Rangeof Control
mmol/l � mg/dlMortality
(%)
�55 �6.7 (�122) 9.56.7–7.7 122–140 9.57.8–8.7 141–159 12.58.8–9.9 160–180 12.5�10.0 12.5
55–64 �6.7 (�122) 15.46.7–7.7 122–140 23.27.8–8.7 141–159 23.28.8–9.9 160–180 23.2�10.0 48.0
65–69 �6.7 (�122) 16.76.7–7.7 122–140 40.07.8–8.7 141–159 40.08.8–9.9 160–180 41.7�10.0 54.6
70–74 �6.7 (�122) 38.56.7–7.7 122–140 40.07.8–8.7 141–159 45.88.8–9.9 160–180 45.8�10.0 76.5
�75 �6.7 (�122) 46.36.7–7.7 122–140 46.37.8–8.7 141–159 50.08.8–9.9 160–180 76.5�10.0 76.5
Table 27
Risk FactorHazard Ratio
(Risk of Death)
LDL � 4.5 mmol/L 2.0HDL � 1.25 mmol/L �1.0Age years to 65 2.25HbA1c level 6.0% 1.0HbA1c level � 7.0% 1.75
Systolic BP:120 mm Hg 1.0130 mm Hg 1.75150–160 mm Hg 2.0
Never smokers & ex-smokers 1.0Current smokers 1.5
cardiovascular- specific mortality in patientswith type 2 diabetes mellitus.
DESIGN: A stepwise selection procedure,adjusting for age and sex, was used in 2693subjects with complete data to determinewhich risk factors for coronary artery diseaseshould be included in a Cox proportionalhazards model.
SUBJECTS: 3055 white patients (mean age52) with recently diagnosed type 2 diabetesmellitus and without evidence of disease re-lated to atheroma. Median duration of followup was 7.9 years. 335 patients developed cor-onary artery disease within 10 years.
OUTCOME MEASURES: Angina with con-firmatory abnormal electrocardiogram; non-fatal and (cause-specific) fatal myocardial in-farction.
RESULTS
1. Coronary artery disease was significant-ly associated with increased concentrations oflow density lipoprotein cholesterol, decreasedconcentrations of high density lipoproteincholesterol, and increased triglyceride con-centration, haemoglobin A1c, systolic bloodpressure, fasting plasma glucose concentra-tion, and a history of smoking.
2. The estimated hazard ratios for the up-per third relative to the lower third were 2.26(95% confidence interval 1.70 to 3.00) for lowdensity lipoprotein cholesterol, 0.55 (0.41 to0.73) for high density lipoprotein cholesterol,1.52 (1.15 to 2.01) for haemoglobin A1c, and1.82 (1.34 to 2.47) for systolic blood pressure.
3. The estimated hazard ratio for smokerswas 1.41 (1.06 to 1.88).
CONCLUSIONS
1. A quintet of potentially deadly but mod-ifiable risk factors for coronary artery diseaseexists in patients with type 2 diabetes melli-tus.
2. These risk factors are increased concen-trations of low density lipoprotein cholester-ol, decreased concentrations of high densitylipoprotein cholesterol, raised blood pressure,hyperglycaemia, and smoking (see Table 28).

JOURNAL OF INSURANCE MEDICINE
70
Table 28. CAUSE-SPECIFIC MORTALITY:Standardized mortality ratios for 5,071 patients recently diagnosed with non-insulin dependent diabetes
mellitus compared with general population are displayed below
Years sinceRandom-
ization No of patients Observed ExpectedStandardized
mortality ratio P value
Men0 to �5 2982 153 182 0.94 0.785 to �10 2287 161 118 1.36 �0.001�10 588 42 26 1.62 0.002
Women0 to �5 2079 89 72 0.96 0.645 to �10 1581 84 55 1.52 �0.001�10 409 28 12 2.42 �0.0001
CAUSE-SPECIFIC MORTALITYCONCLUSIONS
1. Poorer prognosis with disease durationin both men and women
2. Prognosis is more severe in women com-pared to men with increasing disease dura-tion.
ALL-CAUSE MORTALITY ASSOCIATEDWITH NIDDM
Hanefeld et al62 analyzed the risk factorsfor subsequent CHD and all-cause mortalityduring the 11 year follow-up of the DiabetesIntervention Study (DIS) on, at baseline, 1139subjects, aged 30–55 years at the time of di-abetes detection and classified as diet con-trolled after a 6-week screening phase, wereincluded.
RESULTS
1. Of the patients 112 (15.2%) suffered frommyocardial infarction, 197 (19.82%) of 994had died.
2. The odds ratios for all-cause mortalitycompared to the general population at theage of 36–45 years were: males 5.1; females7.0.
Glycosuria, Ketonuria63,64 andKetoacidosis65
Urine glucose tests cannot provide accurateinformation regarding current blood glucoselevels because glucose profiles, especially inIDDM are highly labile, and the renal thresh-old for glucose excretion is variable66. Reagentstrips to make the measurements more pre-cise have been developed.
Diagnosed and Treated Diabetics
● 0.25 mg/dl urine (dipstick trace to 1�), noadditional rating is usually necessary,
● �0.26 mg/dl urine, obtain and use HbA1cfor accurate risk assessment
● More than trace ketones present in severalspecimens in current 3-months, considerthe presence of superimposed illness, in-adequate insulin intake or pernicious vom-iting as these symptoms may indicate ke-toacidosis.Undiagnosed New Applicants: If urine glucose
levels are � 0.26 mg/dl with cause unknown:use HbA1c for risk accurate assessment.
Brittle Diabetes and RecurrentKetoacidosis (DKA)
‘Brittle diabetes’ is defined as insulin-depen-dent diabetes mellitus associated with gly-cemic instability of any type, leading to life

MILANO—DIABETES MELLITUS AND LIFE INSURANCE
71
disruption with recurrent and/or prolongedhospitalizations.67 DKA is relatively uncom-mon and is not usually the first presentingsign of diabetes. Brittleness is often episodicand perceived causes of brittleness are usu-ally psychosocial.68 Nevertheless, in the studyby Kent et al:69
Mortality rate was 19% (5) of 26 femalesreassessed after a mean of 10.5 (SD 1.4) years.
Causes of death were not certain, but wereprobably ketoacidosis, hypoglycemia and re-nal failure
Of the 21 survivors, only 2 (10%) were stillconsidered to have brittle diabetes,
DM complications were more common &frequent (67%) than a matched stable DMcontrol group (25%),
Pregnancy complications occurred in 13 of28 pregnancies (46%) in severely unstable pa-tients compared with 2 of 27 patients (7%) instable controls,
Pediatric mortality, diabetic ketoacidosis
While the treatment of children with type1 diabetes mellitus has dramatically im-proved since the introduction of insulin in1922, significant acute mortality still remains.In a retrospective review of diabetes70 asso-ciated mortality in younger children and ad-olescents at the Children’s Hospital of Pitts-burgh between the years 1950 and 1985, 55deaths were identified of which 20 occurredduring the initial presentation of diabetes and35 occurred between 2 months and 11 yearsfollowing diagnosis of DM. DKA was asso-ciated with 64% of the total mortality. 85% ofthe early onset and 54% of the late onsetdeaths were ketoacidosis related.
Diabetes ‘‘control’’ versus diabetes‘‘management’’
Malone et al71 noted that the terms ‘‘dia-betic control’’ and ‘‘diabetic management’’are not synonymous. Diabetes control (lessthan 25 grams urine sugar/24 hours) impliesnormal glucose metabolism, typically moni-tored by periodic determinations of plasma
glucose and urine reducing sugar concentra-tions (URS). A group of 220 diabetic childrenattending a camp complied 74% of the timewith the request to collect and test their urinefor URS. Fifty percent of random URS valuesdetermined by the children varied from thoseobtained on the same specimens of urine bylaboratory technicians. Good control wasfound in 18 of 54 children.
Insulin Pumps and Glucose MonitoringSilverstein and Rosenbloom72 have given
an excellent overview in the recent advancesof diabetes management and prevention ofdiabetes including the research and develop-ment of improved methods of glucose moni-toring, and more physiologic ways of insulindelivery. The two most promising methods ofminimally invasive blood glucose monitoringare the Glucowatch, using the technique of re-verse iontophoresis to measure interstitial flu-id glucose levels every 20 minutes and an im-plantable sensor, in which a catheter througha pump is impregnated with glucose oxidaseat the tip. This device monitors blood glucoseevery few minutes, but like a holter monitor,must be downloaded in the physician’s office.
Implantible Subcutaneous SensorsStill under development are (1) implantible
subcutaneous sensors with a high and lowblood glucose alarm and (2) sensors in whichthe patient will be able to download the datausing a home PC. Advances in insulin deliv-ery have included the availability of new in-sulin analogs simulating the increase in en-dogenous insulin release with rapid actinganalogs simulating the increase in insulinproduction that normally occurs aftermeals.73 In addition, use of the insulin pumphas increased markedly since publication ofthe DCCT with the greatest increase beingamong adolescents and pregnant mothers.74
Pancreas and Islet Transplantation forPatients with Diabetes
Research is continuing on curing the dis-ease using islet cell transplantation and pre-

JOURNAL OF INSURANCE MEDICINE
72
venting the disease with agents such as in-sulin (DPT-1 Trial) and nicotinamide (EN-DIT). No data are available concerning long-term mortality and morbidity outcomes.Registry data on patients with type 1 diabetesmellitus indicate that only 8% are free of theneed for insulin therapy at one year. How-ever, in addition to the side effects of life-longimmunosuppression,75,76 the procedure itselfhas significant morbidity and carries a small,but not negligible risk of mortality.
Very recently, Shapiro and his colleagues77
reported that seven of seven transplant recip-ients with type 1 diabetes who received anaverage of approximately 800,000 islets (de-livered to the liver by injection into the portalvein) maintained normal blood glucose con-centrations and glycosylated hemoglobin val-ues without exogenous insulin for an averageof one year. The keys to this impressive out-come include transplanting very high qualityislets as soon as possible after harvest fromcadaveric donors and substantially modifyingthe conventional immunosuppressive regi-men. The modifications involved eliminatingglucocorticoids, using a low dose of tacroli-mus, a conventional dose of sirolimus, andadding daclizumab. Editorializing in thesame issue of the Journal, R. Paul Robertson78
of the Pacific Northwest Research Institute,Seattle, WA 98122 noted that if such remark-able preliminary success continues over thenext few years, it is the supply-and-demandissue that will determine whether islet trans-plantation will become a readily accessibletherapeutic option for patients with diabetes.The American Diabetes Association’s techni-cal review on this subject may be consultedfor further information.79
Underwriting Action
Amidst rapidly emerging and very hopefuladvances in the management, control andprevention of diabetes mellitus, the under-writer must carefully understand the clinicalsetting at its basics to preclude sepsis, myocar-dial infarction, patient non-compliance, ‘‘brittle-ness’’, inadequate insulin treatment, inanition,
pregnancy, complications, co-morbidities, risk fac-tors etc. Type I diabetic patients still have amortality in excess of non-diabetic individu-als not withstanding the fact that the medianlife expectancy for IDDM has increased bymore than 15 years.80 However, there shouldbe no cause for underwriting concern inadults—and at this point adolescents—withearly recognition, prompt and adequate treat-ment, good management & control, and long-term prevention of DKA especially as brittlediabetes has a tendency to stabilize with time.
MACROVASCULAR COMPLICATIONS:CARDIOVASCULAR DISEASE
General: The risk of cardiac disease is in-creased from two to 10-fold in NIDDM. Asindicated in the Joslin Clinic and EquitableLife studies earlier, the relative risk of cardio-vascular disease in diabetic women (com-pared with non-diabetic women) is increasedeven more than for diabetic men. Risk factorsinclude obesity, hypertension, dyslipidemia(low HDLs and high VLDLs with small denseLDLs), hyperglycemia, and, HbA1c (as an in-dependent risk factor).81,82
Myocardial Infarction
MIDAS Study:83 The effect of diabetes mel-litus (DM) on mortality rate was studied in42,595 patients in the statewide MyocardialInfarction Data Acquisition System (MIDAS),which included patients with myocardial in-farction from 90 nonfederal hospitals in NewJersey during the years 1986 and 1987. Ofthese patients, 9,695 (22.8%) had DM. DMwas more prevalent among female, black, andolder patients.
DM was associated with higher mortalityrates, both in-hospital (21.5% vs 19.2%, p �0.001) and during 3-year follow-up (46.7% vs37.8%, p � 0.001). This relation persisted inmen and women, blacks and whites, and allage groups.
DM was an independent predictor of mor-tality by multivariate Cox proportional haz-ards regression analysis after adjustments

MILANO—DIABETES MELLITUS AND LIFE INSURANCE
73
Table 29
(MIDAS)RESULTS: Age-group
Relative Risk forDeath (p � 0.001)
30–49 1.8750–69 1.3670–89 1.17
CONCLUSION: DM and acute MI
3-year mortality 46.7%Annual mortality 15.6%3-year survival 53.3%
Table 30
In Hospital Mortality
Mortality (%)Odds Ratio
(95% CI) p* Value
6-months Post Discharge
Mortality (%)Odds Ratio
(95% CI) p* Value
MENNo diabetes 5.8 1 3.1 1Diabetes
Insulin-dependent 8.7 1.7 (0.8–3.3) NS 2.2 0.7 (0.3–2.4) NSNon-insulin-dependent 10.1 2.0 (1.6–2.6) �0.001 4.4 1.5 (1.0–2.2) �0.05
WOMENNo diabetes 13.9 1 4.3 1Diabetes
Insulin-dependent 24.0 2.2 (1.4–3.5) �0.001 13.7 7.3 (3.1–17.4) �0.001Non-insulin-dependent 15.8 1.2 (0.9–1.6) NS 5.5 1.3 (0.8–2.4) NS
(p values are in comparison with values in non diabetic patients. CI � confidence interval).
were made for gender, race, age, hyperten-sion, left ventricular dysfunction, chronic liv-er disease, & anemia. This effect of DM wasmost pronounced in the younger age groups (seeTable 29).
GISSI-2 Study84
Carried out on a total of 11,667 patientswho were randomized within 6-hours of theonset of acute myocardial infarction symp-toms for thrombolytic treatment with eitherstreptokinase or recombinant tissue-typeplasminogen activator (Actylise).
RESULTS
1. The prevalence of diabetes was higher inwomen than in men,
● 8.75% compared with 1.85%, (p � 0.01); forinsulin-dependent women,
● 23.7% compared with 13.8% (p � 0.01) fornon-insulin-dependent diabetic patients.
2. The type of fibrinolytic agent used didnot affect mortality rates;
3. Six-month and Total Mortality Rates: SeeTable 30.
CONCLUSIONS
Males
The increase in in-hospital mortality of di-abetic patients was moderate and similar formen with insulin- and non-insulin-dependentdiabetes (8.7% and 10.1%, respectively, versus5.8% in non-diabetic patients;
Females
1. Mortality was markedly higher for in-sulin-dependent and only slightly higher fornon-insulin-dependent patients (24.0% and15.8% respectively, vs 13.9% for non-diabeticpatients);
2. Adjusted relative risks were 1.9 (95%confidence interval 1.2 to 2.9) for insulin-de-pendent diabetic women, and, 1.4 (95% con-fidence interval 1.1 to 1.8) for non-insulin-de-pendent diabetic men.
3. Post-discharge mortality rate showed a

JOURNAL OF INSURANCE MEDICINE
74
Table 31
SURVIVAL:CABG Rx; 5-yearSurvival � 80.6%:
PTCA Rx; 5-year survival
� 65.5%
MORTALITY:Age
MortalityRatio
MortalityRatio
45 1,970 4,00055 896 2,00065 231 727
similar gender difference, and in insulin-de-pendent women, prognosis was ominous(even in the absence of left ventricular dam-age before discharge).
Corpus Christi Heart Project:85 The effectof diabetes on survival after myocardial in-farction (MI) was examined in a prospectivepopulation-based study of 1,199 individualshospitalized with MI in a bi-ethnic commu-nity of Mexican-Americans and non-hispanicwhites.
TOTAL NUMBER: diabetics � 523; non-di-abetics � 676.
RESULTS & MORTALITY: Adjusting forage, sex, and ethnicity;
Cumulative total mortality over 44months of follow-up:
1. Diabetics: 37.4% (Ann Mort � 10.1%);Non-diabetics: 23.3% (Ann Mort � 6.3%) (P� 0.001), with similar adverse post-MI mor-tality in both Mexican-Americans and non-Hispanic whites.
2. Kaplan-Meier estimates for 28-day casefatality rates were 10.1% among diabetics,and 5.0% among non-diabetic individuals.
3. Kaplan-Meier estimates for long-term (43months) all-cause mortality starting 1 monthafter the index event were 30.4% among di-abetic cases and 19.3% among non-diabeticcases (P � 0.001).
4. Diabetes remained significantly predic-tive of long-term mortality, RR 1.45, 95% CI1.08–1.94).
Rancho Bernardo Study86 This study re-ports the 14-year sex-specific effect of non-insulin-dependent diabetes mellitus on therisk of fatal ischemic heart disease in a geo-graphically defined population of men andwomen aged 40 through 79 years. There were207 men and 127 women who had diabetesat baseline based on medical history or fast-ing hyperglycemia who were compared with2,137 adults who had fasting euglycemia anda negative personal and family history of di-abetes.
RESULTS & MORTALITY: Relative hazardof ischemic heart disease (IHD) death in di-abetics vs non diabetics after adjusting forage, systolic blood pressure, cholesterol, body
mass index, and cigarette smoking using theCox regression model was: 1.8 in men and 3.3in women (Average RH � 2.5)
CONCLUSION: The sex difference in the in-dependent contribution of diabetes to fatalheart disease was largely explained by thepersistently more favorable survival rate ofwomen (than men) without diabetes.
BARI Investigators—Treatment withPTCA or CABG87,88,89
RESULTS AND CONCLUSIONS
1. Treated type I or type II diabetes melli-tus, (19% of a randomized cohort of 1829 pa-tients),
2. 5-year survival—DM patients: 80.6%CABG group, and 65.5% for PTCA group,
3. 5-year survival—non-DM patients: 89.3%for CABG Group, and 86.3% for PTCA group.
4. PTCA-treated diabetics experienced farworse mortality outcomes; a difference of 15percentage points in 5-year survival wasfound in favor of CABG.
5. Overall Annual Non-diabetic vs DiabeticMortality in Coronary Heart Disease Patients
Non-diabetic Mortality: CABG Group: 2.1%per year for multi-vessel disease
PTCA Group: 2.7% per year for multi-ves-sel disease
Diabetic Mortality: CABG Group: 4.0% peryear for multi-vessel disease
PTCA Group: 7.0% per year for multi-ves-sel disease
6. Age-specific Magnitude of Risk for Dia-betics with CABG-or PTCA-Treated CHD: SeeTable 31.

MILANO—DIABETES MELLITUS AND LIFE INSURANCE
75
Table 32
No Diabetes Diabetes P
All patients –n 1,859 (87%) 268 (13%)Mortality n (%) n (%)
�30 days 56 3.0 18 6.7 �0.0130 days to 2 years 64 3.6 19 7.8 �0.012 years (total) 120 6.5 37 13.9 �0.0001
Table 33
Clinical Factor 2-year Mortality (%) P
Age (years) (�65/�65) 10.9/4.5 �0.0001Sex (M/F) 6.5/11.8 �0.001
HistoryMyocardial infarction (yes/no) 8.4/6.0 �0.05Congestive heart failure (yes/no) 15.5/6.0 �0.0001Hypertension (yes/no) 9.7/6.1 �0.01Renal dysfunction (yes/no) 12.9/5.3 �0.0001Cerebrovascular disease (yes/no) 12.4/7.0 �0.05Intermittent claudication (yes/no) 13.9/6.5 �0.0001Previous CABG (yes/no) 16.4/7.0 �0.0001Three-vessel disease ((yes/no) 8.2/4.8 �0.01Ejection fraction �40 (yes/no) 12.4/6.3 �0.01
Western Sweden Study90
RESULTS
1. In this prospective follow-up study car-ried out on 2,127 patients in western Swedenin whom CABG was undertaken betweenJune 1988 and June 1991 and in whom con-comitant procedures were not performed, di-abetic patients (n � 268) differed from non-diabetic patients (n � 1,859) in that morewomen were included, and the patients hada more frequent history of myocardial infarc-tion (MI), congestive heart failure, intermit-tent claudication, and obesity.
2. Mortality During 2-Years of Follow-up:See Table 32.
3. Factors in Clinical History Associatedwith 2-Year Mortality (univariate analysis):See Table 33.
4. Overall cardiac death rate:Diabetics: 9.9%;Non-diabetics: 4.6%; (P � 0.001)
5. 2-year cumulative survival after CABG:
Diabetics: 86.1%;Non-diabetics: 93.5%.
6. Independent Predictors of Death During2 Years of Follow-up (multivariate anal-ysis): See Table 34.
7. Post CABG Morbidity During 2 Years ofFollow-up: See Table 35.
CONCLUSIONS
1. Even after CABG, diabetic patients withischemic heart disease remain a high-riskgroup with twice the mortality of non-dia-betics both peri-operatively and long term.
2. Diabetes per se confers an increasedlong-term mortality risk after CABG.
No history of myocardial infarction orcongestive heart failure
Haffner study91
Stable 1-vessel CAD, ejection fraction �45%treated medically or with CABG; relative risk� 1.50
Stable 2-vessel CAD disease, ejection frac-tion �45%, treated medically or with CABG;RR � 2.0
3-vessel CAD disease, or ejection fraction�50, relative risk is greater than 2.0
Herlitz (Western Sweden study)
Post CABG annual mortality in diabeticswith otherwise uncomplicated

JOURNAL OF INSURANCE MEDICINE
76
Table 34
Factor Beta Relative Risk P
Cong. heart failure 0.622 � 0.205 1.86 (1.25–2.78) �0.01Renal dysfunction 0.595 � 0.203 1.81 (1.22–2.70) �0.01Age �65 years 0.581 � 0.214 1.79 (1.17–2.72) �0.01Diabetes 0.574 � 0.224 1.78 (1.14–2.76) �0.05Intermittent claud. 0.506 � 0.222 1.66 (1.07–2.56) �0.05
Data are means � SE or relative risk (95% CI).
Table 35
Morbid Factor Diabetics Nondiabetics P
Anterior MI (�30 days) 4.2% 2.1% 0.06Fatal AMI 0.4% 0.5% �0.2Nonfatal AMI 3.7% 1.6% �0.05
Developed Stroke 6.3% 2.5% �0.001Fatal Stroke 1.2% 0.6% �0.2Nonfatal Stroke 5.25 1.9% �0.001
CHD � 3.4%Untreated or treated silent ischemia: It is
well known that patients with diabetes mel-litus may not have chest pain during MI (pos-sibly secondary to autonomic dysfunc-tion).92,93,94
Canto et al.95 analyzing a total of 434,877patients with confirmed MI enrolled June1994 to March 1998 in the largest observa-tional study to date (NRMI-2), indicated thatMI patients without chest pain had a 23.3%in-hospital mortality rate compared with9.3% among patients with chest pain (adjust-ed odds ratio for mortality, 2.21 [95% confi-dence interval, 2.17–2.26]).
Risk factors associated with lack of pain:
● Diabetes-38.5%, prior heart failure-51.0%,prior stroke 47%, Age �75 years-44.9%,non-white-33.7%, women-38.6%, (any com-bination of risk factors-as high as 63.4%).
● Prinzmetal’s (variant) angina96 may be si-lent with the risk for sudden death.
CEREBROVASCULAR DISEASE
Stroke: The World Health Organization defi-nition of stroke is ‘‘rapidly developing clinical
signs of focal or global disturbance of cerebralfunction, with symptoms lasting 24 hours or lon-ger or leading to death, with no apparent causeother than of vascular origin.’’97
This definition excludes transient ischemicattack (TIA), subdural hematoma, and hem-orrhage or infarction caused by infection ortumor. Approximately 90% of strokes areischemic of which about 41% are thromboticand 59% embolic.98
Primary intracerebral hemorrhage (ICH)accounts for the remaining 10% of strokes.99
The prevalence of cerebral infarcts, especiallylacunar infarcts is increased, and the preva-lence of subarachnoid hemorrhage, cerebralhemorrhage, and transient ischemic attacksare decreased in the diabetic patient.100
Diabetes as a risk factor for stroke:101 Be-cause of local cerebral acidosis caused byischemia and hyperglycemia in diabetics,morbidity and mortality are increased. Serumglucose �120 mg/dl (6.7mM) have a highermorbidity and mortality from stroke. Hemi-paresis may last 4-weeks or longer. However,focal neurologic findings, such as seizuresand hemiparesis, that disappear with correc-tion of dehydration and hyperglycemia are

MILANO—DIABETES MELLITUS AND LIFE INSURANCE
77
features of hyperosmolar nonketotic diabeticcoma rather than stroke.
Risk Factors Predicting Incidence & Out-come:102 Age, race, hypertension, level ofphysical activity103, diabetic nephropathy, andcoronary and peripheral vascular disease arerisk factors for stroke in the diabetic patient;whereas obesity, smoking, hyperlipidemia,and glycemic control are questionable.
Increased Mortality from Stroke inDiabetics
The Bell paper comments on a carefullymatched Finnish study (Webster P. The naturalhistory of stroke in diabetic patients. Acta MedScand 1980; 207: 417–424)104 in which the sur-vival of diabetic patients was compared witha group of randomly selected non-diabeticpatients and a group of age- and sex-matchednon-diabetic control subjects with a stroke.
Stroke 5-Year Survival & Mortality: Non-diabetics: 40%; Mortality: 60%: Annual Mor-tality: 12%
Diabetics: 20%; Mortality: 80%: AnnualMortality: 16%
(Expected General Population Survival �80%)
Increased Morbidity from Stroke inDiabetics
5-year recurrence rate: 20% to 40% (50%greater mortality associated with secondCVA)
Morbidity is related to the serum glucosecut-off point of 120 mg/dl (6.6mM):
�120 mg/dl is associated with increasedlikelihood of cerebral edema and �4 weeks(slowed) recovery of hemiparesis.
Transient Ischemic Attack (TIA)105
Transient ischemic attack (TIA) is defined as‘‘an episode of focal loss of brain function attrib-uted to ischemia that lasts less than 24 hours, islocalized to a portion of the brain supplied by onevascular system, has no persistent deficit, and isnot attributable to any other cause.’’106
Most TIAs are caused by small throm-
boemboli originating in atheromas in theheart or neck vessels and are quite brief induration; 24% � 5 minutes, 50% � 30 min-utes, 60% � 1 hour.
Risk Factors Predicting Outcome:107 Post-TIA survival is significantly decreased byolder age, smoking, previous stroke, ischemicheart disease, peripheral arterial disease, anddiabetes mellitus.
TIA MORTALITY & SURVIVAL108
United States:109 Annual mortality is 5% to6% following a TIA, mainly due to myocar-dial infarction, (At age 60, this equates to anobserved of 50–60 deaths/1,000 comparedwith a general population expected of 10–12deaths/1,000). (Annual mortality was report-edly as high as 8% in a prior paper by Eastonet al.)110
Asian:111 71 patients with TIA were fol-lowed for 22 years. Most of the 34 deathswere due to stroke; cerebral hemorrhage-15deaths, cerebral infarction-6 deaths, myocar-dial infarction-1death.
Age-gender groups: (Mayo Clinic, RochesterMinnesota, second age-and sex-matchedcommunity-based study):112 Young women:best overall survival; older women: worstoverall survival;
Males: relative risk highest at age 50 withsubsequent decline.
Risk of Stroke:113 Overall post-TIA risk ofstroke:● First month: 5%; First year: 12%; Five year:
30%; Annual after first year: 7%● Risk of stroke is about seven times higher
than in an age-matched general population● Higher risk with extensive neurologic
(hemispheric) TIAs,● Higher risk with recent or increasingly fre-
quent TIAs,● Risk by age; older age, risk increases by
45% for each 10 year increment of age● TIAs associated with high grade carotid
stenosis114
Amaurosis fugax: (retinal TIAs); the inci-dence of stroke is much higher than in thegeneral population115 but prognosis is more

JOURNAL OF INSURANCE MEDICINE
78
Table 36. Five-year Incidence, Type of Stroke & Risk Factors
60–99% Stenosis Group Percent Risk factors
Territory of large artery; 9.9% silent brain infarct, diabetes, higher degree stenosis,Lacunar stroke; 6.0% �age 75, hypertension, diabetes, higher degree stenosisCardio-embolic stroke; 2.1% history of myocardial infarction, angina, hypertension
Table 37. Five-year Risk of Mortality
Any cause Stroke MI Vascular non-Vascular
Asymptomatic stenosis (�60%): 17.5% 1.9% 3.4% 6.2% 7.1%Symptomatic stenosis (60%-99): 21.0% 1.0% 2.0% 10.7% 8.8%
favorable compared to those with hemispher-ic brain TIAs.116
CAROTID ARTERY SURGERY117,118,119
GENERAL
The North American Symptomatic CarotidEndarterectomy Trial Collaborators (NAS-CETC) studied 1820 patients with unilateralsymptomatic carotid-artery stenosis andasymptomatic contralateral stenosis from1988 to 1997.
RESULTS
The risk of stroke at five years after studyentry increased with the severity of the ste-nosis:Stenosis: �60% luminal diameter among1604 patients: risk of first stroke � 8.0% (1.6%annually),
Stenosis: 60–99% of luminal diameter in216 patients: risk of first stroke � 16.2% (3.2%annually)
80% of 1st strokes were not heralded bytransient ischemia (see Table 36).
Annualized Risk of Stroke
In area of asymptomatic occluded artery;1.9% (relatively low risk),
perioperative (30-day) risk of stroke anddeath in asymptomatic patients; 5%-12.3%(see Table 37).
Annual (Multi-study) Mortality Rates120,121
● 3.4%-4.9% with significant early & latemorbidity & mortality among diabetic pa-tients,
● Leading cause of death is ischemic heartdisease
● Improved survival after carotid endarterec-tomy in TIA or CVA patients with at least70% stenosis, (however, beneficial effectlasted only 3-years)
Ocular Ischemic Syndrome (OIS): The OISis defined as ocular symptoms and sign attribut-able to severe carotid artery obstruction.122 De-creased vision and pain are symptoms of theOIS, while signs in the anterior segment in-clude rubeosis iridis and uveitis. Posteriorsegment signs include narrowed retinal ar-teries, dilated but non-tortuous retinal veins,dot and blot retinal hemorrhages, optic discand retinal neovascularization, and cotton-wool spots. Carotid angiography usually dis-closes at least a 90% atherosclerotic obstruc-tion within the ipsilateral arterial system (seeTable 38).
Mortality● 5-Year mortality rate � 40%: Annual mor-
tality � 8% (similar to TIA)● Causes of death: Cardiac 63%, Stroke 19%,
Other impairments 18%.Conclusion OIS is clinical manifestation of
advanced, diffuse and severe arteriosclerosis

MILANO—DIABETES MELLITUS AND LIFE INSURANCE
79
Table 38
Associated systemicdiseases Percent (%)
Hypertension 73Diabetes mellitus 56Ischemic heart disease 48Cerebrovascular accident 27Peripheral vascular disease 19
Table 39. Mortality, Morbidity & Survival Results(Source for Tayside (control) group for 70 year old
people—Registrar General for Scotland 1987)
Causes of AmputationPVD non-diabetic 61PVD with diabetes melli-tus 32Tumor 4Other 3
Causes of Death Tayside% DLFC%
Myocardial infarction 25.2 42Other heart disease 2.9 9Carcinomatosis 23.5 14Cerebrovascular
accident 12.3 6Pulmonary disease 10.2 5Bronchopneumonia 5.4 13PVD 0.5 5Septicemia 0.2 3Renal failure 1.0 1Hypoglycemia 0.9 1Total 79.5 1 operative
death(4111 cases) (100 cases)
Table 40
Comparative Median SurvivalTimes: Tayside DLFC
Median survival overall: �10 years 3 yrs. 9 months.PVD
● 61 cases non diabetic 3 yrs. 10 months.● 32 cases diabetes mellitus) 3 yrs. 5 months.
Myocardial infarction: 2 yrs. 11 months.(25 of 61 patients (41%) with PVD)(15 of 32 patients (46.9%) with DM)
Bronchopneumonia: 5 yrs. 11 months.Above-knee amputation: 1 yr. 11 months.Below-knee amputation: 4 yrs. 0 months.
affecting other target organs such as theheart, brain, and kidneys.
PERIPHERAL VASCULAR DISEASE(PVD)
In the general population, peripheral ath-erosclerosis is a strong predictor of cardio-vascular disease and death. Peripheral vas-cular disease (PVD) may be defined as claudi-cation, any loss of a lower limb pulse, peripheralvascular surgery, dysvascular lower extremity am-putation, or abdominal aortic aneurysm.
Cause of Death of Lower Limb Amputees
The Dundee Limb Fitting Center(DLFC)123 reviewed 100 sequential deaths oflower limb amputees admitted for prostheticmanagement to determine cause of death andsurvival times over a 25-year period, and,compare this with the recorded causes ofdeath and survival times for the Tayside pop-
ulation for the year of study; Average age ofamputation—70 years (see Table 39 and 40).
CONCLUSION: 25-year median survival oflower limb amputees:
● No diabetes and PVD: 3 yrs. 10 months;● Diabetes and PVD: 3 yrs. 5 months;● Peer group survival (no PVD): �10 yrs.

JOURNAL OF INSURANCE MEDICINE
80
Table 41. MEDIAN SURVIVAL for the whole 25-Year Study (p � 0.006)
1. All vascular cases (1464 overall) 4 yr 0 month2. Above-knee 3 yr 6 month
Below-knee 4 yr 2 monthVascular (non-diabetic � 1,019) 4 yr 2 monthDiabetic Cases (445) 3 yr 8 month
3. 70-year-old Control Group (1988)Male 10.34 yrFemale 13.40 yr
Lower limb amputee survival (DLFC),Dundee Limb Fitting Center (DLFC):124
PURPOSE
● A total of 1710 primary lower limb am-putees were studied over a 25-year periodat the DLFC from 1965–1989 and their sur-vival time calculated.
● Vascular related amputees (1464 overall)had an overall median survival of 4 years.
RESULTS
Source for Tayside (control) group for 70-year-old people—Registrar General for Scot-land 1988: See Table 41.
CONCLUSION
Associated diabetic cases have significantlyshorter survival than the pure PVD associat-ed amputee, 3 yr 8 month as compared with4 yr 2 month (p � 0.006).
PVD Survival, Mortality & Morbidity withRehabilitation after amputation forvascular disease125
PURPOSES AND METHODS: Compare 5-year survival, mortality & continuing mor-bidity in PVD amputees fitted with prosthe-sis, with and without diabetes mellitus.
DESIGN: From August 1979 to August1987, 128 consecutive patients—median age62 years—with lower limb amputation due toperipheral vascular disease (PVD), who werefitted with prosthesis and provided intensive
rehabilitation to restore bipedal gait, wereevaluated:
99 male (77.3%), 29 female (22.7%), 67 di-abetic (52.3%)
RESULTS: (Kaplan-Meyer product-limitestimates): Five-year Survival for 128 Patientswith Lower Limb Amputation Caused byPVD: See Table 42.
CONCLUSIONS: 5-Year Survival, Mortality& Morbidity
Post amputation five-year survival
Diabetics; 42.4% (Average Annual Mortal-ity-11.5%)
Non-diabetics; 85.5% (p � 0.0002) (AverageAnnual Mortality-2.9%)
Late mortality risk: six times greater in di-abetics than non-diabetics.
Five year opposite limb preservation: Dia-betics-69.5%, Non-diabetics-90.2% (p �0.0013).
COMMENT: CLEVELAND CLINIC RE-PORTED COMPARATIVE SURVIVAL RATESFOR PVD:126
5-years: 75%, 10-years: 40%, 15-years: 26%Average mortality: 5% to 10% per yearAverage loss of life expectancy: 10-years
Results of Peripheral Vascular Bypass inJuvenile-onset Diabetes Mellitus127
PURPOSES: This study was performed toevaluate the results of peripheral vascularreconstruction for arterial occlusive diseasein patients with juvenile-onset diabetesmellitus. The results of 67 bypassprocedures performed on 60 patients withjuvenile-onset diabetes mellitus (JODM)between Jan. 1, 1984 and Dec. 31, 1989,were reviewed (see Table 43).
RESULTS: Outcomes & Survival (24-months follow-up)
1. Actuarial patency (primary vein graftgroup) 66.0% � 10.7
2. Limb salvage rates 83.4% � 8.03. Cumulative 2 year survival, entire group
84.1%

MILANO—DIABETES MELLITUS AND LIFE INSURANCE
81
Table 42. Mean Survival Time
Variable Categories # Patients (months) % 5-yr Survival
Sex male 99 (77.3%) 93.5 � 12.6 61.3female 29 (22.7%) 95.4 � 22.1 67.3
Associated diabetes 67 (52.4%) 55.6 � 5.5 42.4Disease other 61 (47.6%) 86.4 � 4.5 85.5
Table 43. Demographic Characteristics of Patientswith JODM
Total Patients 60Men 31Women 29
Mean age (range) 44.4 yrs (29–59)Mean age diabetes onset 9.8 yrs (1–19)Mean duration of diabetes (range) 34.6 yrs (20–52)
Preoperative risk factorsIDDM 60 (100%)Hypertension 27 (45%)Neuropathy 60 (100%)Retinopathy 55 (92%)Renal Failure 27 (45%)Dialysis 21 (35%)Previous Kidney Transplant 14 (23%)
SmokingCurrent 29Previous 13Never 15Unknown 6
CONCLUSIONS
1. Small vessel disease does not appear toplay a significant role in the diabetic lowerextremity. This subgroup has a very high in-cidence of ocular and renal microangiopathy,and renal failure (45%). However, graft paten-cy and limb salvage rates were acceptablewhen compared with other peripheral vas-cular bypass series for ischemia in AODMand non-diabetic populations suggesting thatocclusive disease in the large vessels is theprincipal cause for ischemia-related limb lossin these patients.
2. The 2-year cumulative survival rate of84% is low in this young group of patients.However, considering the substandard life ex-pectancies by age at diagnosis (0–19) in gen-
eral cases reported in the Lincoln NationalReinsurance Study, a mortality ratio of 524%indicates that median survival is decreasedby nearly 25 years when compared with thegeneral population.
Relationship of Severity of Lower LimbPVD to Mortality and Morbidity
The paper by Howell et al128 describes a 6-year review of 247 consecutive patients un-dergoing lower extremity noninvasive vascu-lar assessment to investigate the relationshipof risk of death, myocardial infarction, stroke,and limb loss to the severity of peripheralvascular disease.
There were 130 men and 117 women witha mean age of 65 � 15 years. Patients werecategorized into four groups according totheir ankle-brachial pressure indexes (ABI)at their first visit as follows: (decreasing ABIindicates an increase in PVD severity) See Ta-ble 44.
Developmental Course & Mortality ofPVD in Non-insulin Dependent Diabetics
The report by Kreines et al129 analyzed thecourse of peripheral vascular disease (PVD)in 619 patients with type 2 diabetes recruitedwithin 1-year of diagnosis and followed quar-terly for up to 14 years (see Table 45).
Relationship between CALC and mortality
40.3% of 144 women who developed CALCdied versus 21% of 300 without CALC, a re-lationship not seen among the men, (RR �1.9)

JOURNAL OF INSURANCE MEDICINE
82
Table 44
Ankle-Brachial Index PatientsTotal Diabetes
n (%) Mean Age (yr)
Group I normal (�0.92) 97 14 (14) 59.6 � 16.1Group II mild disease (0.50 to 0.91) 86 16 (19) 67.3 � 13.4
Group IIImoderate disease (0.31 to0.49) 39 17 (44) 71.1 � 10.3
Group IV ischemic disease (�0.30) 25 4 (16) 73.4 � 12.1247 51 (21)
RESULTS: Distribution of End Events at 6-year Follow-up
End Events I II III IV Total
n 97 86 39 25 247Death n (%) 19 (20) 22 (26) 12 (31) 16 (64) 69 (28)(Annual mortality) (3.3) (4.3) (5.2) (10.7) (4.7)MI n (%) 8 (8) 15 (17) 8 (21) 5 (20) 36 (15)Stroke n (%) 5 (5) 9 (10) 3 (8) 3 (12) 20 (8)Amputation n (%) 1 (1) 6 (7) 5 (13) 8 (32) 20 (8)Vascular Surgery n (%) 4 (4) 26 (30) 10 (26) 7 (28) 47 (19)
Table 45. 13-year duration actuarially determinedcumulative risks
Males Females
Intermittent claudication (IC), 37.9% 24.3%,Non palpable dorsal pedal
pulse (NPUL), 34.5% 37.6%,Arterial calcification (CALC), 60.9% 32.2%
Relationship between NPUL and mortalityin both sexes
Men: 50% of 68 men with NPUL died ver-sus 27.6% of the 96 without NPUL (P �0.0053), (RR � 1.8). In men, the only signifi-cant risk factors were diminished vibrationperception that was related to NPUL (P �0.05), and the serum tryglyceride that was re-lated to IC (P � 0.05).
Women: 36.4% of 173 women with NPULdied versus 21.4% of the 280 without NPUL(P � 0.0007), (RR � 1.7).
MICROVASCULAR DISEASE
Nephropathy
Nephropathy is the diabetic complicationassociated with the highest mortality.130,131
The kidney, as a window on the vasculatureis an elegant and excellent surrogate markerfor cardiovascular disease. Even mild anom-alies are easy to detect.
Risk factors for nephropathy & measuresto prevent progression to overt ESRD132
● Elevated blood pressure: maintain mid-normal range blood pressure of 125/75preferably with use of ACE inhibitors orpossibly angiotensin II—receptor blockers;
● Albuminuria or proteinuria: reduce level to�1 g per day;
● Poor glycemic control (high level of insulinresistance): maintain HgbA1c �7.0%;
● Smoking● High dietary intake of protein? Restrict di-
etary protein intake to �0.8 grams/kilobody weight/day
● HyperlipidemiaPathogenesis: It begins incipiently with
low levels of albumin excretion (microalbu-minuria) as early as five years after IDDMonset and progresses to macroalbuminuriawith accompanying hypertension after IDDMof 12 to 20 years duration. Finally, the ne-phrotic syndrome and the decrease in glo-

MILANO—DIABETES MELLITUS AND LIFE INSURANCE
83
Table 46. Comparative mortality by age & primarycause of ESRD, durations 0–5 years combined
Age group
5-yearAnnualSurvival
MortalityRatio (%)
Excess DeathRate/1000
42,107 Patients with ESRD due to diabeticnephropathy
15–24 0.345 16,000 19125–34 0.297 11,400 21435–44 0.253 9,200 23745–54 0.234 7,100 24555–64 0.185 1,820 27065–74 0.115 1,130 32075–84 0.074 515 32785 up 0.171(2y) 385 434All Ages 0.186 1,640 269
112,540 Patients with ESRD due to other causes15–24 0.788 3,900 4625–34 0.675 4,000 7435–44 0.634 3,300 8445–54 0.608 1,400 8755–64 0.368 1,150 16565–74 0.218 850 23275–84 0.105 460 28485 up 0.051 265 279All Ages 0.361 780 160
Table 47. Comparative mortality by duration, all agescombined (primary cause diabetes or all others)
ESRD due to diabetic nephropathy
Interval yearsMortalityRatio (%)
Excess DeathRate/1000
0–1 1,070 2491–2 1,190 2652–3 1,210 2323–4 1,400 2724–5 (1,580) 2670–4 1,210 254
ESRD due to all other causes0–1 1,160 1851–2 1,140 1562–3 1,240 1713–4 1,410 1844–5 (1,140) 1370–4 1,190 177
merular filtration rate (GFR) progress to end-stage renal disease (ESRD).133,134,135,136
The 1995 mortality results of Singer andBalakrishna:137 (Mortality Abstract 637M1)analysis of mortality by age and disease du-ration in medicare patients with diabetes mel-litus on dialysis for end-stage renal disease(ESRD) from 1982 to 1987 is a dreadful &morbid revelation summarized in Table 46and 47.
Conclusion: The diabetic nephropathy grouphas the highest mortality of all the primarycause groups of ESRD patients.
Prediction of Creatinine Clearance (CC)from Serum Creatinine: In the insurance en-vironment, it is useful to be able to quicklypredict creatinine clearance when a 24-hoururine volume cannot be collected.
Cockcroft and Gault138 developed the follow-ing formula in 1975 to roughly predict cre-atinine clearance in adult males expressed asfollows:
Creatinine Clearance� (140 � age)(wt kg) � 72
� Serum Creatinine (mg/100 ml)(15% less in females)
● They demonstrated an almost linear de-crease of about 50% (23.6 to 12.1 mg/kg)over the 3rd to 9th decades (presumably re-lated to a decrease in muscle mass with ag-ing)
● A correction to lean or ideal body weightis advised when abnormalities are pro-nounced.
● A limitation is that CC can be greatly overestimated in the early phase of acute renalfailurebefore the serum creatinine has risenappreciablyLevy et al139 in 1999 reported a new formula
to more accurately predict renal function.Glomerular filtration rate (GFR) rather thancreatinine clearance may provide a more ac-curate estimate of renal function, according tothe Modification of Diet in Renal Disease(MDRD) Study expressed as follows:
�0.999 –0.176GFR � 170 � [Scr] � [Age]� [0.762 if female]� [1.180 if patient is black]
–0.170 –0.318� [BUN] � [Albumin]
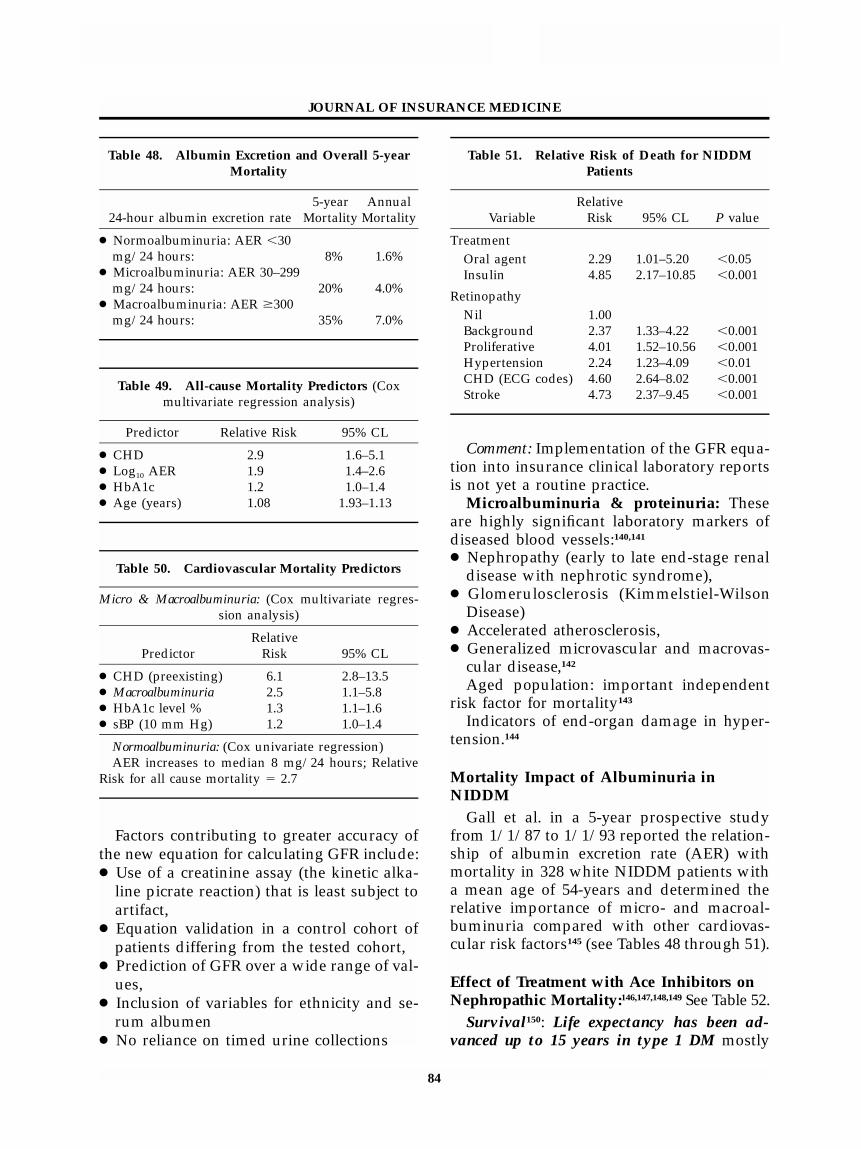
JOURNAL OF INSURANCE MEDICINE
84
Table 48. Albumin Excretion and Overall 5-yearMortality
24-hour albumin excretion rate5-year
MortalityAnnual
Mortality
● Normoalbuminuria: AER �30mg/24 hours: 8% 1.6%
● Microalbuminuria: AER 30–299mg/24 hours: 20% 4.0%
● Macroalbuminuria: AER �300mg/24 hours: 35% 7.0%
Table 49. All-cause Mortality Predictors (Coxmultivariate regression analysis)
Predictor Relative Risk 95% CL
● CHD 2.9 1.6–5.1● Log10 AER 1.9 1.4–2.6● HbA1c 1.2 1.0–1.4● Age (years) 1.08 1.93–1.13
Table 50. Cardiovascular Mortality Predictors
Micro & Macroalbuminuria: (Cox multivariate regres-sion analysis)
PredictorRelative
Risk 95% CL
● CHD (preexisting) 6.1 2.8–13.5● Macroalbuminuria 2.5 1.1–5.8● HbA1c level % 1.3 1.1–1.6● sBP (10 mm Hg) 1.2 1.0–1.4
Normoalbuminuria: (Cox univariate regression)AER increases to median 8 mg/24 hours; Relative
Risk for all cause mortality � 2.7
Table 51. Relative Risk of Death for NIDDMPatients
VariableRelative
Risk 95% CL P value
TreatmentOral agent 2.29 1.01–5.20 �0.05Insulin 4.85 2.17–10.85 �0.001
RetinopathyNil 1.00Background 2.37 1.33–4.22 �0.001Proliferative 4.01 1.52–10.56 �0.001Hypertension 2.24 1.23–4.09 �0.01CHD (ECG codes) 4.60 2.64–8.02 �0.001Stroke 4.73 2.37–9.45 �0.001
Factors contributing to greater accuracy ofthe new equation for calculating GFR include:● Use of a creatinine assay (the kinetic alka-
line picrate reaction) that is least subject toartifact,
● Equation validation in a control cohort ofpatients differing from the tested cohort,
● Prediction of GFR over a wide range of val-ues,
● Inclusion of variables for ethnicity and se-rum albumen
● No reliance on timed urine collections
Comment: Implementation of the GFR equa-tion into insurance clinical laboratory reportsis not yet a routine practice.
Microalbuminuria & proteinuria: Theseare highly significant laboratory markers ofdiseased blood vessels:140,141
● Nephropathy (early to late end-stage renaldisease with nephrotic syndrome),
● Glomerulosclerosis (Kimmelstiel-WilsonDisease)
● Accelerated atherosclerosis,● Generalized microvascular and macrovas-
cular disease,142
Aged population: important independentrisk factor for mortality143
Indicators of end-organ damage in hyper-tension.144
Mortality Impact of Albuminuria inNIDDM
Gall et al. in a 5-year prospective studyfrom 1/1/87 to 1/1/93 reported the relation-ship of albumin excretion rate (AER) withmortality in 328 white NIDDM patients witha mean age of 54-years and determined therelative importance of micro- and macroal-buminuria compared with other cardiovas-cular risk factors145 (see Tables 48 through 51).
Effect of Treatment with Ace Inhibitors onNephropathic Mortality:146,147,148,149 See Table 52.
Survival150: Life expectancy has been ad-vanced up to 15 years in type 1 DM mostly

MILANO—DIABETES MELLITUS AND LIFE INSURANCE
85
Table 52. Mortality Implications of the HOPE Study and MICRO-HOPE Sub-study148,149
Outcome Relative Risk (95% CL) P value
MI, stroke, or death from cardiovasc. causes 0.78 (0.70–0.86) �0.001Death from cardiovascular causes 0.74 (0.64–0.87) �0.001Myocardial infarction 0.80 (0.70–0.90) �0.001Stroke 0.68 (0.56–0.84) �0.001Death from non-cardiovascular causes 1.03 (0.85–1.26) 0.74Death from any cause 0.84 (0.75–0.95) 0.005
Mortality, Morbidity, Survival-Outcomes: Ramipril Relative Risk Reduction:Mortality
Composite outcomes 25% (12–36) 0.004Myocardial infarction 22% (6–36)Stroke 33% (10–50)Cardiovascular death 37% (21–51)Total mortality 24% (8–37)Revascularization 17% (2–30)Overt nephropathy 24% (3–40) 0.027
Table 53. Reduction of Relative Risk ofNeuropathy—Results of DCCT: NEJM 1993
Cohort
IntensiveTreat-ment
Conven-tionalTreat-ment
% RiskReduc-
tion
Development prevented 3.1 9.8 69Progression prevented 7.0 16.1 57
attributable to improved treatment of diabeticnephropathy by blocking the renin-angioten-sion system & stabilizing micro-angiopathicproliferation.
Outpatient Random Urine Sampling toPredict Persistent Microalbuminuria151
Sensitivity: 91%Specificity: 83.2%Positive Predictive Value: 76.3%
Microalbumin/Creatinine Ratio (P/C):24-hour urine collection152
1. Defined as the number of grams of pro-tein per gram of creatinine excreted in 24hours.
2. Normal value should not exceed 0.2grams,
3. Slightly higher values to .42 grams (up-per limit of normal) in insurance urine sam-ples may reflect a delay in analysis with cre-atinine degeneration,
4. Should not be used for risk assessmentin isolation from other data as a number offactors can affect numerator & denominatori.e., state of hydration, physical activity, etc.
Neuropathy
Neuropathy, characterized as peripheral(mono & polyneuropathy) or autonomic (car-diovascular, gastrointestinal & genitourinary)has a variety of differing forms, manifesta-tions and associated mortality and morbidityin diabetes.153,154,155 Common clinical expres-sions include mild peripheral sensorimotorparesthesias of the feet or toes. With time, se-verity progresses to hypoesthesia and insen-sate feet become vulnerable to trauma, infec-tion, foot ulcers and amputation. DCCT re-sults below indicated a major beneficial im-pact with greatly enhanced risk reduction forthe development and progression of neurop-athy with intensive Rx: See Table 53.
Autonomic neuropathy may affect the car-diovascular, gastrointestinal and genitouri-

JOURNAL OF INSURANCE MEDICINE
86
nary systems with catastrophic clinical syn-dromes including gastroparesis with perni-cious nausea & vomiting, and diabetic diar-rhea alternating with constipation.Genitourinary neuropathy causes impotence,and bladder hypotonia or atonia resulting inoverflow incontinence.156,157
Cardiovascular neuropathy red flags includeresting tachycardia, postural hypotension,systolic & diastolic decreased blood pressure,sympathetic and parasympathetic failure re-sulting in decreased glomerulo filtration rate,lack of respiratory variation in heart rate andmost ominously, painless myocardial infarc-tion & silent ischemia.158,159
10-year mortality rate for autonomic neu-ropathy summarized by Watkins160 as fol-lows:
Symptomatic diabetics: 27% 10-year mor-tality: Asymptomatic diabetics: 10% 10-yearmortality
Hazard ratio: 2.7
Retinopathy161,162
General: Diabetes mellitus is a leadingcause of blindness in the United States.162 Inthe pre-DCCT era, retinopathy occurred in al-most all IDDM and most NIDDM patientswith long duration diabetes.
Non-proliferative retinopathy—also calledbackground retinopathy—is generally benignunless it occurs near the macula, and consistsof microaneurysms & hard exudates. It is nota marker for excess mortality. As retinopathyprogresses, terminal capillaries become ob-structed causing retinal ischemia.
Infarctions of the nerve layer appear as soft(cotton-wool) exudates with new vessel pro-liferation proliferative retinopathy in response toangiogenic growth factors released by theischemic retina. It is a marker for renal and vas-cular disease.164 Symptomatic or asymptomaticvascular disease may be present, along withnephropathy, proteinuria, vitreous hemor-rhage, retinal edema and blindness.
Retinopathy versus mortality164: Klein andassociates165 investigated the association ofocular disease with all-cause mortality and
cause-specific mortality in a geographicallydefined population-based cohort study in an11-county area in Wisconsin.
STUDY POPULATION
● Participants were all younger-onset diabet-ic persons (diagnosed as having diabetes at�30 years of age and taking insulin) and arandom sample of older-onset diabetic per-sons (diagnosed as having diabetes at �30years of age).
● Diabetic retinopathy, macular edema, vi-sual acuity, and cataract were measured us-ing standardized protocols at baseline ex-aminations from 1980 to 1982, in which 996younger-onset and 1370 older-onset per-sons participated.
● Participants were followed up for 16 years.
MAIN OUTCOME MEASURE: All-cause andcause-specific mortality as determinedfrom death certificates.
RESULTS
In the younger-onset group, after control-ling for age and sex, retinopathy severity,macular edema, cataract, history of cataractsurgery, and history of glaucoma at baseline,were associated with all-cause and ischemicheart disease mortality.
In the older-onset group
1. After controlling for age and sex, reti-nopathy and visual impairment were relatedto all-cause, ischemic heart disease, andstroke mortality. No ocular variable understudy was related to cancer mortality.
2. Retinopathy severity was related to all-cause and stroke mortality, and visual im-pairment was related to all-cause, ischemicheart disease, and stroke mortality.
In the younger-onset group, after controllingfor systemic risk factors, visual impairmentwas associated with all-cause and ischemicheart disease mortality.

MILANO—DIABETES MELLITUS AND LIFE INSURANCE
87
CONCLUSIONS
1. Presence of more severe retinopathy orvisual impairment in diabetic patients is arisk indicator for increased risk of ischemicheart disease death. Presence of these ocularconditions may identify individuals whoshould be under care for cardiovascular dis-ease.
2. In the post DCCT era, The Diabetes Con-trol and Complications Trial/Epidemiologyof Diabetes Interventions and ComplicationsResearch Group was organized to assesswhether the benefits of intensive therapy toreduce the risk of occurrence and severity ofmicrovascular complications (retinopathy &nephropathy) persists for four years after theend of the Diabetes Control and Complica-tions Trial.166
3. The reduction of the risk of progressiveretinopathy and nephropathy resulting fromintensive therapy persisted during the fouryears of follow-up in the EDIC study despiteincreasing hyperglycemia.
4. Those who will benefit most from eyescreening are patients with poor glycemiccontrol.167
MORTALITY IMPACT OF C0-EXISTINGRISK FACTORS
Hypertension
Recent guidelines have emphasized thatthe target blood pressure levels for patientswith diabetes should be lower than in otherhypertensive groups.168,169 A decrease in car-diovascular events is especially important topatients with diabetes, who have at least a 2-fold increase in cardiovascular mortality thatis further increased by concomitant hyperten-sion.170 Hypertension is associated with boththe progression of renal and cardiovasculardisease and its control is linked to a de-creased rate in their concomitant excess mor-tality and morbidity in IDDM & NIDDM pa-tients.171,172
The Heart Outcomes Prevention Evalua-tion (HOPE) Study173 cited elsewhere, pro-vides compelling evidence for the role of ACE
inhibition in patients with diabetes. Ramipriltreatment was associated with a:
25% reduction in a composite endpoint ofcardiovascular death, MI, and stroke;
24% decrease in total mortality, beneficialeffects were observed with a reduction in sys-tolic blood pressure of only 2.4 mm Hg anddiastolic of 1 mm Hg after 4 years.
The 1990 WHO Multinational Study byMorrish174 of co-existing risk factors and theircontribution to mortality in diabetic patientsindicated the following:
STUDY DESIGN
● 497 diabetics ages 35–54; 254 males, 243 fe-males,
● Stratified by age, gender, diabetes type(equal numbers IDDM & NIDDM), dura-tion,
● Follow-up period 1975–1987.● Overall mortality � 92 deaths (see Table
54).
CONCLUSION
Hypertension and proteinuria have themost consistent associations with mortality inthe different analyses with the effect of hy-pertension appearing stronger in IDDM andproteinuria in NIDDM.
The 1996 WHO Multinational Study re-ported by Wang and colleagues in 1996175 wasmore complete & statistically powerful, de-termined the extent that mortality in IDDMand NIDDM patients is in excess of that inthe general population and examined its re-lation to hypertension and proteinuria in di-abetic patients.
STUDY DESIGN: Stratified random sampleof 4,714 diabetics (2310 men, 2404 women)ages 35–55 clinically followed from 1975 to1987.● Excess mortality, compared with the back-
ground population, was assessed in termsof standardized mortality ratios (SMRs) foreach of the 10 international cohorts
● The relationship between excess mortality& proteinuria/hypertension was examinedby DM type & sex.

JOURNAL OF INSURANCE MEDICINE
88
Table 54. Results for IDDM
Risk Factors
Variable
Relative Risk forAll-Cause Mortality
(Univariate Cox Regression)
Males(n � 117)
Females(n � 123)
Systolic BP 1.5 1.4Diastolic BP 1.4 1.0Serum cholesterol 1.0 0.9Plasma creatinine 1.5 1.2Body mass index 0.9 0.9Duration 1.3 1.1Proteinuria 2.1 2.9ECG abnormal 0.5 3.2Hypertension 4.3 7.2Smoking 1.0 1.1
Results for NIDDM
Males(n � 132)
Females(n � 114)
Systolic BP 1.2 1.0Diastolic BP 1.2 0.8Serum cholesterol 1.0 1.5Plasma creatinine 0.5 1.6Body mass index 1.3 1.1Duration 1.1 1.2Proteinuria 2.5 5.0ECG abnormal 1.9 0.8Hypertension 2.0 1.5Smoking 1.7 1.3
Table 55. Demographics
Total # Male # Female #
Diabetics: 4,714 2,310 2,404IDDM: 1,266 663 603NIDDM: 3,448 1,647 1,801Deaths 1,088 (23%)IDDM deaths 367 (34%)
Table 56. Mortality Results of 1996 WHO Study
1. All-cause Standardized Mortality Ratios (SMRs) byDM Type and Gender
VariableStandardized Mortality
Ratios
IDDM male 437 (188 to 686)IDDM women 563 (336 to 790)
2. Cardiovascular SMRs by Diabetes Mellitus Typeand Gender
Cause
IDDM
Male Female
NIDDM
Male Female
CHD 504 1155 414 749Stroke 736 747 284 371
3. Relative Risk (SMRs): With Hypertension andProteinuria
IDDM males: 11 IDDM females: 18NIDDM males: 5 NIDDM females: 8
4. Relative Risk (SMRs): Absence of Proteinuria andHypertension
IDDM males: 284 IDDM females: 360NIDDM males: 192 NIDDM females: 236
● Definition of hypertension: systolic BP �160 mmHg; diastolic BP � 95 mmHg
● Definition of proteinuria: light to heavyturbidity (see Tables 55 and 56).
COMMENT
1. SMRs were in general higher in patientswith IDDM (ranging from 188 to 686 for menand from 336 to 790 for women).
2. For both diabetes types and in both sex-es, SMRs decreased with increasing age andincreased with increasing diabetes duration.
3. IDDM patients with both hypertensionand proteinuria experienced a strikingly highmortality risk:11-fold for men with IDDM and 18-fold forwomen with IDDM,
5-fold for men with NDDM and 8-fold forwomen with NIDDM,
4. Even in the absence of proteinuria andhypertension, SMRs were significantly in-creased in both IDDM (284 men & 360 wom-en) and NIDDM (192 men & 236 women) pa-tients.
CONCLUSIONS
1. Considerable international differenceswere found not only in mortality rates for thetwo types of diabetes but also in the extentof excess mortality among centers.
2. IDDM had the highest excess mortality,3. Significant excess mortality was demon-

MILANO—DIABETES MELLITUS AND LIFE INSURANCE
89
strated even in patients without proteinuriaand hypertension for both sexes and for bothtypes of diabetes
Isolated Systolic HypertensionAfter the fact analyses of studies per-
formed more than 10 years ago, such as theSystolic Hypertension in the Elderly Program(SHEP), indicated that antihypertensive ther-apy may reduce the rate of cardiovasculardisease (CHD) events in the diabetes patientsubgroup.176
SHEP Study Participants4736 diabetic males and females age � 60
at baseline with isolated systolic hypertension(ISH), (blood pressure � 160 mm Hg; dia-stolic BP �90 mm Hg at baseline, 583NIDDM and 4149 non-diabetic patients,
RESULTS1. The SHEP antihypertensive drug regi-
men lowered BP of both diabetic and non-diabetic patients;
2. 5-year major CHD rate was 34% lowerfor the treated group compared to placebo,both for diabetics (95% CI, 6%-54%) and non-diabetics (95% CI 21%-45%),
3. Absolute risk reduction with treatmentcompared with placebo was twice as great fordiabetic versus non-diabetic patients (101/1000 vs 51/1000 randomized participants atthe 5-year follow-up), reflecting the higherrisk of diabetic patients.
CONCLUSIONLow-dose diuretic-based (chlorthalidone)
treatment is effective in preventing majorCVD events, cerebral and cardiac, in bothNIDDM and non-diabetic older patients withISH.
The Systolic Hypertension in Europe (Syst-Eur) Trial Investigators177 paralleled SHEPStudy outcomes
1. Active treatment reduced the total rateof stroke from 13.7 to 7.9 endpoints per 1000patient-years (42% reduction; p � 0.003).
2. Non-fatal stroke decreased by 44% (p �0.007).
3. All fatal and non-fatal cardiac endpoints,including sudden death, declined by 26% (p� 0.03) and all fatal and non-fatal cardiovas-cular endpoints by 31% (p � 0.001).
4. Cardiovascular mortality was slightlylower on active treatment (-27%, p � 0.07),but,
5. All cause mortality was not influenced (-14%; p � 0.22)
CONCLUSION
Anti-hypertensive treatment of 1000 pa-tients for 5-years may prevent 29 strokes or53 major cardiovascular endpoints.
Systolic Hypertension in Europe (Syst-EUR) study: Quite recently, Tuomilehto andcolleagues178 indicated that in 492 diabetic pa-tients of 4695 patients (age � 60-years) withsystolic blood pressure of 160 to 219 mm Hgand diastolic pressure below 95 mm Hg, thecalcium channel blocker (CCB), nitrendipine,was associated with a decrease in the rate ofcardiac events as well as cardiovascular mor-tality;
1. Overall mortality: reduced 55%—from45.1 deaths/1000 patients to 26.4 deaths/1000patients
2. Mortality from cardiovascular disease:reduced by 76%,
3. All cardiovascular events combined: re-duced by 69%,
4. Fatal and non-fatal strokes: reduced by73%,
5. All cardiac events combined: reduced by63%.
CONCLUSIONS
1. Nitrendipine-based antihypertensivetherapy is particularly beneficial in older pa-tients with diabetes and isolated systolic hy-pertension;
2. Long-acting calcium channel blockers arenot harmful in diabetic patients.
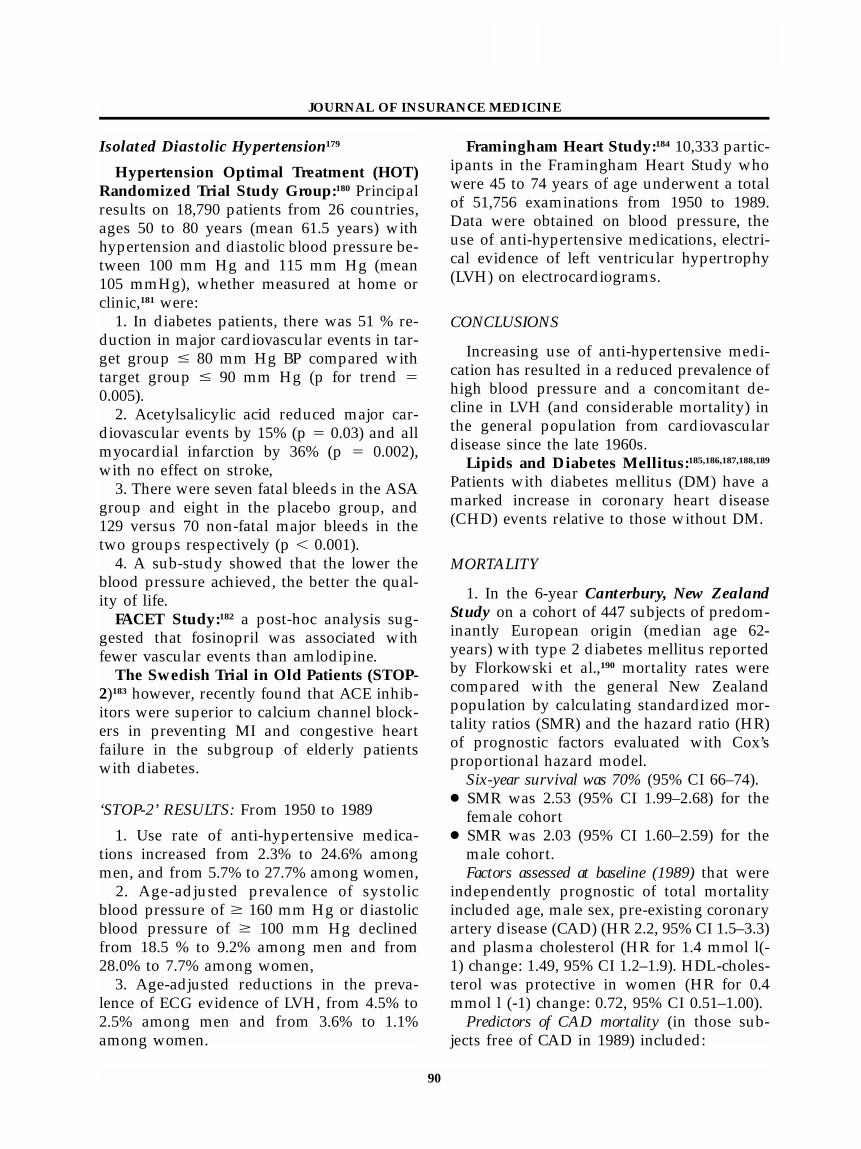
JOURNAL OF INSURANCE MEDICINE
90
Isolated Diastolic Hypertension179
Hypertension Optimal Treatment (HOT)Randomized Trial Study Group:180 Principalresults on 18,790 patients from 26 countries,ages 50 to 80 years (mean 61.5 years) withhypertension and diastolic blood pressure be-tween 100 mm Hg and 115 mm Hg (mean105 mmHg), whether measured at home orclinic,181 were:
1. In diabetes patients, there was 51 % re-duction in major cardiovascular events in tar-get group � 80 mm Hg BP compared withtarget group � 90 mm Hg (p for trend �0.005).
2. Acetylsalicylic acid reduced major car-diovascular events by 15% (p � 0.03) and allmyocardial infarction by 36% (p � 0.002),with no effect on stroke,
3. There were seven fatal bleeds in the ASAgroup and eight in the placebo group, and129 versus 70 non-fatal major bleeds in thetwo groups respectively (p � 0.001).
4. A sub-study showed that the lower theblood pressure achieved, the better the qual-ity of life.
FACET Study:182 a post-hoc analysis sug-gested that fosinopril was associated withfewer vascular events than amlodipine.
The Swedish Trial in Old Patients (STOP-2)183 however, recently found that ACE inhib-itors were superior to calcium channel block-ers in preventing MI and congestive heartfailure in the subgroup of elderly patientswith diabetes.
‘STOP-2’ RESULTS: From 1950 to 1989
1. Use rate of anti-hypertensive medica-tions increased from 2.3% to 24.6% amongmen, and from 5.7% to 27.7% among women,
2. Age-adjusted prevalence of systolicblood pressure of � 160 mm Hg or diastolicblood pressure of � 100 mm Hg declinedfrom 18.5 % to 9.2% among men and from28.0% to 7.7% among women,
3. Age-adjusted reductions in the preva-lence of ECG evidence of LVH, from 4.5% to2.5% among men and from 3.6% to 1.1%among women.
Framingham Heart Study:184 10,333 partic-ipants in the Framingham Heart Study whowere 45 to 74 years of age underwent a totalof 51,756 examinations from 1950 to 1989.Data were obtained on blood pressure, theuse of anti-hypertensive medications, electri-cal evidence of left ventricular hypertrophy(LVH) on electrocardiograms.
CONCLUSIONS
Increasing use of anti-hypertensive medi-cation has resulted in a reduced prevalence ofhigh blood pressure and a concomitant de-cline in LVH (and considerable mortality) inthe general population from cardiovasculardisease since the late 1960s.
Lipids and Diabetes Mellitus:185,186,187,188,189
Patients with diabetes mellitus (DM) have amarked increase in coronary heart disease(CHD) events relative to those without DM.
MORTALITY
1. In the 6-year Canterbury, New ZealandStudy on a cohort of 447 subjects of predom-inantly European origin (median age 62-years) with type 2 diabetes mellitus reportedby Florkowski et al.,190 mortality rates werecompared with the general New Zealandpopulation by calculating standardized mor-tality ratios (SMR) and the hazard ratio (HR)of prognostic factors evaluated with Cox’sproportional hazard model.
Six-year survival was 70% (95% CI 66–74).● SMR was 2.53 (95% CI 1.99–2.68) for the
female cohort● SMR was 2.03 (95% CI 1.60–2.59) for the
male cohort.Factors assessed at baseline (1989) that were
independently prognostic of total mortalityincluded age, male sex, pre-existing coronaryartery disease (CAD) (HR 2.2, 95% CI 1.5–3.3)and plasma cholesterol (HR for 1.4 mmol l(-1) change: 1.49, 95% CI 1.2–1.9). HDL-choles-terol was protective in women (HR for 0.4mmol l (-1) change: 0.72, 95% CI 0.51–1.00).
Predictors of CAD mortality (in those sub-jects free of CAD in 1989) included:

MILANO—DIABETES MELLITUS AND LIFE INSURANCE
91
Table 57
Simvastatin treated diabetics Non-diabetics
Total mortality: 0.57 (95% CI, 0.30–1.08; P � 0.087), 0.71 (95% CI, 0.58–0.87; p � 0.001)Major CHD events (death or MI): 0.45 (95% CI, 0.27–0.74; P � 0.002), 0.68 (95% CI, 0.60–0.77; P � 0.0001)Any atherosclerotic event: 0.63 (95% CI, 0.60–0.77; p � 0.0001), 0.74 (95% CI, 0.68–0.82; p � 0.0001)
Table 58
RiskLDL
cholesterolHDL
cholesterol* Triglyceride
High �130 �35 �400Borderline 100–129 35–45 200–399Low �100 �45 �200
* Data are given in milligrams per deciliter. Forwomen, the HDL cholesterol values should be in-creased by 10%.
● Plasma cholesterol (HR for 1.4 mmol l(-1)change: 1.86 95% CI 1.20–2.89)
● Glycated haemoglobin (HR for 1.8%change: 1.9 95%CI 1.04–3.47),
● Male sex, peripheral vascular disease, andsmoking2. In the Multiple Risk Factor Intervention
Trial (MRFIT) Reported by Stamler and col-leagues191,● Relative risk for CVD mortality for diabetic
compared with non-diabetic men rangedfrom 2.83 to 4.46 at varying levels of serumcholesterol. Of interest, unlike absolute ex-cess risk, RR was lower at higher serumcholesterol levels.
● Absolute risk for CVD mortality:Non-diabetic men: 32.28/10,000 person-year (46.12–13.84),Diabetic men: 68.71 (130.43–61.72) or morethan double.In a landmark report from the Scandina-
vian Simvastatin Survival Study (4S)192 usinga clinical case definition of DM (202 diabeticscompared with 4,242 non-diabetic patientswith previous myocardial infarction, anginapectoris, serum cholesterol 5.5–8.0 mmol/l,and serum triglycerides �2.5 mmol/l), sim-vastatin-treated patients had significantlyfewer CHD end-events compared with pla-cebo-treated control subjects. Over the 5.4-year median follow-up period, simvastatintreatment produced mean changes in serumlipids in diabetic patients similar to those ob-served in non-diabetics.
RESULTS
Relative risks (RRs) of main endpointswere as in Table 57.
CONCLUSIONS
The results strongly suggest that cholester-ol lowering with simvastatin:
1. Improves the prognosis of diabetic pa-tients with CHD,
2. The absolute clinical benefit is greater indiabetics with CHD than in non-diabeticswith CHD because diabetics have a higherabsolute risk of recurrent CHD events & oth-er atherosclerotic events.
3. Significant decreases in total mortality,major coronary events, and revascularizationswere also observed in simvastatin-treated pa-tients with impaired fasting glucose levels(�6.0 mmol/L [�110 mg dL]) or DM andknown CHD.193
4. Similar reductions in cardiovascularevents in diabetics using pravastatin were re-ported by the cholesterol and recurrentevents (CARE) trial investigators.194
Categories of Risk: The American DiabetesAssociation has recently published its Clini-cal Practice Recommendations 2000 for themanagement of dyslipidemia.195 The catego-ries of CHD risk by lipoprotein levels in type2 diabetic patients are shown in Table 58.
Management of Dyslipidemia: Aggressive

JOURNAL OF INSURANCE MEDICINE
92
therapy of diabetic dyslipidemia will proba-bly reduce the risk of CHD in patients withdiabetes. Primary therapy should be directedfirst at lowering LDL levels. The goal is toreduce LDL concentrations to levels recom-mended for patients with preexisting CHD(�100 mg/dl [2.60 mmol/l]). The initiationlevel for behavioral interventions is also anLDL cholesterol of �100 mg/dl (2.60 mmol/l)]. The initial therapy should be to use statintherapy with the addition of a resin if nec-essary to reach the LDL goal.
However, limited data are available fromclinical trials especially in diabetic patientswithout clinical CVD. In the absence of suchdata, because of the high mortality for dia-betic patients with first myocardial infarction,aggressive treatment of dyslipidemia is also indi-cated.● For patients without previous CHD, the
goal for LDL cholesterol is �100 mg/dl(2.60 mmol/l); the initiation level for phar-macological therapy is set at an LDL level�130 mg/dl (3.35 mmol/l).
● However, in patients with multiple risk fac-tors, some authorities recommend the ini-tiation of drug therapy when LDL levelsare between 100 and 130 mg/dl196
● The initial therapy for hypertriglyceride-mia is improved glycemic control.
● Additional triglyceride lowering can beachieved with very high dose statins (forsubjects with both high LDL and triglyc-eride levels) or fibric acid derivatives (gem-fibrozil or fenofibrate).
Obesity and Diabetes Mellitus: Existingevidence regarding the relationship betweenweight and mortality and the effects ofweight change is conflicting.
Colditz and colleagues197 at the ChanningLaboratory, Harvard Medical School, carriedout a study to determine the relation of bodymass index (weight/height2) with the risk ofclinical NIDDM in a cohort of 113,861 USwomen aged 30–55 years in 1976. During the8 years of follow-up (826,010 person-years),873 definite cases were identified among
women initially free from diagnosed diabe-tes.
RESULTS
1. Among women of average body mass in-dex, 23–23.9 kg.m2, the relative risk was 3.6times that of women having a body mass in-dex �22 kg/m2. The risk continued to in-crease above this level of body mass index.
2. The authors observed a much weaker as-sociation with weight at age 18, and this as-sociation was eliminated after adjustment forcurrent body mass index (BMI).
3. Thus, weight gain after age 18 was a ma-jor determinant of risk.
4. For an increase of 20–35 kg, the relativerisk was 11.3,
5. For an increase of more than 35 kg, therelative risk was 17.3.
6. These data indicate that, at even averageweight, women are at increased risk of clini-cal NIDDM,
7. The relation of body mass index and riskof diabetes is continuous.
Higgins and colleagues198 identified the ben-efits and adverse effects of weight loss fromobservations derived from the FraminghamStudy in men and women, ages 35–54, (20-year FU) in Framingham, Mass.
1. During 20 years follow-up, death rateswere highest in those whose BMI decreasedand in those with the highest BMI at studyentry.
2. Relative risks for death from cardiovas-cular disease, coronary heart disease,
3. All cause mortality was significantlygreater by 33% to 61% in men whose BMIdecreased after adjusting for age and risk fac-tors for cardiovascular disease.
4. In women, weight loss and weight gainwere associated with higher relative risks forcardiovascular disease and coronary heartdisease, but only the 38% increase in totalmortality rate among women who lost weightwas statistically significant after adjusting forage.
They concluded that weight loss was as-sociated with improvements in blood pres-

MILANO—DIABETES MELLITUS AND LIFE INSURANCE
93
sure and cholesterol levels but also with con-tinued cigarette smoking, prevalent and in-cident cardiovascular disease, diabetes melli-tus, other diseases, and higher death rates.Leanness and maintenance of stable weightwere beneficial to risk factors, and to the pre-vention of morbidity and death.
Chaturvedi and associates however, in the De-partment of Epidemiology and Public Health,University College, London, U.K., examinedmorbidity and mortality risks associated withbody weight in people with IDDM andNIDDM.
In the IDDM cohort199 of 644 men and 576women with IDDM from nine centers world-wide and followed from 1975 to 1988, the fol-lowing results were noted:
1. Body weight was positively associatedwith blood pressure, and in men, with cho-lesterol,
2. Fasting blood glucose was higher washigher in the most obese groups in womenonly,
3. There were 204 male deaths, and 148 fe-male deaths,
4. A J-shaped relationship existed betweenbody weight and all-cause mortality
5. Highest mortality rates occurred in theleanest BMI category.
6. The age-, duration-, and center-adjustedmortality rate ratio (95% CI) comparing BMIcategory �29 kg/m2 with BMI category �22and �24 kg/m2 was 2.64 (1.59–4.38) in menand 1.54 (0.77–3.06 in women.
7. Additional adjustments for smoking,blood pressure, glucose, cholesterol, and pro-teinuria did not qualitatively alter these find-ings
CONCLUSIONS
Except in very lean people with IDDM,body weight is not significantly associatedwith mortality,Efforts to improve glycemic control shouldnot be restricted by concerns about the effectsof weight gain on mortality.
In the NIDDM cohort200 study of 1,416men and 1,544 women, a morbidity follow-
up was performed in 1983, and a mortalityfollow-up continued until 1988. Data wereanalyzed according to geographical groups:Europeans, East Asians, and Native Ameri-cans. The relationship between weightchange and mortality was analyzed for Eur-opeans only.
RESULTS
1. Generally, BMI was positively associatedwith age, blood pressure, and cholesterol,
2. BMI was negatively associated with di-abetes duration, retinopathy prevalence, & in-sulin use,
3. No clear relationship between BMI andmortality across geographical groups,
4. In Europeans, weight loss in the leanestsubjects at baseline (BMI � 26 kg/m2) wasassociated with a three-fold increase in mor-tality risk compared with those who hadmaintained a steady weight (relative risk[RR] 3.05, 95% CI, 1.26–7.36).
5. Only in the most obese group wasweight loss associated with a mortality riskreduction (BMI � 29 kg/m2, RR 0.84, 95% CI0.40–1.74)
CONCLUSIONS
1. The positive association of BMA withage, blood pressure, and cholesterol and thenegative association with diabetes duration,retinopathy, and insulin use may explain whythere is no strong relationship between BMIand mortality in NIDDM.
2. Weight loss, particularly in the relativelylean diabetic person, may be associated withan increased mortality risk.
Smoking and Diabetes Mellitus
In the EURODIAB IDDM ComplicationsStudy201 which was a prevalence survey of3,250 men and women aged 15–60 years withIDDM from 31 diabetes centers in 16 Euro-pean countries, Chaturvedi and associates de-termined that the:
1. Relative risk (RR) of developing micro-vascular complications (microalbuminuria

JOURNAL OF INSURANCE MEDICINE
94
and retinopathy) between insulin-dependentdiabetics who were smokers versus IDDMnon-smokers was 2.0.
2. Current smokers had higher prevalenceof microalbuminuria and total retinopathythan those who never smoked,
3. Ex-smokers had a higher prevalence ofmacroalbuminuria and proliferative retinop-athy than those who never smoked,
4. Both current and ex-smokers had similarprevalence of microalbuminuria.
In the MRFIT Study (previously cited—seesection on Lipids and DM)
1. Absolute risk for heavy diabetic smokersthan diabetic non-smokers: 89.64/ vs. 56.28/10,000 person-yr
2. RR for diabetic compared with non-di-abetic men ranged from 2.38 (smokers of 16–25 cigarettes/day) to 4.56 (non-smokers).
In the Epidemiology of Diabetes Compli-cations Study (EDC)202 in the United States,comparing similar complication outcomes be-tween IDDM smokers and IDDM non-smok-ers of comparable ages and sex distributionsand duration characteristics between the twocontinents;
1. Prevalence of macroalbuminuria washigher in EDC (27%) than in EURODIAB(12%),
2. Rates of microalbuminuria were similar(33 versus 25% respectively
CONCLUSIONS1. Advanced renal disease is more preva-
lent in IDDM in EDC (Pittsburgh, PA) thanin Europe,
2. This is not explained by hypertension,glycemic control, or smoking.
American Diabetes Association Recom-mendations Regarding Smoking: The ration-al for the prevention and cessation of smok-ing in diabetics is substantial. The guidelinesare based on the body of evidence summa-rized in the ADA’s technical review on smok-ing and diabetes.203
Alcohol and Diabetes Mellitus1. Lindegard and Hilborn204 studied the ef-
fects of alcohol abuse in 1987 and found a very
strong correlation with excess mortality andbrain infarct.
2. Valmadrid et al205 analyzed the associa-tion between alcohol consumption and risk ofcardiovascular outcomes in a population-based prospective cohort study from 1984through 1996, with a follow-up of 12.3 years.
Setting and Participants:
● A total of 983 older-onset diabetic individ-uals (mean [SD] age, 68.6 [11.0] years;45.2% male; 98.5% white) were interviewedabout their past-year intake of alcoholicbeverages during the 1984–1986 follow-upexamination of a population-based study ofdiabetic persons in southern Wisconsin.
Main Outcome Measure:
● Time to mortality from CHD by categoryalcohol intake.
MORTALITY RESULTS
1. Alcohol use was inversely associated withrisk of CHD mortality in older-onset diabeticsubjects.
2. The CHD mortality rates for never andformer drinkers were 43.9 and 38.5 per 1000person-years, respectively,
3. Rates for those with alcohol intakes ofless than 2, 2 to 13, and 14 or more g/d were25.3, 20.8, and 10.0 per 1000 person-years, re-spectively.
4. Compared with never drinkers and con-trolling for age, sex, cigarette smoking, gly-cosylated hemoglobin level, insulin use, plas-ma C-peptide level, history of angina or myo-cardial infarction, digoxin use, and the pres-ence and severity of diabetic retinopathy,former drinkers had a relative risk (RR) of0.69 (95% confidence interval [CI], 0.43–1.12);
5. Excess Mortality (Relative Risk): See Ta-ble 59.
6. Further adjustments for blood pressure,body mass index, education, physical activity,diabetes duration, hypertension history, overtnephropathy, peripheral neuropathy, lipidmeasures, or intake of medications such as as-
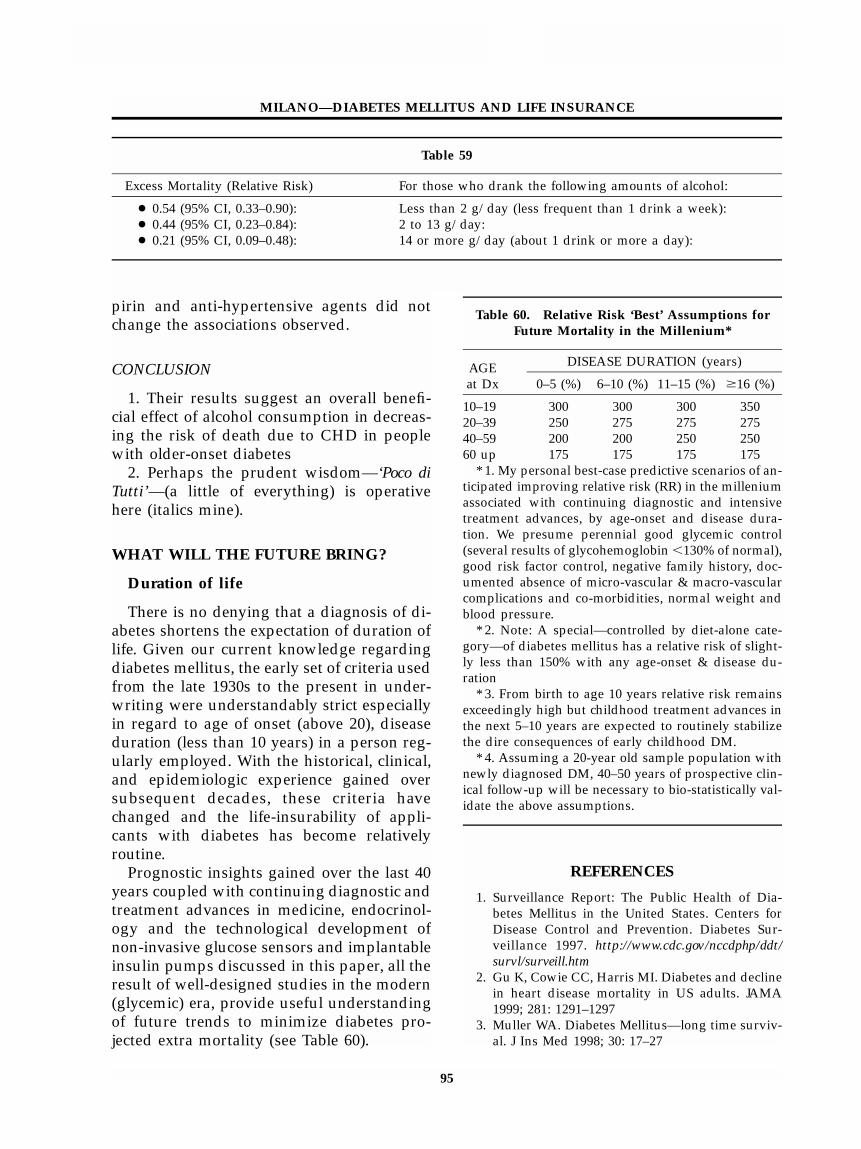
MILANO—DIABETES MELLITUS AND LIFE INSURANCE
95
Table 59
Excess Mortality (Relative Risk) For those who drank the following amounts of alcohol:
● 0.54 (95% CI, 0.33–0.90): Less than 2 g/day (less frequent than 1 drink a week):● 0.44 (95% CI, 0.23–0.84): 2 to 13 g/day:● 0.21 (95% CI, 0.09–0.48): 14 or more g/day (about 1 drink or more a day):
Table 60. Relative Risk ‘Best’ Assumptions forFuture Mortality in the Millenium*
AGEat Dx
DISEASE DURATION (years)
0–5 (%) 6–10 (%) 11–15 (%) �16 (%)
10–19 300 300 300 35020–39 250 275 275 27540–59 200 200 250 25060 up 175 175 175 175
* 1. My personal best-case predictive scenarios of an-ticipated improving relative risk (RR) in the milleniumassociated with continuing diagnostic and intensivetreatment advances, by age-onset and disease dura-tion. We presume perennial good glycemic control(several results of glycohemoglobin �130% of normal),good risk factor control, negative family history, doc-umented absence of micro-vascular & macro-vascularcomplications and co-morbidities, normal weight andblood pressure.
* 2. Note: A special—controlled by diet-alone cate-gory—of diabetes mellitus has a relative risk of slight-ly less than 150% with any age-onset & disease du-ration
* 3. From birth to age 10 years relative risk remainsexceedingly high but childhood treatment advances inthe next 5–10 years are expected to routinely stabilizethe dire consequences of early childhood DM.
* 4. Assuming a 20-year old sample population withnewly diagnosed DM, 40–50 years of prospective clin-ical follow-up will be necessary to bio-statistically val-idate the above assumptions.
pirin and anti-hypertensive agents did notchange the associations observed.
CONCLUSION
1. Their results suggest an overall benefi-cial effect of alcohol consumption in decreas-ing the risk of death due to CHD in peoplewith older-onset diabetes
2. Perhaps the prudent wisdom—‘Poco diTutti’—(a little of everything) is operativehere (italics mine).
WHAT WILL THE FUTURE BRING?
Duration of life
There is no denying that a diagnosis of di-abetes shortens the expectation of duration oflife. Given our current knowledge regardingdiabetes mellitus, the early set of criteria usedfrom the late 1930s to the present in under-writing were understandably strict especiallyin regard to age of onset (above 20), diseaseduration (less than 10 years) in a person reg-ularly employed. With the historical, clinical,and epidemiologic experience gained oversubsequent decades, these criteria havechanged and the life-insurability of appli-cants with diabetes has become relativelyroutine.
Prognostic insights gained over the last 40years coupled with continuing diagnostic andtreatment advances in medicine, endocrinol-ogy and the technological development ofnon-invasive glucose sensors and implantableinsulin pumps discussed in this paper, all theresult of well-designed studies in the modern(glycemic) era, provide useful understandingof future trends to minimize diabetes pro-jected extra mortality (see Table 60).
REFERENCES
1. Surveillance Report: The Public Health of Dia-betes Mellitus in the United States. Centers forDisease Control and Prevention. Diabetes Sur-veillance 1997. http://www.cdc.gov/nccdphp/ddt/survl/surveill.htm
2. Gu K, Cowie CC, Harris MI. Diabetes and declinein heart disease mortality in US adults. JAMA1999; 281: 1291–1297
3. Muller WA. Diabetes Mellitus—long time surviv-al. J Ins Med 1998; 30: 17–27

JOURNAL OF INSURANCE MEDICINE
96
4. Centers for Disease Control and Prevention. Na-tional Diabetes Fact Sheet: National estimates andgeneral information on diabetes in the UnitedStates. NIH Publication No. 98–3926, Atlanta, GA:U.S. Department of health and Human Services,Centers for Disease Control and Prevention, No-vember 1997. http://www.niddk.nih.gov/health/diabe-tes/pubs/dmstats/dmstats.htm
5. Aitman TJ, London MRC Clinical Science Center.Nature, Medicine, January, 1999
6. Colditz GA, Willett WC, Stampfer MJ, et al.Weight as a risk factor for clinical diabetes inwomen. Am J Epidemiol 1990; 132: 501–513.
7. Hu FB, Sigal RG, Rich-Edwards JW et al. Walkingcompared with vigorous physical activity andrisk of type 2 diabetes in women: a prospectivestudy. JANA 1999; 282: 1433–1439.
8. Tattersall RB. Mild familial diabetes with domi-nant inheritance. Q J Med 1974; 43: 339.
9. Froguel P, Vaxillaire M, Sun F, et al. Close linkageof glucokinase locus on chromosome 7p to earlyonset non-insulin-dependent diabetes mellitus.Nature 1992: 356: 162.
10. Herman WH, Fajans SS, Ortiz FJ, et al. Abnormalinsulin secretion, not insulin resistance, is the ge-netic or primary defect of MODY in the RW ped-igree. Diabetes 1994; 43(1): 40–46.
11. Diabetes during pregnancy—United States, 1993–1995. MMWR 1998 (May 29);47: 408–414
12. Metzger BE, Cho NH, Roston SM, Radvany RR.Prepregnancy weight and antepartum insulin se-cretion predict glucose tolerance five years aftergestational diabetes mellitus. Diabetes Care 1993;16 (12): 1598–1605.
13. Report of the Expert Committee on the Diagnosisand Classification of Diabetes Mellitus. DiabetesCare 1997 July; 20 (7): 1183–97.
14. Goldstein DE, Little RR, Lorenz RA, et al. Testsof glycemia in diabetes. Diabetes care 1995; 19:896–909
15. Little RR, Wiedmeyer HM, England JD, et al. In-terlaboratory standardization of measurements ofglycohemoglobin. Clin Chem 1992; 38: 2472–78.
16. Goldstein DE, Little RR, England JD, et al. Meth-ods for quantitating glycosylated hemoglobins:high performance liquid chromatography andthiobarbituric acid colorimetry. In: Clarke WL,Larner J, Pohl SL, eds. Methods in Diabetes Re-search, Vol. 2.: Clinical methods. New York: JohnWiley, 1986: 475–504.
17. Ludvigsen CW, Sprague G, Smith KM. Fructo-samine—clinical usefulness and determination ofreference ranges. J Ins Med 1989; 21:No. 3, 203–208
18. Miller PK, Ludvigsen CW, Roberts BD. Letter tothe editor; Prostate specific antigen and fructo-samine (sensitivity and specificity of glycated se-
rum proteins and glycohemoglobin). J Ins Med1990; 22(1):67–68.
19. Centers for Disease Control and Prevention. Na-tional Diabetes Fact Sheet: National estimates andgeneral information on diabetes in the UnitedStates. NIH Publication No. 98–3926, Atlanta, GA:U.S.Department of health and Human Services,Centers for Disease Control and Prevention, No-vember 1997. http://www.niddk.nih.gov/health/diabe-tes/pubs/dmstats/dmstats.htm
20. Cohen DL, Neil HAW, Thorogood M, Mann JI. Apopulation-based study of the incidence of com-plications associated with type 2 diabetes in theelderly. Diabetic Medicine 1991; 8: 928–933.
21. Brownlee M. Glycation products and the patho-genesis of diabetic complications. Diabetes Care1992; 15: 1835.
22. MacLeod CA, Murchison LE, Russell EM, Ding-wall-Fordyce I. Measuring outcomes of diabetes:a retrospective survey. Diabetic Medicine 1989; 6:59–63.
23. Colwell J. DCCT findings: Applicability and im-plications for NIDDM. Diabetes Reviews 1994; 2:277.
24. Singer RB, Levinson L. 905-Natural history of di-abetes.(Joslin Clinic 1939–1963). Medical Risks:Patterns of Mortality and Survival 1976; 9–22 to25.
25. Goodkin L, Wolloch L, Gottcent RA, Reich F. Di-abetes—A Twenty Year Mortality Study. Trans.Life Ins. Med. Dir. Amer. 1974; 217–269. Rep. In:Medical Risks; Patterns of Mortality and Survival:Editors: RB Singer, L Levinson; D.C.Heath andCo. 1976, pp9–2 to 9–7.
26. Mast JL. Findings from LNRC’s fourth majorstudy on diabetics and mortality. ReinsuranceReporter 1996; 148:18–30.
27. Berger B, Stenstrom G, Sundkvist G. Incidence,prevalence and mortality of diabetes in a largepopulation. A report from the Skaraborg Diabe-tes Registry. Diabetes Care 1999 May; 22 (5): 773–778.
28. Claude R Catellier, MD. Be it resolved that givenour current knowledge regarding diabetes mel-litus that insurance companies are liberal in theirunderwriting of this condition (negative). Presen-tation at the annual Canadian Life InsuranceMedical Officers Association (CLIMOA); ChateauFrontenac, Quebec, Canada, May 17, 2000.
29. Goldstein DE, Little RR, Lorenz RA, et al. Testsof glycemia in diabetes. Diabetes Care 1995; 19:896–909.
30. Ditzel J. Oxygen transport impairment in diabe-tes. Diabetes 1976; (Suppl II): 832–837.
31. Ludvigsen CW, Sprague G, Smith KM. Fructo-samine—clinical usefulness and determination of

MILANO—DIABETES MELLITUS AND LIFE INSURANCE
97
reference ranges. J Ins Med 1989; 21: No. 3, 203–208.
32. Miller PK, Ludvigsen CW, Roberts BD. Letter tothe Editor; Prostate specific antigen and fructo-samine. J Ins Med 1990; 22: No. 1, 67–68.
33. Stout R (personal communication). ReferenceRanges for Glycemic Control. Clinical ReferenceLaboratory (CRL), Lenexa, Kansas, Sept. 17,1998.
34. Stout R (personal communication). Referenceranges for glycemic control. Clinical ReferenceLaboratory (CRL), Lenexa, Kansas, September 17,1998.
35. Moss SE, Klein R, Klein BEK, Meuer S. The as-sociation of glycemia and cause-specific mortalityin a diabetic population. Arch Int Med 1994; 154:2473–2479.
36. Goldstein DE, Little RR, Lorenz RA, et al. Testsof glycemia in diabetes. Diabetes Care 1995; 18:896–909.
37. National Glycohemoglobin Standardization Pro-gram (NGSP). http://www.missouri.edu/�diabetes/ngsp.html
38. Moss SE, Klein R, Klein BEK, Meuer SM. The as-sociation of glycemia and cause-specific mortalityin a diabetic population. Arch Intern Med 1994;154: 2473–2479.
39. Balkau B, Shipley M, Jarrett RJ, et al. High bloodglucose concentration is a risk factor for mortalityin middle-aged nondiabetic men. 20-year follow-up in the Whitehall Study, the Paris ProspectiveStudy, and the Helsinki Policemen Study. Diabe-tes Care 1998 Mar; 21(3):360–7.
40. Harris MI, Eastman RC. Is there a glycemicthreshold for mortality risk? [editorial]. DiabetesCare 1998 Mar; 21(3):331–3
41. The Diabetes Control and Complications TrialResearch Group, The effect of intensive treatmentof diabetes on the development and progressionof long-term complications in insulin-dependentdiabetes mellitus. N Engl J Med 1993; 329: 977–986.
42. Vijan S, Hofer TP, Hayward RA. Estimated ben-efits of glycemic control in microvascular com-plications in type 2 diabetes. Ann. Int. Med. 1997:127: 788–795.
43. Andersson DKG, Svardsudd K. Long-term gly-cemic control relates to mortality in type II dia-betes. Diabetes Care 1995; 18: 1534–1543.
44. Celentano A, Vaccaro O, Tammaro P, et al. Earlyabnormalities of cardiac function in non-insulindependent diabetes mellitus and impaired glu-cose tolerance. Am J Cardiol 1995; 76: 1173–1176.
45. Reaven GM. Banting Lecture 1988: role of insulinresistance in human disease. Diabetes 1988 (9);37: 1595–1607.
46. Davidson MB. Clinical implications of the insulinresistant syndromes. Am J Med 1995; 99:420
47. Depres JP, Lamarche B, Maureague P, et al. Hy-perinsulinemia as an independent risk factor forischemic heart disease. N Engl J Med 1996 April11; 334 (15): 952–957.
48. Regenauer A. Prognostic aspects of the metabolicsyndrome. J Ins Med 1998; 30 (3):180–190.
49. Nathan DM. Inferences and implications: (Do re-sults from the Diabetes Control and Complica-tions Trial apply in NIDDM?) Diabetes Care1995; 18: 251–257.
50. Turner RC, Cull CA, et al. UK Prospective Dia-betes Study 16, (UKPDS). Overview of 6 yearstherapy of type II diabetes: A progressive disease.Diabetes 1995; 44: 1249–1258.
51. Intensive blood-glucose control with sulphony-lureas or insulin compared with conventionaltreatment and risk of complications in patientswith type 2 diabetes (UKPDS 33). UK ProspectiveDiabetes Study (UKPDS) Group. Lancet 1998:352: 837.
52. Effect of intensive blood-glucose control withmetformin on complications in overweight pa-tients with type 2 diabetes (UKPDS 34). UK Pro-spective Diabetes Study (UKPDS) Group. Lancet1998; 352:854.
53. Nathan DM. Some answers, more controversy,from UKPDS. UK Prospective Diabetes Study.Lancet 1998; 352: 832.
54. Tight blood pressure control and risk of macro-vascular and microvascular complications in type2 diabetes: UKPDS 38. UK Prospective DiabetesStudy Group. BMJ 1998; 317: 703.
55. Cost effectiveness analysis of improved bloodpressure control in hypertensive patients withtype 2 diabetes: UKPDS 40. UK Prospective Di-abetes Study Group. BMJ 1998; 317:720.
56. Abriara C, Colwell JA, Nuttall FQ, et al. VeteransAffairs Cooperative Study on glycemic controland complications in type II diabetes (VA CSDM).Results of the feasibility trial. Veterans AffairsCooperative Study in Type II Diabetes. DiabetesCare 1995; 18: 1113–1123.
57. Kuusisto J, Mykkanen L, Pyorala K, Laakso M.NIDDM and its metabolic control predict coro-nary heart disease in elderly subjects. Diabetes1994; 43: 960–967.
58. Standl E, Balletshofer B, Dahl B, et al. Predictorsof 10-year macrovascular and overall mortality inpatients with NIDDM: the Munich General Prac-titioner Project. Diabetologia 1996; 39: 1540–1545.
59. Turner RC. The U.K. Prospective Study: a review.Diabetes Care 1998; 21 (Suppl 3): C35–38.
60. Gaede P, Vedel P, Parving HH, Pedersen O. Inten-sified multifactorial intervention in patients withtype 2 diabetes mellitus and microalbuminuria:the Steno type 2 randomized study. Lancet 1999Feb 20; 353 (9153): 617–622.

JOURNAL OF INSURANCE MEDICINE
98
61. Turner RC; Millns H; Neil HA; Stratton IM; Man-ley SE; Matthews DR; Holman RR. Diabetes Re-search Laboratories, Nuffield Department ofMedicine, University of Oxford, Radcliffe Infir-mary. Risk factors for coronary artery disease innon-insulin dependent diabetes mellitus: UnitedKingdom Prospective Diabetes Study (UKPDS:23). BMJ 1998 Mar 14;316(7134):823–8. PMID:9549452 UI: 98210620
62. Hanefeld M; Fischer S; Julius U; Schulze J; Schwa-nebeck U; Schmechel H; Ziegelasch HJ; LindnerJ. Medical Faculty C. G. Carus, Technical Univer-sity Dresden, Germany. Risk factors for myocar-dial infarction and death in newly detectedNIDDM: the Diabetes Intervention Study, 11-yearfollow-up. Diabetologia 1996 Dec;39(12):1577–83PMID: 8960845 UI: 97120174
63. Malone JI, Rosenbloom AL, Grgic A, et al. Therole of urine sugar in diabetic management. AmJ Dis Child 1976; 130: 1324.
64. Frishman D, Ardito DM, Graham SM. Perfor-mance of glucose monitors. Lab Med 1992; 23:179.
65. Faich GA, Fishbein HA, Ellis SE. The epidemiol-ogy of diabetic acidosis: a population-basedstudy. Am J Epidemiol 1983; 117: 551.
66. Malone JI, Rosenbloom AL, Grgic A, Weber FT.The role of urine sugar in diabetic management.Am J Dis Child 1976 Dec; 130(12):1324–1327.
67. Gill GV, Lucus S, Kent LA. Prevalence and char-acteristics of brittle diabetes in Britain. Walton Di-abetes Centre, Walton Hospital, Liverpool, UK.QJM 1996 Nov; 89(11): 839–843.
68. Tattersall R, Gregory R, Selby C, et al. Course ofbrittle diabetes: 12 year follow-up. Department ofDiabetes, University Hospital, Nottingham. BMJ1991 May 25: 302(6787): 1240–1243.
69. Kent La, Gill GV, Williams G. Mortality and out-come of patients with brittle diabetes and recur-rent ketoacidosis. Diabetic Clinic, Royal Liver-pool University Hospital, UK. Lancet 1994 Sep 17;344(89250: 765–766.
70. Scibilia J, Finegold D, Dorman J, et al. Acta En-docrinol Suppl (Copenh) 1986; 279: 326–333.
71. Malone JI, Hellrung JM, Malphus EW, et al. Gooddiabetic control—a study in mass delusion. J Pe-diatr 1976 Jun; 88(6): 943–947. J Matern Fetal Med2000 Jan-Feb; 9(1):42–45.
72. Silverstein JH, Rosenbloom AL. New develop-ments in type 1 (insulin-dependent) diabetes. De-partment of Pediatrics, University of Florida Col-lege of Medicine, Gainesville, USA. Clin Pediatr(Phila) 2000 May; 39(5): 257–266.
73. Melki V, Renard E, Lassmann-Vague V, et al. Im-provement in HbA1c and blood glucose stabilityin IDDM patients treated with lispro insulin an-alog in external pumps. Service de Diabetologie,
Hospital de Rangueil, CHU Toulouse, France. Di-abetes Care 1998Jun; 21(6): 977–982.
74. Gabbe SG. New concepts and applications in theuse of the insulin pump during pregnan-cy.Department of Obstetrics and Gynecology,University of Washington School of Medicine,seattle 09195–6460, USA. J Matern Fetal Med 2000Jan-Feb; 9(1): 42–45.
75. Original Articles—NEJM (rating: 672) OriginalText. A.M. James Shapiro, Jonathan R.T. Lakey,Edmond A. Ryan, Gregory S. Korbutt, Ellen Toth,Garth L. Warnock, Norman M. Kneteman, Ray V.Rajotte. NEJM 2000 July 27 (Full text pub)
76. From the Surgical-Medical Research Institute andthe Department of Surgery (A.M.J.S., J.R.T.L.,G.S.K., G.L.W., N.M.K., R.V.R.) and the Depart-ment of Medicine (E.A.R., E.T.), University of Al-berta, Edmonton, Alta., Canada. Address reprintrequests to Dr. Shapiro at 2D4.37 Department ofSurgery, University of Alberta Hospitals, Mac-kenzie Health Sciences Center, 8440 112 St., Ed-monton, AB T6G 2B7, Canada, or at.
77. Shapiro AMJ, Lakey JRT, Ryan EA, et al. Islettransplantation in seven patients with type 1 di-abetes mellitus using a glucocorticoid-free im-munosuppressive regimen. N Engl J Med 2000July; 343(4):230–238
78. Robertson RP. Successful islet transplantation forpatients with diabetes—fact or fantasy? N Engl JMed 2000 July: 343 (4): 289–290.
79. Robertson RP, Davis C, Larsen J, Stratta R, Suth-erland DER: Pancreas and islet transplantationfor patients with diabetes mellitus (Technical Re-view).
80. Borch-Johnsen K. Improving prognosis of type 1diabetes. Mortality, accidents, and impact on in-surance. Steno Diabetes Centre, Gentofte, Den-mark.. Diabetes Care 1999 Mar;22 Suppl 2:B1–3
81. Kannel WB, McGee DL. Diabetes and cardiovas-cular disease: the Framingham Study. JAMA1979; 241: 2035.
82. Singer DE, Nathan DM, Anderson KM, et al. As-sociation of HbA1c with prevalent cardiovasculardisease in the original cohort of the FraminghamHeart Study. Diabetes 1992; 41:202.
83. Abbud ZA, Shindler DM, Wilson AC, Kostis JB.Effect.of diabetes mellitus on short- and longterm mortality rates of patients with acute myo-cardial infarction: A statewide (MIDAS) study.Am Heart J 1995; 130: 51–8.
84. Zuanetti G, Latini R, Maggioni AP, et al. Influ-ence of diabetes on mortality in acute myocardialinfarction: Data from the GISSI-2 Study. J AmColl Cardiol 1993; 22: 1788–94.
85. Orlander PR, Goff DC, Morrissey M, et al. Therelation of diabetes to the severity of acute myo-cardial infarction and post-myocardial infarction

MILANO—DIABETES MELLITUS AND LIFE INSURANCE
99
survival in Mexican-Americans and non-Hispan-ic whites. The Corpus Christi Heart Project. Di-abetes 1994; 43: 897–902.
86. Barrett-Connor EL, Cohn BA, Wingard DL, Edel-stein SL. Why is diabetes mellitus a stronger riskfactor for fatal ischemic heart disease in womenthan in men? The Rancho Bernardo Study.JAMA 1991; 265: 627–631.
87. The Bypass Angioplasty Revascularization Inves-tigation (BARI) Investigators. Comparison of cor-onary bypass surgery with angioplasty in pa-tients with multivessel disease. N Engl J Med1996; 335: 217–225.
88. Gum PA, O’Keefe JH Jr, Borkon AM et al. Bypasssurgery versus coronary angioplasty for revas-cularization of treated diabetic patients. Circula-tion 1997 Nov 4; 96 (9 Suppl): II-7–10.
89. Barsness GW, Peterson ED, Ohman EM, et al. Re-lationship between diabetes mellitus and long-term survival after coronary bypass and angio-plasty. Circulation 1997 Oct 21; 96 (8): 2551–2556.
90. Herlitz J, Wognsen GB, Emanuelsson H, et al.Mortality and morbidity in diabetic and nondi-abetic patients during a 2-year period after cor-onary artery bypass grafting. Diabetes Care 1996;19: 698–703.
91. Haffner SM, Lehto S, Ronnemaa T, et al. Mortal-ity from coronary heart disease in subjects withtype II diabetes and in non-diabetic subjects withand without prior myocardial infarction. N EnglJ Med 1998; 339: 229–234.
92. Acharya DU, Shekhar YC, Aggarwal A, Anand IS.Lack of pain during myocardial infarction in di-abetics: is autonomic dysfunction responsible?Am J Cardiol 1991; 68: 793–796.
93. Nesto RW, Watson FS, Kowalchuk GJ, et al. Silentmyocardial and infarction in diabetics with pe-ripheral vascular disease: Assessment by dipyri-damole Thallium-201 scintigraphy. Am Heart J1990; 120: 1073–1077.
94. O’Brien IA, McFadden JP, Corrall RJM. The influ-ence of autonomic neuropathy on mortality in in-sulin-dependent diabetes. Quart J Med 1991; 79:495–502.
95. Canto JG, Shlipak MG, Rogers WJ, et al. Preva-lence, clinical characteristics, and mortalityamong patients with myocardial infarction pre-senting without chest pain. National Registry ofMyocardial Infarction 2 (NRMI-2). JAMA June28,2000; 283: 3223–3229.
96. Nakamura M, Takeshita A, Nose Y. Clinical char-acteristics associated with myocardial infarction,arrhythmias, and sudden death in patients withvasospastic angina. Circulation 1987; 75: 1110.
97. Bonita R. Epidemiology of stroke. Lancet 1992;339: 342–344.
98. Kistler JP. The risk of embolic stroke: another
piece of the puzzle. N Engl J Med 1994; 331:1517–1519.
99. Caplan LR. Intracerebral hemorrhage. Lan-cet1992; 339: 656–658.
100. Bell DSH. Stroke in the diabetic patient. DiabetesCare 1994; 17: 213–219
101. Stegmayr B, Asplund K. Diabetes as a risk factorfor stroke. A population perspective. Diabetologia1995; 38: 1061–1068.
102. Sacco RL. Risk factors and outcomes for ischemicstroke. Neurology (suppl. 1) 1995; 45:S10-S14.
103. Hu FB, Stampfer MJ, Colditz GA, et al. Physicalactivity and risk of stroke in women. JAMA 2000;283: 2961–2967.
104. Webster P. The natural history of stroke in dia-betic patients. Acta Med Scand 1980; 207: 417–424.
105. Roehmhodt ME, Palumbo PJ, Whisnant JP, Elus-back LR. Transient ischemic attack and stroke ina community-based diabetic cohort. Mayo ClinProc 1983; 58:56–58.
106. Matchar DB, McCrory DC, Barnett HJM, FeussnerJR. Medical treatment for stroke prevention. AnnInt Med 1994; 121: 41–53.
107. Hornig CR, Lammers C, Buttner T, et al. Long-term prognosis of infratentorial transient isch-emic attacks and minor strokes. Stroke 1992; 23:199–204.
108. Roehmhodt ME, Palumbo PJ, Whisnant JP, Elus-back LR. Transient ischemic attack and stroke ina community-based diabetic cohort. Mayo ClinProc 1983; 58:56–58.
109. Biller J, Saver JL. Transient ischemic attacks—populations and prognosis. Mayo Clin Proc 1994;69: 493–494.
110. Easton JD, Hart RG, Sherman DG, Kaste M. Di-agnosis and management of ischemic stroke: PartI. Threatened stroke and its management CurrProb Cardiol 1983; 8; 76.
111. Wang X. Chinese patients with transient ischemicattack. Chinese Med J 1990; 103: 699–703.
112. Evans BA, Sicks JD, Whisnant JP. Factors affectingsurvival and occurrence of stroke in patients withtransient ischemic attacks. Mayo Clin Proc 1994;69: 416–421.
113. Warlow C. Secondary prevention of stroke. Lancet1992; 339: 724–727.
114. Moore WS, Barnett HJM, Beebe HG, et al. Guide-lines for carotid endarterectomy: a multi-discipli-nary consensus statement from the ad hoc com-mittee, American Heart Association. Circulation1995: 91: 566–579.
115. Streifler JY, Benavente OR, Harbison JW, et al.Prognostic implications of retinal versus hemi-spheric TIA in patients with high grade carotidstenosis: observations from NASCET (abstract).Stroke 1992; 23:159.

JOURNAL OF INSURANCE MEDICINE
100
116. Brown RD, Evans BA, Wiebers DO, et al. Tran-sient ischemic attack and minor ischemic stroke:an algorithm for evaluation and treatment. MayoClin Proc 1004; 69: 1027–1039.
117. Inzitari D, Eliasziw M, Gates P, et al. The causesand risk of stroke in patients with asymptomaticinternal-carotid-artery stenosis: for the NorthAmerican Symptomatic Carotid EndarterectomyTrial Collaborators. N Engl J Med 2000; 342 (No.23): 1693–1700.
118. North American Symptomatic Carotid Endarte-rectomy Trial Collaborators: Beneficial effect ofcarotid endarterectomy in symptomatic patientswith high grade stenosis. N Engl J Med 1991; 325:445–453.
119. North American Symptomatic Carotid Endarte-rectomy Trial Collaborators. Benefit of carotidendarterectomy in patients with symptomaticmoderate or severe stenosis. N Engl J Med 1998;339: 1415.
120. Executive Committee For the Asymptomatic Ca-rotid Atherosclerosis Study. Endarterectomy forasymptomatic carotid artery stenosis. JAMA1995: 273; 1421–1428.
121. The CASANOVA Study Group. Carotid surgeryversus medical therapy in asymptomatic carotidstenosis. Stroke 1991; 22: 1229–1235.
122. Brown GC, Magargal LE. The ocular ischemicsyndrome. Int Opthalmol1988; 11:239–251
123. Stewart CPU, Jain AS. Cause of death of lowerlimb amputees. Dundee Limb Fitting Centre(DLFC), Broughty Ferry, Scotland. Prostheticsand Orthotics International 1992; 16: 129–132.
124. Stewart CPU, Jain AS, Ogston SA. Lower limbamputee survival. Dundee Limb Fitting Centre(DLFC), Broughty Ferry, Scotland. Prostheticsand Orthotics International 1992; 16: 11–18.
125. DeLuccia N, DeSouza Pinto MAG, Guedes JPB,Albers MTV. Rehabilitation after amputation forvascular disease: a follow-up study. Prostheticsand Orthotics International 1992:16: 124–128.
126. Cleveland Clinic J Med 1993; Jan/Feb: 12127. Kwolek CJ, Pomposelli FB, Tannenbaum GA, et
al. Peripheral vascular bypass in juvenile-onsetdiabetes mellitus: Are aggressive revasculariza-tion attempts justified? J Vasc Surg 1992; 15: 394–401.
128. Howell MA, Colgan MP, Seeger RW, et al. Rela-tionship of severity of lower limb peripheral vas-cular disease to mortality and morbidity: A six-year follow-up study. J Vasc Surg 1989; 9: 691–697.
129. Kreines K, Johnson E, Albrink M, et al. Thecourse of peripheral vascular disease in non-in-sulin dependent diabetes. Diabetes Care 1985; 8:235–243.
130. Messent JW, Elliott TG, Hill RD, et al. Prognostic
significance of microalbuminuria in insulin-de-pendent diabetes mellitus: a twenty-three yearfollow-up study. Kidney Int 1992, April; 41 (4):836–839.
131. Stephenson JM, Kenny S, Stevens LK, et al. Pro-teinuria and mortality in diabetes: the WHO Mul-tinational Study of Vascular Disease in Diabetes.Diabet Med 1995 Feb; 12 (2): 149–155.
132. Ritz E, Orth SR. Nephropathy in patients withtype 2 diabetes mellitus. N Eng J Med 1999; 341(15): 1127–1133.
133. Andersen AR, Christiansen JS, Andersen JK, etal. Diabetic nephropathy in type 1 (insulin-de-pendent diabetes): an epidemiological study. Dia-betetologia 1982; 25: 496.
134. Remuzzi G, Ruggenenti P, Benigni A. Perspec-tives in Clinical Nephrology: Understanding thenature of renal disease progression. Kidney In-ternational 1997; 51: 2–15.
135. Orth SR, Ritz E. The nephrotic syndrome.N EnglJ Med 1998 April; 338 (17): 1202–1211.
136. Remuzzi G, Bertani T. Pathophysiology of pro-gressive nephropathies. N Engl J Med 1998 Nov;339 (20): 1448–1556.
137. Singer RB, Balakrishna SS. Mortality in medicarepatients on dialysis for end-stage renal disease(ESRD), 1982–1987. J Ins Med 1995 Summer; 27(1): 28–32.
138. Cockcroft DW, Gault MH. Prediction of creatinineclearance from serum creatinine. Nephron 1976;16:31–34.
139. Levey AS, Bosch JP, Lewis JB, et al. A more ac-curate method to estimate glomerular filtrationrate from serum creatinine: a new predictionequation. Modification of Diet in Renal DiseaseStudy Group. Ann Intern Med 1999; 130; 461.
140. Wass V, Cameron JS. Cardiovascular disease andthe nephrotic syndrome: the other side of thecoin. Nephron 1981; 27: 58–61.
141. Ordonez JD, Hiatt RA, Killebrew EJ, Fireman BH.The increased risk of coronary heart disease as-sociated with nephrotic syndrome. Kidney Inter-national 1993; 44: 638–642.
142. Alzaid AA. Microalbuminuria in patients withNIDDM: An overview. Diabetes Care 1996; 19:70–89
143. Klein R, Klein BEK, Moss SE. Prevalence of mi-croalbuminuria in older-onset diabetes. DiabetesCare 1993; 16 (10): 1325–1330.
144. Nielsen S, Hansen KW, Schmitz A, et al. Albu-minuria and 24-h ambulatory blood pressure innormal albuminuric and microalbuminuricNIDDM Patients: A longitudinal study. DiabetesCare 1995 Nov; 18 (11): 1434–1441.
145. Gall M, Borch-Johnsen K, Hougaard P, et al. Al-buminuria and poor glycemic control predict

MILANO—DIABETES MELLITUS AND LIFE INSURANCE
101
mortality in NIDDM. Diabetes 1995; 44: 1303–1309.
146. Ravid M, Lang R, Rachmani R, Lishner M. Long-term renoprotective effect of Angiotensin-con-verting enzyme inhibition in non-insulin- depen-dent diabetes mellitus. Arch Int Med 1996; 156:286–289.
147. Kiberd BA, Jindal KK. Routine treatment of in-sulin-dependent diabetic patients with ACE in-hibitors to prevent renal failure: an economicevaluation. Am J Kid Dis 1998 Jan: 31 (1): 49–54.
148. The Heart Outcomes Prevention EvaluationStudy Investigators. Effects of an angiotensin-converting-enzyme inhibitor,ramipril, on cardio-vascular events in high risk patients. N Engl JMed January 20, 2000; 342 (3): 145–153.
149. Heart Outcomes Prevention Evaluation (HOPE)Study Investigators. Effects of ramipril on cardio-vascular and microvascular outcomes in peoplewith diabetes mellitus: results of the HOPE studyand MICRO-HOPE substudy. Lancet January 22,2000; 355 (No. 9200): 253–259.
150. Borch-Johnsen. Increase in life expectancy in type1 diabetes mellitus. Diab Care 1999; 22: BI
151. Bouhanick B, Berrut G, Chameau AM, et al. Pre-dictive value of testing random urine sample todetect microalbuminuria in diabetic subjects dur-ing outpatient visit. Diabetes Metab 1992;18: 54–58.
152. Advances in the assessment of the prognostic im-plications of proteinuria: microalbuminuria andthe protein/creatinine ratio.J Ins Med 1994; 26 (2):272–277
153. Vinik AI, Holland MT, LeBeau JM, et al. Diabeticneuropathies. Diabetes Care 1992; 15: 1926–1975.
154. McNeely MJ, Boyko EJ, Ahroni JH, et al. The in-dependent contributions of diabetic neuropathyand vasculopathy in foot ulceration: how greatare the risks? Diabetes Care 1995; 18: 216–219.
155. Dyck PJ, Kratz KM, Karnes MS, et al. The prev-alence by staged severity of various types of di-abetic neuropathy, retinopathy, and nephropathyin a population-based cohort: The Rochester Di-abetic Neuropathy Study. Neurology 1993; 43:817–824.
156. Ewing DJ, Clarke BF. Autonomic neuropathy: itsdiagnosis and prognosis. Clin Endocrinol Metab1986; 15: 855–888.
157. Levitt NS, Stansberry KB, Wynchank S, Vinik AI.The natural progression of autonomic neuropathyand autonomic function tests in a cohort of peo-ple with IDDM. Diabetes Care 1996; 19: 751–754.
158. Sundvist G, Lilja B. Autonomic neuropathy pre-dicts deterioration in glomerular filtration rate inpatients with IDDM. Diabetes Care 1993; 16: 773–779.
159. Nesto RW, Watson FS, Kowalchuk GJ, et al. Silent
myocardial ischemia and infarction in diabeticswith peripheral vascular disease: Assessment bydipyridamole thallium-201 scintigraphy. AmHeart J 1990; 120: 1073–1077.
160. Watkins PJ, Diabetic autonomic neuropathy. NEngl J Med 1990; 322: 1078–1079.
161. Krolewski AS, Warram JH, Christlieb AR, et al.Risk of diabetic proliferative retinopathy in ju-venile-onset type I diabetes: a 40-year follow-upstudy. Diabetes Care 1986; 9: 443–452
162. Krolewski AS, WarramJH, Rand LI, et al. Epide-miologic approach to the etiology of type 1 dia-betes mellitus and its complications. N Engl JMed 1987; 317: 1390.
163. Diabetes in America. 2nd ed. Bethesda, MD: Na-tional Institutes of Health, National Institute ofDiabetes and Digestive and Kidney Diseases;1995.
164. Palmberg P, Smith M, Waltman S, et al. The nat-ural history of retinopathy in insulin-dependentjuvenile-onset diabetes. Opthalmology 1981; 88:613.
165. Klein R, Klein BE; Moss SE, Cruickshanks KJ. As-sociation of ocular disease and mortality in a di-abetic population. Department of Ophthalmologyand Visual Sciences, University of WisconsinMedical School, Madison 53705–2397, USA. ArchOphthalmol 1999 Nov;117(11):1487–95
166. The Diabetes Control and Complications Trial/Epidemiology of Diabetes Interventions andComplications Research Group. Retinopathy andnephropathy in patients with type 1 diabetes fouryears after a trial of intensive therapy. N Engl JMed 2000; 342: 381–389.
167. Vijan S, Hofer TP, Hayward RA. Cost-utility anal-ysis of screening intervals for diabetic retinopa-thy in patients with type 2 diabetes mellitus.JAMA 2000,; 283: 889–896.
168. Guidelines Subcommittee. 1999 World Health Or-ganization-International Society of Hypertensionguidelines for the management of hypertension.J Hypertens 1999; 17: 151–183.
169. The sixth report of the Joint National Committeeon Prevention, Detection, Evaluation, and Treat-ment of High Blood Pressure. Arch Intern Med1997; 157: 2413–2445
170. Stamler J, Vaccaro O, Neaton JD, Wentworth D.Diabetes, other risk factors, and 12-year cardio-vascular mortality for men screened in the Mul-tiple Risk Factor Intervention Trial. Diabetes Care1993;16:434–444.
171. Grossman E, Messerli FH. Diabetic and hyperten-sive heart disease. Ann Intern Med 1996; 125:304–310.
172. Hemmelder MH, de Zeeuw D, Gansevort RT, deJong PE. Blood pressure reduction initiates the

JOURNAL OF INSURANCE MEDICINE
102
antiproteinuric effect of ACE inhibition. KidneyInternational 1996, 49: 174–180.
173. The Heart Outcomes Prevention EvaluationStudy Investigators. Effects of an angiotensin-converting-enzyme inhibitor,ramipril, on cardio-vascular events in high risk patients. N Engl JMed January 20, 2000; 342 (3): 145–153.
174. Morrish NJ, Stevens LK, Head J, et al. A prospec-tive study of mortality among middle-aged dia-betic patients (the WHO Multinational Study ofVascular Disease in Diabetics) II: associated riskfactors. Diabetologia 1990; 33: 542–548.
175. Wang SL, Head J, Stevens L, Fuller JH. WorldHealth Organization Multinational Study Group.Excess mortality and its relation to hypertensionand proteinuria in diabetic patients: The WorldHealth Organization Multinational Study of Vas-cular Disease in Diabetes. Diabetes Care April,1996; 19 (4): 305–312.
176. Curb JD, Pressel SL, Cutler JA, et al. for the Sys-tolic Hypertension in the Elderly Program Co-operative Research Group. Effect of diuretic-based antihypertensive treatment on cardiovas-cular disease risk in older diabetic patients withisolated systolic hypertension. JAMA 1996; 276:1886–1892.
177. Staessen JA, Fagard R, Thijs L, et al. Randomiseddouble-blind comparison of placebo and activetreatment for older patients with isolated systolichypertension. Systolic Hypertension in Europe(Syst-Eur) Trial Investigators. (Effect on cardiovas-cular, cerebrovascular and overall mortality). The Lan-cet 1997; 350: 757–764.
178. Tuomilehto J, Rastenyte D, Birkenhager WH, etal: For the Systolic Hypertension in Europe TrialInvestigators. Effects of calcium-channel blockadein older patients with diabetes and systolic hy-pertension. N Engl J Med March 1999; 340 (9):677–684.
179. Mosterd A, D’Agostino RB, Silbershatz H, et al.Trends in the prevalence of hypertension, anti-hypertensive therapy, and left ventricular hyper-trophy from 1950 to 1989: Framingham HeartStudy. N Engl J Med 1999; 340: 1221–1227.
180. Hansson L, Zanchetti A, Carruthers SG, etal.Effects of intensive blood-pressure loweringand low-dose aspirin in patients with (diastolic)hypertension: Principle results of the hyperten-sion optimal treatment (HOT) randomized trial.The Lancet 1998 (June 13); 351: 1755–1761.
181. Kjeldsen SE, Hedner T, Jamerson K, et al. Hyper-tension optimal treatment (HOT) study: homeblood pressure in treated hypertensive subjects.Hypertension 1998 Apr; 31 (4): 1014–1020.
182. Tatti P, Pahor M, Byington RP, et al. Outcome re-sults of the Fosinopril versus Amlodipine cardio-vascular events randomized trial (FACET) in pa-
tients with hypertension and NIDDM. DiabetesCare 1998 April: 21 (4): 597–603.
183. Hansson L, Lindholm LH, Ekbom T, et al. Ran-domized trial of old and new antihypertensivedrugs in elderly patients. Lancet 1999; 354: 1751–1756.
184. Mostard A, D’Agostino RB, Silbershatz H, et al.National Heart, Lung, and Blood Institute’s Fra-mingham Heart Study. Trends in the prevalenceof hypertension, antihypertensive therapy, andleft ventricular hypertrophy from 1950 to 1989. NEngl J Med April 1999; 340 (16): 1221–1227.
185. Morrish NJ, Stevens LK, Head J, Fuller JH et al.A prospective study of mortality among middle-aged diabetic patients (the London cohort of theWHO Multinational Study of Vascular Disease inDiabetics)II: associated risk factors. Diabetologia1990; 33: 542–548.
186. Florkowski CM, Scott RS, Moir CL, Graham PJ.Lipid but not glycaemic parameters predict totalmortality from type 2 diabetes mellitus in Can-terbury, New Zealand. Diabet Med 1998 May; 15(5): 359.
187. American Diabetes Association consenus state-ment. Detection and management of lipid disor-ders in diabetes. Diabetes Care 1993; 16: 828.
188. Betteridge J. Diabetic dyslipidemia. The Ameri-can Journal of Medicine 1994; 96: 6A–25S.
189. Goldschmid MG, Barrett-Connor E, Edelstein SL,et al. Division of Diabetes Translation, Centers forDisease Control, Atlanta, GA. Dyslipidemia andischemic heart disease mortality among men andwomen with diabetes. Circulation 1994 Mar; 89(3): 991–997.
190. Florkowski CM, Scott RS, Moir CL, Graham PJ.Lipid but not glycaemic parameters predict totalmortality from type 2 diabetes mellitus in Can-terbury, New Zealand. Diabet Med 1998 May; 15(5): 386–92
191. Stamler J, Vaccaro O, Neaton JD, et al. Diabetes,other risk factors, and 12-yr cardiovascular mor-tality for men screened in the multiple risk factorintervention trial. Diabetes Care 1993; 16: 434–444.
192. Pyorala K, Pedersen TR, Kjekshus J, et al. Choles-terol lowering with simvastatin improves prog-nosis of diabetic patients with coronary heart dis-ease. A subgroup analysis of the ScandanavianSimvastatin Survival Study (4S). Diabetes Care1997 Apr; 20 (4): 469–471.
193. Haffner SM, Alexander CM, Cook TH et al. Re-duced coronary events in simvastatin-treated pa-tients with coronary heart disease and diabetesor impaired fasting glucose levels: subgroupanalyses in the Scandanavian Simvastatin Surviv-al Study. Arch Int Med 1999 Dec 13–27; 159 (22):2661–2667.

MILANO—DIABETES MELLITUS AND LIFE INSURANCE
103
194. Goldberg RB, Mellies MJ, Sacks FM, et al. Car-diovascular events and their reduction with pra-vastatin in diabetic and glucose-intolerant myo-cardial infarction survivors with average choles-terol levels: subgroup analyses in the cholesteroland recurrent events (CARE) trial. The CARE In-vestigators. Circulation 1998 Dec 8; 98 (23): 2513–2519.
195. American Diabetes Association. Management ofDyslipidemia in Adults With Diabetes. ClinicalPractice Recommendations 2000. Diabetes Care2000 Jan; 23, Supplement 1: 1–9.
196. Haffner SM, Lehto S, Ronnemaa T, et al: Mortal-ity from coronary heart disease in subjects withtype 2 diabetes and in nondiabetic subjects withand without prior myocardial infarction.
197. Colditz GA, Willett WC, Stampfer MJ, et al.Weight as a risk factor for clinical diabetes inwomen. Am J Epidemiol 1990 Sep; 132 (3): 501–513.
198. Higgins M, D’Agostino R, Kannell W, et al. Ben-efits and adverse effects of weight loss. Obser-vations from the Framingham Study. Nationalheart, Lung and Blood Institute, Bethesda, MD.Ann Intern Med 1993 Oct 1; 119 (7 Pt 2): 758–763.
199. Chaturvedi N, Stevens LK, Fuller JH. Mortalityand morbidity associated with body weight inpeople with IDDM. The WHO Multinational
Study of Vascular Diseases in Diabetics. DiabetesCare 1995 Jun; 18 (6): 761–765.
200. Chaturvedi N, Fuller JH. Mortality risk by bodyweight and weight change in people withNIDDM. The WHO Multinational Study of Vas-cular Disease in Diabetes. Diabetes Care 1995Jun; 18 (6): 766–774.
201. Chaturvedi N, Stephenson JM, Fuller JH, et al.The relationship between smoking and microvas-cular complications in the EURODIAB IDDMcomplications study. Diabetes Care 1995 Jun; 18(6); 785–792.
202. Lloyd CE, Stephenson J, Fuller JH, Orchard TJ. Acomparison of renal disease across two conti-nents: the epidemiology of diabetes complicationsstudy and the EURODIAB IDDM ComplicationsStudy. Craduate School of Public Health, Univer-sity of Pittsburgh, Pennsylvania, USA. DiabetesCare 1996 Mar; 19(3): 219–225.
203. Haire-Joshu D, Glasgow RE, Tibbs TL: Smokingand diabetes (Technical Review).
204. Lindegard B, Hillborn M. Associations betweenbrain infarction, diabetes and alcoholism: obser-vations from the Gothenburg population cohortstudy. Acta Neurol Scand 1987; 75: 195–200.
205. Valmadrid CT, Klein R, Moss SE, Klein BEK,Cruickshanks KJ. Alcohol Intake and the Risk ofCoronary Heart Disease Mortality in PersonsWith Older-Onset Diabetes Mellitus. JAMA 1999July 21; 282 (3): 239–246.