Dhar - New York University
21
A VALUE-CHAIN BASED PROCESS MODEL FOR SUPPORTING BUSINESS PROCESS REENGEWERING Vasant Dhar Associate Professor Department of Information Systems Leonard N. Stern School of Business New York University December 1991 This research was sponsored by IBM and was conducted while the author was a visitor at the T.J. Watson Research Center, IBM Research, Yorktown Heights, NY 10058. A nearly identical version of this paper appears as Technical Report RC 17221, IBM Research Division. Replaces: Working Paper IS-9 1-29 Working Paper Series STERN IS-9 1-42 Center for Digital Economy Research Stern School of Business Working Paper IS-91-42
Transcript of Dhar - New York University

A VALUE-CHAIN BASED PROCESS MODEL FOR SUPPORTING BUSINESS PROCESS REENGEWERING
Vasant Dhar Associate Professor
Department of Information Systems Leonard N. Stern School of Business
New York University
December 199 1
This research was sponsored by IBM and was conducted while the author was a visitor at the T.J. Watson Research Center, IBM Research, Yorktown Heights, NY 10058. A nearly identical version of this paper appears as Technical Report RC 17221, IBM Research Division.
Replaces: Working Paper IS-9 1-29
Working Paper Series STERN IS-9 1-42
Center for Digital Economy Research Stern School of Business Working Paper IS-91-42

Abstract
Constantly envisioning how the rapid developments in information technology offer new opportunities, and engineering business processes accordingly will continue to be a difficult problem for senior manage- ment. An important observation by Keen (1991) is that over the last three decades, effective use of rapidly changing technology has lagged its availability. A central problem is that of justifying the technology, measuring its business value. The value-chain model articulated by Porter (1985) is a natural candidate in providing a basis for this eval- uation. It is based on the simple economic theory that a firm remains competitive by virtue of being a low cost producer or differentiating its products/services to the customer, that is, by providing customer satisfaction. It is intuitive to think of "the customer" as the end user of a product or service. However, projecting this definition into the organization, where all pieces of work within it have a customer that needs to be satisfied provides a good basis for work design and its implementation. As technology evolves, forcing the organization to reassess its customers, the work must be redesigned. This is becoming known increasingly as "process reengineering" .
Porter's model has found widespread appeal among practitioners a t the strategic level due t o its theoretical simplicity and common- sense appeal. Several methodologies have been designed around this model that encourage executives to "think through" and identify tech- nologies that could provide competitive advantage. However, these methods have some serious limitations due to the lack of a sound conceptual underpinning and their inability to link explicitly, technol- ogy to business value metrics. Based on an analysis of one specific industry (insurance) we have found that simple process oriented mod- els such as BSP, when extended to deal with value (in terms of cost or product/service differentiation to the customer), provide a sound basis for exploring process reengineering. An implementation of this methodology should enable management to simulate how a system would "react" to various types of inputs in terms of specific metrics of interest.
Center for Digital Ecol lol~~y Research Stern School o f Business W o r h g Paper IS-91-42

1 Where Should Information Systems Plans Come From?
The problem of evaluating information technology is a difficult one for sev- eral reasons. First, for technological leaders, there are several inherent risks involved such as whether customers will accept the innovation as planned, in implementing the technology, whether followers will quickly neutralize first mover advantages, and so on. The second difficulty is that investment in information technology is a timing problem, where costs, benefits, and risks are involved over a protracted time horizon. Since there is inherent uncer- tainty associated in making these estimates, assumptions and estimates must be constantly updated. The third difficulty is that investments directed at creating a technology platform do not have payoffs that can be envisioned except in a very general way. For example, a platform that enables several future applications to share data and processing capabilities is difficult to quantify even in terms of simple metrics if the specific applications have not yet been envisioned. In fact, Keen (1991) argues that in the longer run, senior management should really focus on the platform issues and not applications since it is the former that really provide sustainable competitive advantage.
Given the inherent intractability of the evaluation problem, it is probably fruitless looking for "the best model" that measures the worth of information technology. Rather, it is probably more worthwhile developing a systematic methodology for enabling management to (1) focus on specific parts of the business which can be strengthened via technology by addressing cost drivers or enabling product/service differentiation, (2) use such a linkage to busi- ness value as a basis for comparing and prioritizing investments, (3) identify and assess the risks associated with IT investments, and (4) revise previous assumptions and estimates as uncertainty diminishes over time. We have focused on the first two goals.
The Underlying Economic Theory
The reason for the existence of an organization is that it performs a set of integrated activities more efficiently than the market (see Williamson (1980) for the theory of markets and hierarchies). Porter's notion of the "value chain" derives from this theory: if we divide a firm's activities into techno-
Center for Digital Economy Research Stern School of Business Working Paper IS-91-42

logically and economically distinct activities that are used to "create value1', this value can be measured by the amount that buyers are willing to pay for its final product or service. To be competitive, a firm must either perform these activities at a low cost or perform them in a way that leads to product differentiation (and hence premium price or value). Activities have "cost drivers" that determine the potential sources of a cost advantage. Similarly, a company's ability to differentiate itself derives from the contribution of each value activity in the chain toward fulfillment of customer needs.
In virtually any industry, information technology can be applied to the value chain at every point, transforming activities and the linkages among them (i.e. it can change the way individual or aggregate activities are per- formed).
The most common type of technology investment is targeted at the cost drivers that are the basis of the fundamental revenue generating activities of the firm. Technology may reduce costs, or as is more frequently the case, reduce the rate at which costs grow with volume by substituting a fixed cost (technology) for the variable cost such as labor which typically increases with volume. It is less frequent to come across a serious consideration of the firm's customers and their degree of satisfaction in the information systems plan- ning process. However, this is a potentially important perspective, one that enables a firm to differentiate its product in the value chain sense. Making this concept operational requires a representation that captures the flows of information and products through an organization and indicates how they contribute to value as defined from the customer's perspective.
Our specific objective is to operationalize the value chain concept to the point where it actually becomes meaningful to measure (value) business pro- cesses along criteria that are meaningful to the business, and to be able to assess specifically, how a proposed technology or organizational change can impact the values of interest at various levels of the enterprise. Our approach is to start with the customer, since this leads to focusing on the metrics that can serve as a basis for differentiation. We begin by examining the properties of process notations such as BSP and Structured Analysis and show how they should be extended in order to incorporate the value chain concept. A pro- cedure known as Business Design Technology (BDT) (Flores and Dunham (1990)) turns out to have properties that are useful in enabling this linkage.
We describe the relationship between the BDT and the value chain model shortly. In order to illustrate our methodology, we limit the analysis to one
Center for Digital Economy Research Stern School of Business W o r h g Paper IS-91-42

part of the insurance industry. We focus on the area of claims processing, which is an important core business process in the industry. It should be recognized, however, that this is itself only a limited part of the value chain.
The State of the Art
The Porter framework has led to several methodologies aimed at enabling information systems executives interested in prioritizing information tech- nology investments (Buss, 1983; McFarlan, 1984; McKenney and McFarlan, 1982; Millar, 1984; Parsons, 1983; Cash and Konsynski, 1985; Davey, 1988). The framework is used in the ISIS methodology developed by IBM which is aimed at executives interested in knowing how much and where to invest in information technology. The system combines several of the ideas pro- posed by Porter, McFarlan, Buss, Rockart, the Boston Consulting Group and others into an easy to use framework that tries to show the impacts of IT investments on financial statements.
The ISIS method involves going through five steps. The first involves an analysis of the market direction, based in large part on secondary data from Value Line, Standard and Poor's, the U.S. Industrial Outlook and A.M. Best., and an analysis of competitive forces in the industry (the bargaining power of suppliers, the bargaining power of buyers, threat of substitute products or services, and potential new entrants), The second step provides a picture on how much the firm is investing in IT reIative to the industry and its competitors. This step uses methods aimed at appraising the condition of the firm's current applications, highlighting those that are critical to the business. The third step identifies those strategic business units where the highest returns are likely. This is based on the importance of the business unit and that of IS in supporting it.
The fourth step in ISIS is aimed at prioritizing competing information technologies. This is based on the analysis performed in step 1 on market di- rection etc, critical success factors (Rockart, 1979), and estimates of benefits and doability of the applications. Finally, a detailed business case is built for the identified applications based on impacts on the bottom line. This is based on historical data and the cost and benefit projections of the chosen applications under consideration.
The major strengths of the ISIS model are twofold. First, it extracts
Center for Digital Economy Research Stern School of Business Working Paper IS-91-42

data systematically from the executive through a series of questionnaires, and uses this and secondary data to generate graphs that position the firm relative to the industry and its competitors in terms of investment and various performance parameters. Broadly speaking, this attempts to address the question "how much should we be spending on information technology"? Secondly, the process of going through the ISIS exercise forces the executive to t ry and identify those applications that are likely to yield the best returns. In other words, it addresses to some extent, the question of )'how do we get to where we want to be, given how much we can afford to spend"?
While the goals of the ISIS method are important ones, its approach has some major shortcomings. Although benchmark figures on spending compared with the competition are useful information, they can hide the im- portant details. Has a firm been investing heavily lately to catch up or is it on the verge of implementing major strategic initiatives? Or is it inefficient? Or is it simply investing inappropriately? Such questions not addressable by looking at the numbers alone. Likewise, simply forcing an executive to iden- tify useful applications completely ignores platform issues, namely, building a foundation for future applications. Specifically, trying to link all technol- ogy investments to ROI encourages an overly short term orientation towards informat ion technology. And even at the level of applications, couldn't they be better evaluated on how well they fit with the platform plans instead of on ROI? Finally, there is no explicit basis or anchor for generating the estimates, which could turn out to be off by orders of magnitude.
Keen (1991) points out that the short term orientation to IT investments is in large part an effect of the accounting system which direct costs IT expenses (including a large portion of equipment, software development costs, data resource development costs, and so on). He proposes that IT (including software resources) should be treated as capital instead of overhead. Drawing up an "IT balance sheet" shows how the hidden value of this capital can be several times that resulting from the direct costing approach. Perhaps most importantly, viewing IT investment as a cost leads to the empirically supported argument that IT does not provide real benefits to the bottom line since it rarely reduces costs (Strassman, 1985; Weill, 1989). It ignores the fact that the investment more often reduces future expenses on personnel (variable costs) associated with increased business volume rather than costs per se. In this light, more pertinent measures might therefore be "sales per employee" or "profits per employee", which Keen calls "anchor measures7'.
Center for Digital Economy Research Stern School of Business Working Paper IS-91-42

The above "anchor measures" focus largely on the benefits provided in terms of making firm operations more efficient or streamlined. In spirit, their purpose is similar to that of financial measures like ROI, but the focus is on those aspects of the business actually impacted by the technology that are not recognized by the cost accounting system. We can use these metrics for focusing on the cost drivers. In addition, we need a way to link the technology to the all important actor, the customer, and measure it in terms of how it can contribute to customer satisfaction by differentiating its product or service.
What Value Metrics Should be Used?
There are, broadly speaking, two sets of factors involved in evaluating IT investments. The first set are inherently qualitative and not amenable to measurement except in a very coarse sense. Nevertheless they define impor- tant general constraints that technology investments must satisfy. The set of risks mentioned earlier (market, technology, implementation, etc) belong to this category; while not quantifiable, one can categorize them as high or low and take steps to reduce them. In addition, certain types of platform deci- sions belong to this set. For example, Keen (1991) enumerates several policy criteria senior management must consider: ensuring that the IT base does not block a practical and important business initiative (such as the ability to link applications or expand a network), that it enables the firm to respond quickly to initiatives by competitors, to form electronic alliances, and so on. These criteria, in effect, define the constraints or boundaries within which technology must be evaluated. If a proposed technology (platform or appli- cation) violates any of them or moves the firm in a direction away from a policy criterion, there is little use in evaluating it further.
If the policy and risk criteria are satisfied, we can attempt to measure and contrast alternatives. How the technology is evaluated depends on the valuation metrics employed. Porter's model provides a good starting point for addressing this question by forcing management to articulate the sources of sustainable competitive advantage in the industry, which depend on its market structure. For example, if one analyzes the competitive forces within the insurance industry, a dominant one is the bargaining power of buyers. With increasing competition and improved access of buyers to information,
Center for Digital Economy Rerearch Stern School of Business Working Paper IS-91-42

this power is likely to increase. So, what is it that buyers want, and what metrics can be used to measure how well the need is being fulfilled? And, can this need be satisfied with low risk at a reasonable cost? Let us address this question by considering a core business function of any insurance com- pany, namely, claims processing. Assuming that two firms provide identical coverages and premiums, what makes one more competitive than the other? In other words, what are the metrics that differentiate one from the other?
There is no standard answer to address this question. One proposal calls for using "the Braudel guideline" which advocates considering "the changes in the limits of the possible in the structures of everyday life" that the new product or service makes possible (Braudel, 1985). An illustration of this concept is the phenomenal success of ATMs, contrasted with the miserable failure of home banking, a seemingly similar service. Fundamentally, the latter does not affect the limits of the possible like dispensing cash on Sundays at convenient locations. Instead, it provides extensions from everyday life, extensions that turn out to be of marginal value for most normal people.
For the purposes of our analysis, suppose that the Braudel guideline sug- gests that the main factors of interest to the customer are the following:
time taken to process a claim
the quality of information provided to the patient/client concerning the extent of coverage provided, deductibles, exclusions and so on at the time the service is rendered
Likewise, some of the metrics of interest to the insurance company could be the following:
the time taken to process various types of claims
the cost of processing various types of claims
the number of errors for the various types of claims
the extent of fraudlcreep (i.e. type I and type I1 errors)
Likewise, the metrics of interest to the service provider (doctor, garage, etc) could be similar to those of the insured.
Center for Digital Economy Research Stern School of Business Working Paper IS-91-42

In summary, let us assume that from the standpoint of the insurance com- pany, the challenge is to differentiate its service in terms of quick turnaround, accuracy, and timely information to the user, while ensuring that the pre- mium charged for a desired level of service exceeds the cost of producing it. In the next section, we describe how this criterion is operationalized.
5 A Representation for Business Processes
Loosely speaking, a firm can be decomposed into "business processes" that are responsible for carrying out the essential parts of the business. If tech- nology is to be evaluated in terms of how it impacts such processes, we need a notation for expressing such processes, and metrics for measuring them. The metrics could be a function of time, i.e. sales per empolyee could vary over time, although we ignore time in our analysis.
In designing large business systems, it is common practice to use notations that communicate effectively among members of a design team the processes of interest, the data that they require, manipulate, and generate. In addition to serving the purpose of communication, such a notation also enables a design team to proceed top-down, until detailed processes are identified for which modules of code can be written.
There are several process-oriented notations that are commonly used in the early stages of the systems development life cycle. Commonly used ones are Business Systems Planning (BSP, popularized by IBM in the early 80s; see BSP- 1984) and Structured Analysis. Both require identifying the following:
processes, which are groups of logically related decisions and activi- ties required to manage or run the business. These can be thought of as similar to Porter's "technologically or economically distinct activi- ties" that create value. At the highest level, these might be marketing, production, sales, etc. In an insurance company, these could be claims analysis, marketing support, billing, outpatient monitoring, and so on. A special type of process, often called an external en t i ty either gen- erates or receives data (i.e. does no transformation).
d a t a classes, which are data elements used by or generated by pro- cesses. Attributes of dala classes characterize what flows among the processes. Data can also reside in d a t a stores. Data flows can in turn
Center for Digital Economy Research Stern School of Business Working Paper IS-91-42

have their own attributes such as where they are generated or absorbed, the t i m e they spend between processes and so on.
input/output relationships; in BSP, these form an "Information architecture" which shows what data items are created by or required by which processes. In structured analysis, they are shown graphically.
Sample diagrams showing the above components are shown in Figures 1 and 2 (Managed-Care Manual 1990). Figire 1 is the highest level depiction of a process called claims workflow management. Figure 2 "blows up" Figure 1, showing the processes that make up the high level process. It also includes additional data flows that were "hidden" in Figure 1. These are commonly refered to as dataflow diagrams, for obvious reasons. External entities or external systems are shown as rectangles. Processes are shown as circles, and data stores or knowledge bases are shown in enclosed parallel lines (in Figure 1, sets of databases are shown using the DASD symbol).
Properties of the Process Not at ion and Required Extensions
It is clear from Figure 1 that the claims workflow management function has four objectives specified inside the circle. These are really processes at the next lower level, which can in turn be broken down into more detailed processes. In other words, objectives or functions can simply be aggregated as we move up levels.
As we proceed to the lower levels, the ambiguity between the input/output relationships vanishes (i.e. it becomes clearer which process is using which inputs, producing specific outputs, etc). If we work down to the level of detail where each process has only one output, such processes can be considered "atomic" in that the transformation they represent is unambiguous.
The process notation is excellent for communicating what actually hap- pens in a firm in terms of data flows and transformations. A complex business process can be decomposed horizontally and vertically to the extent desired. It is also independent of the method actually employed to implement it; a process could be manual, automated, or a combination. Its attributes pro- vide its description. For example, the processes described previously could have the following attributes:
Center for Digital Economy Research Stern School of Business Working Paper IS-91-42

Center for Digital Economy Research Stern School of Business Working Paper IS-91-42

Center for Digital Economy Research Stern School of Business Working Paper IS-91-42

objective
resources used: this is a list of resources such as labor, machinery (such as processors) and space. Each of these resources themselves could be further categorized as shown in Figure 5 . Each resource can have its own attributes.
total cost: this is a function defined over the resources used
processing rate: indicating the rate at which the input is processed or the output produced.
location: where the process is performed. For atomic processes this would probably be one value whereas for aggregates it would be a set.
A simple but fundamental extension we emake to the notation is to associate computable attributes with processes which can serve as an indicators of the "quality" of the process. Coming up with meaningful numbers, particularly for the higher level processes is a challenging detail. Conceptually, however, aggregated properties are a function of those of their subprocesses.
Another required extension is to enable a process flow model to indicate those processes or links that are critical in achieving the more desirable values for the metrics. For example, if transporting something from one geographic location to another involves delay, and this delay is an impediment to differ- entiation, steps must be taken to reduce the delay or to rethink the business process so that the transportation step is eliminated altogether.
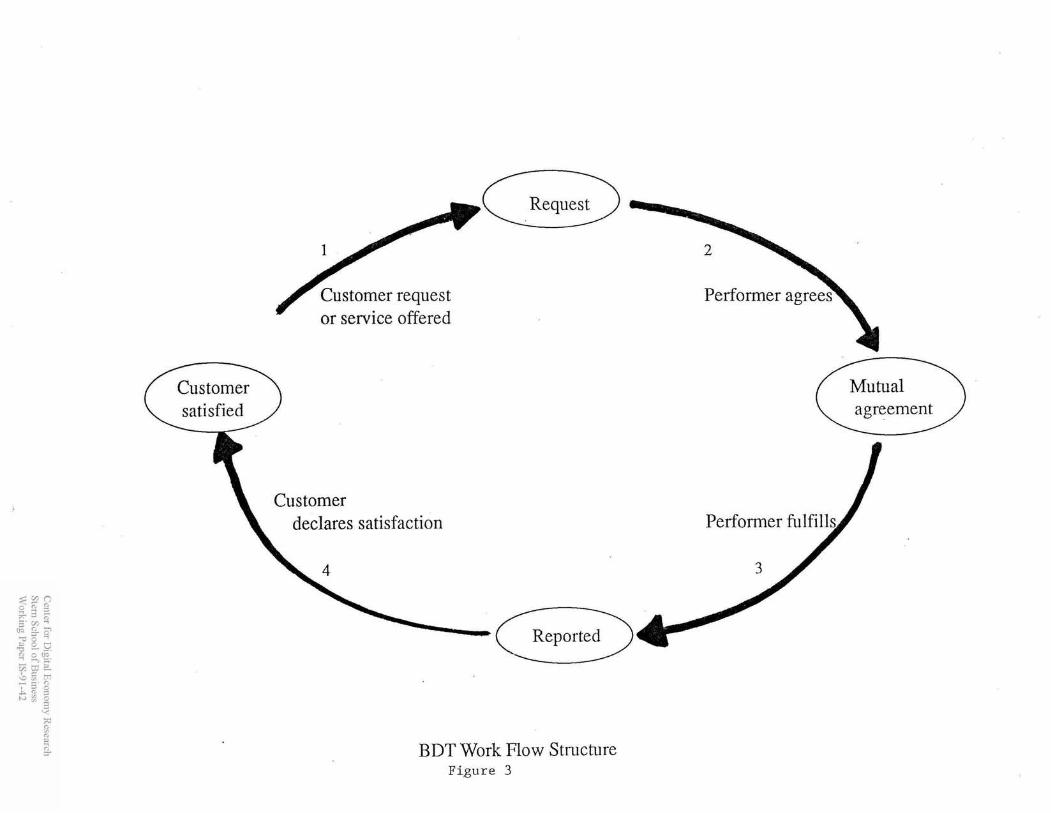
The Business Design Technology (BDT) attempts to make the customer the driving force behind business design. Motivated to some extent by speech- acts theory, it advocates representing every business process as a four part "action work flow loop" that makes explicit four states and actions that can describes a business process at any level of abstraction. Each action can be further decomposed into more detailed work flow loops as shown in Figure 3. Every process "begins" from some initial state with an action that makes a request or offers a service (leading to a "request state"). This state is "accepted" (the second action) by the performer of the service which leads to a contract or a mutual agreement state. This agreement is then fulfilled (the third action), leading to a new state where the obligation has been completed. The customer then declares satisfaction, leading back to a
Center for Digital Economy Research Stern School of Business Working Paper IS-91-42

"satisfied" state. The customer need not be an external customer. In fact, if we consider a firm's operations, it would be some individual, department, or function within the firm.
The claims function can be described in terms of the BDT model. In fact, if the processes in Figure 2 were represented with the BDT, the result would be as in Figure 4. Each process is represented in terms of the four part transition state network shown in Figure 3.
Conceptually the difference between the two notations is the following: the contents of the dataflow diagram in Figure 2, namely, the processes and links, are not based on on any principles of good business design whereas those of BDT are (at least there is an attempt to do so). One thing missing in the processes of Figure 2 is notion of a customer for each process, and because of this absence, the lack of a guideline for how to design a good process. Forcing a customer into each process forces a consideration of what quality means for that process. Conceptually, this is similar to the notion of differentiation in the value chain model, but by forcing it a micro level, it applies the concept concretely at the system implementation level. In contrast, the DFD notation places the burden of designing good processes entirely on the analyst, providing no sound guidelines for how to do so. The DFD is also silent on the coordination linkages required among the various processes. In contrast, if the work flows are represented as hierarchical, nested work loops, it also becomes possible to compute at the level of the organization of interest to the executive, coordination requirements, potential sources of delays, and ways to improve overall processing time. If metrics of interest are identified for an atomic process, these can be aggregated ("rolled up") for the higher level processes. Basically, the aggregated value is some function of the component values, where the function can be specified as part of the flow model.
The above attributes are illustrative only. The important thing to note is that we have associated values with processes and linkages. Depending on the metrics of interest, these provide a precise measure of the value of the business process. Even more importantly, it becomes possible to ag- gregate these values so that a business process can be analyzed at any level of abstraction. For example, at the highest level, the claims workflow management can be viewed as performing several functions. It might have associated with it aggregated properties such as processing rates for various types of claims (i.e. on average, 1 out of 10 health claims is routed to an
Center for Digital Economy Rerearch Stern School of Business Working Paper IS-91-42
w or service offered
Mutual agreement
declares satisfaction Pedorrner fiilfil
Reported
BDT Work Flow Structure F i g u r e 3

s .n ccl
f?
Center for Digital Economy Research Stern School of Business Working Paper IS-91-42

adjudicator for resolution whereas 1 out of 100 property claims needs ad- judication, health claims are processed at an average of 100 per day with an average fraudlcreep rate of 3 percent, property and casualty claims at 2,000 per day with a fraud rate of 1 percent, the average processing rate for all claims is 1,000 claims per day, and so on). Where do these num- bers come from? From the lower level processes that deal with the specific types of claims (in Figures 2 and 4, and from more detailed "blow ups" of its processes).
This type of functionality requires a sort of "reverse inheritance", where the attributes of a higher level object are a function of those below it. For the objective attribute, the function is simple: it is simply the set of objectives of the objectives of the processes below it. For attributes such as cost, it should be the sum of the costs of lower level processes. Other attributes such as processing time or delays can be likewise computed deterministically or probabilist ically.
How Can the Model be Used
Firstly, it would be fruitful to translate the existing process notations of an industry such as insurance as in Figures 1 and 2 into BDT based action work flow loops. This would provide the baseline model, and indicate the weak links, that is, parts that adversely affect customer satisfaction. In effect, this analysis should provide the basis for defining the IT platform and applications.
The next step would be to determine how existing processes could be "reengineered" through technology or otherwise in order to improve on the metrics that are derived from a thorough consideration of customer satis- faction. It would be worthwhile developing normatively oriented industry- specific models of business processes by industry based on the customer sat- isfaction based metrics. Of course, these process models do not specify how they can be implemented. Different implementations, based on different uses of technology should be comparable at various levels of abstraction in terms of how they impact the metrics, and the resources they require. It could be that the "ideal" level of service or quality of product requires prohibitive levels of resource investment, in which case the tradeoffs must be evaluated.
The process model also offers the ability to "simulate" the functioning of
Center for Digital Economy Research Stern School of Business Working Paper IS-91-42

Taxonomy of Resource Objects
Resource Object
Manager clerk leased owned 3381 A As400 A spaced space
claims clerk
J ~ h n Mohammad Ashoka
F i g u r e 5
Center for Digital Economy Research Stern School of Business Working Paper IS-91-42

the business processes, much in the way that a spy plane might trigger an enemy's defence systems, highlighting parts that functioned most efficiently, those that failed to react as expected, and the unexpected effects induced by the input. Inputs such as "assume that the invoice was made out incorrectly and repored by the customer" could provide an interesting simulation of the business processes, as could queries incorporating aggregated or statistical parameters, i.e. "tell me how the system would behave if 15% of the claims for over $10,000 are filled out incorrectly by the claimant". Conceptually, this is like debugging a program by testing it with a diverse range of inputs and if required, producing summary reports of its behavior. It makes sense to apply the same methods to business processes since they have a conceptually similar structure (nested loops with explicit termination conditions). In sum- mary, since the processes have a precise semantics, a meaningful simulation should be possible. Such a simulation should be viewable using a graphical user interface where processes, coordination linkages, and the value metrics associated with them change in response to different types of inputs, or by restructuring basic work flows.
Center for Digital Ecollol~~y Research Stern School of Business W o r h g Paper IS-91-42

References
[l] BSP-1984., Business Systems Planning: Information Systems Planning Guide, GE20-0527-4, IBM, July 1984.
[2] Braudel, Ferdnand., Capitalism and Civilization, Harper and Row, New York, 1985.
[3] Buss, Martin., How to Rank Computer Project, Harvard Business Re- view, Jan-Feb 1983.
141 Cash, James., and Konsynski, Benn., IS Redraws Competitive Bound- aries, Harvard Business Review, Mar- April 1985, p. 134.
[5] Davey, Tony., How to Win with Information Technology, IBM UK Cus- tomer Executive Education Facility, Hursley Park, Hampshire, 1988.
161 Flores, F., and Dunham, R., Business Design Technology, Business De- sign Associates Inc., Emeryville, CA, 1990.
[7] Gongla, P, et .al., S*P*A*R*K: A Knowledge-based system for identify- ing competitive uses of information technology, IBM Systems Journal, vo1.28, no.4, 1989, p.628.
[8] Kauffman, R., and Wright, C., Evaluating Implementation Schedules for Investments in Strategic Information Technologies: Framework and Application to EDI, Working Paper Stern 89-103, Department of In- formation Systems, Leonard N. Stern School of Business, New York University, NY NY 10003, August 1989.
191 Keen, Peter., Shaping the Future, Harvard Business School Press, 1991.
[lo] McFarlan, Warren., Information Technology Changes the Way you Com- pete, Harvard Business Review, May-June 1984, p.98.
[ll] McKenney, James., and McFarlan, Warren., The Information Archipelago: Maps and Bridges, Harvard Business Review, September- October 1982, p.109.
[12] Managed Care Application Solutions Description Working Group, IBM Confidential Report, March 1990.
Center for Digital Economy Research Stern School of Business Working Paper IS-91-42
[13] Millar, Victor., Decision-Oriented Information, Datamation, January 1984, p.159.
[14] Parsons, Gregory., Information Technology: A New Competitive Weapon, Sloan Management Review, Fall 1983, p.3.
[15] Porter, Michael., Competitive Strategy, Free Press, New York, 1980.
1161 Porter, Michael., Competitive Advantage, Free Press, New York, 1985.
[17] Rockart, John., Chief Executives Define Their Own Data Needs, Har- vard Business Review, March- April 1979, pp. 81-93.
[18] Weill, Peter., Do Computers Pay Off?, ICIT Press, Washington DC, 1991.
[19] Williamson, Oliver., Markets and Hierarchies, The Free Press, New York, 1980.
Center for Digital Economy Research Stern School of Business Working Paper IS-91-42