DGUV Statistics 2016 - Figures and long-term trends (PDF, 712...
48
DGUV Statistics 2016 Figures and long-term trends DGUV Deutsche Gesetzliche Unfallversicherung Spitzenverband
Transcript of DGUV Statistics 2016 - Figures and long-term trends (PDF, 712...
DGUV Statistics 2016Figures and long-term trends
DGUVDeutsche GesetzlicheUnfallversicherungSpitzenverband

2
DGUV Statistics 2016Current figures and long-term trends relating to theindustrial and the public sector accident insurers

3
Table of contents
Notes on tables and figures . . . . . . . . . . . . . . . . . . . . . . . . . . . . . . . . 6
Companies, hours worked, full time equivalent employees, schools and pupilsCompanies, hours worked and full time equivalent employees . 11Institutions, insureds in statutory pupil accident insurance . . . . 12Companies by size . . . . . . . . . . . . . . . . . . . . . . . . . . . . . . . . . . . . . . 14Full time equivalent employees/pupils . . . . . . . . . . . . . . . . . . . . . 16
Reportable accidentsReportable work-related accidents . . . . . . . . . . . . . . . . . . . . . . . . . 18Reportable school-related accidents . . . . . . . . . . . . . . . . . . . . . . . 19Rates of reportable work-related accidents . . . . . . . . . . . . . . . . . . 20Rates of reportable school-related accidents . . . . . . . . . . . . . . . . 21Reportable accidents at work by sector and BG . . . . . . . . . . . . . . 22Reportable accidents at school by region . . . . . . . . . . . . . . . . . . . 24Reportable commuting accidents by sector and BG . . . . . . . . . . . 25Reportable school commuting accidents by region . . . . . . . . . . . 27
New accident pensionsWork-related accidents . . . . . . . . . . . . . . . . . . . . . . . . . . . . . . . . . . 30 School-related accidents . . . . . . . . . . . . . . . . . . . . . . . . . . . . . . . . . 31 Rates of work-related accidents . . . . . . . . . . . . . . . . . . . . . . . . . . . 32 Rates of school-related accidents . . . . . . . . . . . . . . . . . . . . . . . . . . 33 Accidents at work by sector and BG . . . . . . . . . . . . . . . . . . . . . . . . 34 Accidents at school by region . . . . . . . . . . . . . . . . . . . . . . . . . . . . . 35 Commuting accidents by sector and BG . . . . . . . . . . . . . . . . . . . . . 37 School commuting accidents by region . . . . . . . . . . . . . . . . . . . . . 38
Fatal accidentsWork-related accidents . . . . . . . . . . . . . . . . . . . . . . . . . . . . . . . . . . 40 School-related accidents . . . . . . . . . . . . . . . . . . . . . . . . . . . . . . . . . 41 Accidents at work by sector and BG . . . . . . . . . . . . . . . . . . . . . . . . 43 Commuting accidents by sector and BG . . . . . . . . . . . . . . . . . . . . . 44 School-related accidents by region . . . . . . . . . . . . . . . . . . . . . . . . 45
Occupational diseases (OD)Occupational diseases as contained in the annex to the German ordinance on occupational diseases . . . . . . . . . . . . . . . . 48
Booklet produced by:Bonifatius GmbH, Druck · Buch · Verlag, Paderborn
climate-neutralclimate-neutralclimate-neutral
Basislogo
Mit Nummer
Mit Erläuterung
printed climate-neutrally
Certificate Number:
www.climatepartner.com
printed climate-neutrally
Certificate Number:
www.climatepartner.com
printed climate-neutrally
Certificate Number:
www.climatepartner.com
printed climate-neutrally
CO2 emissions of this product have been com-pensated with emission reduction certificates.
Certificate Number:www.climatepartner.com
printed climate-neutrally
CO2 emissions of this product have been com-pensated with emission reduction certificates.
Certificate Number:www.climatepartner.com
printed climate-neutrally
CO2 emissions of this product have been com-pensated with emission reduction certificates.
Certificate Number:www.climatepartner.com
printed climate-neutrally
CO2 emissions of thisproduct have been com-pensated with emissionreduction certificates.
Certificate Number:
www.climatepartner.com
printed climate-neutrally
CO2 emissions of thisproduct have been com-pensated with emissionreduction certificates.
Certificate Number:
www.climatepartner.com
printed climate-neutrally
CO2 emissions of thisproduct have been com-pensated with emissionreduction certificates.
Certificate Number:
www.climatepartner.com
printed climate-neutrally
Certificate Number:
www.climatepartner.com
Certificate Number:
climate-neutral
Certificate Number:
www.climatepartner.com
Certificate Number:
printed climate-neutrally
Certificate Number:
www.climatepartner.com
53323-1707-1010
53323-1707-1010
53323-1707-1010
53323-1707-1010
53323-1707-1010
53323-1707-101053323-1707-101053323-1707-1010
53323-1707-1010
53323-1707-1010 53323-1707-1010
53323-1707-101053323-1707-101053323-1707-1010
Tables 22 and 27 corrected on 11/06/2017

4 5
Occupational diseases as contained in the appendix of theformer GDR ordinance . . . . . . . . . . . . . . . . . . . . . . . . . . . . . . . . . . . 52 Decided cases . . . . . . . . . . . . . . . . . . . . . . . . . . . . . . . . . . . . . . . . . . 54 Occupational diseases by subgroup of disease (Summary) . . . . 56 Occupational diseases according to former GDR ordinance . . . . 58 Notification of suspected cases of OD . . . . . . . . . . . . . . . . . . . . . . 60 Recognized cases of OD . . . . . . . . . . . . . . . . . . . . . . . . . . . . . . . . . . 62 New OD pensions . . . . . . . . . . . . . . . . . . . . . . . . . . . . . . . . . . . . . . . 64 Fatalities due to OD . . . . . . . . . . . . . . . . . . . . . . . . . . . . . . . . . . . . . . 66 Notification of suspected cases of OD by BG . . . . . . . . . . . . . . . . 68 Recognized OD by BG . . . . . . . . . . . . . . . . . . . . . . . . . . . . . . . . . . . . 69 New OD pensions by BG . . . . . . . . . . . . . . . . . . . . . . . . . . . . . . . . . . 70 Long-term trends in OD . . . . . . . . . . . . . . . . . . . . . . . . . . . . . . . . . . 71
Stock of pensions . . . . . . . . . . . . . . . . . . . . . . . . . . . . . . . . . . . . . . . 74
ContributionRemuneration level used as basis for calculating contribution in the industrial sector . . . . . . . . . . . . . . . . . . . . . . . . . . . . . . . . . . . 76 Apportionment quota required of member companies in the industrial sector . . . . . . . . . . . . . . . . . . . . . . . . . . . . . . . . . . . . . . . . 77 Contribution quota required of member municipalities and affiliated companies in the public sector . . . . . . . . . . . . . . . . . . . . 78
ExpenditureCompensation . . . . . . . . . . . . . . . . . . . . . . . . . . . . . . . . . . . . . . . . . . 79 Curative treatment . . . . . . . . . . . . . . . . . . . . . . . . . . . . . . . . . . . . . . 80 Pensions . . . . . . . . . . . . . . . . . . . . . . . . . . . . . . . . . . . . . . . . . . . . . . . 81 Prevention . . . . . . . . . . . . . . . . . . . . . . . . . . . . . . . . . . . . . . . . . . . . . 83
PreventionStaff in the section of prevention . . . . . . . . . . . . . . . . . . . . . . . . . . 85Selected activities in the section of prevention . . . . . . . . . . . . . 86Consulting initiated by companies and insured persons . . . . . . . 87Occupational health and safety training seminars . . . . . . . . . . . . 88Participants in occupational health and safety training seminars . . . . . . . . . . . . . . . . . . . . . . . . . . . . . . . . . . . . . . . . . . . . . . . .89 Staff with responsibility for safety at work . . . . . . . . . . . . . . . . . 90
FiguresFig . 1: Hours worked . . . . . . . . . . . . . . . . . . . . . . . . . . . . . . . . . . .13 Fig . 2: Full time equivalent employees/pupils . . . . . . . . . . . . . .13 Fig . 3: Member companies/schools . . . . . . . . . . . . . . . . . . . . . . .15 Fig . 4: Full time equivalent employees by company size . . . . . .15 Fig . 5: Reportable workplace accidents by company size
per 1,000 full time equivalent employees . . . . . . . . . . . .17 Fig . 6: Reportable accidents at work and school per
1,000 full time equivalent employees and pupils . . . . .28 Fig . 7: Reportable work- and school-related commuting
accidents per 1,000 (weighted) insurance relation- ships and pupils . . . . . . . . . . . . . . . . . . . . . . . . . . . . . . . . .28
Fig . 8: Accidents at work and school per 1,000 full time equivalent employees and pupils - new pensions . . . . .29
Fig . 9: Work -and school-related commuting accidents per 1,000 (weighted) insurance relationships and pupils – new pensions . . . . . . . . . . . . . . . . . . . . . . . . . . . .29
Fig . 10: Fatal work- and school-related accidents . . . . . . . . . . . .46 Fig . 11: Suspected cases of occupational disease . . . . . . . . . . .72 Fig . 12: Recognized cases of OD . . . . . . . . . . . . . . . . . . . . . . . . . . 72Fig . 13: New OD pensions . . . . . . . . . . . . . . . . . . . . . . . . . . . . . . . .73 Fig . 14: Pensions . . . . . . . . . . . . . . . . . . . . . . . . . . . . . . . . . . . . . . .75 Fig . 15: Pensions . . . . . . . . . . . . . . . . . . . . . . . . . . . . . . . . . . . . . . .75 Fig . 16: Expenditure on prevention . . . . . . . . . . . . . . . . . . . . . . . .84 Fig . 17: Expenditure on compensation . . . . . . . . . . . . . . . . . . . . .84

6 7
Notes on tables and figures
General remarks
In Germany, the Gewerbliche Berufsgenossenschaften (BGs) and the Unfallversicherungsträger der öffentlichen Hand (UVTöH) are the institutions for statutory accident insurance and prevention for the industrial (BGs) and public (UVTöH) sector . The Deutsche Ge-setzliche Unfallversicherung (German Statutory Accident Insur-ance, DGUV) was been founded by the BGs and UVTöH in 2007 to support their common objectives and to serve their mutual inter-est .
Since 1969, the former central federation of the BGs, the HVBG, has published annually a booklet under the title “Arbeitsunfallstatistik für die Praxis” containing figures and long-term trends from the BG . The scope of data compiled has been extended several times over this period . Considering this development, the German title of the brochure has been changed to “BG-Statistiken für die Praxis” in 1992 . Since 1993, an English translation of the brochure has been published every year, responding to the growing interest shown in these figures abroad . Following the merger into DGUV in 2007, the statistical information of the industrial (BGs) and public (UVTöH) sector were brought together .
The material has been compiled using the many years of experi-ence gained in dealing with requests for statistical data from the BG and the UVTöH . First, the booklet contains information on the number of member companies, hours worked and persons insured . Furthermore, data on reportable and fatal accidents at work (in-cluding day care and school) and on the way to and from work as well as new accident pensions are given . A list of all occupational diseases (OD) is included as well as the number of notifications of a suspected case of OD, the recognized OD cases, new OD pen-sions and a summary of all OD cases a decision was taken on in the year under review . Finally, data on the number of pensions, the apportionment quota required of member companies, the expendi-ture of the BG and the UVTöH including that for accident preven-tion, curative treatment and pensions are provided, together with selected information on the BGs and UVTöH work in the field of accident prevention and worker protection .
The time-series normally begins in 1987 when in some areas the statistical basis used in accident insurance has been changed .
Inclusion of the new federal states in eastern GermanySince January 1, 1991, the BG and UVTöH have also been respon-sible for the new federal states in eastern Germany . Therefore these have been included in the data since 1991 . For that reason it is not possible to make any direct comparison between the figures for these years and figures for previous years . This applies in par-ticular to the frequency of new pensions awarded due to ill health: Pensions are only granted when all attempts have been made to rehabilitate the person concerned; hence in particularly serious cases in which the person is hospitalised for a long time or spends a long time in vocational retraining, a long period may elapse be-tween the accident occurring and compensation being received . In 1991 and 1992, those cases have not been compensated by cases from preceding years, leading to an artificial decrease of new pen-sion rates in these years . Since 1993, the rates are again reflecting the actual risks .In addition to this, the former GDR law on occupational diseases with its own list of recognized diseases continued to apply in the new federal states until the end of 1991 . Even after 1991, cases of occupational disease listed under former GDR law may still be recognized, as long as the insured event took place before January 1, 1992, and notification of the suspected case of the disease was made before the end of 1993 .
Introduction of the European Single Currency EuroSince introduction of the Euro on January 1, 2002, all monetary figures have been reported in Euro . To facilitate a comparison with the previous years, the figures before 2002 have been converted in €, the conversion being based on the factor 1 .95583 DM for 1 € .
MergersOn June 1, 2007, the BGs and the UVTöH merged their umbrella associations - the registered associations HVBG and BUK, the former central federation of the UVTöH, – to the Deutsche Gesetz-liche Unfallversicherung .In addition, a large number of mergers took place between the individual institutions for statutory accident insurance since the

8 9
turn of the century . The figures shown always represent the current situation at the time of the most recent reporting year for the previ-ous years, too .
Data revision
On the basis of a revision of the data base, there may be some slight differences between previous publications and publications from the year 2016 onwards .
Definition of terms
Berufsgenossenschaften (BGs): Institutions for statutory accident insurance and prevention for the industrial sector .Unfallversicherungsträger der öffentlichen Hand (UVTöH): Institu-tions for statutory accident insurance and prevention for the public sector .
Reportable accidents: – Accidents at work or on the way to or from work (commuting ac-cidents) which are either fatal or lead to an incapacity to work for more than three days .– Accidents at school1 or on the way to or from school which are either fatal or lead to medical attention .
New occupational accident pensions / new commuting accident pensions: Accidents at work or commuting accidents for which compensation was paid for the first time in the year under review either in the form of a pension, a lump-sum or a death grant .
Notification of a suspected case of occupational disease:Any notification of a suspected case of occupational disease re-ceived by the BG or UVTöH from insured persons, health insurance funds, companies or other sources, regardless of whether or not the suspicion proves justified .
Recognized occupational diseases:Of all reports of suspected occupational disease, all those cases in which it has been proved in an adjudication procedure that the person is indeed suffering from the occupational disease .For some diseases, the confirmation of the occupational causation must coincide with additional insurance conditions, e .g . some diseases must have forced the person to refrain from all activities which led or could lead to the development, aggravation or recur-rence of the illness . If such conditions are not fulfilled, a formal OD recognition is not possible . Nevertheless, extensive benefits for prevention, curative treatment and vocational help are often grant-ed in these cases .
New occupational disease pensions: Those cases of recognized occupational disease for which the insurance requirements for compensation in the form of a pension or a death grant were estab-lished for the first time in the year under review .
Full time equivalent employees (FTE): Factor used in calculating the incidence of work-related accidents . A full time equivalent employee (FTE) is defined in relation to the average annual number of actual working hours for a full time employee in industry and in services sectors and is therefore a reflection of the period of expo-sure to the risk of accidents at work .
Insurance relationship: Any relationship between an insurer and an insured person based on legal ordinance, bearing in mind that one person may have multiple insurance relationships; used as a basis for calculating the frequency of commuting accidents since every insured activity also entails the risk of a commuting acci-dent .
Apportionment quota: Surplus of the outgoings of the Berufs-genossenschaften over their incomings which, at the end of the year under review, is divided between the industrial companies .
Contribution quota: Surplus of the outgoings of the public sector accident insurers over their incomings which is shared among the insured municipality and affiliated companies following the bud-get plan before the year under review .
1 The statutory pupil accident insurance covers all children and adolescents from nursery school through university during their time at school and day care, including their way to and from school .

10 11
Compensation: All cash and non-cash benefits to those who have been injured or have become ill or to surviving dependents .
Expenditure on prevention: These are the costs for administration and coordination . The members of the professional associations themselves are obliged by law to carry out accident prevention in their business . No statistics are compiled on their expenditure but it is without doubt many times greater than the expenditure of the professional associations recorded here .
1987 2,313,818 43,312,231 26,735,947 1,620
1988 2,339,865 44,279,552 27,294,164 1,620
1989 2,384,782 44,978,295 27,929,444 1,610
1990 2,443,363 45,999,442 28,929,493 1,590
1991 2,717,863 55,478,665 34,891,275 1,590
1992 2,851,798 56,998,130 35,256,354 1,620
1993 2,948,708 54,044,726 34,842,251 1,570
1994 3,013,134 54,463,880 34,755,066 1,570
1995 3,132,124 55,933,957 35,458,516 1,570
1996 3,177,649 55,950,166 36,340,343 1,520
1997 3,263,723 55,339,481 35,946,365 1,530
1998 3,326,795 55,195,601 35,453,589 1,550
1999 3,346,331 55,712,781 35,712,028 1,560
2000 3,392,402 55,071,511 35,759,390 1,540
2001 3,383,339 54,390,728 35,549,496 1,530
2002 3,379,854 53,188,970 34,764,031 1,530
2003 3,407,108 52,643,804 34,407,718 1,530
2004 3,523,000 55,276,837 34,985,339 1,580
2005 3,614,349 54,031,845 34,415,187 1,570
2006 3,475,002 55,616,874 35,200,557 1,580
2007 3,464,587 56,908,994 35,791,823 1,590
2008 3,504,709 58,377,951 36,259,598 1,610
2009 3,669,406 57,246,629 36,462,823 1,570
2010 3,806,367 59,105,870 36,941,169 1,600
2011 3,734,454 59,586,190 37,475,591 1,590
2012 3,726,475 59,972,074 37,957,013 1,580
2013 3,775,721 60,254,613 38,873,944 1,550
2014 3,861,340 60,934,232 39,060,408 1,560
2015 3,895,441 61,861,231 39,402,061 1,570
2016 3,875,908 62,909,624 40,069,831 1,570
1 Companies, private households and assistance companies2 For definition see note on p . 9
Year Companies 1 Hours Full time FTE
worked equivalent guideline
in 1,000 employees figure 2
Table 1:
Companies, hours worked and full time equivalent employees

12 13
Year Educational institutions 1 Insureds 2
1987 57,622 12,136,518
1988 57,676 11,989,188
1989 57,864 11,908,904
1990 58,155 11,956,684
1991 67,342 14,878,096
1992 76,363 15,844,198
1993 80,158 16,153,547
1994 80,871 16,336,970
1995 82,066 16,452,524
1996 83,099 16,809,262
1997 98,049 17,539,932
1998 99,975 17,659,188
1999 100,354 17,583,620
2000 94,048 17,363,208
2001 91,112 17,444,431
2002 93,230 17,479,762
2003 94,898 17,443,636
2004 89,054 17,416,479
2005 87,795 17,373,585
2006 120,260 17,399,085
2007 120,019 17,268,114
2008 126,771 17,058,553
2009 131,026 17,072,402
2010 136,766 17,122,852
2011 140,512 17,071,776
2012 139,970 17,150,120
2013 140,891 17,155,415
2014 142,104 17,112,531
2015 142,271 17,170,607
2016 143,560 17,327,432
1 Including day care facilities2 Pupils from nursery school (including day care) through university
Table 1a:
Institutions, insureds in statutory pupil accident insurance
Figure 1: Hours worked*
Figure 2: Full time equivalent employees/pupils*
4045
35302520
10
0
15
5
1987 1990 1993 1996 1999 2002 2005 2008 2011 2014
Full time equivalent employees Pupils
* Children and adolescents from nursery school through university
Millions
70
60
50
40
20
0
30
10
* Excluding day care and school
Billions
1987 1990 1993 1996 1999 2002 2005 2008 2011 2014

14 15
Figure 3: Companies*
Figure 4: Full time equivalent employees* by company size 2016
Table 2:
Companies 1 by size in 2016
Number of companies with … FTE All com -
panies 2up to 9 10
to 4950
to 249250
to 499500
or more
Accident insurance in industrial sector
2,901,104 331,340 69,287 8,798 6,728 3,322,947
101 BG for the raw mate-rials and chemical industry
21,667 5,643 2,818 533 386 31,047
102 BG for the wood-working and metal-working industries
168,292 35,443 9,295 1,277 840 215,147
103 BG for the energy, textile, electrical and media products sectors
181,962 24,018 7,305 1,100 779 215,164
104 BG for the building trade
250,532 31,482 3,920 314 203 286,451
105 BG for the foodstuffs and catering industry
208,289 29,310 4,700 527 288 243,114
106 BG for the trade and logistics industry
325,210 41,109 9,590 979 1,015 377,903
107 BG for the Transport industry, postal logistics and tele-communications
170,888 19,406 3,676 298 193 194,944
108 BG for the adminis-trative sector
1,006,624 97,593 18,791 2,586 1,933 1,127,527
109 BG for the health and welfare services
567,640 47,336 9,192 1,184 1,091 631,650
Accident insurance in public sector (General AI 3)
8,642 8,433 4,743 1,143 1,261 24,236
Total 2,909,746 339,773 74,030 9,941 7,989 3,347,183
1 Without private households and assistance companies2 In some cases the size of companies was not available . So summing up does not always
coincide with the column3 General AI (General Accident Insurance): Public Sector accident insurance without pupil
accident insurance
in companies with up to 9 FTE: 16.2 %
in companies with 10 to 49 FTE: 19.0 %
in companies with 50 to 249 FTE: 21.0 %
in companies with 250 to 499 FTE: 9.5 %
in companies with at least 500 FTE: 34.2 %
* Full time equivalent employees (only for dependent employees, employers and non-professional construction workers)
Total number of full time equivalent employees: 35,948,783 without full time equivalent employees in companies unknown size
1987 1990 1993 1996 1999 2002 2005 2008 2011 2014
* Companies, private households, assistance companies and schools (including day care)
4.5
4.03.53.02.52.0
1.0
0.0
1.5
0.5
absolut (Mio.)

16 17
Table 3:
Full time equivalent employees/pupils
2000 2005 2010 2015 2016
Accident insurance in industrial sector
31,108,083 29,706,299 32,049,142 34,406,081 34,945,205
101 BG for the raw mate-rials and chemical industry
1,390,797 1,239,124 1,179,281 1,212,459 1,224,642
102 BG for the wood-working and metal-working industries
4,362,292 3,958,779 3,844,841 4,089,069 3,995,297
103 BG for the energy, textile, electrical and media products sectors
3,498,258 3,141,625 2,893,902 3,066,041 3,055,280
104 BG for the building trade
2,723,932 1,846,606 1,769,325 1,844,284 1,895,711
105 BG for the foodstuffs and catering industry
2,045,719 1,892,250 1,817,047 1,937,151 1,982,669
106 BG for the trade and logistics industry
3,677,160 3,698,166 3,739,645 4,488,496 4,573,506
107 BG for the Transport industry, postal logistics and tele-communications
1,709,552 1,603,974 1,669,824 1,643,065 1,662,718
108 BG for the adminis-trative sector
8,671,810 8,876,661 11,047,870 11,594,383 11,839,888
109 BG for the health and welfare services
3,028,563 3,449,114 4,087,407 4,531,133 4,715,494
Accident insurance in public sector (General AI)
4,651,307 4,708,888 4,892,027 4,995,980 5,124,626
Total 35,759,390 34,415,187 36,941,169 39,402,061 40,069,831
Pupil accident insurancePupils 17,363,208 17,373,585 17,122,852 17,170,607 17,327,432
Figure 5: Reportable occupational accidents at the workplace* per 1,000 FTE in 2015 by company size
18.7
26.2 25.3
20.4
16.9
average accident rate= 21.530
25
20
10
0
15
5
* In this case only occupational accidents at the workplace are included, since these are the only types of accident where a comparison of company size is informative. The average accident rate is therefore not identical to the accident rate shown in table 5.
companies with up to 9
FTE
companies with 10 to 49
FTE
companies with 50 to 249
FTE
companies with 250 to 499
FTE
companies with at least
500 FTE
per 1,000

18 19
Table 4:
Reportable work-related accidents– absolute figures –
Year
Accidents
at work
Commuting
accidents
Total
1987 1,384,564 183,611 1,568,175
1988 1,403,458 172,000 1,575,458
1989 1,430,279 171,127 1,601,406
1990 1,495,569 185,257 1,680,826
1991 1,817,711 240,819 2,058,530
1992 1,874,713 258,100 2,132,813
1993 1,747,574 261,528 2,009,102
1994 1,727,095 242,729 1,969,824
1995 1,651,481 264,584 1,916,065
1996 1,504,436 255,837 1,760,273
1997 1,453,100 235,983 1,689,083
1998 1,443,401 245,740 1,689,141
1999 1,421,757 244,335 1,666,092
2000 1,380,289 231,332 1,611,621
2001 1,273,478 230,336 1,503,814
2002 1,187,694 219,897 1,407,591
2003 1,032,997 199,703 1,232,700
2004 985,410 188,253 1,173,663
2005 931,932 185,146 1,117,078
2006 948,546 191,186 1,139,732
2007 959,714 167,067 1,126,781
2008 971,620 176,608 1,148,228
2009 886,122 178,590 1,064,712
2010 954,459 223,973 1,178,432
2011 919,025 188,452 1,107,477
2012 885,009 176,356 1,061,365
2013 874,514 185,667 1,060,181
2014 869,817 174,240 1,044,057
2015 866,056 179,181 1,045,237
2016 877,071 186,070 1,063,141
Table 4a:
Reportable school-related accidents – absolute figures –
Year Accidents
at school
School
commuting
accidents
Total
1987 897,810 94,137 991,947
1988 902,057 92,292 994,349
1989 884,182 89,036 973,218
1990 879,163 90,298 969,461
1991 977,129 105,920 1,083,049
1992 1,217,928 118,379 1,336,307
1993 1,289,485 126,619 1,416,104
1994 1,343,003 125,425 1,468,428
1995 1,338,643 135,707 1,474,350
1996 1,369,534 141,575 1,511,109
1997 1,439,713 148,258 1,587,971
1998 1,481,248 151,970 1,633,218
1999 1,512,084 151,280 1,663,364
2000 1,463,423 140,275 1,603,698
2001 1,441,817 141,995 1,583,812
2002 1,425,909 139,653 1,565,562
2003 1,361,305 140,254 1,501,559
2004 1,328,808 127,768 1,456,576
2005 1,290,782 124,650 1,415,432
2006 1,279,771 124,824 1,404,595
2007 1,282,464 114,510 1,396,974
2008 1,332,424 118,563 1,450,987
2009 1,250,552 115,534 1,366,086
2010 1,307,348 124,572 1,431,920
2011 1,293,653 114,157 1,407,810
2012 1,229,546 110,908 1,340,454
2013 1,212,563 112,225 1,324,788
2014 1,283,506 109,992 1,393,498
2015 1,244,577 110,200 1,354,777
2016 1,241,139 111,216 1,352,355

20 21
Table 5:
Reportable work-related accidents – per 1,000 FTE/weighted insurance relationships –
Year
Accidents at work Commuting accidents
per 1,000 weighted
insurance
relationships
Per 1,000 full
time equivalent
employees
Per one million
manhours
1987 51 .79 31 .97 6 .59
1988 51 .42 31 .70 5 .90
1989 51 .21 31 .80 5 .71
1990 51 .70 32 .51 5 .97
1991 52 .10 32 .76 6 .01
1992 53 .17 32 .89 6 .37
1993 50 .16 32 .34 6 .61
1994 49 .69 31 .71 6 .18
1995 46 .58 29 .53 6 .60
1996 41 .40 26 .89 6 .43
1997 40 .42 26 .26 5 .89
1998 40 .71 26 .15 6 .19
1999 39 .81 25 .52 6 .08
2000 38 .60 25 .06 5 .73
2001 35 .82 23 .41 5 .75
2002 34 .16 22 .33 5 .60
2003 30 .02 19 .62 5 .16
2004 28 .17 17 .83 4 .86
2005 27 .08 17 .25 4 .73
2006 26 .95 17 .06 4 .78
2007 26 .81 16 .86 4 .05
2008 26 .80 16 .64 4 .23
2009 24 .30 15 .48 4 .24
2010 25 .84 16 .15 5 .25
2011 24 .52 15 .42 4 .34
2012 23 .32 14 .76 3 .93
2013 22 .50 14 .51 4 .08
2014 22 .27 14 .27 3 .75
2015 21 .98 14 .00 3 .78
2016 21 .89 13 .94 3 .85
Table 5a:
Reportable school-related accidents– per 1,000 pupils –
Year Accidents at
school
per 1,000
pupils
School
commuting
accidents
per 1,000
pupils
All accidents
per 1,000
pupils
1987 73 .98 7 .76 81 .73
1988 75 .24 7 .70 82 .94
1989 74 .25 7 .48 81 .72
1990 73 .53 7 .55 81 .08
1991 65 .68 7 .12 72 .79
1992 76 .87 7 .47 84 .34
1993 79 .83 7 .84 87 .67
1994 82 .21 7 .68 89 .88
1995 81 .36 8 .25 89 .61
1996 81 .47 8 .42 89 .90
1997 82 .08 8 .45 90 .53
1998 83 .88 8 .61 92 .49
1999 85 .99 8 .60 94 .60
2000 84 .28 8 .08 92 .36
2001 82 .65 8 .14 90 .79
2002 81 .57 7 .99 89 .56
2003 78 .04 8 .04 86 .08
2004 76 .30 7 .34 83 .63
2005 74 .30 7 .17 81 .47
2006 73 .55 7 .17 80 .73
2007 74 .27 6 .63 80 .90
2008 78 .11 6 .95 85 .06
2009 73 .25 6 .77 80 .02
2010 76 .35 7 .28 83 .63
2011 75 .78 6 .69 82 .46
2012 71 .69 6 .47 78 .16
2013 70 .68 6 .54 77 .22
2014 75 .00 6 .43 81 .43
2015 72 .48 6 .42 78 .90
2016 71 .63 6 .42 78 .05

22 23
Table 6:
Reportable accidents at work by sector and BG– absolute figures –
Table 7:
Reportable accidents at work by sector and BG– per 1,000 FTE/pupils –
2000 2005 2010 2015 2016
Accident insurance in industrial sector
1,154,447 810,637 852,532 791,319 802,016
101 BG for the raw mate- rials and chemical industry
42,856 25,302 22,689 22,234 22,480
102 BG for the wood-working and metal-working industries
254,367 172,662 163,864 151,179 148,512
103 BG for the energy, textile, electrical and media products sectors
80,217 57,733 63,206 56,135 56,183
104 BG for the building trade
246,287 123,647 117,736 102,333 104,820
105 BG for the foodstuffs and catering industry
114,608 92,080 72,921 67,622 67,821
106 BG for the trade and logistics industry
120,002 90,615 100,417 102,766 104,722
107 BG for the Transport industry, postal logistics and tele-communications
83,337 64,375 72,679 69,935 71,986
108 BG for the adminis-trative sector
164,483 139,240 174,779 147,156 148,551
109 BG for the health and welfare services
48,290 44,983 64,241 71,959 76,941
Accident insurance in public sector (General AI)
225,842 121,295 101,927 74,737 75,055
Total 1,380,289 931,932 954,459 866,056 877,071
Pupil accident insuranceReportable accidents at school 1,463,423 1,290,782 1,307,348 1,244,577 1,241,139
2000 2005 2010 2015 2016
Accident insurance in industrial sector
37.11 27.29 26.60 23.00 22.95
101 BG for the raw mate- rials and chemical industry
30 .81 20 .42 19 .24 18 .34 18 .36
102 BG for the wood-working and metal-working industries
58 .31 43 .61 42 .62 36 .97 37 .17
103 BG for the energy, textile, electrical and media products sectors
22 .93 18 .38 21 .84 18 .31 18 .39
104 BG for the building trade
90 .42 66 .96 66 .54 55 .49 55 .29
105 BG for the foodstuffs and catering industry
56 .02 48 .66 40 .13 34 .91 34 .21
106 BG for the trade and logistics industry
32 .63 24 .50 26 .85 22 .90 22 .90
107 BG for the Transport industry, postal logistics and tele-communications
48 .75 40 .13 43 .52 42 .56 43 .29
108 BG for the adminis-trative sector
18 .97 15 .69 15 .82 12 .69 12 .55
109 BG for the health and welfare services
15 .94 13 .04 15 .72 15 .88 16 .32
Accident insurance in public sector (General AI)
48.55 25.76 20.84 14.96 14.65
Total 38.60 27.08 25.84 21.98 21.89
Pupil accident insuranceReportable accidents at school per 1,000 pupils 84.28 74.30 76.35 72.48 71.63

24 25
Table 7a:
Reportable accidents at school by region – per 1,000 pupils –
2000 2005 2010 2015 2016
Baden–Württemberg 77 .45 68 .91 70 .66 63 .22 63 .00
Bavaria 62 .42 59 .31 61 .27 64 .61 63 .74
Berlin 102 .33 88 .03 85 .93 83 .90 82 .61
Brandenburg 114 .34 91 .09 88 .47 83 .42 81 .09
Bremen 80 .24 77 .75 78 .78 66 .78 67 .46
Hamburg/ Schleswig-Holstein 1
91 .94 83 .26 78 .92 81 .02 79 .87
Hesse 71 .94 63 .00 65 .16 61 .07 61 .39
Mecklenburg- Vorpommern
117 .00 84 .22 89 .50 89 .48 88 .67
Lower Saxony 86 .32 86 .35 82 .55 83 .17 85 .23
North Rhine-Westphalia 87 .38 75 .70 85 .71 73 .00 71 .68
Rhineland-Palatinate 81 .54 76 .53 69 .84 69 .53 65 .27
Saarland 78 .53 78 .53 78 .88 69 .01 69 .45
Saxony 84 .45 71 .32 74 .93 79 .23 77 .88
Saxony-Anhalt 104 .21 81 .94 86 .19 74 .68 67 .60
Thuringia 105 .46 87 .93 87 .90 93 .71 92 .31
Total 84.28 74.30 76.35 72.48 71.63
1 Public sector accident insurance institution spanning two Länder
Table 8:
Reportable commuting accidents by sector and BG – absolute figures –
2000 2005 2010 2015 2016
Accident insurance in industrial sector
179,793 153,685 191,693 153,980 159,502
101 BG for the raw mate- rials and chemical industry
7,324 5,837 6,161 5,662 5,850
102 BG for the wood-working and metal-working industries
26,071 21,580 22,217 19,383 19,692
103 BG for the energy, textile, electrical and media products sectors
16,375 13,355 15,023 12,669 13,018
104 BG for the building trade
16,379 10,225 11,738 8,740 8,833
105 BG for the foodstuffs and catering industry
15,216 13,872 14,321 10,967 11,096
106 BG for the trade and logistics industry
25,061 20,626 25,308 22,159 22,575
107 BG for the Transport industry, postal logistics and tele-communications
7,364 7,301 8,786 7,177 7,763
108 BG for the adminis-trative sector
44,264 38,148 53,230 36,984 38,144
109 BG for the health and welfare services
21,739 22,741 34,909 30,239 32,531
Accident insurance in public sector (General AI)
51,539 31,461 32,280 25,201 26,568
Total 231,332 185,146 223,973 179,181 186,070
Pupil accident insuranceReportable school commuting accidents 140,275 124,650 124,572 110,200 111,216

26 27
Table 9:
Reportable commuting accidents by sector and BG – per 1,000 weighted insurance relationships/pupils –
Table 9a:
Reportable school commuting accidents by region– per 1,000 pupils –
2000 2005 2010 2015 2016
Baden–Württemberg
Bavaria
Berlin
Brandenburg
Bremen
Hamburg/ Schleswig-Holstein 1
Hesse
Mecklenburg- Vorpommern
Lower Saxony
North Rhine-Westphalia
Rhineland-Palatinate
Saarland
Saxony
Saxony-Anhalt
Thuringia
Total
1 Public sector accident insurance institution spanning two Länder
7 .76 5 .99 6 .14 6 .19 5 .97
7 .04 7 .22 7 .79 7 .07 6 .69
6 .15 5 .79 5 .79 4 .93 5 .34
11 .27 9 .28 7 .81 5 .84 6 .62
6 .34 8 .55 8 .42 5 .84 5 .70
8 .13 7 .79 8 .38 6 .47 6 .46
6 .45 5 .24 5 .48 4 .45 4 .34
11 .22 8 .25 6 .61 6 .39 6 .78
9 .16 8 .88 10 .24 9 .73 10 .37
8 .52 7 .05 7 .13 6 .18 6 .15
6 .40 6 .69 5 .86 6 .05 5 .42
9 .25 8 .35 8 .16 5 .48 6 .04
8 .25 7 .96 7 .14 5 .88 6 .20
9 .26 8 .56 7 .82 5 .19 5 .03
9 .64 8 .30 7 .18 6 .65 6 .61
8.08 7.17 7.28 6.42 6.42
2000 2005 2010 2015 2016
Accident insurance in industrial sector
5.09 4.51 5.13 3.75 3.82
101 BG for the raw mate- rials and chemical industry
5 .07 4 .56 5 .02 4 .01 4 .07
102 BG for the wood-work-ing and metalworking industries
5 .87 5 .24 5 .20 4 .09 4 .12
103 BG for the energy . textile . electrical and media products sectors
4 .41 3 .92 4 .12 3 .28 3 .42
104 BG for the building trade
4 .45 3 .84 4 .41 3 .18 3 .12
105 BG for the foodstuffs and catering industry
4 .43 4 .19 4 .30 3 .03 2 .99
106 BG for the trade and logistics industry
5 .95 4 .93 6 .03 4 .12 4 .11
107 BG for the Transport industry . postal logistics and telecom-munications
4 .21 4 .46 5 .16 4 .28 4 .57
108 BG for the administra-tive sector
5 .54 4 .64 5 .29 3 .52 3 .55
109 BG for the health and welfare services
4 .67 4 .36 5 .60 4 .27 4 .49
Accident insurance in public sector (General AI)
10.28 6.18 6.01 3.99 4.07
Total 5.73 4.73 5.25 3.78 3.85
Pupil accident insuranceReportable school commuting accidents per 1.000 pupils 8.08 7.17 7.28 6.42 6.42
28 29
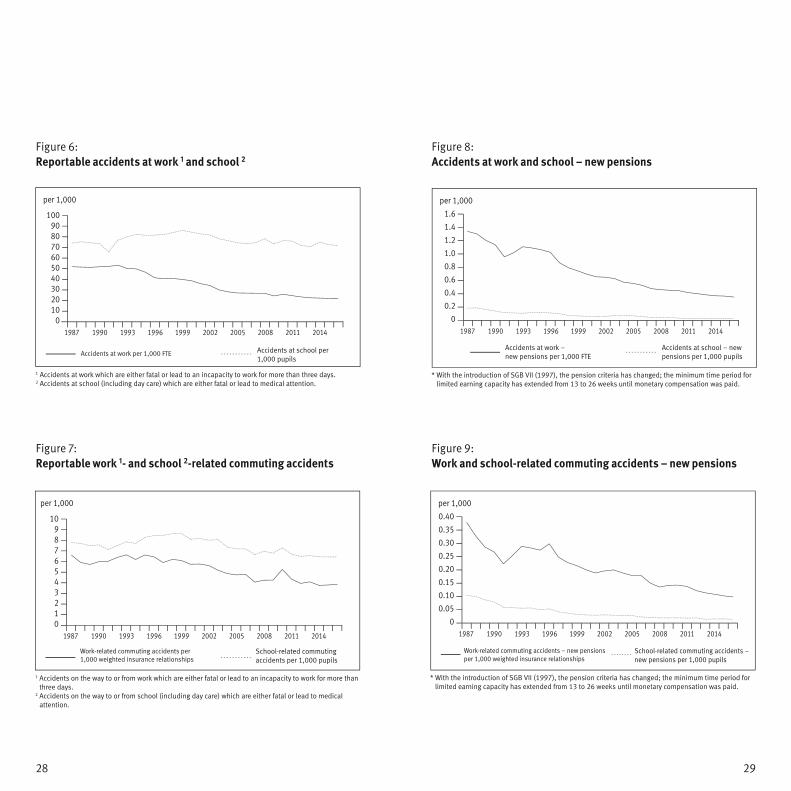
Figure 8: Accidents at work and school – new pensions
Figure 6: Reportable accidents at work 1 and school 2
Figure 7: Reportable work 1- and school 2-related commuting accidents
Figure 9: Work and school-related commuting accidents – new pensions
0.40
0
0.350.300.250.200.150.100.05
1987 1990 1993 1996 1999 2002 2005 2008 2011 2014
* With the introduction of SGB VII (1997), the pension criteria has changed; the minimum time period for limited earning capacity has extended from 13 to 26 weeks until monetary compensation was paid.
per 1,000
Work-related commuting accidents – new pensions per 1,000 weighted insurance relationships
School-related commuting accidents – new pensions per 1,000 pupils
1.6
0
1.41.21.00.80.60.40.2
1987 1990 1993 1996 1999 2002 2005 2008 2011 2014
Accidents at work – new pensions per 1,000 FTE
Accidents at school – new pensions per 1,000 pupils
* With the introduction of SGB VII (1997), the pension criteria has changed; the minimum time period for limited earning capacity has extended from 13 to 26 weeks until monetary compensation was paid.
per 1,000
1 Accidents on the way to or from work which are either fatal or lead to an incapacity to work for more than three days.
2 Accidents on the way to or from school (including day care) which are either fatal or lead to medical attention.
10
0
per 1,000
987654321
1987 1990 1993 1996 1999 2002 2005 2008 2011 2014
Work-related commuting accidents per 1,000 weighted insurance relationships
School-related commutingaccidents per 1,000 pupils
100
0
908070605040302010
1987 1990 1993 1996 1999 2002 2005 2008 2011 2014
1 Accidents at work which are either fatal or lead to an incapacity to work for more than three days.2 Accidents at school (including day care) which are either fatal or lead to medical attention.
per 1,000
Accidents at work per 1,000 FTE Accidents at school per 1,000 pupils

30 31
Table 10:
Work-related accidents – new pensions 1
– absolute figures –
Year
Accidents
at work
Commuting
accidents
Total
1987 35,888 10,570 46,458
1988 35,634 9,541 45,175
1989 33,704 8,560 42,264
1990 33,016 8,289 41,305
1991 2 33,458 8,919 42,377
1992 2 35,986 10,294 46,280
1993 2 38,736 11,426 50,162
1994 37,983 11,093 49,076
1995 37,809 11,001 48,810
1996 37,368 11,876 49,244
1997 3 31,243 9,928 41,171
1998 28,136 9,031 37,167
1999 26,687 8,652 35,339
2000 24,903 8,082 32,985
2001 23,403 7,533 30,936
2002 22,667 7,684 30,351
2003 21,734 7,718 29,452
2004 20,135 7,292 27,427
2005 19,237 7,001 26,238
2006 18,639 7,142 25,781
2007 17,171 6,170 23,341
2008 16,823 5,629 22,452
2009 16,590 5,944 22,534
2010 16,564 6,076 22,640
2011 15,740 5,951 21,691
2012 15,344 5,449 20,793
2013 14,990 5,146 20,136
2014 14,540 4,997 19,537
2015 14,460 4,809 19,269
2016 14,132 4,716 18,848
1 Serious cases for which a pension, lump-sum payment or death grant was paid for the first time in the year under review
2 See note on p . 7 for interpretation 3 With the introduction of SGB VII (1997), the pension criteria has changed; the minimum
time period for limited earning capacity has extended from 13 to 26 weeks until monetary compensation was paid
Table 10a:
School-related accidents – new pensions 1
– absolute figures –
Year
Accidents
at school
School
commuting
accidents
Total
1987 2,265 1,255 3,520
1988 2,272 1,189 3,461
1989 1,961 1,034 2,995
1990 1,710 935 2,645
1991 2 1,762 873 2,635
1992 2 1,806 899 2,705
1993 2 1,764 893 2,657
1994 1,944 915 2,859
1995 1,935 810 2,745
1996 1,926 882 2,808
1997 3 1,784 725 2,509
1998 1,333 644 1,977
1999 1,204 552 1,756
2000 1,107 512 1,619
2001 1,074 498 1,572
2002 1,081 520 1,601
2003 1,276 500 1,776
2004 1,288 459 1,747
2005 1,209 469 1,678
2006 1,021 390 1,411
2007 799 339 1,138
2008 733 311 1,044
2009 751 314 1,065
2010 619 317 936
2011 505 303 808
2012 601 315 916
2013 542 230 772
2014 472 244 716
2015 541 248 789
2016 479 228 707
1 Serious cases for which a pension, lump-sum payment or death grant was paid for the first time in the year under review
2 See note on p . 7 for interpretation 3 With the introduction of SGB VII (1997), the pension criteria has changed; the minimum
time period for limited earning capacity has extended from 13 to 26 weeks until monetary compensation was paid

32 33
Table 11:
Work-related accidents – new pensions– per 1,000 FTE/weighted insurance relationships –
Year Accidents at work Commuting
accidents per 1,000
weighted insurance
relationshipsPer 1,000 full
time equivalent
employees
Per one million
hours worked
1987 1 .342 0 .829 0 .379
1988 1 .306 0 .805 0 .327
1989 1 .207 0 .749 0 .286
1990 1 .141 0 .718 0 .267
1991 1 0 .959 0 .603 0 .223
1992 1 1 .021 0 .631 0 .254
1993 1 1 .112 0 .717 0 .289
1994 1 .093 0 .697 0 .282
1995 1 .066 0 .676 0 .274
1996 1 .028 0 .668 0 .298
1997 2 0 .869 0 .565 0 .248
1998 0 .794 0 .510 0 .227
1999 0 .747 0 .479 0 .215
2000 0 .696 0 .452 0 .200
2001 0 .658 0 .430 0 .188
2002 0 .652 0 .426 0 .196
2003 0 .632 0 .413 0 .200
2004 0 .576 0 .364 0 .188
2005 0 .559 0 .356 0 .179
2006 0 .530 0 .335 0 .178
2007 0 .480 0 .302 0 .150
2008 0 .464 0 .288 0 .135
2009 0 .455 0 .290 0 .141
2010 0 .448 0 .280 0 .142
2011 0 .420 0 .264 0 .137
2012 0 .404 0 .256 0 .121
2013 0 .386 0 .249 0 .113
2014 0 .372 0 .239 0 .108
2015 0 .367 0 .234 0 .102
2016 0 .353 0 .225 0 .098
1 See note on p . 7 for interpretation2 With the introduction of SGB VII (1997), the pension criteria has changed; the minimum
time period for limited earning capacity has extended from 13 to 26 weeks until monetary compensation was paid
Year Accidents at
school
per 1,000
pupils
School
commuting
accidents
per 1,000
pupils
All accidents
per
1,000 pupils
1987 0 .187 0 .103 0 .290
1988 0 .190 0 .099 0 .289
1989 0 .165 0 .087 0 .251
1990 0 .143 0 .078 0 .221
1991 1 0 .118 0 .059 0 .177
1992 1 0 .114 0 .057 0 .171
1993 1 0 .109 0 .055 0 .164
1994 0 .119 0 .056 0 .175
1995 0 .118 0 .049 0 .167
1996 0 .115 0 .052 0 .167
1997 2 0 .102 0 .041 0 .143
1998 0 .075 0 .036 0 .112
1999 0 .068 0 .031 0 .100
2000 0 .064 0 .029 0 .093
2001 0 .062 0 .029 0 .090
2002 0 .062 0 .030 0 .092
2003 0 .073 0 .029 0 .102
2004 0 .074 0 .026 0 .100
2005 0 .070 0 .027 0 .097
2006 0 .059 0 .022 0 .081
2007 0 .046 0 .020 0 .066
2008 0 .043 0 .018 0 .061
2009 0 .044 0 .018 0 .062
2010 0 .036 0 .019 0 .055
2011 0 .030 0 .018 0 .047
2012 0 .035 0 .018 0 .053
2013 0 .032 0 .013 0 .045
2014 0 .028 0 .014 0 .042
2015 0 .032 0 .014 0 .046
2016 0 .028 0 .013 0 .041
1 See note on p . 7 for interpretation2 With the introduction of SGB VII (1997), the pension criteria has changed; the minimum
time period for limited earning capacity has extended from 13 to 26 weeks until monetary compensation was paid
Table 11a:
School-related accidents – new pensions– per 1,000 pupils –

34 35
Table 12:
Accidents at work – new pensions by sector and BG – absolute figures –
Table 12a:
Accidents at school –new pensions by region – absolute figures –
2000 2005 2010 2015 2016
Baden–Württemberg 93 109 47 65 47
Bavaria 111 102 141 57 53
Berlin 88 40 13 9 16
Brandenburg 98 57 37 13 15
Bremen 9 5 2 1 4
Hamburg/ Schleswig-Holstein 1
36 31 25 13 15
Hesse 75 42 35 39 37
Mecklenburg- Vorpommern
26 15 10 2 7
Lower Saxony 78 44 70 48 35
North Rhine-Westphalia 297 454 140 212 162
Rhineland-Palatinate 21 29 17 26 12
Saarland 13 9 9 0 4
Saxony 38 132 40 33 40
Saxony-Anhalt 70 43 15 17 17
Thuringia 54 97 18 6 15
Total 1,107 1,209 619 541 479
1 Public sector accident insurance institution spanning two Länder
2000 2005 2010 2015 2016
Accident insurance in industrial sector
22,844 17,494 15,336 13,362 13,092
101 BG for the raw mate- rials and chemical industry
1,344 1,003 774 591 603
102 BG for the wood-working and metal-working industries
4,128 3,000 2,578 2,086 1,975
103 BG for the energy, textile, electrical and media products sectors
1,698 1,567 1,491 1,151 1,105
104 BG for the building trade
5,819 3,419 2,518 2,681 2,605
105 BG for the foodstuffs and catering industry
1,609 1,228 1,039 722 759
106 BG for the trade and logistics industry
2,620 2,154 1,899 1,575 1,561
107 BG for the Transport industry, postal logistics and tele-communications
2,338 1,825 1,680 1,391 1,368
108 BG for the adminis-trative sector
2,374 2,298 2,380 2,273 2,276
109 BG for the health and welfare services
914 1,000 977 892 840
Accident insurance in public sector (General AI)
2,059 1,743 1,228 1,098 1,040
Total 24,903 19,237 16,564 14,460 14,132
Pupil accident insuranceAccidents at school – new pensions 1,107 1,209 619 541 479

36 37
Table 13:
Accidents at work – new pensions by sector and BG – per 1,000 FTE/pupils –
Table 14:
Commuting accidents – new pensions by sector and BG– absolute figures –
2000 2005 2010 2015 2016
Accident insurance in industrial sector
0.734 0.589 0.479 0.388 0.375
101 BG for the raw mate- rials and chemical industry
0 .966 0 .809 0 .656 0 .487 0 .492
102 BG for the wood-working and metal-working industries
0 .946 0 .758 0 .671 0 .510 0 .494
103 BG for the energy, textile, electrical and media products sectors
0 .485 0 .499 0 .515 0 .375 0 .362
104 BG for the building trade
2 .136 1 .852 1 .423 1 .454 1 .374
105 BG for the foodstuffs and catering industry
0 .787 0 .649 0 .572 0 .373 0 .383
106 BG for the trade and logistics industry
0 .713 0 .582 0 .508 0 .351 0 .341
107 BG for the Transport industry, postal logistics and tele-communications
1 .368 1 .138 1 .006 0 .847 0 .823
108 BG for the adminis-trative sector
0 .274 0 .259 0 .215 0 .196 0 .192
109 BG for the health and welfare services
0 .302 0 .290 0 .239 0 .197 0 .178
Accident insurance in public sector (General AI)
0.443 0.370 0.251 0.220 0.203
Total 0.696 0.559 0.448 0.367 0.353
Pupil accident insuranceAccidents at school – new pensions per 1,000 pupils 0.064 0.070 0.036 0.032 0.028
2000 2005 2010 2015 2016
Accident insurance in industrial sector
7,020 6,153 5,334 4,187 4,130
101 BG for the raw mate- rials and chemical industry
387 316 245 188 217
102 BG for the wood-working and metal-working industries
1,194 933 787 629 585
103 BG for the energy, textile, electrical and media products sectors
774 698 588 430 412
104 BG for the building trade
769 462 385 291 271
105 BG for the foodstuffs and catering industry
579 488 409 328 271
106 BG for the trade and logistics industry
1,011 979 732 589 583
107 BG for the Transport industry, postal logistics and telecom-munications
307 270 225 158 145
108 BG for the administra-tive sector
1,186 1,108 1,141 925 920
109 BG for the health and welfare services
813 899 822 649 726
Accident insurance in public sector (General AI)
1,062 848 742 622 586
Total 8,082 7,001 6,076 4,809 4,716
Pupil accident insuranceSchool commuting accidents – new pensions 512 469 317 248 228

38 39
Table 14a:
School commuting accidents – new pensions by region– absolute figures –
2000 2005 2010 2015 2016
Baden–Württemberg 54 57 43 38 38
Bavaria 68 44 55 36 32
Berlin 20 9 6 2 4
Brandenburg 34 18 14 6 10
Bremen 6 1 3 1 -
Hamburg/ Schleswig-Holstein 1
21 19 9 10 9
Hesse 33 32 19 18 19
Mecklenburg- Vorpommern
16 8 3 1 3
Lower Saxony 30 41 49 45 29
North Rhine-Westphalia 120 133 56 61 50
Rhineland-Palatinate 27 14 13 4 3
Saarland 7 5 4 1 2
Saxony 22 42 25 12 23
Saxony-Anhalt 31 24 9 10 3
Thuringia 23 22 9 3 3
Total 512 469 317 248 228
1 Public sector accident insurance institution spanning two Länder
Table 15:
Commuting accidents – new pensions by sector and BG– per 1,000 weighted insurance relationships/pupils –
2000 2005 2010 2015 2016
Accident insurance in industrial sector
0.199 0.181 0.143 0.102 0.099
101 BG for the raw mate- rials and chemical industry
0 .268 0 .247 0 .200 0 .133 0 .151
102 BG for the wood-working and metal-working industries
0 .269 0 .226 0 .184 0 .133 0 .122
103 BG for the energy, textile, electrical and media products sectors
0 .208 0 .205 0 .161 0 .111 0 .108
104 BG for the building trade
0 .209 0 .173 0 .145 0 .106 0 .096
105 BG for the foodstuffs and catering industry
0 .168 0 .147 0 .123 0 .091 0 .073
106 BG for the trade and logistics industry
0 .240 0 .234 0 .175 0 .110 0 .106
107 BG for the Transport industry, postal logistics and tele-communications
0 .176 0 .165 0 .132 0 .094 0 .085
108 BG for the adminis-trative sector
0 .149 0 .135 0 .113 0 .088 0 .086
109 BG for the health and welfare services
0 .174 0 .172 0 .132 0 .092 0 .100
Accident insurance in public sector (General AI)
0.212 0.167 0.138 0.098 0.090
Total 0.200 0.179 0.142 0.102 0.098
Pupil accident insuranceSchool commuting accidents – new pensions per 1,000 pupils 0.029 0.027 0.019 0.014 0.013

40 41
Table 16:
Fatal work-related accidents– absolute figures –
Year Accidents at work Commuting
accidents
Total
1987 1,168 706 1,874
1988 1,242 730 1,972
1989 1,185 728 1,913
1990 1,208 694 1,902
1991 1 1,160 713 1,873
1992 1 1,443 884 2,327
1993 1 1,543 921 2,464
1994 2 1,372 928 2,300
1995 1,326 911 2,237
1996 1,273 822 2,095
1997 1,119 857 1,976
1998 1,040 780 1,820
1999 1,070 830 1,900
2000 918 794 1,712
2001 870 743 1,613
2002 857 659 1,516
2003 821 680 1,501
2004 714 560 1,274
2005 656 552 1,208
2006 711 535 1,246
2007 619 503 1,122
2008 572 458 1,030
2009 456 362 818
2010 519 367 886
2011 498 394 892
2012 500 386 886
2013 455 317 772
2014 483 322 805
2015 470 348 818
2016 424 311 735
1 See note on p . 7 for interpretation2 1993 and earlier: new fatal accident pensions
Since 1994: death with the year under review and within 30 days following the accident
Table 16a:
Fatal school-related accidents– absolute figures –
Year Accidents
at school
School
commuting
accidents
Total
1987 21 112 133
1988 19 106 125
1989 19 69 88
1990 6 65 71
1991 1 14 75 89
1992 1 16 114 130
1993 1 14 91 105
1994 2 13 112 125
1995 25 107 132
1996 18 115 133
1997 20 120 140
1998 18 119 137
1999 22 120 142
2000 19 93 112
2001 14 106 120
2002 14 97 111
2003 13 121 134
2004 6 79 85
2005 9 72 81
2006 11 54 65
2007 5 57 62
2008 8 68 76
2009 14 45 59
2010 6 50 56
2011 7 70 77
2012 8 48 56
2013 6 37 43
2014 6 36 42
2015 21 40 61
2016 10 31 41
1 See note on p . 7 for interpretation2 1993 and earlier: new fatal accident pensions
Since 1994: death with the year under review and within 30 days following the accident

42 43
Table 17:
Fatal work-related accidents– per 1,000 FTE/weighted insurance relationships –
Year
Accidents at work Commuting
accidents per 1,000
weighted insurance
relationshipsPer 1,000 full
time equivalent
employees
Per one million
hours worked
1987 0 .044 0 .027 0 .025
1988 0 .046 0 .028 0 .025
1989 0 .042 0 .026 0 .024
1990 0 .042 0 .026 0 .022
1991 1 0 .033 0 .021 0 .018
1992 1 0 .041 0 .025 0 .022
1993 1 0 .044 0 .028 0 .023
1994 2 0 .039 0 .025 0 .024
1995 0 .037 0 .024 0 .023
1996 0 .035 0 .023 0 .021
1997 0 .031 0 .020 0 .021
1998 0 .029 0 .019 0 .020
1999 0 .030 0 .019 0 .021
2000 0 .026 0 .017 0 .020
2001 0 .024 0 .016 0 .019
2002 0 .025 0 .016 0 .017
2003 0 .024 0 .016 0 .018
2004 0 .020 0 .013 0 .014
2005 0 .019 0 .012 0 .014
2006 0 .020 0 .013 0 .013
2007 0 .017 0 .011 0 .012
2008 0 .016 0 .010 0 .011
2009 0 .013 0 .008 0 .009
2010 0 .014 0 .009 0 .009
2011 0 .013 0 .008 0 .009
2012 0 .013 0 .008 0 .009
2013 0 .012 0 .008 0 .007
2014 0 .012 0 .008 0 .007
2015 0 .012 0 .008 0 .007
2016 0 .011 0 .007 0 .006
1 See note on p . 7 for interpretation 2 1993 and earlier: new fatal accident pensions
Since 1994: death with the year under review and within 30 days following the accident
Table 18:
Fatal accidents at work by sector and BG – absolute figures –
2000 2005 2010 2015 2016
Accident insurance in industrial sector
831 589 493 428 393
101 BG for the raw mate- rials and chemical industry
39 28 23 24 23
102 BG for the wood-working and metal-working industries
93 90 51 52 46
103 BG for the energy, textile, electrical and media products sectors
66 52 34 25 33
104 BG for the building trade
189 113 103 86 73
105 BG for the foodstuffs and catering industry
52 23 23 14 7
106 BG for the trade and logistics industry
91 64 59 33 39
107 BG for the Transport industry, postal logistics and tele-communications
205 133 117 103 83
108 BG for the adminis-trative sector
75 70 70 75 82
109 BG for the health and welfare services
21 16 13 16 7
Accident insurance in public sector (General AI)
87 67 26 42 31
Total 918 656 519 470 424
Fatal accidents at school 19 9 6 21 10
44 45
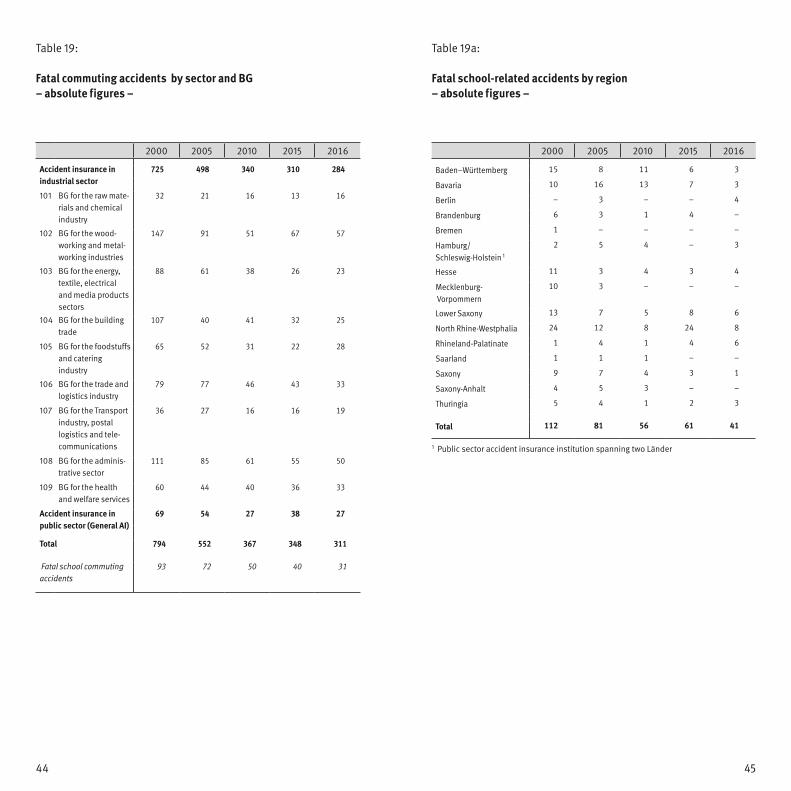
Table 19:
Fatal commuting accidents by sector and BG– absolute figures –
Table 19a:
Fatal school-related accidents by region– absolute figures –
2000 2005 2010 2015 2016
Baden–Württemberg 15 8 11 6 3
Bavaria 10 16 13 7 3
Berlin – 3 – – 4
Brandenburg 6 3 1 4 –
Bremen 1 – – – –
Hamburg/ Schleswig-Holstein 1
2 5 4 – 3
Hesse 11 3 4 3 4
Mecklenburg- Vorpommern
10 3 – – –
Lower Saxony 13 7 5 8 6
North Rhine-Westphalia 24 12 8 24 8
Rhineland-Palatinate 1 4 1 4 6
Saarland 1 1 1 – –
Saxony 9 7 4 3 1
Saxony-Anhalt 4 5 3 – –
Thuringia 5 4 1 2 3
Total 112 81 56 61 41
1 Public sector accident insurance institution spanning two Länder
2000 2005 2010 2015 2016
Accident insurance in industrial sector
725 498 340 310 284
101 BG for the raw mate- rials and chemical industry
32 21 16 13 16
102 BG for the wood-working and metal-working industries
147 91 51 67 57
103 BG for the energy, textile, electrical and media products sectors
88 61 38 26 23
104 BG for the building trade
107 40 41 32 25
105 BG for the foodstuffs and catering industry
65 52 31 22 28
106 BG for the trade and logistics industry
79 77 46 43 33
107 BG for the Transport industry, postal logistics and tele-communications
36 27 16 16 19
108 BG for the adminis-trative sector
111 85 61 55 50
109 BG for the health and welfare services
60 44 40 36 33
Accident insurance in public sector (General AI)
69 54 27 38 27
Total 794 552 367 348 311
Fatal school commuting accidents
93 72 50 40 31

46 47
Figure 10: Fatal accidents
1,600
0
1,4001,2001,000
800600400200
1987 1990 1993 1996 1999 2002 2005 2008 2011 2014
Fatal accidents at work
Absolute
Fatal work-related commuting accidents
Fatal school-relatedaccidents
* see note on p. 7 for interpretation

48 49
No . Occupational diseases
Table 20a:
Occupational Diseases as contained in the annex to the Germanordinance on occupational diseases
1 Diseases caused by chemical agents 11 Metals and metalloids1101 Diseases caused by lead or its compounds1102 Diseases caused by mercury or its compounds1103 Diseases caused by chromium or its compounds1104 Diseases caused by cadmium or its compounds1105 Diseases caused by manganese or its compounds1106 Diseases caused by thallium or its compounds1107 Diseases caused by vanadium or its compounds1108 Diseases caused by arsenic or its compounds1109 Diseases caused by phosporus or its inorganic compounds1110 Diseases caused by beryllium or its compounds 12 Asphyxiating gases1201 Diseases caused by carbon monoxide1202 Diseases caused by hydrogen sulphide 13 Solvents, pesticides and other chemical agents1301 Mucosal changes, cancer or other neoplasms of the urinary
tract caused by aromatic amines1302 Diseases caused by halogenated hydrocarbons1303 Diseases caused by benzene and its homologues or by styre-
ne 1304 Diseases caused by nitro or amino compounds of benzene or
its homologues or their derivatives1305 Diseases caused by carbon disulphide1306 Diseases caused by methyl alcohol (methanol)1307 Diseases caused by organic phosphorus compounds1308 Diseases caused by fluorine or its compounds1309 Diseases caused by nitric acid esters1310 Diseases caused by halogenated alkyl oxide, aryl oxide or
alkyl aryl oxide1311 Diseases caused by halogenated alkyl sulphide, aryl sulphide
or alkyl aryl sulphide1312 Dental diseases caused by acids1313 Lesions to the cornea of the eye caused by benzoquinone1314 Diseases caused by para-tertiary-butylphenol1315 Diseases caused by isocyanates 11316 Liver diseases caused by dimethyl formamide1317 Polyneuropathy or encephalopathy caused by organic sol-
vents or their mixtures1318 Diseases of blood, blood generating and lymphatic system
caused by Benzol
No . Occupational diseases
1319 Laryngeal cancer caused by intensive and multiyear exposure to mists and vapours from sulphuric acid 2
2 Diseases caused by physical impact 21 Mechanical impact 2101 Diseases of the tendon sheaths or diseases of the peritendi-
nous tissue or of the insertions of tendons or muscles 12102 Meniscus lesions caused by excessive physical load on the
knee joints either sustained or repeated over several years 2103 Diseases caused by vibration during work with pneumatic or
similar tools or machines2104 Circulatory disturbances of the hands caused by vibration 12105 Chronic diseases of the mucous bursae caused by constant
pressure2106 Pressure-induced nerve damage2107 Strain fracture of the spinous processes 2108 Disc-related diseases of the lumbar spine caused by the lifting
or carrying of heavy loads over many years or by performance of work in an extremely bent posture over many years 1
2109 Disc-related diseases of the cervical spine caused by the carrying of heavy loads on the shoulder over many years 1
2110 Disc-related diseases of the lumbar spine caused by the pre-dominately vertical impact of whole-body vibration in a sea-ted position over many years 1
2111 Excessive dental abrasion caused by silica dust exposure over several years
2112 Osteoarthritis of the knee caused by kneeling or comparable knee straining activities with a cumulative exposure period in the whole working life at least of 13,000 hours and a mini-mum exposure time per shift of 1 hour
2113 Pressure damage of the median nerve in the carpal tunnel (carpal tunnel syndrome) by repetitive manual tasks with bending and stretching of the wrist, by elevated effort of hands, or by hand-arm-vibration 2
2114 Vascular damage of the hand by percussion-like force effect (Hypothenar Hammer Syndrome and Thenar Hammer Syndrome) 2
22 Compressed air2201 Diseases caused by work in compressed air 23 Noise2301 Hearing impairment caused by noise
1 see footnote on p . 512 Since January 1, 2015: added to the annex to the German ordinance on occupational
diseases
1 see footnote on p . 512 Since January 1, 2015: added to the annex to the German ordinance on occupational
diseases

50 51
No . Occupational diseases
24 Radiation2401 Cataract caused by heat radiation2402 Diseases caused by ionizing radiation
3 Diseases caused by infectious agents or parasites including tropical diseases
3101 Infectious diseases in cases where the insured person worked in health care, welfare or laboratories or was particu-larly exposed to a similar risk of infection in the context of another activity
3102 Diseases transmitted to humans by animals3103 Miner's vermination caused by Ancylostoma duodenale (an-
cylostomiasis) or Strongyloides stercoralis (strongyloidiasis)3104 Tropical diseases, typhus
4 Diseases of the respiratory tract, lungs, pleura and peri-toneum41 Diseases caused by inorganic dust
4101 Silicosis4102 Silicosis combined with active pulmonary tuberculosis (sili-
cotuberculosis)4103 Asbestosis or diseases of the pleura caused by asbestos dust4104 Lung or larynx cancer
– combined with asbestosis– combined with diseases of the pleura caused by asbestos
dust or– if there is evidence of cumulative exposure to asbestos
dust in the workplace of at least 25 fibre years {25*106 [(fibre/m3) * years]}
4105 Mesothelioma of the pleura, the peritoneum or the pericardi-um caused by asbestos
4106 Diseases of the lower respiratory tract and the lungs caused by aluminium or its compounds
4107 Pulmonary fibrosis caused by metallic powder present in the production or processing of hard metals
4108 Diseases of the lower respiratory tract and the lungs caused by dust from basic slag (Thomas phosphate)
4109 Malignant neoplasms of the respiratory tract and the lungs caused by nickel or its compounds
4110 Malignant neoplasms of the respiratory tract and the lungs caused by crude coke oven gas
4111 Chronic obstructive bronchitis or emphysema in under-ground hard coal miners if there is evidence of exposure to a cumulative dose of generally 100 fine dust years [(mg/m3) * years]
4112 Lung cancer caused by silica dust where there is accompany-ing silicosis or silicotuberculosis
4113 Lung cancer caused by polycyclic aromatic hydrocarbons if there is evidence of exposure to a cumulative dose of gene-rally 100 Benzo[a]pyren years [(µg/m3) x years]
4114 Lung cancer caused by simultaneous exposure to asbestos fiber dust and polycyclic aromatic hydrocarbons if there is evidence of exposure to a cumulative dose corresponding to a causative probability of at least 50 % according to annex 2
4115 Lung fibrosis caused by extreme and longlasting exposure to welding fumes and gases (Siderofibrosis) 42 Diseases caused by organic dust
4201 Exogenic allergic alveolitis4202 Diseases of the lower respiratory tract and the lungs caused
by raw cotton, raw flax or raw hemp dust (byssinosis)4203 Adenocarcinoma of the nasal cavaties and sinuses caused by
beech or oak wood dust43 Obstructive diseases of the respiratory tract
4301 Obstructive diseases of the respiratory tract (including rhino-pathy) caused by allergic agents 1
4302 Obstructive diseases of the respiratory tract caused by che-mical irritants or agents with a toxic effect 15 Skin diseases
5101 Severe or recurrent skin diseases 15102 Skin cancer or skin alterations showing a cancerous tenden-
cy caused by soot, paraffin sludge, tar, anthracene, pitch or similar substances
5103 Squamous cell carcinoma or multiple actinic keratosis of the skin caused by natural ultraviolet irradiation 26 Diseases caused by other factors
6101 Miner´s nystagmus
No . Occupational diseases
1 These diseases must be so severe as to have forced the person to discontinue all activi-ties that caused or could cause the development, worsening or recurrence of the disease
2 Since January 1, 2015: added to the annex to the German ordinance on occupational diseases
1 see footnote on p . 512 Since January 1, 2015: added to the annex to the German ordinance on occupational
diseases
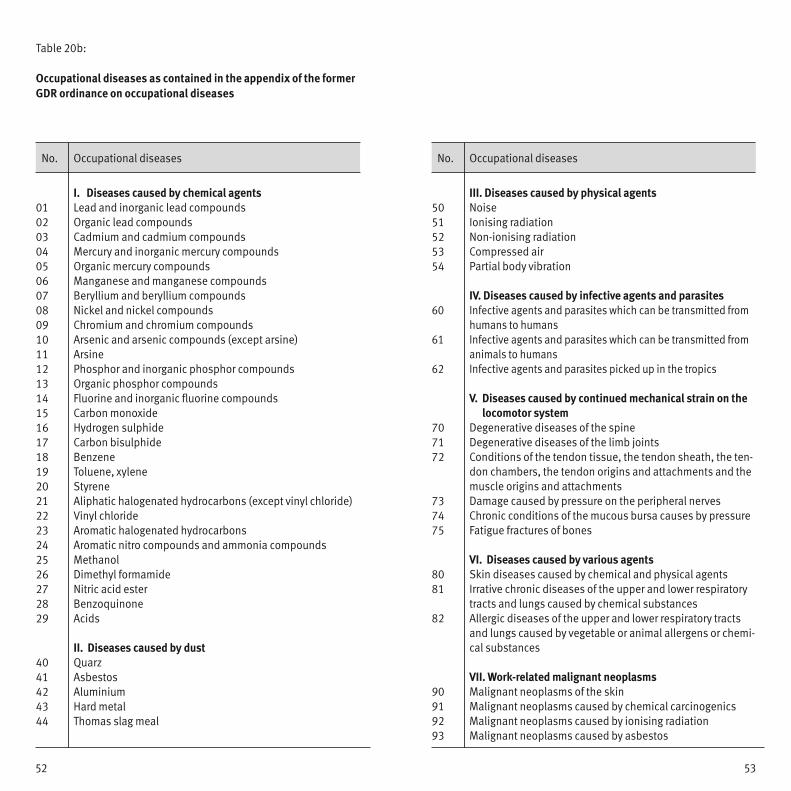
52 53
No . Occupational diseases
Table 20b:
Occupational diseases as contained in the appendix of the formerGDR ordinance on occupational diseases
I. Diseases caused by chemical agents 01 Lead and inorganic lead compounds02 Organic lead compounds03 Cadmium and cadmium compounds04 Mercury and inorganic mercury compounds05 Organic mercury compounds06 Manganese and manganese compounds07 Beryllium and beryllium compounds08 Nickel and nickel compounds09 Chromium and chromium compounds10 Arsenic and arsenic compounds (except arsine)11 Arsine12 Phosphor and inorganic phosphor compounds13 Organic phosphor compounds14 Fluorine and inorganic fluorine compounds15 Carbon monoxide16 Hydrogen sulphide17 Carbon bisulphide18 Benzene19 Toluene, xylene20 Styrene21 Aliphatic halogenated hydrocarbons (except vinyl chloride)22 Vinyl chloride23 Aromatic halogenated hydrocarbons24 Aromatic nitro compounds and ammonia compounds25 Methanol26 Dimethyl formamide27 Nitric acid ester28 Benzoquinone29 Acids
II. Diseases caused by dust40 Quarz41 Asbestos42 Aluminium43 Hard metal44 Thomas slag meal
No . Occupational diseases
III. Diseases caused by physical agents50 Noise51 Ionising radiation52 Non-ionising radiation53 Compressed air54 Partial body vibration
IV. Diseases caused by infective agents and parasites60 Infective agents and parasites which can be transmitted from
humans to humans61 Infective agents and parasites which can be transmitted from
animals to humans62 Infective agents and parasites picked up in the tropics
V. Diseases caused by continued mechanical strain on the locomotor system
70 Degenerative diseases of the spine71 Degenerative diseases of the limb joints72 Conditions of the tendon tissue, the tendon sheath, the ten-
don chambers, the tendon origins and attachments and the muscle origins and attachments
73 Damage caused by pressure on the peripheral nerves74 Chronic conditions of the mucous bursa causes by pressure75 Fatigue fractures of bones
VI. Diseases caused by various agents80 Skin diseases caused by chemical and physical agents 81 Irrative chronic diseases of the upper and lower respiratory
tracts and lungs caused by chemical substances82 Allergic diseases of the upper and lower respiratory tracts
and lungs caused by vegetable or animal allergens or chemi-cal substances
VII. Work-related malignant neoplasms90 Malignant neoplasms of the skin91 Malignant neoplasms caused by chemical carcinogenics92 Malignant neoplasms caused by ionising radiation93 Malignant neoplasms caused by asbestos

54 55
Table 21:
Decided cases
Change from 2015 to 2016
2006 2007 2008 2009 2010 2011 2012 2013 2014 2015 2016 absolut %
Occupational causation confirmed 23,019 23,663 23,028 25,570 31,219 34,573 35,293 36,202 36,754 37,149 40,056 + 2,907 + 7.8
of which n Recognized cases of occupational disease 1
14,156 13,383 12,972 16,078 15,461 15,262 15,291 15,656 16,112 16,802 20,539 + 3,737 + 22 .2
of witch: new pensions 4,781 4,123 4,312 6,643 6,123 5,407 4,924 4,815 5,155 5,049 5,365 + 316 + 6.3
of which n Cases with absence of additionallyrequired insurance characteristics 2 8,863 10,280 10,056 9,492 15,758 19,311 20,002 20,546 20,642 20,347 19,517 – 830 – 4 .1
Occupational causation not confirmed 38,040 35,980 36,440 37,132 37,967 37,165 36,096 36,725 38,425 38,941 39,973 + 1,032 + 2.7 Total number of decided cases 61,059 59,643 59,468 62,702 69,186 71,738 71,389 72,927 75,179 76,090 80,029 + 3,939 + 5.2
1 The increase is partly due to new occupational diseases, which were added on January 1, 2015 .
2 The reason for the increase from 2010 is the improvement of the documentation § 3 of the German Ordinance on Occupational Diseases step 1 of the phased procedure “skin” .

56 57
Table 22:
Occupational diseases (OD) in 2016 by subgroups of diseases; summary
Group Sub-Group
Disease Notifications of a suspected
case of OD
Fatalities due to
OD
Decided cases
Total Occupational causation confirmed Occupational causation
not confirmed
Total Recognized cases of OD
Cases with absence of
additionally required
insurance characte-
ristics
Total Of which new
pensions
1 Conditions due to chemical agents 3,800 174 3,864 722 705 557 17 3,142 11 Metals and metalloids 372 8 360 39 39 31 – 321
12 Asphyraxiating gases 82 1 68 39 39 – – 29
13 Solvents, pesticides and other chemical substances
3,346 165 3,436 644 627 526 17 2,792
2 Conditions due to physical agents 23,395 28 24,661 8,427 8,307 876 120 16,234 21 Mechanical agents 10,683 – 11,874 1,537 1,417 605 120 10,337
22 Compressed air 3 – 1 – – – – 1
23 Noise 12,367 – 12,433 6,850 6,850 237 – 5,583
24 Radiation 342 28 353 40 40 34 – 313
3 Diseases caused by infective agents or parasites including tropical di-seases
2,958 17 2,736 1,257 1,257 50 – 1,479
4 Conditions of the respiratory passa-ges and the lungs, the pleura and the peritoneum
15,201 2,285 17,186 6,175 5,903 3,375 272 11,011
41 Conditions caused by inorganic dust 11,935 2,209 13,392 5,230 5,230 3,069 – 8,162
42 Conditions caused by organic dust 232 35 245 89 89 64 – 156
43 Conditions related to obstruction of the respiratory tract
3,034 41 3,549 856 584 242 272 2,693
5 Skin diseases 28,881 3 30,260 23,423 4,315 478 19,108 6,837 6 Miner's nystagmus 3 – – – – – – –
GDR–OD 1 – 29 57 7 7 7 – 50 Other diseases 1,253 37 1,265 45 45 22 – 1,220
Total 75,491 2,573 80,029 40,056 20,539 5,365 19,517 39,973
1 Cases in acc . with GDR OD ordinance

58 59
Table 23:
Occupational diseases (OD) in 2016 as contained in the appendix of the former GDR ordinance
Group of occupational diseases Fatalities due to OD
Occupational causation confirmed
Total Decides cases Occupational causation not
confirmedTotal Recognized cases of OD
Cases with absence of
additionally required
insurance characteristics
Total Of which new pensions
Diseases caused by chemical agents 1 – – – – – –
Diseases caused by dust 19 8 6 6 6 – 2
Diseases caused by physical agents – 44 – – – – 44
Diseases caused by infective agents and parasites
1 – – – – – –
Diseases caused by continued mechanical strain on the locomotor system
– 3 – – – – 3
Diseases caused by various agents 4 2 1 1 1 – 1
Work–related malignant neoplasms 2 – – – – – –
OD No . unknown – – – – – – –
Extraordinary ruling 1 2 – – – – – –
Total 29 57 7 7 7 – 50
1 „Sonderentscheid“ in acc . with § 2 Sec . 2 GDR OD ordinance

60 61
Table 24:
Notifications of suspected cases of occupational disease
OD No . 2000 2005 2010 2015 2016
1101 101 78 61 49 65 1102 50 30 23 29 24 1103 100 114 110 151 166 1104 18 16 21 23 23 1105 5 5 5 13 10 1106 1 1 1 2 – 1107 1 – – 2 2 1108 27 19 23 17 46 1109 9 7 7 7 7 1110 14 7 18 32 29
1201 86 150 130 38 78 1202 13 16 11 3 4
1301 345 633 1,138 1,334 1,336 1302 401 307 365 276 233 1303 376 376 87 54 54 1304 50 25 17 8 12 1305 7 6 4 5 7 1306 22 11 4 8 3 1307 10 14 6 8 8 1308 16 17 8 6 9 1309 4 4 1 1 3 1310 60 37 22 14 17 1311 4 2 – 1 2 1312 353 134 128 62 61 1313 3 – 1 1 1 1314 1 3 2 2 1 1315 91 99 119 103 130 1316 22 33 22 11 17 1317 362 331 234 164 143 1318 – – 725 1,261 1,265 1319 1 – – – 46 44
2101 1,282 749 741 722 688 2102 2,359 1,607 1,411 1,053 1,003 2103 617 419 433 432 420 2104 94 64 67 82 98 2105 746 496 381 373 344 2106 131 87 82 98 71 2107 6 4 3 1 1 2108 12,401 5,515 5,114 5,144 4,759 2109 1,579 1,031 1,019 722 692 2110 669 300 217 167 158 2111 13 19 7 9 7 2112 – – 1,804 1,400 1,385
OD No . 2000 2005 2010 2015 2016
2113 1 – – – 1,391 1,009 2114 1 – – – 59 48
2201 26 7 6 2 3
2301 12,220 9,310 10,979 11,874 12,367
2401 16 8 14 17 15 2402 725 634 389 338 327
3101 2,124 4,047 1,493 1,640 1,959 3102 218 508 559 575 634 3103 3 – 2 – – 3104 456 332 344 327 365
4101 2,040 1,425 1,571 1,449 1,176 4102 63 47 17 19 19 4103 3,730 3,594 3,732 3,674 3,607 4104 2,783 2,908 3,709 4,375 4,368 4105 988 1,149 1,479 1,397 1,304 4106 27 23 23 39 37 4107 52 65 62 62 78 4108 3 3 1 3 – 4109 27 30 40 48 62 4110 51 31 37 25 39 4111 1,345 799 1,076 545 455 4112 – 124 205 326 307 4113 – – 140 218 245 4114 – – 89 137 125 4115 – – 169 128 113
4201 73 67 102 140 140 4202 25 5 14 7 6 4203 49 67 66 87 86
4301 3,746 2,014 2,045 1,739 1,593 4302 2,000 1,439 1,564 1,506 1,441
5101 20,431 16,529 23,596 23,786 22,574 5102 50 61 202 256 206 5103 1 – – – 5,531 6,101
6101 2 6 2 – 3
Other 2,307 1,921 1,978 1,337 1,253
Total 78,029 59,919 70,277 76,991 75,491 1 Since January 1, 2015: added to the annex to the German ordinance on occupational
diseases
62 63
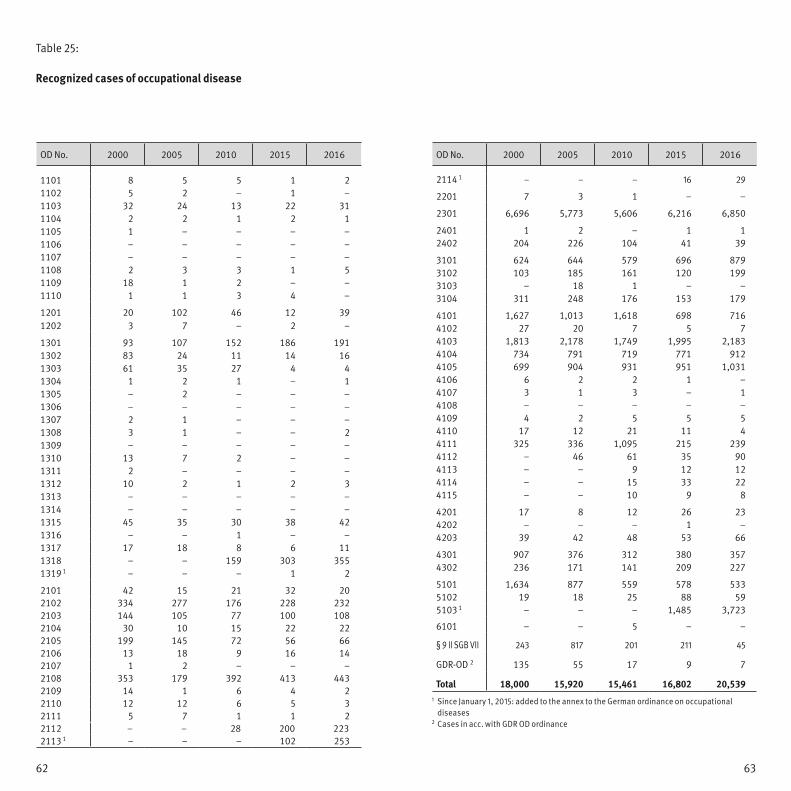
Table 25:
Recognized cases of occupational disease
1 Since January 1, 2015: added to the annex to the German ordinance on occupational diseases
2 Cases in acc . with GDR OD ordinance
OD No . 2000 2005 2010 2015 2016
1101 8 5 5 1 2 1102 5 2 – 1 – 1103 32 24 13 22 31 1104 2 2 1 2 1 1105 1 – – – – 1106 – – – – – 1107 – – – – – 1108 2 3 3 1 5 1109 18 1 2 – – 1110 1 1 3 4 –
1201 20 102 46 12 39 1202 3 7 – 2 –
1301 93 107 152 186 191 1302 83 24 11 14 16 1303 61 35 27 4 4 1304 1 2 1 – 1 1305 – 2 – – – 1306 – – – – – 1307 2 1 – – – 1308 3 1 – – 2 1309 – – – – – 1310 13 7 2 – – 1311 2 – – – – 1312 10 2 1 2 3 1313 – – – – – 1314 – – – – – 1315 45 35 30 38 42 1316 – – 1 – – 1317 17 18 8 6 11 1318 – – 159 303 355 1319 1 – – – 1 2
2101 42 15 21 32 20 2102 334 277 176 228 232 2103 144 105 77 100 108 2104 30 10 15 22 22 2105 199 145 72 56 66 2106 13 18 9 16 14 2107 1 2 – – – 2108 353 179 392 413 443 2109 14 1 6 4 2 2110 12 12 6 5 3 2111 5 7 1 1 2 2112 – – 28 200 223 2113 1 – – – 102 253
OD No . 2000 2005 2010 2015 2016
2114 1 – – – 16 29
2201 7 3 1 – –
2301 6,696 5,773 5,606 6,216 6,850
2401 1 2 – 1 1 2402 204 226 104 41 39
3101 624 644 579 696 879 3102 103 185 161 120 199 3103 – 18 1 – – 3104 311 248 176 153 179
4101 1,627 1,013 1,618 698 716 4102 27 20 7 5 7 4103 1,813 2,178 1,749 1,995 2,183 4104 734 791 719 771 912 4105 699 904 931 951 1,031 4106 6 2 2 1 – 4107 3 1 3 – 1 4108 – – – – – 4109 4 2 5 5 5 4110 17 12 21 11 4 4111 325 336 1,095 215 239 4112 – 46 61 35 90 4113 – – 9 12 12 4114 – – 15 33 22 4115 – – 10 9 8
4201 17 8 12 26 23 4202 – – – 1 – 4203 39 42 48 53 66
4301 907 376 312 380 357 4302 236 171 141 209 227
5101 1,634 877 559 578 533 5102 19 18 25 88 59 5103 1 – – – 1,485 3,723
6101 – – 5 – –
§ 9 II SGB VII 243 817 201 211 45
GDR-OD 2 135 55 17 9 7
Total 18,000 15,920 15,461 16,802 20,539

64 65
Table 26:
New occupational disease pensions
1 Since January 1, 2015: added to the annex to the German ordinance on occupational diseases
2 Cases in acc . with GDR OD ordinance
OD No . 2000 2005 2010 2015 2016
1101 2 1 4 – 1 1102 2 2 – – – 1103 22 12 12 16 24 1104 – – 1 1 1 1105 – – – – – 1106 – – – – – 1107 – – – – – 1108 1 2 3 1 5 1109 1 – – – – 1110 1 1 1 3 –
1201 1 – – 1 – 1202 2 – – 1 –
1301 72 99 143 177 173 1302 13 18 9 8 11 1303 43 29 23 3 2 1304 – – – – – 1305 – – – – – 1306 – – – – – 1307 2 – – – – 1308 – – – – – 1309 – – – – – 1310 7 6 2 – – 1311 – – – – – 1312 1 – – – – 1313 – – – – – 1314 – – – – – 1315 23 22 13 21 24 1316 – – 1 – – 1317 12 17 6 5 9 1318 – – 151 266 307 1319 1 – – – 1 –
2101 5 2 5 4 2 2102 142 77 57 77 84 2103 91 62 49 58 57 2104 19 8 9 17 10 2105 5 1 1 1 2 2106 4 9 2 2 5 2107 – – – – – 2108 135 118 237 254 275 2109 5 1 6 2 1 2110 7 9 4 4 2 2111 – – – – – 2112 – – 13 126 148 2113 1 – – – 8 12
OD No . 2000 2005 2010 2015 2016
2114 1 – – – 6 7
2201 2 – – – –
2301 806 508 389 306 237
2401 – – – – 1 2402 196 216 96 36 33
3101 193 180 64 54 35 3102 15 14 5 6 11 3103 – 1 – – – 3104 – 4 2 2 4
4101 368 271 1,203 417 423 4102 24 19 6 5 6 4103 388 427 421 541 578 4104 690 739 676 713 814 4105 668 851 876 875 944 4106 2 2 – 1 – 4107 2 1 3 – 1 4108 – – – – – 4109 4 2 5 4 4 4110 16 12 20 11 3 4111 272 275 906 174 183 4112 – 34 58 28 79 4113 – – 7 12 11 4114 – – 14 28 19 4115 – – 6 6 4
4201 11 3 6 18 12 4202 – – – 1 – 4203 39 39 44 40 52
4301 231 116 95 116 97 4302 172 129 106 140 145
5101 456 263 168 169 143 5102 15 8 17 42 23 5103 1 – – – 173 312
6101 – – 4 – –
§ 9 II SGB VII 23 806 157 59 22
GDR-OD 2 93 43 17 9 7
Total 5,304 5,459 6,123 5,049 5,365

66 67
Table 27:
Fatalities due to occupational disease
1 Since January 1, 2015: added to the annex to the German ordinance on occupational diseases
2 Cases in acc . with GDR OD ordinance
OD No . 2000 2005 2010 2015 2016
1101 1 1 1 1 – 1102 – – – – – 1103 16 13 7 8 6 1104 1 – – – 1 1105 – – – – – 1106 – – – – – 1107 – – – – – 1108 1 3 – 1 – 1109 – – 1 – – 1110 – – – 4 1
1201 2 – – 1 – 1202 – – – – 1
1301 25 16 32 26 30 1302 5 9 2 6 7 1303 24 18 14 7 9 1304 – – – – – 1305 – 1 – – – 1306 – 1 – 1 – 1307 – – – – – 1308 – – – – – 1309 1 – – – – 1310 2 4 2 1 1 1311 – 1 – – – 1312 – – – – – 1313 – – – – – 1314 – – 1 – – 1315 1 1 – 3 – 1316 – – – – – 1317 – – – – 1 1318 – – 37 105 117 1319 1 – – – – –
2101 – – – – – 2102 – – – – – 2103 – – – – – 2104 – – – – – 2105 – – – – – 2106 – – – – – 2107 – – – – – 2108 – – – – – 2109 – – – – – 2110 – – – – – 2111 – – – – – 2112 – – – – – 2113 1 – – – – –
OD No . 2000 2005 2010 2015 2016
2114 1 – – – – –
2201 – – – – –
2301 – – – – –
2401 – – – – – 2402 182 150 82 42 28
3101 26 9 20 13 16 3102 1 3 – 1 – 3103 – – – – – 3104 1 3 2 – 1
4101 458 334 420 305 287 4102 30 11 4 7 2 4103 73 71 101 165 168 4104 612 699 497 593 622 4105 645 812 694 811 871 4106 2 – – – 1 4107 3 4 – – – 4108 – – – – – 4109 5 2 3 4 4 4110 16 12 17 6 9 4111 16 60 300 115 141 4112 – 32 50 37 83 4113 – – 3 10 4 4114 – – 3 11 15 4115 – – – 1 2
4201 3 3 6 1 7 4202 – 1 – – 1 4203 19 14 22 16 27
4301 22 20 15 12 11 4302 25 25 16 24 30
5101 4 – 3 – – 5102 – 1 – 1 – 5103 1 – – – 1 3
6101 – – – – –
§ 9 II SGB VII 22 139 93 31 37
GDR-OD 2 113 91 38 38 29
Total 2,357 2,564 2,486 2,409 2,573

68 69
Table 28:
Notifications of suspected cases of occupational disease by sector and BG
Table 29:
Recognized cases of occupational disease by sector and BG
2000 2005 2010 2015 2016
Accident insurance in industrial sector
71,401 53,668 64,721 69,874 68,270
101 BG for the raw mate- rials and chemical industry
10,264 7,400 8,579 7,302 6,759
102 BG for the wood-working and metal-working industries
16,453 12,401 14,707 15,732 15,139
103 BG for the energy, textile, electrical and media products sectors
6,497 4,245 5,418 5,856 5,737
104 BG for the building trade
13,609 8,986 10,501 13,613 13,863
105 BG for the foodstuffs and catering industry
4,985 4,339 5,203 4,209 4,051
106 BG for the trade and logistics industry
4,060 2,886 3,774 4,247 4,044
107 BG for the Transport industry, postal logistics and tele-communications
1,787 1,445 1,814 1,965 1,898
108 BG for the adminis-trative sector
2,673 2,989 4,005 4,254 4,401
109 BG for the health and welfare services
11,073 8,977 10,720 12,696 12,378
Accident insurance in public sector (General AI)
6,543 6,094 5,447 7,030 7,105
Total 77,944 59,762 70,168 76,904 75,375
Pupil accident insurance 85 157 109 87 116
2000 2005 2010 2015 2016
Accident insurance in industrial sector
16,424 14,930 14,615 15,658 18,783
101 BG for the raw mate- rials and chemical industry
4,007 3,884 4,362 2,166 2,489
102 BG for the wood-working and metal-working industries
4,998 4,570 4,545 4,989 5,489
103 BG for the energy, textile, electrical and media products sectors
1,227 1,288 1,103 1,353 1,693
104 BG for the building trade
2,779 2,520 2,013 4,053 5,686
105 BG for the foodstuffs and catering industry
884 364 398 565 543
106 BG for the trade and logistics industry
556 424 361 692 645
107 BG for the Transport industry, postal logistics and tele-communications
352 216 187 265 398
108 BG for the adminis-trative sector
654 636 701 706 828
109 BG for the health and welfare services
967 1,028 945 869 1,012
Accident insurance in public sector (General AI)
1,572 984 839 1,135 1,730
Total 1 17,996 15,914 15,454 16,793 20,513
Pupil accident insurance 4 6 7 9 26
1 The increase is partly due to new occupational diseases, which were added on January 1, 2015 .

70 71
Table 30:
New occupational disease pensions by sector and BG
Table 31:
Long-term trends of occupational disease: notifications of suspected cases, recognized cases,new pensions
Year Suspected cases Recognized cases
Total Of which new pensions
1987 45,781 7,666 3,577
1988 49,985 7,726 3,889
1989 52,788 9,448 4,207
1990 56,231 9,771 4,251
1991 1 66,726 10,952 4,833
1992 1 81,920 12,849 5,553
1993 1 101,851 18,635 5,984
1994 93,296 20,318 6,835
1995 87,431 22,938 7,135
1996 90,304 23,212 7,536
1997 85,406 22,577 7,469
1998 82,376 19,976 6,072
1999 80,282 18,633 5,693
2000 78,029 18,000 5,304
2001 73,551 17,950 5,503
2002 68,196 17,722 5,443
2003 62,130 16,778 5,085
2004 60,965 16,784 5,021
2005 59,919 15,920 5,459
2006 61,457 14,156 4,781
2007 61,150 13,383 4,123
2008 60,736 12,972 4,312 2009 66,951 16,078 6,643
2010 70,277 15,461 6,123
2011 71,269 15,262 5,407
2012 70,566 15,291 4,924
2013 71,579 15,656 4,815 2014 71,685 16,112 5,155 2015 76,991 16,802 5,049
2016 2 75,491 20,539 5,365
1 See note on p . 7 for interpretation2 The increase is partly due to new occupational diseases, which were added on January 1,
2015 .
2000 2005 2010 2015 2016
Accident insurance in industrial sector
4,903 5,210 5,946 4,813 5,086
101 BG for the raw mate- rials and chemical industry
1,607 2,119 2,907 1,078 1,170
102 BG for the wood-working and metal-working industries
1,252 1,173 1,284 1,338 1,387
103 BG for the energy, textile, electrical and media products sectors
407 444 433 501 516
104 BG for the building trade
764 667 584 1,044 1,245
105 BG for the foodstuffs and catering industry
180 105 88 133 117
106 BG for the trade and logistics industry
221 179 136 250 198
107 BG for the Transport industry, postal logistics and tele-communications
89 65 69 90 90
108 BG for the adminis-trative sector
157 164 198 186 174
109 BG for the health and welfare services
226 294 247 193 189
Accident insurance in public sector (General AI)
400 249 176 234 277
Total 5,303 5,459 6,122 5,047 5,363
Pupil accident insurance 1 – 1 2 2

72 73
Figure 11: Notifications of suspected cases of occupational disease
Figure 12: Recognized cases of occupational disease
* 2009: The omission of the retroactive effect clause (verdict of the Federal Social Court, 2008-12-02) caused a recognition of old cases (OD 4111) . Simultaneously, the revised recommendation for medical expertise of slight silicosis (OD 4101) resulted in an increase in the number of cases . At the present time the impact of these changes comes to an end .) . Simultaneously, the revised recommendation for medical expertise of slight silicosis (OD 4101) resulted in an increase in the number of cases . At the present time the impact of these changes comes to an end .
Figure 13: New occupational disease pensions*
** see note on p . 7 for interpretation** 2009: The omission of the retroactive effect clause (verdict of the Federal Social Court, 2008-12-02) caused
a recognition of old cases (OD 4111) . Simultaneously, the revised recommendation for medical expertise of slight silicosis (OD 4101) resulted in an increase in the number of cases . At the present time the impact of these changes comes to an end .) . Simultaneously, the revised recommendation for medical expertise of slight silicosis (OD 4101) resulted in an increase in the number of cases . At the present time the impact of these changes comes to an end .
8,000
6,000
4,0003,000
0
2,0001,000
7,000
5,000
Absolute
* see note on p. 7 for interpretation** 2009: The omission of the retroactive effect clause (verdict of the Federal Social Court, 2008-12-02) caused a
recognition of old cases (OD 4111). Simultaneously, the revised recommendation for medical expertise of slight silicosis (OD 4101) resulted in an increase in the number of cases. At the present time the impact of these changes comes to an end.). Simultaneously, the revised recommendation for medical expertise of slight silico-sis (OD 4101) resulted in an increase in the number of cases. At the present time the impact of these changes comes to an end.
1987 1990 1993 1996 1999 2002 2005 2008 2011 2014
25,000
20,000
15,000
10,000
0
5,000
Absolute
* 2009: The omission of the retroactive effect clause (verdict of the Federal Social Court, 2008-12-02) caused a recognition of old cases (OD 4111). Simultaneously, the revised recommendation for medical expertise of slight silicosis (OD 4101) resulted in an increase in the number of cases. At the present time the impact of these changes comes to an end.). Simultaneously, the revised recommendation for medical expertise of slight silico-sis (OD 4101) resulted in an increase in the number of cases. At the present time the impact of these changes comes to an end.
1987 1990 1993 1996 1999 2002 2005 2008 2011 2014
1987 1990 1993 1996 1999 2002 2005 2008 2011 2014
120,000
100,000
80,000
60,000
40,000
20,000
Absolute
0

74 75
Table 32:
Stock of pensions
Year Pension paid to Total
Insuredperson
Widows andwidowers
Orphans Otherclaimants
1987 628,383 121,490 29,320 379 779,572
1988 628,541 119,154 26,913 349 774,957
1989 627,731 116,789 25,001 334 769,855
1990 630,621 114,674 22,879 303 768,477
1991 858,572 133,477 23,608 291 1,015,948
1992 858,750 131,561 24,335 263 1,014,909
1993 859,116 131,625 24,027 231 1,014,999
1994 862,688 131,249 23,537 212 1,017,686 1995 865,545 130,343 22,815 206 1,018,909 1996 863,337 129,043 22,248 211 1,014,839
1997 857,590 127,233 21,580 188 1,006,591
1998 856,651 125,827 21,020 164 1,003,662
1999 852,802 124,379 20,464 138 997,783
2000 847,884 123,530 20,292 127 991,833
2001 841,228 121,552 19,985 113 982,878
2002 833,141 120,073 19,668 108 972,990
2003 826,093 118,791 19,302 105 964,291
2004 816,869 117,510 18,774 95 953,248
2005 806,707 115,977 18,236 87 941,007
2006 797,457 114,971 17,243 72 929,743
2007 789,655 113,509 16,585 71 919,820
2008 775,750 112,081 15,281 55 903,167
2009 767,350 110,883 14,902 42 893,177
2010 758,374 109,023 13,837 34 881,268
2011 747,685 107,698 12,894 31 868,308
2012 737,675 105,540 12,415 34 855,664
2013 727,162 103,861 11,845 31 842,899
2014 716,345 102,650 10,636 30 829,661
2015 704,858 100,717 10,174 29 815,778
2016 694,841 99,045 9,561 27 803,474
Figure 14: Total pensions paid at end of 2016
Figure 15: Total pensions
1987 1990 1993 1996 1999 2002 2005 2008 2011 2014
1,000,000
600,000
400,000300,000
0
200,000100,000
700,000
500,000
900,000800,000
Absolute
Pensions for injury/illness Pensions for dependents
Renten an Unfallverletzte: 611.668
Renten an Berufserkrankte: 83.173
Renten an Hinterbliebene (Unfälle): 68.979
Renten an Hinterbliebene (Berufskrankheiten):
39.654
Gesamter Rentenbestand am Ende des Geschäftsjahres 2016
Pensions to sufferers of occupational disease: 83,173
Pensions to dependents (occupational disease):39,654
Pensions to victims:611,668
Pensions to dependents (accidents):68,979
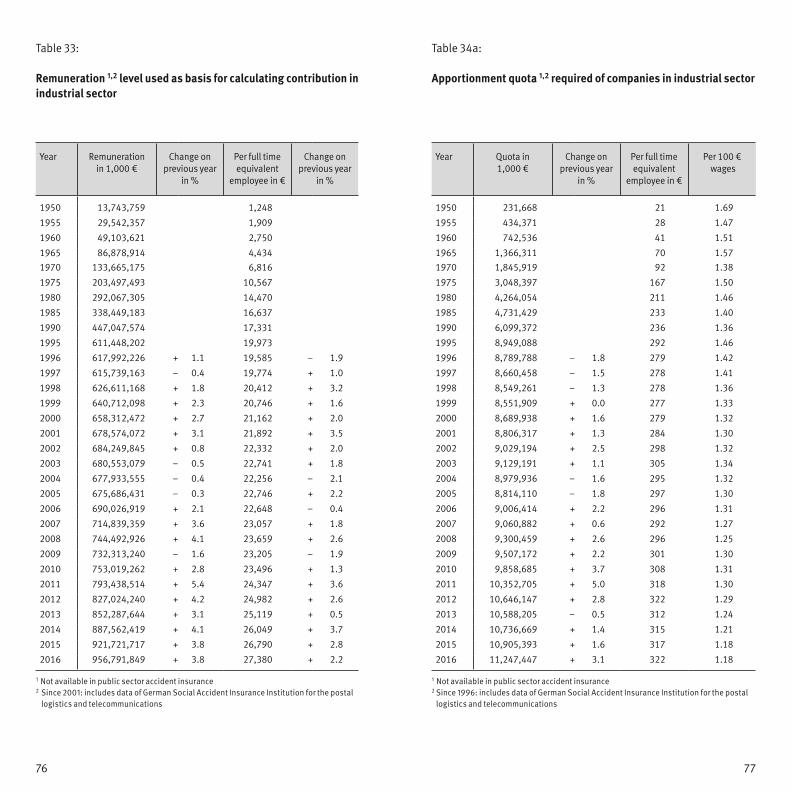
76 77
Table 33:
Remuneration 1,2 level used as basis for calculating contribution in industrial sector
Year Remuneration in 1,000 €
Change on previous year
in %
Per full time equivalent
employee in €
Change on previous year
in %
1950 13,743,759 1,248
1955 29,542,357 1,909
1960 49,103,621 2,750
1965 86,878,914 4,434 1970 133,665,175 6,816
1975 203,497,493 10,567
1980 292,067,305 14,470
1985 338,449,183 16,637
1990 447,047,574 17,331
1995 611,448,202 19,973
1996 617,992,226 + 1 .1 19,585 – 1 .9
1997 615,739,163 – 0 .4 19,774 + 1 .0
1998 626,611,168 + 1 .8 20,412 + 3 .2
1999 640,712,098 + 2 .3 20,746 + 1 .6
2000 658,312,472 + 2 .7 21,162 + 2 .0
2001 678,574,072 + 3 .1 21,892 + 3 .5
2002 684,249,845 + 0 .8 22,332 + 2 .0
2003 680,553,079 – 0 .5 22,741 + 1 .8
2004 677,933,555 – 0 .4 22,256 – 2 .1
2005 675,686,431 – 0 .3 22,746 + 2 .2
2006 690,026,919 + 2 .1 22,648 – 0 .4
2007 714,839,359 + 3 .6 23,057 + 1 .8
2008 744,492,926 + 4 .1 23,659 + 2 .6
2009 732,313,240 – 1 .6 23,205 – 1 .9
2010 753,019,262 + 2 .8 23,496 + 1 .3
2011 793,438,514 + 5 .4 24,347 + 3 .6
2012 827,024,240 + 4 .2 24,982 + 2 .6
2013 852,287,644 + 3 .1 25,119 + 0 .5
2014 887,562,419 + 4 .1 26,049 + 3 .7
2015 921,721,717 + 3 .8 26,790 + 2 .8
2016 956,791,849 + 3 .8 27,380 + 2 .2
1 Not available in public sector accident insurance2 Since 2001: includes data of German Social Accident Insurance Institution for the postal
logistics and telecommunications
Table 34a:
Apportionment quota 1,2 required of companies in industrial sector
Year Quota in1,000 €
Change on previous year
in %
Per full time equivalent
employee in €
Per 100 € wages
1950 231,668 21 1 .69
1955 434,371 28 1 .47
1960 742,536 41 1 .51
1965 1,366,311 70 1 .571970 1,845,919 92 1 .38
1975 3,048,397 167 1 .50
1980 4,264,054 211 1 .46
1985 4,731,429 233 1 .40
1990 6,099,372 236 1 .36
1995 8,949,088 292 1 .46
1996 8,789,788 – 1 .8 279 1 .42
1997 8,660,458 – 1 .5 278 1 .41
1998 8,549,261 – 1 .3 278 1 .36
1999 8,551,909 + 0 .0 277 1 .33
2000 8,689,938 + 1 .6 279 1 .32
2001 8,806,317 + 1 .3 284 1 .30
2002 9,029,194 + 2 .5 298 1 .32
2003 9,129,191 + 1 .1 305 1 .34
2004 8,979,936 – 1 .6 295 1 .32
2005 8,814,110 – 1 .8 297 1 .30
2006 9,006,414 + 2 .2 296 1 .31
2007 9,060,882 + 0 .6 292 1 .27
2008 9,300,459 + 2 .6 296 1 .25
2009 9,507,172 + 2 .2 301 1 .30
2010 9,858,685 + 3 .7 308 1 .31
2011 10,352,705 + 5 .0 318 1 .30
2012 10,646,147 + 2 .8 322 1 .29
2013 10,588,205 – 0 .5 312 1 .24
2014 10,736,669 + 1 .4 315 1 .21
2015 10,905,393 + 1 .6 317 1 .18
2016 11,247,447 + 3 .1 322 1 .18
1 Not available in public sector accident insurance2 Since 1996: includes data of German Social Accident Insurance Institution for the postal
logistics and telecommunications
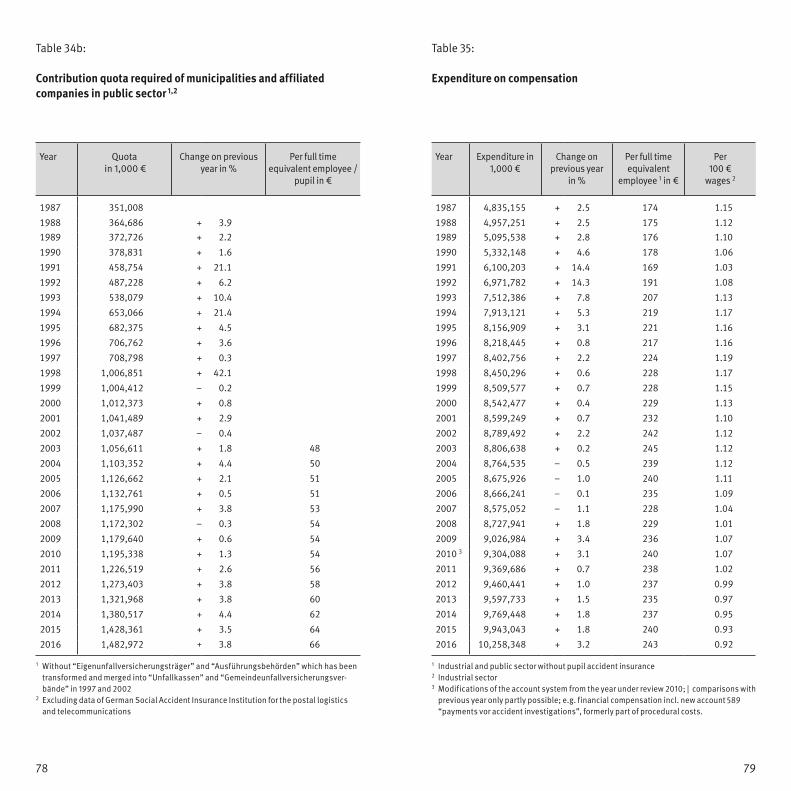
78 79
Table 34b:
Contribution quota required of municipalities and affiliated companies in public sector 1,2
Year Quota in 1,000 €
Change on previous year in %
Per full time equivalent employee /
pupil in €
1987 351,008
1988 364,686 + 3 .9 1989 372,726 + 2 .2
1990 378,831 + 1 .6
1991 458,754 + 21 .1
1992 487,228 + 6 .2
1993 538,079 + 10 .4
1994 653,066 + 21 .4
1995 682,375 + 4 .5
1996 706,762 + 3 .6
1997 708,798 + 0 .3
1998 1,006,851 + 42 .1
1999 1,004,412 – 0 .2
2000 1,012,373 + 0 .8
2001 1,041,489 + 2 .9
2002 1,037,487 – 0 .4
2003 1,056,611 + 1 .8 48
2004 1,103,352 + 4 .4 50
2005 1,126,662 + 2 .1 51
2006 1,132,761 + 0 .5 51
2007 1,175,990 + 3 .8 53
2008 1,172,302 – 0 .3 54
2009 1,179,640 + 0 .6 54
2010 1,195,338 + 1 .3 54
2011 1,226,519 + 2 .6 56
2012 1,273,403 + 3 .8 58
2013 1,321,968 + 3 .8 60
2014 1,380,517 + 4 .4 62
2015 1,428,361 + 3 .5 64
2016 1,482,972 + 3 .8 66
1 Without “Eigenunfallversicherungsträger” and “Ausführungsbehörden” which has been transformed and merged into “Unfallkassen” and “Gemeindeunfallversicherungsver-bände” in 1997 and 2002
2 Excluding data of German Social Accident Insurance Institution for the postal logistics and telecommunications
Table 35:
Expenditure on compensation
Year Expenditure in1,000 €
Change on previous year
in %
Per full time equivalent
employee 1 in €
Per 100 €
wages 2
1987 4,835,155 + 2 .5 174 1 .15
1988 4,957,251 + 2 .5 175 1 .12 1989 5,095,538 + 2 .8 176 1 .10
1990 5,332,148 + 4 .6 178 1 .06
1991 6,100,203 + 14 .4 169 1 .03
1992 6,971,782 + 14 .3 191 1 .08
1993 7,512,386 + 7 .8 207 1 .13
1994 7,913,121 + 5 .3 219 1 .17
1995 8,156,909 + 3 .1 221 1 .16
1996 8,218,445 + 0 .8 217 1 .16
1997 8,402,756 + 2 .2 224 1 .19
1998 8,450,296 + 0 .6 228 1 .17
1999 8,509,577 + 0 .7 228 1 .15
2000 8,542,477 + 0 .4 229 1 .13
2001 8,599,249 + 0 .7 232 1 .10
2002 8,789,492 + 2 .2 242 1 .12
2003 8,806,638 + 0 .2 245 1 .12
2004 8,764,535 – 0 .5 239 1 .12
2005 8,675,926 – 1 .0 240 1 .11
2006 8,666,241 – 0 .1 235 1 .09
2007 8,575,052 – 1 .1 228 1 .04
2008 8,727,941 + 1 .8 229 1 .01
2009 9,026,984 + 3 .4 236 1 .07
2010 3 9,304,088 + 3 .1 240 1 .07
2011 9,369,686 + 0 .7 238 1 .02
2012 9,460,441 + 1 .0 237 0 .99
2013 9,597,733 + 1 .5 235 0 .97
2014 9,769,448 + 1 .8 237 0 .95
2015 9,943,043 + 1 .8 240 0 .93
2016 10,258,348 + 3 .2 243 0 .92
1 Industrial and public sector without pupil accident insurance2 Industrial sector3 Modifications of the account system from the year under review 2010; | comparisons with
previous year only partly possible; e .g . financial compensation incl . new account 589 “payments vor accident investigations”, formerly part of procedural costs .

80 81
Year In 1,000 € Change on previous year in %
Total Of which injury benefit 1
Total Injury benefit 1
1987 1,346,814 343,847
1988 1,377,709 353,403 + 2 .3 + 2 .8
1989 1,435,727 354,265 + 4 .2 + 0 .2 1990 1,559,341 384,336 + 8 .6 + 8 .5
1991 1,821,739 453,971 + 16 .8 + 18 .1
1992 2,213,892 527,853 + 21 .5 + 16 .3
1993 2,393,196 559,648 + 8 .1 + 6 .0
1994 2,511,911 564,198 + 5 .0 + 0 .8
1995 2,620,197 568,801 + 4 .3 + 0 .8
1996 2,609,508 573,878 - 0 .4 + 0 .9
1997 2,664,089 550,455 + 2 .1 - 4 .1
1998 2,715,191 550,523 + 1 .9 + 0 .0
1999 2,788,545 557,884 + 2 .7 + 1 .3
2000 2,817,784 562,303 + 1 .0 + 0 .8
2001 2,832,271 577,124 + 0 .5 + 2 .6
2002 2,915,904 606,495 + 3 .0 + 5 .1
2003 2,860,311 549,884 - 1 .9 - 9 .3
2004 2,854,926 506,762 - 0 .2 - 7 .8
2005 2,861,599 484,486 + 0 .2 - 4 .4
2006 2,950,789 486,559 + 3 .1 + 0 .4
2007 2,955,801 484,155 + 0 .2 - 0 .5
2008 3,114,170 515,200 + 5 .4 + 6 .4
2009 3,284,596 556,700 + 5 .5 + 8 .1
2010 3,496,863 583,781 + 6 .5 + 4 .9
2011 3,610,276 602,100 + 3 .2 + 3 .1
2012 3,677,790 602,522 + 1 .9 + 0 .1
2013 3,813,642 640,067 + 3 .7 + 6 .2
2014 3,965,957 658,769 + 4 .0 + 2 .9
2015 4,084,241 680,664 + 3 .0 + 3 .3
2016 4,278,674 711,832 + 4 .8 + 4 .6
1 Including special assistance
Year Expenditure on pensions for Total
Insured persons
Widows and widowers
Orphans Other claimants
1987 2,193,008 972,154 137,688 1,709 3,304,559
1988 2,253,480 986,812 131,733 1,409 3,373,435
1989 2,311,109 999,017 124,108 1,511 3,435,745
1990 2,377,190 1,010,688 117,979 1,249 3,507,106
1991 2,794,398 1,064,968 118,982 1,314 3,979,661
1992 3,128,234 1,155,033 126,824 1,256 4,411,347
1993 3,372,782 1,216,886 135,872 1,168 4,726,709
1994 3,573,341 1,266,218 139,105 1,151 4,979,815
1995 3,680,098 1,286,027 139,241 1,303 5,106,669
1996 3,742,889 1,291,736 137,000 1,042 5,172,667
1997 3,809,192 1,293,131 134,738 900 5,237,961
1998 3,820,465 1,291,114 132,253 828 5,244,659
1999 3,849,370 1,286,826 129,547 761 5,266,505
2000 3,863,449 1,287,180 127,730 711 5,279,071
2001 3,914,986 1,297,226 126,509 651 5,339,372
2002 3,982,916 1,316,549 125,612 695 5,425,771
2003 4,017,914 1,323,577 124,940 593 5,467,024
2004 4,006,454 1,320,115 122,916 567 5,450,052
2005 3,987,306 1,310,681 117,813 534 5,416,334
2006 3,941,354 1,310,888 113,746 445 5,366,433
2007 3,897,356 1,296,209 110,953 384 5,304,903
2008 3,894,222 1,300,728 107,767 365 5,303,082
2009 3,994,375 1,335,211 102,801 278 5,432,666
2010 3,993,057 1,331,476 98,556 265 5,423,355
2011 3,954,730 1,322,278 92,666 211 5,369,884
2012 3,975,382 1,328,316 89,732 218 5,393,648
2013 3,980,744 1,330,928 85,001 191 5,396,863
2014 4,005,807 1,332,015 79,756 185 5,417,763
2015 4,039,730 1,339,334 77,455 243 5,456,762
2016 4,131,929 1,369,162 74,980 166 5,576,236
1 Excluding lump-sum payments and allowances
Table 36:
Expenditure on currative treatment
Table 37:
Expenditure on pensions 1 in 1,000 €
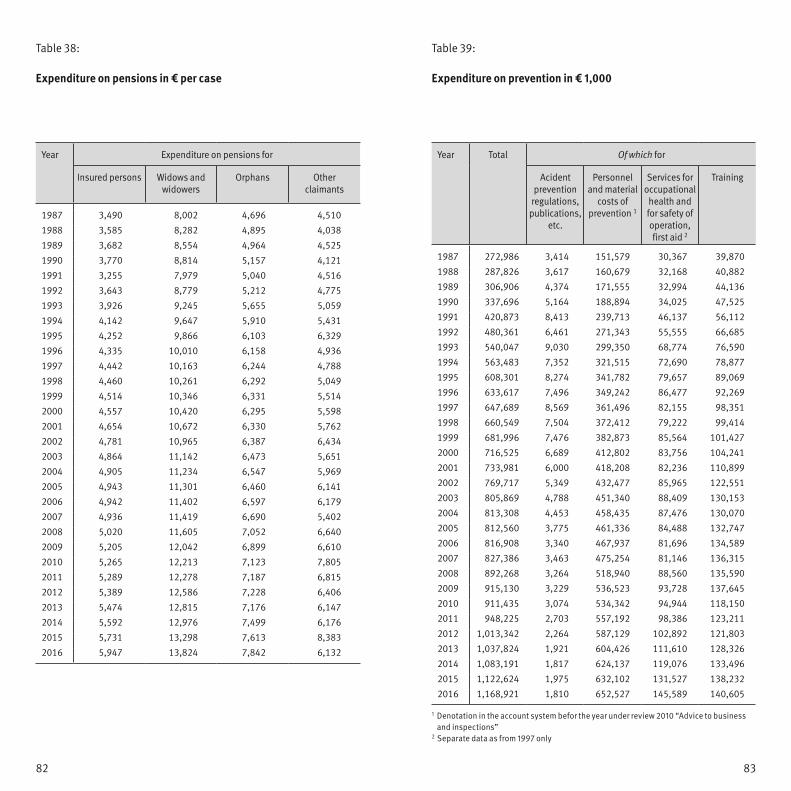
82 83
Table 38:
Expenditure on pensions in € per case
Year Expenditure on pensions for
Insured persons Widows and widowers
Orphans Other claimants
1987 3,490 8,002 4,696 4,510
1988 3,585 8,282 4,895 4,038
1989 3,682 8,554 4,964 4,525
1990 3,770 8,814 5,157 4,121
1991 3,255 7,979 5,040 4,516
1992 3,643 8,779 5,212 4,775
1993 3,926 9,245 5,655 5,059
1994 4,142 9,647 5,910 5,431
1995 4,252 9,866 6,103 6,329
1996 4,335 10,010 6,158 4,936
1997 4,442 10,163 6,244 4,788
1998 4,460 10,261 6,292 5,049
1999 4,514 10,346 6,331 5,514
2000 4,557 10,420 6,295 5,598
2001 4,654 10,672 6,330 5,762
2002 4,781 10,965 6,387 6,434
2003 4,864 11,142 6,473 5,651
2004 4,905 11,234 6,547 5,969
2005 4,943 11,301 6,460 6,141
2006 4,942 11,402 6,597 6,179
2007 4,936 11,419 6,690 5,402
2008 5,020 11,605 7,052 6,640
2009 5,205 12,042 6,899 6,610
2010 5,265 12,213 7,123 7,805
2011 5,289 12,278 7,187 6,815
2012 5,389 12,586 7,228 6,406
2013 5,474 12,815 7,176 6,147
2014 5,592 12,976 7,499 6,176
2015 5,731 13,298 7,613 8,383
2016 5,947 13,824 7,842 6,132
Table 39:
Expenditure on prevention in € 1,000
Year Total Of which for
Acident prevention
regulations, publications,
etc .
Personnel and material
costs of prevention 1
Services for occupational
health and for safety of operation, first aid 2
Training
1987 272,986 3,414 151,579 30,367 39,870
1988 287,826 3,617 160,679 32,168 40,882
1989 306,906 4,374 171,555 32,994 44,136
1990 337,696 5,164 188,894 34,025 47,525
1991 420,873 8,413 239,713 46,137 56,112
1992 480,361 6,461 271,343 55,555 66,685
1993 540,047 9,030 299,350 68,774 76,590
1994 563,483 7,352 321,515 72,690 78,877
1995 608,301 8,274 341,782 79,657 89,069
1996 633,617 7,496 349,242 86,477 92,269
1997 647,689 8,569 361,496 82,155 98,351
1998 660,549 7,504 372,412 79,222 99,414
1999 681,996 7,476 382,873 85,564 101,427
2000 716,525 6,689 412,802 83,756 104,241
2001 733,981 6,000 418,208 82,236 110,899
2002 769,717 5,349 432,477 85,965 122,551
2003 805,869 4,788 451,340 88,409 130,153
2004 813,308 4,453 458,435 87,476 130,070
2005 812,560 3,775 461,336 84,488 132,747
2006 816,908 3,340 467,937 81,696 134,589
2007 827,386 3,463 475,254 81,146 136,315
2008 892,268 3,264 518,940 88,560 135,590
2009 915,130 3,229 536,523 93,728 137,645
2010 911,435 3,074 534,342 94,944 118,150
2011 948,225 2,703 557,192 98,386 123,211
2012 1,013,342 2,264 587,129 102,892 121,803
2013 1,037,824 1,921 604,426 111,610 128,326
2014 1,083,191 1,817 624,137 119,076 133,496
2015 1,122,624 1,975 632,102 131,527 138,232
2016 1,168,921 1,810 652,527 145,589 140,605
1 Denotation in the account system befor the year under review 2010 “Advice to business and inspections”
2 Separate data as from 1997 only
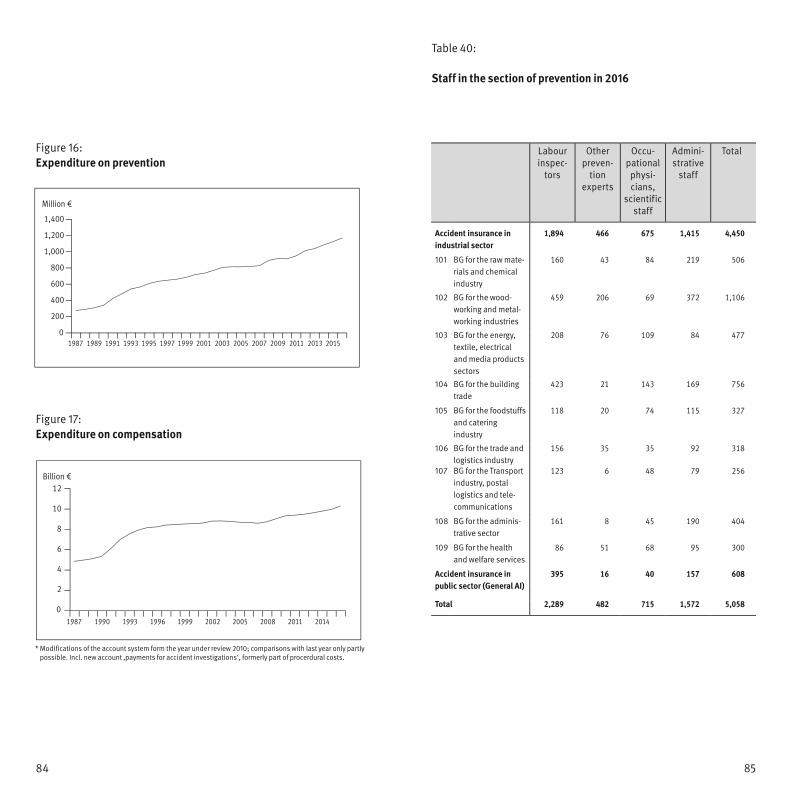
84 85
Table 40:
Staff in the section of prevention in 2016
Labour inspec-
tors
Other preven-
tion experts
Occu-pational
physi-cians,
scientific staff
Admini-strative
staff
Total
Accident insurance in industrial sector
1,894 466 675 1,415 4,450
101 BG for the raw mate-rials and chemical industry
160 43 84 219 506
102 BG for the wood-working and metal-working industries
459 206 69 372 1,106
103 BG for the energy, textile, electrical and media products sectors
208 76 109 84 477
104 BG for the building trade
423 21 143 169 756
105 BG for the foodstuffs and catering industry
118 20 74 115 327
106 BG for the trade and logistics industry
156 35 35 92 318
107 BG for the Transport industry, postal logistics and tele-communications
123 6 48 79 256
108 BG for the adminis-trative sector
161 8 45 190 404
109 BG for the health and welfare services
86 51 68 95 300
Accident insurance in public sector (General AI)
395 16 40 157 608
Total 2,289 482 715 1,572 5,058
Figure 16: Expenditure on prevention
Figure 17: Expenditure on compensation
6
4
0
2
8
12
10
1987 1990 1993 1996 1999 2002 2005 2008 2011 2014
Billion €
* Modifications of the account system form the year under review 2010; comparisons with last year only partly possible. Incl. new account ‚payments for accident investigations‘, formerly part of procerdural costs.
800
600
0
400
200
1,000
1,400
1,200
1987 1989 20111991 1993 1995 1997 1999 2001 2003 2005 2007 2009 2013 2015
Million €

86 87
Table 41:
Selected activities in the section of prevention in 2016
Table 42:
Consulting initiated by companies and insured persons 2016
Inspected companies 1/ educational institutions 2
Inspections in the
compa- nies 1 /
educational institutions 2
Safety deficiencies
found
Investigated accidents
Accident insurance in industrial sector
216,192 471,876 951,668 30,647
101 BG for the raw mate- rials and chemical industry
9,116 11,596 16,132 4,181
102 BG for the wood-working and metal-working industries
58,579 92,980 100,568 5,940
103 BG for the energy, textile, electrical and media products sectors
23,014 38,823 20,703 3,934
104 BG for the building trade
51,626 212,288 591,486 3,029
105 BG for the foodstuffs and catering industry
20,478 23,285 74,579 4,734
106 BG for the trade and logistics industry
30,866 57,787 113,257 6,356
107 BG for the Transport industry, postal logistics and tele-communications
12,419 12,755 14,072 624
108 BG for the adminis-trative sector
5,520 15,046 11,492 1,169
109 BG for the health and welfare services
4,574 7,316 9,379 680
Accident insurance in public sector
4,195 9,569 25,525 2,071
Total 220,387 481,445 977,193 32,718
1 Including assistance companies2 The inspected companies and inspections in the public sector include the educational
institutions of the pupil accident insurance
On-site consultation Consultation by telephone or in writing 1
Occupa- tionalsafety
Health protection
Occupa- tionalsafety
Health protection
Accident insurance in industrial sector
115,621 50,577 328,437 110,925
101 BG for the raw mate- rials and chemical industry
6,828 – – –
102 BG for the wood-working and metal-working industries
1,313 531 256 135
103 BG for the energy, textile, electrical and media products sectors
53,753 17,293 227,212 48,364
104 BG for the building trade
3,946 1,773 18,605 8,360
105 BG for the foodstuffs and catering industry
888 363 10,792 6,306
106 BG for the trade and logistics industry
10,665 3,900 5,501 2,149
107 BG for the Transport industry, postal logistics and tele-communications
11,956 9,324 10,484 15,314
108 BG for the adminis-trative sector
20,479 13,653 265 176
109 BG for the health and welfare services
5,793 3,740 55,322 30,121
Accident insurance in public sector
16,113 4,831 76,789 29,206
Total 131,734 55,408 405,226 140,131
1 Including consulting outside the permanent establishment

88 89
Table 43:
Occupational health and safety training seminars by target groups in 2016
Target groups Total number
of courses
Safety officers
OSH profes-sionals
Emplo-yers and
mana-gers
Com- pany
medical officers
Other com-pany
staff 1
Accident insurance in industrial sector
3,543 911 2,024 3 120,004 126,485
101 BG for the raw mate- rials and chemical industry
255 75 193 – 958 1,481
102 BG for the wood-working and metal-working industries
656 179 708 1 4,002 5,546
103 BG for the energy, textile, electrical and media products sectors
423 155 180 – 20,075 20,833
104 BG for the building trade
163 132 348 – 14,272 14,915
105 BG for the foodstuffs and catering industry
159 70 113 – 4,891 5,233
106 BG for the trade and logistics industry
461 67 97 2 25,550 26,177
107 BG for the Transport industry, postal logistics and tele-communications
135 20 79 – 110 344
108 BG for the adminis-trative sector
698 178 179 – 16,132 17,187
109 BG for the health and welfare services
593 35 127 – 34,014 34,769
Accident insurance in public sector
772 223 1,016 34 20,577 22,622
Total 4,315 1,134 3,040 37 140,581 149,107
1 Including first aid training
Target groups Total number
of courses
Safety officers
OSH profes-sionals
Emplo-yers and
mana-gers
Com- pany
medical officers
Other com-pany
staff 1
Accident insurance in industrial sector
69,518 19,129 33,449 372 1,591,496 1,713,964
101 BG for the raw mate- rials and chemical industry
5,286 2,907 2,792 – 17,674 28,659
102 BG for the wood-working and metal-working industries
14,208 4,025 11,485 271 55,805 85,794
103 BG for the energy, textile, electrical and media products sectors
7,901 2,713 3,204 – 307,881 321,699
104 BG for the building trade
3,159 1,892 5,956 – 160,401 171,408
105 BG for the foodstuffs and catering industry
2,838 1,109 1,866 – 74,563 80,376
106 BG for the trade and logistics industry
9,991 1,317 1,551 101 218,298 231,258
107 BG for the Transport industry, postal logistics and tele-communications
2,348 369 1,555 – 2,308 6,580
108 BG for the adminis-trative sector
12,990 4,209 3,091 – 243,747 264,037
109 BG for the health and welfare services
10,797 588 1,949 – 510,819 524,153
Accident insurance in public sector
15,504 2,319 19,056 642 310,235 347,756
Total 85,022 21,448 52,505 1,014 1,901,731 2,061,720
1 Including first aiders
Table 44:
Persons attending OSH training by target groups in 2016

90 91
Table 45:
Staff with responsibility for safety at work in 2016
Safety officers OSH professionals 1
Accident insurance in industrial sector
479,272 77,344
101 BG for the raw mate- rials and chemical industry
63,560 6,410
102 BG for the wood-working and metalworking industries
71,295 17,763
103 BG for the energy, textile, electrical and media products sectors
52,221 11,425
104 BG for the building trade 21,310 6,742
105 BG for the foodstuffs and catering industry
24,517 3,503
106 BG for the trade and logistics industry
36,275 6,716
107 BG for the Transport industry, postal logistics and telecom-munications
28,550 1,430
108 BG for the administrative sector
54,573 10,081
109 BG for the health and welfare services
126,971 13,274
Accident insurance in public sector
154,503 5,163
Total 633,775 82,507
1 Not available in pupil accident insurance

92
Deutsche GesetzlicheUnfallversicherung e.V. (DGUV)
Glinkastraße 4010117 BerlinTelefon 030 288763-800Fax 030 288763-808