Dgc 16 06_14-15 - rbc conference
29
1 CANADA’S INTERMEDIATE GOLD PRODUCER RBC Global Mining & Materials Conference Boston - June 14-15, 2016
-
Upload
detourgold -
Category
Investor Relations
-
view
8.508 -
download
1
Transcript of Dgc 16 06_14-15 - rbc conference
1
CANADA’S INTERMEDIATE GOLD PRODUCER
RBC Global Mining & Materials Conference Boston - June 14-15, 2016

2
Forward Looking Information This presentation contains certain forward-looking information and statements as defined in applicable securities law (referred to herein as
“forward-looking statements”). Forward-looking statements include, but are not limited to, statements with respect to strategic focus, 2016
guidance (gold production, total cash costs, all-in sustaining costs, additional non-sustaining capital, sustaining capital and exploration
costs), repayment of $125 M and refinancing <$300 million of the Convertible Notes before due date, expected future production and mining
activities, opportunities and objectives to optimize the operation, life of mine plan (gold production profile), testing plant capacity, improving
operating time, evaluation of processing MG fines, filing an EA for West Detour in Q3’16, proceeding with a preliminary cost estimate and
infrastructure design for Zone 58N, and continuation of exploration activities.
Forward-looking statements involve known and unknown risks, uncertainties and other factors which may cause actual results, performance
or achievements to be materially different from any of its future results, performance or achievements expressed or implied by forward-
looking statements. These risks, uncertainties and other factors include, but are not limited to, assumptions and parameters underlying the
life of mine plan not being realized, a decrease in the future gold price, discrepancies between actual and estimated production, changes in
costs (including labour, supplies, fuel and equipment), changes to tax rates; environmental compliance and changes in environmental
legislation and regulation, exchange rate fluctuations, general economic conditions and other risks involved in the gold exploration and
development industry, as well as those risk factors discussed in the section entitled “Description of Business - Risk Factors” in Detour
Gold’s 2015 AIF and in the continuous disclosure documents filed by Detour Gold on and available on SEDAR at www.sedar.com.
Such forward-looking statements are also based on a number of assumptions which may prove to be incorrect, including, but not limited to,
assumptions about the following: the availability of financing for exploration and development activities; operating and sustaining capital
costs; the Company’s ability to attract and retain skilled staff; sensitivity to metal prices and other sensitivities; the supply and demand for,
and the level and volatility of the price of, gold; the supply and availability of consumables and services; the exchange rates of the Canadian
dollar to the U.S. dollar; energy and fuel costs; the accuracy of reserve and resource estimates and the assumptions on which the reserve
and resource estimates are based; market competition; ongoing relations with employees and impacted communities and general business
and economic conditions. Accordingly, readers should not place undue reliance on forward-looking statements. The forward-looking
statements contained herein are made as of the date hereof, or such other date or dates specified in such statements.
All forward-looking statements in this presentation are necessarily based on opinions and estimates made as of the date such statements
are made and are subject to important risk factors and uncertainties, many of which cannot be controlled or predicted. Detour Gold
undertakes no obligation to update publicly or otherwise revise any forward-looking statements contained herein whether as a result of new
information or future events or otherwise, except as may be required by law.
All amounts are in US dollars except as noted.

3
Notes to Investors
Qualified Persons
The scientific and technical content of this presentation was reviewed, verified and approved by Drew Anwyll, P.Eng., Senior Vice President Technical
Services, and exploration results was reviewed, verified and approved by Guy MacGillivray, P.Geo., Exploration Manager , both Qualified Person as
defined by Canadian Securities Administrators National Instrument 43-101 “Standards of Disclosure for Mineral Projects”.
Information Containing Estimates of Mineral Reserves and Resources The mineral reserve and resource estimates reported in this presentation were prepared in accordance with Canadian National Instrument 43-
101Standards of Disclosure for Mineral Projects (“NI 43-101”), as required by Canadian securities regulatory authorities. For United States reporting
purposes, the United States Securities and Exchange Commission (“SEC”) applies different standards in order to classify mineralization as a reserve. In
particular, while the terms “measured,” “indicated” and “inferred” mineral resources are required pursuant to NI 43-101, the SEC does not recognize such
terms. Canadian standards differ significantly from the requirements of the SEC. Investors are cautioned not to assume that any part or all of the mineral
deposits in these categories constitute or will ever be converted into reserves. In addition, “inferred” mineral resources have a great amount of uncertainty
as to their existence and great uncertainty as to their economic and legal feasibility. It cannot be assumed that all or any part of an inferred mineral
resource will ever be upgraded to a higher category. Under Canadian securities laws, issuers must not make any disclosure of results of an economic
analysis that includes inferred mineral resources, except in rare cases.
Non-IFRS Financial Performance Measures The Company has included non-IFRS measures in this presentation: total cash costs and all-in sustaining costs. The Company believes that these
measures, in addition to conventional measures prepared in accordance with IFRS, provide investors an improved ability to evaluate the underlying
performance of the Company. The non-IFRS measures are intended to provide additional information and should not be considered in isolation or as a
substitute for measures of performance prepared in accordance with IFRS. These measures do not have any standardized meaning prescribed under
IFRS, and therefore may not be comparable to other issuers. Other companies may calculate these measure differently.
Detour Gold reports total cash costs on a sales basis. Total cash costs include production costs such as mining, processing, refining and site
administration, agreements with Aboriginal communities, less non-cash share-based compensation and net of silver sales divided by gold ounces sold to
arrive at total cash costs per gold ounce sold. The measure also includes other mine related costs incurred such as mine standby costs and current
inventory write downs. Production costs are exclusive of depreciation and depletion. Production costs include the costs associated with providing the
royalty in kind ounces.
The Company believes the measure all-in sustaining costs more fully defines the total costs associated with producing gold. The Company calculates all-in
sustaining costs as the sum of total cash costs (as described above), share-based compensation, corporate general and administrative expense,
exploration and evaluation expenses that are sustaining in nature, reclamation cost accretion, sustaining capital including deferred stripping, and realized
gains and losses on hedges due to operating and capital costs, all divided by the gold ounces sold to arrive at a per ounce figure.
Costs excluded from all-in sustaining costs are non-sustaining capital expenditures and exploration costs that are expected to materially increase
production, financing costs and tax expense. Consequently, this measure is not representative of all of the Company’s cash expenditures. In addition, the
calculation of all-in sustaining costs does not include depreciation and depletion expense as it does not reflect the impact of expenditures incurred in prior
periods.
4
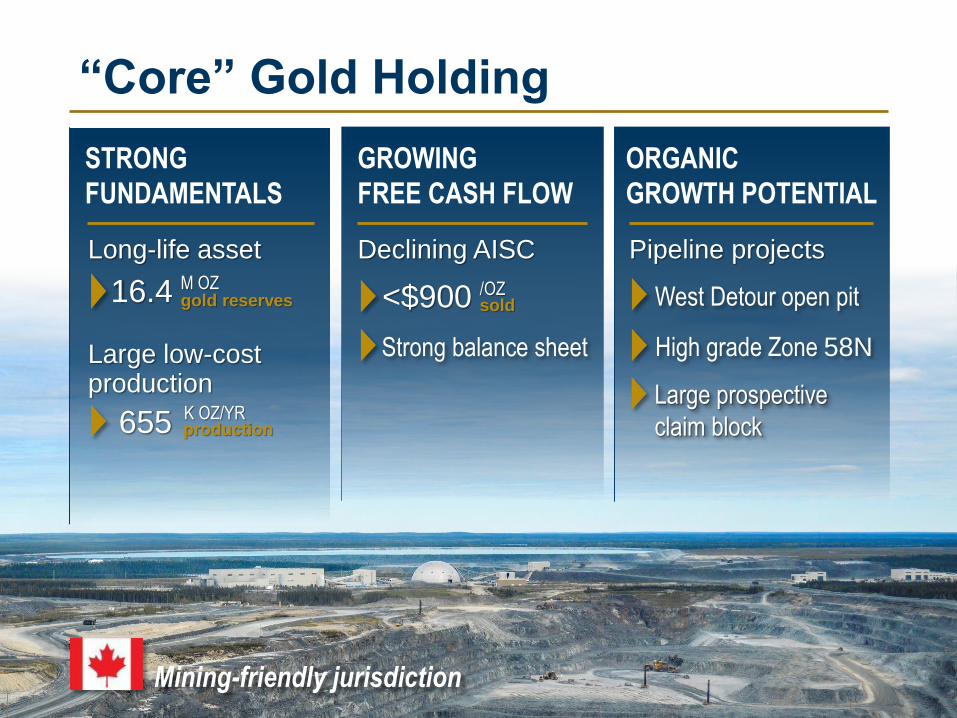
STRONG
FUNDAMENTALS
16.4 M OZ gold reserves
655 K OZ/YR
“Core” Gold Holding
GROWING
FREE CASH FLOW
<$900 /OZ sold
ORGANIC
GROWTH POTENTIAL
High grade Zone 58N
Long-life asset
production
Large low-cost production
Declining AISC Pipeline projects
West Detour open pit
Mining-friendly jurisdiction
Large prospective
claim block
Strong balance sheet

5
OPERATIONS GROWTH BALANCE SHEET
Mine and mill optimization
Organic growth valuation
Debt reduction
Realize on economies of scale
Add value with: Maintain capital discipline
Satellite deposit development
Early-stage project acquisition
Shareholder returns
Strategic Focus
6
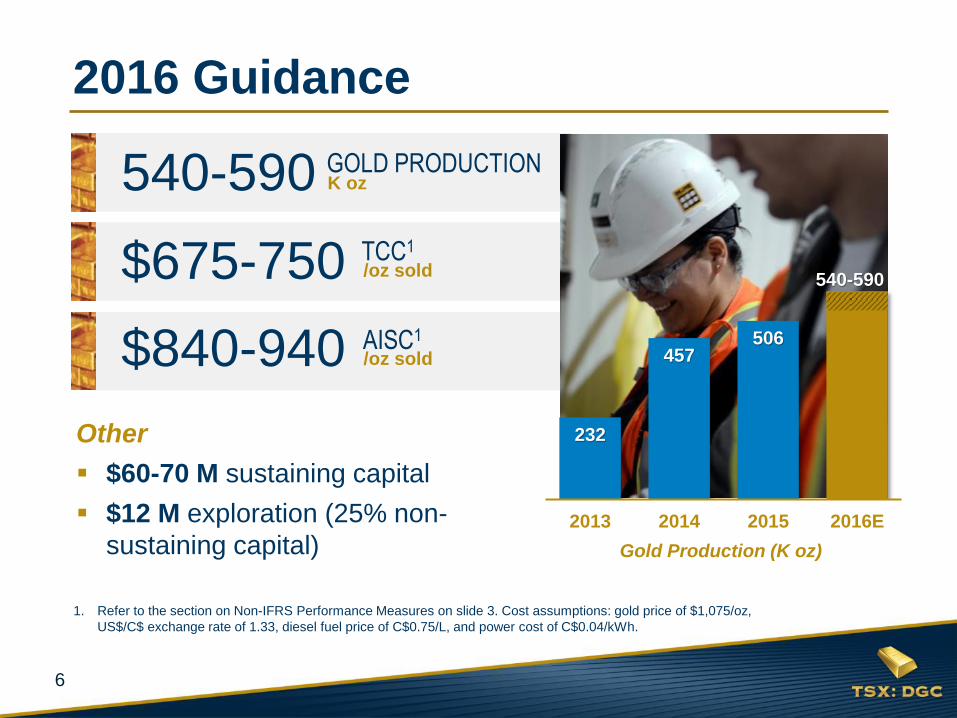
1. Refer to the section on Non-IFRS Performance Measures on slide 3. Cost assumptions: gold price of $1,075/oz,
US$/C$ exchange rate of 1.33, diesel fuel price of C$0.75/L, and power cost of C$0.04/kWh.
2016 Guidance
540-590 GOLD PRODUCTION K oz
$675-750 TCC1
/oz sold
$840-940
Other
$60-70 M sustaining capital
$12 M exploration (25% non-
sustaining capital)
AISC1
/oz sold
232
457 506
2013 2014 2015 2016E
Gold Production (K oz)
540-590

7
$500 $500 $500
$425
$181
$123
2013 2014 2015 Apr. '16 Nov. '17
Short-term Debt ($M) Convertible Notes ($M)
On or before Convertible
Notes due date:
Pay back >$125 M
Re-finance <$300 M
<$300
Plan for Further Debt Reduction
Nov.’17 E
~$200 M debt reduction in
just over 1 year
April 2016: Purchased $75 M of Convertible Notes

8
2016 Mine Plan Focus
Phase 1 Pit
Campbell pit
pioneering 2016 Phase 2
Late 2016/17
Phase 2
Status:
Peat layer removed
Mine Focus for 2016:
Targeting mining rates of 250,000-270,000 tpd for H2 2016
› Phase 1 mining rate on track
› Phase 2 pioneering to accelerate with additional shovel in June
Improving open pit blast fragmentation

9
2016 Processing Plant Focus
Successful planned shutdown completed 1st half of April:
410-conveyor system split into 2 conveyors and speed increased
for higher crushing rates

10
Plant performance with new 410-Conveyor to date
2,486 2,680
2,458
2,153
2,852
0%
20%
40%
60%
80%
100%
2014 2015 Q1 2016 DuringShutdown
PostShutdown
H2 2016 E
1,000
1,500
2,000
2,500
3,000
3,500
(Apr 21-May 31) (Apr 4-20)
Operating
Time Milling Rates (tpoh)
Target:
2,700- 3,000
2016 Processing Plant Focus

11
2,852 2,850
3,200
Post Shutdown*
LOM
Milling Rates (tpoh)
Plant Known Limit
Plant Optimization: What is Next?
*April 21-May 31
Continue to test plant limit with new
410-conveyor: in progress
Improve fragmentation: in progress
Evaluate processing fines from MG
stockpile (20-25 koz/yr not in LOM):
in progress
Process LG fines (17 koz/yr in LOM):
2017
Improve operating time from 88% to
92%: in progress
12
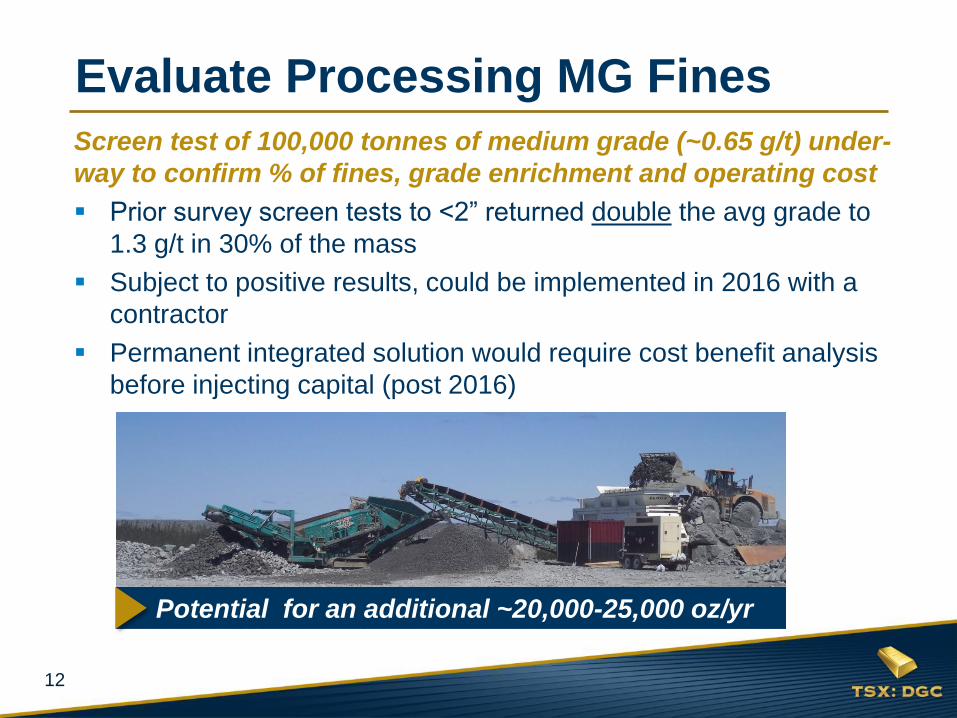
Evaluate Processing MG Fines
Potential for an additional ~20,000-25,000 oz/yr
Screen test of 100,000 tonnes of medium grade (~0.65 g/t) under-
way to confirm % of fines, grade enrichment and operating cost
Prior survey screen tests to <2” returned double the avg grade to
1.3 g/t in 30% of the mass
Subject to positive results, could be implemented in 2016 with a
contractor
Permanent integrated solution would require cost benefit analysis
before injecting capital (post 2016)

13
Adding West Detour in 2019
De-risk operation (2nd feed source)
Ability to defer 160 Mt of waste over next 9 yrs
(lower strip ratio)
Low capital of ~$80 M
Potential use of pit for waste stockpiles and
tailings deposition
200
400
600
800
16-18 19-21 22-24 25-27 28-30 31-33 34-36 37-38
Low-Grade Fines
West Detour
Detour Lake
Production
(koz) ~650 koz/yr
for next 9 yrs
YEAR 20’
WEST
DETOUR
ADVANTAGES

14
Gold Production Projected in Q1 2019
2015 2016 2017 2018
Permitting Schedule Q2 Q3 Q4 Q1 Q2 Q3 Q4 Q1 Q2 Q3 Q4 Q1 Q2 Q3 Q4 Q1
Baseline Studies
Consultation & EA
Operating Permits
Operation Readiness
Pre-stripping (Phase 1)
Gold Production
West Detour Permitting Schedule
Start equipment procurement this year
File Provincial EA in Q3
2019

15
8-Year Plan
Find and develop
satellite deposits
to feed plant with
higher grade
Modest funding
requirement until
discovery
Organic Growth Valuation
625 km2
Zone 58N
Detour Lake Mine
West Detour
Pipeline Projects
West Detour
(pre-strip in 2018)
Zone 58N
(infill drilling)

16
Detour Lake: Lower Detour Trend
Zone 58N
Detour Lake Mine
West Detour Lower Detour Trend (LDT)
Most prospective area at
this time
Significantly underexplored
25 km trend
Completed 9,977 m in
36 holes in winter 2016
Completed IP geophysical
survey at east end of trend
Drilling program resuming
this summer
6,000 m to test additional
targets
TMA Target

17
LDT: Advancing Zone 58N
2016 Exploration Program:
60,000 m infill drilling program
At 25 m spacing
› Upper 250 metres
› Test continuity of geology
and grade
At 50 m spacing
› Lower 450 metres
› Define extent and tonnage
Status: 61% of drilling completed
36,830 m in 119 holes
Program resuming this summer
Isometric View (3D) Looking West
>3 g/t Au

18
LDT: Advancing Zone 58N
2016 Exploration Program
Results received to date
are in line with prior
results
Metallurgical testing
underway
Proceeding with a
preliminary cost
estimate and
infrastructure design for
UG exploration program
Long Section Looking North

19
INTERMEDIATE GOLD PRODUCER
PRODUCTION GROWTH /
DECLINING UNIT COSTS
REALIZE VALUE-ENHANCING
OPPORTUNITIES
GROWING CASH FLOW

21
ADDITIONAL information
Safety Performance
Quarterly Operational
Statistics
LOM Production Plan
Year-End 2015 Reserves
and Resources
Status of LOM Plan
Opportunities
Shareholder Information
Analyst Coverage
Management & Directors
Contact Information

22
2.5 2.3
1.6
0.0
0.5
1.0
1.5
2.0
2.5
2014 2015 2016 todate
Total Recordable Injury
Frequency Rate (TRIFR)1
Safety Performance
1. TRIFR: Total recordable injuries x 200,000 hours divided by total man hours worked.
12 Month Rolling
Avg: 2.18
Committed to Zero-Harm:
Initiatives implemented to improve safety
culture and performance:
› Visible Felt Leadership (VFL)
› Life Saving Rules
› Leading Indicators:
Workplace inspections PPE audits
Job observations Safety equipment inspections
Housekeeping audits VFL interactions
At corporate and site, SAFETY performance is
part of the KPIs
› In 2017, Leading Indicators performance
will also be included in KPIs at corporate

23
Q1’16 Q4’15 Q3’15 Q2’15 Q1’15 Q4’14 Q3’14 Q2’14
Ore mined (Mt) 5.8 6.3 6.5 6.4 3.8 4.3 4.2 2.9
Waste mined (Mt) 15.2 15.7 17.0 19.1 16.0 15.4 14.7 16.1
Total mined (Mt) 21.0 22.0 23.5 25.5 19.8 19.7 18.9 19.0
Strip ratio (waste:ore) 2.6 2.5 2.6 3.0 4.2 3.6 3.5 5.6
Mining rate (tpd) 231,000 239,000 255,000 280,000 220,000 214,000 206,000 209,000
Ore milled (Mt) 4.7 5.1 5.2 5.2 4.3 4.7 4.5 4.4
Mill grade (g/t Au) 0.91 0.98 0.86 0.82 0.84 0.85 0.88 0.91
Recovery (%) 91 91 90 91 91 91 90 91
Mill throughput (tpd) 52,165 55,522 56,015 57,015 47,797 51,142 49,186 48,569
Mill availability (%) 88 86 85 88 78 83 81 83
Ounces produced (oz) 127,136 146,417 128,222 125,348 105,572 116,770 115,344 117,366
Ounces sold (oz) 137,608 132,209 126,241 123,296 104,497 124,913 106,334 107,206
Quarterly Operational Statistics

24
LOM Production Plan
Yearly Average per Period Total
2016-
18
2019-
21
2022-
24
2025-
27
2028-
30
2031-
33
2034-
36
2037-
38 LOM LOM
Ore milled (Mt) 21.4 23.0 23.0 23.0 23.0 23.0 23.0 18.1 22.4 514
Head grade (g/t Au) 0.98 0.89 1.06 0.89 0.87 1.06 1.15 1.08 0.99 0.99
Gold recovery (%) 91.5 92.0 92.0 92.0 92.0 92.0 92.0 92.0 91.9 91.9
Gold production (k oz) 617 607 721 604 589 719 781 580 655 15,072
Total mined (Mt) 104.8 119.4 118.8 123.2 118.7 88.5 51.5 19.4 96.3 2,214
Strip ratio (waste:ore) 3.8 4.9 3.5 4.9 5.5 2.5 1.4 0.5 3.5 3.5
Technical Report filed on January 25, 2016.

25
Year-end 2015 Reserves & Resources Notes:
1. Mineral resources and reserves were
completed by Detour Gold in conformity
with generally accepted definitions and
guidelines given in the Canadian Institute
of Mining, Metallurgy and Petroleum (CIM)
Standards on Mineral Resources and
Mineral Reserves as required by NI 43-
101.
2. Mineral reserves were estimated using a
gold price of $1,000/oz and mineral
resources were estimated using a gold
price of $1,200/oz at a US$/C$ exchange
rate of 1.10.
3. Mineral reserves and resources were
based on a cut-off grade of 0.50 g/t Au.
4. Mineral reserves included an average
mining dilution of 5.3% from 2016 to 2018
and 4% for 2018+, at a diluting grade of
0.20g/t Au. Mining ore loss of 5% also
included.
5. Only Probable LG Fines scheduled in the
mine plan were reported as mineral
reserves. The LG fines reserves were
based on a cut-off grade of 0.40 g/t Au.
6. Mineral resources are reported exclusive
of mineral reserves. Mineral resources
that are not mineral reserves do not have
demonstrated economic viability.
7. Totals may not add due to rounding.
At Dec. 31, 2015
Reserves Tonnes
(millions)
Grade
(g/t Au)
Contained
Gold Ounces
(000’s oz)
Detour Lake Mine Proven 89.2 1.26 3,603
Probable 351.6 0.95 10,779
Stockpiles 4.8 0.64 98
Total P&P 445.5 1.01 14,480
West Detour Proven 1.8 0.99 56
Probable 47.0 0.97 1,473
Total P&P 48.8 0.98 1,529
LG Fines Probable 20.0 0.60 386
Total P&P 514.3 0.99 16,395
Resources
Detour Lake Mine Measured 17.4 1.33 746
Indicated 66.2 1.00 2,125
M+I 83.6 1.07 2,871
West Detour Measured 0.4 0.85 10
Indicated 36.5 0.86 1,005
M+I 36.9 0.86 1,015
Total M+I 120.5 1.00 3,886
Detour Lake Mine Inferred 33.7 0.81 875
West Detour Inferred 8.6 0.89 246
Total Inferred 42.3 0.82 1,121

26
Status LOM Plan Opportunities Opportunity
Area Description Status
Processing
Plant
Early addition of LG Fines Included in LOM plan starting in 2019; now targeting for 2017.
Addition of medium grade fines Testing in Q2; if positive results proceeding immediately.
West Detour is softer ore Not started.
Increasing secondary and pebble
crushers operating time
Improving steadily.
Increase ball mill power draw Work underway with suppliers; 0.5 MW per ball mill identified as possible.
Metallurgical Improvement Plan Lead nitrate system planned for 2017 with other improvements to gravity
and CIP circuit, and managing liquid losses
Increased plant operating time Improving steadily; performance of 410-conveyor was a catalyst.
Pebble extractor Planned for end of mine life.
Mine
Open pit unit costs Reaching economies of scale is first order of business. Good progress on
roads resulting in extended tire life.
“Continuous Improvement” Projects In the process of filling a new plant role at superintendent level.
Open pit fragmentation Mine to mill program getting some early wins. Measurable positive impact in
plant in May.
Block model reconciliation Block model reconciliation has shown additional ore tonnage to date;
continued trend would extend mine life or increase ore production and
reduce yearly stripping requirements.
West Detour operational readiness
plan
Trade-off on truck size expected in Q3’16.
TMA and Waste
Rock SP
Further optimization for placement of
tailings and waste rock
In progress with new engineering firm from B.C.
Exploration
Inferred material between Detour Lake
and West Detour pits
If this material is converted to mineral reserves, it would reduce the strip
ratio of Detour Lake pit in Stages 3 & 4 and add ounces. No progress.
Lower Detour/ Zone 58N Infill drilling program in 2016.

27
1. Conversion price for the Notes is $38.50.
2. Cash and short-term investments at March 31, 2016.
Shareholder Information
>80% INSTITUTIONS TOTAL
7.1 M Share options
11.0 M Convertible notes 1
190.8 M FULLY DILUTED
172.7 M Issued & outstanding
Share Structure (03/31/2014) Top Shareholders
<10%
C$5.5 BILLION market cap $214 MILLION
cash position2
Share Structure (April 27, 2016) Top Shareholders
BlackRock
6% Van Eck Associates
5% Tocqueville

28
Initiating
Research Firm Analyst Target Price at
June 9, 2016
07.06.11 Haywood Kerry Smith $32.00
07.07.09 Paradigm Don Blyth/Don MacLean $32.25
07.08.07 Raymond James Phil Russo $30.00
07.11.26 National Bank Steve Parsons $32.25
07.12.20 Macquarie Mike Siperco $35.00
08.01.14 Canaccord Rahul Paul $32.00
08.07.14 TD Dan Earle $35.00
08.09.04 RBC Dan Rollins $27.00
08.11.06 BMO Brian Quast $37.25
09.06.17 Laurentian Pierre Vaillancourt $30.00
10.05.19 CIBC World Markets Cosmos Chiu $28.00
10.07.22 Credit Suisse Anita Soni $35.00
13.04.16 Scotiabank Trevor Turnbull $32.00
13.08.14 Desjardins Michael Parkin $35.00
13.11.12 Beacon Securities Michael Curran $34.00
13.12.09 GMP Securities Ian Parkinson $25.25
14.02.06 Cormark Securities Richard Gray/Tyron Breytenbach $36.00
14.04.22 Goldman Sachs Andrew Quail $28.00
14.06.17 Dundee Capital Markets Josh Wolfson $40.00
16.06.06 Bank of America Merrill Lynch Michael Jalonen $35.00
Average target C$32.55
Analyst Coverage (19)

29
Paul Martin President and CEO
Pierre Beaudoin COO
James Mavor CFO
Drew Anwyll Sr VP Technical Services
Julie Galloway Sr VP General Counsel &
Corporate Secretary
Derek Teevan Sr VP Corporate &
Aboriginal Affairs
Jean-François Métail VP Mineral Resource
Management
Ruben Wallin VP Environment & Sustainability
Charles Hennessey Mine General Manager
Laurie Gaborit Director Investor Relations
Alberto Heredia Controller
Lisa Colnett
Edward C. Dowling
Robert E. Doyle
André Falzon
Alex G. Morrison
Jonathan Rubenstein
Graham Wozniak
Ingrid Hibbard
Michael Kenyon
Paul Martin
Management & Directors
Management
Directors

30
Laurie Gaborit Director Investor Relations
Email: [email protected]
Phone: 416.304.0581
Paul Martin President and Chief Executive Officer
Email: [email protected]
Phone: 416.304.0800
www.detourgold.com
Contact Information