DGA Whitepaper2
6
The Transition to Next-Generation Online DGA Monitoring Technologies Utilizing Photo-Acoustic Spectroscopy DONAL SKELLY GE Digital Energy g imagination at work Industry White Paper Part 2 of a 2 part series Expanded Technical Insights and Results
description
DGA Whitepaper2
Transcript of DGA Whitepaper2
The Transition to Next-Generation Online DGA Monitoring Technologies Utilizing Photo-Acoustic Spectroscopy
Donal Skelly GE Digital Energy
g imagination at work Industry White Paper
Part 2 of a 2 part series
Expanded Technical Insights and Results

The
Tran
siTi
on T
o n
exT-
Gen
eraT
ion
on
lin
e DG
a M
oniT
orin
G Te
chn
oloG
ies
UTil
izin
G Ph
oTo-
acoU
sTic
sPe
cTro
scoP
y
©2013 General electric company. all riGhts reserved.
Dissolved Gas Analysis When the oil or paper insulation in a power transformer is stressed, such as under elevated temperature conditions associated with high load and/or fault conditions, or over time under normal operating conditions, both may break down to form a range of by-products and simple gases (1). These gases normally dissolve into the oil immediately following their creation and remain there indefinitely (if they cannot escape from the electrical equipment via a breather or a leak).
The gases that are associated with specific fault types are Hydrogen (H2), Carbon Dioxide (CO2), Carbon Monoxide (CO), Ethane (C2H6), Methane (CH4), Ethylene (C2H4) and Acetylene (C2H2). They are known collectively as the “diagnostic gases”.
Analysis of these gases allows for the diagnosis of developing faults using a variety of methods, including Duval’s Triangle, Key Gas Method etc…
Traditionally DGA was limited to a laboratory environment because of the complexity of the equipment required to first extract gases from the oil sample taken and then measure these gases, often at quantities as low as one part-per-million (ppm). Historically gas extraction from a sample was performed using a strong vacuum pump called a Toepler pump apparatus (1). More recently, IEC, ASTM and others have published a new gas extraction technique, “Headspace Gas Extraction”, which is becoming standard in laboratories due to its convenience, excellent repeatability and perhaps more importantly its inherent suitability for automation. Historically the DGA technique comprised of an extraction process (such as the aforementioned headspace) and Gas
AbstractDissolved Gas Analysis (DGA) is recognised as a powerful monitoring technique for the detection of developing faults within transformer main tanks and associated oil filled equipment. Extensive historical data, collected by laboratory analysis over the years, allows for accurate result interpretation. Online DGA has become increasingly relevant for timely fault detection, especially in the context of the ageing worldwide transformer fleet.
Aspects of laboratory DGA are presented to illustrate the evolution from laboratory analysis to on-line DGA. The benefits of GC are outlined together with an analysis of the difficulties associated with the use of this technology in field based on-line instruments. An introduction to photoacoustic technology is offered, together with examples of benefits associated with using this robust technology in the challenging substation environment. Examples or successful applications of this technology are presented and discussed.
AbbreviationsPAS: Photo-Acoustic Spectroscopy
DGA: Dissolved Gas Analysis
GC: Gas Chromatography

The
Tran
siTi
on T
o n
exT-
Gen
eraT
ion
on
lin
e DG
a M
oniT
orin
G Te
chn
oloG
ies
UTil
izin
G Ph
oTo-
acoU
sTic
sPe
cTro
scoP
y
©2013 General electric company. all riGhts reserved.©2013 General electric company. all riGhts reserved.
On-Line, Remote DGA
Recent advances in gas detection technology have seen DGA move out of the laboratory and into the field. Starting with composite gas detectors capable of passively sampling fault gases through a membrane, online DGA has advanced to a point where full 9+ gas analysis can now be performed routinely. By adding communication to the monitoring units, users can now remotely track daily, weekly and seasonal gassing trends as well as detect abnormal gassing events. Based on the ever rising number of installed instruments, it is clear that online DGA is becoming increasingly accepted as one of the most effective methods for monitoring oil filled electrical equipment. Applied across generation, transmission and distribution transformers, more than 80,000 online monitors are now in operation worldwide.
Historically, multigas on-line monitoring devices were based around versions of laboratory GC equipment, packaged to allow them to work in a field environment. Photo Acoustic Spectroscopy (PAS) based DGA instruments entered the market more recently (2). Utilising detection technology normally associated with urban pollution monitoring, PAS based systems for DGA employ the common headspace gas extraction technique but use an infrared/acoustic based detector for gas measurement.
This paper will look at the application of this innovative technique Photo Acoustic Spectroscopy (PAS), and its application to online DGA, its challenges and benefits.
PAS Technology
Photo Acoustic Spectroscopy (PAS) works along the following principle: A gas substance absorbs light energy following local heating by an IR light and transforms it into kinetic energy (by the energy exchange process). Regularly interrupting this process causes a series of pressure waves (sound) that can be detected by microphones. By measuring the sound at different wavelengths,
Chromatography (GC) as a measuring method. Standards such as IEC60567 have acknowledged that this technique is sensitive and repeatable for performing DGA in a laboratory environment. Repeatability and accuracy have been documented and various diagnostic techniques have been developed on the basis of results obtained using such a system.
Due to the time and costs involved (site visit, logistics and laboratory analysis), DGA analysis of an oil sample would usually be restricted to once per year, with repeated or more frequent samples collected and tested only if significant fault gases were detected in the routine annual sample. As many types of faults can progress significantly in less than one year, this approach often resulted in missed diagnostic opportunities. Faults could occur and progress for up to 12 months before being detected and significant damage would be caused to the transformer in the mean-time as a result.
For this reason, there has been a dramatic increase in recent years of technology companies offering instrumentation mounted on the transformer and capable of performing online automated DGA at a frequency up to one sample per hour.
4000 3000 2000
1800
10002,380CO2
1460, 1380nujol
cm-1
X-H Attached to heteroatoms C-H
2800 2300 21004000 3200N H O H
Triples Doubles Singles
1500 Finger printC NC C
C OC N
C C
the photo acoustic spectrum of a gas sample can be recorded. This spectrum can then be used to identify the absorbing components of the sample (3).
Figure 1. Generic location of bond absorptions that can lead, through vibrational excitation to the acoustic effect in a Photoacoustic Spectrometer. When the exact compounds of interest are known specific regions of the spectrum can be focused upon for quantitative and qualitative analysis.
Figure 2. Diagram of a generic photoacoustic analyser. The IR energy from the source is focused into the measurement cell, containing a gas sample. The IR energy is pulsed by the action of the rotating chopper wheel and filtered to produce a qualitative and quantitative acoustic signal for a targeted bandwidth.
When the target gases are known, such as in the DGA application, IR filters are used to select regions of the infrared spectrum that overlap with the target gas absorption spectrum. Broadband IR is produced by a black body IR source. This method achieves parts per million gas detection levels for multiple gas species (Table 1)
Table 1. Gases detected using Photoacoustic Spectroscopy and approximate lower detection level (LDL) of each gas in the gas phase.
Wavelength Selection(Filter wheel)
AnalysisChamber
ChopperWheel
RadiationSource
ParabolicMirror
Sample IN
MicrophoneMicrophone
Sample OUT
GAS Lower DeteCtioN LeveL iN GAS (PPM)
Carbon Dioxide (CO2) <1
Carbon Monoxide (CO) <1
Methane (CH4) <1
Ethane (C2H6) <1
Ethylene (C2H4) <1
Acetylene (C2H2) <0.2
The
Tran
siTi
on T
o n
exT-
Gen
eraT
ion
on
lin
e DG
a M
oniT
orin
G Te
chn
oloG
ies
UTil
izin
G Ph
oTo-
acoU
sTic
sPe
cTro
scoP
y
©2013 General electric company. all riGhts reserved.
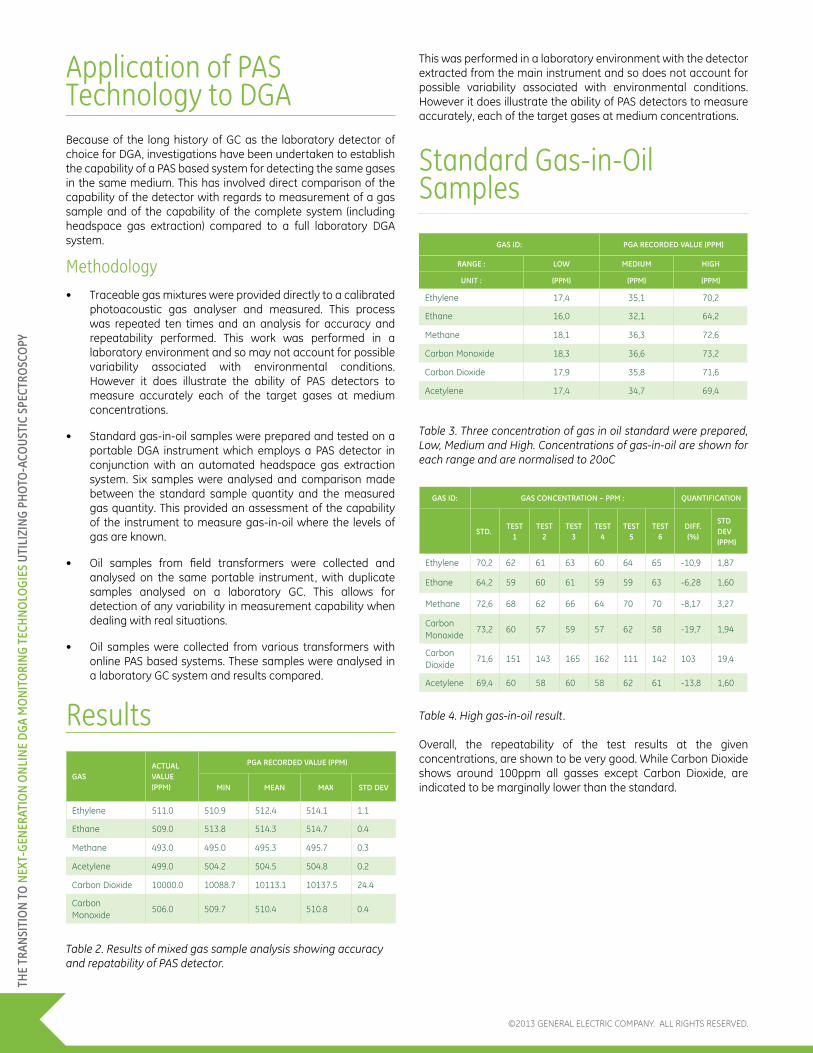
This was performed in a laboratory environment with the detector extracted from the main instrument and so does not account for possible variability associated with environmental conditions. However it does illustrate the ability of PAS detectors to measure accurately, each of the target gases at medium concentrations.
Standard Gas-in-OilSamples
Table 3. Three concentration of gas in oil standard were prepared, Low, Medium and High. Concentrations of gas-in-oil are shown for each range and are normalised to 20oC
Table 4. High gas-in-oil result.
Overall, the repeatability of the test results at the given concentrations, are shown to be very good. While Carbon Dioxide shows around 100ppm all gasses except Carbon Dioxide, are indicated to be marginally lower than the standard.
Application of PASTechnology to DGABecause of the long history of GC as the laboratory detector of choice for DGA, investigations have been undertaken to establish the capability of a PAS based system for detecting the same gases in the same medium. This has involved direct comparison of the capability of the detector with regards to measurement of a gas sample and of the capability of the complete system (including headspace gas extraction) compared to a full laboratory DGA system.
Methodology• Traceable gas mixtures were provided directly to a calibrated
photoacoustic gas analyser and measured. This process was repeated ten times and an analysis for accuracy and repeatability performed. This work was performed in a laboratory environment and so may not account for possible variability associated with environmental conditions. However it does illustrate the ability of PAS detectors to measure accurately each of the target gases at medium concentrations.
• Standard gas-in-oil samples were prepared and tested on a portable DGA instrument which employs a PAS detector in conjunction with an automated headspace gas extraction system. Six samples were analysed and comparison made between the standard sample quantity and the measured gas quantity. This provided an assessment of the capability of the instrument to measure gas-in-oil where the levels of gas are known.
• Oil samples from field transformers were collected and analysed on the same portable instrument, with duplicate samples analysed on a laboratory GC. This allows for detection of any variability in measurement capability when dealing with real situations.
• Oil samples were collected from various transformers with online PAS based systems. These samples were analysed in a laboratory GC system and results compared.
Results
Table 2. Results of mixed gas sample analysis showing accuracy and repatability of PAS detector.
GAS iD: GAS CoNCeNtrAtioN – PPM : QuANtifiCAtioN
StD.teSt
1teSt
2teSt
3teSt
4teSt
5teSt
6Diff. (%)
StD Dev (PPM)
Ethylene 70,2 62 61 63 60 64 65 -10,9 1,87
Ethane 64,2 59 60 61 59 59 63 -6,28 1,60
Methane 72,6 68 62 66 64 70 70 -8,17 3,27
Carbon Monoxide
73,2 60 57 59 57 62 58 -19,7 1,94
Carbon Dioxide
71,6 151 143 165 162 111 142 103 19,4
Acetylene 69,4 60 58 60 58 62 61 -13,8 1,60
GASACtuAL vALue (PPM)
PGA reCorDeD vALue (PPM)
MiN MeAN MAx StD Dev
Ethylene 511.0 510.9 512.4 514.1 1.1
Ethane 509.0 513.8 514.3 514.7 0.4
Methane 493.0 495.0 495.3 495.7 0.3
Acetylene 499.0 504.2 504.5 504.8 0.2
Carbon Dioxide 10000.0 10088.7 10113.1 10137.5 24.4
Carbon Monoxide
506.0 509.7 510.4 510.8 0.4
GAS iD: PGA reCorDeD vALue (PPM)
rANGe : Low MeDiuM HiGH
uNit : (PPM) (PPM) (PPM)
Ethylene 17,4 35,1 70,2
Ethane 16,0 32,1 64,2
Methane 18,1 36,3 72,6
Carbon Monoxide 18,3 36,6 73,2
Carbon Dioxide 17,9 35,8 71,6
Acetylene 17,4 34,7 69,4

The
Tran
siTi
on T
o n
exT-
Gen
eraT
ion
on
lin
e DG
a M
oniT
orin
G Te
chn
oloG
ies
UTil
izin
G Ph
oTo-
acoU
sTic
sPe
cTro
scoP
y
©2013 General electric company. all riGhts reserved.©2013 General electric company. all riGhts reserved.
Table 5. Medium gas-in-oil results
Overall, the repeatability of the test results at the given concentrations, are shown to be very good. The accuracy of Ethylene, Ethane, and Methane are within 10% of the Standard, while Acetylene at this particular concentration, can be regarded as more than adequate for transformer DGA. All gasses except CO2 and C2H6 (which is only slightly more positive) indicate slightly lower than the Standard value.
Table 6. Low gas-in-oil results
Overall, the repeatability of the test results at the given concentrations, are shown to be very good. The nominal accuracy of all the gasses excepting Carbon Dioxide and Carbon Monoxide are within 10% of the Standard, however at these low concentrations a 1 to 2 ppm result difference is insignificant. Therefore the results can be regarded as more than adequate for transformer DGA. While in general the indicated values are slightly below the expected Standard, Ethane, Methane and Carbon Dioxide are shown to indicate marginally higher than the Standard. The Carbon Dioxide result consistently indicates about 100ppm higher than the standard for all concentrations. Again for transformer monitoring purposes this is adequate and especially so at these very low levels.
GAS iD: GAS CoNCeNtrAtioN – PPM : QuANtifiCAtioN
StD.teSt
1teSt
2teSt
3teSt
4teSt
5teSt
6Diff. (%)
StD Dev (PPM)
Ethylene 35,1 31 33 33 32 34 35 -5,98 1,41
Ethane 32,1 29 31 32 32 37 33 +0,73 2,66
Methane 36,3 31 34 35 33 36 38 -4,96 2,43
Carbon Monoxide
36,6 29 30 31 29 31 31 -17,6 0,98
Carbon Dioxide (CO2)
35,8 130 139 122 131 121 122 +256 7,12
Acetylene 34,7 29 31 31 30 32 32 -11,1 1,17
GAS iD: GAS CoNCeNtrAtioN – PPM : QuANtifiCAtioN
StD.teSt
1teSt
2teSt
3teSt
4teSt
5teSt
6Diff. (%)
StD Dev (PPM)
Ethylene 17,4 17 17 17 17 17 16 -3,26 0,41
Ethane 16,0 17 17 18 15 15 16 +2,08 1,21
Methane 18,1 19 19 17 19 18 18 +1,29 0,82
Carbon Monoxide
18,3 15 16 16 14 16 15 -16,2 0,82
Carbon Dioxide
17,9 110 109 131 124 105 111 +542 10,14
Acetylene 17,4 16 16 16 16 15 15 -9,96 0,52
In-service transformer oilPAS versus GCThe consistency of results for a random sample of oil from an in-service transformer, were checked by PAS analysis and also the Laboratory Head Space Analysis methods. The results of several tests by each technique, on the same specimen oil are shown in Table 7 and Table 8. A Standard Deviation result in ppm is produced, together with the result of the Standard Deviation as a percentage of the average reading obtained. As there is no true standard value to compare either method against, this is considered a test of repeatability.
Table 7. PAS and headspace analysis of gas-in-oil samples from field transformer
Table 8. Laboratory GC and headspace analysis of gas-in-oil samples from field transformer
The PAS based analyser produced results which are in most cases better than the Laboratory Head Space Analyser in terms of repeatability, as would be expected from an online unit not subject to sampling variance. In general the results between both methods compared at a level that would not affect fault diagnosis. Clearly the transformer in question has some excessive gassing issues.
GAS iD: QuANtifiCAtioN
teSt 1 teSt 2 teSt 3Ave
(PPM)StD Dev (PPM) Diff. (%)
Ethylene (C2H4)
145 145 144 144,7 0,58 0,39
Ethane (C2H6)
165 164 164 164,3 0,58 0,35
Methane (CH4)
63 65 64 64 1 1,56
Carbon Monoxide (CO)
32 31 33 32 1 3,13
Carbon Dioxide (CO2)
334 312 331 325,7 11,9 3,66
Acetylene (C2H2)
118 119 119 118,7 0,58 0,49
GAS iD: QuANtifiCAtioN
teSt 1 teSt 2 teSt 3Ave
(PPM)StD Dev (PPM) Diff. (%)
Ethylene 161 161 164 162 1,73 1,07
Ethane 174 177 180 177 3 1,7
Methane 68 68 71 69 1,73 2,5
Carbon Monoxide
38 41 44 41 3 7,3
Carbon Dioxide
181 182 187 183,3 3,2 1,75
Acetylene 130 156 147 144,3 13,2 9,1

The
Tran
siTi
on T
o n
exT-
Gen
eraT
ion
on
lin
e DG
a M
oniT
orin
G Te
chn
oloG
ies
UTil
izin
G Ph
oTo-
acoU
sTic
sPe
cTro
scoP
y
©2013 General electric company. all riGhts reserved.
Field ExperiencesEstimates put the number of installed online DGA instruments at more than 80,000, of which the vast majority are composite gas monitors employed as alarms to detect developing faults. More than five thousand PAS based DGA instruments are now installed globally, in more than 120 countries. They are normally deployed on critical or large transformers where their cost benefit is more obvious.
Many examples exist of where DGA has prevented further damage occurring to a transformer by notifying asset managers of a developing faults through increasing gas levels .
PAS based systems are now providing this capability all over the world through the provision of high quality DGA results.
Example of successful diagnosis of developingfaultA GE Transfix monitor was installed on a transformer in Asia. Results observed over several months identified a thermal problem in the transformer evidenced by:
• Oxygen content of the oil decreasing,
• Carbon monoxide and carbon dioxide content of the oil increasing
This combination of gases indicates overheating of the paper insulation in the transformer and, using a load sensor, the rate of gas generation was traced to load conditions. The transformer was left in operation until a sudden dramatic increase in gas indicated that the fault had progressed from thermal to electrical fault, diagnosed using the Key Gas Method. The unit was then managed out of operation.
Figure 3. Decreasing Oxygen and increasing carbon monoxide and carbon dioxide. Leading eventually to a rapid increase in hydrogen and acetylene indicating an electrical fault.
Figure 4. Best match (86% pattern match) to the Key gas diagnosis: “Arcing from load current”
ConclusionPAS based DGA instruments have been developed with the express purpose of addressing the shortcomings of online GC based instruments. They provide a real alternative to GC by matching their performance and operating successfully in the field. Utilising a technology historically designed for online application, PAS instruments are very stable and repeatable monitoring instruments suited for the tough environmental and operational demands associated with remote transformer monitoring. PAS is the new high-end standard for monitoring critical transformers.
References[1] IEC 60567 standard
[2] McIlroy, C. D. Photo-Acoustic Spectroscopy. A New Technique for Dissolved Gas Analysis in Oil. EPRI Substation Equipment Diagnostics Conference, New Orleans, LA, USA. February 23 – 26, 2003
[3] McIlroy, C. D. A Comparison of Photo-Acoustic Spectrometer and Gas Chromatograph Techniques for Dissolved Gas Analysis of Transformer Oil. EPRI Substation Equipment Diagnostics Conference, New Orleans, LA, USA. February 15 – 18, 2004