DG Cement 1st Quater Report 2018 - psx.com.pk · DG Cement 1st Quarter 2019 41. Chief Executive...
47
Transcript of DG Cement 1st Quater Report 2018 - psx.com.pk · DG Cement 1st Quarter 2019 41. Chief Executive...

2018
First Quarter Report,September 30,
(Un-audited)
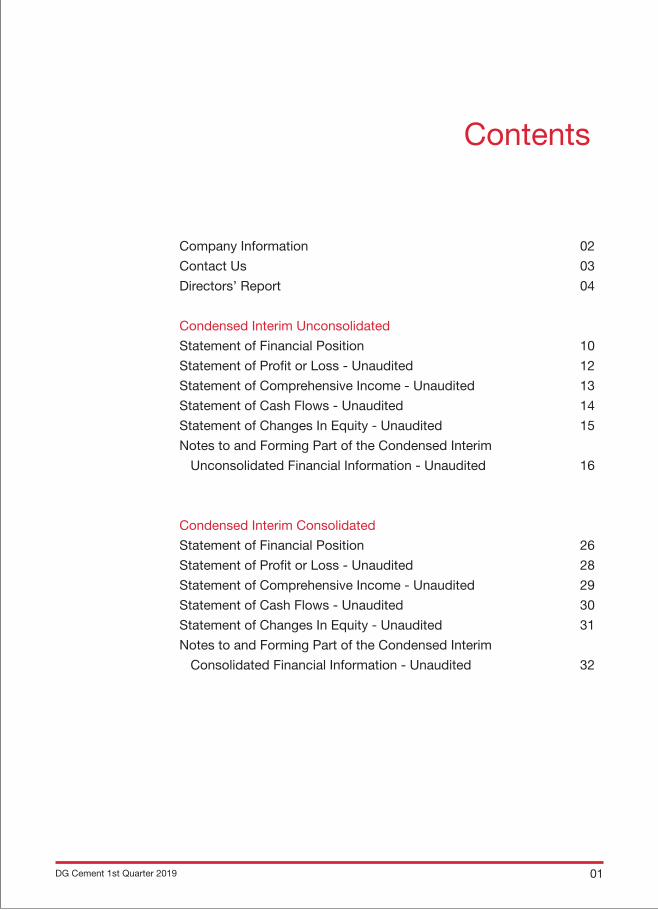
Company Information 02
Contact Us 03
Directors’ Report 04
Condensed Interim Unconsolidated
Statement of Financial Position 10
Statement of Profit or Loss - Unaudited 12
Statement of Comprehensive Income - Unaudited 13
Statement of Cash Flows - Unaudited 14
Statement of Changes In Equity - Unaudited 15
Notes to and Forming Part of the Condensed Interim
Unconsolidated Financial Information - Unaudited 16
Condensed Interim Consolidated
Statement of Financial Position 26
Statement of Profit or Loss - Unaudited 28
Statement of Comprehensive Income - Unaudited 29
Statement of Cash Flows - Unaudited 30
Statement of Changes In Equity - Unaudited 31
Notes to and Forming Part of the Condensed Interim
Consolidated Financial Information - Unaudited 32
Contents
DG Cement 1st Quarter 2019 01
Company Information
Mrs. Naz Mansha ChairpersonMr. Raza Mansha Chief ExecutiveMr. Khalid Niaz KhawajaMr. Mohammad Arif Hameed Mr. Khalid Qadeer Qureshi Mr. Farid Noor Ali FazalMr. Shahzad Ahmad Malik
Mr. Khalid Niaz Khawaja Member/ChairmanMr. Khalid Qadeer Qureshi MemberMr. Mohammad Arif Hameed Member
Mr. Khalid Niaz Khawaja Member/ChairmanMr. Raza Mansha Member Mr. Khalid Qadeer Qureshi Member
Mr. Khalid Mahmood Chohan
Mr. Raza Mansha Chief Executive OfficerMr. Aftab Ahmad Khan Director FinanceDr. Arif Bashir Director Technical & OperationsMr. Farid Noor Ali Fazal Director MarketingMr. Inayat Ullah Niazi Chief Financial Officer
Allied Bank Limited MCB Islamic Bank Limited Bank Alfalah Limited Meezan Bank LimitedBank Al-Habib Limited National Bank of PakistanBank Islami Pakistan Limited Samba Bank LimitedDubai Islamic Bank Soneri Bank LimitedFaysal Bank Limited Standard Chartered BankHabib Bank Limited Limited (Pakistan) LimitedHabib Metropolitan Bank The Bank of PunjabMCB Bank Limited United Bank Limited A.F. Ferguson & Co., Chartered Accountants
Mr. Shahid Hamid, Bar-at-Law
0006469
1213275-6
0402252300164
DGKC
Board of Directors
Audit Committee
Human Resource &Remuneration Committee
Company Secretary
Management
Local Bankers
External Auditors
Legal Advisors
CUIN
NTN
STRN
Symbol
DG Cement 1st Quarter 201902
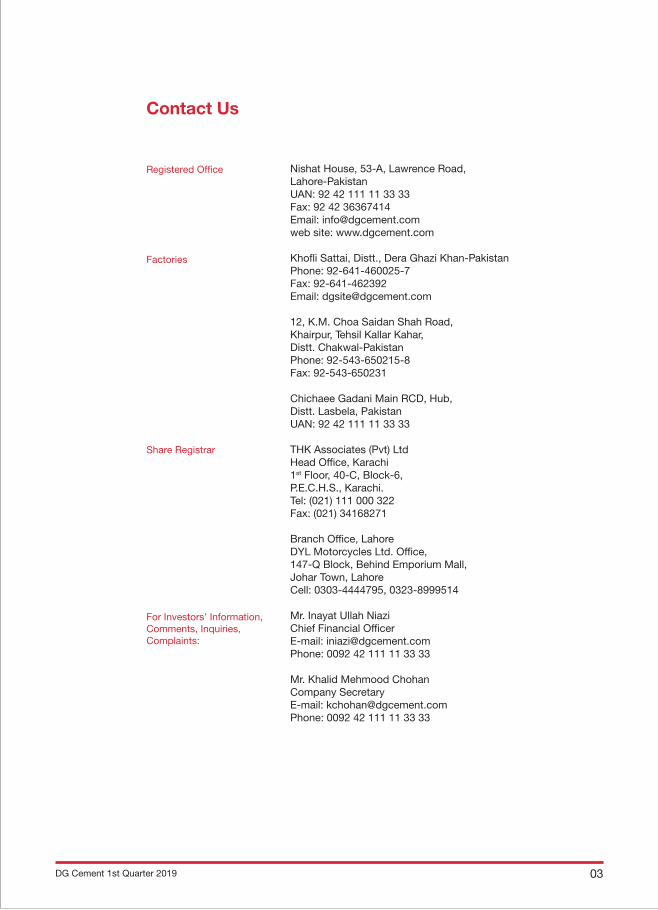
Nishat House, 53-A, Lawrence Road,Lahore-PakistanUAN: 92 42 111 11 33 33 Fax: 92 42 36367414Email: [email protected] site: www.dgcement.com
Khofli Sattai, Distt., Dera Ghazi Khan-PakistanPhone: 92-641-460025-7Fax: 92-641-462392Email: [email protected]
12, K.M. Choa Saidan Shah Road,Khairpur, Tehsil Kallar Kahar, Distt. Chakwal-PakistanPhone: 92-543-650215-8Fax: 92-543-650231
Chichaee Gadani Main RCD, Hub,Distt. Lasbela, PakistanUAN: 92 42 111 11 33 33
THK Associates (Pvt) LtdHead Office, Karachi1st Floor, 40-C, Block-6, P.E.C.H.S., Karachi.Tel: (021) 111 000 322Fax: (021) 34168271
Branch Office, LahoreDYL Motorcycles Ltd. Office,147-Q Block, Behind Emporium Mall, Johar Town, LahoreCell: 0303-4444795, 0323-8999514
Mr. Inayat Ullah Niazi Chief Financial OfficerE-mail: [email protected]: 0092 42 111 11 33 33
Mr. Khalid Mehmood Chohan Company SecretaryE-mail: [email protected]: 0092 42 111 11 33 33
Registered Office
Factories
Share Registrar
For Investors’ Information,Comments, Inquiries,Complaints:
Contact Us
DG Cement 1st Quarter 2019 03
DG Cement 1st Quarter 201904
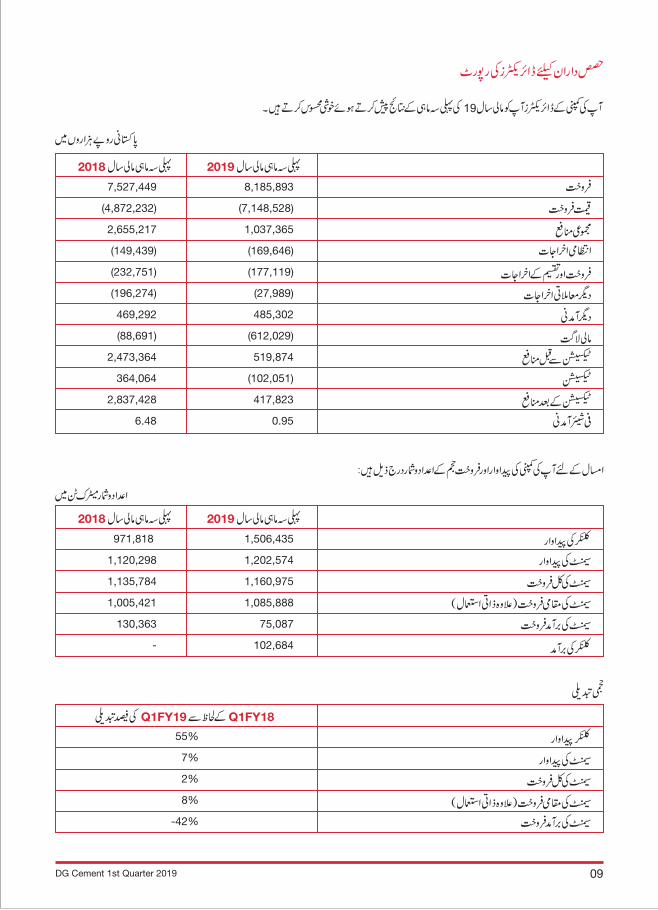
Directors’ Report
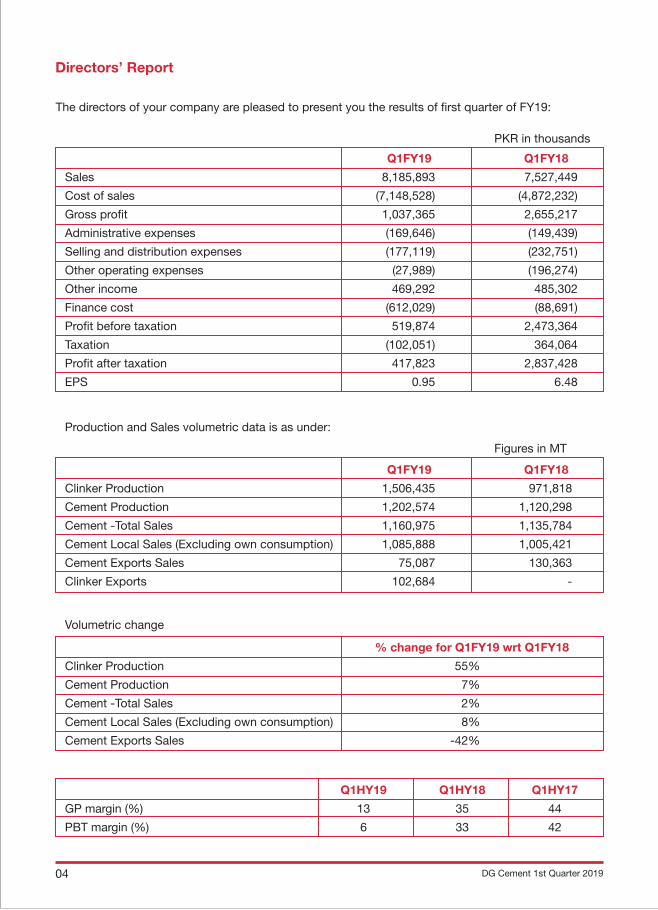
The directors of your company are pleased to present you the results of first quarter of FY19:
PKR in thousands
Q1FY19 Q1FY18
Sales 8,185,893 7,527,449
Cost of sales (7,148,528) (4,872,232)
Gross profit 1,037,365 2,655,217
Administrative expenses (169,646) (149,439)
Selling and distribution expenses (177,119) (232,751)
Other operating expenses (27,989) (196,274)
Other income 469,292 485,302
Finance cost (612,029) (88,691)
Profit before taxation 519,874 2,473,364
Taxation (102,051) 364,064
Profit after taxation 417,823 2,837,428
EPS 0.95 6.48
Production and Sales volumetric data is as under:
Figures in MT
Q1FY19 Q1FY18
Clinker Production 1,506,435 971,818
Cement Production 1,202,574 1,120,298
Cement -Total Sales 1,160,975 1,135,784
Cement Local Sales (Excluding own consumption) 1,085,888 1,005,421
Cement Exports Sales 75,087 130,363
Clinker Exports 102,684 -
Volumetric change
% change for Q1FY19 wrt Q1FY18
Clinker Production 55%
Cement Production 7%
Cement -Total Sales 2%
Cement Local Sales (Excluding own consumption) 8%
Cement Exports Sales -42%
Q1HY19 Q1HY18 Q1HY17
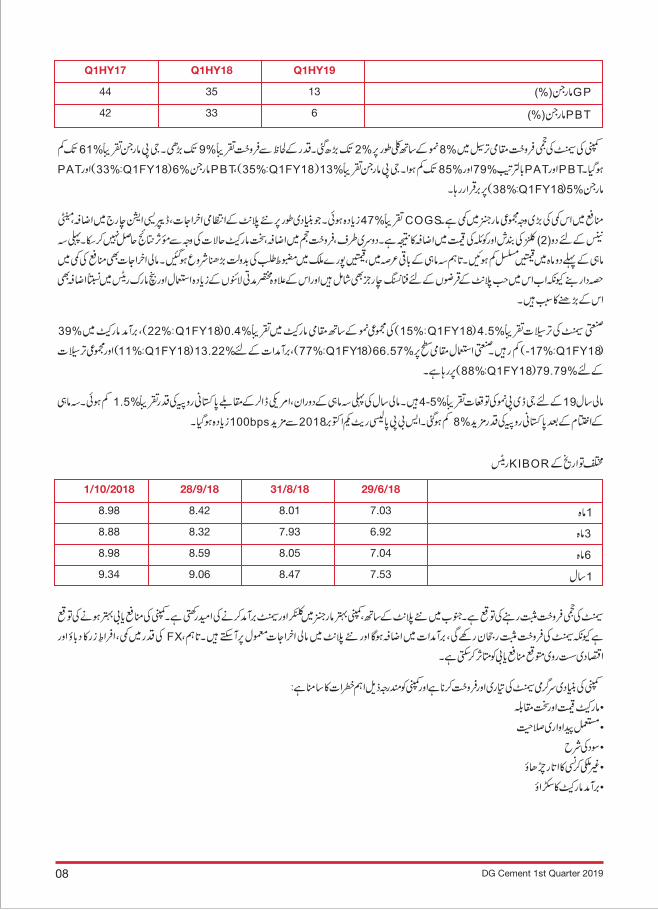
GP margin (%) 13 35 44
PBT margin (%) 6 33 42
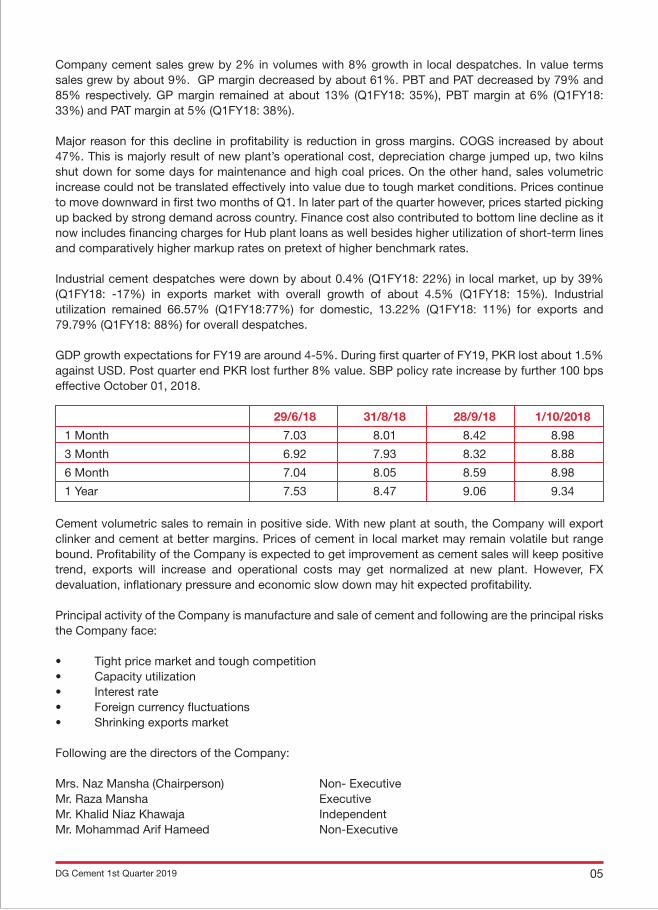
Company cement sales grew by 2% in volumes with 8% growth in local despatches. In value terms sales grew by about 9%. GP margin decreased by about 61%. PBT and PAT decreased by 79% and 85% respectively. GP margin remained at about 13% (Q1FY18: 35%), PBT margin at 6% (Q1FY18: 33%) and PAT margin at 5% (Q1FY18: 38%).
Major reason for this decline in profitability is reduction in gross margins. COGS increased by about 47%. This is majorly result of new plant’s operational cost, depreciation charge jumped up, two kilns shut down for some days for maintenance and high coal prices. On the other hand, sales volumetric increase could not be translated effectively into value due to tough market conditions. Prices continue to move downward in first two months of Q1. In later part of the quarter however, prices started picking up backed by strong demand across country. Finance cost also contributed to bottom line decline as it now includes financing charges for Hub plant loans as well besides higher utilization of short-term lines and comparatively higher markup rates on pretext of higher benchmark rates.
Industrial cement despatches were down by about 0.4% (Q1FY18: 22%) in local market, up by 39% (Q1FY18: -17%) in exports market with overall growth of about 4.5% (Q1FY18: 15%). Industrial utilization remained 66.57% (Q1FY18:77%) for domestic, 13.22% (Q1FY18: 11%) for exports and 79.79% (Q1FY18: 88%) for overall despatches.
GDP growth expectations for FY19 are around 4-5%. During first quarter of FY19, PKR lost about 1.5% against USD. Post quarter end PKR lost further 8% value. SBP policy rate increase by further 100 bps effective October 01, 2018.
Cement volumetric sales to remain in positive side. With new plant at south, the Company will export clinker and cement at better margins. Prices of cement in local market may remain volatile but range bound. Profitability of the Company is expected to get improvement as cement sales will keep positive trend, exports will increase and operational costs may get normalized at new plant. However, FX devaluation, inflationary pressure and economic slow down may hit expected profitability.
Principal activity of the Company is manufacture and sale of cement and following are the principal risks the Company face:
• Tight price market and tough competition• Capacity utilization• Interest rate• Foreign currency fluctuations• Shrinking exports market
Following are the directors of the Company:
Mrs. Naz Mansha (Chairperson) Non- ExecutiveMr. Raza Mansha ExecutiveMr. Khalid Niaz Khawaja IndependentMr. Mohammad Arif Hameed Non-Executive
DG Cement 1st Quarter 2019 05
29/6/18 31/8/18 28/9/18 1/10/2018
1 Month 7.03 8.01 8.42 8.98
3 Month 6.92 7.93 8.32 8.88
6 Month 7.04 8.05 8.59 8.98
1 Year 7.53 8.47 9.06 9.34
Mr. Khalid Qadeer Qureshi Non-ExecutiveMr. Farid Noor Ali Fazal ExecutiveMr. Shahzad Ahmad Malik Non-Executive
Female Directors: 01Male Directors: 06
Audit CommitteeMr. Khalid Niaz Khawaja ChairmanMr. Mohammad Arif Hameed MemberMr. Khalid Qadeer Qureshi Member
Human Resource & Remuneration CommitteeMr. Khalid Niaz Khawaja ChairmanMr. Raza Mansha MemberMr. Khalid Qadeer Qureshi Member
There are no material post balance sheet events affecting the period end position.
Our plants and operations are complying with international and national environmental standards. DGKC is fully cognizant of its responsibility towards society and welfare. The Company is spending on education, health, medical and fire-fighting facilities, water supply to nearby localities, aiding in emergency and disaster situations in nearby areas, awareness campaigns etc.
There are no changes that have occurred during the period under review concerning the nature of the business of the company or of its subsidiaries, or any other company in which the company has interest.
The Directors of your company state that the system of internal control is sound in design and has been effectively implemented and monitored. Significant deviations from last period in operating results of the company are highlighted and reasoned in other parts of Directors report.
We thank all our stakeholders and admire efforts of our employees.
For and on behalf of the Board
Raza Mansha Farid Noor Ali FazalChief Executive Officer Director
LahoreOctober 25, 2018
DG Cement 1st Quarter 201906
DG Cement 1st Quarter 2019 07
DG Cement 1st Quarter 201908
Q1HY17 Q1HY18 Q1HY19
44 35 13
42 33 6
1/10/2018 28/9/18 31/8/18 29/6/18
8.98 8.42 8.01 7.03
8.88 8.32 7.93 6.92
8.98 8.59 8.05 7.04
9.34 9.06 8.47 7.53
DG Cement 1st Quarter 2019 09
7,527,449 8,185,893
(4,872,232) (7,148,528)
2,655,217 1,037,365
(149,439) (169,646)
(232,751) (177,119)
(196,274) (27,989)
469,292 485,302
(88,691) (612,029)
2,473,364 519,874
364,064 (102,051)
2,837,428 417,823
6.48 0.95
20192018
971,818 1,506,435
1,120,298 1,202,574
1,135,784 1,160,975
1,005,421 1,085,888
130,363 75,087
- 102,684
20192018
Q1FY19 Q1FY18
55%
7%
2%
8%
-42%
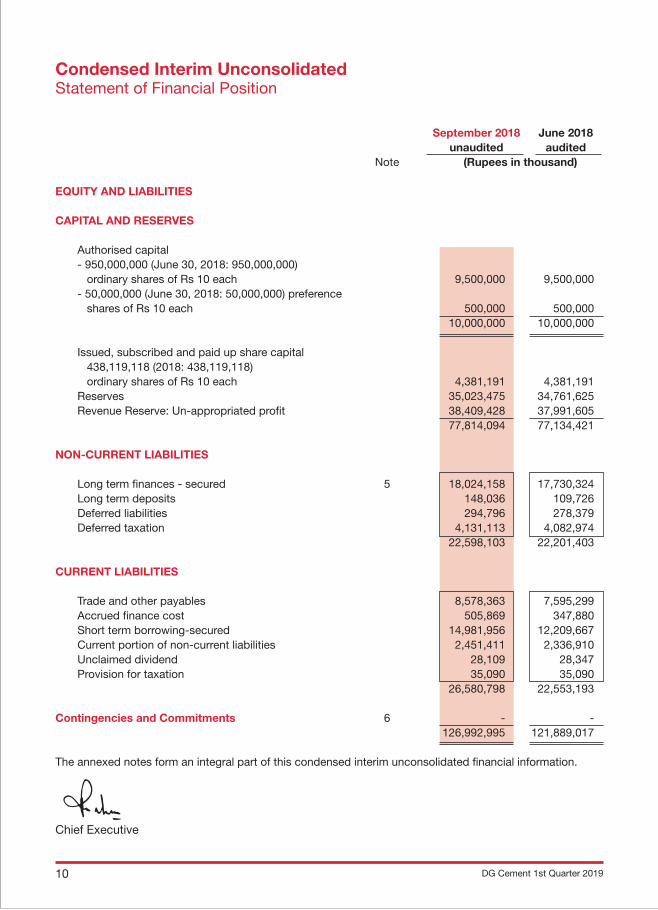
Condensed Interim Unconsolidated Statement of Financial Position
September 2018 June 2018 unaudited audited Note (Rupees in thousand) EQUITY AND LIABILITIES
CAPITAL AND RESERVES
Authorised capital - 950,000,000 (June 30, 2018: 950,000,000) ordinary shares of Rs 10 each 9,500,000 9,500,000 - 50,000,000 (June 30, 2018: 50,000,000) preference shares of Rs 10 each 500,000 500,000 10,000,000 10,000,000
Issued, subscribed and paid up share capital 438,119,118 (2018: 438,119,118) ordinary shares of Rs 10 each 4,381,191 4,381,191 Reserves 35,023,475 34,761,625 Revenue Reserve: Un-appropriated profit 38,409,428 37,991,605 77,814,094 77,134,421
NON-CURRENT LIABILITIES
Long term finances - secured 5 18,024,158 17,730,324 Long term deposits 148,036 109,726 Deferred liabilities 294,796 278,379 Deferred taxation 4,131,113 4,082,974 22,598,103 22,201,403
CURRENT LIABILITIES Trade and other payables 8,578,363 7,595,299 Accrued finance cost 505,869 347,880 Short term borrowing-secured 14,981,956 12,209,667 Current portion of non-current liabilities 2,451,411 2,336,910 Unclaimed dividend 28,109 28,347 Provision for taxation 35,090 35,090 26,580,798 22,553,193
Contingencies and Commitments 6 - - 126,992,995 121,889,017
The annexed notes form an integral part of this condensed interim unconsolidated financial information.
Chief Executive
DG Cement 1st Quarter 201910
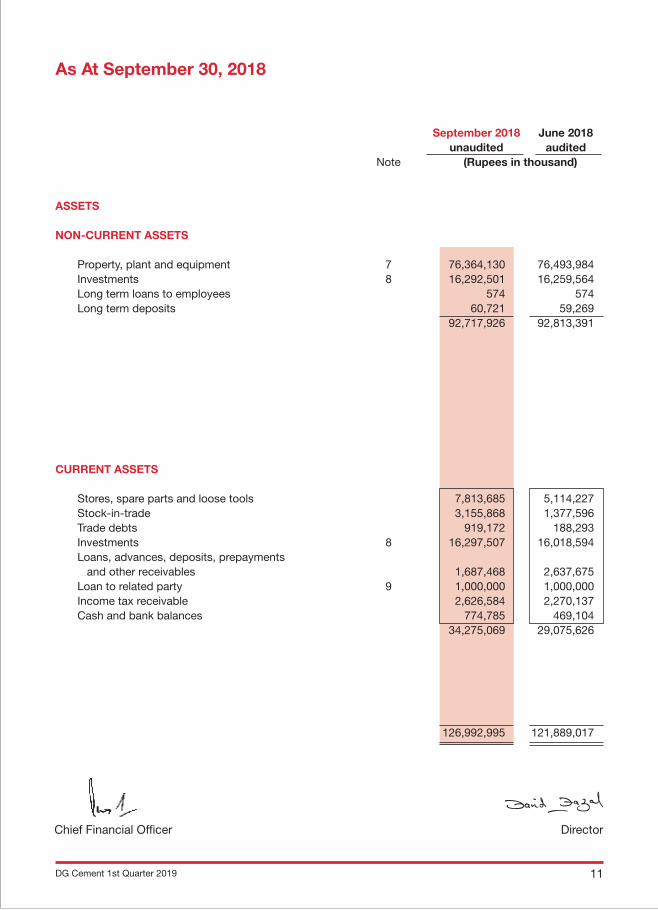
September 2018 June 2018 unaudited audited Note (Rupees in thousand)
ASSETS
NON-CURRENT ASSETS
Property, plant and equipment 7 76,364,130 76,493,984 Investments 8 16,292,501 16,259,564 Long term loans to employees 574 574 Long term deposits 60,721 59,269 92,717,926 92,813,391
CURRENT ASSETS
Stores, spare parts and loose tools 7,813,685 5,114,227 Stock-in-trade 3,155,868 1,377,596 Trade debts 919,172 188,293 Investments 8 16,297,507 16,018,594 Loans, advances, deposits, prepayments and other receivables 1,687,468 2,637,675 Loan to related party 9 1,000,000 1,000,000 Income tax receivable 2,626,584 2,270,137 Cash and bank balances 774,785 469,104 34,275,069 29,075,626
126,992,995 121,889,017
As At September 30, 2018
DirectorChief Financial Officer
DG Cement 1st Quarter 2019 11
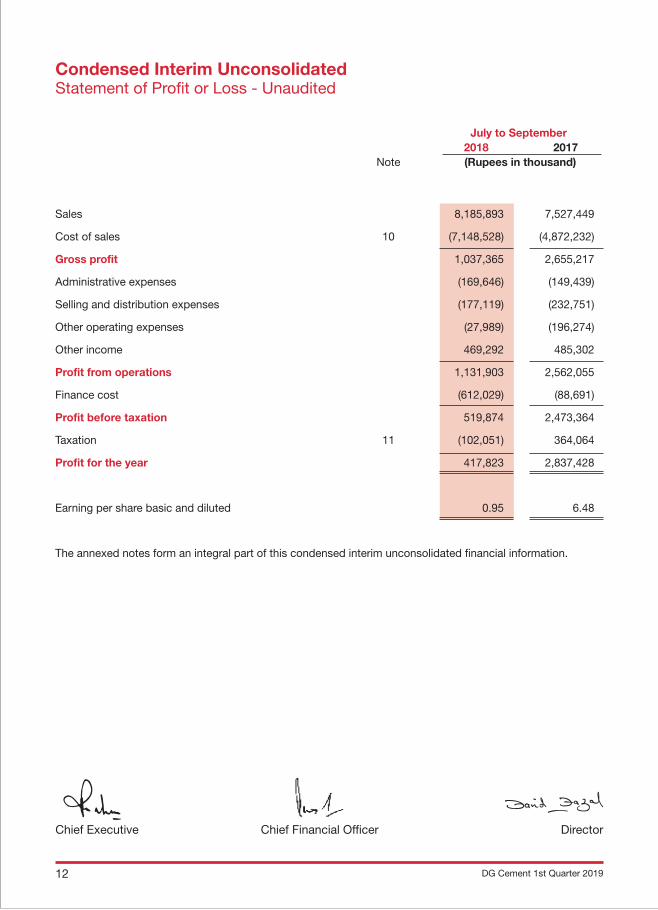
July to September 2018 2017 Note (Rupees in thousand)
Sales 8,185,893 7,527,449
Cost of sales 10 (7,148,528) (4,872,232)
Gross profit 1,037,365 2,655,217
Administrative expenses (169,646) (149,439)
Selling and distribution expenses (177,119) (232,751)
Other operating expenses (27,989) (196,274)
Other income 469,292 485,302
Profit from operations 1,131,903 2,562,055
Finance cost (612,029) (88,691)
Profit before taxation 519,874 2,473,364
Taxation 11 (102,051) 364,064
Profit for the year 417,823 2,837,428
Earning per share basic and diluted 0.95 6.48
The annexed notes form an integral part of this condensed interim unconsolidated financial information.
DirectorChief Executive Chief Financial Officer
Condensed Interim UnconsolidatedStatement of Profit or Loss - Unaudited
DG Cement 1st Quarter 201912
DirectorChief Executive Chief Financial Officer
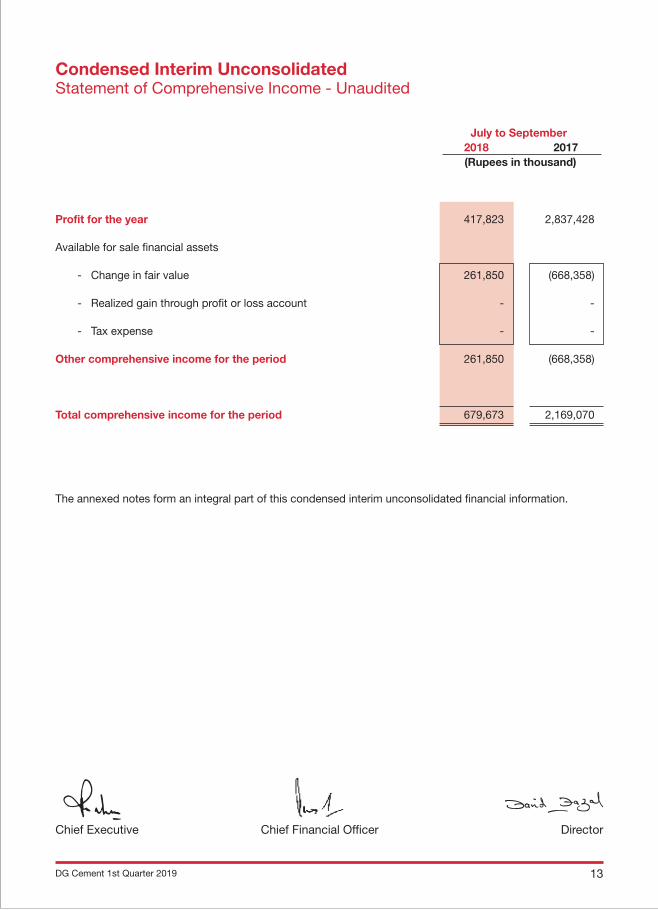
July to September 2018 2017 (Rupees in thousand)
Profit for the year 417,823 2,837,428
Available for sale financial assets
- Change in fair value 261,850 (668,358)
- Realized gain through profit or loss account - -
- Tax expense - -
Other comprehensive income for the period 261,850 (668,358)
Total comprehensive income for the period 679,673 2,169,070
The annexed notes form an integral part of this condensed interim unconsolidated financial information.
Condensed Interim UnconsolidatedStatement of Comprehensive Income - Unaudited
DG Cement 1st Quarter 2019 13
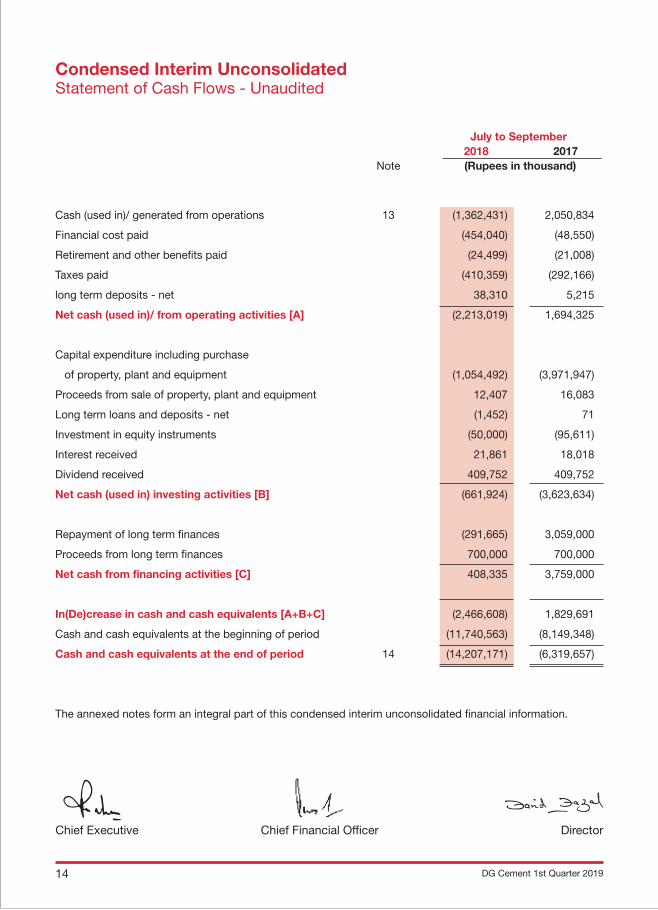
July to September 2018 2017 Note (Rupees in thousand)
Cash (used in)/ generated from operations 13 (1,362,431) 2,050,834
Financial cost paid (454,040) (48,550)
Retirement and other benefits paid (24,499) (21,008)
Taxes paid (410,359) (292,166)
long term deposits - net 38,310 5,215
Net cash (used in)/ from operating activities [A] (2,213,019) 1,694,325
Capital expenditure including purchase
of property, plant and equipment (1,054,492) (3,971,947)
Proceeds from sale of property, plant and equipment 12,407 16,083
Long term loans and deposits - net (1,452) 71
Investment in equity instruments (50,000) (95,611)
Interest received 21,861 18,018
Dividend received 409,752 409,752
Net cash (used in) investing activities [B] (661,924) (3,623,634)
Repayment of long term finances (291,665) 3,059,000
Proceeds from long term finances 700,000 700,000
Net cash from financing activities [C] 408,335 3,759,000
In(De)crease in cash and cash equivalents [A+B+C] (2,466,608) 1,829,691
Cash and cash equivalents at the beginning of period (11,740,563) (8,149,348)
Cash and cash equivalents at the end of period 14 (14,207,171) (6,319,657)
The annexed notes form an integral part of this condensed interim unconsolidated financial information.
DirectorChief Executive Chief Financial Officer
Condensed Interim UnconsolidatedStatement of Cash Flows - Unaudited
DG Cement 1st Quarter 201914
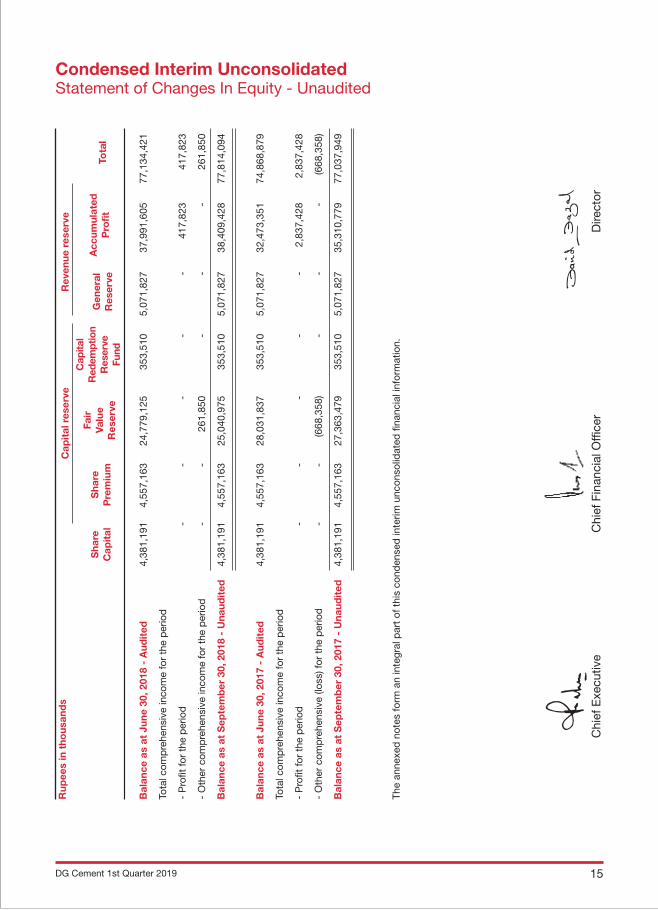
Cap
ital
res
erve
Rev
enue
res
erve
Bal
ance
as
at J
une
30, 2
018
- A
udit
ed
4,3
81,1
91
4,55
7,16
3 24
,779
,125
35
3,51
0 5,
071,
827
37,9
91,6
05
77,1
34,4
21
Tota
l com
pre
hens
ive
inco
me
for
the
per
iod
- P
rofit
for
the
per
iod
-
- -
- -
417
,823
41
7,82
3
- O
ther
com
pre
hens
ive
inco
me
for
the
per
iod
-
- 2
61,8
50
- -
- 2
61,8
50
Bal
ance
as
at S
epte
mb
er 3
0, 2
018
- U
naud
ited
4
,381
,191
4,
557,
163
25,0
40,9
75
353,
510
5,07
1,82
7 38
,409
,428
77
,814
,094
Bal
ance
as
at J
une
30, 2
017
- A
udit
ed
4,3
81,1
91
4,55
7,16
3 28
,031
,837
35
3,51
0 5,
071,
827
32,4
73,3
51
74,8
68,8
79
Tota
l com
pre
hens
ive
inco
me
for
the
per
iod
- P
rofit
for
the
per
iod
-
- -
- -
2,8
37,4
28
2,8
37,4
28
- O
ther
com
pre
hens
ive
(loss
) for
the
per
iod
-
- (6
68,3
58)
- -
- (6
68,3
58)
Bal
ance
as
at S
epte
mb
er 3
0, 2
017
- U
naud
ited
4
,381
,191
4,
557,
163
27,3
63,4
79
353,
510
5,07
1,82
7 35
,310
,779
77
,037
,949
The
anne
xed
not
es fo
rm a
n in
tegr
al p
art
of t
his
cond
ense
d in
terim
unc
onso
lidat
ed fi
nanc
ial i
nfor
mat
ion.
Fair
Valu
eR
eser
ve
Sha
reP
rem
ium
Sha
reC
apit
al
Cap
ital
Red
empt
ion
Res
erve
Fund
Gen
eral
Res
erve
Acc
umul
ated
Pro
fitTo
tal
Rup
ees
in t
hous
and
s
Dire
ctor
Chi
ef E
xecu
tive
Chi
ef F
inan
cial
Offi
cer
Condensed Interim UnconsolidatedStatement of Changes In Equity - Unaudited
DG Cement 1st Quarter 2019 15
1. Legal status and nature of business
D. G. Khan Cement Company Limited ("the Company") is a public limited company incorporated in
Pakistan and is listed on the Pakistan Stock Exchange Limited. It is principally engaged in production
and sale of Clinker, Ordinary Portland and Sulphate Resistant Cement. The registered office of the
Company is situated at 53-A, Lawrence Road, Lahore.
2. Basis of preparation
These condensed interim financial statements have been prepared in accordance with the accounting
and reporting standards as applicable in Pakistan for interim financial reporting. The accounting and
reporting standards as applicable in Pakistan for interim financial reporting comprise of:
- International Accounting Standard (IAS) 34, Interim Financial Reporting, issued by the International
Accounting Standards Board (IASB) as notified under the Companies Act, 2017; and
- Provisions of and directives issued under the Companies Act, 2017.
Where the provisions of and directives issued under the Companies Act, 2017 differ with the
requirements of IAS 34, the provisions of and directives issued under the Companies Act, 2017 have
been followed.
2.1 Initial application of standards, amendments or an interpretation to existing standards.
There are certain standards, amendments to the approved accounting standards and
interpretations that are mandatory for the Company’s accounting periods beginning from july 01,
2018 but are not considered to be relevant or to have any significant effect on the Company’s
operations and are, therefore, not detailed in this condensed interim financial information.
2.2 The preparation of the interim financial information requires management to make judgments,
estimates and assumptions that affect the application of accounting policies, the presentation of
assets, liabilities, incomes and expenses and the amounts reported there against as well as
disclosure of contingent liabilities at the date of the interim financial information. If in future such
estimates and assumptions, which are based on management's best judgment at the date of the
interim financial information, deviate from the actual circumstances, the original estimates and
assumptions will be modified as appropriate during the period in which the circumstances change.
- Residual value and useful life estimation of fixed assets
- Provision for taxation
- Retirements and other benefits
- Provisions and Contingencies
- Fair value of unquoted available-for-sale investment
Notes to and Forming Part of theCondensed Interim Unconsolidated Financial Information - Unaudited
DG Cement 1st Quarter 201916
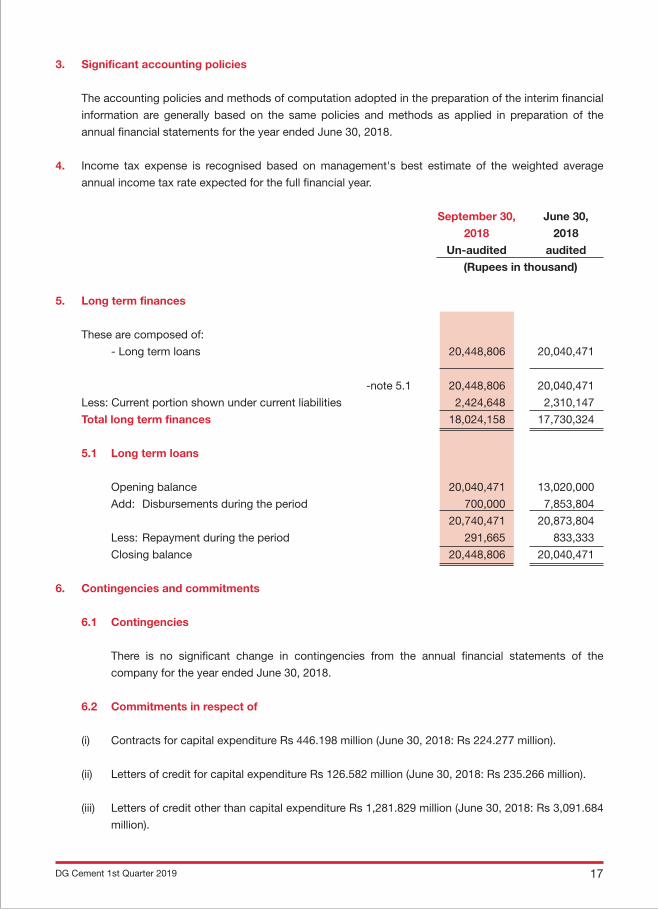
3. Significant accounting policies
The accounting policies and methods of computation adopted in the preparation of the interim financial
information are generally based on the same policies and methods as applied in preparation of the
annual financial statements for the year ended June 30, 2018.
4. Income tax expense is recognised based on management's best estimate of the weighted average
annual income tax rate expected for the full financial year.
September 30, June 30,
2018 2018
Un-audited audited
(Rupees in thousand)
5. Long term finances
These are composed of:
- Long term loans 20,448,806 20,040,471
-note 5.1 20,448,806 20,040,471
Less: Current portion shown under current liabilities 2,424,648 2,310,147
Total long term finances 18,024,158 17,730,324
5.1 Long term loans
Opening balance 20,040,471 13,020,000
Add: Disbursements during the period 700,000 7,853,804
20,740,471 20,873,804
Less: Repayment during the period 291,665 833,333
Closing balance 20,448,806 20,040,471
6. Contingencies and commitments
6.1 Contingencies
There is no significant change in contingencies from the annual financial statements of the
company for the year ended June 30, 2018.
6.2 Commitments in respect of
(i) Contracts for capital expenditure Rs 446.198 million (June 30, 2018: Rs 224.277 million).
(ii) Letters of credit for capital expenditure Rs 126.582 million (June 30, 2018: Rs 235.266 million).
(iii) Letters of credit other than capital expenditure Rs 1,281.829 million (June 30, 2018: Rs 3,091.684
million).
DG Cement 1st Quarter 2019 17
September 30, June 30,
2018 2018
Un-audited audited
(Rupees in thousand)
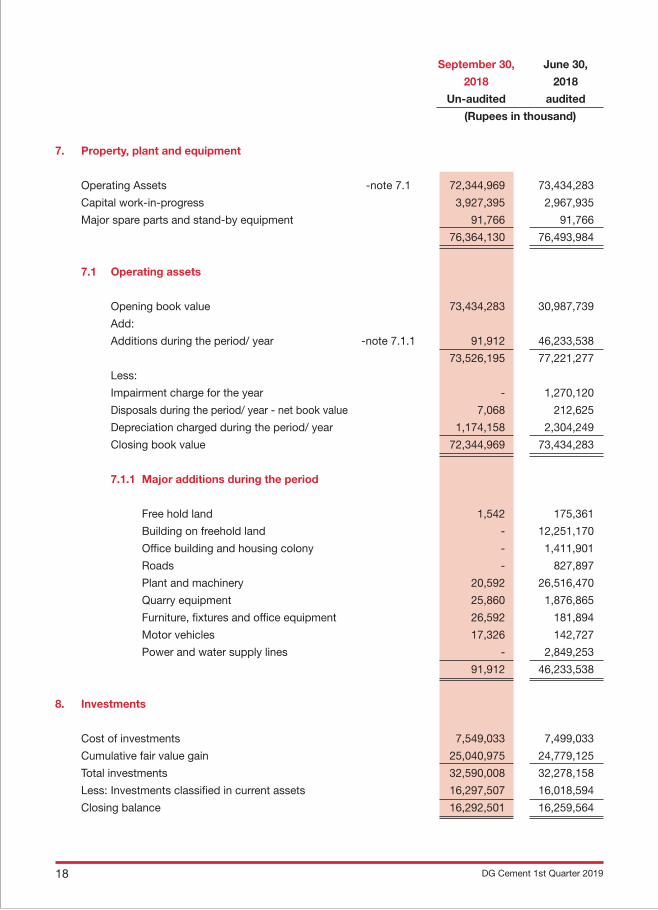
7. Property, plant and equipment
Operating Assets -note 7.1 72,344,969 73,434,283
Capital work-in-progress 3,927,395 2,967,935
Major spare parts and stand-by equipment 91,766 91,766
76,364,130 76,493,984
7.1 Operating assets
Opening book value 73,434,283 30,987,739
Add:
Additions during the period/ year -note 7.1.1 91,912 46,233,538
73,526,195 77,221,277
Less:
Impairment charge for the year - 1,270,120
Disposals during the period/ year - net book value 7,068 212,625
Depreciation charged during the period/ year 1,174,158 2,304,249
Closing book value 72,344,969 73,434,283
7.1.1 Major additions during the period
Free hold land 1,542 175,361
Building on freehold land - 12,251,170
Office building and housing colony - 1,411,901
Roads - 827,897
Plant and machinery 20,592 26,516,470
Quarry equipment 25,860 1,876,865
Furniture, fixtures and office equipment 26,592 181,894
Motor vehicles 17,326 142,727
Power and water supply lines - 2,849,253
91,912 46,233,538
8. Investments
Cost of investments 7,549,033 7,499,033
Cumulative fair value gain 25,040,975 24,779,125
Total investments 32,590,008 32,278,158
Less: Investments classified in current assets 16,297,507 16,018,594
Closing balance 16,292,501 16,259,564
DG Cement 1st Quarter 201918
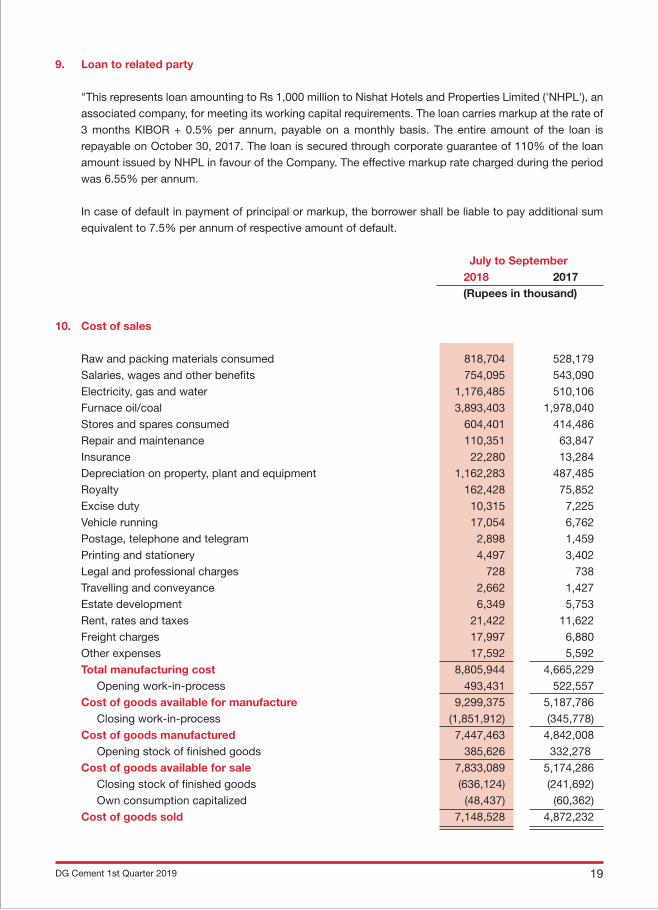
9. Loan to related party "This represents loan amounting to Rs 1,000 million to Nishat Hotels and Properties Limited ('NHPL'), an
associated company, for meeting its working capital requirements. The loan carries markup at the rate of 3 months KIBOR + 0.5% per annum, payable on a monthly basis. The entire amount of the loan is repayable on October 30, 2017. The loan is secured through corporate guarantee of 110% of the loan amount issued by NHPL in favour of the Company. The effective markup rate charged during the period was 6.55% per annum.
In case of default in payment of principal or markup, the borrower shall be liable to pay additional sum equivalent to 7.5% per annum of respective amount of default.
July to September 2018 2017 (Rupees in thousand)
10. Cost of sales
Raw and packing materials consumed 818,704 528,179 Salaries, wages and other benefits 754,095 543,090 Electricity, gas and water 1,176,485 510,106 Furnace oil/coal 3,893,403 1,978,040 Stores and spares consumed 604,401 414,486 Repair and maintenance 110,351 63,847 Insurance 22,280 13,284 Depreciation on property, plant and equipment 1,162,283 487,485 Royalty 162,428 75,852 Excise duty 10,315 7,225 Vehicle running 17,054 6,762 Postage, telephone and telegram 2,898 1,459 Printing and stationery 4,497 3,402 Legal and professional charges 728 738 Travelling and conveyance 2,662 1,427 Estate development 6,349 5,753 Rent, rates and taxes 21,422 11,622 Freight charges 17,997 6,880 Other expenses 17,592 5,592 Total manufacturing cost 8,805,944 4,665,229 Opening work-in-process 493,431 522,557 Cost of goods available for manufacture 9,299,375 5,187,786 Closing work-in-process (1,851,912) (345,778) Cost of goods manufactured 7,447,463 4,842,008 Opening stock of finished goods 385,626 332,278 Cost of goods available for sale 7,833,089 5,174,286 Closing stock of finished goods (636,124) (241,692) Own consumption capitalized (48,437) (60,362) Cost of goods sold 7,148,528 4,872,232
DG Cement 1st Quarter 2019 19
July to September
2018 2017
(Rupees in thousand)
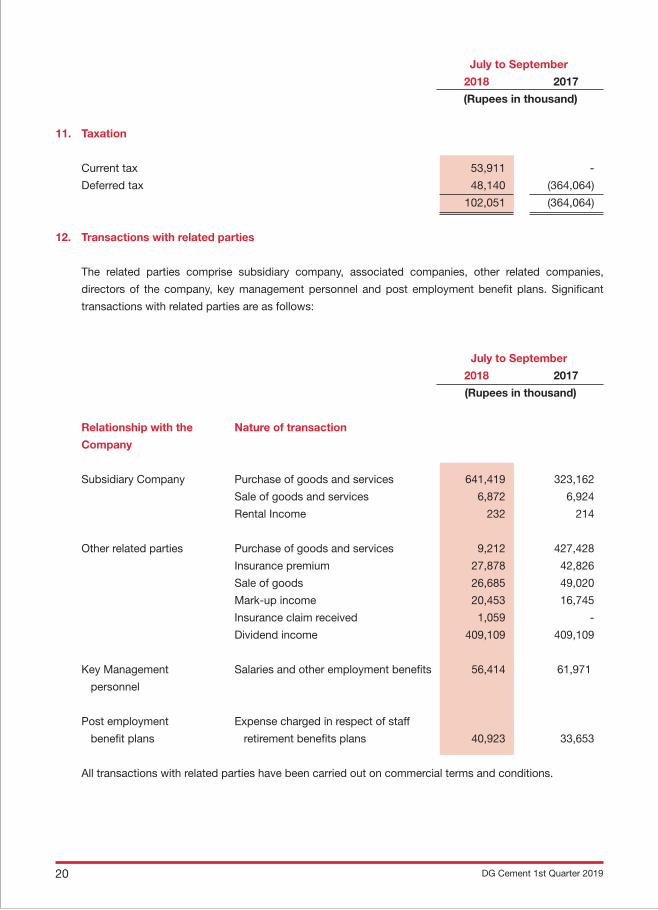
11. Taxation
Current tax 53,911 -
Deferred tax 48,140 (364,064)
102,051 (364,064)
12. Transactions with related parties
The related parties comprise subsidiary company, associated companies, other related companies,
directors of the company, key management personnel and post employment benefit plans. Significant
transactions with related parties are as follows:
July to September
2018 2017
(Rupees in thousand)
Relationship with the Nature of transaction
Company
Subsidiary Company Purchase of goods and services 641,419 323,162
Sale of goods and services 6,872 6,924
Rental Income 232 214
Other related parties Purchase of goods and services 9,212 427,428
Insurance premium 27,878 42,826
Sale of goods 26,685 49,020
Mark-up income 20,453 16,745
Insurance claim received 1,059 -
Dividend income 409,109 409,109
Key Management Salaries and other employment benefits 56,414 61,971
personnel
Post employment Expense charged in respect of staff
benefit plans retirement benefits plans 40,923 33,653
All transactions with related parties have been carried out on commercial terms and conditions.
DG Cement 1st Quarter 201920

July to September
2018 2017
(Rupees in thousand)
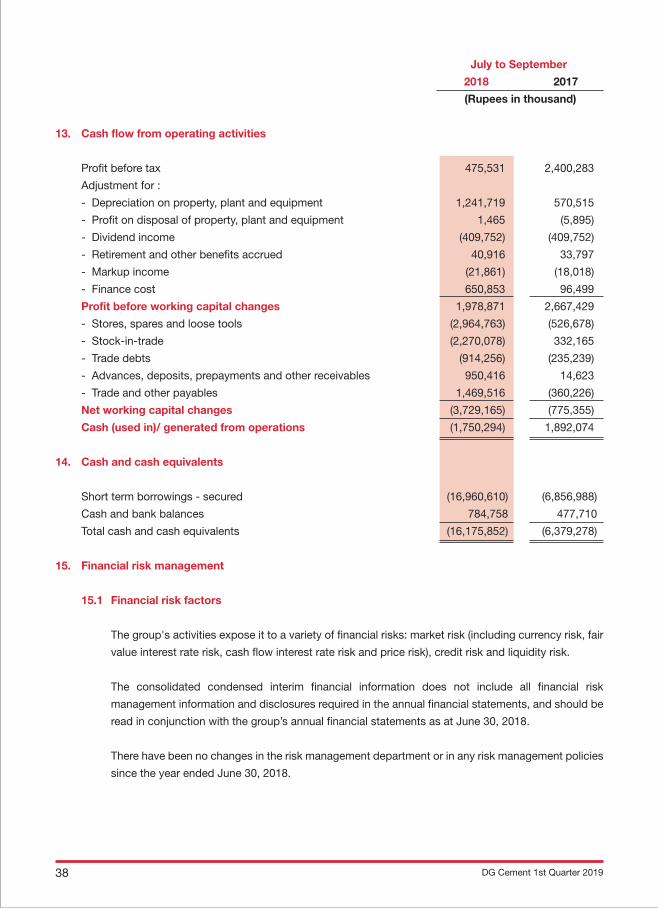
13. Cash flow from operating activities
Profit before tax 519,874 2,473,364
Adjustment for :
- Depreciation on property, plant and equipment 1,174,158 505,361
- Profit on disposal of property, plant and equipment (2,219) (5,895)
- Dividend income (409,752) (409,752)
- Retirement and other benefits accrued 40,916 33,797
- Markup income (21,861) (18,018)
- Finance cost 612,029 88,691
Profit before working capital changes 1,913,145 2,667,548
- Stores, spares and loose tools (2,699,458) (527,567)
- Stock-in-trade (1,778,272) 352,685
- Trade debts (730,879) (85,336)
- Advances, deposits, prepayments and other receivables 950,207 228,545
- Trade and other payables 982,826 (585,041)
Net working capital changes (3,275,576) (616,714)
Cash (used in)/ generated from operations (1,362,431) 2,050,834
14. Cash and cash equivalents
Short term borrowings - secured (14,981,956) (6,761,578)
Cash and bank balances 774,785 441,921
Total cash and cash equivalents (14,207,171) (6,319,657)
15. Financial risk management
15.1 Financial risk factors
The company’s activities expose it to a variety of financial risks: market risk (including currency risk,
fair value interest rate risk, cash flow interest rate risk and price risk), credit risk and liquidity risk.
The condensed interim financial information does not include all financial risk management
information and disclosures required in the annual financial statements, and should be read in
conjunction with the company’s annual financial statements as at June 30, 2018.
There have been no changes in the risk management department or in any risk management policies
since the year ended June 30, 2018.
DG Cement 1st Quarter 2019 21
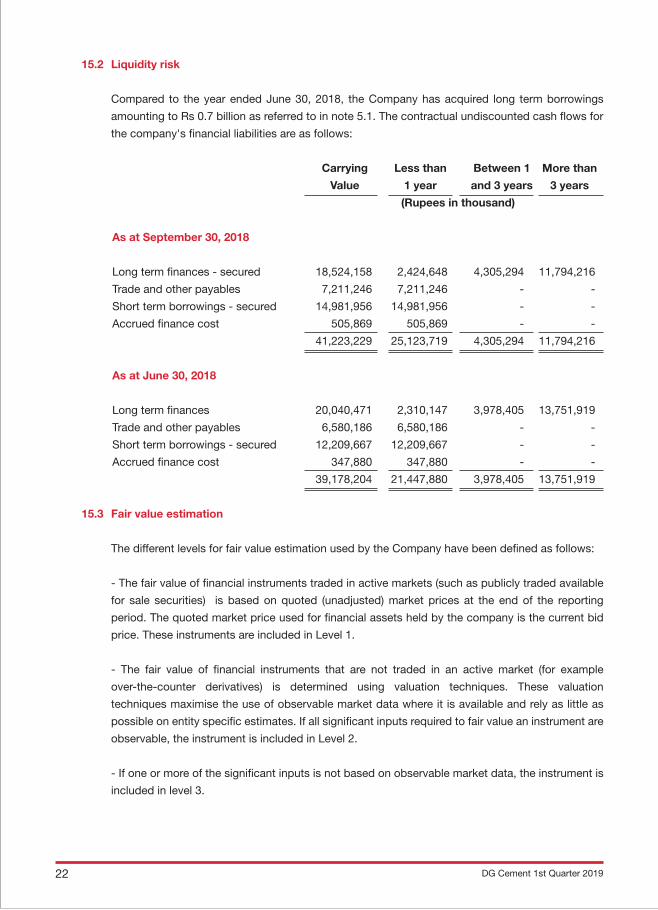
15.2 Liquidity risk
Compared to the year ended June 30, 2018, the Company has acquired long term borrowings
amounting to Rs 0.7 billion as referred to in note 5.1. The contractual undiscounted cash flows for
the company's financial liabilities are as follows:
Carrying Less than Between 1 More than
Value 1 year and 3 years 3 years
(Rupees in thousand)
As at September 30, 2018
Long term finances - secured 18,524,158 2,424,648 4,305,294 11,794,216
Trade and other payables 7,211,246 7,211,246 - -
Short term borrowings - secured 14,981,956 14,981,956 - -
Accrued finance cost 505,869 505,869 - -
41,223,229 25,123,719 4,305,294 11,794,216
As at June 30, 2018
Long term finances 20,040,471 2,310,147 3,978,405 13,751,919
Trade and other payables 6,580,186 6,580,186 - -
Short term borrowings - secured 12,209,667 12,209,667 - -
Accrued finance cost 347,880 347,880 - -
39,178,204 21,447,880 3,978,405 13,751,919
15.3 Fair value estimation
The different levels for fair value estimation used by the Company have been defined as follows:
- The fair value of financial instruments traded in active markets (such as publicly traded available
for sale securities) is based on quoted (unadjusted) market prices at the end of the reporting
period. The quoted market price used for financial assets held by the company is the current bid
price. These instruments are included in Level 1.
- The fair value of financial instruments that are not traded in an active market (for example
over-the-counter derivatives) is determined using valuation techniques. These valuation
techniques maximise the use of observable market data where it is available and rely as little as
possible on entity specific estimates. If all significant inputs required to fair value an instrument are
observable, the instrument is included in Level 2.
- If one or more of the significant inputs is not based on observable market data, the instrument is
included in level 3.
DG Cement 1st Quarter 201922
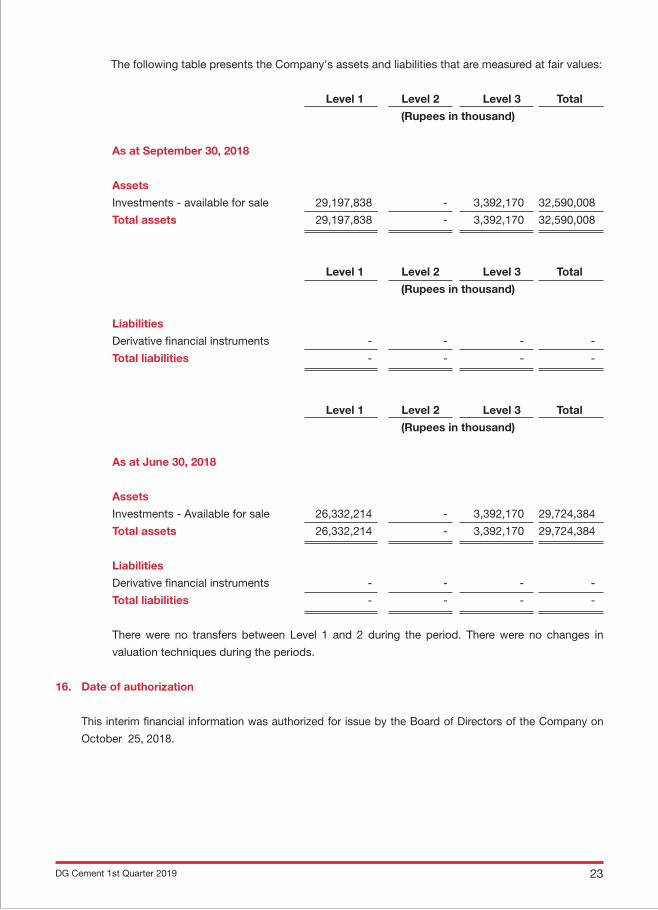
The following table presents the Company's assets and liabilities that are measured at fair values:
Level 1 Level 2 Level 3 Total
(Rupees in thousand)
As at September 30, 2018
Assets
Investments - available for sale 29,197,838 - 3,392,170 32,590,008
Total assets 29,197,838 - 3,392,170 32,590,008
Level 1 Level 2 Level 3 Total
(Rupees in thousand)
Liabilities
Derivative financial instruments - - - -
Total liabilities - - - -
Level 1 Level 2 Level 3 Total
(Rupees in thousand)
As at June 30, 2018
Assets
Investments - Available for sale 26,332,214 - 3,392,170 29,724,384
Total assets 26,332,214 - 3,392,170 29,724,384
Liabilities
Derivative financial instruments - - - -
Total liabilities - - - -
There were no transfers between Level 1 and 2 during the period. There were no changes in
valuation techniques during the periods.
16. Date of authorization
This interim financial information was authorized for issue by the Board of Directors of the Company on
October 25, 2018.
DG Cement 1st Quarter 2019 23
DirectorChief Executive Chief Financial Officer
17. Corresponding figures
In order to comply with the requirements of the International Accounting Standard 34: 'Interim Financial
Reporting', the condensed interim unconsolidated balance sheet and condensed interim unconsolidated
statement of changes in equity have been compared with the balances of annual audited financial
statements of preceding year, whereas, the condensed interim unconsolidated profit and loss account,
condensed interim unconsolidated statement of comprehensive income and condensed interim
unconsolidated cash flow statement have been compared with the balances of comparable period of
immediately preceding year.
Corresponding figures have been re-arranged wherever necessary for the purposes of comparison,
however, no significant re-arrangements have been made.
DG Cement 1st Quarter 201924
Interim ConsolidatedFinancial
Statements
Chief Executive
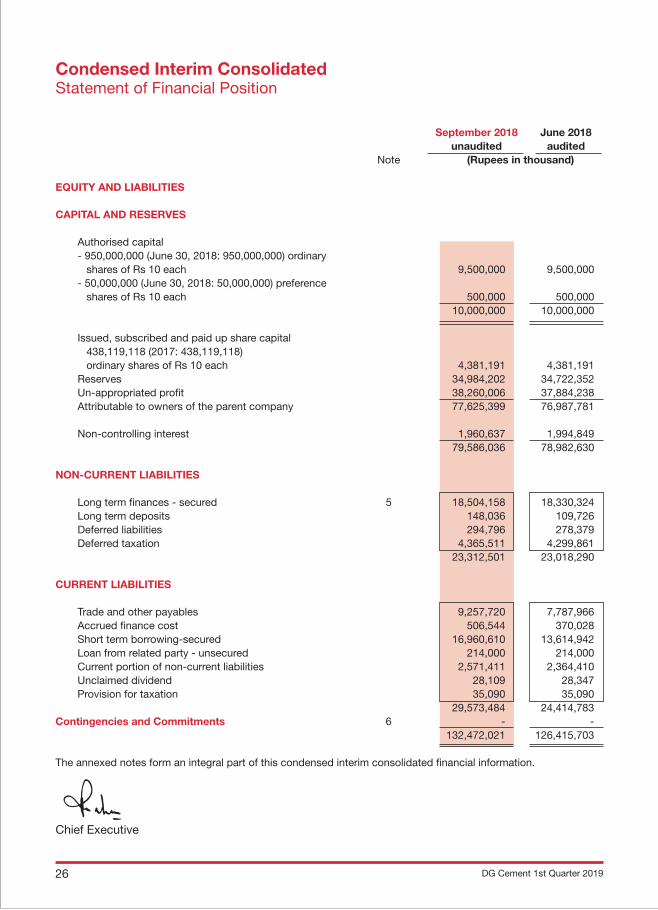
September 2018 June 2018 unaudited audited Note (Rupees in thousand) EQUITY AND LIABILITIES
CAPITAL AND RESERVES
Authorised capital - 950,000,000 (June 30, 2018: 950,000,000) ordinary shares of Rs 10 each 9,500,000 9,500,000 - 50,000,000 (June 30, 2018: 50,000,000) preference shares of Rs 10 each 500,000 500,000 10,000,000 10,000,000
Issued, subscribed and paid up share capital 438,119,118 (2017: 438,119,118) ordinary shares of Rs 10 each 4,381,191 4,381,191 Reserves 34,984,202 34,722,352 Un-appropriated profit 38,260,006 37,884,238 Attributable to owners of the parent company 77,625,399 76,987,781
Non-controlling interest 1,960,637 1,994,849 79,586,036 78,982,630
NON-CURRENT LIABILITIES
Long term finances - secured 5 18,504,158 18,330,324 Long term deposits 148,036 109,726 Deferred liabilities 294,796 278,379 Deferred taxation 4,365,511 4,299,861 23,312,501 23,018,290
CURRENT LIABILITIES
Trade and other payables 9,257,720 7,787,966 Accrued finance cost 506,544 370,028 Short term borrowing-secured 16,960,610 13,614,942 Loan from related party - unsecured 214,000 214,000 Current portion of non-current liabilities 2,571,411 2,364,410 Unclaimed dividend 28,109 28,347 Provision for taxation 35,090 35,090 29,573,484 24,414,783Contingencies and Commitments 6 - - 132,472,021 126,415,703
The annexed notes form an integral part of this condensed interim consolidated financial information.
Condensed Interim Consolidated Statement of Financial Position
DG Cement 1st Quarter 201926
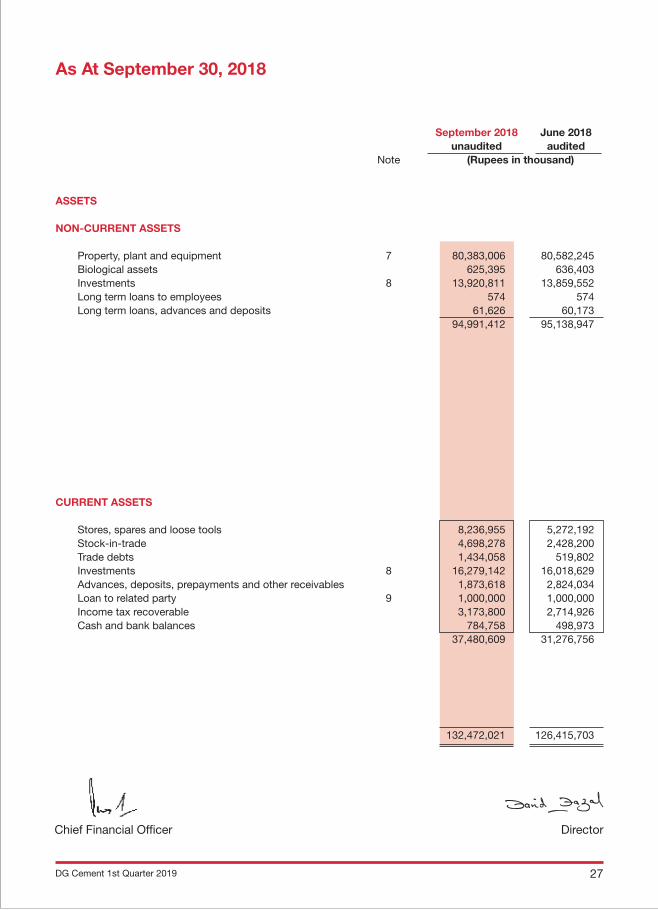
September 2018 June 2018 unaudited audited Note (Rupees in thousand)
ASSETS
NON-CURRENT ASSETS
Property, plant and equipment 7 80,383,006 80,582,245 Biological assets 625,395 636,403 Investments 8 13,920,811 13,859,552 Long term loans to employees 574 574 Long term loans, advances and deposits 61,626 60,173 94,991,412 95,138,947
CURRENT ASSETS
Stores, spares and loose tools 8,236,955 5,272,192 Stock-in-trade 4,698,278 2,428,200 Trade debts 1,434,058 519,802 Investments 8 16,279,142 16,018,629 Advances, deposits, prepayments and other receivables 1,873,618 2,824,034 Loan to related party 9 1,000,000 1,000,000 Income tax recoverable 3,173,800 2,714,926 Cash and bank balances 784,758 498,973 37,480,609 31,276,756
132,472,021 126,415,703
DirectorChief Financial Officer
As At September 30, 2018
DG Cement 1st Quarter 2019 27
DG Cement 1st Quarter 201928
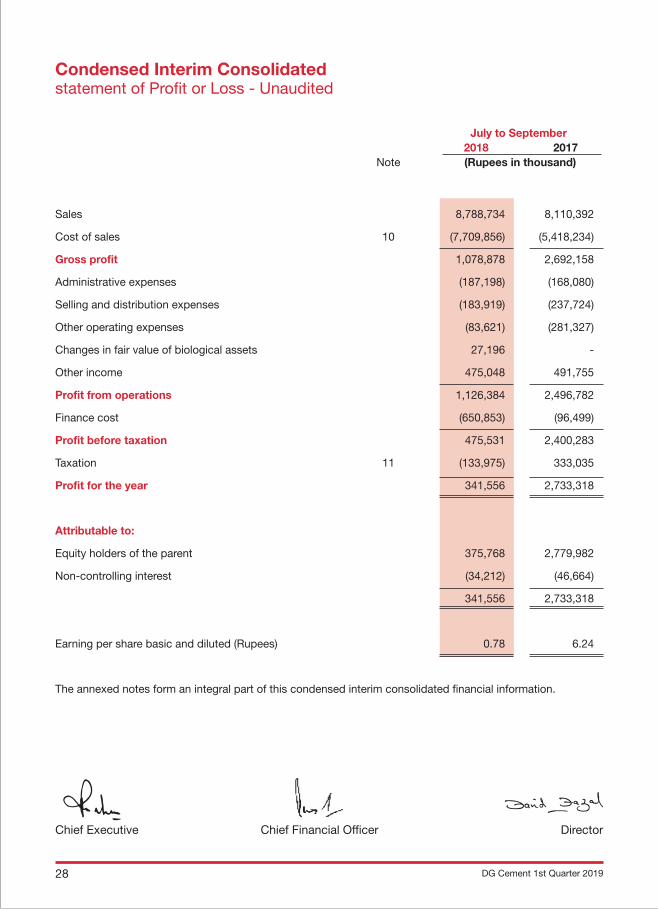
July to September 2018 2017 Note (Rupees in thousand)
Sales 8,788,734 8,110,392
Cost of sales 10 (7,709,856) (5,418,234)
Gross profit 1,078,878 2,692,158
Administrative expenses (187,198) (168,080)
Selling and distribution expenses (183,919) (237,724)
Other operating expenses (83,621) (281,327)
Changes in fair value of biological assets 27,196 -
Other income 475,048 491,755
Profit from operations 1,126,384 2,496,782
Finance cost (650,853) (96,499)
Profit before taxation 475,531 2,400,283
Taxation 11 (133,975) 333,035
Profit for the year 341,556 2,733,318
Attributable to:
Equity holders of the parent 375,768 2,779,982
Non-controlling interest (34,212) (46,664)
341,556 2,733,318
Earning per share basic and diluted (Rupees) 0.78 6.24
The annexed notes form an integral part of this condensed interim consolidated financial information.
DirectorChief Executive Chief Financial Officer
Condensed Interim Consolidatedstatement of Profit or Loss - Unaudited
DG Cement 1st Quarter 2019 29
DirectorChief Executive Chief Financial Officer
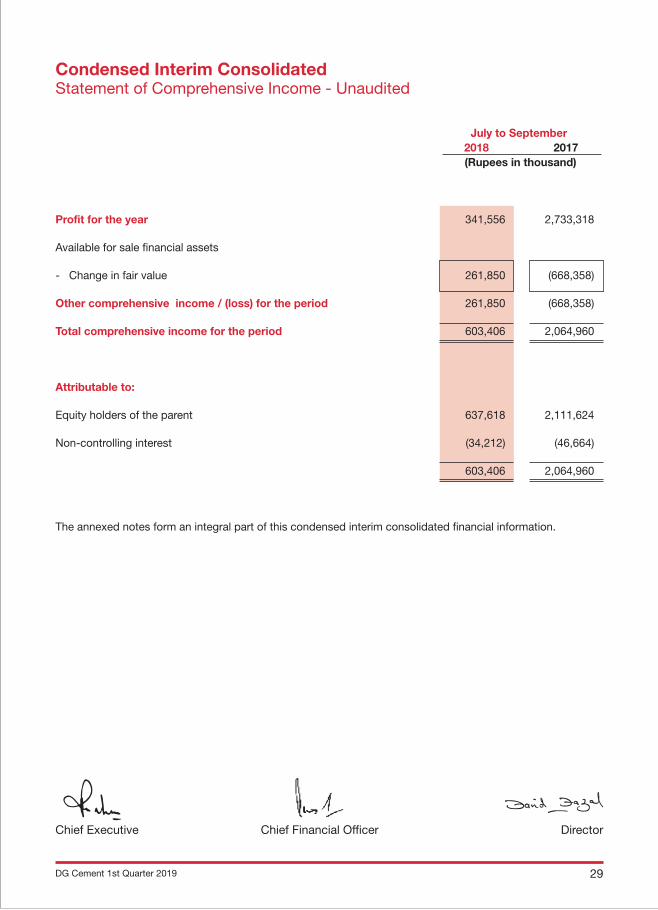
July to September 2018 2017 (Rupees in thousand)
Profit for the year 341,556 2,733,318
Available for sale financial assets
- Change in fair value 261,850 (668,358)
Other comprehensive income / (loss) for the period 261,850 (668,358)
Total comprehensive income for the period 603,406 2,064,960
Attributable to:
Equity holders of the parent 637,618 2,111,624
Non-controlling interest (34,212) (46,664)
603,406 2,064,960
The annexed notes form an integral part of this condensed interim consolidated financial information.
Condensed Interim ConsolidatedStatement of Comprehensive Income - Unaudited
DG Cement 1st Quarter 201930
DirectorChief Executive Chief Financial Officer
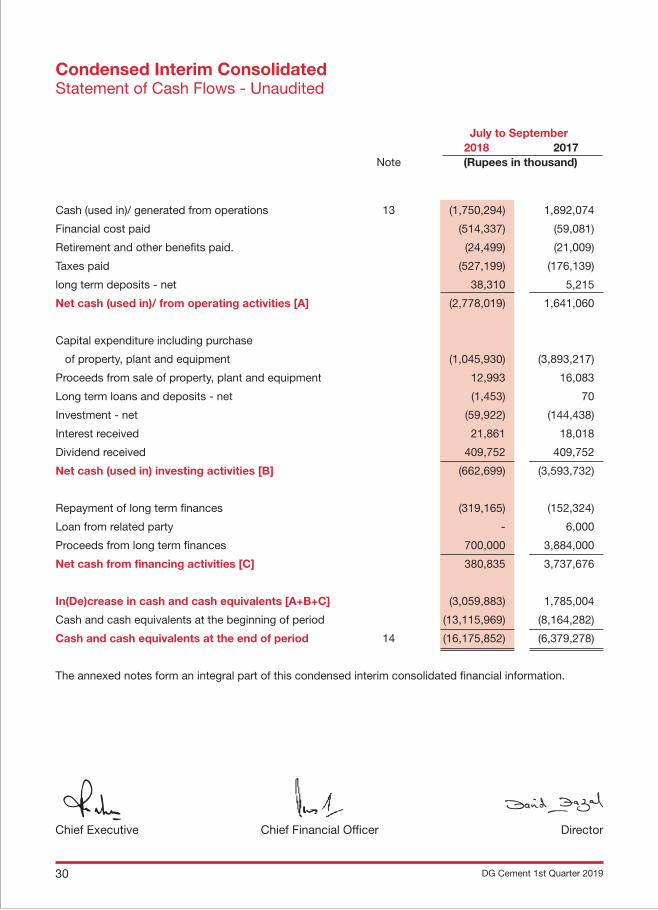
July to September 2018 2017 Note (Rupees in thousand)
Cash (used in)/ generated from operations 13 (1,750,294) 1,892,074
Financial cost paid (514,337) (59,081)
Retirement and other benefits paid. (24,499) (21,009)
Taxes paid (527,199) (176,139)
long term deposits - net 38,310 5,215
Net cash (used in)/ from operating activities [A] (2,778,019) 1,641,060
Capital expenditure including purchase
of property, plant and equipment (1,045,930) (3,893,217)
Proceeds from sale of property, plant and equipment 12,993 16,083
Long term loans and deposits - net (1,453) 70
Investment - net (59,922) (144,438)
Interest received 21,861 18,018
Dividend received 409,752 409,752
Net cash (used in) investing activities [B] (662,699) (3,593,732)
Repayment of long term finances (319,165) (152,324)
Loan from related party - 6,000
Proceeds from long term finances 700,000 3,884,000
Net cash from financing activities [C] 380,835 3,737,676
In(De)crease in cash and cash equivalents [A+B+C] (3,059,883) 1,785,004
Cash and cash equivalents at the beginning of period (13,115,969) (8,164,282)
Cash and cash equivalents at the end of period 14 (16,175,852) (6,379,278)
The annexed notes form an integral part of this condensed interim consolidated financial information.
Condensed Interim ConsolidatedStatement of Cash Flows - Unaudited
DG Cement 1st Quarter 2019 31
Dire
ctor
Chi
ef E
xecu
tive
Chi
ef F
inan
cial
Offi
cer
Cap
ital
res
erve
Rev
enue
res
erve
Rup
ees
in t
hous
and
s
Bal
ance
as
at J
une
30, 2
018
- A
udit
ed
4,38
1,19
1 4,
557,
163
24,7
00,8
28
353,
510
5,11
0,85
1 37
,884
,238
76
,987
,781
1,
994,
849
78,9
82,6
30
Tota
l com
pre
hens
ive
inco
me
for
the
per
iod
- P
rofit
for
the
per
iod
-
- -
- -
375,
768
375,
768
(34,
212)
34
1,55
6
- O
ther
com
pre
hens
ive
inco
me
for
the
per
iod
-
- 26
1,85
0 -
- -
261,
850
- 26
1,85
0
Bal
ance
as
at S
epte
mb
er 3
0, 2
018
- U
naud
ited
4,
381,
191
4,55
7,16
3 24
,962
,678
35
3,51
0 5,
110,
851
38,2
60,0
06
77,6
25,3
99
1,96
0,63
7 79
,586
,036
Bal
ance
as
at J
une
30, 2
017
- A
udit
ed
4,38
1,19
1 4,
557,
163
27,9
57,4
95
353,
510
5,11
0,85
1 32
,333
,597
74
,693
,807
1,
971,
423
76,6
65,2
30
Tota
l com
pre
hens
ive
inco
me
for
the
per
iod
- P
rofit
for
the
per
iod
-
- -
- -
2,77
9,98
2 2,
779,
982
(46,
664)
2,
733,
318
- O
ther
com
pre
hens
ive
loss
for
the
per
iod
-
- (6
68,3
58)
- -
- (6
68,3
58)
- (6
68,3
58)
Bal
ance
as
at S
epte
mb
er 3
0, 2
017
- U
naud
ited
4,
381,
191
4,55
7,16
3 27
,289
,137
35
3,51
0 5,
110,
851
35,1
13,5
79
76,8
05,4
31
1,92
4,75
9 78
,730
,190
The
anne
xed
not
es fo
rm a
n in
tegr
al p
art
of t
his
cond
ense
d in
terim
con
solid
ated
fina
ncia
l inf
orm
atio
n.
Sha
reP
rem
ium
Fair
Valu
eR
eser
ve
Cap
ital
Red
empt
ion
Res
erve
Fund
Gen
eral
Res
erve
Acc
umul
ated
Pro
fit
Tota
l sha
reho
lder
s eq
uity
Sha
reC
apit
al
Tota
l eq
uity
attr
ibut
able
to
shar
eho
lder
s o
f p
aren
t co
mp
any
No
n-C
ont
rolli
ngin
tere
st
Condensed Interim Consolidatedstatement of Changes In Equity - Unaudited
DG Cement 1st Quarter 201932
1. Legal status and nature of business
The group comprises of:
- D. G. Khan Cement Company Limited (the parent company); - Nishat Paper Products Company Limited; - Nishat Dairy (Private) Limited; and - Nishat Farm Supplies (Private) Limited.
The parent company is a public limited company incorporated in Pakistan and is listed on Pakistan Stock Exchange. It is principally engaged in production and sale of Clinker, Ordinary Portland and Sulphate Resistant Cement. The registered office of the Company is situated at 53-A Lawrence Road, Lahore.
Nishat Paper Products Company Limited is a public limited company incorporated in Pakistan under the Companies Ordinance, 1984 on July 23, 2004. It is principally engaged in the manufacture and sale of paper products and packaging material.
Nishat Dairy (private) Limited (the company) was incorporated in Pakistan under the Companies Ordinance 1984 on October 28, 2011. The principally activity of the company is to carry on the business of production of raw milk.
Nishat Farm Supplies (Private) Limited is a private limited company incorporated in Pakistan. It is a wholly owned subsidiary of Nishat Dairy (Private) Limited. The principal activity of the company is to carry on the business of sale, marketing and distribution of imported chemicals, medicines, vaccines, cows, other chemicals of all kinds and types (hereinafter referred to as the 'Farm Supplies segment').
2. Basis of preparation
These condensed interim financial statements have been prepared in accordance with the accounting and reporting standards as applicable in Pakistan for interim financial reporting. The accounting and reporting standards as applicable in Pakistan for interim financial reporting comprise of:
- International Accounting Standard (IAS) 34, Interim Financial Reporting, issued by the International Accounting Standards Board (IASB) as notified under the Companies Act, 2017; and
- Provisions of and directives issued under the Companies Act, 2017.
Where the provisions of and directives issued under the Companies Act, 2017 differ with the requirements of IAS 34, the provisions of and directives issued under the Companies Act, 2017 have been followed.
2.1 Initial application of standards, amendments or an interpretation to existing standards
Initial application of standards, amendments or an interpretation to existing standards There are
Notes to and Forming Part of theCondensed Interim Consolidated Financial Information - Unaudited
certain standards, amendments to the approved accounting standards and interpretations that are mandatory for the Company’s accounting periods beginning from july 01, 2018 but are not considered to be relevant or to have any significant effect on the Company’s operations and are, therefore, not detailed in this condensed interim financial information.
2.2 The preparation of the interim financial information requires management to make judgments, estimates and assumptions that affect the application of accounting policies, the presentation of assets, liabilities, incomes and expenses and the amounts reported there against as well as disclosure of contingent liabilities at the date of the interim financial information. If in future such estimates and assumptions, which are based on management's best judgment at the date of the interim financial information, deviate from the actual circumstances, the original estimates and assumptions will be modified as appropriate during the period in which the circumstances change.
- Residual value and useful life estimation of fixed assets - Provision for taxation - Retirements and other benefits - Provisions and Contingencies - Fair value of unquoted available-for-sale investment - Fair valuation of biological assets
3. Significant accounting policies
3.1 The accounting policies adopted for the preparation of this interim consolidated financial information are the same as those applied in the preparation of the preceding annual published consolidated financial statements of the group for the year ended June 30, 2018.
3.2 Significant accounting estimates, judgements and financial risk:
The preparation of this condensed interim financial information in conformity with the approved accounting standards as applicable in Pakistan for interim reporting to make estimates, assumptions and use judgements that affect the application of policies and reported amounts of assets, liabilities , income and expenses. Estimates, assumptions and judgements are continually evaluated and are based on historical experience and other factors, including reasonable expectations of future events. Revision to accounting estimates are recognised prospectively commencing from the period of revision.
Judgements and estimates made by the management in the preparation of this condensed interim consolidated financial information are the same as those applied to the financial statements as at and for the year ended June 30, 2018.
The Company's financial risk management objectives and policies are consistent with those disclosed in the financial statements as at and for the year ended June 30, 2018.
4. Income tax expense is recognised based on management's best estimate of the weighted average annual income tax rate expected for the full financial year.
DG Cement 1st Quarter 2019 33
September 30, June 30,
2018 2018
Un-audited audited
(Rupees in thousand)
5. Long term finances
These are composed of:
- Long term loans 21,048,806 20,667,971
-note 5.1 21,048,806 20,667,971
Less: Current portion shown under current liabilities 2,544,648 2,337,647
18,504,158 18,330,324
5.1 Long term loans
Opening balance 20,667,971 13,133,750
Add: Disbursements during the period 700,000 8,453,805
21,367,971 21,587,555
Less: Repayment during the period 319,165 919,584
Closing balance 21,048,806 20,667,971
6. Contingencies and commitments
6.1 Contingencies
There is no significant change in contingencies from the annual financial statements of the
company for the year ended June 30, 2018.
6.2 Commitments in respect of
(i) Contracts for capital expenditure Rs 446.198 million (June 30, 2018: Rs 224.277 million).
(ii) Letters of credit for capital expenditure Rs 126.582 million (June 30, 2018: Rs 235.266 million).
(iii) Letters of credit other than capital expenditure Rs 1,712.819 million (June 30, 2018: Rs 3,685.854
million).
September 30, June 30,
2018 2018
Un-audited audited
(Rupees in thousand)
7. Property, plant and equipment
Operating Assets -note 7.1 76,357,170 77,509,420
Capital work-in-progress 3,934,070 2,981,059
Major spare parts and stand-by equipment 91,766 91,766
80,383,006 80,582,245
DG Cement 1st Quarter 201934
September 30, June 30,
2018 2018
Un-audited audited
(Rupees in thousand)
7.1 Operating assets
Opening book value 77,509,420 34,336,559 Add: Additions during the period/ year -note 7.1.1 103,927 47,234,857 77,613,347 81,571,416 Less: Impairment charge for the year - 1,270,120 Disposals during the period/ year - net book value 14,458 222,769 Depreciation charged during the period/ year 1,241,719 2,569,107 Closing book value 76,357,170 77,509,420
7.1.1 Major additions during the period
Free hold land 1,542 38,525 Building on freehold land - 221,859 Office building and housing colony - 29,200 Roads - 66,354 Plant and machinery 27,093 852,612 Quarry equipment 25,860 18,722 Furniture, fixtures and office equipment 27,090 39,664 Motor vehicles 22,342 123,240 Power and water supply lines - 21,330 103,927 1,411,506
8. Investments
Cost of investments 5,237,275 5,177,353 Add: Fair value adjustments 24,962,678 24,700,828 30,199,953 29,878,181 Less: Investments classified in current assets 16,279,142 16,018,629 Closing balance 13,920,811 13,859,552
9. Loan to related party
This represents loan amounting to Rs 1,000 million to Nishat Hotels and Properties Limited ('NHPL'), an associated company, for meeting its working capital requirements. The loan carries markup at the rate of 3 months KIBOR + 0.5% per annum, payable on a monthly basis. The entire amount of the loan is repayable on October 30, 2017. The loan is secured through corporate guarantee of 110% of the loan amount issued by NHPL in favour of the Company. The effective markup rate charged during the period was 6.55% per annum.
In case of default in payment of principal or markup, the borrower shall be liable to pay additional sum equivalent to 7.5% per annum of respective amount of default.
DG Cement 1st Quarter 2019 35
July to September 2018 2017 (Rupees in thousand)
10. Cost of sales
Raw and packing materials consumed 961,806 678,981
Forage 238,409 216,343
Medicine and related items 22,984 22,216
Salaries, wages and other benefits 792,779 579,359
Electricity, gas and water 1,223,523 553,844
Furnace oil/coal 3,893,403 1,978,040
Stores and spares consumed 609,211 418,359
Repair and maintenance 122,974 76,648
Insurance 22,783 13,947
Depreciation on property, plant and equipment 1,228,691 551,299
Royalty 162,428 75,852
Excise duty 10,315 7,225
Vehicle running 17,360 6,992
Postage, telephone and telegram 2,908 1,465
Printing and stationery 4,497 3,402
Legal and professional charges 828 738
Travelling and conveyance 2,662 1,427
Estate development 6,349 5,753
Rent, rates and taxes 21,422 11,622
Freight charges 18,105 6,896
Other expenses 35,506 24,176
Total manufacturing cost 9,398,943 5,234,584
Opening work-in-process 493,431 522,557
Cost of goods available for manufacture 9,892,374 5,757,141
Closing work-in-process (1,851,912) (345,778)
Cost of goods manufactured 8,040,462 5,411,363
Opening stock of finished goods 535,499 431,356
Cost of goods available for sale 8,575,961 5,842,719
Closing stock of finished goods (817,668) (364,123)
Own consumption capitalized (48,437) (60,362)
Cost of goods sold 7,709,856 5,418,234
11. Taxation
Current tax 68,297 29,772
Deferred tax 65,678 (362,807)
133,975 (333,035)
DG Cement 1st Quarter 201936
12. Transactions with related parties
The related parties comprise associated companies, other related companies, directors of the company,
key management personnel and post employment benefit plans. Significant transactions with related
parties are as follows:
July to September
2018 2017
(Rupees in thousand)
Relationship with the Nature of transaction
Group
Other related parties Purchase of goods and services 9,212 427,428
Insurance premium 27,878 42,826
Sale of goods 26,685 49,020
Mark-up income 20,453 16,745
Insurance claim received 1,059 -
Dividend income 409,109 409,109
Key Management Salaries and other
personnel employment benefits 56,414 61,971
Post employment Expense charged in respect of staff
benefit plans retirement benefits plans 40,923 33,653
All transactions with related parties have been carried out on commercial terms and conditions.
DG Cement 1st Quarter 2019 37
July to September
2018 2017
(Rupees in thousand)
13. Cash flow from operating activities
Profit before tax 475,531 2,400,283
Adjustment for :
- Depreciation on property, plant and equipment 1,241,719 570,515
- Profit on disposal of property, plant and equipment 1,465 (5,895)
- Dividend income (409,752) (409,752)
- Retirement and other benefits accrued 40,916 33,797
- Markup income (21,861) (18,018)
- Finance cost 650,853 96,499
Profit before working capital changes 1,978,871 2,667,429
- Stores, spares and loose tools (2,964,763) (526,678)
- Stock-in-trade (2,270,078) 332,165
- Trade debts (914,256) (235,239)
- Advances, deposits, prepayments and other receivables 950,416 14,623
- Trade and other payables 1,469,516 (360,226)
Net working capital changes (3,729,165) (775,355)
Cash (used in)/ generated from operations (1,750,294) 1,892,074
14. Cash and cash equivalents
Short term borrowings - secured (16,960,610) (6,856,988)
Cash and bank balances 784,758 477,710
Total cash and cash equivalents (16,175,852) (6,379,278)
15. Financial risk management
15.1 Financial risk factors
The group's activities expose it to a variety of financial risks: market risk (including currency risk, fair
value interest rate risk, cash flow interest rate risk and price risk), credit risk and liquidity risk.
The consolidated condensed interim financial information does not include all financial risk
management information and disclosures required in the annual financial statements, and should be
read in conjunction with the group’s annual financial statements as at June 30, 2018.
There have been no changes in the risk management department or in any risk management policies
since the year ended June 30, 2018.
DG Cement 1st Quarter 201938
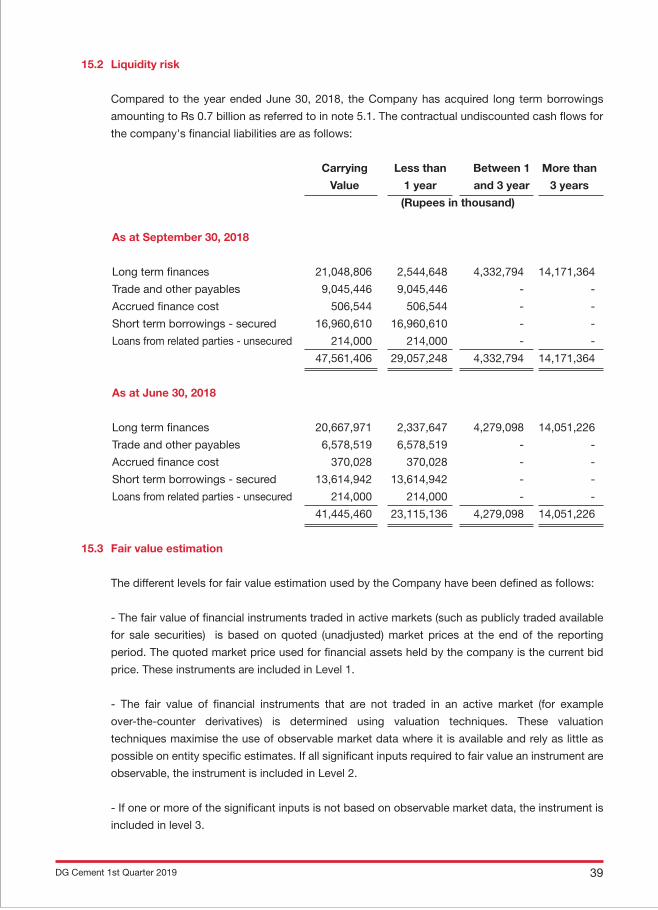
15.2 Liquidity risk
Compared to the year ended June 30, 2018, the Company has acquired long term borrowings
amounting to Rs 0.7 billion as referred to in note 5.1. The contractual undiscounted cash flows for
the company's financial liabilities are as follows:
Carrying Less than Between 1 More than
Value 1 year and 3 year 3 years
(Rupees in thousand)
As at September 30, 2018
Long term finances 21,048,806 2,544,648 4,332,794 14,171,364
Trade and other payables 9,045,446 9,045,446 - -
Accrued finance cost 506,544 506,544 - -
Short term borrowings - secured 16,960,610 16,960,610 - -
Loans from related parties - unsecured 214,000 214,000 - -
47,561,406 29,057,248 4,332,794 14,171,364
As at June 30, 2018
Long term finances 20,667,971 2,337,647 4,279,098 14,051,226
Trade and other payables 6,578,519 6,578,519 - -
Accrued finance cost 370,028 370,028 - -
Short term borrowings - secured 13,614,942 13,614,942 - -
Loans from related parties - unsecured 214,000 214,000 - -
41,445,460 23,115,136 4,279,098 14,051,226
15.3 Fair value estimation
The different levels for fair value estimation used by the Company have been defined as follows:
- The fair value of financial instruments traded in active markets (such as publicly traded available
for sale securities) is based on quoted (unadjusted) market prices at the end of the reporting
period. The quoted market price used for financial assets held by the company is the current bid
price. These instruments are included in Level 1.
- The fair value of financial instruments that are not traded in an active market (for example
over-the-counter derivatives) is determined using valuation techniques. These valuation
techniques maximise the use of observable market data where it is available and rely as little as
possible on entity specific estimates. If all significant inputs required to fair value an instrument are
observable, the instrument is included in Level 2.
- If one or more of the significant inputs is not based on observable market data, the instrument is
included in level 3.
DG Cement 1st Quarter 2019 39
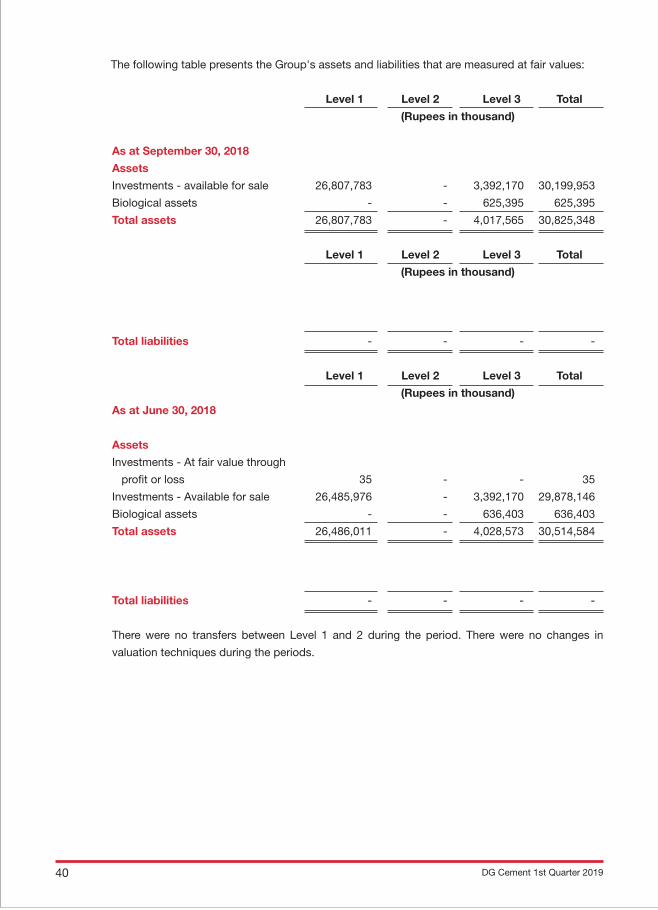
The following table presents the Group's assets and liabilities that are measured at fair values:
Level 1 Level 2 Level 3 Total
(Rupees in thousand)
As at September 30, 2018
Assets
Investments - available for sale 26,807,783 - 3,392,170 30,199,953
Biological assets - - 625,395 625,395
Total assets 26,807,783 - 4,017,565 30,825,348
Level 1 Level 2 Level 3 Total
(Rupees in thousand)
Total liabilities - - - -
Level 1 Level 2 Level 3 Total
(Rupees in thousand)
As at June 30, 2018
Assets
Investments - At fair value through
profit or loss 35 - - 35
Investments - Available for sale 26,485,976 - 3,392,170 29,878,146
Biological assets - - 636,403 636,403
Total assets 26,486,011 - 4,028,573 30,514,584
Total liabilities - - - -
There were no transfers between Level 1 and 2 during the period. There were no changes in
valuation techniques during the periods.
DG Cement 1st Quarter 201940
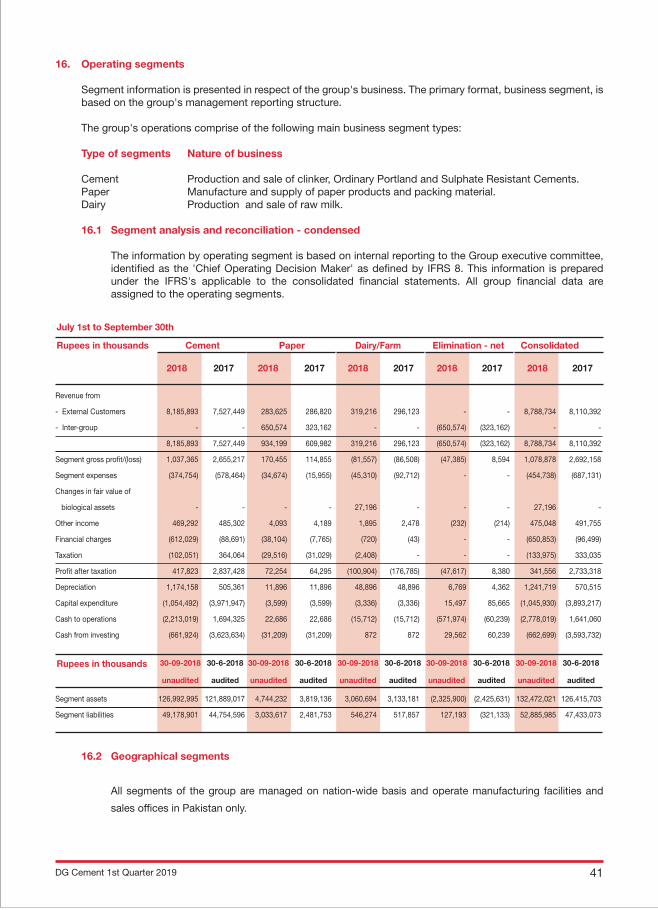
Revenue from
- External Customers 8,185,893 7,527,449 283,625 286,820 319,216 296,123 - - 8,788,734 8,110,392
- Inter-group - - 650,574 323,162 - - (650,574) (323,162) - -
8,185,893 7,527,449 934,199 609,982 319,216 296,123 (650,574) (323,162) 8,788,734 8,110,392
Segment gross profit/(loss) 1,037,365 2,655,217 170,455 114,855 (81,557) (86,508) (47,385) 8,594 1,078,878 2,692,158
Segment expenses (374,754) (578,464) (34,674) (15,955) (45,310) (92,712) - - (454,738) (687,131)
Changes in fair value of
biological assets - - - - 27,196 - - - 27,196 -
Other income 469,292 485,302 4,093 4,189 1,895 2,478 (232) (214) 475,048 491,755
Financial charges (612,029) (88,691) (38,104) (7,765) (720) (43) - - (650,853) (96,499)
Taxation (102,051) 364,064 (29,516) (31,029) (2,408) - - - (133,975) 333,035
Profit after taxation 417,823 2,837,428 72,254 64,295 (100,904) (176,785) (47,617) 8,380 341,556 2,733,318
Depreciation 1,174,158 505,361 11,896 11,896 48,896 48,896 6,769 4,362 1,241,719 570,515
Capital expenditure (1,054,492) (3,971,947) (3,599) (3,599) (3,336) (3,336) 15,497 85,665 (1,045,930) (3,893,217)
Cash to operations (2,213,019) 1,694,325 22,686 22,686 (15,712) (15,712) (571,974) (60,239) (2,778,019) 1,641,060
Cash from investing (661,924) (3,623,634) (31,209) (31,209) 872 872 29,562 60,239 (662,699) (3,593,732)
Segment assets 126,992,995 121,889,017 4,744,232 3,819,136 3,060,694 3,133,181 (2,325,900) (2,425,631) 132,472,021 126,415,703
Segment liabilities 49,178,901 44,754,596 3,033,617 2,481,753 546,274 517,857 127,193 (321,133) 52,885,985 47,433,073
16.2 Geographical segments
All segments of the group are managed on nation-wide basis and operate manufacturing facilities and
sales offices in Pakistan only.
2018 2017 2018 2017 2018 2017 2018 2017 2018 2017
July 1st to September 30th
Rupees in thousands
Rupees in thousands
Cement Paper Elimination - net ConsolidatedDairy/Farm
30-09-2018
unaudited
30-6-2018
audited
30-09-2018
unaudited
30-6-2018
audited
30-09-2018
unaudited
30-6-2018
audited
30-09-2018
unaudited
30-6-2018
audited
30-09-2018
unaudited
30-6-2018
audited
16. Operating segments
Segment information is presented in respect of the group's business. The primary format, business segment, is based on the group's management reporting structure.
The group's operations comprise of the following main business segment types:
Type of segments Nature of business
Cement Production and sale of clinker, Ordinary Portland and Sulphate Resistant Cements. Paper Manufacture and supply of paper products and packing material. Dairy Production and sale of raw milk.
16.1 Segment analysis and reconciliation - condensed The information by operating segment is based on internal reporting to the Group executive committee,
identified as the 'Chief Operating Decision Maker' as defined by IFRS 8. This information is prepared under the IFRS's applicable to the consolidated financial statements. All group financial data are assigned to the operating segments.
DG Cement 1st Quarter 2019 41
DirectorChief Executive Chief Financial Officer
17. Date of authorization
This interim financial information was authorized for issue by the Board of Directors of the Company on
October 25, 2018.
18. Corresponding figures
In order to comply with the requirements of the International Accounting Standard 34: 'Interim Financial
Reporting', the condensed interim consolidated balance sheet and condensed interim consolidated
statement of changes in equity have been compared with the balances of annual audited financial
statements of preceding year, whereas, the condensed interim consolidated profit and loss account,
condensed interim consolidated statement of comprehensive income and condensed interim consolidated
cash flow statement have been compared with the balances of comparable period of immediately
preceding year.
DG Cement 1st Quarter 201942
Notes
DG Cement 1st Quarter 2019 43
Notes
DG Cement 1st Quarter 201944

VE
RS
AT
ILE
P
h: +
92 4
2 37
12 1
920
Nishat House, 53-A, Lawrence Road, Lahore-Pakistan.UAN:+92-42-111-11-33-33
D.G. KHAN CEMENT COMPANY LIMITED