DFFHSWHGI RUS XEOLFDWLRQLQ,((( 6PDUW*ULG&RPP …gyuri/Pub/Vukovic-SGC13-DSESec.pdf · DFFHSWHGI RUS...
6
© Personal use of this material is permitted. Permission from IEEE must be obtained for all other uses, in any current or future media, including reprinting/republishing this material for advertising or promotional purposes, creating new collective works, for resale or redistribution to servers or lists, or reuse of any copyrighted component of this work in other works. The paper is accepted for publication in IEEE SmartGridComm 2013. Detection and Localization of Targeted Attacks on Fully Distributed Power System State Estimation Ognjen Vukovi´ c and Gy¨ orgy D´ an Laboratory for Communication Networks School of Electrical Engineering KTH Royal Institute of Technology, Stockholm, Sweden Email: {vukovic,gyuri}@ee.kth.se Abstract—Distributed state estimation will play a central role in the efficient and reliable operation of interconnected power systems. Therefore, its security is of major concern. In this work we show that an attacker that compromises a single control center in an interconnected system could launch a denial of service attack against state-of-the-art distributed state estimation by injecting false data, and consequently, it could blind the entire system. We propose a fully distributed attack detection scheme based on local measurements to detect such a denial of service attack. We then propose a fully distributed attack localization scheme that relies on the regions’ beliefs about the attack location, and performs inference on the power system topology to identify the most likely attack location. We validate both algorithms on the IEEE 118 bus power system. I. I NTRODUCTION Modern power systems are becoming increasingly inter- connected in order to improve their operational efficiency. In the future smart grid, it is expected that interconnected power systems become even more prevalent, and that their control and supervision becomes fully distributed, without any central coordinator. The goal of each independent operator of such an interconnected system is to operate its system in an efficient and reliable way, and to preserve the system’s stability. Since the stability of an entire interconnected power system depends on the stability of its constituent regions, e.g., as shown by the cascading failures that led to the 2003 North-East blackout in the U.S., it is important that the operators cooperate and exchange timely and accurate information about their systems. However, to safeguard confidential information, the cooperation and information exchange between the operators is limited. One of the most fundamental applications that requires coordination between operators is power system state estima- tion (SE). SE is essential for maintaining the power system stable and for operating it efficiently. The SE uses noisy field measurements acquired by the Supervisory Control and Data Acquisition (SCADA) system and a steady-state model of the power flows in the physical system to provide an accurate estimate of the state of the system [1], [2]. The SE is a core component of the Energy Management System (EMS): the output of the SE is used by various EMS applications. Examples include contingency analysis, which evaluates how an outage would affect the system, and optimal power flow, which computes the optimal generation profile based on some criteria such as minimization of generation costs. In the case of distributed SE, each independent operator performs the SE of its region, but it needs to cooperate with the operators of neighboring regions so that a consistent and correct estimate of power flows on the lines connecting two regions can be obtained. The resulting fully distributed SE (DSE) [3], [4], [5], [6] are effectively extensions of the basic SE algorithm [1], [2], and they obtain a consistent state estimate for the entire interconnected power system. The DSE typically requires that every operator exchanges only partial information about the state of its system. The central role that SE plays in power system operations makes its security a major concern. The security of standalone SEs against so called stealth attacks on the measurements acquired by the SCADA system has been widely studied [7], [8], [9], [10], [11], [12], [13], [14], [15]. Stealth attacks are false measurement data injection attacks that bypass the model- based bad data detection used in the SE [7]. Various mitigation schemes against stealth attacks have been proposed: protection of individual data [9], changes to the model-based detec- tion [10], and the protection of the SCADA infrastructure [11], [12]. Detection of stealth attacks along with state recovery has been studied in [15]. The security of DSE against false data injection attacks on the exchanged data between neighboring operators has been studied in [16]. It was shown that such attacks can disable the DSE (prevent it from finding a correct estimate). Furthermore, a detection scheme was proposed to detect such attacks along with a simple mitigation scheme where the operators perform a local state estimation upon detecting the attacks. However, by using such a mitigation scheme, the power flows connecting any two regions cannot be correctly estimated. In this work we address the detection and localization of false data injection attacks on the DSE. We consider an attacker that compromises a single control center so that it can manipulate the data exchanged between the control center and its neighbors. We apply the attack to one of the most recent DSE algorithms [6] (outlined in Section II), and show that the attack can effectively disable the DSE (Section III). We propose an algorithm to detect the attacks by identifying discrepancies between the evolution of manipulated data (Sec- tion IV). Furthermore, we propose a distributed algorithm to locate the attacks, which relies on the regions’ beliefs about the attack location, and performs graphical inference on the power system topology to identify the most likely attack location. To the best of our knowledge this is the first work to propose a mitigation scheme for denial of service attacks against power system DSE.
Transcript of DFFHSWHGI RUS XEOLFDWLRQLQ,((( 6PDUW*ULG&RPP …gyuri/Pub/Vukovic-SGC13-DSESec.pdf · DFFHSWHGI RUS...
© Personal use of this material is permitted. Permission from IEEE must be obtained for all other uses, in any current or future media, including reprinting/republishing this material for advertising or promotional purposes, creating new collective works, for
resale or redistribution to servers or lists, or reuse of any copyrighted component of this work in other works. The paper is accepted for publication in IEEE SmartGridComm 2013.
Detection and Localization of Targeted Attacks on
Fully Distributed Power System State Estimation
Ognjen Vukovic and Gyorgy DanLaboratory for Communication Networks
School of Electrical EngineeringKTH Royal Institute of Technology, Stockholm, Sweden
Email: {vukovic,gyuri}@ee.kth.se
Abstract—Distributed state estimation will play a central role
in the efficient and reliable operation of interconnected power
systems. Therefore, its security is of major concern. In this work
we show that an attacker that compromises a single control
center in an interconnected system could launch a denial of
service attack against state-of-the-art distributed state estimation
by injecting false data, and consequently, it could blind the entire
system. We propose a fully distributed attack detection scheme
based on local measurements to detect such a denial of service
attack. We then propose a fully distributed attack localization
scheme that relies on the regions’ beliefs about the attack location,
and performs inference on the power system topology to identify
the most likely attack location. We validate both algorithms on
the IEEE 118 bus power system.
I. INTRODUCTION
Modern power systems are becoming increasingly inter-connected in order to improve their operational efficiency.In the future smart grid, it is expected that interconnectedpower systems become even more prevalent, and that theircontrol and supervision becomes fully distributed, without anycentral coordinator. The goal of each independent operator ofsuch an interconnected system is to operate its system in anefficient and reliable way, and to preserve the system’s stability.Since the stability of an entire interconnected power systemdepends on the stability of its constituent regions, e.g., asshown by the cascading failures that led to the 2003 North-Eastblackout in the U.S., it is important that the operators cooperateand exchange timely and accurate information about theirsystems. However, to safeguard confidential information, thecooperation and information exchange between the operatorsis limited.
One of the most fundamental applications that requirescoordination between operators is power system state estima-tion (SE). SE is essential for maintaining the power systemstable and for operating it efficiently. The SE uses noisy fieldmeasurements acquired by the Supervisory Control and DataAcquisition (SCADA) system and a steady-state model of thepower flows in the physical system to provide an accurateestimate of the state of the system [1], [2]. The SE is acore component of the Energy Management System (EMS):the output of the SE is used by various EMS applications.Examples include contingency analysis, which evaluates howan outage would affect the system, and optimal power flow,which computes the optimal generation profile based on somecriteria such as minimization of generation costs.
In the case of distributed SE, each independent operator
performs the SE of its region, but it needs to cooperatewith the operators of neighboring regions so that a consistentand correct estimate of power flows on the lines connectingtwo regions can be obtained. The resulting fully distributedSE (DSE) [3], [4], [5], [6] are effectively extensions of thebasic SE algorithm [1], [2], and they obtain a consistent stateestimate for the entire interconnected power system. The DSEtypically requires that every operator exchanges only partialinformation about the state of its system.
The central role that SE plays in power system operationsmakes its security a major concern. The security of standaloneSEs against so called stealth attacks on the measurementsacquired by the SCADA system has been widely studied [7],[8], [9], [10], [11], [12], [13], [14], [15]. Stealth attacks arefalse measurement data injection attacks that bypass the model-based bad data detection used in the SE [7]. Various mitigationschemes against stealth attacks have been proposed: protectionof individual data [9], changes to the model-based detec-tion [10], and the protection of the SCADA infrastructure [11],[12]. Detection of stealth attacks along with state recovery hasbeen studied in [15].
The security of DSE against false data injection attacks onthe exchanged data between neighboring operators has beenstudied in [16]. It was shown that such attacks can disable theDSE (prevent it from finding a correct estimate). Furthermore,a detection scheme was proposed to detect such attacks alongwith a simple mitigation scheme where the operators performa local state estimation upon detecting the attacks. However,by using such a mitigation scheme, the power flows connectingany two regions cannot be correctly estimated.
In this work we address the detection and localizationof false data injection attacks on the DSE. We consider anattacker that compromises a single control center so that itcan manipulate the data exchanged between the control centerand its neighbors. We apply the attack to one of the mostrecent DSE algorithms [6] (outlined in Section II), and showthat the attack can effectively disable the DSE (Section III).We propose an algorithm to detect the attacks by identifyingdiscrepancies between the evolution of manipulated data (Sec-tion IV). Furthermore, we propose a distributed algorithm tolocate the attacks, which relies on the regions’ beliefs about theattack location, and performs graphical inference on the powersystem topology to identify the most likely attack location. Tothe best of our knowledge this is the first work to propose amitigation scheme for denial of service attacks against powersystem DSE.

II. SYSTEM MODEL AND STATE ESTIMATION
We consider an inter-connected power system that consistsof several control areas, which we call regions. We denotethe set of regions by R, and use |R| = R. A region r 2 Rincludes a subset of all buses, and a subset of the transmissionlines. Regions have no common buses, but there are sharedtransmission lines, which connect two regions. We refer tothe shared transmission lines as tie lines, and to the busesconnected by these lines as border buses.
We consider models of the active power injections at everybus, and active power flows on transmission lines [1], [2].The active power injection and flow measurements taken inregion r are denoted by the vector z
r
2 RMr , where Mr
isthe number of measurements in region r. The measurementsequal to the actual power injections/flows plus independentrandom measurement noise. The noise is usually assumed tohave a Gaussian distribution of zero mean. We denote by W
r
the diagonal measurement covariance matrix.
The state-estimation problem consists of estimating voltagephase angles at the buses given the power flow and injectionmeasurement vector [2]. Typically, one (arbitrary) phase angleis selected as the reference angle, and its value is fixed toan arbitrary value, e.g., zero. We describe the phase anglesto be estimated in region r by the state vector x
r
, and werefer to a component of the vector x
r
as a state variable. Thestate variables of the vector x
r
correspond to the phase angleson buses that belong to region r, and to the phase angles onborder buses in other regions that are needed to describe themeasurements on the tie lines and to describe power injectionmeasurements at border buses in region r. Consequently, thesets of state variables defined by vectors x
r
, 8r 2 R, areoverlapping. We denote by x
r,r
0 the vector of state variablesestimated in region r that correspond to state variables sharedbetween regions r and r0. Observe that all components in thevector x
r,r
0 are also contained in the vector xr
. We say thatregion r and region r0 are neighbors if the vector x
r,r
0 is nonempty, and we denote the set of all neighbors of region rby N (r) (|N (r)| = N(r)). For convenience, we introducethe vector x
r,b
for all state variables that are shared with theneighboring regions N (r), i.e., all components in the vectorsxr,r
0 , 8r0 2 N (r) form the vector xr,b
. The vectors xr
0,r
andxb,r
can be defined in a similar way.
A. Distributed State Estimation (DSE)
In an inter-connected power system, the control center ofeach region obtains a state estimate of its part of the systemusing measurements from its region and a model of its region.A control center needs to estimate only those phase angles thatare necessary to describe its measurements, but it cooperateswith neighboring control centers, typically by exchanging thestate variables of the border buses, to ensure that the powerflows on the tie lines are correctly estimated. In most of therecently proposed DSE algorithms, e.g., [3], [4], [5], [6], statevariables are exchanged at the beginning or at the end of everyiteration, and are used as an input when calculating the nextstate vector update. For the purpose of our study, we considera state of the art algorithm proposed in [6], which is highlyrobust and can acquire highly accurate estimates of the powerflows on the tie lines. The algorithm works as follows.
The goal of the DSE is to estimate xr
in every region underthe condition that the estimates of shared state variables matchbetween neighboring regions. One (arbitrary) phase angle inthe entire interconnected system is selected as the referenceangle, and its value is fixed to zero. Each region estimatesxr
by minimizing the squares of the weighted deviations ofthe estimated active power flows and injections (which arefunctions of x
r
) from the measured values (comprehended inzr
). Therefore, the distributed state estimation problem can beformulated as,
min
xr, 8r2R
X
8r2R[z
r
� f(xr
)]
T
[W�1r
][zr
� f(xr
)]
s.t. xr,r
0= x
r
0,r
8r 2 R and 8r0 2 N (r),(1)
where fr
(x) is the vector of non-linear functions describingthe active power flows and power injections in region r as afunction of the state vector x
r
.
The constraints in (1) couple the estimation across regions.In order to have a fully distributed algorithm, auxiliary vari-ables can be introduced so that the problem can be solved usingthe alternating direction method of multipliers (ADMM) [6].The resulting iterative solution scheme is
x(k+1)r
= (H(k)Tr
W�1H(k)r
)
�1(H(k)T
r
zr
+ cDr
p(k)r
), 8rs(k+1)r
= Uxr ·
X
8r02N (r)
Yr,r
0 · xr
0,r
p(k+1)r
= p(k)r
+ s(k+1)r
� 1
2
(Yr,b
· Y T
r,b
· x(k)r
� s(k)r
),
where c > 0 is a predefined constant, the matrix H(k)r
is theJacobian of vector f
r
(x(k)), and matrices D
r
, Uxr , Y
r,r
0 aredefined as follows. D
r
is a diagonal matrix whose element di,i
equals to the number of regions sharing the ith component(state variable) of the vector x
r
. Uxr is a diagonal matrix
whose elements are defined as: ui,i
equals to the inverse of thenumber of regions (if greater than 0) sharing the ith component(state variable) of the vector x
r
, and zero otherwise. Finally,Yr,r
0 is a matrix that determines the connection between vectorxr
and vector xr,r
0 , and its elements are: yi,j
= 1 if the ithelement (state variable) in x
r
corresponds to the jth element(state variable) in x
r,r
0 , and yi,j
= 0 otherwise. Consequently,we have
xr,r
0= Y T
r,r
0 · xr
. (2)
Similar to (2), we introduce the matrix Yr,b
, which has asimilar structure as Y
r,r
0 so that we have
xr,b
= Y T
r,b
· xr
(3)
The matrix Yb,r
can be defined in a similar way.
The DSE is said to converge when for some k⇤ themaximum change of the state variables in every region issmaller than the convergence threshold ✏ > 0, i.e., 8r 2R, ||x(k⇤+1)
r
� xk
⇤
r
||1 < ✏, where || · ||1 denotes themaximum norm of a vector. We refer to the number ofiterations k⇤ required for convergence as the convergence time.

III. A DOS ATTACK ON DSE
We consider an attacker whose goal is to disable the DSE.The attacker compromises the control center of a single regionra 2 R so that it can manipulate with the data exchangedbetween ra and its neighbors N (ra) that are used as an inputto the DSE. The exchanged data are the state variables definedby the vectors x(k)
r,r
a , 8r 2 N (ra), and the vectors x(k)r
a,r
, 8r 2N (ra). We describe the attack against the state variables sentfrom regions r 2 N (ra) to region ra (from ra to r) at theend of iteration k by the attack vector a(k)
r,r
a (a(k)r
a,r
). We definethe attack vector a(k)
r,r
a as the vector of phase angles whoseelements correspond to the value that the attacker adds to thatphase angle, or
x(k)r,r
a = x(k)r,r
a + a(k)r,r
a , (4)
where x(k)r,r
a is the resulting corrupted vector of state variables.The vector x(k)
r,r
a is used as input to the next iteration of DSEin region ra, instead of the originally exchanged vector x(k)
r,r
a .The attack vector a(k)
r,r
a can be defined in a similar way.
In the rest of this Section, we describe the attack against thestate variables sent to region ra from its neighbors r 2 N (ra).The attack against the state variables sent from region ra toits neighbors can be described in a similar way, but we omitit for brevity. For convenience, we introduce the attack vectora(k)b,r
a for the state variables that the region ra receives fromall its neighboring regions
a(k)b,r
a = [a(k)Tri1 ,r
a a(k)Tri2 ,r
a ... ]T 8rij 2 N (ra), (5)
and the corresponding corrupted vector of state variables
x(k)b,r
a = x(k)b,r
a + a(k)b,r
a , (6)
Fig. 1 illustrates an attack on a power system with threeregions. Observe that x(k)
b,r
a is the input to iteration k + 1 ofDSE, and thus, the attack a(k)
b,r
a leads to a corrupted state vectorx(k+1)r
a .
We define the size of the attack as the Euclidean normof the attack vector, i.e., ||a(k)
b,r
a ||2. Intuitively, a smaller attacksize implies smaller corruption added to the exchanged values,which could make the detection and the localization of theattack harder. Thus, it would be natural for the attacker tolook for the smallest attack vector that prevents the DSE fromconverging (k⇤ = 1), or formally
min
a
(k)b,ra ,k=1,...
� s.t. k⇤ = 1 and � = ||a(k)b,r
a ||2; 8k.
(7)Since the distributed state estimation problem is non-linear,solving (7) is non-trivial.
A. First Singular Vector Attack (FSV)
The FSV attack [16] is an approximation of (7) done bymaximizing the introduced disturbances for a given attack size.Note that the attack vector a(k)
b,r
a results in corrupted vectors
s((k+1)r
a = s((k+1)r
a + Uxr · Yb,r
a · a(k)b,r
a
p((k+1)r
a = p((k+1)r
a + Uxr · Yb,r
a · a(k)b,r
a ,(8)
REGION 1
SEX1,2
(k) X2,1(k) X3,2
(k) X2,3(k)
Control center of region 2REGION 2
REGION 3
~
X1,3(k)~
SEX1(k)
X3,1(k)
a3,1(k)
X3,1(k)
~ X1,3(k)
a1,3(k)
X1,3(k)~
X2,1(k)
a2,1(k)
X2,1(k)
~ X1,2(k)
a1,2(k)
X1,2(k)~
Control center of region 1
X2(k)
SEX1,3
(k) X3,1(k) X2,3
(k) X3,2(k)
Control center of region 3
~X3
(k)
... ...
...
... ...
...
......
...
X2,1(k)
X3,2(k) X2,3
(k)
X3,1(k)
X1,2(k)~
Fig. 1. Interconnected power system with three regions. The attacker corruptsthe control center of Region 1, and tampers with the state variables x
(k)1,2 and
x
(k)1,3 sent from Region 1, and the state variables x
(k)2,1 and x
(k)3,1 received by
Region 1. The symbol (+) indicates that the components of the attack vectorare added to the corresponding components (phase angles) of the vector ofexchanged state variables. The attacker cannot tamper with the state variablesexchanged between Regions 2 and 3.
which yield a corrupted state vector
x(k+1)r
a = x(k+1)r
a +K · a(k)b,r
a , (9)
where K = (H(k)Tr
W�1H(k)r
)
�1 ·cDr
UxrYb,r
a . Note that theaddend in (9) is a vector with the same number of elements asthe vector x(k+1)
r
a , and we refer to it as the addend vector. TheEuclidean norm of the addend vector is maximized if the attackvector a(k)
b,r
a is aligned with the first right singular vector of thematrix K, that is, with the singular vector with highest singularvalue. The complexity of singular vector decomposition isO(mn2
) [17], low enough for the computation to be doneon-line. Nevertheless, the computation of the Jacobian H(k)
r
requires knowledge of the current system state x(k)r
a for theattacked region ra. Therefore, we approximate H(k)
r
with theJacobian calculated at the initial state H(0)
r
.
Observe that in (9) the size of the corrupted vector x(k+1)r
a
depends on the direction of the addend vector, and conse-quently, on the direction of the first singular vector. Sincethe attacker does not know the state vector x(k)
r
a , finding thecorrect direction is not trivial. In order to estimate the direction,the attacker can assume that the estimates of the power flowson a tie line are closer to their actual values when usingthe most recent exchanged state variables. Then, the attackerapplies the attack so that the introduced estimation errors takethe estimates in the direction towards the previous iterationestimates, i.e., farther from the measured values.
B. Impact of FSV Attack on DSE
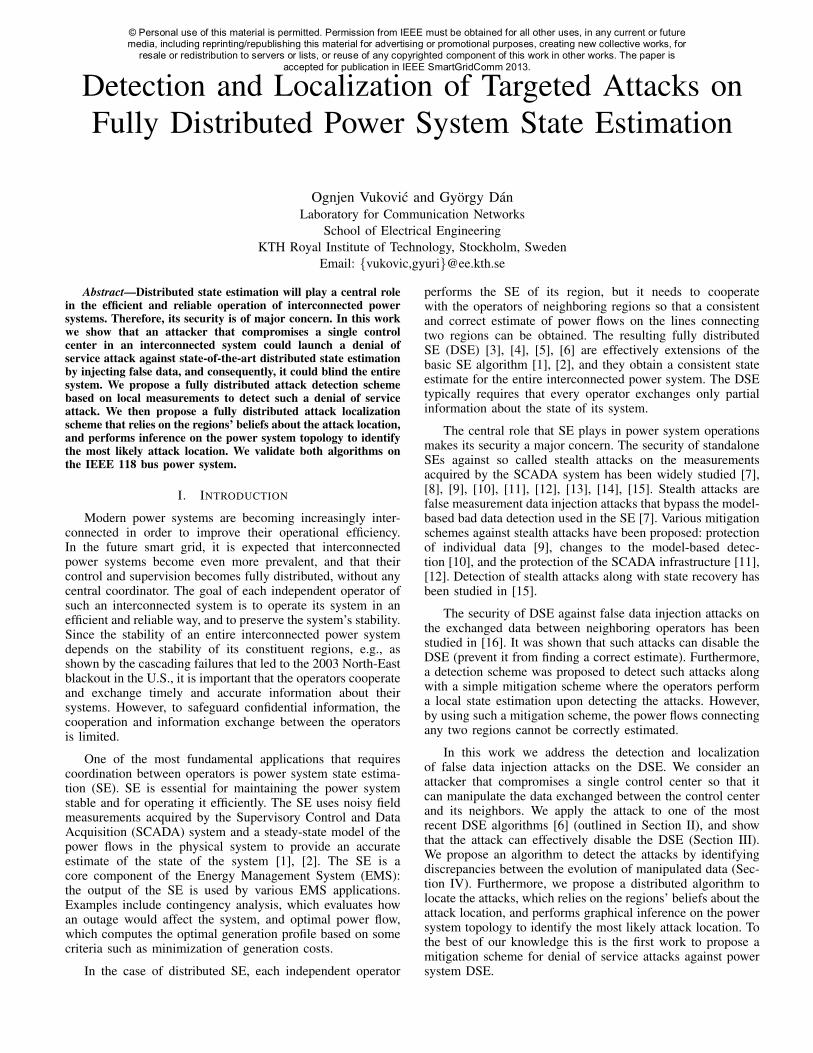
We show the impact of the FSV attack on the IEEE 118bus power system, divided into six regions as shown in Fig. 2.We consider that the attacker corrupts the control center ofone of the regions, and performs the attacks against the statevariables sent from and to that region. Bus 69, located in regionr6, is used as the reference bus, as specified in the IEEE 118bus power system. Measurements are taken at every powerinjection and power flow, and the convergence threshold is✏ = 10
�3. The phase angles, thereby the state variables andthe attack vector, are in radians.
Region 1
19 buses: 49-67
22 buses: 68, 69, 78-81, 97-101, 103-112, 116
5
18 buses: 21-29, 31, 32, 70-73, 113-115
3
21 buses: 74-77, 82-96, 102, 118
12
719 buses: 18-20, 33-48
7
34
Region 2
Region 3
Region 4
Region 5
Region 6
4
2
19 buses: 1-17, 30, 117
1
Fig. 2. IEEE 118 bus system divided into sixregions. Neighboring regions are connected by aline and the number next to the line representsthe number of shared state variables. Note thatthe reference bus (69) is not a state variable.
0 0.01 0.02 0.03 0.04 0.05 0.06 0.070
50
100
150
200
250
300
Attack size (||a(t)b,ra ||2 )
Convergencetime(k
⇤ )
ra = r1ra = r2ra = r3ra = r4ra = r5ra = r6
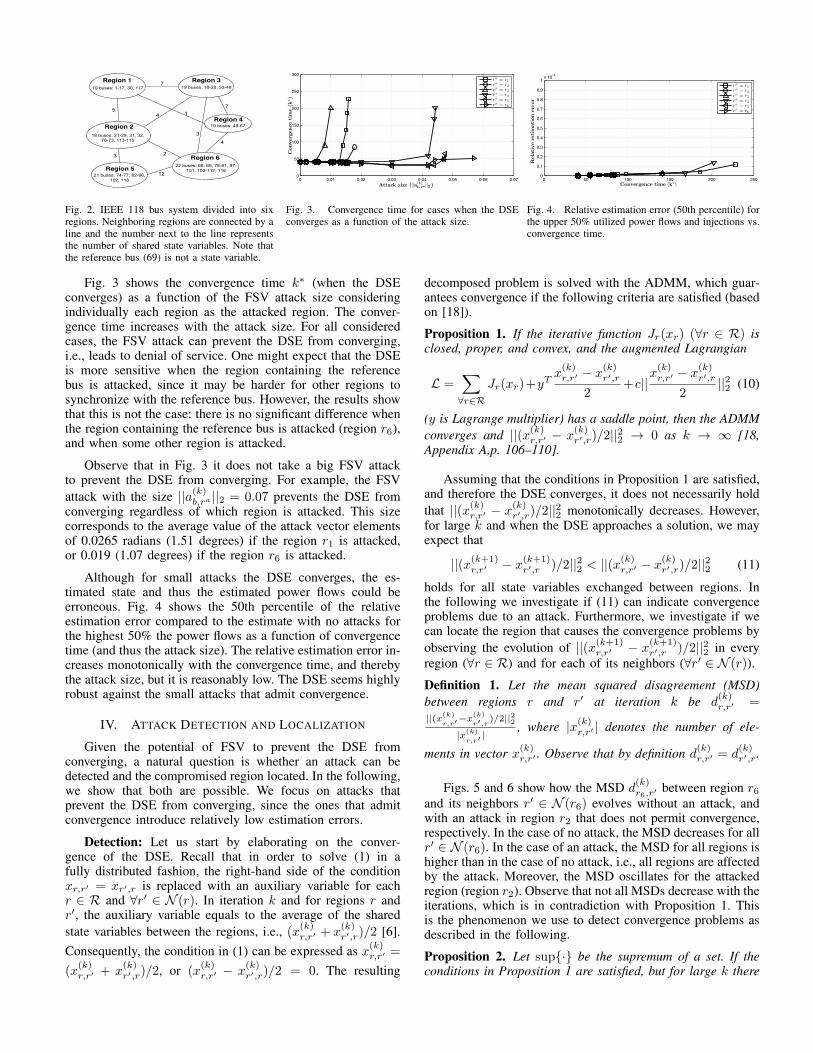
Fig. 3. Convergence time for cases when the DSEconverges as a function of the attack size.
0 50 100 150 200 2500
0.1
0.2
0.3
0.4
0.5
0.6
0.7
0.8
0.9
1x 10⁻³
Convergence time (k
⇤)
Relativeestimation
error
ra = r1ra = r2ra = r3ra = r4ra = r5ra = r6
Fig. 4. Relative estimation error (50th percentile) forthe upper 50% utilized power flows and injections vs.convergence time.
Fig. 3 shows the convergence time k⇤ (when the DSEconverges) as a function of the FSV attack size consideringindividually each region as the attacked region. The conver-gence time increases with the attack size. For all consideredcases, the FSV attack can prevent the DSE from converging,i.e., leads to denial of service. One might expect that the DSEis more sensitive when the region containing the referencebus is attacked, since it may be harder for other regions tosynchronize with the reference bus. However, the results showthat this is not the case: there is no significant difference whenthe region containing the reference bus is attacked (region r6),and when some other region is attacked.
Observe that in Fig. 3 it does not take a big FSV attackto prevent the DSE from converging. For example, the FSVattack with the size ||a(k)
b,r
a ||2 = 0.07 prevents the DSE fromconverging regardless of which region is attacked. This sizecorresponds to the average value of the attack vector elementsof 0.0265 radians (1.51 degrees) if the region r1 is attacked,or 0.019 (1.07 degrees) if the region r6 is attacked.
Although for small attacks the DSE converges, the es-timated state and thus the estimated power flows could beerroneous. Fig. 4 shows the 50th percentile of the relativeestimation error compared to the estimate with no attacks forthe highest 50% the power flows as a function of convergencetime (and thus the attack size). The relative estimation error in-creases monotonically with the convergence time, and therebythe attack size, but it is reasonably low. The DSE seems highlyrobust against the small attacks that admit convergence.
IV. ATTACK DETECTION AND LOCALIZATION
Given the potential of FSV to prevent the DSE fromconverging, a natural question is whether an attack can bedetected and the compromised region located. In the following,we show that both are possible. We focus on attacks thatprevent the DSE from converging, since the ones that admitconvergence introduce relatively low estimation errors.
Detection: Let us start by elaborating on the conver-gence of the DSE. Recall that in order to solve (1) in afully distributed fashion, the right-hand side of the conditionxr,r
0= x
r
0,r
is replaced with an auxiliary variable for eachr 2 R and 8r0 2 N (r). In iteration k and for regions r andr0, the auxiliary variable equals to the average of the sharedstate variables between the regions, i.e., (x(k)
r,r
0 + x(k)r
0,r
)/2 [6].Consequently, the condition in (1) can be expressed as x(k)
r,r
0 =
(x(k)r,r
0 + x(k)r
0,r
)/2, or (x(k)r,r
0 � x(k)r
0,r
)/2 = 0. The resulting
decomposed problem is solved with the ADMM, which guar-antees convergence if the following criteria are satisfied (basedon [18]).
Proposition 1. If the iterative function Jr
(xr
) (8r 2 R) isclosed, proper, and convex, and the augmented Lagrangian
L =
X
8r2RJr
(xr
)+yTx(k)r,r
0 � x(k)r
0,r
2
+c||x(k)r,r
0 � x(k)r
0,r
2
||22 (10)
(y is Lagrange multiplier) has a saddle point, then the ADMMconverges and ||(x(k)
r,r
0 � x(k)r
0,r
)/2||22 ! 0 as k ! 1 [18,Appendix A,p. 106–110].
Assuming that the conditions in Proposition 1 are satisfied,and therefore the DSE converges, it does not necessarily holdthat ||(x(k)
r,r
0 � x(k)r
0,r
)/2||22 monotonically decreases. However,for large k and when the DSE approaches a solution, we mayexpect that
||(x(k+1)r,r
0 � x(k+1)r
0,r
)/2||22 < ||(x(k)r,r
0 � x(k)r
0,r
)/2||22 (11)
holds for all state variables exchanged between regions. Inthe following we investigate if (11) can indicate convergenceproblems due to an attack. Furthermore, we investigate if wecan locate the region that causes the convergence problems byobserving the evolution of ||(x(k+1)
r,r
0 � x(k+1)r
0,r
)/2||22 in everyregion (8r 2 R) and for each of its neighbors (8r0 2 N (r)).
Definition 1. Let the mean squared disagreement (MSD)between regions r and r0 at iteration k be d(k)
r,r
0 =
||(x(k)
r,r0�x
(k)
r0,r)/2||22
|x(k)
r,r0 |, where |x(k)
r,r
0 | denotes the number of ele-
ments in vector x(k)r,r
0 . Observe that by definition d(k)r,r
0 = d(k)r
0,r
.
Figs. 5 and 6 show how the MSD d(k)r6,r
0 between region r6and its neighbors r0 2 N (r6) evolves without an attack, andwith an attack in region r2 that does not permit convergence,respectively. In the case of no attack, the MSD decreases for allr0 2 N (r6). In the case of an attack, the MSD for all regions ishigher than in the case of no attack, i.e., all regions are affectedby the attack. Moreover, the MSD oscillates for the attackedregion (region r2). Observe that not all MSDs decrease with theiterations, which is in contradiction with Proposition 1. Thisis the phenomenon we use to detect convergence problems asdescribed in the following.
Proposition 2. Let sup{·} be the supremum of a set. If theconditions in Proposition 1 are satisfied, but for large k there

0 5 10 15 20 25 30 35 40 45 50
10!4
10!3
10!2
Mean
SquareDisagreement(d
(k)
r,r0)
Iteration (k)
r0 = r2r0 = r3r0 = r4r0 = r5
Fig. 5. Evolution of the MSD (d(k)r,r0 ) observed inregion r6. No attack
0 5 10 15 20 25 30 35 40 45 50
10!4
10!3
10!2
Mean
SquareDisagreement(d
(k)
r,r0)
Iteration (k)
r0 = r2r0 = r3r0 = r4r0 = r5
Fig. 6. Evolution of the MSD (d(k)r,r0 ) observed inregion r6 in presence of attacks in region r
a = r2(r6 2 N (ra)) with attack size 0.1.
20 40 60 80 100 120 1400
0.05
0.1
0.15
0.2
0.25
0.3
0.35
Entriesofstationary
distribution
vector(⇡ r)
Iteration (k)
r = r1
r = r2
r = r3
r = r4
r = r5
r = r6
Fig. 7. Evolution of the elements of the stationaryprobability vector ⇡
(k) in presence of attacks inregion r
a = r2 with attack size 0.1. ↵ = 0.2.
are some r and r0 2 N (r) such that sup{d(k0)
r,r
0 : k0 > k} > 0,||x(k+1)
r
� x(k)r
||1 > ✏, and 6 9t 2 N so that
sup{d(k0)
r,r
0 : k0 > k} > sup{d(k0)
r,r
0 : k0 > k + t} (12)
then there is a convergence problem (an attack).
Proof: The proof follows from Proposition 1, where if theconditions hold, then ||(x(k)
r,r
0 � x(k)r
0,r
)/2||22 ! 0 and d(k)r,r
0 ! 0
as k ! 1, and, consequently, sup{d(k0)
r,r
0 : k0 > k} ! 0.
The regions can thus use Proposition 2 to detect an attack.
Localization: We now turn to the problem of localizing theattacked region. The localization scheme we propose consistsof two steps. First, each region forms its own belief of theattack location (BAL) as a function of its MSDs. Second,regions exchange their BALs and use them as an input to alocalization scheme at every region so that the attack can becorrectly located. The way BALs are formed and the localiza-tion scheme based on the exchanged BALs are explained asfollows.
Step 1: We denote the BAL of region r that its neighborr0 2 N (r) is the attacked region at iteration k by B(k)
r,r
0 .Since MSDs can oscillate and the difference between the MSDrelated to the attacked region (d(k)
r,r
a ) and others (d(k)r,r
0 r0 6= ra)typically increases with k (Fig. 6), we calculate the BAL B(k)
r,r
0
8r0 2 N (r) as
B(k)r,r
0 =
˜d(k)r,r
0
P8r02N (r)
˜d(k)r,r
0
=
↵d(k)r,r
0 + (1� ↵) ˜d(k�1)r,r
0
P8r02N (r)
(↵d(k)r,r
0 + (1� ↵) ˜d(k�1)r,r
0 )
,
(13)where ˜d(k)
r,r
0 is the exponentially weighted moving average(EWMA) of the MSD d(k)
r,r
0 with the degree of weightingdecrease ↵ 2 (0, 1). For 8r0 /2 N (r), B(k)
r,r
0 equals to 0.Observe that it is possible to have B(k)
r,r
0 6= B(k)r
0,r
.
Step 2: Given the BALs of the regions, we want to find theprobability that a particular region is attacked consistent withall BALs. This can be done by constructing the right stochasticR ⇥ R matrix B(k). Each row of B(k) corresponds to a rand contains B(k)
r,r
0 8r0 2 R. This matrix can be constructedif regions exchange their BAL vectors. The distribution thatis consistent with all BALs is the stationary distribution ⇡(k)
of the Markov chain for which the matrix B(k) is the statetransition matrix, thus ⇡(k)B(k)
= ⇡(k) [19]. The following
proposition establishes the existence and the uniqueness of thestationary distribution ⇡(k).
Proposition 3. Consider a system with R > 2. If (i) thereexists a 3-clique in the graph G = (R, E) where E =
{er,r
0 |r 2 R, r0 2 N (r)}, (ii) for finite k the DSE does notconverge, and (iii) all regions obtain the correct matrix B(k),then the stationary probability vector ⇡(k) exists, it is uniqueand it can be computed in every region.
Proof: Observe that because ↵ < 1, it holds that 8r, r0s.t. r 2 N (r0), B(k)
r,r
0 > 0 since from (13) it is clear thatB(k)
r,r
0 will always take into account with non-zero weights theinitial disagreements on the shared state variables and the mis-synchronization to the reference bus. Consequently, the statetransition diagram of the Markov chain described by B(k) isa symmetric directed graph. Furthermore, it is clear that allstates of such a Markov chain lie in a single communicatingclass, and consequently, such a chain is irreducible. Since theMarkov chain is irreducible, it has a stationary distribution [19,Proposition 1.14] and it is unique [19, Corollary 1.17]. SinceB(k)
r,r
= 0 8r 2 R, R > 2 and (i) ensure that the Markov chainis aperiodic. Finally, the aperiodicity was a sufficient conditionthat the (irreducible) Markov chain converges to its stationarydistribution [19, Theorem 4.9]. Since all regions obtain thesame matrix B(k), and the vector ⇡(k) is unique, all regionsobtain the same vector ⇡(k).
We use the vector ⇡(k) to locate the attacked region, asdescribed in the following.
Conjecture 4. Let us denote by ⇡(k)r
the entry of vector ⇡(k)
that corresponds to region r. Let region r⇤(k) = argmax
r
⇡(k)r
.Then the attacked region is ra = r⇤(k) for large k, i.e., thestationary distribution converges.
Observe that the localization is fully distributed: if theBALs are exchanged between all regions at iteration k, theneach region can locally construct the matrix B
(k), find thevector ⇡(k) and its maximal component.
Remark: One may argue that the attacker may corrupt theBALs sent from and to region ra. Recall that d(k)
r,r
0 = d(k)r
0,r
, andconsequently ˜d(k)
r,r
0 =
˜d(k)r
0,r
. Therefore, the nominator in (13)can be verified between neighbors. However, the denominatorin (13) is only known to region r. Therefore, in order to preventattacks against exchanged BALs, the regions could exchange˜d(k)r,r
0 so that every region can compare if ˜d(k)r,r
0 =˜d(k)r
0,r
holdsfor 8r 2 R and r0 2 N (r). If there are multiple inequalities,then there will be a common region in all those inequalities

0 0.2 0.4 0.6 0.8 10
20
40
60
80
100
120
140
Degree of weighting decrease
Localization
time
ra = 1
ra = 2
ra = 3
ra = 4
ra = 5
ra = 6
0 0.2 0.4 0.6 0.8 10
2
4
6
8
10
12
14
Degree of weighting decrease
Localization
time
ra = 1
ra = 2
ra = 3
ra = 4
ra = 5
ra = 6
Fig. 8. The localization time (kd) as a function of the degree of weightingdecrease (↵) considering the attacks in every region 8r 2 R individually withattack size 0.1 (left) and 0.5 (right)
from which the corrupted BALs originate, and that region isthe attack location. If there is one inequality, then the attackedregion is one of the two regions. In that case regions couldconstruct two matrices B(k) (each considering one side ofthe inequality) and if the localization scheme based on B(k)
cannot identify which of the two regions is attacked, then themitigation scheme could consider both regions as attacked.Otherwise, the attack is located.
Once the attack region is localized, the DSE algorithm canbe continued by non-attacked regions by discarding all datafrom the attacked region ra.
Numerical results: Fig. 7 shows how the elements of thestationary probability vector ⇡(k) evolve in the presence ofattacks in region ra = r2 with attack size 0.1. The degree ofweighting decrease (↵) equals to 0.2. The elements of vector⇡(k) approach stable values as k increases, and the largestelement corresponds to the attacked region ra. We refer to theminimum iteration number kd such that for all k � kd thelargest element of ⇡(k) does not change, and we call this forregion ra as the localization time. In the case showed in Fig. 7,the localization time is kd = 82.
Fig. 8 shows how the localization time (kd) changes with↵ considering the attacks in every region r 2 R individuallywith attack size 0.1 (left) and 0.5 (right). The localization timesignificantly depends on the region that is attacked as well ason the attack size: for larger the attack size the localizationis faster, which supports the formulation in (7). For most ofthe regions, the optimal ↵ is in the range ↵ 2 (0.2, 0.3). Insome cases for small attack sizes (⇡ 0.1) very high ↵ > 0.7prevents localization. This implies that one should use a lowweighting factor to ensure successful localization.
V. CONCLUSION
We addressed the detection and localization of false datainjection attacks against distributed state estimation. We con-sidered an attacker that compromises a single control center,and tampers with the data that are exchanged between a controlcenter and its neighbors. We showed that a denial of serviceattack can be launched against a state of the art state estimatorthis way. We proposed an attack detection scheme based on theevolution of the exchanged data and based on the convergenceproperties of the distributed algorithm. We proposed an attacklocalization scheme based on the steady state distribution of aMarkov chain where the states are the control centers and thetransition probabilities are beliefs about the attack location. We
showed the efficiency of the attack detection and localizationschemes via simulations on an IEEE benchmark power system.Our results show that the attacks are faster localized when mostof the evolution of the exchanged data is considered, ratherthan just most recent values. Moreover, our results show thatstronger attacks are faster localized.
ACKNOWLEDGMENT
This work is partially funded by the EIT ICTLabs throughactivity ASES 13030.
REFERENCES
[1] A. Monticelli, “Electric power system state estimation,” Proc. of theIEEE, vol. 88, no. 2, pp. 262–282, 2000.
[2] A. Abur and A. G. Exposito, Power System State Estimation: Theoryand Implementation. Marcel Dekker, Inc., 2004.
[3] M. Shahidehpour and Y. Wang, Communication and Control in ElectricPower Systems. John Wiley and Sons, 2003.
[4] A. J. Conejo, S. d. Torre, and M. Canas, “An optimization approachto multiarea state estimation,” IEEE Transactions on Power Systems,vol. 22, no. 1, pp. 213–221, February 2007.
[5] L. Xie, D.-H. Choi, S. Kar, and H. V. Poor, “Fully distributed stateestimation for wide-area monitoring systems,” IEEE Transactions onSmart Grid, vol. 3, no. 3, pp. 1154–1169, September 2012.
[6] V. Kekatos and G. B. Giannakis, “Distributed robust power system stateestimation,” IEEE Transactions on Power Systems, vol. 28, no. 2, pp.1617–1626, 2013.
[7] Y. Liu, P. Ning, and M. Reiter, “False data injection attacks against stateestimation in electric power grids,” in Proc. of the 16th ACM conferenceon Computer and Communications Security (CCS), 2009, pp. 21–32.
[8] A. Teixeira, G. Dan, H. Sandberg, and K. H. Johansson, “A cybersecurity study of a SCADA energy management system: Stealthydeception attacks on the state estimator,” in Proc. IFAC World Congress,Aug. 2011.
[9] R. B. Bobba, K. M. Rogers, Q. Wang, H. Khurana, K. Nahrstedt,and T. J. Overbye, “Detecting false data injection attacks on dc stateestimation,” in Preprints of the First Workshop on Secure ControlSystems, CPSWEEK, Stockholm, Sweden, April 2010.
[10] O. Kosut, L. Jia, R. Thomas, and L. Tong, “Malicious data attacks onsmart grid state estimation: Attack strategies and countermeasures,” inProc. of IEEE SmartGridComm, Oct. 2010.
[11] G. Dan and H. Sandberg, “Stealth attacks and protection schemes forstate estimators in power systems,” in Proc. of IEEE SmartGridComm,Oct. 2010.
[12] O. Vukovic, K. C. Sou, G. Dan, and H. Sandberg, “Network-awaremitigation of data integrity attacks on power system state estimation,”IEEE JSAC: Smart Grid Communications Series, vol. 30, no. 6, pp.176–183, July 2012.
[13] T. T. Kim and H. V. Poor, “Strategic protection against data injectionattacks on power grids,” IEEE Trans. on Smart Grid, vol. 2, pp. 326–333, Jun. 2011.
[14] A. Giani, E. Bitar, M. Garcia, M. McQueen, P. Khargonekar, andK. Poolla, “Smart grid data integrity attacks: Characterizations andcountermeasures,” in Proc. of IEEE SmartGridComm, Oct. 2011.
[15] A. Tajer, S. Kar, H. V. Poor, and S. Cui, “Distributed joint cyberattack detection and state recovery in smart grids,” in Proc. of IEEESmartGridComm, October 2011, pp. 202–207.
[16] O. Vukovic and G. Dan, “On the security of distributed power systemstate estimation under targeted attacks,” in Proc. of ACM Symposiumon Applied Computing (SAC), March 2013.
[17] R. Horn and C. R. Johnson, Matrix Analysis. Cambridge UniversityPress, 1990.
[18] S. Boyd, N. Parikh, E. Chu, B. Peleato, and J. Eckstein, “Distributedoptimization and statistical learning via the alternating direction methodof multipliers,” Foundations and Trends in Machine Learning, vol. 3,no. 1, pp. 1–122, 2010.
[19] D. A. Levin, Y. Peres, and E. L. Wilmer, Markov Chains and MixingTimes. American Mathematical Society, 2009.