DFC: Density Fragment Clustering without Peakslik/publications/Jianhua-Jiang-JIFS-2018.pdf ·...
12
AUTHOR COPY Journal of Intelligent & Fuzzy Systems 34 (2018) 525–536 DOI:10.3233/JIFS-17678 IOS Press 525 DFC: Density Fragment Clustering without Peaks Jianhua Jiang a , Xing Tao b and Keqin Li c,∗ a School of Management Science and Information Engineering, Jilin University of Finance and Economics, Changchun, China b School of Management, Jilin University, Changchun, China c Department of Computer Science, State University of New York, New Paltz, NY, USA Abstract. The density peaks clustering (DPC) algorithm is a novel density-based clustering approach. Outliers can be spotted and excluded automatically, and clusters can be found regardless of the shape and of dimensionality of the space in which they are embedded. However, it still has problems when processing a complex data set with irregular shapes and varying densities to get a good clustering result with anomaly detection. A density fragment clustering (DFC) algorithm without peaks algorithm is proposed with inspiration from DPC, DBSCAN and SCAN to cope with a larger number of data sets. Experimental results show that our algorithm is more feasible and effective when compared to DPC, AP and DBSCAN algorithms. Keywords: Density peak, fragment clustering, anomaly detection 1. Introduction Clustering is known as unsupervised classification in pattern recognition, or nonparametric density esti- mation in statistics [1–3]. The goal of clustering is to separate a finite unlabeled objects into different clusters with characteristics of internal homogene- ity and external separation. Clustering has been applied in a wide variety of fields, ranging from engineering (machine learning, artificial intelligence, pattern recognition, mechanical engineering, electri- cal engineering), computer sciences (web mining, spatial database analysis, textual document collec- tion, image segmentation), life and medical science (genetics, biology, microbiology, psychiatry, clinic, pathology), to earth sciences (geography, geology, ∗ Corresponding author. Keqin Li, Department of Computer Science, State University of New York, New Paltz, NY 12561, USA. E-mail: [email protected]. remote sensing), social sciences (sociology, psychol- ogy, education), and economics (marketing, business) [4, 5]. Traditional methods in clustering can be broadly categorized into hierarchical, partitioning, density- based, model-based, grid-based, and soft-computing methods [6]. Many density-based clustering methods [7–9] have been proposed and inspired by DBSCAN [7] because its capability of discovering clusters with arbitrary shapes with an overall average runtime com- plexity of O(n × lgn). In addition, DBSCAN can detect the number of clusters automatically. How- ever, choosing an appropriate density threshold can be nontrivial. It is very sensitive to the user-defined threshold values, often producing very different clus- tering results in a data set even for slightly different threshold settings [10]. Density peaks clustering (DPC) algorithm is based on the idea that cluster centers are characterized by a higher density than their neighbors and by a relatively 1064-1246/18/$35.00 © 2018 – IOS Press and the authors. All rights reserved
Transcript of DFC: Density Fragment Clustering without Peakslik/publications/Jianhua-Jiang-JIFS-2018.pdf ·...

AU
THO
R C
OP
Y
Journal of Intelligent & Fuzzy Systems 34 (2018) 525–536DOI:10.3233/JIFS-17678IOS Press
525
DFC: Density Fragment Clusteringwithout Peaks
Jianhua Jianga, Xing Taob and Keqin Lic,∗aSchool of Management Science and Information Engineering, Jilin University of Finance and Economics,Changchun, ChinabSchool of Management, Jilin University, Changchun, ChinacDepartment of Computer Science, State University of New York, New Paltz, NY, USA
Abstract. The density peaks clustering (DPC) algorithm is a novel density-based clustering approach. Outliers can be spottedand excluded automatically, and clusters can be found regardless of the shape and of dimensionality of the space in whichthey are embedded. However, it still has problems when processing a complex data set with irregular shapes and varyingdensities to get a good clustering result with anomaly detection. A density fragment clustering (DFC) algorithm withoutpeaks algorithm is proposed with inspiration from DPC, DBSCAN and SCAN to cope with a larger number of data sets.Experimental results show that our algorithm is more feasible and effective when compared to DPC, AP and DBSCANalgorithms.
Keywords: Density peak, fragment clustering, anomaly detection
1. Introduction
Clustering is known as unsupervised classificationin pattern recognition, or nonparametric density esti-mation in statistics [1–3]. The goal of clustering isto separate a finite unlabeled objects into differentclusters with characteristics of internal homogene-ity and external separation. Clustering has beenapplied in a wide variety of fields, ranging fromengineering (machine learning, artificial intelligence,pattern recognition, mechanical engineering, electri-cal engineering), computer sciences (web mining,spatial database analysis, textual document collec-tion, image segmentation), life and medical science(genetics, biology, microbiology, psychiatry, clinic,pathology), to earth sciences (geography, geology,
∗Corresponding author. Keqin Li, Department of ComputerScience, State University of New York, New Paltz, NY 12561,USA. E-mail: [email protected].
remote sensing), social sciences (sociology, psychol-ogy, education), and economics (marketing, business)[4, 5].
Traditional methods in clustering can be broadlycategorized into hierarchical, partitioning, density-based, model-based, grid-based, and soft-computingmethods [6]. Many density-based clustering methods[7–9] have been proposed and inspired by DBSCAN[7] because its capability of discovering clusters witharbitrary shapes with an overall average runtime com-plexity of O(n × lgn). In addition, DBSCAN candetect the number of clusters automatically. How-ever, choosing an appropriate density threshold canbe nontrivial. It is very sensitive to the user-definedthreshold values, often producing very different clus-tering results in a data set even for slightly differentthreshold settings [10].
Density peaks clustering (DPC) algorithm is basedon the idea that cluster centers are characterized by ahigher density than their neighbors and by a relatively
1064-1246/18/$35.00 © 2018 – IOS Press and the authors. All rights reserved

AU
THO
R C
OP
Y
526 J. Jiang et al. / DFC: Density Fragment Clustering without Peaks
large distance from points with higher densities [11].Concretely speaking, DPC adopts the idea of localdensity maxima from mean-shift [12] and the basicidea of only one parameter of the distance betweendata points from K-Medoids [13]. The DPC algorithmis effective with two assumptions that cluster centersare surrounded by neighbors with lower local den-sity and that they are a relatively large distance fromany points with a higher local density [11]. Severalresearches [14–23] have been going on around thismethod.
As illustrated in Table 1, DPC still has somelimitations: (1) The number of clusters cannot bedetermined automatically. It is determined by its deci-sion graph in two dimensional space with a cutoffdistance dc and its density ρ. Du M. et al. [14]have figured out that DPC cannot detect the numberof clusters when clusters are in the lower-left cor-ner. Unfortunately, it cannot be changed with humaninterference. (2) Like DBSCAN [7], relative thinclusters would not be detected by its decision graph.Especially, when a path-based data set consists of acircular cluster with an opening near the bottom andtwo Gaussian distributed clusters inside, the numberof clusters cannot be found via DPC [16] correctly.(3) It is not reasonable that there must be a densitypeak and only one centroid in each cluster. Otherwise,DPC will split natural groups [16].
The proposed DFC algorithm has solved theseabove problems via applying both density fragmentand network structural similarity that inspired byDPC [11], SCAN [24] and DBSCAN [7] algorithms.When compared with clustering algorithms such asDBSCAN [7], AP [2] and DPC [11] illustrated inTable 1, the proposed novel DFC algorithm has thecapability of determining the number of clusters auto-matically, clustering more reasonable clusters, anddetecting anomalies.
We test the novel DFC algorithm in the mostpopular clustering benchmarks to demonstrate its fea-sibility. Our algorithm has overcome these aboveproblems with satisfactory results when comparedwith DPC, SCAN and DBSCAN algorithms on some
UCI and synthetic data sets. The rest of this paperis organized as follows. In Section 2, we describeprinciples of DPC, DBSCAN and SCAN algorithms.In Section 3, we propose the novel density fragmentclustering without peaks algorithm. In Section 4, wepresent experimental results on synthetic data setsand some UCI data sets. In Section 5, some discus-sions are made to explain the major reasons. Finally,we make conclusions.
2. Related work
The proposed DFC algorithm is inspired byDPC, DBSCAN and SCAN. Brief reviews of thesethree algorithms should be given in the followingsubsections.
2.1. DPC: A density peaks clustering approach
Density peaks clustering (DPC) algorithm is basedon the idea that cluster centers are characterized bya higher density than their neighbors and by rela-tively large distance from points with higher density[11]. Cutoff distance dc is the only parameter in thismethod. For each data point xi, it computes two quan-tities: its local density ρi and its distance δi frompoints of higher density.
dij = distance(xi, xj) (1)
Where the distance can be measured by distance func-tions, e.g. Euclidean distance.
ρi =∑
j
χ × (dij − dc) (2)
Where χ(x) = 1 if x < 0 and χ(x) = 0 otherwise, anddc is the only user defined parameter to describe itscutoff distance. As a rule of thumb, one can choose dc
so that the average number of neighbors is around 1 to2% of the total number of points in a data set [11]. ρi,similar to MinPoints in DBSCAN [7], is defined as thenumber of neighbour points to point xi in Equation 2.
Table 1Advantages of DFC when compared with DBSCAN, AP and DPC, where ‘×’ refers to disable, ‘
√’
means able and ‘∂’ is partial
Algorithms Varying sizes Irregular shapes Varying densities � of clusters Anomaly detection
DBSCAN ∂ ∂ ∂ ∂ ∂
AP√ × ∂ ∂ ×
DPC√
∂√
∂ ∂
DFC√
∂√ √ √

AU
THO
R C
OP
Y
J. Jiang et al. / DFC: Density Fragment Clustering without Peaks 527
Another local density of a point xi is presented inEquation 3, as follows:
ρi =∑
j
exp
(−d 2
ij
d 2c
)(3)
δi = minj:ρj>ρi
dij (4)
Note that δi is measured by computing the mini-mum distance between point xi and any other pointswith relative higher density.
The DPC algorithm can be summarized fromRodriguez et al. [11] and Du et al. [14] in Algorithm 1.
Algorithm 1 The DPC algorithmInput: Initial nodes X∈RN×M , dc
Output: The label vector of cluster index: y∈RN×M
Step 1: Calculate dc
1.1 Calculate dij from RN×M based on Equation 1;1.2 Sort dij in an ascending order;1.3 Determine dc by finding value of 1 to 2% posi-tion in the above order.Step 2: Detect cluster centroids by density peaks2.1 Calculate ρi based on Equation 2 or 3;2.2 Calculate δi based on Equation 4;2.3 Sort nodes based on ρ in a descending order;2.4 Detect centroids with relative high ρ and δ.Step 3: Assign each node to different clusters3.1 Detect halo nodes based on its density;3.2 Determine its affiliation of relative high densitynodes by δi to each cluster.
As illustrated in Algorithm 1, there is an inspira-tion that each node to be a centroid has two majorcharacteristics: one is relative high density, and theother is relative long distance from its higher densitynodes.
2.2. DBSCAN: A density-based clusteringapproach with noise
DBSCAN is a time proved and efficient clusteringalgorithm with the following features. (1) It is signif-icantly effective in discovering clusters of arbitraryshapes. (2) It is easy for anomaly detection. (3) It isefficient in clustering process [7].
The DBSCAN can determine a cluster if twoparameters Eps and MinPts are satisfied. Therefore,it is easy to figure outliers out. The capabil-ity of finding arbitrary shaped cluster is achieved
by its characteristics of directly-density-reachable,density-reachable and density-connected. It is theinspiration that each cluster is consisted of reachablecore nodes and their boundary nodes classified bydensity parameters of Eps and MinPts. Furthermore,the density within the areas of noise is lower than thedensity in any of the clusters.
2.3. SCAN: A structural network clusteringapproach
The SCAN algorithm is a famous structural net-work clustering approach to discover underlyingstructures in networks. It can detect clusters, hubs andoutliers in networks with the following features [24]:
– It detects clusters, hubs and outliers by using thestructure and the connectivity of the vertices asclustering criteria.
– It is fast with its running time of O(m) on anetwork with n vertices and m edges.
Similar to DBSCAN algorithm, SCAN algorithminherits the ideas of node density, such as definitionsof directly density-reachable, density-reachable, anddensity-connected. Different from DBSCAN, eachedge between two vertices is measured bynetwork structural similarity in Equation 5.
σ(v, w) = |�(v) ∩ �(w)|√|�(v)||�(w)| (5)
In SCAN algorithm, network structural similarityin Equation 5 is adopted to determine core andmember vertex in a cluster. It is the inspiration thatnetwork structural similarity is an efficient measure-ment to determine the role of each vertex in a network.In other words, network-based modelling maybe agood way to aggregate clusters.
3. Methods
The proposed DFC algorithm inherits the strengthsof DPC, DBSCAN and SCAN. Density fragment canbe defined as the set of density decreasing nodeswith relative nearby distance. DFC assumes that (1) acluster is consisted of many density fragments; (2)two density fragments can be merged together iftheir network structural similarity is relative high. Asillustrated in Algorithm 2, DFC includes three majorsteps: density decreasing, density fragment genera-tion and density fragment aggregation.

AU
THO
R C
OP
Y
528 J. Jiang et al. / DFC: Density Fragment Clustering without Peaks
Algorithm 2 The DFC algorithm.Input: Initial nodes X∈RN×M , dc, ρ
Output: All clusters and outliers are foundStep 1: Similarity matrix(d) calculation
1.1 Calculate dij from RN×M based on Equation 1;1.2 Sort dij in an ascending order.
Step 2: Density(ρ) calculation
2.1 Determine dc value with principles of DPC;2.2 Calculate ρi value based on Equations 2 or 3;2.3 Put all ρ in a descending order.Step 3: Delta(δ) calculationfor each node i do
δi = dij based on Equation 1end forStep 4: Density fragment generation4.1 Core node link generation;for each node i in a descending order do
if δi < dc thenNode i becomes a core node i;Get slot nodes for the core node i that theirdistances within dc;Connect core node i to its neighbour core nodei + 1;Get a core node link based on the above rule;Get the core node link and their slot nodestogether and then generate a density fragment.
end ifend forStep 5: Density fragment aggregationfor each density fragment do
Calculate density fragment similarity based onEquation 7for each DFSim(x, y) do
if DFSim(x, y) > 0.5 thenAggregate the fragment x and fragment y
as one cluster.end if
end forend forStep 6: Anomaly detectionfor each core node link do
if DFSim(x, y) > 0.5 thenNode i is an outlier.
elseif Core node link has no slot nodes then
It is an outlier.end if
end ifend for
Fig. 1. An example of core node chains.
3.1. Density decreasing
As similar with DPC, a suitable cutoff distance dc
is selected based on principles of density to calculatetheir local density ρ for sorting these density val-ues in a descending order. δi is an Euclidean distancebetween the nodei and its next nodei+1 in the densitydecreasing order depicted in Equation 6.
δi = Distance(nodei, nodei+1) (6)
3.2. Density fragment generation
Density fragment generation is processed in twostages: in stage I, nodei can become a core nodeif its δi ≤ dc, then check its next nodei+1 withdensity-reachability to form a core node chain illus-trated in Fig. 1; in stage II, a core node i can expandits density-connectivity to its nearby nodes in therange of dc. These nearby nodes can be defined asslot nodes. A core node chain and its slot nodes con-stitute a density fragment. All density fragments canbe formed after processing this two stages.
As illustrated in Fig. 1, 40 nodes with two dimen-sions are generated randomly, core node chains aredepicted with solid line, and density fragments areformed by these core node chains and their slot nodes.
3.3. Density fragment aggregation
As described in the sub Section 3.2,density fragment is a network structure. Densityfragment aggregation can be processed by principles

AU
THO
R C
OP
Y
J. Jiang et al. / DFC: Density Fragment Clustering without Peaks 529
Table 27 different types of data sets
Data sets Nodes Dimensions Clusters
Iris 150 4 3Seeds 210 7 3Wine 178 13 3Glass 214 9 6Flame 240 2 2Aggregation 788 2 7Spiral 312 2 3D 87 2 3
of network structural similarity and a priori proba-bility. The network structural similarity of densityfragments can be defined in Equation 7. Fragx
and Fragy refer to density fragment of x and y
respectively. The larger of DFSim(x, y) value, thehigher probability of aggregation between Fragx
and Fragy. The aggregation of density fragments isprocessed with a priori probability that the densityfragment with higher density has a higher priority tomerge other density fragments.
DFSim(x, y) = |Fragx ∩ Fragy|√|Fragx||Fragy|(7)
The proposed density fragment clusteringapproach is depicted in Algorithm 2.
4. Results
To test its feasibility and effectiveness of the pro-posed DFC algorithm, we compare it with DBSCAN,AP and DPC in the above four UCI data sets andthe next three synthetic data sets listed in Table 2.F-Measure can be defined in Equation 10, which isan index to evaluate the performance of clusteringresults. 7 different data sets (Iris, Seeds, Wine, Glass,Flame, Aggregation and Spiral) are selected to eval-uate the clustering performance of DBSCAN, AP,DPC and DFC in Table 3 and Fig. 2. The resultsin Table 3 and Fig. 2 are mean values based on30 times run.
F-Measure index measures accuracy. It considersboth the precision P and the recall R of clusteringalgorithms: P is the ratio of the number of correctresults to the number of all returned results, and R
is the ratio of the number of correct results to thenumber of results that should have been returned.P , R and F-Measure(F ) are defined as the followingEquations 8, 9 and 10.
Table 3F-Measure evaluation
Data sets DBSCAN AP DPC DFC
Iris 0.7045 0.4851 0.7715 0.7554Seeds 0.4784 0.3877 0.8026 0.793Wine 0.5794 0.3142 0.5892 0.5894Glass 0.3315 0.2874 0.5418 0.5571Flame 0.6242 0.2874 1 0.9713Aggregation 0.8140 0.3429 1 0.9909Spiral 1 0.2853 1 1D 0.8143 0.6117 0.8780 1
P = (Mj, Ci) = |Mj ∩ Ci||Ci| (8)
R = (Mj, Ci) = |Mj ∩ Ci||Mj| (9)
F (Mj, Ci) = 2 · P(Mj, Ci) · R(Mj, Ci)
P(Mj, Ci) + R(Mj, Ci)(10)
Besides the clustering performance depicted inFig. 2, many experiments have been done to evaluatethe DFC capability with limitations such as varyingsizes, irregular shapes, varying densities, number ofclusters and anomaly detection.
4.1. Varying sizes
Clusters with varying sizes are normal in a realdata set, and they should be detected correctly withoutinterference. Aggregation, Flame and D are selectedto evaluate the capability of processing varying sizesof clusters in a data set.
As illustrated in Fig. 3, to test the accuracy of theDBSCAN algorithm without any other factors, thenumber of cluster is controlled to the true cluster num-ber (Eps = 0.9, MinPts = 5). AP’s preference is setto the medium value of the similarity matrix accord-ing to the original AP algorithm. DPC’s dc value isset to 2.7212 and DFC’s DFSim is set to 0.3024when they can get their best result. This figure showsthat both DFC and DPC can find clusters correctlywhile AP cannot cluster in an intuitive way. Andsome points are close to their actual clusters whileDBSCAN cannot recognize them. And the param-eters in these four algorithms are set for the samepurpose in the following data sets. Figures 5 and 8show the same result that DFC has the ability to detectdata sets with varying size while most algorithms cannot.

AU
THO
R C
OP
Y
530 J. Jiang et al. / DFC: Density Fragment Clustering without Peaks
Fig. 2. F-Measure with 7 different data sets.
Fig. 3. Clustering the data set of Aggregation with varying sizes and irregular shapes.

AU
THO
R C
OP
Y
J. Jiang et al. / DFC: Density Fragment Clustering without Peaks 531
Fig. 4. Clustering the data set of Spiral with irregular shapes.
4.2. Irregular shapes
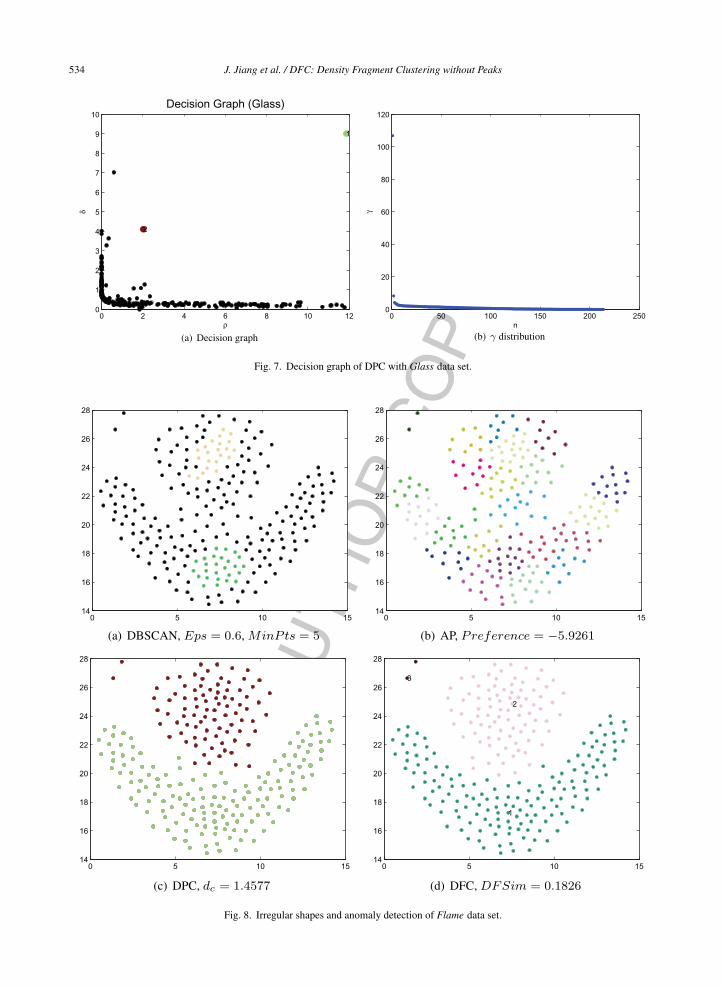
In general, density-based clustering algorithmhas advantage of processing data sets with irregu-lar shapes. Aggregation, Spiral and Flame can beadopted to evaluate its capability of processing irreg-ular shapes. When compared with the DPC algorithm,the proposed DFC algorithm has the equal capabilityof clustering irregular shaped clusters shown in Figs.3, 4 and 8. Compared with AP in these three data sets,DFC has the superior performance. DBSCAN gets agood result on Spiral clustering the same as the DPCand DFC in Fig. 4. However, DBSCAN cannot dealwith the data sets such as Aggregation and Flamedue to its incorrect anomaly detection. The DFC candetect the linear data like Spiral and also has the abil-ity to handle irregular spherical data like Aggregationand Flame.
4.3. Varying densities
Data set D in Fig. 5 is used to test the advantageof the DFC in varying densities clustering. AP cannotsolve this kind of data set when it gets the right clusternumber. DBSCAN only detect the two cluster centerswhile the data set has the three centers actually, and allthe points in the third cluster are recognized as anoma-lies which shown black color in Fig. 5. The DPC andDFC have a good performance in the data set D.
4.4. Number of clusters
The DPC has the advantage of finding cluster num-ber by its decision graph [11]. However the DPCdoesn’t work well in data sets Iris or Glass whichshown in Figs. 6 and 7, because it is difficult toselect the suitable cluster centroids. The proposed

AU
THO
R C
OP
Y
532 J. Jiang et al. / DFC: Density Fragment Clustering without Peaks
Fig. 5. Clustering with varying densities on D data set.
DFC can achieve reasonable clusters without humanintervention.
4.5. Anomaly detection
Anomaly detection is a basic function for anyclustering algorithm. DBSCAN adopts MinPts anddensity-reachability to detect outliers, but this algo-rithm meets unsatisfied anomaly detection whichshown in Figs. 3, 5 and 8. DPC takes outliers as haloswithout anomaly detection. As illustrated in Figs. 8and 9, only the proposed DFC algorithm can figurethese twooutlierscorrectly in the top left corner indataset Flame.
5. Discussion
With the aggregation principle in DFC, clustersare formed by merging density fragments based on
network structural similarity and density decreasingsequence. To analyse the strengths and weaknesses ofthe proposed DFC algorithm, the elaborate analysisof simulation results shown in Section 4 are madeto know its capability of processing data sets withvarying sizes, irregular shapes and varying densities,of detecting the number of clusters and outliers.
5.1. Analysis of processing varying sizes
As illustrated in Section 4.1, both DFC and DPCcan detect clusters correctly with varying sizes.InDBSCAN algorithm, the true cluster cannot be foundwhen there is a close line, and the wrong anomalydetecting disturb border points to reach their correctclusters. In AP algorithm, it is difficult to adjust globalparameters to satisfy the data distribution in Fig. 3(b).To overcome the limitation of global parameters, eachcluster in DPC is formed by determining its centroid
AU
THO
R C
OP
Y
J. Jiang et al. / DFC: Density Fragment Clustering without Peaks 533
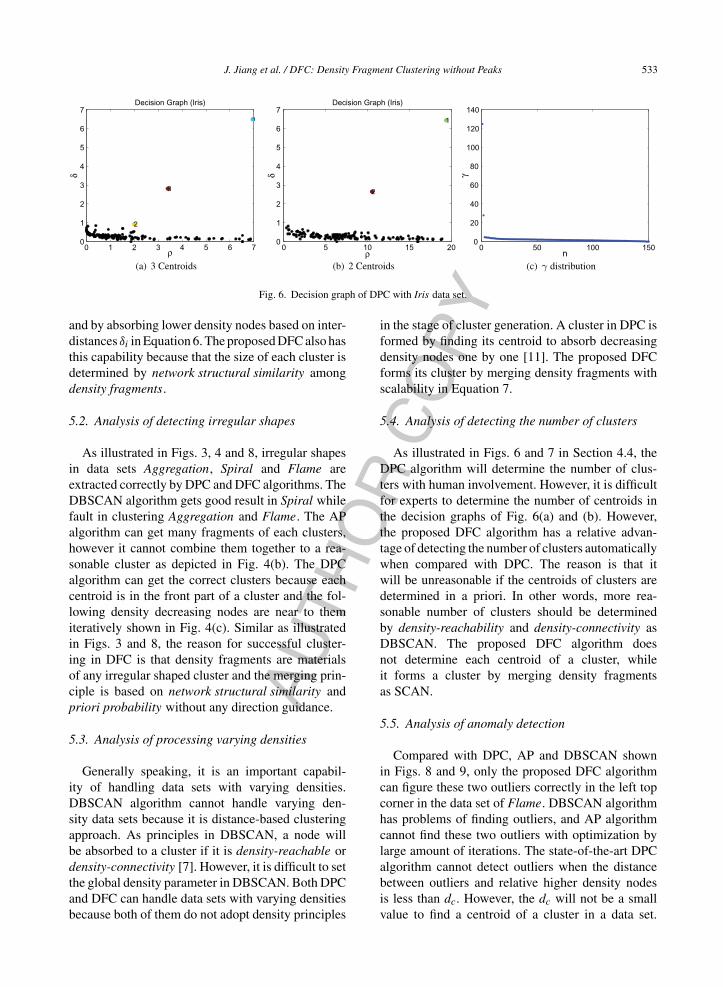
Fig. 6. Decision graph of DPC with Iris data set.
and by absorbing lower density nodes based on inter-distances δi in Equation 6. The proposed DFC also hasthis capability because that the size of each cluster isdetermined by network structural similarity amongdensity fragments.
5.2. Analysis of detecting irregular shapes
As illustrated in Figs. 3, 4 and 8, irregular shapesin data sets Aggregation, Spiral and Flame areextracted correctly by DPC and DFC algorithms. TheDBSCAN algorithm gets good result in Spiral whilefault in clustering Aggregation and Flame. The APalgorithm can get many fragments of each clusters,however it cannot combine them together to a rea-sonable cluster as depicted in Fig. 4(b). The DPCalgorithm can get the correct clusters because eachcentroid is in the front part of a cluster and the fol-lowing density decreasing nodes are near to themiteratively shown in Fig. 4(c). Similar as illustratedin Figs. 3 and 8, the reason for successful cluster-ing in DFC is that density fragments are materialsof any irregular shaped cluster and the merging prin-ciple is based on network structural similarity andpriori probability without any direction guidance.
5.3. Analysis of processing varying densities
Generally speaking, it is an important capabil-ity of handling data sets with varying densities.DBSCAN algorithm cannot handle varying den-sity data sets because it is distance-based clusteringapproach. As principles in DBSCAN, a node willbe absorbed to a cluster if it is density-reachable ordensity-connectivity [7]. However, it is difficult to setthe global density parameter in DBSCAN. Both DPCand DFC can handle data sets with varying densitiesbecause both of them do not adopt density principles
in the stage of cluster generation. A cluster in DPC isformed by finding its centroid to absorb decreasingdensity nodes one by one [11]. The proposed DFCforms its cluster by merging density fragments withscalability in Equation 7.
5.4. Analysis of detecting the number of clusters
As illustrated in Figs. 6 and 7 in Section 4.4, theDPC algorithm will determine the number of clus-ters with human involvement. However, it is difficultfor experts to determine the number of centroids inthe decision graphs of Fig. 6(a) and (b). However,the proposed DFC algorithm has a relative advan-tage of detecting the number of clusters automaticallywhen compared with DPC. The reason is that itwill be unreasonable if the centroids of clusters aredetermined in a priori. In other words, more rea-sonable number of clusters should be determinedby density-reachability and density-connectivity asDBSCAN. The proposed DFC algorithm doesnot determine each centroid of a cluster, whileit forms a cluster by merging density fragmentsas SCAN.
5.5. Analysis of anomaly detection
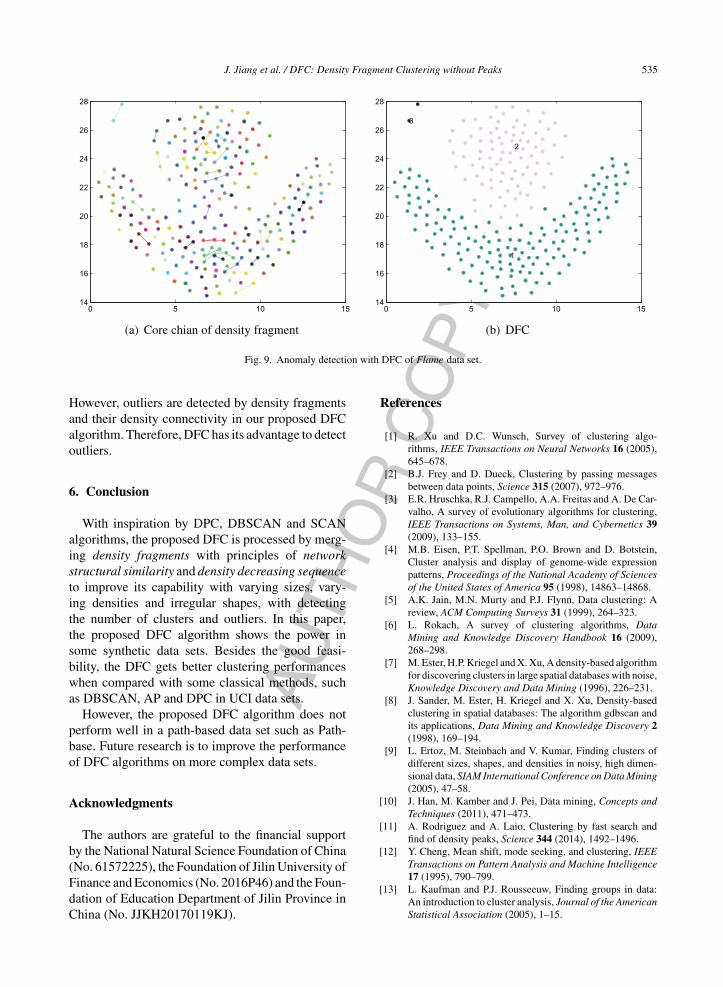
Compared with DPC, AP and DBSCAN shownin Figs. 8 and 9, only the proposed DFC algorithmcan figure these two outliers correctly in the left topcorner in the data set of Flame. DBSCAN algorithmhas problems of finding outliers, and AP algorithmcannot find these two outliers with optimization bylarge amount of iterations. The state-of-the-art DPCalgorithm cannot detect outliers when the distancebetween outliers and relative higher density nodesis less than dc. However, the dc will not be a smallvalue to find a centroid of a cluster in a data set.
AU
THO
R C
OP
Y
534 J. Jiang et al. / DFC: Density Fragment Clustering without Peaks
Fig. 7. Decision graph of DPC with Glass data set.
Fig. 8. Irregular shapes and anomaly detection of Flame data set.
AU
THO
R C
OP
Y
J. Jiang et al. / DFC: Density Fragment Clustering without Peaks 535
Fig. 9. Anomaly detection with DFC of Flame data set.
However, outliers are detected by density fragmentsand their density connectivity in our proposed DFCalgorithm. Therefore, DFC has its advantage to detectoutliers.
6. Conclusion
With inspiration by DPC, DBSCAN and SCANalgorithms, the proposed DFC is processed by merg-ing density fragments with principles of networkstructural similarity and density decreasing sequenceto improve its capability with varying sizes, vary-ing densities and irregular shapes, with detectingthe number of clusters and outliers. In this paper,the proposed DFC algorithm shows the power insome synthetic data sets. Besides the good feasi-bility, the DFC gets better clustering performanceswhen compared with some classical methods, suchas DBSCAN, AP and DPC in UCI data sets.
However, the proposed DFC algorithm does notperform well in a path-based data set such as Path-base. Future research is to improve the performanceof DFC algorithms on more complex data sets.
Acknowledgments
The authors are grateful to the financial supportby the National Natural Science Foundation of China(No. 61572225), the Foundation of Jilin University ofFinance and Economics (No. 2016P46) and the Foun-dation of Education Department of Jilin Province inChina (No. JJKH20170119KJ).
References
[1] R. Xu and D.C. Wunsch, Survey of clustering algo-rithms, IEEE Transactions on Neural Networks 16 (2005),645–678.
[2] B.J. Frey and D. Dueck, Clustering by passing messagesbetween data points, Science 315 (2007), 972–976.
[3] E.R. Hruschka, R.J. Campello, A.A. Freitas and A. De Car-valho, A survey of evolutionary algorithms for clustering,IEEE Transactions on Systems, Man, and Cybernetics 39(2009), 133–155.
[4] M.B. Eisen, P.T. Spellman, P.O. Brown and D. Botstein,Cluster analysis and display of genome-wide expressionpatterns, Proceedings of the National Academy of Sciencesof the United States of America 95 (1998), 14863–14868.
[5] A.K. Jain, M.N. Murty and P.J. Flynn, Data clustering: Areview, ACM Computing Surveys 31 (1999), 264–323.
[6] L. Rokach, A survey of clustering algorithms, DataMining and Knowledge Discovery Handbook 16 (2009),268–298.
[7] M. Ester, H.P. Kriegel and X. Xu, A density-based algorithmfor discovering clusters in large spatial databases with noise,Knowledge Discovery and Data Mining (1996), 226–231.
[8] J. Sander, M. Ester, H. Kriegel and X. Xu, Density-basedclustering in spatial databases: The algorithm gdbscan andits applications, Data Mining and Knowledge Discovery 2(1998), 169–194.
[9] L. Ertoz, M. Steinbach and V. Kumar, Finding clusters ofdifferent sizes, shapes, and densities in noisy, high dimen-sional data, SIAM International Conference on Data Mining(2005), 47–58.
[10] J. Han, M. Kamber and J. Pei, Data mining, Concepts andTechniques (2011), 471–473.
[11] A. Rodriguez and A. Laio, Clustering by fast search andfind of density peaks, Science 344 (2014), 1492–1496.
[12] Y. Cheng, Mean shift, mode seeking, and clustering, IEEETransactions on Pattern Analysis and Machine Intelligence17 (1995), 790–799.
[13] L. Kaufman and P.J. Rousseeuw, Finding groups in data:An introduction to cluster analysis, Journal of the AmericanStatistical Association (2005), 1–15.

AU
THO
R C
OP
Y
536 J. Jiang et al. / DFC: Density Fragment Clustering without Peaks
[14] M. Du, S. Ding and H. Jia, Study on density peaks cluster-ing based on k-nearest neighbors and principal componentanalysis, Knowledge Based Systems 99 (2016), 135–145.
[15] M. Wang, W. Zuo and Y. Wang, An improved densitypeaks-based clustering method for social circle discov-ery in social networks, Neurocomputing 179 (2016), 219–227.
[16] W. Zhang and J. Li, Extended fast search clustering algo-rithm: Widely density clusters, no density peaks (2015).
[17] E. Aksehirli, B. Goethals and E. Muller, Efficient clusterdetection by ordered neighborhoods, In Big Data Analyticsand Knowledge Discovery (2015), 15–27.
[18] Y. Chen, D. Lai, H. Qi, J. Wang and J. Du, A new method toestimate ages of facial image for large database, MultimediaTools and Applications (2005), 1–19.
[19] Y. Li, W. Liu, Y. Wang and D. Tao, Co-spectral cluster-ing based density peak, In 2015 IEEE 16th InternationalConference on Communication Technology (ICCT), 2015,pp. 925–929.
[20] C. Wiwie, J. Baumbach and R. Rottger, Comparing theperformance of biomedical clustering methods, NatureMethods 12 (2015), 1033–1038.
[21] K. Sun, X. Geng and L. Ji, Exemplar component analysis:A fast band selection method for hyperspectral imagery,IEEE Geoscience and Remote Sensing Letters 12 (2015),998–1002.
[22] S. Jia, G. Tang and J. Hu, Band selection of hyperspectralimagery using a weighted fast density peak-based clusteringapproach, In Intelligence Science and Big Data Engineer-ing, Image and Video Data Engineering, 2015, pp. 50–59.
[23] K. Xie, J. Wu, W. Yang and C. Sun, K-means clusteringbased on density for scene image classification, In Proceed-ings of the 2015 Chinese Intelligent Automation Conference,2015, pp. 379–386.
[24] X. Xu, N. Yuruk, Z. Feng and T.A.J. Schweiger, Scan:A structural clustering algorithm for networks, In AcmSigkdd International Conference on Knowledge Discoveryand Data Mining, 2017, pp. 824–833.