Devolved Regions, Fragmented Landscapes: The Struggle for
30
Sustainability 2010, 2, 1252-1281; doi:10.3390/su2051252 sustainability ISSN 2071-1050 www.mdpi.com/journal/sustainability Article Devolved Regions, Fragmented Landscapes: The Struggle for Sustainability in Madrid Richard Hewitt 1, * and Veronica Hernandez-Jimenez 2 1 Department of Geography, University of Alcalá , Calle Colegios 2, 28801 Alcalá de Henares, Madrid, Spain 2 Observatory for a Culture of the Territory, Department of Rural Planning, Polytechnic University of Madrid, Ciudad Universitaria 28040, Madrid, Spain; E-Mail: [email protected] * Author to whom correspondence should be addressed; E-Mail: [email protected]; Tel.: +34-635-917-168; Fax: +34-91-885-44-39. Received: 30 March 2010; in revised form: 7 April 2010 / Accepted: 28 April 2010 / Published: 5 May 2010 Abstract: This article reflects on the recent unsustainable land use changes in the Autonomous Community of Madrid and asserts the need for progress towards economically, environmentally and socially sustainable development models. Following research undertaken over the last six years there are encouraging signs of agreement between stakeholders and the problem has begun to ―open up‖. Here a new phase of problem solving is initiated, in which particular tendencies toward unsustainability are identified using a variety of basic indicators. These ―Sustainability Action Areas‖ can be targeted for collaborative sustainability initiatives involving groups of municipalities aggregated according to their response to particular indicators. Keywords: sustainability; land use change; collaboration; local action areas 1. Unsustainability of Land Use Changes Land use change is an inseparable part of the human exploitation of the earth and its resources. In Europe, vegetation changes observed at the end of the most recent Ice Age around 10,000 years ago OPEN ACCESS
Transcript of Devolved Regions, Fragmented Landscapes: The Struggle for

Sustainability 2010, 2, 1252-1281; doi:10.3390/su2051252
sustainability ISSN 2071-1050
www.mdpi.com/journal/sustainability
Article
Devolved Regions, Fragmented Landscapes: The Struggle for
Sustainability in Madrid
Richard Hewitt 1,* and Veronica Hernandez-Jimenez
2
1 Department of Geography, University of Alcalá, Calle Colegios 2, 28801 Alcalá de Henares,
Madrid, Spain 2 Observatory for a Culture of the Territory, Department of Rural Planning, Polytechnic University of
Madrid, Ciudad Universitaria 28040, Madrid, Spain;
E-Mail: [email protected]
* Author to whom correspondence should be addressed; E-Mail: [email protected];
Tel.: +34-635-917-168; Fax: +34-91-885-44-39.
Received: 30 March 2010; in revised form: 7 April 2010 / Accepted: 28 April 2010 /
Published: 5 May 2010
Abstract: This article reflects on the recent unsustainable land use changes in the
Autonomous Community of Madrid and asserts the need for progress towards
economically, environmentally and socially sustainable development models. Following
research undertaken over the last six years there are encouraging signs of agreement
between stakeholders and the problem has begun to ―open up‖. Here a new phase of
problem solving is initiated, in which particular tendencies toward unsustainability are
identified using a variety of basic indicators. These ―Sustainability Action Areas‖ can be
targeted for collaborative sustainability initiatives involving groups of municipalities
aggregated according to their response to particular indicators.
Keywords: sustainability; land use change; collaboration; local action areas
1. Unsustainability of Land Use Changes
Land use change is an inseparable part of the human exploitation of the earth and its resources. In
Europe, vegetation changes observed at the end of the most recent Ice Age around 10,000 years ago
OPEN ACCESS

Sustainability 2010, 2
1253
marked the beginning of a process of anthropogenic land cover and soil modification and the eventual
transition to agriculture, which probably originated in the southern Levant and Euphrates valley
around 12,000 years ago [1]. Since this time, land use change has accelerated sharply in line with an
exponentially increasing world population and rapidly evolving technological capabilities, bringing
ever greater areas of the earth’s surface under human control. However, bioproductive land, capable of
sustaining the earth’s ecosystems, is not limitless, and some types of land use change, for example
extraction of non-renewable resources, are irreversible on a human timescale. The need, therefore, to
manage the exploitation of the earth and its ecosystems in such a way that the planet may continue to
sustain both human and animal life gives us the principal of sustainable development—―development
that meets the needs of the present without compromising the ability of future generations to meet their
own needs‖ [2]. Though sustainability in practice is often subdivided into narrower sub-categories
emphasizing particular economic, environmental or social criteria, these problems are highly
inter-related. Land use changes that jeopardize food production, ecosystem services or global climate
are clearly unsustainable. Patterns of unsustainable land use change of this kind may be fairly easy to
detect at the scale of a country, continent or large land mass. The difficulty arises at regional or local
scales where there is no widespread agreement about what is causing the problem, or even, that there is
a problem at all [3].
For example, European agriculture operates within the framework of a European agricultural
subsidy model (the Common Agricultural Policy) which recognises that maintenance of European
agricultural production at its optimum level is not economically sustainable. However, encouraging
abandonment of productive land erases ancient farming traditions, empties the rural landscape,
provoking social changes, and may drive other land use changes, such as urban sprawl, that are
environmentally unsustainable [4]. In a scenario where agricultural land commands a much lower
market price than urban land, farmers are anxious to sell to developers.
This is what has been happening in Spain, most notably in the Autonomous Community of Madrid
(CM). The Land Law 2/2005 [5] (a modification of the Land Law 9/2001 [6]) of the regional
government of Madrid facilitated the rapid conversion of non-urbanisable (usually agricultural) land
not subject to special protection into urbanisable land. This may be acceptable to the European
economy on one level (less economically unviable farmland) but it has serious environmental
consequences, and may lead to unsustainability at the local or regional level as societies find
themselves unable to adapt to purely economic top-down decisions. Antrop [7] reflects that landscapes
evolve in response to economic and social needs. Economic, social and environmental sustainability
are interlinked at the level of the landscape. These different aspects of sustainability in the landscape
must be solved together, with each of the varying perspectives seen in their shared context et al. [8] if
progress is to be made in development that is genuinely sustainable at all levels. In Madrid, the
collapse of the construction industry at the end of the property boom is at least partly related to the
massive expansion of the sector for short-term economic reasons without thought to the long term
economic, social and environmental consequences (See Figure 1). Both local and regional economies
were initially boosted by the construction sector, only to be later submerged in recession. Just as over-
exploitation of natural resources causes future hardship, over-expansion of one sector without adequate
provision for the future makes the fall even harder when it comes.

Sustainability 2010, 2
1254
Figure 1. Unemployment in the construction industry 2006–2008 (CM).
In practice, of course, integrating the different perspectives about sustainability and land use is
difficult. The conflicting perspectives of many different interest groups must be taken into account and
achieving consensus about these issues in a modern democracy like Spain is far from straightforward.
The viewpoint of the farmer, the ecologist and the politician cannot become one and the same, no
matter how globally conscious the farmer, no matter how sensitive the ecologist to the needs of the
local economy, no matter how environmentally aware the politician.
In a six year program of research funded by the fifth and the sixth European Framework
Programmes, investigators identified key stakeholders in the CM and attempted to negotiate
collaboration and participation ―buy-in‖ [9,10]. Under TiGrESS (Time Geographical Approaches to
Emergent Sustainable Societies) in FP5, and its successor, ISBP (Integrative Systems and the
Boundary Problem) in FP6, divergent perspectives and attitudes were brought to the discussion table.
The researchers observed that highly conflicting viewpoints tended to bring negotiations to a standstill,
where the problem domain becomes ―locked down‖ [11]. In such a scenario, no progress is possible;
powerful policy makers will push through their actions anyway, and all other groups are excluded from
discussions or banished to the margins as troublemakers. Progress cannot be made unless excluded
groups are brought back in to the circle and the problem is ―opened up‖. In fact, despite what appears
to be a frustrating lack of progress on many issues relating to sustainability, much ―opening up‖ has
already taken place in the CM (previously excluded stakeholders are becoming part of the debate), and

Sustainability 2010, 2
1255
it is now becoming possible to begin a new phase of problem-solving. It is time to move away from
generalities to a discussion of ―impacts, mitigation, compensation, and accommodation‖ (ibid) and
begin making constructive attempts at a solution. The CM is now capable of moving towards a more
sustainable development model [3].
In this article we take a step further down the line and address both the level of government
appropriate for sustainable development initiatives to be instigated, and identify key areas of concern
at which these initiatives should be directed. The current situation is reviewed in the light of
sustainable development planning initiatives in other Spanish regions (i.e., Catalonia). We suggest that
existing development planning arrangements are not sufficient to deliver sustainability actions without
some form of broader territorial grouping within the Madrid region. The article is concluded with some
recommendations for appropriate areas of action defined on the basis of concerns about sustainability
at particular locations.
2. Development, Change and Complexity in Madrid
Much literature deals with the whole of the Autonomous Community of Madrid, and does not refer
to districts or areas. There is no review of sustainability on a regional or local scale, and little comment
about specifics. It is time to move away from generalities and open up the problem.
The CM is a self-governing (autonomous) region of 802,231 ha (8,022 km2) in the heart of Spain
with the Spanish capital city at its center. Over the last 20 years, the region has seen massive
infrastructure expansion and accelerated urban growth, coupled with a sharp decline in agricultural
production, with large land areas, particularly non-irrigated arable land, being abandoned or
converted to residential or industrial uses [12,13]. Though compliant with European Union economic
and legal convergence criteria, the CM falls short of environmental and sustainable development
criteria [14,15]. In the CM, where land use change has been particularly dynamic, a substantial body of
literature—much of it highly critical—exists documenting this phenomenon. The CM, together with
Murcia and the Community of Valencia, is the Spanish region with the highest rate of urban
growth [14]. Artificial surfaces (continuous and discontinuous urban fabric, industrial or commercial
units, road and rail networks and associated land, airports, minerals extraction sites, dump
sites, construction sites, green urban areas and sports and leisure facilities) increased by 47.7%
between 1987 and 2000 [16], far beyond either national or European averages [17].
Madrid’s sprawling development pattern has drawn criticism at European level on sustainability
grounds, as much of the new urban fabric constructed since 1990 has been dispersed or discontinuous.,
with new low-density residential development outside the city’s core areas requiring continued
investment in expansion and maintenance of transport infrastructure (itself a driver of urban growth)
and increasing dependence on the private car. Private vehicle use is especially high for transversal
mobility, that is, journeys between built up areas on the outskirts of the core city, between towns on the
fringe of the metropolitan area, and between outlying towns and villages in the wider region. Despite a
higher percentage of journeys undertaken by public transport than in many other European cities,
Madrid, nonetheless, is tending towards an unsustainable transport model [18].
Expansion of Madrid’s infrastructure network appears to have acted as a driver for land use change,
with a clear relationship between the rapid growth of the capital’s infrastructure and land use change in

Sustainability 2010, 2
1256
spaces adjacent to new roads. Authors such as Serrano et al. and Lopéz de Lucio [19-22], emphasized
the key role played by massive expansion of the road network in the dispersion of the population away
from the old urban core and the development of leisure and retail spaces in peripheral areas.
Decentralisation of commercial and industrial activities to outlying areas, accelerated by expansion of
infrastructures, has been underway for some time [23,24]. These fringe areas, where the city ―stops‖
and the country ―starts‖, also called transition or periurban areas, are particularly susceptible to
sprawling development patterns, with little control exercised over urban form and no consideration to
sustainability. Here, land is often simply re-classified for urban development without opposition or
impact assessment. New forms of very low density development have emerged, so called grandes
superficies (large surface area developments) for industrial (large scale distributors) commercial and
leisure (shopping centers, offices and entertainment complexes) [25,26].
The Spanish Observatory for Sustainability (OSE) noted that land use changes have been most
extensive in the immediate hinterlands of the big cities, mainly in formerly agrarian areas [16].
Although there are agrarian areas in the CM, agricultural value has not been a factor in regional
planning legislation. Nature conservation is managed in a confrontational way, with reserves protected
from development, but no thought given to complementarity (the importance of what lies beyond the
boundary of a protected area), or system resilience. Resilience, a system’s capacity to cope with
alteration and innovation [27,28], is an important consideration in sustainability of socio-natural
systems [29]. The concept of resilience is important here because land use protection is unhelpful if it
is not tied to land resource requirements (protecting everything effectively amounts to protecting
nothing) or if it is so inflexible that it ends up being ignored.
Land use change analysis at the level of the region by authors such as Aldana [30], OSE [16] reports
and Plata et al. [12] clarified important patterns that had already been emerging from earlier studies.
Aldana [30] investigating land use change between 1987 and 1997, noted significant urban expansion
orientated along road and rail networks and a general tendency toward dispersed urban development.
OSE [16] reported rapid growth in artificial surfaces (urban, industrial and commercial areas transport,
mines, quarries and construction sites and other non-vegetated areas such as sports and leisure
facilities) over the period analyzed (1987–2000), to the detriment of forested and agricultural areas.
Plata et al. [12], investigating land use change between 1990 and 2000, noted a strong increase in
urban areas, principally low density residential units. Significant changes to forested areas through
gains from agricultural land and losses to urbanization, although these land use areas did not register
net loss over the time period. Traditional agricultural areas had experienced serious net losses. Losses
to both forested and agricultural areas were shown to be occurring principally less than 500 meters
from artificial areas in 1990. Significant expansion of mining and quarrying activity was also noted
over the 10 year period.
Despite vigorous debate and dialog about Madrid’s unsustainable growth, the only factor to have
any effect at all in slowing the pace of development has been the recent recession. The CM was hard
hit by the deteriorating economic climate in Spain and elsewhere, and the booming construction
industry, sustained by a permissive land-planning model operating at a very devolved level of
governance, collapsed [31,32].

Sustainability 2010, 2
1257
3. The Gap between Land Planning Regulations and Land Planning in Practice
Despite considerable effort over the last 20 years in producing laws, directives, urban planning
regulations and other legal instruments related to landscape—land uses, transport, water, rural
development and energy—all of this has yet to bear fruit in terms of concrete actions in the
territory [33]. The failure to approve land planning tools at regional government level means that 59%
of the Spanish territory is still managed without appropriate land planning instruments. Exceptions are
Catalonia and the Basque Country; both autonomies are working on their sectorial plans,
supra-municipal plans and other specific (i.e., metropolitan) area plans. Hildenbrand [34] notes that the
conflictive relationship between regional and local powers makes land management at a municipal
level very difficult.
Even in the context of disputed competencies and documents awaiting approval, there is now so
much legal information and precedent that it should still be possible to develop a single, transparent
and functioning regional plan. Nonetheless, the CM remains without such an invaluable document,
despite attempts at its creation since the 1970s with the ―Special Plan for Protection of the
Environment of Madrid‖. Later efforts in the early 90s under the socialist’s government in the
region [35], Fundicot [36] also failed to define an effective regional framework. Subsequent attempts
have met with no greater success. It is suspected that lack of political will is largely to blame. One
researcher has observed that ―...really the clearest strategy of the Community of Madrid in the last
decade has been to neither define nor set down in a public document their project for the territory. It
would be appropriate to say that the absence of a project for the territory is perhaps the most explicit
project of the successive regional administrations...‖ [37].
This lack of supra-municipal land planning tools directly affects land use change processes, which
take place without any formal direction, independent of the strategic value of the land and resources
(for instance: fertile soils located in the river basins also have been used for urban development, as, for
example, in the case of the Henares river corridor), and the essential inter-relationship between city and
its territory is ignored [38,39]. Clearly, ever-expanding infrastructural networks increasing private car
use, sprawling residential development, and loss of agricultural and natural areas all constitute threats
to sustainability. These problems are of serious and legitimate public concern, and even in the short
term, may substantially affect citizens’ quality of life.
However, the absence of territorial planning in any legally enforceable sense is defended by the
administration of the CM, which adopts one of two positions, either arguing that proper development
planning is neither useful nor necessary in the region, or, alternatively, insisting that such a plan
already exists, despite the abundant evidence to the contrary. Planning chiefs have preferred to
question the practicality of implementing sustainable development initiatives. Leboreiro, Sub-Director
of Regional Planning for the CM has argued that ―the land planner may take as his starting point the
paradigm of sustainability without taking into account the fact that this paradigm may be accepted by
academics and professionals, but not necessarily by the rest of society‖ [40]. While this is a
worthwhile observation, it is questionable whether Madrid’s trajectory of increasing unsustainability is
really a matter of democratic choice, or whether society, represented through the municipal
government, lacks the appropriate tools and information to make informed choices. Public
participation is virtually absent from the planning process, despite the fact that, according to recent

Sustainability 2010, 2
1258
surveys, the CM’s inhabitants did notice significant changes in their territory [37]. The kind of public
participation in local planning decisions reported by Deal and Pallathucheril [41] remains non-existent
in Madrid.
While this noisy and unproductive debate continues in the region, other Spanish Autonomous
Communities have been hard at work to build a more inclusive and sustainable development model.
Catalonia has developed territorial planning tools whose main aim is to control urban expansion in the
region [42]. According to Nel·Lo, Director of Territorial Policies at the Regional Government of
Catalonia, this new territorial policy brings to an end a long period of scant supra-municipal planning
by developing strategies for open spaces, infrastructures and control of urbanization in specific areas
such as the metropolitan area of Barcelona, and other administrative units characteristic of Spanish
devolved government. The current Catalan regional government aims to recuperate the oldest
territorial system which divided Catalonia into territories known as veguerías. The regional
government has established territorial action plans for each of these old divisions in order to facilitate
supra-municipal planning and explore new ways of planning linked to historical identity and values.
This territorial division has been recently adapted to the current situation and seven veguerías have
been approved, named as follows: the metropolitan area of Barcelona, Girona, Alt Pirineu i Aran,
Lleida, Comarques Centrals, Camp de Tarragona, and Terres de l’Ebre. Clearly, this is a challenging
multi-stage process requiring consensus between different levels of public administration. In Barcelona,
progress has already been made. As the economic powerhouse of Catalonia, the successful cooperation
(including a public participation phase) between the 165 municipalities that make up Barcelona’s
metropolitan area to approve such a challenging plan is an extremely important step forward [43].
In Madrid, despite the abundance of decision tools, instruments and regulations ready and waiting
to support a process of public participation and negotiation, power relationships between municipal,
regional and national levels of government, consistently prevent the machinery being put into
action [33]. As Cartledge et al. [11] have argued, it is impossible to ―close down‖ the conflict and
move towards implementation if no consensus was achieved in the previous stage. We seem to be
locked in a cycle of conflict. However, if negotiations can be maintained until all the parties raise their
concerns about emergent problems, progress can be made. It is not of course possible to know before
opening up a problem that it will necessarily be possible to bring it to an end. There is potential both
for information to flow from bottom up, causing problems to emerge, as well as for information to
flow from top down, closing down problems and starting the implementation phase.
Madrid faces more or less the same challenges as all capital cities, i.e., managing resources while
resolving political and economic conflicts of interest and responding to supranational and national laws
while maintaining political consensus. Normally this would involve impact, mitigation, compensation,
or accommodation states, but in the context of the current recession all of these stages are likely to be
more difficult than usual. However, as we noted earlier, considerable ―opening up‖ has already taken
place. In May 2009, Madrid’s land planning model was discussed and debated in workshop sessions
extending over three days by a diverse range of stakeholders, including civil servants, local and
national politicians, ecologists groups, local action groups, planners, academics, farmers and farmers
representatives and rural development experts. Results from both TiGrESS and ISBP [9,32]
reach the same conclusions about the role of consensus and participation in regional land use
management—stakeholders are likely to be more strongly motivated to harmonize regional planning

Sustainability 2010, 2
1259
and make agreements for efficient participatory networks if they are involved from the outset in
developing planning tools. Thus, now more than ever, it is essential to look at the right level of
governance in a devolved country like Spain.
4. The Importance of Working at the Appropriate Level of Governance
Under Spain’s devolved government system, the smallest administrative unit (the municipality) is
responsible for development in its territory. Where overarching planning controls at the level of the
autonomous community are not implemented or are not effective, as we have seen in Madrid, local
interests and impacts tend to supplant the interests of the wider community. However, the example of
Catalonia shows that progress can be made, if we are prepared to look at the territory in innovative
ways. Sustainable development is one such area in which the wider community can benefit, but only if
local interests can be encouraged to work together. To do this, it may be necessary to create new
grouping of geographical units or, as in the case of Catalonia, invest ancient ones with new functions.
The Madrid region’s own administrative limits are ancient, only constitution of the area they
circumscribe as an autonomous community is in any sense new (Law of Autonomous Communities in
the framework of the Spanish Constitution of 1978) [44]. The boundaries of today’s Autonomous
Community of Madrid (CM) were in place by 1833 when Spain was divided into provinces, Madrid
province at that time forming part of New Castile (Castilla La Mancha). It might be imagined
therefore that this historic administrative unit would contain some agreed historic sub-divisions that
could serve as indicative groupings for the purpose of defining shared territories, such as comarcas.
Indeed, in the CM, as elsewhere, comarcas are to be found, generally grouping between 15
and 30 individual municipalities (Figure 2) into a single unit. Unfortunately, the boundaries of these
comarcas themselves are not anywhere clearly defined—there is no official modern definition of what
exactly constitutes a comarca in the CM, and the exact limits of a comarca depend as much on
perspective (tourism, history, physical features or landscape characteristics) as on administrative
convenience. The character of these comarcas in the CM is very different to other regions in which
comarcas have a clear identity based on territory, language and heritage. In the Madrid region, there
are, for example, comarcas defined for purposes of tourism, forestry areas, rural development areas
and landscape areas defined by modern landscape researchers [45]. At any one time, it is possible to
attain at least five possible territorial sub-configurations for the CM, no one more valid than the other,
and none of which have any formal administrative responsibility. If a response to the fragmented and
devolved sphere of action where every municipality acts for its own benefit is sought through grouping
municipalities into meaningful sub-territories, comarcas are clearly not the answer.
There do exist, however, regional subdivisions, which although not recognized as administrative
divisions in the normal sense, do group municipalities with common characteristics to achieve shared
goals. Regional policy initiatives within the European rural development programme (LEADER,
PRODER, etc.) are co-financed with member countries and administered through the Local Action
Groups (GAL) (Figure 3). These groups act as promoters of local development strategies as well as
intermediaries between local and regional administrations. These groups are formed from groupings of
municipalities with common territorial objectives which resemble (though do not exactly respect) in
some senses, the comarcas. The great difference, however, between GAL territories and comarcas is

Sustainability 2010, 2
1260
that, unlike the latter, GAL territories are administrative groupings recognized by the regional
government, and as such, have genuine political influence, albeit in a limited sphere of action. It can be
suggested that some concerted action towards a more sustainable approach to land use change might be
achieved within a similar framework. Indeed, rural development in the CM is currently under review
by the regional government in the light of a new national law of Sustainable Rural Development [46],
requiring Autonomous Communities to establish their own Sustainable Rural Development Plans
(PDRS) for 2010–2014 reinforcing the EU funding for rural areas and the countryside with
government funding.
Figure 2. The 179 Municipalities of the Autonomous Community of Madrid.

Sustainability 2010, 2
1261
Figure 3. Local Action Group territories in 2009.
GAL territories are defined and organized to reflect local conditions and local preoccupations, and
all are united by some common criteria, even if this is simply the desire of neighboring municipalities
to work together. Usually, however, these criteria relate to shared rural origins, history or
circumstances. They play a significant role in sustainable rural development as well as in
revalorization of cultural and natural heritage. The Local Action Group for the Sierra Norte
(GALSINMA), for example, broadly respects the administrative divisions of the historic territory of
Somosierra [44,47,48]. The Local Action Groups have diversified over time. The first Rural
Development programme (1995) of the Madrid region recognized only three Local Action Groups:
Sierra Oeste de Madrid (SIERRA OESTE), Comarca de las Vegas (ARACOVE), and Sierra Norte de
Madrid (GALSINMA). Then, in the second Rural Development programme (2002), the number of
Local Action Groups increased to occupy almost all the territory except the Metropolitan Area of
Madrid, with three more Local Action Groups: Campiña del Henares (ADECHE), Sierra de
Guadarrama y Alto Manzanares (ADESGAM), and, Sierra del Jarama (SIERRA JARAMA). Figure 3
shows Local Action Groups in their present configuration, with regard to the national law in
Sustainable Rural Development (Law 45/2007) [46]. ADESGAM will stop receiving funding because
of the new indicators of rurality, and this is why it does not appear on the map of Local Action Groups

Sustainability 2010, 2
1262
(Figure 3). This new situation is a result of urbanization over the last two decades in the region. The
municipalities belonging to ADESGAM have become urban municipalities according to the indicators
(e.g., distance to the main urban nuclei, agrarian land and agrarian population, percentage of protected
natural areas, etc.) that the national law (45/2007) [46] has established.
Agenda 21 (another tool for sustainability) emerged from the international community out of
concerns about the appropriate scale of action for sustainable development. In 1992, in the United
Nations Summit for Environment and Development (The Rio Summit), an agreement was reached
within the international community with regard to local administrative methods for planning
sustainable development from the lowest level of government. However, at the implementation stage,
individual local priorities have tended to take precedence over collective action for sustainable
development [49,50]. For example, Local Agenda 21 strategies might lay down detailed plans for
waste management centers or car parks, but not consider initiatives to reduce production of waste or
improve public transport between local towns and villages. Agenda 21 is already implemented or in
progress in many of the CM’s municipalities (Figure 4).
Figure 4. Municipalities with Agenda 21 completed or in progress.

Sustainability 2010, 2
1263
Following this lead, in the struggle for a sustainable approach to land use and development, it
makes sense to try to define territories through precisely the characteristics that make sustainability
urgently necessary. Such a process of definition is not merely a problem of regional geography, land
use changes must be interpreted through the lens of society and economy as well as landscape (Irwin
and Geoghegen [51].
5. Choosing the Appropriate Scale for Sustainability Action
By stating clearly the areas of the Madrid region which are of concern from a sustainability point of
view, it becomes possible to start working towards a solution [11]. In the following paragraphs, with
the objective of defining ―Strategic Areas for future Action‖, we identify some key zones which we
consider to be of concern from the point of view of sustainability.
Perhaps the most widely reported threat to sustainability in the CM has been the seemingly
unstoppable extension of housing, industry, mining and quarrying, infrastructures and other related
―artificial‖ non-agricultural activities into all areas of the territory. Most literature is devoted to
analytical description of this process, leading to explanations as to why this has occurred. Some
authors note the threats these changes pose for sustainable development [22,52]. It is not so much that
tendencies like massive development of the transport network [19-21], increasing dispersion of
residential areas [18], expansion of mining and quarrying [12], relocation of industrial areas from core
to periphery [23], and changes in distribution of goods and services [25] are in themselves undesirable,
but that collectively they lead to a transformation of landscape, economy and society that accelerates
natural resource use in a way completely unknown at any time previously. By identifying the areas
where this transformation has been most accelerated, we try to identify zones of specific concern for
future action.
The indicators we have selected for discussion below are, in our opinion, those which exhibit the
strongest evidence for transformation towards an unsustainable configuration, and which were, at the
time of writing, most easily available. In most cases it would have been possible to select other data
sources for the same information. Allowing for differences of scale or emphasis, all alternative sources,
as far as we are aware, demonstrate the same trends. Though there may be much debate about the
importance and significance of the dynamics discussed, the data are all derived from widely available,
accepted and reliable national and international sources, and the tendencies they show are largely
uncontroversial. Data unavailable to us at the time of writing, but which would be of great interest to
review for their implications for sustainability include, water use and water sources [22], expansion of
the infrastructure network [19-21], and the expansion of the logistics sector [25]. Research into the
sustainability implications of new habits of consumption and the increasing phenomenon of out-of
town retail and leisure parks is in progress [26].
5.1. Growth of Artificial Areas 1990–2000
Land use and land cover mapping datasets like CORINE land cover [54] are appropriate for
identifying areas of the territory where changes have been most dynamic. The CORINE 1990–2000
datasets were analysed using GIS software. Land cover in 1990 falling into the CORINE artificial land
cover category was extracted by municipality, and expressed as a percentage of the total land area of

Sustainability 2010, 2
1264
each municipality. This process was repeated for land cover in 2000. The percentage of each
municipality occupied by artificial surfaces in 1990 was compared with the percentage occupied
by artificial surfaces 10 years later. The difference between the two percentages (% artificial land
cover 2000–% artificial land cover 1990) was then plotted by municipality (Figure 5 and Appendix 1).
Figure 5. Growth of artificial areas 1990–2000.
Though CORINE land cover 2006 was still not available at the time of writing, evidence from other
sources [52] suggests that the trends identified here have almost certainly continued in the time
period 2000–2006. Figure 5 depicts the sharpest growth in percentage of land area occupied by
artificial surfaces. It can be noted that those municipalities shown in yellow have increased their
percentage of artificial surfaces by 5% or more, and that, in the red shaded areas, municipalities
in 2000 have 20% more artificial land than in 1990. In the south-west corner of Madrid core city, four
municipalities are shown in dark orange and red (Alcorcón, Móstoles, Leganés and Pozuelo de
Alarcón). These are historic urban development zones at the city’s fringe, which have seen planned,
and mostly high-quality urban development since the 1970s. All except the latter (Pozuelo de Alarcón)
are served by the southern branch of the city’s metro system, a cheap and efficient service which does
more to reduce private car use within the metropolitan area than practically any other European metro

Sustainability 2010, 2
1265
system [18]. If urban development in Madrid is to be sustainable, we should look to locate it here. The
crescent shaped municipality to the north of the core city is Alcobendas, a historic peripheral industrial
area served by both the metro system and a long-established motorway (N-II). It is not surprising
growth here has been extensive.
To the east of the core areas, the other red and orange shaded municipalities of Coslada, Torrejón de
Ardoz and Alcalá de Henares are all well-served by local short distance train services (Cercanías).
These are, at least, historically developed areas of lower-income residential and industrial use, even if
the development pattern here has been excessively linear (dispersed along the Madrid—Guadalajara
infrastructure corridor) and the fertile terraces of the river Henares have been needlessly built-up with
industrial and warehouse units.
Areas of concern, from the point of view of sustainability, is the increasing occupation by artificial
land areas, of zones well away from traditional population centres or poorly served by public transport.
In this bracket, the group of municipalities to the north west of Madrid, Torrelodones, Moralzarzal, El
Boalo, Becerril de la Sierra, Collado Mediano and Alpedrete, are of interest. These are traditional areas
of tourism and second homes, but also occupy an area of outstanding natural value, within, or adjacent
to, the Sierra de Guadarrama. Is it really desirable that these areas should grow so much?
To the south of the capital, artificial land areas in Rivas-Vaciamadrid and San Martín de la Vega
have increased substantially, along with all of the municipalities along the line of the N-IV motorway
to Andalucía (Getafe, Pinto, Valdemoro, Ciempozuelos). With the exception of Getafe (an older
peripheral build up area like Alcorcón), these municipalities are lately emerging as pockets of light
industry along road and rail routes. The development of these areas is likely to be related to the
increasing tendency for industry and services (especially large scale distribution centers) to relocate
away from the city’s core areas, a well-documented driver of urban sprawl [14].
Many further observations could be made that are beyond the scope of this article. However, it is
already possible to define, and group together municipalities that share particular dynamics on the
basis of sustainability criteria independent of any historical or administrative allegiances.
5.2. Loss of Natural and Agricultural Areas 1990–2000
The land area occupied by artificial surfaces has increased between 1990 and 2000. Since there are
no wetlands in the CM, and water bodies have not increased over this time period, this increase must
be at the expense of the two remaining CORINE level 1 land use categories, namely: natural and
agricultural areas. This is indeed the case, as detailed analysis of land use and land cover change in the
CM over this time period confirms [12]. This exchange of land between the various agricultural and
natural categories is quite complex (principally because abandoned agricultural land tends to be
difficult to distinguish from, or to revert entirely to, natural, or unmanaged land).
For this reason, the two categories are grouped together, in what is essentially the inverse of the
previous map (Figure 6 and Appendix 2). It is included to emphasize the fact that unsustainability is
not purely related to development, but also its inverse—sprawling development may lead to inefficient
resource use through over-extended supply networks, while loss of agricultural land reduces the
possibility of shortening supply chains by fostering local production.

Sustainability 2010, 2
1266
Figure 6. Decline of agricultural and natural areas 1990–2000.
5.3. Economic Sustainability—The Example of the Construction Industry
Critics of development policy in the CM have drawn attention to the unusually non-interventionist
approach of the regional government with regard to proper regional spatial planning. Some authors
suspect that this peculiar situation has been maintained because it ―has proved very profitable for some
political insiders‖ [3].
The lack of political will to interfere with the short-term financial interests of the construction boom
has tended to frustrate any form of innovation (ibid). Prior to the crisis, it was possible for politicians
to argue, against a background of voter apathy around sustainable development issues, that there was a
real risk of harming the regional economy by implementing tighter development control. With the
regional economy in boom on the back of the construction industry, a lack of willingness on the part of
politicians to interfere in a massive wealth creation scheme on the grounds of debated principles of
sustainability, is, if not justifiable, at least comprehensible. But sustainable development, if properly
handled, is anything but anti-economic in the long term. Sensible handling of the construction boom
cycle might have allowed transfer of genuinely skilled workers across to related industries (such as
Sustainability 2010, 2
1267
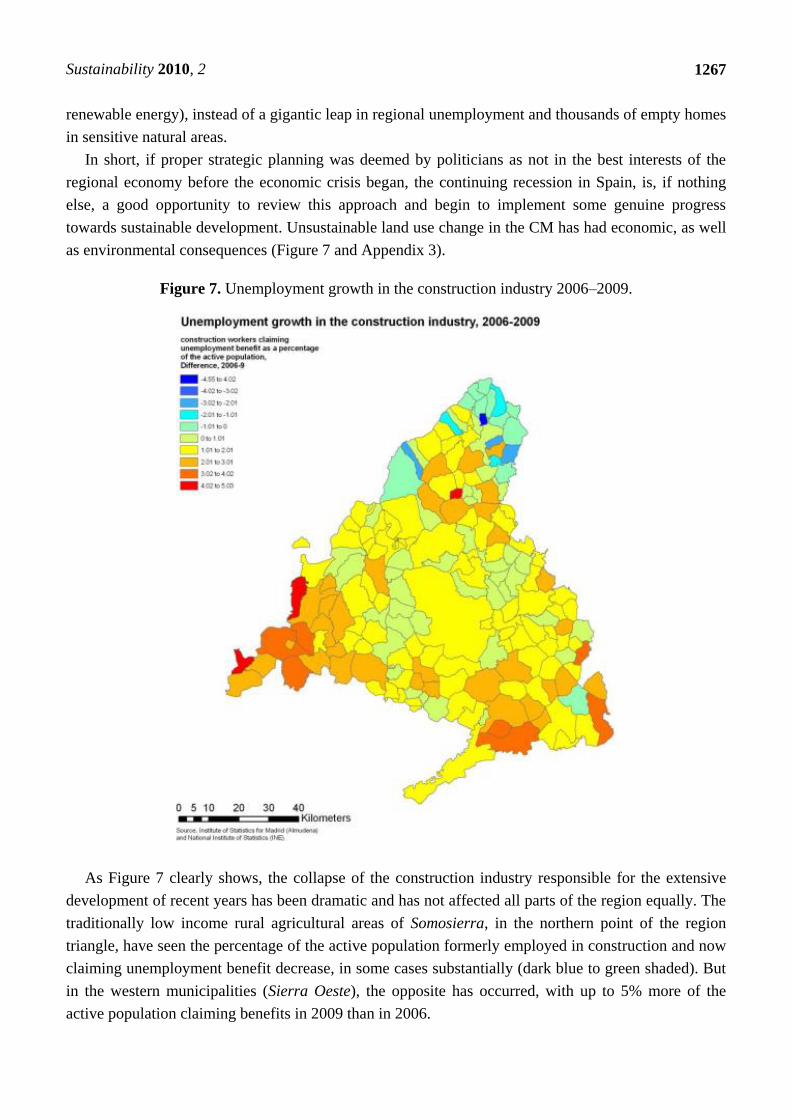
renewable energy), instead of a gigantic leap in regional unemployment and thousands of empty homes
in sensitive natural areas.
In short, if proper strategic planning was deemed by politicians as not in the best interests of the
regional economy before the economic crisis began, the continuing recession in Spain, is, if nothing
else, a good opportunity to review this approach and begin to implement some genuine progress
towards sustainable development. Unsustainable land use change in the CM has had economic, as well
as environmental consequences (Figure 7 and Appendix 3).
Figure 7. Unemployment growth in the construction industry 2006–2009.
As Figure 7 clearly shows, the collapse of the construction industry responsible for the extensive
development of recent years has been dramatic and has not affected all parts of the region equally. The
traditionally low income rural agricultural areas of Somosierra, in the northern point of the region
triangle, have seen the percentage of the active population formerly employed in construction and now
claiming unemployment benefit decrease, in some cases substantially (dark blue to green shaded). But
in the western municipalities (Sierra Oeste), the opposite has occurred, with up to 5% more of the
active population claiming benefits in 2009 than in 2006.

Sustainability 2010, 2
1268
The contrast between these two rural areas (both Local Action Group territories in receipt of rural
development funding) in their response to the collapse of the construction industry is interesting. It is
also of interest that there is no immediately obvious correlation between areas of intensive recent
development (see Figure 5) and areas now showing high increases in construction sector
unemployment. The contrasting pattern of regional unemployment resulting from the collapse of the
construction industry suggests that the construction boom has not benefited the regional economy
evenly. Some of the lowest income areas (e.g., Ambite, Colmenar de Oreja, Estremera and
Villaconejos) of the CM have been the worst affected. Through the boom inmobiliario, the CM has
paid a heavy price for the short-term benefit of, one suspects, a very few [31,55].
Figure 8. Growth of automobiles, 1998–2008.
5.4. Increased Motorized Transport
The CM, in common with most parts of the developed world, has experienced strong growth both of
personal car use and vehicular transportation generally in recent years. The growth of low density
residential areas in Madrid has been documented by authors such as Garcia and Gutierrez [52], who
have also noted the increasing trend towards private car use, especially for shorter journeys between

Sustainability 2010, 2
1269
outlying population centres [18]. To obtain an idea of the level of increase of personal car use in the
CM, data from the Caixa’s (a major Spanish bank) yearly statistical report have been explored. These
results, showing difference between numbers of automobiles (not commercial vehicles or motorcycles)
per capita 1998–2008 (Figure 8 and Appendix 4) do not paint a very encouraging picture, with
increased numbers of motor vehicles almost everywhere, though in most municipalities the increases
have been very slight (less than 0.1 car per inhabitant). It is likely that some of the more extreme
values (an increase of 16.39 cars per head between 1998 and 2008 in Colmenar de Arroyo) are due to
the relocation of car-dealers premises out of the city centre to rural areas for tax reasons, as well as city
dwellers registering their cars at their second homes in order to pay lower vehicle licensing costs.
However, it is notable that some of the largest increases are in precisely the areas that showed the
greatest growth of artificial surfaces and the most substantial reduction in natural and agricultural areas
(see Figures 5 and 6).
Now it may be that the strong increases in automobiles per capita between 1998 and 2008 in
municipalities of the north western sierra such as Collado Mediano, Moralzarzal and Torrelodones
may be indirectly reflecting the increased construction observed between 1990 and 2000 (Figure 5 and
Appendix 1). More second homes probably means that more cars per capita are registered in these
areas. Nonetheless, these basic results are sufficient to begin asking questions about sustainability in
these areas. This is the objective we have wanted to draw out of this article—by application of some
basic indicators areas can be earmarked for future action. These areas, developed through
the discussion of the previous section in reference to the statistics shown in Figures 5–8 and
Appendices 1–4 we will denote ―Sustainability Action Areas‖ (Figure 9).
6. Conclusions: Sustainability Action Areas
In the concluding part of this article, the indicators discussed in the preceding section have been
aggregated into a single map (Figure 9, see also Appendix 5) through map overlay techniques. The aim
of this is to begin to distil the large body of information on tendencies, about which most stakeholders
identified were in agreement, into concentrated areas of focus. It is not suggested that Figure 9 would
in itself serve as a map for administration of sustainability actions, rather that the ―hotspots‖ observed
in this map should indicate the municipalities that might usefully be grouped for particular target
actions, such as reduction of private vehicle use or control of urban sprawl.
The key argument here is that progress can be made from the bottom-up, based on actual observable
tendencies that must be managed through collective action where they occur, rather than by ―bolting
on‖ additional administrative responsibilities from the top-down across the whole territory. This
process aims to empower local groups in the territory, charging them with assessing their own
sustainability and providing their own solutions. In contrast to other processes, this must be undertaken
collectively. This article may serve as a baseline study for establishing sustainability action groups for
such collective action in the relevant areas, which can then themselves undertake rapid appraisal work
to define achievable objectives to enhance sustainability. This approach has paid dividends in many
parts of the world [53].

Sustainability 2010, 2
1270
Figure 9. Areas of proposed action for sustainability.
With reference to Figure 9 and Appendix 5, the following areas can be identified:
(1) At the western edge of the core urban area, municipalities of Arroyomolinos, Móstoles,
Villaviciosa de Odón, Boadilla del Monte, Majadahonda, Las Rozas and Villanueva de la
Cañada experienced large increases in artificial areas 1990–2000 and corresponding loss of
natural/agricultural land.
(2) To the west of the CM, the municipalities of the SIERRA OESTE Local Action Group
territory perform poorly in the various indicators. Rozas de Puerto Real, Villa del Prado,
San Martín de Valdeiglesias, Villamaqueda and Navas del Rey have suffered strong
growth in construction industry unemployment following the collapse of the industry. Of
these, Villamaqueda and Navas del Rey have not yet initiated Agenda 21. Navalagamella
and the adjacent municipality of Valdemorillo (outside of the SIERRA OESTE Local
Action Group) have also not begun this process. The municipalities of Robledo de Chavela,

Sustainability 2010, 2
1271
Colmenar de Arroyo and Aldea del Fresno have experienced dramatic increases in
automobiles per capita since 1998.
(3) To the East and Southeast of Madrid capital, there has been generally poor compliance
with Agenda 21. Of these, Ambite and Estremera have suffered in the construction
industry downturn.
(4) To the south of Madrid city, municipalities such as Fuenlabrada, Pinto, Valdemoro and
Ciempozuelos have seen large increases in occupation of the territory by artificial surfaces
relating to peripheral residential development and expansion of infrastructures and
associated logistics and light industry. Fuenlabrada, Valdemoro, Ciempozuelos, and
Titulcia lack Agenda 21.
(5) To the north west of the core city, in the middle and upper valley of the river Guadarrama,
the municipalities of Torrelodones, Moralzarzal, El Boalo, Becerril de la Sierra, Collado
Mediano and Alpedrete have seen extensive development since 1990. Of these, Collado
Mediano, Moralzarzal and Torrelodones have seen dramatic increases in automobiles
since 1998. Additionally, Moralzarzal has not begun to implement Agenda 21.
(6) To the east of the core city, major development has taken place not only in the Henares
corridor in Coslada, Alcalá de Henares and Torrejón de Ardoz but also to the north, in the
municipalities of Meco and Ajalvir. Neither of these two municipalities has begun the
Agenda 21 process, and Ajalvir has seen a strong increase in automobiles per capita
since 1998.
(7) To the north east of the core city, Alcobendas, San Sebastian de los Reyes, Algete and Tres
Cantos have seen substantial development in the period 1990–2000. Of these, Algete lacks
Agenda 21.
(8) In the north of the region, particularly in the mountainous north-west edge of the CM, there
has been generally poor uptake of Agenda 21.
(9) In the center north of the region, the municipality of La Cabrera, an area of outstanding
natural value, has seen extensive development 1990–2000. Neighboring municipalities of
Torrelaguna and Venturada have seen strong per capita increases in automobiles
since 1998 and lack Agenda 21, like Navalafuente, which has also been hard hit by
construction industry job losses.
The nine ―Sustainability Action Areas‖ proposed are clearly not an exhaustive list and can scarcely
be considered to reflect the complex range of dynamic land use changes to which the CM has been
subjected in the last 20 years. However, they are sufficient to allow us to move away from the
confused domain of debate and analysis into the sphere of concerted policy action. As we have seen,
different dynamics are manifest in particular areas, and it is these dynamics that need to inform us as to
where action for sustainable development is most necessary, and what precise action is needed to
respond to each particular challenge.
The approach suggested here, which has certain similarities to methodologies adopted by rural
development workers since the 1990s [53], focuses on bottom up appraisal of sustainability threats to
the territory by local groups. Such groups cannot emerge where they are most necessary, if zones
tending particularly toward unsustainability (hotspots) are not first identified. On the basis of the

Sustainability 2010, 2
1272
successful ―opening up‖ of the problem domain over the last six years (inclusion of marginalized
stakeholders in the debate about issues of broad consensus), we have attempted to define these
unsustainability hotspots, here denominated ―Sustainability Action Areas‖. It is now appropriate to
move to the next stage of the process, and begin to implement sustainability actions in the relevant
areas. It is important to emphasize that the Spanish case forming the basis of this study is likely to be
applicable to other parts of the world where achieving consensus over territorial management issues
has proved particularly difficult.
In the CM, municipalities need to be grouped together according to the threats they face and
encouraged to work together to produce sustainability action plans based on measurable indicators of
sustainability. It is important that the indicators are developed by the municipalities themselves in
response to their particular capabilities and sets of circumstances, not imposed by the regional
government. However they also need to take into account shared regional threats to sustainability, and
not become tied down by purely local concerns. Action groups like the Observatory for a Culture of
the Territory (OCT), recently established to continue the work of the European Union FP6 project
ISBP, need to take this model into forward into the arena of public policy by negotiating with Madrid
land planning stakeholders at all levels. In Spain’s highly devolved democratic system, only
collaborative planning at the appropriate level of governance can hope to respond adequately to the
tremendous challenges that the Autonomous Community of Madrid now faces.
Acknowledgements
We would like to acknowledge all of the stakeholders that contributed to this research under the
TiGrESS and ISBP projects, culminating in the ―1st Workshops on Analysis and Reflection on the
Territorial Model of the Region of Madrid‖. Out of these encouraging discussions, this article emerged.
We would like to thank: the Ministry of Environment and Rural Affairs; Regional politicians of
the 3 major political parties: PP, PSOE and IU. We are also particularly grateful for the contribution
made by Regional authorities, notably the departments of Territorial Planning, Rural Development,
and, Drover Tracks in the Madrid Government; and the departments of Territorial Policy and Agrarian
Parks in the Catalonian Government.
We have drawn information and ideas from Civil Society Organisations: ecologist groups,
consumer groups, non-governmental associations, farmer’s trade unions, Local Actions Groups, and,
local governments of municipalities in the region of Madrid, notably as Rivas-Vaciamadrid, Olmeda
de las Fuentes, and Villaviciosa de Odón.
Among the academic Institutions contributing to the work, we acknowledge specially the assistance
of the department of Rural Planning at the UPM as well as the Faculty of Agronomy at the UPM. We
also thank the department of Geography at the UAH, UCM and UAM, as well as the URJC, UC3, and,
Universitat de Valencia. We are grateful to the Commission of the EU (D.G. Research) for
funding support.
The courage, vision and commitment of numerous individuals representing the above listed
organisations have allowed bridges to be built between stakeholder groups and new entities, like the
recently formed Observatory for a Culture of the Territory, to emerge.

Sustainability 2010, 2
1273
References and Notes
1. Harris, D.R. First farmers were colonists after all. British Archaeology 1997, No. 27.
2. Brundtland, G. Our Common Future: Towards Sustainable Development; The World Commission
on Environment and Development, The United Nations: Geneva, Switzerland, 1987; Available
online: http://www.un-documents.net/wced-ocf.htm (accessed on 20 March 2009).
3. Hernandez-Jimenez, V.; Winder, N.P. Knowledge integration and power relations: Pathways to
sustainability in Madrid. In Beyond the Rural-Urban Divide: Cross-Continental Perspectives on
the Differentiated Countryside and Its Regulation; Andersson, K., Lehtola, M., Eklund, E.,
Salmi, P., Eds.; Emerald Group Publishing Limited: London, UK, 2009.
4. Antrop, M. Landscape change and the urbanisation process in Europe. Landscape Urban Plan.
2004, 67, 9–26.
5. Ley 2/2005 de modificación de la ley 9/2001; Boletín Oficial de La Comunidad de Madrid BOCM:
Madrid, Spain, 2005.
6. Ley 9/2001 del Suelo de la Comunidad de Madrid; Boletín Oficial de La Comunidad de Madrid
BOCM: Madrid, Spain, 2001.
7. Antrop, M. Sustainable landscapes: Contradiction, fiction or utopia? Landscape Urban Plan. 2006,
75, 187–197.
8. Haberl, H.; Wackernagel, M.; Wrbka, T. Land use and sustainability indicators: An introduction.
Land Use Policy 2004, 21, 193–198.
9. TiGrESS Project Final Report; Winder, N.P., Ed.; European Commission and University of
Newcastle: Newcastle Upon Tyne, UK, 2006.
10. Winder, N.P. Innovation and metastability: A systems model. Ecol. Soc. 2007, 12, 28.
11. Cartledge, K.; Dürrwächter, C.; Hernandez-Jimenez, V.; Winder, N.P. Making sure you solve the
right problem. Ecol. Soc.2009, 14, 3.
12. Plata Rocha, W.; Gómez-Delgado, M.; Bosque Sendra, J. Cambios de usos del suelo y expansión
urbana en la Comunidad de Madrid 1990–2000. Scripta Nova 2009, 13, No. 293.
13. Estudio Sobre la Ocupación de Suelo por Usos Urbano-industriales, Aplicado a la Comunidad de
Madrid; Naredo, J., Garcia Zaldivar, R., Eds.; Spanish Ministry of Environment and Polytechnic
University of Madrid: Madrid, Spain, 2008.
14. Urban Sprawl in Europe—The Ignored Challenge; Report No. 10; Environmental European
Agency (EEA): Copenhagen, Denmark, 2006.
15. Regional Policy; Directorate General for Regional Policy of the European Commission: Brussels,
Belgium, 2004.
16. Cambio de Ocupación del Suelo en España: Implicaciones Para la Sostenibilidad. Principales
Resultados a Nivel Nacional y Por Comunidades Autónomas; Spanish Observatory for
Sustainability and University of Alcala: Alcala de Henarés, Madrid, Spain, 2006.
17. Barredo, J.I.; Gómez-Delgado, M. Towards a set of IPCC SRES urban land-use scenarios:
Modelling urban land-use in the Madrid region. In Modelling Environmental Dynamics;
Paegelow, M., Camacho Olmedo, M.T., Eds.; Springer: New York, NY, USA, 2006.
18. García Palomares, J.C.; Gutiérrez Puebla, J. Pautas de la movilidad en el área metropolitana de
Madrid. Cuadernos de Geografía 2007, 81–82, 7–30.

Sustainability 2010, 2
1274
19. Serrano Cambronero, M.; Gago García, C.; Anton Burgos, F.J. Impacto Territorial de las
Carreteras Orbitales de la Comunidad de Madrid. Dirección General de Investigación;
Consejería de Educación de la Comunidad de Madrid: Madrid, Spain, 2002.
20. Serrano Cambronero, M.; Gago García, C.; Anton Burgos, F.J. Implicaciones Territoriales de los
Trazados de las Carreteras Orbitales de la Comunidad de Madrid Mediante Teledetección: Bases
Metodológicas. In Proceedings of the X Congreso Nacional de Teledetección, Cáceres, Spain,
17–19 September 2003.
21. López de Lucio, R. Transformaciones territoriales recientes en la región urbana de Madrid. Urban
2003, 8, 124–161.
22. López de Lucio, R. Morfología y características de las nuevas periferias. Nueve paisajes
residenciales en la región urbana de Madrid. Urban 2004, 9, 56–80.
23. Mendez G. del Valle, R. Crisis económica y difusión industrial en la aglomeración de Madrid.
An. de Geogr. de la UCM 1983, 3, 173–195.
24. Gutiérrez Puebla, J. Accesibilidad y descentralización en el espacio metropolitano madrileño.
An. de Geogr. de la UCM. 1992, 12, 325–331.
25. de Santiago Rodríguez, E. El sector logístico y la gestión de los flujos globales en la región
metropolitana de Madrid. Scripta Nova. 2008, 12, No. 259.
26. Diaz, J.; Hewitt, R. El territorio como bien de consumo: las grandes superficies comerciales en el
contexto metropolitano y su implicación para el desarrollo urbano sostenible. In Proceedings of
the Conference on Ciudad, Territorio y Paisaje: Una Mirada Multidisciplinar, Madrid, Spain,
5–7 May 2010.
27. Holling, C.S. Resilience and stability of ecological systems. Annu. Rev. Ecol. Syst. 1973, 4, 1–23.
28. Folke, C.; Hahn, T.; Olsson, P.; Norberg, J. Adaptive governance of social-ecological knowledge.
Annu. Rev. Environ. Res. 2005, 30, 441–473.
29. Winder, N.P. Integrative research as appreciative system. Syst. Res. Behav. Sci. 2005, 22,
299–309.
30. Aldana, A.T. Cartografía de los cambios en las cubiertas artificiales de la Comunidad de
Madrid-España 1987–1997. Revista Forestal Latinoamericana. 2005, 37, 59–86.
31. Naredo, J. El aterrizaje inmobiliario: El boom inmobiliario en España y sus consecuencias.
Boletín de Ciudades para un Futuro más Sostenible, 10 July 2008.
32. Hernandez-Jimenez, V.; Ocón, B.; Encinas, M.A.; Pereira, D.; Winder, N.P. Planificación
participativa en el entorno de las grandes ciudades. In Cohesión e Inteligencia Territorial;
Farinós, J., Romero, J., Salom, J., Eds.; Universitat de Valencia: Valencia, Spain, 2009.
33. Gonzalez Alonso, S. 20 Años de Política Territorial en España. Tecno Ambiente 2009, 19,
43–52.
34. Hildenbrand, A. La política de ordenación del territorio de las Comunidades Autónomas: Balance
crítico y propuestas para la mejora de su eficacia. Revista de derecho urbanístico y medio
ambiente 2006, 40, 79–140.
35. Madrid 21; Agencia Ambiental de la Comunidad Autónoma de Madrid: Madrid, Spain, 1993.
36. Fundicot. Bases del Plan Regional de Estrategia Territorial de la Comunidad de Madrid;
Asociación Interprofesional de Ordenación del Territorio: Madrid, Spain, 1997.

Sustainability 2010, 2
1275
37. Fernández Muñoz, S. Participación pública, gobierno del territorio y paisaje en la Comunidad de
Madrid. Boletín de la Asociación de Geógrafos Españoles 2008, 46, 97–119.
38. Orive, L. Paisajes Rotos. Ecosostenible 2008, 45, 35–42.
39. Izquierdo, J. Asturias: Región Agropolitana; KRK Ediciones: Oviedo, Spain, 2008.
40. Leboreiro, A. De la teoría a la práctica en la planificación territorial. Urban 1999, 3, 68–79.
41. Deal, B.; Pallathucheril, V. Sustainability and urban dynamics: Assessing future impacts on
ecosystem services. Sustainability 2009, 1, 346–362.
42. Nel·Lo, O. La Nova Politica Territorial de Catalunya; Generalitat de Catalunya: Barcelona,
Catalunya, Spain, 2004.
43. La Catalunya del Futur; EL PAIS—Catalonia Section: Barcelona, Catalonia, Spain, 15 May 2009.
44. Constitución Española; Gobierno de España: Madrid, Spain, 1978.
45. Mata Olmo, R.; Sanz Herraiz, C. Atlas de los Paisajes de España; Ministerio de Medio Ambiente:
Madrid, Spain, 2006.
46. Gobierno de España. Ley 45/2007 de Desarrollo Sostenible del Medio Rural; Boletín Oficial del
Estado Español BOE: Madrid, Spain, 2007.
47. Galve Martín, A.; Sancho Comíns, J. La Sierra Norte de Madrid: aspectos generales de su
estructura agraria. Estudios Geográficos 1993, 211, 209–235.
48. Bullón Mata, T. Los paisajes de Madrid. Cometario sobre un texto inédito de Manuel de Terán
Álvarez. Eria 2008, 76, 197–211.
49. CIMAS—Observatorio para el Desarrollo de la Ciudadanía. Agenda Local 21 y su Aplicación en
la Comunidad de Madrid; Instituto de Estudios Políticos para América Latina y África (IEPALA):
Madrid, Spain, 2004.
50. CIMAS—Observatorio para el Desarrollo de la Ciudadanía. Desarrollo Sostenible y Agenda 21
Local: Prácticas, Metodología y Teoría; Instituto de Estudios Políticos para América Latina y
África (IEPALA): Madrid, Spain, 2004.
51. Irwin, E.G.; Geoghegan, J. Theory, data, methods: Developing spatially explicit economic models
of land use change. Agr. Ecosyst. Environ. 2001, 85, 7–23.
52. García Palomares, J.C.; Gutiérrez Puebla, J. La ciudad dispersa: Cambios recientes en los espacios
residenciales de la Comunidad de Madrid. An. de Geografía. 2007, 271, 45–67.
53. Chambers, R. Whose Reality Counts? Putting the First Last; ITDG Publishing: London, UK, 1997.
54. Data Service for CORINE Land Cover CLC1990 100 m; European Environmental Agency(EEA):
Copenhagen, Denmark, 2007; Available online: http://dataservice.eea.europa.eu/dataservice/
metadetails.asp?id=1010 (accessed on 1 February 2010).
55. Cartografía del Suelo; El PAIS—Madrid Section: Madrid, Spain, 24 December 2004.

Sustainability 2010, 2
1276
Appendix
Appendix 1. Madrid municipalities: artificial land cover as a percentage of whole
municipal land area, increases by 5% or more 1990–2000.
Municipality Total area
(hectares)
Area of
artificial
land cover
1990
(hectares)
Area of
artificial
land cover
2000
(hectares)
Artificial
land cover
1990 as %
total area
1990
Artificial
land cover
2000 as %
total area
1990
Difference
% 1990 to
% 2000
Coslada 1,201.52 570.56 940.69 47.49 78.29 30.81
Leganés 4,324.72 790.53 1,743.21 18.28 40.31 22.03
Pozuelo de Alarcón 4,311.67 1,764.91 2,709.02 40.93 62.83 21.90
Alcorcón 3,358.38 728.16 1,365.03 21.68 40.65 18.96
Alcobendas 4,522.31 1,287.30 2,091.94 28.47 46.26 17.79
Móstoles 4,493.91 698.14 1,454.46 15.54 32.37 16.83
Alcalá de Henares 8,834.58 1,603.72 2,871.65 18.15 32.50 14.35
Rozas de Madrid (Las) 5,826.43 1,555.10 2,372.64 26.69 40.72 14.03
Rivas-Vaciamadrid 6,729.40 357.01 1,243.56 5.31 18.48 13.17
Fuenlabrada 3,917.32 1,085.10 1,598.80 27.70 40.81 13.11
Torrejón de Ardoz 3,242.16 1,895.41 2,313.01 58.46 71.34 12.88
Ajalvir 1,974.13 105.07 335.70 5.32 17.00 11.68
Majadahonda 3,846.58 535.02 983.53 13.91 25.57 11.66
Boadilla del Monte 4,740.93 1,197.32 1,741.77 25.25 36.74 11.48
Madrid 60,463.06 22,209.88 28,740.14 36.73 47.53 10.80
San Sebastián de los Reyes 5,921.39 952.79 1,587.59 16.09 26.81 10.72
Mejorada del Campo 1,793.48 259.37 449.33 14.46 25.05 10.59
San Martín de la Vega 10,509.17 570.20 1,666.69 5.43 15.86 10.43
Villanueva de la Cañada 3,477.03 408.99 745.21 11.76 21.43 9.67
Getafe 7,858.95 1,675.68 2,423.65 21.32 30.84 9.52
Boalo (El) 3,946.16 111.34 479.79 2.82 12.16 9.34
Arroyomolinos 2,079.31 18.21 209.11 0.88 10.06 9.18
Griñón 1,708.72 130.72 283.95 7.65 16.62 8.97
Parla 2,497.78 291.69 514.67 11.68 20.61 8.93
Pinto 6,199.83 448.97 967.14 7.24 15.60 8.36
Humanes de Madrid 1,967.30 234.54 393.28 11.92 19.99 8.07
Pelayos de la Presa 751.99 200.94 261.11 26.72 34.72 8.00
Becerril de la Sierra 2952.81 175.92 404.40 5.96 13.70 7.74
Velilla de San Antonio 1437.33 321.24 427.29 22.35 29.73 7.38
Villaviciosa de Odón 6,817.33 820.09 1,313.84 12.03 19.27 7.24
Moralzarzal 4,361.95 114.61 385.10 2.63 8.83 6.20
Cabrera (La) 2,213.96 153.21 277.25 6.92 12.52 5.60
Serranillos del Valle 1,303.14 10.88 83.57 0.83 6.41 5.58
Algete 3,792.22 411.56 622.73 10.85 16.42 5.57
Arganda del Rey 8,027.97 988.10 1,432.47 12.31 17.84 5.54
Tres Cantos 3,793.56 515.72 725.57 13.59 19.13 5.53

Sustainability 2010, 2
1277
Appendix 1. Cont.
Municipality Total area
(hectares)
Area of
artificial
land cover
1990
(hectares)
Area of
artificial
land cover
2000
(hectares)
Artificial
land cover
1990 as %
total area
1990
Artificial
land cover
2000 as %
total area
1990
Difference
% 1990 to
% 2000
Meco 3,492.71 46.32 232.44 1.33 6.66 5.33
Torrelodones 2,173.42 700.12 814.21 32.21 37.46 5.25
Valdemoro 6,417.26 645.27 978.77 10.06 15.25 5.20
Collado Mediano 2,231.08 193.54 307.18 8.67 13.77 5.09
Ciempozuelos 4,937.36 205.45 456.59 4.16 9.25 5.09
Alpedrete 1,266.08 367.09 431.45 28.99 34.08 5.08
Appendix 2. Madrid municipalities: agricultural and natural land cover as a percentage of
whole municipal land area, decreases by 5% or more 1990–2000.
Municipality Total area
(hectares)
Area of
nat/agric
land cover
1990
(hectares)
Area of
nat/agric
land cover
2000
(hectares)
Nat/agric
land cover
1990 as %
total area
Nat/agric
land cover
2000 as %
total area
difference %1990
to %2000
Coslada 1,201.52 630.97 260.83 52.51 21.71 −30.81
Leganés 4,324.72 3,522.59 2,569.91 81.45 59.42 −22.03
Pozuelo de Alarcón 4,311.67 2,546.77 1,602.65 59.07 37.17 −21.90
Alcorcón 3,358.38 2,630.22 1,993.35 78.32 59.35 −18.96
Alcobendas 4,522.31 3,235.01 2,430.37 71.53 53.74 −17.79
Móstoles 4,493.91 3,795.78 3,039.45 84.46 67.63 −16.83
Rivas−Vaciamadrid 6,729.40 6,204.44 5,214.98 92.20 77.50 −14.70
Alcalá de Henares 8,834.58 7,230.85 5,934.76 81.85 67.18 −14.67
Rozas de Madrid (Las) 5,826.43 4,260.87 3,443.32 73.13 59.10 −14.03
Fuenlabrada 3,917.32 2,832.21 2,318.52 72.30 59.19 −13.11
Torrejón de Ardoz 3,242.16 1,346.75 929.15 41.54 28.66 −12.88
Ajalvir 1,974.13 1,869.05 1,638.43 94.68 83.00 −11.68
Majadahonda 3,846.58 3,311.56 2,863.05 86.09 74.43 −11.66
Velilla de San Antonio 1,437.33 1,101.86 935.12 76.66 65.06 −11.60
Boadilla del Monte 4,740.93 3,543.62 2,999.16 74.75 63.26 −11.48
San Martín de la Vega 10,509.17 9,884.98 8,744.08 94.06 83.20 −10.86
Madrid 60,463.06 37,869.73 31,339.47 62.63 51.83 −10.80
San Sebastián de los Reyes 5,921.39 4,968.61 4,333.80 83.91 73.19 −10.72
Mejorada del Campo 1,793.48 1,534.11 1,344.15 85.54 74.95 −10.59
Villanueva de la Cañada 3,477.03 3,068.04 2,731.82 88.24 78.57 −9.67
Getafe 7,858.95 6,183.27 5,426.39 78.68 69.05 −9.63
Boalo (El) 3,946.16 3,834.81 3,466.37 97.18 87.84 −9.34
Arroyomolinos 2,079.31 2,061.11 1,870.20 99.12 89.94 −9.18
Griñón 1,708.72 1,578.00 1,424.76 92.35 83.38 −8.97
Parla 2,497.78 2,206.09 1,983.11 88.32 79.39 −8.93

Sustainability 2010, 2
1278
Appendix 2. Cont.
Municipality Total area
(hectares)
Area of
nat/agric
land cover
1990
(hectares)
Area of
nat/agric
land cover
2000
(hectares)
Nat/agric
land cover
1990 as %
total area
Nat/agric
land cover
2000 as %
total area
difference %1990
to %2000
Pinto 6,199.83 5,750.86 5,232.69 92.76 84.40 −8.36
Humanes de Madrid 1,967.30 1,732.76 1,574.02 88.08 80.01 −8.07
Pelayos de la Presa 751.99 550.27 490.10 73.18 65.17 −8.00
Becerril de la Sierra 2,952.81 2,774.39 2,545.92 93.96 86.22 −7.74
Villaviciosa de Odón 6,817.33 5,997.24 5,503.49 87.97 80.73 −7.24
Moralzarzal 4,361.95 4,247.34 3,976.85 97.37 91.17 −6.20
Algete 3,792.22 3,380.66 3,160.40 89.15 83.34 −5.81
Arganda del Rey 8,027.97 6,995.83 6,537.89 87.14 81.44 −5.70
Cabrera (La) 2,213.96 2,060.75 1,936.71 93.08 87.48 −5.60
Tres Cantos 3,793.56 3,277.84 3,067.99 86.41 80.87 −5.53
Serranillos del Valle 1,303.14 1,288.03 1,219.57 98.84 93.59 −5.25
Torrelodones 2,173.42 1,464.79 1,350.70 67.40 62.15 −5.25
Collado Mediano 2,231.08 2,037.54 1,923.90 91.33 86.23 −5.09
Alpedrete 1,266.08 898.99 834.63 71.01 65.92 −5.08
Valdemoro 6,417.26 5,760.07 5,438.49 89.76 84.75 −5.01
Meco 3,492.71 3,435.11 3,260.26 98.35 93.34 −5.01
Appendix 3. Madrid municipalities: ten highest increases in unemployment in the
construction industry, 2006−2009.
Municipality
Active
population
2006
Active
population
2009
Population
unemployed
from
construction
2006
Population
unemployed
from
construction
2009
Population
unemployed
from
construction
2006 as %
of active
population
2006
Population
unemployed
from
construction
2009 as % of
active
population
2009
Difference, %
population
unemployed
from
construction
(2006−09)
Valdemaqueda 567 593 4 34 0.71 5.73 5.03
Navalafuente 592 805 6 41 1.01 5.09 4.08
Rozas de Puerto
Real 208 247 0 10 0.00 4.05 4.05
Villaconejos 2044 2250 17 103 0.83 4.58 3.75
Colmenar de Oreja 4814 5724 56 272 1.16 4.75 3.59
Ambite 212 349 0 12 0.00 3.44 3.44
Villa del Prado 3779 4212 32 180 0.85 4.27 3.43
Navas del Rey 1635 1674 30 87 1.83 5.20 3.36
San Martín de
Valdeiglesias 4865 5263 68 245 1.40 4.66 3.26
Estremera 860 949 6 36 0.70 3.79 3.10

Sustainability 2010, 2
1279
Appendix 4. Madrid municipalities: ten highest increases in automobiles per capita,
1998−2008.
Municipality Population
(1998)
Population
(2008)
Automobiles
(1998)
Automobiles
(2008)
Autos per
capita
(1998)
Autos per
capita (2008)
Difference,
autos per
capita
2008−1998
Robledo de
Chavela 2,014 3,773 869 63,469 0.43 16.82 16.39
Colmenar del
Arroyo 853 1,348 228 18,973 0.27 14.07 13.81
Serranillos del
Valle 778 3,273 323 21,263 0.42 6.50 6.08
Torrelaguna 2,558 4,671 874 22,894 0.34 4.90 4.56
Venturada 639 1,609 248 6,600 0.39 4.10 3.71
Collado
Mediano 0 6,427 1,562 23,605 0.00 3.67 3.67
Aldea del
Fresno 1,308 2,424 1,036 8,200 0.79 3.38 2.59
Moralzarzal 4,149 11,318 1,820 32,889 0.44 2.91 2.47
Torrelodones 11,100 21,231 5,877 60,494 0.53 2.85 2.32
Ajalvir 1,817 3,558 1,027 8,039 0.57 2.26 1.69
Appendix 5. Sustainability Action areas and relevant indicators.
Action Area nº Action Area name Indicator Municipalities
1 Urban fringe West
Strong increase artificial areas
1990−2000 Arroyomolinos
Decline natural/agricultural areas
1990−2000 Móstoles
Villaviciosa de Odón
Boadilla del Monte
Majadaonda
Las Rozas
Villanueva de la Cañada
2 CM West
Strong increases in construction
unemployment 2006−2009 Rozas de Puerto Real
Agenda 21 not initiated by 2009 Navalagamella
Strong growth in automobiles per capita
since 1998 Valdemorillo
Robledo de Chavela
Colmenar de Arroyo
Aldea del Fresno
Villa del Prado
San Martín de
Valdeiglesias
Villamaqueda
Navas del Rey

Sustainability 2010, 2
1280
Appendix 5. Cont.
Action Area nº Action Area name Indicator Municipalities
3 CM South East
Strong increases in construction
unemployment 2006−2009 Municipalities bisected by
Agenda 21 not initiated by 2009 and east of a line drawn
between Los Santos de la
Humosa and Aranjuez
4
Urban fringe and
Corridor South
Strong increase artificial areas
1990−2000 Fuenlabrada
Decline natural/agricultural areas
1990−2000 Pinto
Agenda 21 not initiated by 2009 Valdemoro
Getafe
San Martín de la Vega
Titulcia
5 Guadarrama Valley
Strong increase artificial areas
1990−2000 Torrelodones
Decline natural/agricultural areas
1990−2000 Moralzarzal
Agenda 21 not initiated by 2009 El Boalo
Strong growth in automobiles per capita
since 1998 Becerril de la Sierra
Collado Mediano
Alpedrete
6
Urban fringe and
Corridor East
Strong increase artificial areas
1990−2000 Coslada
Decline natural/agricultural areas
1990−2000 Alcalá de Henares
Strong growth in automobiles per capita
since 1998 Torrejón de Ardoz
Agenda 21 not initiated by 2009 Meco
Ajalvir
7
Urban fringe and
Corridor North
Strong increase artificial areas
1990−2000 Alcobendas,
Decline natural/agricultural areas
1990−2000 San Sebastián de los Reyes
Agenda 21 not initiated by 2009 Algete
Tres Cantos
8 CM North Agenda 21 not initiated by 2009 Municipalities bisected by
and north of a line drawn
between Torrelaguna and
Rascafria
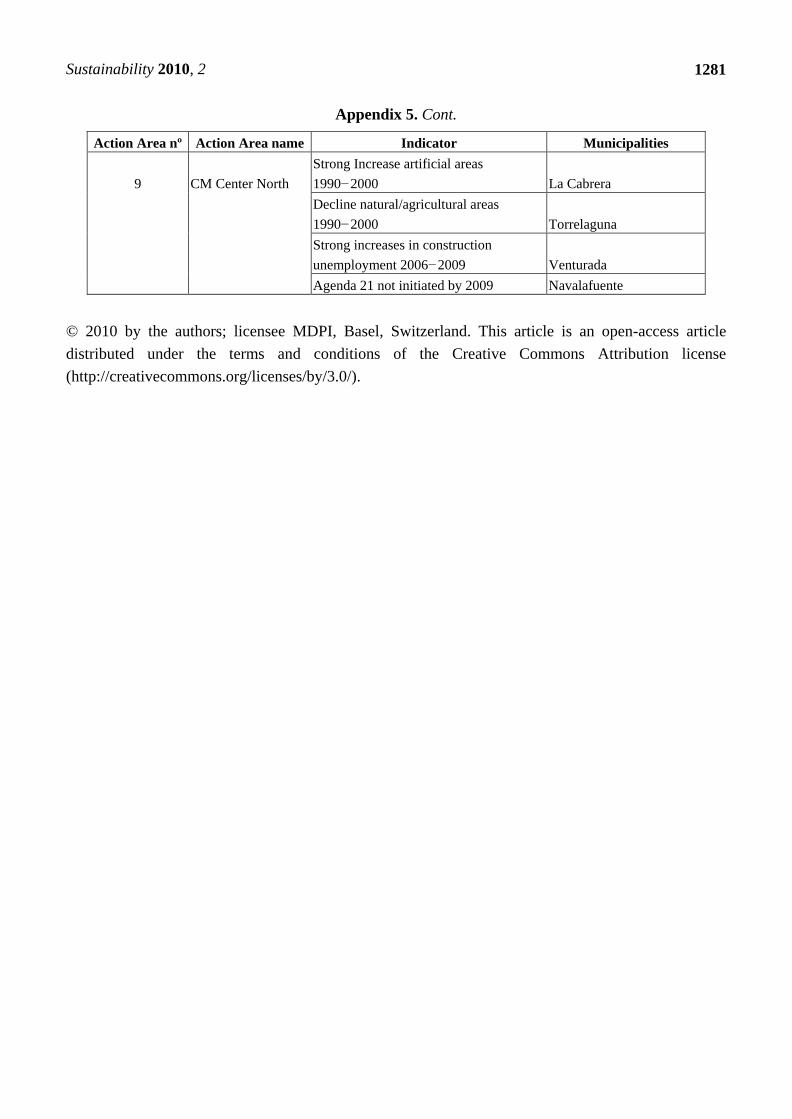
Sustainability 2010, 2
1281
Appendix 5. Cont.
Action Area nº Action Area name Indicator Municipalities
9 CM Center North
Strong Increase artificial areas
1990−2000 La Cabrera
Decline natural/agricultural areas
1990−2000 Torrelaguna
Strong increases in construction
unemployment 2006−2009 Venturada
Agenda 21 not initiated by 2009 Navalafuente
© 2010 by the authors; licensee MDPI, Basel, Switzerland. This article is an open-access article
distributed under the terms and conditions of the Creative Commons Attribution license
(http://creativecommons.org/licenses/by/3.0/).