DeviceAtlas Q1 2015 Mobile Web Report
14
DEVICEATLAS MOBILE WEB TRAFFIC REPORT Q1 2015 PROVIDING DETAILED DATA ON THE LATEST TRENDS IN THE MOBILE MARKET
-
Upload
jon-arsenault -
Category
Mobile
-
view
66 -
download
2
Transcript of DeviceAtlas Q1 2015 Mobile Web Report
DEVICEATLAS MOBILE WEB TRAFFIC REPORT Q1 2015 PROVIDING DETAILED DATA ON THE LATEST TRENDS IN THE MOBILE MARKET

INTRODUCTIONWith 81.5% market share, Android was the leading mobile OS in 2014 in terms of shipments, followed by iOS capturing 14.8% of the market. 2.7% of devices featured Windows Phone, 0.4% were on BlackBerry OS, while 0.6% used some other operating systems. (IDC)
The first quarter of 2015 also marked the launch of a number of new Android smartphones. The most notable being Samsung Galaxy S6, S6 Edge, and HTC One M9 showcased at the MWC 2015. We expect these new launches, and the likes of the LG G4 and Sony Xperia Z4, to push Android’s popularity even further.
If you want to maximize your mobile-driven online revenues , however, sales figures may not be sufficient. You need a deeper understanding of how users are actually using devices for web browsing.
Digital marketers and mobile web developers are welcome to use this DeviceAtlas-powered report offering an overview of the mobile landscape in Q1 2015 based on web browsing figures. Below is what you can learn from this report:
• Most popular devices used for web browsing
• Most popular vendors
• Most popular operating systems, OS versions penetration
• Top mobile browsers and their usage across different operating systems
• Most popular diagonal screen size and device age
• LTE and NFC popularity
All these statistics are presented across selected local markets.

MOST POPULAR SMARTPHONESDifferent versions of the iPhone are the most popular devices for web browsing in nearly every corner of the planet. The iPhone 5 (including the S and C versions) is currently the most popular model out of the three latest Apple phones.
The Samsung Galaxy S family isn’t as visible as iPhones in our web browsing statistics, but their share is nevertheless significant. All three versions are popular, although there are huge differences between the countries we analyzed. The latest launches showcased at the MWC 2015, the S6 and S6 Edge, aren’t yet present in the statistics.
0%
10%
20%
30%
40%
50%
iPhone 6iPhone 5iPhone 4
USASouth KoreaJapanIndiaAustralia
0%
8%
16%
24%
32%
40%
iPhone 6iPhone 5iPhone 4
UKSpainItalyGermanyFrance
Browsing share of Apple iPhones - 2
Browsing share of Apple iPhones - 1

0%
2%
4%
6%
8%
Samsung Galaxy S5Samsung Galaxy S4Samsung Galaxy S3
USASouth KoreaJapanIndiaAustralia
0%
2%
4%
6%
8%
Samsung Galaxy S5Samsung Galaxy S4Samsung Galaxy S3
UKSpainItalyGermanyFrance
Browsing share of Samsung Galaxy S series - 1
Browsing share of Samsung Galaxy S series - 2
Large-Screen Smartphones
Large-screen smartphones have become ubiquitous which means that for many people a ‘smartphone’ is not just a phone but more of a web-browsing device. Here you can compare the browsing share of two hugely popular large-screen devices, Samsung Galaxy Note 3 (5.7-inch) and iPhone 6 Plus (5.5-inch) in various territories.

Samsung Note 3 iPhone 6 Plus
Australia 1.7 2.7
Japan 0.7 2.91
South Korea 2.28 1.77
USA 1.22 2.98
France 1.03 1.21
Germany 1.11 0.9
Spain 1.58 1.08
UK 1.34 1.53
MOST POPULAR VENDORSSamsung and Apple are the two most popular device vendors in every corner of the globe in terms of both sales and web browsing statistics. Other popular brands include LG, HTC, Motorola, and Sony. Interestingly, in some countries BlackBerry and Nokia appear among the top 5 vendors.
Vendor browsing market share change between Q4 2014 and Q1 2015
USA
Winners Losers
Apple (+1.38%) Samsung (-3.34%)
Verizon (+1.05%) Motorola (-0.23%)
Sprint (+0.65%) HTC (-0.17%)
UK
Winners Losers
Apple (+1.52%) BlackBerry (-2.75%)
Sony (+0.51%) Samsung (-0.57%)
HTC (+0.47%) Sony Ericsson (-0.09%)
France
Winners Losers
Samsung (+4.44%) HTC (-4.25%)
Sony (+0.53%) Apple (-4.16%)
Wiko (+0.23%) Nokia (-1.09%)

Note: The above statistics exclude tablet traffic
OPERATING SYSTEMSAndroid and iOS are the two most popular mobile operating systems in the DeviceAtlas mobile traffic statistics. These two operating systems are rivals in nearly every corner of the globe. What is important though, is that the gap between Android and iOS is increasing. Android wins in 56 out of 67 countries DeviceAtlas tracks.
Germany
Winners Losers
Sony (+0.75%) Samsung (-4.13%)
Nokia (+0.21%) HTC (-0.42%)
LG (+0.03%) Huawei (-0.03%)
Japan
Winners Losers
DoCoMo (+1.70%) Sharp (-1.64%)
Sony (+1.38%) Apple (-0.68%)
Fujitsu (+0.48%) Samsung (-0.62%)

0% 25% 50% 75% 100%
iOSAndroid
DenmarkAustralia
CanadaUnited Kingdom
JapanSouth Africa
IrelandRussian Federation
United States of AmericaBelgium
New ZealandFrance
UkraineUruguay
SingaporeHong Kong
NorwayBarbados
NetherlandsIsrael
SwedenVenezuelaIndonesia
FinlandPoland
ThailandBahrain
Saudi ArabiaArgentina
QatarPortugalRomania
ChileDominican Republic
EcuadorNigeria
ItalyChina
GermanyPuerto Rico
MexicoTurkey
PeruGreece
United Arab EmiratesCosta Rica
KazakhstanAustria
PhilippinesCroatia
MalaysiaSpain
PakistanBolivia
SwitzerlandIran
ColombiaBrazil
TaiwanIndia
EgyptVietnam
South KoreaPanama
SerbiaAlbania
Macedonia
Android vs iOS across 67 countries
Note: The above statistics exclude tablet traffic.

Windows Phone
After some interesting mid to low range offerings, Windows Phone is today the only OS that might loosen the dominance of iOS and Android. In Q1 2015, however, Windows Phone-generated mobile traffic was a far cry from both Android and iOS’ share. Here are 10 countries in which Windows Phone was popular in Q1 2015.
Windows Phone - driven mobile traffic
0 3 6 9 12 15
Windows Phone 8.1Windows Phone 8Windows Phone 7.5
FinlandIndia
BosniaCroatia
UruguayEcuador
ItalyHungary
IranArgentina
OS version penetration
Android vendors are generally slow to offer OS updates, given that Lollipop (released back in November 2014) is now less popular than Kitkat (2013), and Jelly Bean (2012). The rollout of updates for iOS users is carried out faster which is probably caused by less device fragmentation.
Android versions penetration
0 10 20 30 40 50 60 70 80
Android 5.0Android 4.4Android 4.3Android 4.2Android 4.1
AustraliaIndia
JapanSouth Korea
USAFrance
GermanyItaly
SpainUK

iOS versions penetration
0 10 20 30 40 50 60iOS 8.2iOS 8.1iOS 8iOS 7.1iOS 7
AustraliaIndia
JapanSouth Korea
USAFrance
GermanyItaly
SpainUK
Note: The above statistics exclude tablet traffic.
MOBILE BROWSERSThe most popular mobile web browsers are Safari, Android Browser, Chrome Mobile, IE Mobile, BlackBerry Mobile, Opera Mobile, and UC Browser. In most cases mobile browser popularity reflects operating system’s market share due to the fact that users are most likely to use standard browsers.
Top mobile browsers part 1
0%
10%
20%
30%
40%
50%
60%
70%
80%
IE MobileBlackBerry BrowserSafariAndroid BrowserChrome Mobile
USASouth KoreaJapanIndiaAustralia

Top mobile browsers part 2
0%
10%
20%
30%
40%
50%
60%
IE MobileBlackBerry BrowserSafariAndroid BrowserChrome Mobile
UKSpainItalyGermanyFrance
Note: The above statistics exclude tablet traffic.
Instead of using built-in, standard browsers users can also surf the internet using third-party apps downloaded from the app stores. The following charts show you which OS users are most likely to swap their standard browsers for some third-party offerings. For example a relatively significant percentage of iOS users browse the Internet using Chrome Mobile.
Browsers Used by Android users % of mobile web traffic
Android Browser 38.07
Chrome Mobile 57.86
Firefox 1.55
Opera Mini 0.06
Opera Mobile 0.26
UC Browser 0.83
Others 1.37
Browsers Used by iOS users % of mobile web traffic
Chrome Mobile 4.21
Firefox 0.01
Safari 95.76
UC Browser 0.02
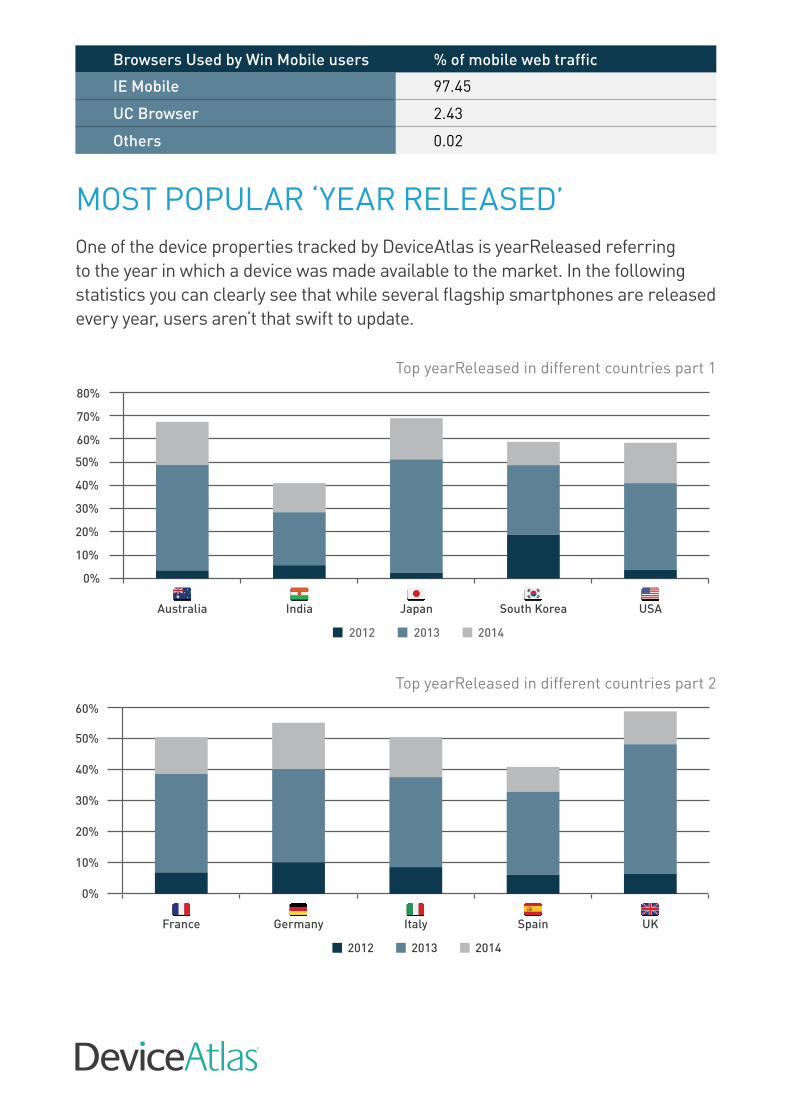
Browsers Used by Win Mobile users % of mobile web traffic
IE Mobile 97.45
UC Browser 2.43
Others 0.02
MOST POPULAR ‘YEAR RELEASED’One of the device properties tracked by DeviceAtlas is yearReleased referring to the year in which a device was made available to the market. In the following statistics you can clearly see that while several flagship smartphones are released every year, users aren’t that swift to update.
0%
10%
20%
30%
40%
50%
60%
70%
80%
201420132012
USASouth KoreaJapanIndiaAustralia
Top yearReleased in different countries part 1
Top yearReleased in different countries part 2
0%
10%
20%
30%
40%
50%
60%
201420132012
UKSpainItalyGermanyFrance
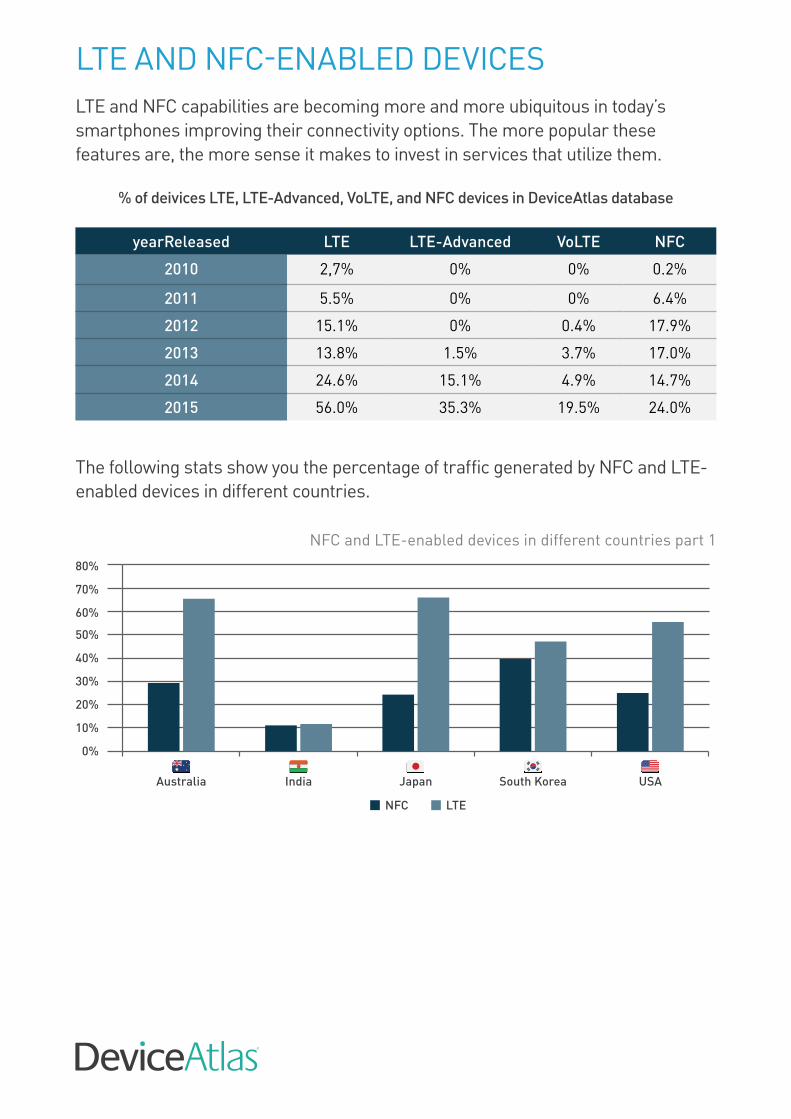
LTE AND NFC-ENABLED DEVICESLTE and NFC capabilities are becoming more and more ubiquitous in today’s smartphones improving their connectivity options. The more popular these features are, the more sense it makes to invest in services that utilize them.
% of deivices LTE, LTE-Advanced, VoLTE, and NFC devices in DeviceAtlas database
yearReleased LTE LTE-Advanced VoLTE NFC
2010 2,7% 0% 0% 0.2%
2011 5.5% 0% 0% 6.4%
2012 15.1% 0% 0.4% 17.9%
2013 13.8% 1.5% 3.7% 17.0%
2014 24.6% 15.1% 4.9% 14.7%
2015 56.0% 35.3% 19.5% 24.0%
NFC and LTE-enabled devices in different countries part 1
0%
10%
20%
30%
40%
50%
60%
70%
80%
LTENFC
USASouth KoreaJapanIndiaAustralia
The following stats show you the percentage of traffic generated by NFC and LTE-enabled devices in different countries.

NFC and LTE-enabled devices in different countries part 2
0%
10%
20%
30%
40%
50%
LTENFC
UKSpainItalyGermanyFrance
MOST POPULAR SCREEN SIZESMost flagship devices released today are over 5in in diagonal but this doesn’t mean that smaller devices aren’t used for web browsing. Our mobile traffic statistics show that 3.5 to 4in smartphones are largely popular in many countries, although we are noticing that this changes in favour of the larger devices.
Top screen sizes in different countries part 1
0%
20%
40%
60%
80%
100%
5.6+5-5.54.1-4.93.5-4
USASouth KoreaJapanIndiaAustralia

Top screen sizes in different countries part 2
0%
10%
20%
30%
40%
50%
60%
70%
80%
5.6+5-5.54-4.93.5-4
UKSpainItalyGermanyFrance
Note: The above statistics include tablet traffic.
Access mobile web traffic data with DeviceAtlasDeviceAtlas allows you to access mobile traffic data sourced from thousands of websites from all over the world. You can browse many kinds of stats across over 70 countries. Each data point shows the percentage of traffic generated by a certain kind of device.
Sign up for a free DeviceAtlas account to get access to our global mobile traffic stats and trial our device detection solution