Device to Detect Sitting to Standing Transitions
52
Device to Detect Sitting to Standing Transitions ME 450: Design and Manufacturing Ⅲ, Fall 2020 Aksel Ahituv Erlin Guri Alli Heinen Mario Shkembi Maria Zaccherini Instructor : Noel Perkins Sponsor : Dr. Lauro Ojeda (UM-ME) 1
Transcript of Device to Detect Sitting to Standing Transitions

Device to Detect Sitting to Standing
Transitions ME 450: Design and Manufacturing Ⅲ, Fall 2020
Aksel Ahituv Erlin Guri
Alli Heinen Mario Shkembi
Maria Zaccherini
Instructor: Noel Perkins
Sponsor: Dr. Lauro Ojeda (UM-ME)
1
Table of Contents Table of Contents 2
Executive Summary 3
Problem Description and Background 4
Requirements and Engineering Specifications 5
Concept Generation / Development 10
Concept Evaluation / Selection 11 Evaluation 11 Selection 19
Solution Development 22 Engineering Analysis / Solution Development 23 Verification 27
Discussion and Recommendations 35
Conclusion 36
Authors 37 Acknowledgements 38
Information Sources 39 Equation Sources 41
Appendices 42 APPENDIX A: Gantt Chart 42 APPENDIX B: Mind Map 44 APPENDIX C: Bill of Materials 45 APPENDIX D: Learning Blocks 45
Engineering Standards 45 Engineering Inclusivity 45 Environmental Context Assessment 46 Social Context Assessment 47 Ethical Decision Making 47
APPENDIX E: Failure Mode and Effects Analysis 49
2
Executive Summary
The elderly population faces significant challenges as they experience loss of balance (LOB) problems causing themselves to trip, stumble, and fall. These falls can be very serious as they can cause significant injuries and an increase in medical bills. According to the Lower Extremity Review Magazine, 20% of elderly falls are caused by tripping while 41% are caused by incorrect transfer in body weight[1]. Although it is easier to observe what occurs before and during slips, trips, or other LOB during laboratory simulations, there is little numerical statistics and study on what actually occurs during real world scenarios, outside of a lab [2]. Our sponsor, Dr. Lauro Ojeda, is interested in studying real world LOB, focusing on the fragile populations, which include elderly people and people with a medical condition, their movements and the context in which LOB occurs. Specifically, he is interested in developing a device that can tell whether a person is sitting or standing at any given moment in time; this can be achieved in two main ways. Firstly by detecting any time a transition occurs and keeping track of this, or by being able to detect whether a person is sitting or standing at a given moment. This device will be added to a collection of current sensors already used in this study. Dr. Ojeda requires the use of minimum hardware devices for this solution so that it does not interfere with a person's daily activities. In addition, he has also asked to develop a device that is non-invasive since this device will be added to elderly participants and sometimes those participants may have medical conditions. Therefore, developing a device to detect the duration for sitting and standing may be difficult with minimum hardware devices; having a device that can detect the transition between sitting to standing is just as useful. The data gathered from when a person went from sitting to standing and vice versa can be used to calculate the time a person spent sitting and standing, making it easier to determine the cause of loss of balance or fall. To ensure that the final sensor design has met Dr. Ojeda’s requirements, Team 19 went through multiple evaluations of concepts, determination of placement of the sensor, and simulations to test the sensor. After evaluating five concepts, we chose to proceed placing a pressure sensor in the sole of a shoe. To begin, we assessed several pressure sensors and ended up choosing Flexiforce A401 sensor, which was capable of fulfilling our stakeholder’s request. For the calibration, a static test was conducted using a series of known masses placed on the pressure sensor and data was collected. The data yielded a nonlinear relationship between the load applied on the pressure sensor and the output voltage. Then a dynamic test was performed by placing the pressure sensor in the sole of the shoe and collecting data from sitting to standing transitions from various types of seats, such as armchair, stool, couch, and task chair. Based on the data collected from our dynamic test, we can conclude that our solution is strong in the fact that our device effectively and consistently achieves its purpose. However, our solution is still at a prototype stage and recommendations for further improvement towards a finalized design are included in the Discussion and Recommendations section.
3

Problem Description and Background
Our sponsor for this project is Prof. Lauro Ojeda, Associate Research Scientist at the UM-ME department. His research lab focuses on using inertial sensors to solve diverse problems in biomechanics, performing gait analysis and studying Losses Of Balance (LOB). One of their main research areas is understanding the cause of self reported loss of balances in community-dwelling older adults. People who fall under this population group are defined by their age (≥60 years) and by living independently. This group can suffer from various healthcare problems just from getting older [3]. Prof. Ojeda’s research has been successful in identifying the strong correlation between older adults and high chance of slips, trips, stumbles and other forms of losses of balance (LOBs). LOBs are more common than everyday falls and are closely related to fall related injuries [2], as they are an early sign of motor deterioration that might cause worse falls, or accidents in the future. It is known from other studies that sitting to standing transitions are one of the major contributing factors of LOBs and falls that often result in injuries like hip fractures in the elderly population [4]. In a study conducted to analyze the risk factors for falls among the elderly people 77% of falls occurred at home and 33% of the falls that occurred without tripping or stumbling were because of getting up or sitting down [5]. Based on this information and his experiences through his own research Prof. Ojeda has determined that studying the correlation between sitting to standing transitions and LOBs (an early sign of motor deterioration that might lead to more falls in the future) is important. The current setup (Figure 1) of Inertial Measurement Units (IMUs) they are using fails to provide accurate information to determine whether a test subject is sitting or standing, or the transition between the two. The main reason for this is the placement of the IMUs; there are two located on each foot attached to the shoelaces, one attached to the wrist and one on the waist of the test subject. The data from the sensors can accurately determine when a LOB occurs. However, the exact orientation of the body cannot be determined from the sensors with precision, and therefore it cannot be determined whether the patient is seated or standing up. This is why we were asked to develop a sensor. For that reason Prof. Ojeda needs our team to help develop a sensor, device or a method to detect sitting to standing transitions. The solution we have to develop will be an addition to the existing setup of sensors, and not a replacement. This is an important part of our problem definition as it limits our scope. At the end if the solution we develop can be successfully implemented into Prof. Ojeda’s research, it will be imperative in determining whether a test subject is sitting or standing when a LOB occurs. With the data obtained from other sensors Prof. Ojeda’s team will be able to successfully analyze and understand the correlation between sitting to standing transitions and LOBs in daily life of elderly people.
4
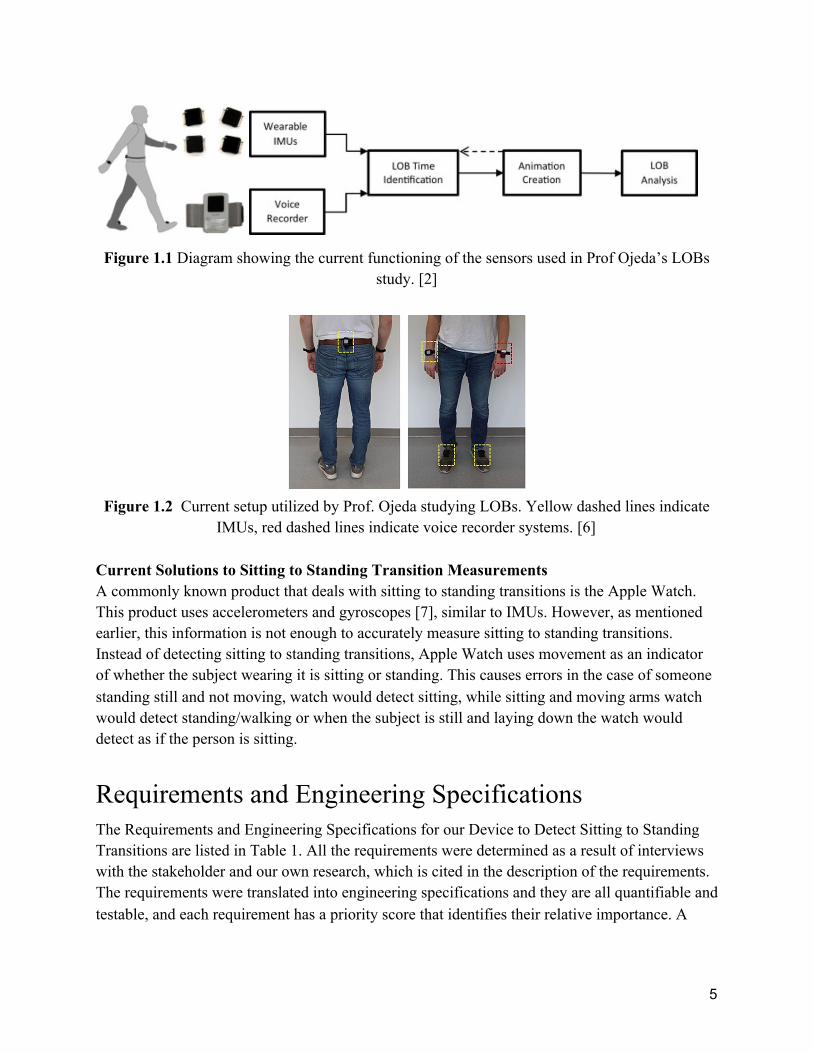
Figure 1.1 Diagram showing the current functioning of the sensors used in Prof Ojeda’s LOBs study. [2]
Figure 1.2 Current setup utilized by Prof. Ojeda studying LOBs. Yellow dashed lines indicate
IMUs, red dashed lines indicate voice recorder systems. [6]
Current Solutions to Sitting to Standing Transition Measurements A commonly known product that deals with sitting to standing transitions is the Apple Watch. This product uses accelerometers and gyroscopes [7], similar to IMUs. However, as mentioned earlier, this information is not enough to accurately measure sitting to standing transitions. Instead of detecting sitting to standing transitions, Apple Watch uses movement as an indicator of whether the subject wearing it is sitting or standing. This causes errors in the case of someone standing still and not moving, watch would detect sitting, while sitting and moving arms watch would detect standing/walking or when the subject is still and laying down the watch would detect as if the person is sitting.
Requirements and Engineering Specifications
The Requirements and Engineering Specifications for our Device to Detect Sitting to Standing Transitions are listed in Table 1. All the requirements were determined as a result of interviews with the stakeholder and our own research, which is cited in the description of the requirements. The requirements were translated into engineering specifications and they are all quantifiable and testable, and each requirement has a priority score that identifies their relative importance. A
5

detailed description and justification of Requirements, Priority Scores and Engineering Specifications is discussed below. Table 1: Requirements, Engineering Specifications and Priority Score for a Device to Detect Sitting to Standing Transitions.
Non Invasive As mentioned, our device is meant to be used by older adults, a fragile section of the population often subject to health conditions. Invasive or restrictive sensors might cause blood flow restrictions and further correlated medical complications such as bruising, dizziness, LOBs, or high blood pressure; therefore it is highly important that our solution is non invasive. Since this requirement directly affects the safety and health of the subjects using our device, we gave it the highest priority score (3 points). In order to achieve this, our device needs to leave no marks around the area it is placed after it is removed including but not limited to rash, stickiness due to tape, bruises etc. It should also cause 0 additional trips due to the placement of the device. This means that the addition of this extra
6
Requirement
Priority Score 1 (less important) to 3 (more
important)
Specification(s)
Non Invasive
3
Weight < 50g
0 permanent marks left
0 additional trips due to sensor
Durability 2 - Does not lose functionality after 1 year of use
- Support up to 300lbs
Current Consumption 2 ≤ 10 mA at 3.3V
Minimum Hardware
2
1 sensor added to the current setup
Dimension ≤ 3x3x0.5cm
Measure Short Kinematic Sequences
3 Sampling rate ≥ 100Hz
Price 1 ≤ $20 for 100 pieces
Success Rate 3 ≥ 95% (5% chance of failure)
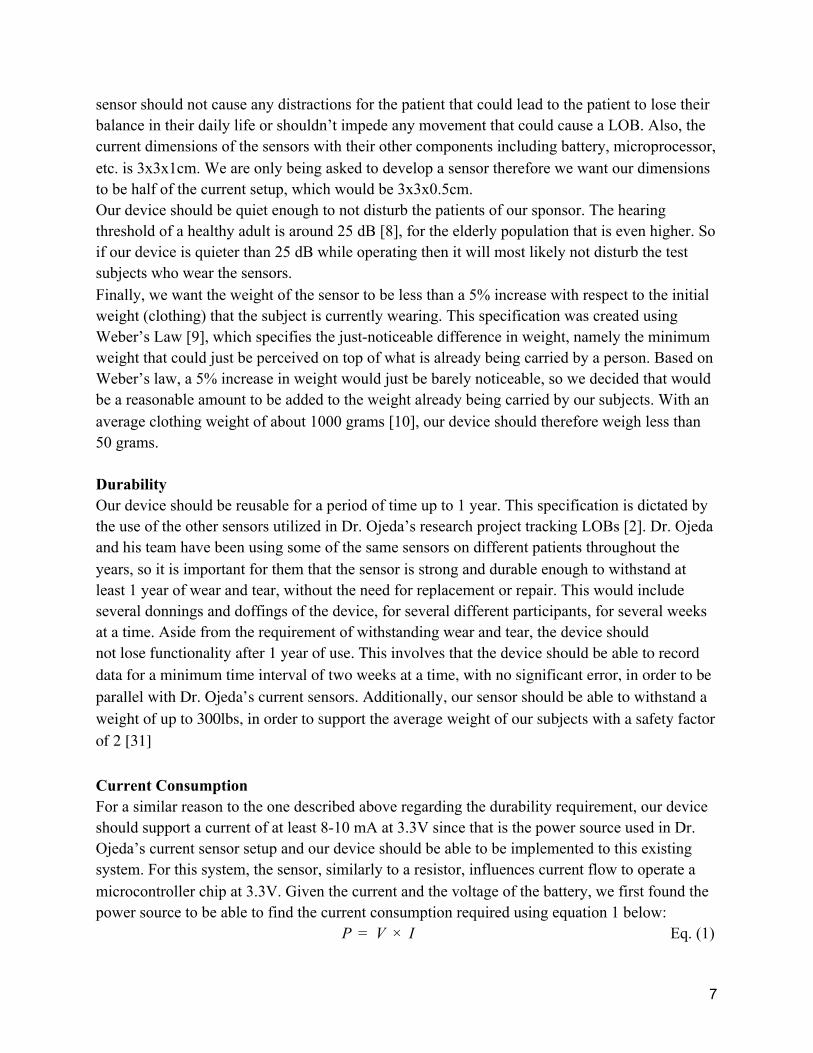
sensor should not cause any distractions for the patient that could lead to the patient to lose their balance in their daily life or shouldn’t impede any movement that could cause a LOB. Also, the current dimensions of the sensors with their other components including battery, microprocessor, etc. is 3x3x1cm. We are only being asked to develop a sensor therefore we want our dimensions to be half of the current setup, which would be 3x3x0.5cm. Our device should be quiet enough to not disturb the patients of our sponsor. The hearing threshold of a healthy adult is around 25 dB [8], for the elderly population that is even higher. So if our device is quieter than 25 dB while operating then it will most likely not disturb the test subjects who wear the sensors. Finally, we want the weight of the sensor to be less than a 5% increase with respect to the initial weight (clothing) that the subject is currently wearing. This specification was created using Weber’s Law [9], which specifies the just-noticeable difference in weight, namely the minimum weight that could just be perceived on top of what is already being carried by a person. Based on Weber’s law, a 5% increase in weight would just be barely noticeable, so we decided that would be a reasonable amount to be added to the weight already being carried by our subjects. With an average clothing weight of about 1000 grams [10], our device should therefore weigh less than 50 grams. Durability Our device should be reusable for a period of time up to 1 year. This specification is dictated by the use of the other sensors utilized in Dr. Ojeda’s research project tracking LOBs [2]. Dr. Ojeda and his team have been using some of the same sensors on different patients throughout the years, so it is important for them that the sensor is strong and durable enough to withstand at least 1 year of wear and tear, without the need for replacement or repair. This would include several donnings and doffings of the device, for several different participants, for several weeks at a time. Aside from the requirement of withstanding wear and tear, the device should not lose functionality after 1 year of use. This involves that the device should be able to record data for a minimum time interval of two weeks at a time, with no significant error, in order to be parallel with Dr. Ojeda’s current sensors. Additionally, our sensor should be able to withstand a weight of up to 300lbs, in order to support the average weight of our subjects with a safety factor of 2 [31] Current Consumption For a similar reason to the one described above regarding the durability requirement, our device should support a current of at least 8-10 mA at 3.3V since that is the power source used in Dr. Ojeda’s current sensor setup and our device should be able to be implemented to this existing system. For this system, the sensor, similarly to a resistor, influences current flow to operate a microcontroller chip at 3.3V. Given the current and the voltage of the battery, we first found the power source to be able to find the current consumption required using equation 1 below:
V IP = × Eq. (1)
7

where P is the power required to operate the device (watt) , V is the voltage (V), and I is the current required to operate the device (mA). We computed the power source to be equal to 0.0264 - 0.033 watts. From the power computed we then calculated the current consumption for 10-12.5 hours using equation 2 below:
Ia = ( PV ) t Eq. (2)
Where is the current consumption (mAh), t is the time the current consumption (hours). WeIa used both 10 and 12 hours to compute the current consumption from both power sources and we calculated the current consumption should be in the range of 80-125 mAh. Our device should match the battery life of the sensors currently employed in tracking LOBs in Dr. Ojeda’s research project [2]. The subject wearing the equipment should be able to charge all of the devices (including our sensor) during the night, and use it throughout an entire work-day without needing to recharge the batteries, an 8-10 mA current consumption with a 80-125 mAh battery would provide a daily lifetime of around 10-12.5 hours for our sensor. Minimum Hardware Considering the current setup utilized in Dr. Ojeda’s research, which includes 4 IMUs and 1 voice recorder [2], we considered it necessary to limit the amount of additional hardware to a maximum of 1 sensor. We arrived at this conclusion after input from Dr. Ojeda and the feedback he received from his patients. Measure Short Kinematic Sequences Sitting to standing transitions for older adults occur in 3-4 seconds and they have previously been studied with a sampling rate of 100Hz [11]. We need to make sure that our frequency is at least 100Hz, so that we can capture such a short kinematic sequence with accuracy and precision. After the data is collected with a sampling rate of 100Hz over a period of time, Dr. Ojeda and his team will be allowed to view the data as low as 1Hz to determine whether a person is sitting or standing at a given time throughout the day. Figure 2 below on pg. 8. shows the sit to stand transition of an elderly population with an average age of 73.8 sampled at 100 samples per second [11]. In the demonstration for Figure 2, the IMU was placed on the waist area of the patient. Although this demonstration shows a sit to stand transition of the patients, it focuses on the upper body muscle strength and how it changes when a person transitions from sitting to standing rather than the movement of a patient’s feet/legs, therefore it cannot detect how long a person has been sitting or standing.
8

Figure 2 shows the sit to stand transition on an elderly population. This data measured
acceleration and angular velocity with respect to time at a rate of 100 samples per second. The green dashed line shows the acceleration and angular velocity in the mediolateral direction, the
red line demonstrates the movements in the anteroposterior direction, while the blue line represents the movements in the vertical direction. This data shows that the average elderly
person transitioned from full sitting to standing in approximately 3.5 seconds. The main phases of sit to stand movement are separated by the gray vertical lines [6].
Price Our device should be able to be manufactured for a price of ≤ $20. This requirement is not extremely important, as shown by the Priority Score of 1, since the initial project budget is actually $400. However, an economically competitive sensor should be cheaper when bought in bulk by Dr. Ojeda’s lab. Success Rate The success rate for our sensor is very important and therefore given a 3 for priority. Dr. Ojeda’s research of the current sensors they use has a 100% success rate, meaning they can accurately detect all losses of balance of elderly people in their daily lives. However, he understands that this is our beginning stages in developing a new device to detect sitting to standing transitions and will be satisfied with a success rate of 95% or better.
9

Concept Generation / Development Brainstorming
After thoroughly identifying and researching the requirements of this project, we began the process of exploring the ideation space. We initially began the concept generation process by identifying as many potential problem solutions as possible, which led to us generating a total of 40 concepts. We focused on generating a large number of different applications to solve the problem, without concentrating on a particular solution or throwing away solutions we thought were unachievable. Our concepts ranged from proximity, heart rate, and blood pressure sensors; force measuring devices; smart jewelry; mobile applications; and participant input.
Concepts were developed through brainstorming sessions that had no limits, in order to get the most diverse and populated set of ideas as possible. We tried to do a divergent concept generation to create a multitude of options. As a team we began forming ideas individually, and effectively. After each team member came up with some concepts, we then collaborated as a group to encourage the most wild ideas, build on each other’s ideas, and think of as many concepts as possible - though still having one conversation at a time to help stay focused. The collaborative brainstorming session was very effective in generating ideas that feed off of other team members’ concepts.
We then used a mind map to converge the concepts that were similar and to group the ones that were more realistic. We developed a mind map with 4 respective groups which include: device that measures force exerted, position displacement angle, device that measures orientation, and device that measures height. We used this approach in order to have the widest range of feasible concepts to select from. By considering as many diverse concepts as possible, our group was able to come up with innovative and efficient designs.
Morphological Analysis
After our concept generation, we used a Morphological Analysis technique for concept development, where we generated a morphological chart that focused on six potential functions and different options for each function to generate even more ideas that we could potentially add on to our mind map.
10
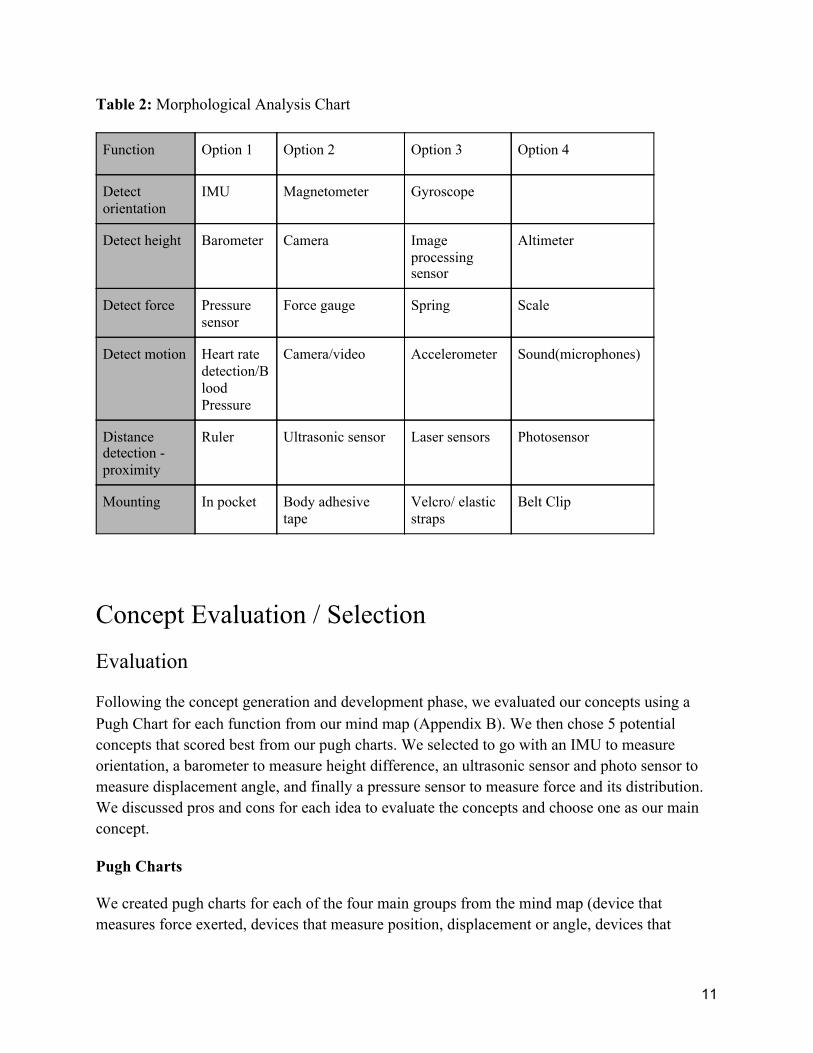
Table 2: Morphological Analysis Chart
Concept Evaluation / Selection
Evaluation
Following the concept generation and development phase, we evaluated our concepts using a Pugh Chart for each function from our mind map (Appendix B). We then chose 5 potential concepts that scored best from our pugh charts. We selected to go with an IMU to measure orientation, a barometer to measure height difference, an ultrasonic sensor and photo sensor to measure displacement angle, and finally a pressure sensor to measure force and its distribution. We discussed pros and cons for each idea to evaluate the concepts and choose one as our main concept.
Pugh Charts
We created pugh charts for each of the four main groups from the mind map (device that measures force exerted, devices that measure position, displacement or angle, devices that
11
Function Option 1 Option 2 Option 3 Option 4
Detect orientation
IMU Magnetometer Gyroscope
Detect height Barometer Camera Image processing sensor
Altimeter
Detect force Pressure sensor
Force gauge Spring Scale
Detect motion Heart rate detection/Blood Pressure
Camera/video Accelerometer Sound(microphones)
Distance detection - proximity
Ruler Ultrasonic sensor Laser sensors Photosensor
Mounting In pocket Body adhesive tape
Velcro/ elastic straps
Belt Clip
measures orientation, and devices that measure height) to be able to evaluate the pros and cons of concepts within each group and converge to a smaller number of ideas.
Device that Measures Orientation
The first group consisted of devices that measure orientation. Each option was evaluated based on criteria that refer to the requirements previously listed. Each criterion has a weight that refers to the priority score of the respective requirement.
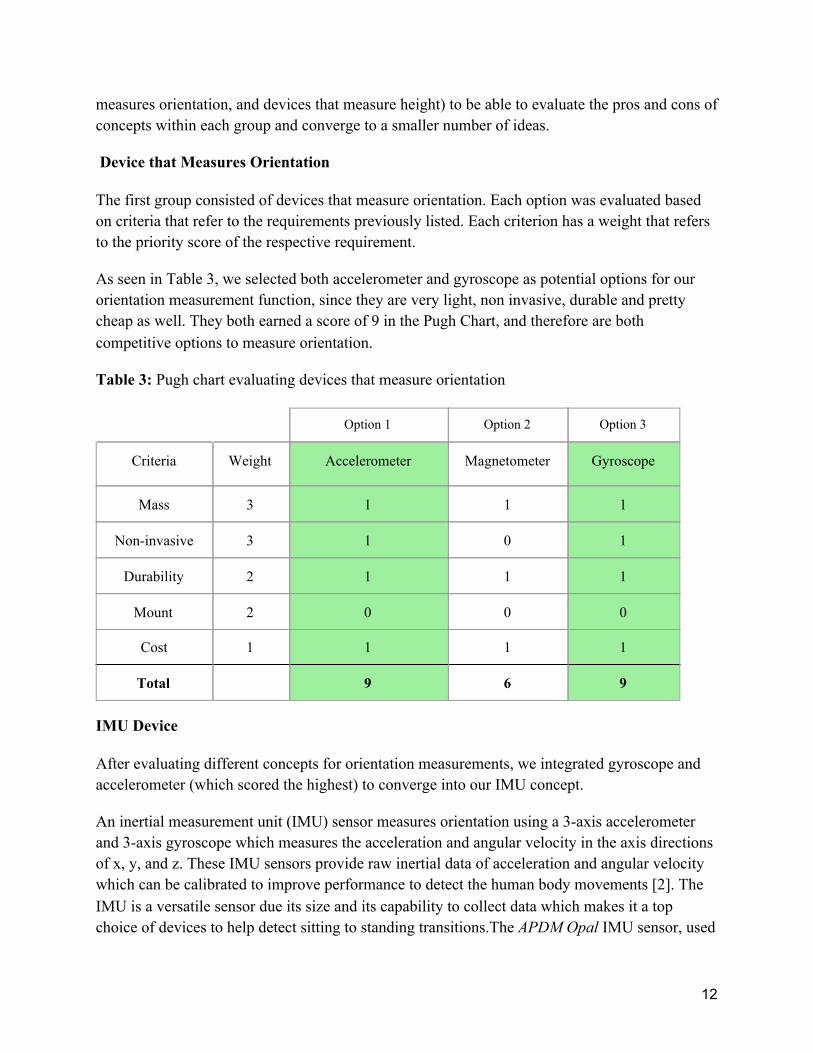
As seen in Table 3, we selected both accelerometer and gyroscope as potential options for our orientation measurement function, since they are very light, non invasive, durable and pretty cheap as well. They both earned a score of 9 in the Pugh Chart, and therefore are both competitive options to measure orientation.
Table 3: Pugh chart evaluating devices that measure orientation
IMU Device
After evaluating different concepts for orientation measurements, we integrated gyroscope and accelerometer (which scored the highest) to converge into our IMU concept.
An inertial measurement unit (IMU) sensor measures orientation using a 3-axis accelerometer and 3-axis gyroscope which measures the acceleration and angular velocity in the axis directions of x, y, and z. These IMU sensors provide raw inertial data of acceleration and angular velocity which can be calibrated to improve performance to detect the human body movements [2]. The IMU is a versatile sensor due its size and its capability to collect data which makes it a top choice of devices to help detect sitting to standing transitions.The APDM Opal IMU sensor, used
12
Option 1 Option 2 Option 3
Criteria Weight Accelerometer Magnetometer Gyroscope
Mass 3 1 1 1
Non-invasive 3 1 0 1
Durability 2 1 1 1
Mount 2 0 0 0
Cost 1 1 1 1
Total 9 6 9

in the current setup, weighs less than 25 grams (including the battery) with dimensions of 43.7 x 39.7 x 13.7 mm [12]. These sensors have a sampling rate of up to 128 Hz and a range of +/−16g acceleration to measure subtle vibrations and +/−2000 deg/s angular rate gyroscope [12]. These features are well suited for our requirements of short kinematic sequences and minimum hardware devices.
During our team meeting, we decided the best place to mount the IMU device is the thigh/femur area of the leg since the thigh changes orientation from horizontal to a vertical position when a person transitions from sitting to standing. This demonstration is shown in Figure 3. The device would be mounted on the thigh using adjustable elastic straps.
Figure 3: The drawing on the left displays the placement of the IMU device on the thigh. As the person transitions from sitting to standing, the IMU changes orientation. The sketch on the right
shows an IMU device with a 3-axis accelerometer to measure acceleration and a 3-axis gyroscope to measure angular velocity.
Some limitations of using this device are when a person walks up the stairs, the knee bends, and the thigh changes orientation by about 70 degrees [13] which may increase the chances of a false positive. Another downside for this concept is mounting the IMU in the correct position so that it doesn’t move out of place during daily activities. In the current setup of Dr. Ojeda’s research for gait analysis and movement of the body, the IMUs are mounted on the shoelaces and secured using straps. However, using straps to secure the device on the thigh can alter the participant’s blood flow and may increase pressure and cause pain. Attaching the IMU to clothing or inserting it in a pocket will limit the risk of causing pain but the downside is that the sensor will have more room to move and turn therefore increasing the chance of false positives and noisy data.
Device that Measures Height
Table 4 shows the Pugh chart we used to converge our concepts for height measurements, and based on the score, a barometer was our best option, mainly for the fact that it is compact, non invasive, and durable. Camera and height gauge would be hard to mount if we want to utilize them for height measurements effectively for the purpose of our device, and they would also be more expensive, invasive, and heavy.
13
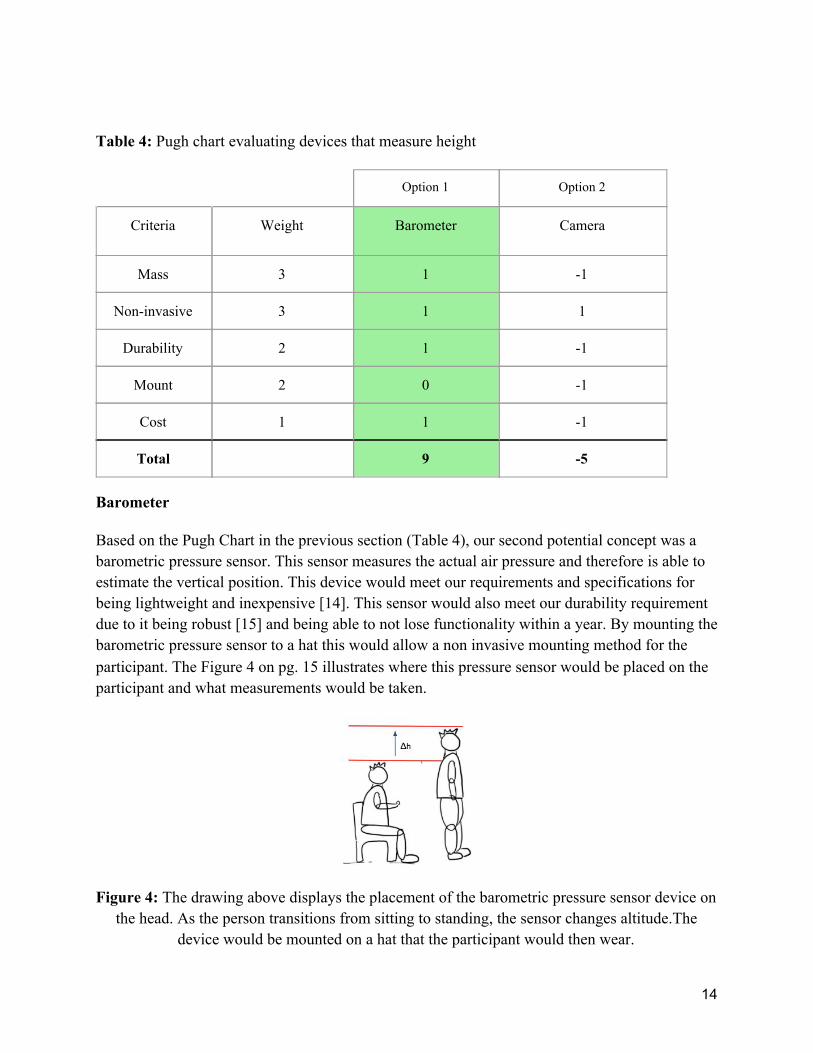
Table 4: Pugh chart evaluating devices that measure height
Barometer
Based on the Pugh Chart in the previous section (Table 4), our second potential concept was a barometric pressure sensor. This sensor measures the actual air pressure and therefore is able to estimate the vertical position. This device would meet our requirements and specifications for being lightweight and inexpensive [14]. This sensor would also meet our durability requirement due to it being robust [15] and being able to not lose functionality within a year. By mounting the barometric pressure sensor to a hat this would allow a non invasive mounting method for the participant. The Figure 4 on pg. 15 illustrates where this pressure sensor would be placed on the participant and what measurements would be taken.
Figure 4: The drawing above displays the placement of the barometric pressure sensor device on the head. As the person transitions from sitting to standing, the sensor changes altitude.The
device would be mounted on a hat that the participant would then wear.
14
Option 1 Option 2
Criteria Weight Barometer Camera
Mass 3 1 -1
Non-invasive 3 1 1
Durability 2 1 -1
Mount 2 0 -1
Cost 1 1 -1
Total 9 -5

There are, however, limitations with this potential concept. A barometric pressure sensor has height estimation eros such as electric noise, temperature changes, weather changes, and/or sudden air flow(e.g. door opening) [16]. There is also resolution and noise from a barometric pressure sensor due to small changes in height. The average person will bend forward between 2-4000 times each day [17]; therefore, this device also has a potential to provide false positives if the participant were to bend down.
Device that Measures Position, Displacement or Angle
For the function of measuring displacement angle, we evaluated our different concepts and got good scores for several ones as shown in Table 5 on pg. 16: ultrasonic sensor, inclinometer and photosensor. Option 2 considers the inclinometer function of an accelerometer, which was already included and selected in a previous Pugh chart. We included it in this one as well because of the overlapping function. Ultrasonic sensor and photo sensor are both proximity sensors with different advantages and disadvantages that could accomplish the same function. Both earned a score of 9 in the Pugh Chart and are therefore competitive options to measure position.
Table 5: Pugh chart evaluating devices that measure position, displacement, or angles
Photosensor
Based on the Pugh Chart presented in the previous paragraph (Table 5), another potential concept our team considered is a light sensitive photoresistor, also known as LDS (light-dependent resistor). Its resistance decreases when light increases [18], so mounted on the back pocket (Figure 5.1 and 5.2) it would be able to detect light when standing, but not when sitting.
15
Option 1 Option 2 Option 3
Criteria Weight Ultrasonic Sensor
Inclinometer Photosensor
Mass 3 1 1 1
Non-invasive 3 1 1 1
Durability 2 1 1 1
Mount 2 0 0 0
Cost 1 1 1 1
Total 9 9 9

Figure 5.1 Mounting location of the photosensor on the participant
Figure 5.2 When mounted on the back pocket, the photoresistor would detect light when standing (left picture), and no light when sitting (right picture)
However, there are some drawbacks connected to this solution. In fact, this device could not work in the dark, as the photoresistor would detect no light regardless of the position of the subject. Also, if we had a scenario with for example a glass chair, or any material that lets in light then light would be detected even in the sitting position. On top of that, this sensor would also be pretty uncomfortable and therefore potentially considered invasive when mounted in the back pocket. In some cases, it would be challenging to mount the sensor in this location, as not every type of clothing allows for a device to be mounted in the area selected. We would like our device to be as inclusive as possible, therefore if this sensor was to be selected for further development, different locations and mounting methods would have to be explored. Ultrasonic Sensor
Ultrasonic Sensor is another device that was considered as a potential concept based on the Pugh Chart presented in the previous paragraph, Page 15 (Table 5).
An ultrasonic sensor is a highly reliable instrument that senses proximity and detects displacement. An ultrasonic sensor measures the distance to an object or target using ultrasonic waves [19]. As seen in Figure 6 below, the transducer of the sensor sends an ultrasonic pulse and then receives the echo, acting similar to a microphone. The way the sensor is able to detect the distance between an object or target is by calculating the time and speed between the sending and
16

receiving of the ultrasonic pulse. Therefore, with this sensor, we are able to meet the requirements of our sponsor, Dr. Ojeda, as this sensor is capable of detecting the transition between sitting to standing.
As a team we discussed several mounting location possibilities, such as a sensor on the shoulder and knee, upper back, and back pocket, but decided the back pocket would provide the most accurate data. When mounting a sensor to the back pocket of the participant, and they sit down, the distance between them and the surface will get smaller, and the opposite thing will occur when they stand up, enabling us to identify when a transition between sitting to standing occurred, as shown in Figure 6 below.
Figure 6: The figure on the left shows how an Ultrasonic Sensor transmits ultrasonic waves by using a transducer and then receives the echo, allowing the sensor to determine the distance
between an object or target. The drawing on the right shows the mounting location of the sensor on the participant.
Our team did not encounter many downsides when discussing the ultrasonic sensor concept. However, one potential issue with this concept is a person may be leaning on the wall and in that case the data received from the sensor may be falsely interpreted when computing sitting to standing transitions. Another potential issue is that the ultrasonic sensor is affected by sensing accuracy with soft materials. Therefore, if a participant is sitting on a chair that is covered in soft fabric, the data collected may generate a false positive or negative when computing the sitting to standing transitions. Soft fabric absorbs more sound waves which makes it hard for the sensor to detect the displacement of the target [20]. Lastly, The device in the back pocket also may be uncomfortable for the participant throughout the day. These potential issues were not significant enough to deter us from selecting this concept for further exploration and development.
Device that Measures Force Distribution
For a device that measures force distribution, we used a pugh chart shown on Table 6 pg.19 to evaluate different options such as a pressure sensor, force gauge, spring, and a scale. The
17
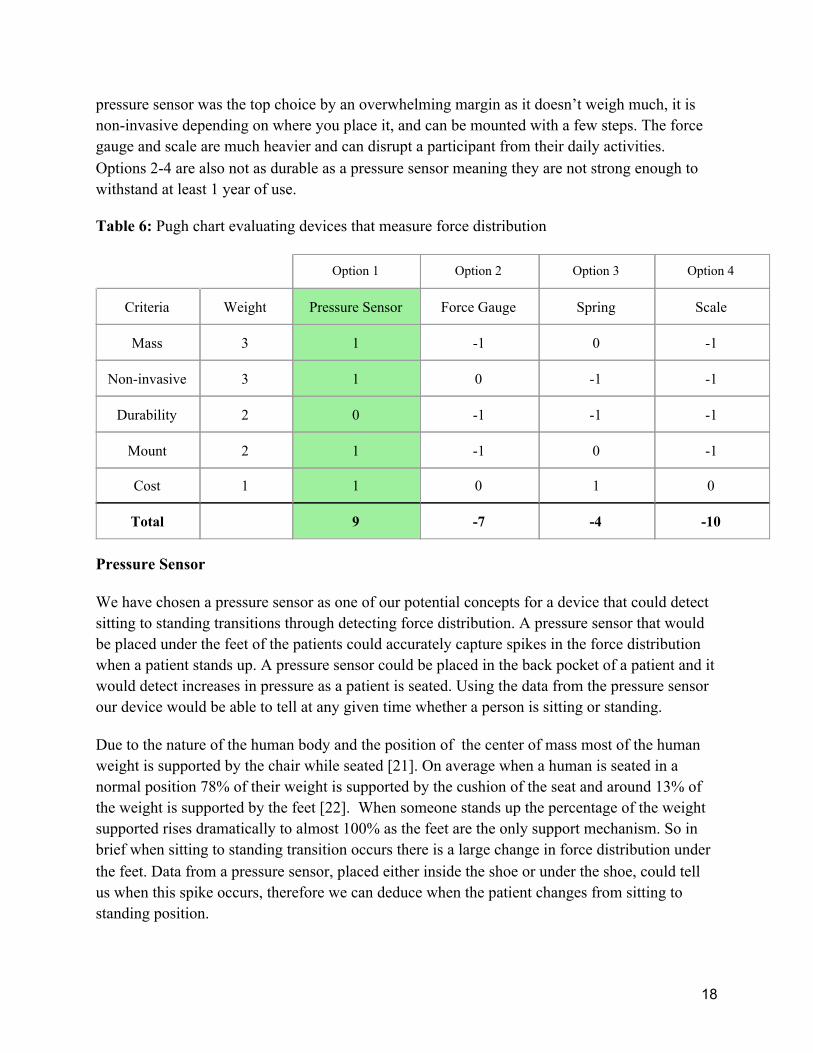
pressure sensor was the top choice by an overwhelming margin as it doesn’t weigh much, it is non-invasive depending on where you place it, and can be mounted with a few steps. The force gauge and scale are much heavier and can disrupt a participant from their daily activities. Options 2-4 are also not as durable as a pressure sensor meaning they are not strong enough to withstand at least 1 year of use.
Table 6: Pugh chart evaluating devices that measure force distribution
Pressure Sensor
We have chosen a pressure sensor as one of our potential concepts for a device that could detect sitting to standing transitions through detecting force distribution. A pressure sensor that would be placed under the feet of the patients could accurately capture spikes in the force distribution when a patient stands up. A pressure sensor could be placed in the back pocket of a patient and it would detect increases in pressure as a patient is seated. Using the data from the pressure sensor our device would be able to tell at any given time whether a person is sitting or standing.
Due to the nature of the human body and the position of the center of mass most of the human weight is supported by the chair while seated [21]. On average when a human is seated in a normal position 78% of their weight is supported by the cushion of the seat and around 13% of the weight is supported by the feet [22]. When someone stands up the percentage of the weight supported rises dramatically to almost 100% as the feet are the only support mechanism. So in brief when sitting to standing transition occurs there is a large change in force distribution under the feet. Data from a pressure sensor, placed either inside the shoe or under the shoe, could tell us when this spike occurs, therefore we can deduce when the patient changes from sitting to standing position.
18
Option 1 Option 2 Option 3 Option 4
Criteria Weight Pressure Sensor Force Gauge Spring Scale
Mass 3 1 -1 0 -1
Non-invasive 3 1 0 -1 -1
Durability 2 0 -1 -1 -1
Mount 2 1 -1 0 -1
Cost 1 1 0 1 0
Total 9 -7 -4 -10

Some challenges with using a pressure sensor attached to the foot of the test subjects are determining the optimal size of pressure sensor that needs to be used, as well as the placement of the sensor under the foot. There are full sized sensors that cover the whole surface of the feet inside the shoe sole, such a sensor could give us a very accurate force distribution since it creates a pressure map of the whole foot. But those sensors don’t fall in our price range set by our sponsor. Full-sized sensors are also much larger than the size requirement we have set after our meetings with Dr. Ojeda, so we would have to consult with our sponsor to see if this sensor could be considered to benefit from its high accuracy. Also pressure sensors placed under the foot might have some issues due to the long periods of constant force being applied, and losing some of its accuracy over lifetime. We would have to make sure that the sensor doesn’t need constant calibration to capture accurate measurements, and the data is precise throughout the duration of each experiment with the patients, which is about 2 weeks.
In order to have a more inclusive concept the pressure sensor could also be placed in the back pocket of a subject/patient and the change in force distribution when sitting to standing transition occurs can be analyzed. But there are more challenges if the pressure sensor were to be placed in the back pocket of a patient. Weight shifting, asymmetric sitting due to items placed in back pockets or medical conditions such as scoliosis, or movement of the buttocks to adjust position would all make it harder to accurately capture and analyze data from the pressure sensor placed in the back pocket. Also leaning on a wall could lead to false-negatives due to the force distribution on the buttocks.
So we think due to the challenges associated with attaching a pressure sensor to the back pocket of patients, utilizing the pressure sensor under the foot is a more accurate and precise approach. So we will consider the pressure sensor as an option that will be attached to the foot and placed in the shoe.
Selection
We placed all 4 potential concept options(5 including both ultrasonic sensor and photosensor) into a pugh chart to be evaluated against each other. In Table 7 these top concepts were compared against the same criteria from the previous pugh charts, which is from our requirements and specifications. The weights for the criteria were also the same as the pugh charts above and correspond to the prioritization of our requirements and specifications.
19

Table 7: Pugh chart evaluating all potential concepts
From the pugh chart, we found that the IMU and pressure sensor are both very competitive options. The IMU had a lower score on mounting due to having to use tape or a band around the thigh of the participant which could lead to some complications for the participant as stated above in the IMU Device section. The pressure sensor had a better score for mounting compared to the IMU because by placing the sensor in the sole of the shoe, this would be a relatively safer and more effective option for the participant. The pressure sensor, however, scored lower on the durability criteria compared to the IMU. This difference in score is because placing the pressure sensor in the sole of the participants shoe means that the sensor would have to experience the participants weight stepping down on it everyday that it was worn. As seen from Table 7 both the IMU and pressure sensor scored a total of 11. Our team presented this information to our ME 450 class and professor to request feedback and advice for what other criteria we might consider in order to determine which design concept outweighs the others.
From our discussion with our class section we were able to get some good feedback on additional criteria to add to our pugh chart so we could better distinguish which concept was better. Table 8 shows the same pugh chart as above, but with the additional criteria of innovation.
20
Option 1 Option 2 Option 3 Option 4
Criteria Weight IMU Barometer Ultrasonic Sensor
Photosensor Pressure Sensor
Mass 3 1 1 1 1 1
Non-invasive 3 1 0 0 0 1
Durability 2 1 0 -1 -1 0
Mount 2 0 0 0 0 1
Success rate 2 1 0 0 -1 1
Cost 1 1 1 1 1 1
Total 11 4 2 0 11

Table 8: Pugh chart evaluating all potential concepts with additional criteria
By adding innovation to our pugh chart criteria, the pressure sensor achieved a higher total score compared to the IMU. A main reason for this was innovation, because our stakeholder has only IMU sensors in his current design, adding another IMU wouldn’t have been a very creative option. Also in our meetings Dr. Ojeda had mentioned that they had previously tried utilizing IMUs to detect sitting to standing transitions but they weren’t satisfied with the data they got, yet he had also mentioned that they were still open to a novel idea of using an IMU therefore we still considered it as a concept option. However, coming up with a design concept that involves a pressure sensor in the sole of the participants shoe is something that our stakeholder has never tried before and therefore is a more innovative solution. Table 8 shows that the pressure sensor has a higher score of 12, compared to the IMU’s score of 10.
Pugh charts are a very effective method for evaluating and selecting design concepts; however, they have their limitations. The weights are subject to what our team finds to be most important. As seen in Tables 3-7, the end scores were most likely independent of the weights for each criteria because the potential concept that received the best score was much higher than the other comparative scores. In Table 8 this is not the case because even though the pressure sensor obtained the best score, it was only 2 points higher than the IMU concept. This shows that the final scores for these potential concepts could be dependent on the weights of the criteria. Our
21
Option 1 Option 2 Option 3 Option 4
Criteria Weight IMU Barometer Ultrasonic Sensor
Photosensor Pressure Sensor
Mass 3 1 1 1 1 1
Non-invasive 3 1 0 0 0 1
Durability 2 1 0 -1 -1 0
Mount 2 0 0 0 0 1
Success Rate
2 1 0 0 -1 1
Cost 1 1 1 1 1 1
Innovation 1 -1 -1 1 1 1
Total 10 3 3 1 12

team decided, for this reason, to further evaluate the IMU and pressure sensor potential concepts in order to ensure we choose the best concept moving forward.
As a team, we looked more into the inclusivity of our potential concepts. Talking with our stakeholder we got a better understanding of what the exclusion criteria is for the study, or who is not able to participate in the study. From that meeting we learned that participants can not have any amputation of limbs and must be wearing shoes when completing the study. This is because the purpose of our stakeholder’s study is to detect falls, and therefore there are already two IMU devices on the shoelaces of the shoes. The study also only includes patients that are 65 or older with a past record of falling, and there is no exclusion criteria for health conditions. From this information we looked at the comparison of how the IMU and pressure sensor potential concepts are inclusive to the subjects.
The IMU mounting uses either bands or tape to mount the device to the participant’s thigh. Tight bands or tape can be harmful to elderly patients [23]. Therefore, this mounting method would not be taking into account how fragile our patients are. Also, the elderly are likely to have health conditions that could be affected by this mounting method. Around 25% of those 65 and older have diabetes [24]. By disrupting circulation, diabetes causes insidious damage to blood vessels that feed the limbs, heart, kidneys, brain and eyes [25]. On the other hand, the pressure sensor being mounted in the sole of the shoe is very inclusive to these patients, knowing that the participants are required to wear shoes during the study. By placing the sensor in the sole of the shoe, it is not coming in contact with the individual, and therefore will not have any of the issues the IMU mounting method would have. We want to make sure we are being inclusive to all fragile patients that may have health conditions. Therefore our final design concept decision is to move forward with the more inclusive option, which is the pressure sensor mounted in the sole of the shoe.
Solution Development We developed our solution of using a pressure sensor to detect sitting to standing transitions by placing a pressure sensor on the sole of the shoe. We first conducted research to determine which type of pressure sensor will meet our requirements and specifications the best. Then, our team created a bill of materials (BOM) table with all the items purchased to conduct the engineering analysis. (Appendix C) Next, our team created a physical prototype that was tested with different variables such as size of the sensor, placement of the sensor, and using different seating options. Verification of our design results and evidence-based justification will be used to explain our design solution as well. Lastly, we will mention what lessons we learned from unsuccessful outcomes and what recommendations we have for the future, if a team were to continue on this project for our stakeholder.
22

Engineering Analysis / Solution Development
Sensor Selection
We started looking at different pressure sensors (or force sensitive resistors) for this project and we found several suppliers; some of the most promising were SparkFun, SingleTact and Tekscan. There are also other suppliers that offer full sole sensors, but due to dimension specifications we did not consider those. We ended up converging to Tekscan because it was the only one that offered sensors that could support up to 300lbs and therefore meet all of our requirements and specifications. Tekscan offers many different types of pressure sensors for different applications. From their list of force sensors [26], we excluded:
- The ones specifically meant for high temperatures or humidity, since our sensor is meant to be used in indoor settings
- The ones that could not support up to 300lbs - The ones that did not meet our dimension specifications
The sensors that were not excluded due to requirements were then considered for our project and are listed in the following Table 9. Table 9: The three Tekscan sensors that were considered after based on requirements and specifications [26]
23
Sensor Description Image Sensing Area
A201 Most popular standard sensor, can be trimmed
9.53 mm
A301 1 in. standard sensor. Also available in an enhanced ink variation (ESS301) for high humidity and heat applications.
9.53 mm

The A201 sensor is the most popular one, has a small sensing area, the length is adjustable, it supports up to 1000lbs, it is durable (≥ 3 million actuations), has an error of less than 3% of full scale and a quick response time (< 5µsec). The A301 sensor is very similar to A201, has the same sensing area and specifications in terms of functionality. It is meant for very high volume manufacturing and embedding in other products because of its compactness. The A401 sensor has a significantly larger sensing area than A201 and A301, still meeting our dimension requirements. It also supports up to 1000lbs, it is durable (≥ 3 million actuations), has an error of less than 3% of full scale and a response time of < 5µsec. We decided to experiment and test both A201 and A401 to see the impact the different sensing area has on the data. We excluded A301 because it is the same sensor as A201 in terms of functionality, and we preferred to experiment with A201 because it is very versatile, length is adjustable and we think it would help us to have a longer sensor in order to prototype on the shoe. It is also the most popular one for prototyping and we found a lot of information on how to calibrate it and use it.
24
A401 Large sensing area
5.40 mm
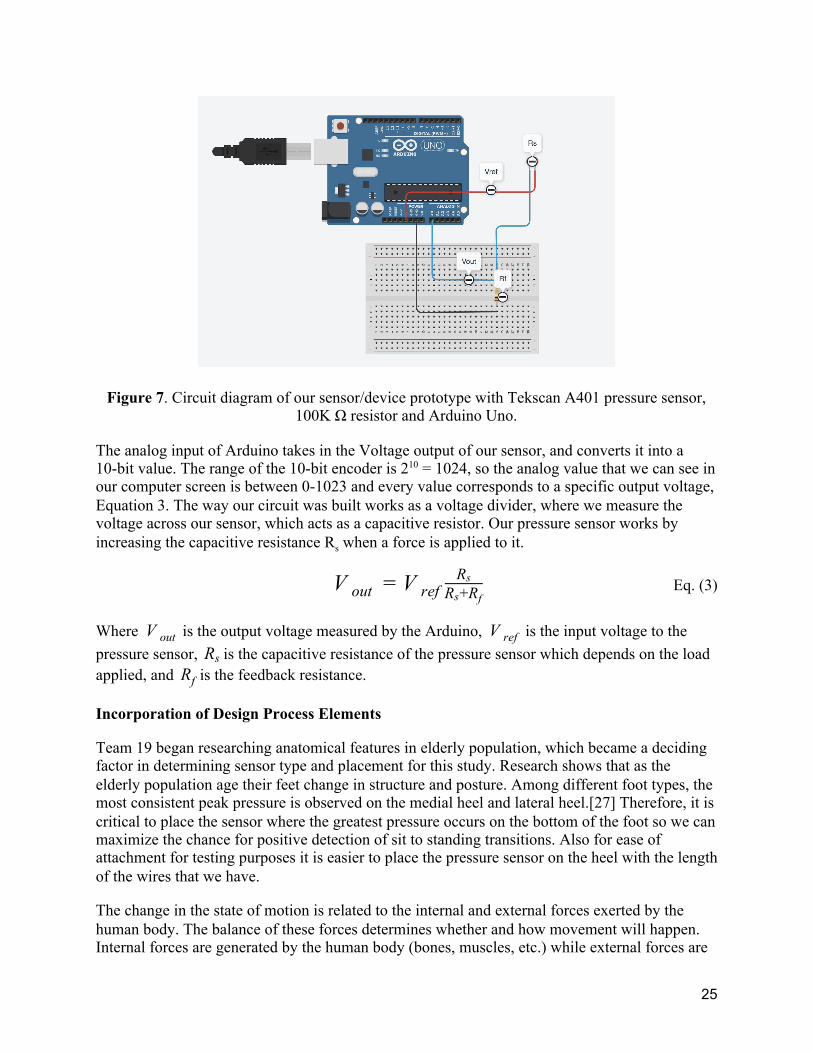
Figure 7. Circuit diagram of our sensor/device prototype with Tekscan A401 pressure sensor, 100K Ω resistor and Arduino Uno.
The analog input of Arduino takes in the Voltage output of our sensor, and converts it into a 10-bit value. The range of the 10-bit encoder is 210 = 1024, so the analog value that we can see in our computer screen is between 0-1023 and every value corresponds to a specific output voltage, Equation 3. The way our circuit was built works as a voltage divider, where we measure the voltage across our sensor, which acts as a capacitive resistor. Our pressure sensor works by increasing the capacitive resistance Rs when a force is applied to it.
V out = V refRs
R +Rs f Eq. (3)
Where is the output voltage measured by the Arduino, is the input voltage to the V out V ref pressure sensor, is the capacitive resistance of the pressure sensor which depends on the loadRs applied, and is the feedback resistance.Rf
Incorporation of Design Process Elements
Team 19 began researching anatomical features in elderly population, which became a deciding factor in determining sensor type and placement for this study. Research shows that as the elderly population age their feet change in structure and posture. Among different foot types, the most consistent peak pressure is observed on the medial heel and lateral heel.[27] Therefore, it is critical to place the sensor where the greatest pressure occurs on the bottom of the foot so we can maximize the chance for positive detection of sit to standing transitions. Also for ease of attachment for testing purposes it is easier to place the pressure sensor on the heel with the length of the wires that we have.
The change in the state of motion is related to the internal and external forces exerted by the human body. The balance of these forces determines whether and how movement will happen. Internal forces are generated by the human body (bones, muscles, etc.) while external forces are
25
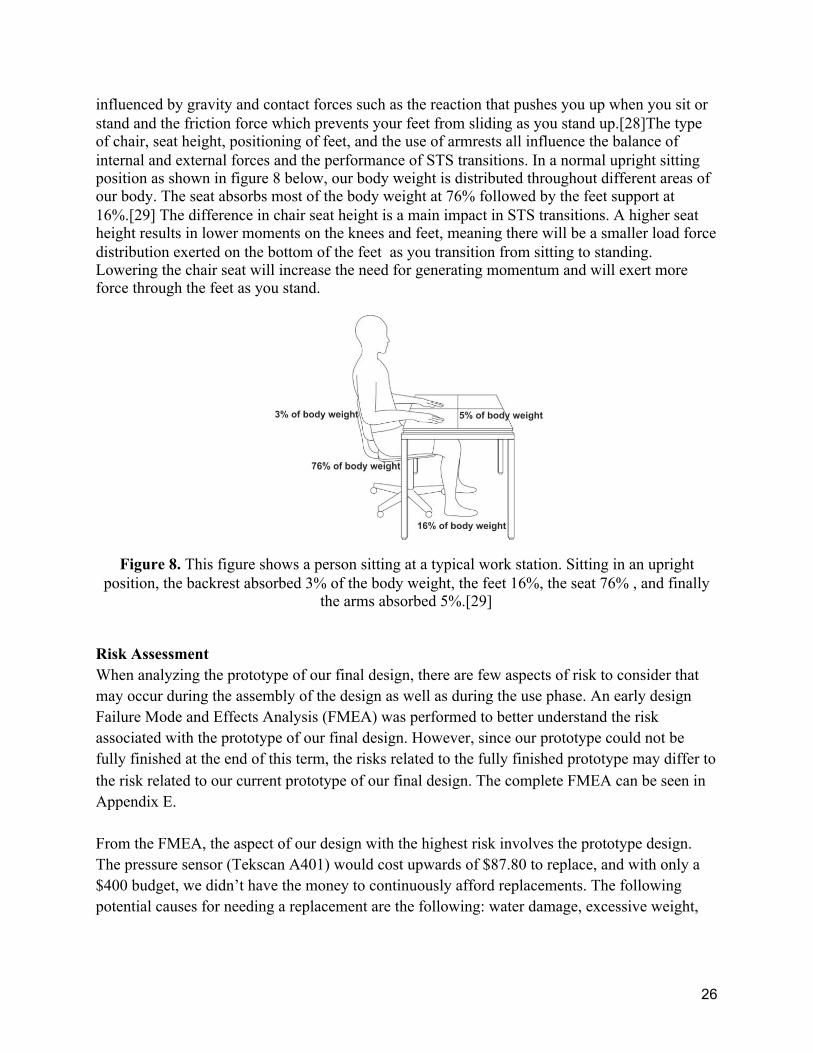
influenced by gravity and contact forces such as the reaction that pushes you up when you sit or stand and the friction force which prevents your feet from sliding as you stand up.[28]The type of chair, seat height, positioning of feet, and the use of armrests all influence the balance of internal and external forces and the performance of STS transitions. In a normal upright sitting position as shown in figure 8 below, our body weight is distributed throughout different areas of our body. The seat absorbs most of the body weight at 76% followed by the feet support at 16%.[29] The difference in chair seat height is a main impact in STS transitions. A higher seat height results in lower moments on the knees and feet, meaning there will be a smaller load force distribution exerted on the bottom of the feet as you transition from sitting to standing. Lowering the chair seat will increase the need for generating momentum and will exert more force through the feet as you stand.
Figure 8. This figure shows a person sitting at a typical work station. Sitting in an upright
position, the backrest absorbed 3% of the body weight, the feet 16%, the seat 76% , and finally the arms absorbed 5%.[29]
Risk Assessment When analyzing the prototype of our final design, there are few aspects of risk to consider that may occur during the assembly of the design as well as during the use phase. An early design Failure Mode and Effects Analysis (FMEA) was performed to better understand the risk associated with the prototype of our final design. However, since our prototype could not be fully finished at the end of this term, the risks related to the fully finished prototype may differ to the risk related to our current prototype of our final design. The complete FMEA can be seen in Appendix E. From the FMEA, the aspect of our design with the highest risk involves the prototype design. The pressure sensor (Tekscan A401) would cost upwards of $87.80 to replace, and with only a $400 budget, we didn’t have the money to continuously afford replacements. The following potential causes for needing a replacement are the following: water damage, excessive weight,
26

greater than average “wear and tear” by the participant, or mistakes made during assembly (i.e. circuit Board is not set up properly, incorrect components used). Since this device will be used mostly by the elderly population we had to analyze the risk associated during the use phase due to the fact the participant will wear this device for 8 to 10 hours a day for weeklong increments that may last 3 to 4 weeks. Therefore, during our analysis we had to consider that our device will be non invasive to the participant, causing no trips or falls. If this is not taken into account, incorrect mounting of the device, which may involve a wire hanging loose, the participant may trip or fall. Lastly, since this device will have to be charged everyday at the end of the day, the device must be easily detachable and reattachable without the manipulation of too many components. If this important step is neglected, data will be missed, and the device would be useless, thus creating a failure within the study. The likelihood of failure for our final prototype design is low, and the participants have been directed on the use and care of the device. Nevertheless, risks and possible failures should be addressed. If the device wears out, becomes water damaged, or is not mounted correctly, the occurrences of transitions from sitting to standing or loss of balance would be difficult, and usually impossible, to observe. Therefore, there are several checkpoints within the assembly and mounting process in place to ensure the correct use and monitoring of the device and data respectively. The first is to follow instructions on setting up the circuit board and all the components used and calibrated as recommended by the manufacturer, then how to mount the device on the shoe, and lastly to understand where misleading data may occur when processing the data for a software. Although this is an intricate and exhaustive process, the assembly and proper use of the device is integral to the success of data collection and analysis. When these checkpoints are completed and the safeguards are ensured, the overall risk of misuse or failure is minimized.
Verification To start the design verification process of our foot mounted pressure sensor we had to choose the optimal sensor to use the A201 sensor from Tekscan or the A401 sensor which had a larger contact area by a factor of approximately 7. When we started our testing and placed weights on the sensor, we found it to be increasingly difficult to concentrate the full load of our test weights on the smaller A201 sensor. We had to place a small circular cap on the pressure sensor itself and place our loads on top of the cap, to ensure that the full load of our test weights was distributed on our pressure sensor area. Concentrating the load evenly on the larger A401 sensor was easier due to the increased surface area. Therefore we thought that using the larger sensor would make our calibration easier, and therefore help us get better results, compared to the small
27
sensor where it would be harder to concentrate the full load of the weights used for calibration on the smaller sensing area. After proceeding with the sensor that we could currently calibrate, we tested our sensor with different resistor combinations in a trial and error process, to select the resistor to use with our sensor, given the load applied on the sensor and our design requirement. We found that a 1M Ω resistor was too high and it didn’t register loads in the 0-150 lbs range precisely enough, and large changes in the load caused small changes in the output voltage therefore making it harder for us to detect STS transitions. We then replaced the 1M Ω resistor with a 10k Ω resistor. Just to the contrary of the 1M Ω resistor, the 10k resistor made our circuit very responsive to even the slightest change of loads; this was because the 10k resistor was very small compared to the range of the capacitive resistor embedded in the pressure sensor. As a result of these failed attempts, given that we had a limited availability of resistors (10k, 100k and 1 MΩ) and the time constraint to build and test our prototype, we found the 100k Ω resistor to better fit our purpose. It gave us a more balanced voltage divider where the output voltage of the sensor under increasing loads was less noisy yet still sensitive enough for our range of loads. When we set the Rf value to 100,000 in our output voltage equation (Equation 3), we obtained Equation 4.
V out = V refRs
R +100000sEq. (4)
We then conducted our static testing with our pressure sensor to obtain our calibration curve. Our static testing consisted of applying loads varying from 5 to 90 lbs on our pressure sensor and obtaining a calibration curve that represents the correlation between the output voltage and the load applied. We conducted this test twice with different input voltages, Vref , from the Arduino, 5V and 3.3V. This was to better understand the effect of input voltage on the sensitivity of the pressure sensor.
28

Figure 9. Calibration curve showing the correlation between the applied load and the output voltage. The blue curve shows the input voltage of 3.3V and the orange curve represents the
input voltage of 5V, both curves were obtained with a 100 kΩ resistor in series with the sensor.
Figure 10. Calibration curves for A401 sensor from Tekscan. This figure confirms the
nonlinearity of the calibration curves we obtained through static testing.[30] Using these calibration curves with different input voltages, we think that a 5V reference voltage is more suitable for our application since it provides a larger range of output voltages given a large range of loads compared to the 3.3V input voltage. Therefore an input voltage of 5V will maximize the range of Vout values when a load is applied on the pressure sensor thereby giving us a better chance to detect STS transitions and provide a more accurate representation of increased load through the increased Vout and load range.
29
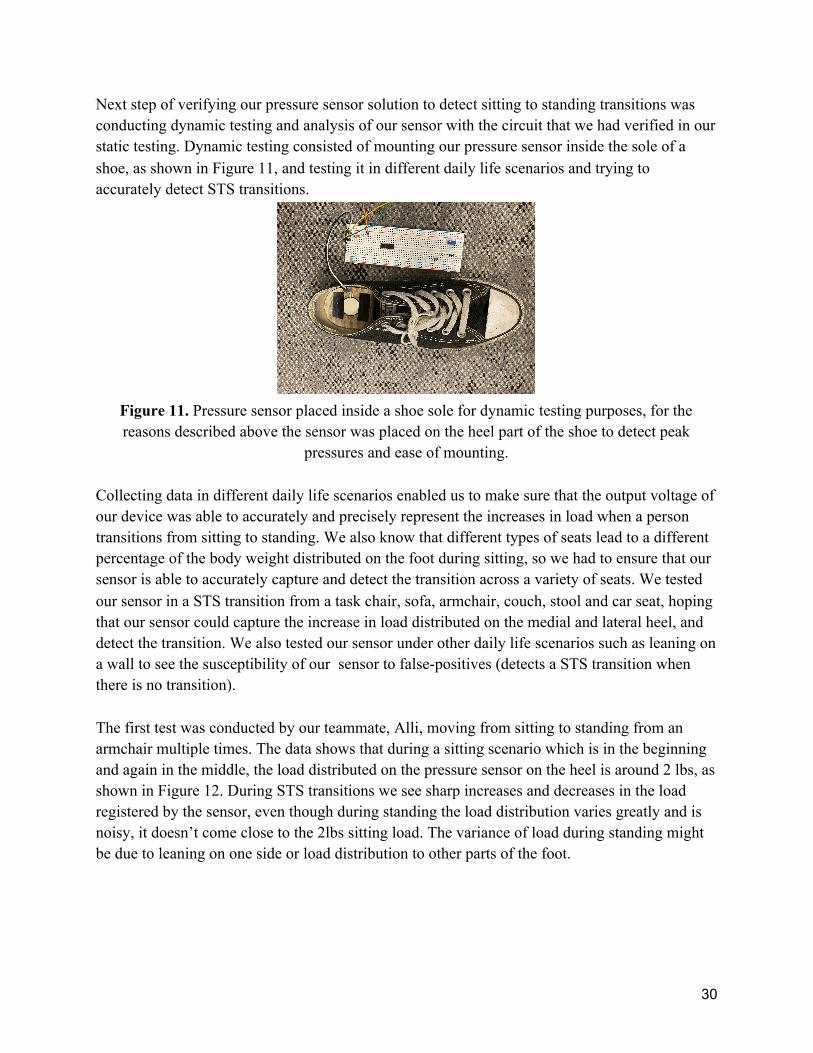
Next step of verifying our pressure sensor solution to detect sitting to standing transitions was conducting dynamic testing and analysis of our sensor with the circuit that we had verified in our static testing. Dynamic testing consisted of mounting our pressure sensor inside the sole of a shoe, as shown in Figure 11, and testing it in different daily life scenarios and trying to accurately detect STS transitions.
Figure 11. Pressure sensor placed inside a shoe sole for dynamic testing purposes, for the reasons described above the sensor was placed on the heel part of the shoe to detect peak
pressures and ease of mounting.
Collecting data in different daily life scenarios enabled us to make sure that the output voltage of our device was able to accurately and precisely represent the increases in load when a person transitions from sitting to standing. We also know that different types of seats lead to a different percentage of the body weight distributed on the foot during sitting, so we had to ensure that our sensor is able to accurately capture and detect the transition across a variety of seats. We tested our sensor in a STS transition from a task chair, sofa, armchair, couch, stool and car seat, hoping that our sensor could capture the increase in load distributed on the medial and lateral heel, and detect the transition. We also tested our sensor under other daily life scenarios such as leaning on a wall to see the susceptibility of our sensor to false-positives (detects a STS transition when there is no transition). The first test was conducted by our teammate, Alli, moving from sitting to standing from an armchair multiple times. The data shows that during a sitting scenario which is in the beginning and again in the middle, the load distributed on the pressure sensor on the heel is around 2 lbs, as shown in Figure 12. During STS transitions we see sharp increases and decreases in the load registered by the sensor, even though during standing the load distribution varies greatly and is noisy, it doesn’t come close to the 2lbs sitting load. The variance of load during standing might be due to leaning on one side or load distribution to other parts of the foot.
30

Figure 12. Load distributed on the pressure sensor when a STS occurs transition from an
armchair. Test subject moves from sitting to standing back to sitting then to standing again.
The next test was conducted from sitting to standing from a car multiple times. In our next scenario, we tested our solution in a different seating environment that people use a lot in their daily lives: the driver seat. The test setup: placement of the sensor in the shoe, reference voltage, etc. was kept the same.The data yielded a load distribution on the pressure sensor on the heel to be around 0.75 lbs when sitting down and a sharp increase up to 18 lbs when standing up, as shown in Figure 13. The variance of load during standing might be due to leaning on one side or load distribution to other parts of the foot.
31
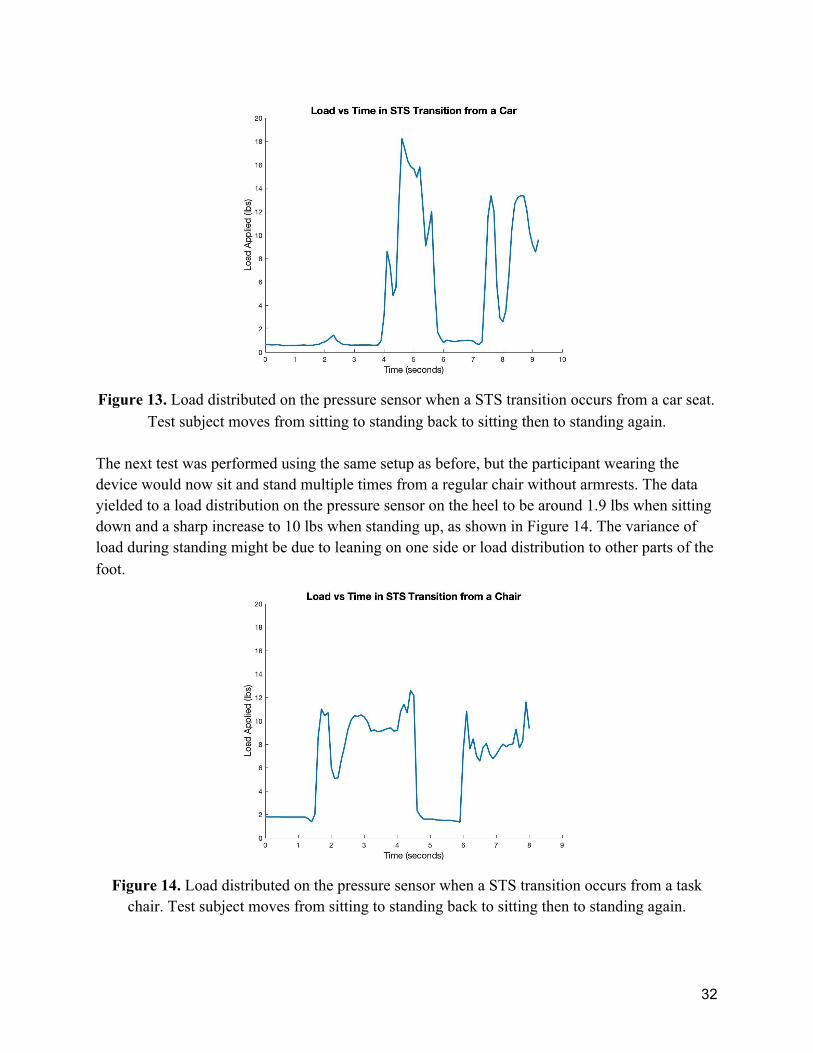
Figure 13. Load distributed on the pressure sensor when a STS transition occurs from a car seat.
Test subject moves from sitting to standing back to sitting then to standing again.
The next test was performed using the same setup as before, but the participant wearing the device would now sit and stand multiple times from a regular chair without armrests. The data yielded to a load distribution on the pressure sensor on the heel to be around 1.9 lbs when sitting down and a sharp increase to 10 lbs when standing up, as shown in Figure 14. The variance of load during standing might be due to leaning on one side or load distribution to other parts of the foot.
Figure 14. Load distributed on the pressure sensor when a STS transition occurs from a task
chair. Test subject moves from sitting to standing back to sitting then to standing again.
32
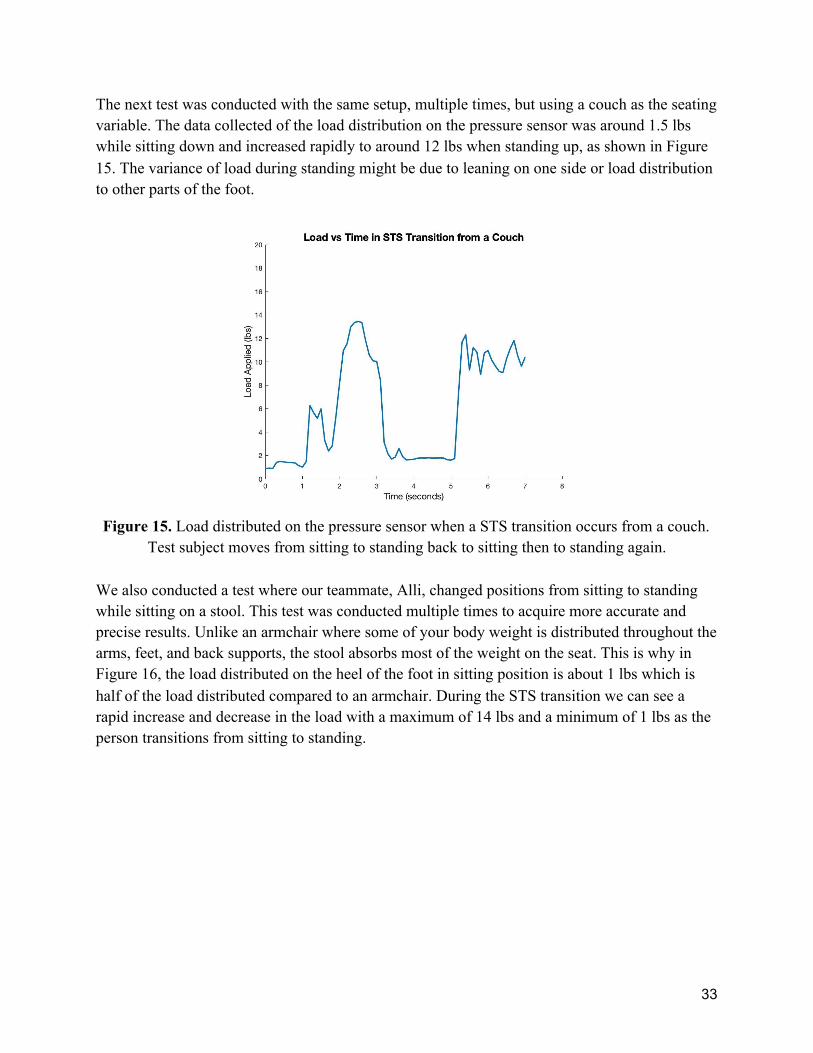
The next test was conducted with the same setup, multiple times, but using a couch as the seating variable. The data collected of the load distribution on the pressure sensor was around 1.5 lbs while sitting down and increased rapidly to around 12 lbs when standing up, as shown in Figure 15. The variance of load during standing might be due to leaning on one side or load distribution to other parts of the foot.
Figure 15. Load distributed on the pressure sensor when a STS transition occurs from a couch.
Test subject moves from sitting to standing back to sitting then to standing again. We also conducted a test where our teammate, Alli, changed positions from sitting to standing while sitting on a stool. This test was conducted multiple times to acquire more accurate and precise results. Unlike an armchair where some of your body weight is distributed throughout the arms, feet, and back supports, the stool absorbs most of the weight on the seat. This is why in Figure 16, the load distributed on the heel of the foot in sitting position is about 1 lbs which is half of the load distributed compared to an armchair. During the STS transition we can see a rapid increase and decrease in the load with a maximum of 14 lbs and a minimum of 1 lbs as the person transitions from sitting to standing.
33
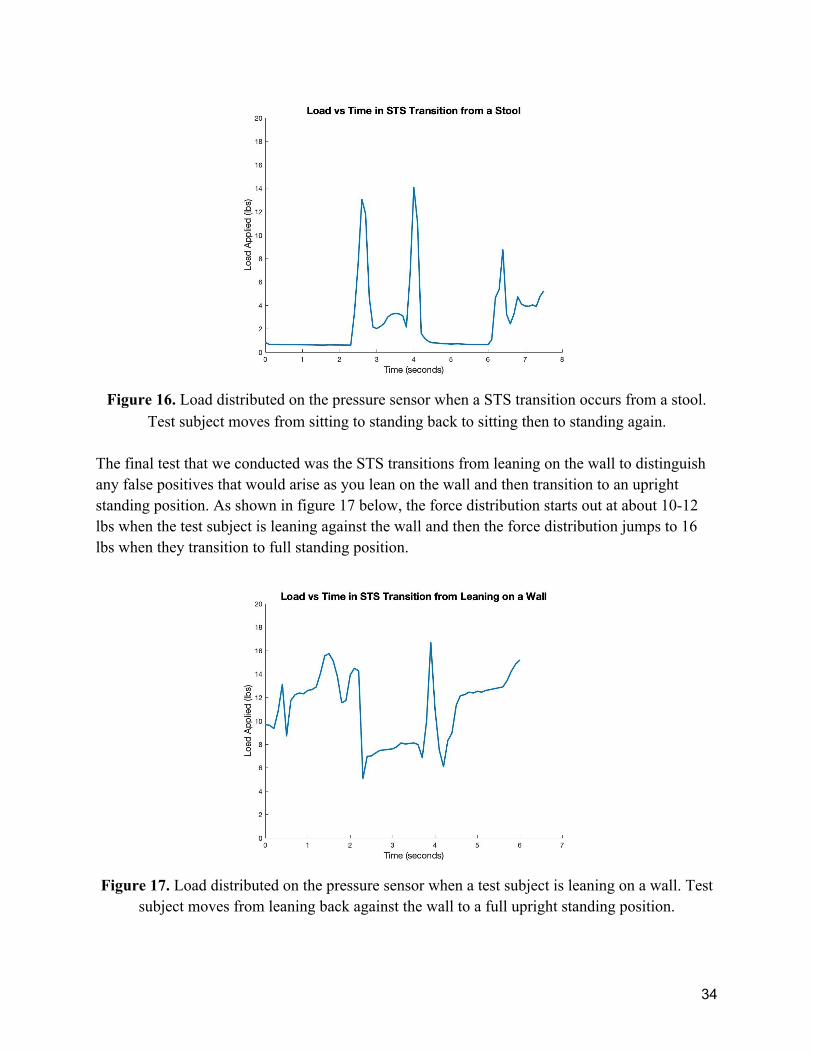
Figure 16. Load distributed on the pressure sensor when a STS transition occurs from a stool.
Test subject moves from sitting to standing back to sitting then to standing again. The final test that we conducted was the STS transitions from leaning on the wall to distinguish any false positives that would arise as you lean on the wall and then transition to an upright standing position. As shown in figure 17 below, the force distribution starts out at about 10-12 lbs when the test subject is leaning against the wall and then the force distribution jumps to 16 lbs when they transition to full standing position.
Figure 17. Load distributed on the pressure sensor when a test subject is leaning on a wall. Test
subject moves from leaning back against the wall to a full upright standing position.
34
Based on these data, as mentioned above, we are confident that our device can successfully detect a STS transition from a: armchair, car seat, chair, couch, and stool. The data provides a baseline for what conditions can be considered as sitting and what can be considered as standing.
Discussion and Recommendations
Our device is not a finalized product, and therefore needs further development before being implemented for Prof. Ojeda’s research purposes. As a prototype, it successfully achieves the detection of sitting to standing transitions from the data that has been collected thus far. However, there is room for improvement and further development. We learned that in future projects it is important to meet with the stakeholders multiple times early on, in order to gather as much information as possible. Our solution is strong in the fact that our device effectively and consistently achieves its purpose, based on the testing presented. Some of the weaknesses, on the other hand, are the fact that since this design is not finalized, it is not portable and the components utilized (such as the feedback resistor and other possible components of the circuit) could have been selected in a more informed way, based on more testing and circuit analysis. Also, more dynamic testing on different subjects and settings could have made our results even stronger.
In order to have a more accurate device, we recommend further and more in depth static testing. This would include a more developed analysis of different resistors (as opposed to our trial-and-error testing), to determine a range of acceptable values for the feedback resistor, and possibly an ideal value for it.
We recommend further testing of the device to be completed on multiple subjects. The subjects should vary in size, weight and age, to help confirm the success rate. We also recommend testing more seat settings and surfaces, to observe any noticeable changes between paved surfaces, carpet, etc. Also, more tests should be completed to collect data in order to detect susceptibility to false positives
We also recommend utilizing one sensor per shoe, since combining and averaging data from both feet would be able to give information about sitting or standing status even during walking time (when feet are on and off the ground periodically in an alternating fashion). Using two sensors would make the data more reliable and most probably increase the accuracy of STS transition detection.
Also, our prototype is currently not portable, which is something that will have to be explored before being used. This would include implementing a battery for power and an SD card to record the data during the use of the sensor. These components would have to be put together in a case with its respective size, weight and attachment constraint. To develop the casing and
35
determine how to put together these components further design thinking, solution development and prototyping is needed.
Another important feature to be further investigated is the mounting method of the device on the subject. This would also have to conform to the requirements previously listed, including being non-invasive to the subject. Our recommendation would be to position the sensor in the shoe sole, and then connect the wires coming from the sensor to the existing hardware on top of the shoe (currently utilized by Prof. Ojeda). The wiring from the sensor to the top of the shoe would be wrapped in soft fabric and would be minimal and non invasive.
Moreover, an important future development would be a program to read the graphs shown in the verification section of this report, and automatically report whether the subject wearing the sensor is sitting or standing.
Conclusion Dr. Lauro Ojeda is interested in studying real world LOB, focusing on the fragile populations, which include elderly people and people with a medical condition, their biomechanics and the context in which LOB occurs. To better understand this study, Dr. Ojeda has asked us to develop a device that uses minimum hardware to detect whether a person is sitting or standing at any given moment in time; this can be achieved in two main ways. Firstly by detecting any time a transition occurs and keeping track of this, or by being able to detect whether a person is sitting or standing at a given moment. The information gathered from background literature and stakeholder meetings were used to generate requirements and engineering specifications as shown on Table 1 on pg. 6. After our concept generation and development, which consisted of brainstorming, mindmapping, and morphological analysis, we converged our concepts and narrowed down our choices through a series of Pugh charts. As a result of categorizing our initial concepts in a mindmap, and converging onto just one design for each function through pugh charts we were able to evaluate 5 different potential concepts in great detail. Finally, we compared and evaluated the 5 concepts against each other, which led to our final design solution: a pressure sensor in the shoe. This led us into the next step of solution development to create a design solution and provide verification and justification to support it. For the verification of our pressure sensor we were able to run some static and dynamic tests. For our static testing with our pressure sensor, we applied loads varying from 5 to 90 lbs and recorded the voltage output. This allowed us to obtain a calibration curve that represents the correlation between the output voltage and the load applied. To understand the effect of input voltage on the sensitivity of the pressure sensor we conducted this test twice with different input voltages, Vref , from the Arduino, 5V and 3.3, seen in Figure 9. Based on this curve we decided to
36

move forward with the 5V input voltage when performing the dynamic tests. The setup for the dynamic testing can be seen in Figure 11. The pressure sensor was placed on the heel of the shoe sole for detecting peak pressures and ease of mounting. Figures 12 - 16 show the results of sit to stand transitions using different types of seats including a task chair, sofa, armchair, couch, stool and car seat. Our solution was able to detect the transition of sitting to standing from different types of seats through the increase in load distributed on the medial and lateral heel. In addition for the limited scope of tests that we had conducted to see the susceptibility to false positives, seen in figure 17, data from our device was promising given that in conditions like leaning on a wall, load measured by the pressure sensor wasn’t as low as some sitting conditions. Meaning that our device is promising in differentiating between real STS transitions and other false positive scenarios.
Authors Aksel Ahituv is graduating with his Bachelor’s degree in Mechanical Engineering in the Spring, he is currently looking for full time job opportunities. His previous experiences are in the fields of tech-startups, industrial flow devices and health furniture design. Aksel’s interests are around innovative technologies, product development and design. In his free time he enjoys reading different articles from magazines, cooking and travelling.
Erlin Guri is a senior graduating with a Bachelor’s Degree in Mechanical Engineering in May 2021. After graduation, his goal is to apply his skills and enthusiasm to help build a more efficient and sustainable world. In his free time, Erlin enjoys traveling, working out, watching sports, and spending time with friends and family.
37

Mario Shkembi is a senior at the University of Michigan, studying Mechanical Engineering, and will be graduating Winter of 2021. After graduation, Mario plans to work part-time, while he continues his studies, earning a master's degree in Engineering in Energy. Mario is very passionate about learning and expanding his knowledge of engineering concepts. In his free time Mario likes working out, playing and watching sports, and hanging out with friends.
Alli Heinen is graduating with a Bachelor’s Degree in Mechanical Engineering this May. She will be working full time for Eli Lilly and Company after graduation. Alli enjoys hiking, traveling, kayaking, cooking and spending time with friends and family. The photo on the left was taken this past summer at Bryce Canyon National Park with Thor’s Hammer. Maria Zaccherini is graduating with a Bachelor in Mechanical Engineering with an Energy Concentration in May 2021. She is originally from Italy and enjoys cooking, reading and exploring new places in her free time. She is currently the President of INvent, a student organization developing and delivering accessible STEM workshops, and she is involved in the Multidisciplinary Design Program where she is part of a team that creates sensors used to analyze various properties of Earth’s atmosphere. She is also passionate about sustainability and hopes to continue her studies pursuing a graduate degree focusing on energy and sustainable design.
38

Acknowledgements Throughout a challenging semester where COVID-19 impacted in-person classes, this project was made possible with the help of our peers and faculty members at the University of Michigan. We would first like to thank our discussion section instructor Professor Noel Perkins and our stakeholder Professor Lauro Ojeda for providing their knowledge and support throughout the duration of this project. We would also like to acknowledge Professor Kathleen Sienko for offering guidance and resources after our DR2 review and Professor Heather Cooper for providing us the necessary supplies from the Mechatronics Lab to complete our prototype. Thank you to the Mechatronics Lab Instructional Lab Manager Don Wirkner for offering advice and suggestions for which components to use for our circuit. We would like to thank Radu Tolontan for providing guidance for our circuit diagram. Finally, we would like to thank our fellow classmates for providing feedback after every presentation to improve our project.
Information Sources [1] Radak, Janice T. “Slip, Trip, Stumble, Fall: An Overview of Falls in the Elderly and How to Prevent Them.” Lower Extremity Review Magazine, Aug. 2018, lermagazine.com/cover_story/slip-trip-stumble-fall-an-overview-of-falls-in-the-elderly-and-how-to-prevent-them.
[2] Ojeda, Lauro V, et al. “Reconstruction of Body Motion during Self-Reported Losses of Balance in Community-Dwelling Older Adults.” Medical Engineering & Physics, vol. 64, Elsevier BV, 2019, pp. 86–92, doi:10.1016/j.medengphy.2018.12.008.
[3] Steultjens, E.M.J, et al. “Occupational Therapy for Community Dwelling Elderly People: A Systematic Review.” Age and Ageing, vol. 33, no. 5, Oxford University Press, 2004, pp. 453–60, doi:10.1093/ageing/afh174.
[4] Yamako, Go, et al. “Quantification of the Sit-to-Stand Movement for Monitoring Age-Related Motor Deterioration Using the Nintendo Wii Balance Board.” PloS One, vol. 12, no. 11, Public Library of Science (PLoS), 2017, p. e0188165, doi:10.1371/journal.pone.0188165.
[5] Tinetti, Mary E, et al. “Risk Factors for Falls among Elderly Persons Living in the Community.” The New England Journal of Medicine, vol. 319, no. 26, Massachusetts Medical Society, 1988, pp. 1701–07, doi:10.1056/nejm198812293192604.
[6] Handelzalts, Shirley, et al. “Detection of Real-World Trips in At-Fall Risk Community Dwelling Older Adults Using Wearable Sensors.” Frontiers in Medicine, vol. 7, Frontiers Research Foundation, 2/9/2020, doi:10.3389/fmed.2020.00514. [7] Inc., Apple. “Apple Watch Accelerometer and Gyroscope.” Accelerometer and Gyroscope - Interaction - WatchOS - Human Interface Guidelines - Apple Developer, developer.apple.com/design/human-interface-guidelines/watchos/interaction/accelerometer-and-gyroscope/.
39

[8] Albert M. Cook, and Janice M. Polgar. “Chapter 14 - Sensory Aids for Persons with Auditory Impairment.” Assistive Technologies, Elsevier Inc, 2015, pp. 352–74, doi:10.1016/B978-0-323-09631-7.00014-4.
[9] LANZARA, R. G. (1993). Weber’s Law Modeled by the Mathematical Description of a Beam Balance. Retrieved October 19, 2020, from http://www.bio-balance.com/Weber%27s_Law.pdf
[10] Whigham, L., Schoeller, D., Johnson, L., & Atkinson, R. (2012, February 28). Effect of clothing weight on body weight. Retrieved October 20, 2020, from https://www.nature.com/articles/ijo201220
[11] van Lummel, Rob C., et al. “Older Adults with Weaker Muscle Strength Stand up from a Sitting Position with More Dynamic Trunk Use.” Sensors (Basel, Switzerland), vol. 18, no. 4, 17 Apr. 2018, www.ncbi.nlm.nih.gov/pmc/articles/PMC5948784/, 10.3390/s18041235.
[12] “Wearable Sensors - APDM Wearable Technologies.” APDM, www.apdm.com/wearable-sensors/. [13] Wimmer, Markus A. “Knee Flexion and Daily Activities in Patients Following Total Knee Replacement: A Comparison with ISO Standard 14243.” Https://Www.researchgate.net/, Sept. 2015,www.researchgate.net/publication/281621893_Knee_Flexion_and_Daily_Activities_in_Patients_following_Total_Knee_Replacement_A_Comparison_with_ISO_Standard_14243. [14] “Affordable and Accurate Barometric Pressure Sensor.” Barometric Pressure, Apogee Instruments, www.apogeeinstruments.com/barometric-pressure/.
[15] T. Möhrle, “Robust and Precise Barometric Pressure Sensor for Wearables in Harsh Environments,” EE Times Europe, 15-Dec-2019. [Online]. Available: https://www.eetimes.eu/robust-and-precise-barometric-pressure-sensor-for-wearables-in-harsh-environments/.
[16] F. Massé, A. Bourke, J. Chardonnens, A. Paraschiv-Ionescu, and K. Aminian, “Suitability of commercial barometric pressure sensors to distinguish sitting and standing activities for wearable monitoring,” Medical Engineering & Physics, vol. 36, no. 6, pp. 739–744, 2014
[17] “Five Life Changes to Reduce Back Pain: Bending.” Buffalo Rehab Group | Physical Therapy, 14 Jan. 2020, buffalorehab.com/blog/five-life-changes-reduce-back-pain-bending/.
[18] Haraoubia, Brahim. “Photoresistors.” Photoresistors - an Overview | ScienceDirect Topics, 2018, www.sciencedirect.com/topics/engineering/photoresistors.
[19] Burnett, Roderick. “Understanding How Ultrasonic Sensors Work.” MaxBotix Inc., Publisher Name MaxBotix Inc.Publisher Logo, 15 July 2020, www.maxbotix.com/articles/how-ultrasonic-sensors-work.htm
[20]Gross, Kristin. “Ultrasonic Sensors: Advantages and Limitations.” MaxBotix Inc., Publisher
40
Name MaxBotix Inc.Publisher Logo, 15 July 2020, www.maxbotix.com/articles/advantages-limitations-ultrasonic sensors.htm/?gclid=Cj0KCQjw8rT8BRCbARIsALWiOvTRYnRCTm_QB7R5lKes0ywV9gjW23pJLBXHq7QE2ICNcXnJ9iGpgQsaAolWEALw_wcB.
[21] Shen, Wenqi et al. “Seated Weight Distribution of Adults and Children in Normal and Non-Normal Positions.” Annual Proceedings / Association for the Advancement of Automotive Medicine vol. 43 (1999): 383–397. [22] Zacharkow D. Posture: Sitting, Standing, Chair Design and Exercise. Charles C. Thomas Publisher; Springfield, IL: 1988. [23] Wang, Zhihua et al. “A Review of Wearable Technologies for Elderly Care that Can Accurately Track Indoor Position, Recognize Physical Activities and Monitor Vital Signs in Real Time.” Sensors (Basel, Switzerland) vol. 17,2 341. 10 Feb. 2017, doi:10.3390/s17020341 [24] “Seniors And Diabetes: A Complete Guide.” Aging.com, 1 Dec. 2017, aging.com/seniors-and-diabetes-a-complete-guide/.
[25] “How Diabetes Can Sabotage Circulation.” U.S. News & World Report, U.S. News & World Report, health.usnews.com/wellness/articles/2016-11-16/how-diabetes-can-sabotage-circulation.
[26] “Force Sensors.” Tekscan, 24 Oct. 2017, www.tekscan.com/force-sensors.
[27] Mohd Said, Aisyah et al. “Plantar Pressure Distribution among Older Persons with Different Types of Foot and Its Correlation with Functional Reach Distance.” Scientifica vol. 2016 (2016): 8564020. doi:10.1155/2016/8564020
[28] Tsuji, Taishi, et al. “Ground Reaction Force in Sit-to-Stand Movement Reflects Lower Limb Muscle Strength and Power in Community-Dwelling Older Adults.” International Journal of Gerontology, No Longer Published by Elsevier, 4 June 2015, www.sciencedirect.com/science/article/pii/S187395981500040X. [29] Moriguchi, Cristiane S., et al. “An Instrumented Workstation to Evaluate Weight-Bearing Distribution in the Sitting Posture.” Safety and Health at Work, Elsevier, 28 Jan. 2019, www.sciencedirect.com/science/article/pii/S209379111830146X. [30] “FlexiForce A401 Sensor.” Tekscan, www.tekscan.com/products-solutions/force-sensors/a401. [31] https://jamanetwork.com/journals/jama/article-abstract/327589
41
Equation Sources Eq. (1) How to convert amps to watts. (n.d.). Retrieved from https://www.rapidtables.com/convert/electric/Amp_to_Watt.html Eq. (2) Calculating rotary and electrical power. (n.d.). Retrieved from https://community.parker.com/technologies/electromechanical-group/w/electromechanical-knowledge-base/1917/calculating-rotary-and-electrical-power Eq. (3) https://www.electronics-tutorials.ws/dccircuits/voltage-divider.html Eq. (4) https://www.electronics-tutorials.ws/dccircuits/voltage-divider.html Eq. (5) https://www.isixsigma.com/tools-templates/fmea/fmea-quick-guide/
42
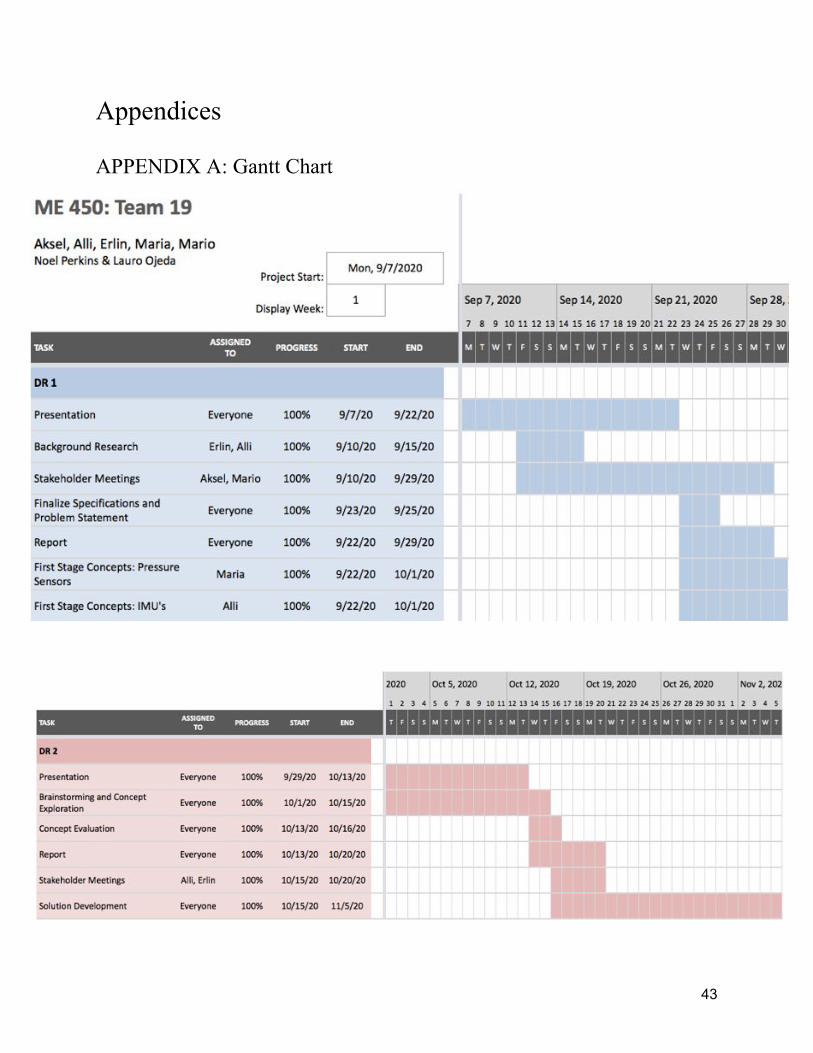
Appendices
APPENDIX A: Gantt Chart
43
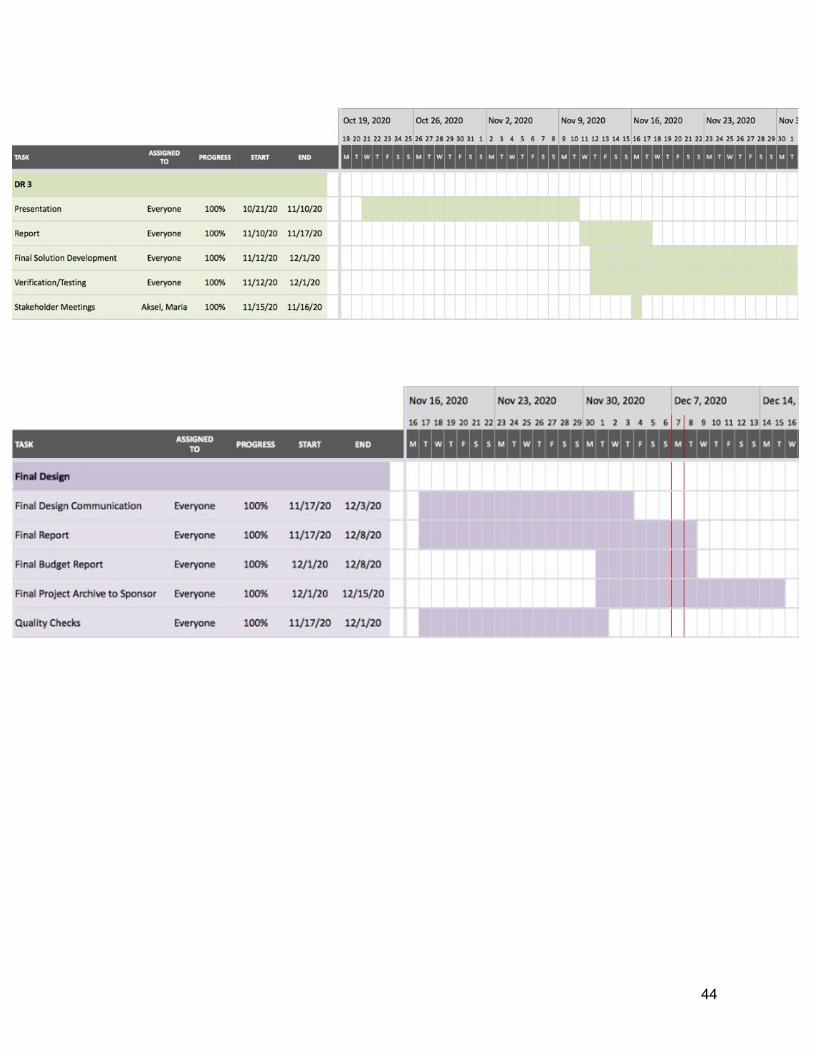
44
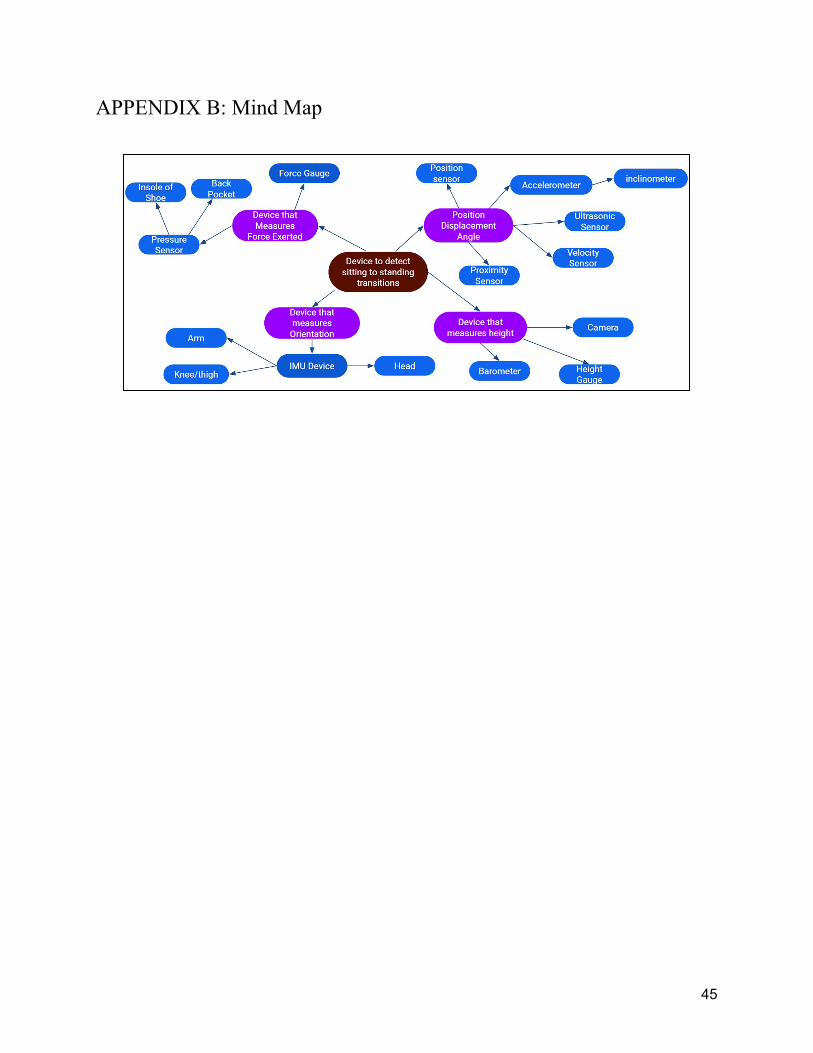
APPENDIX B: Mind Map
45
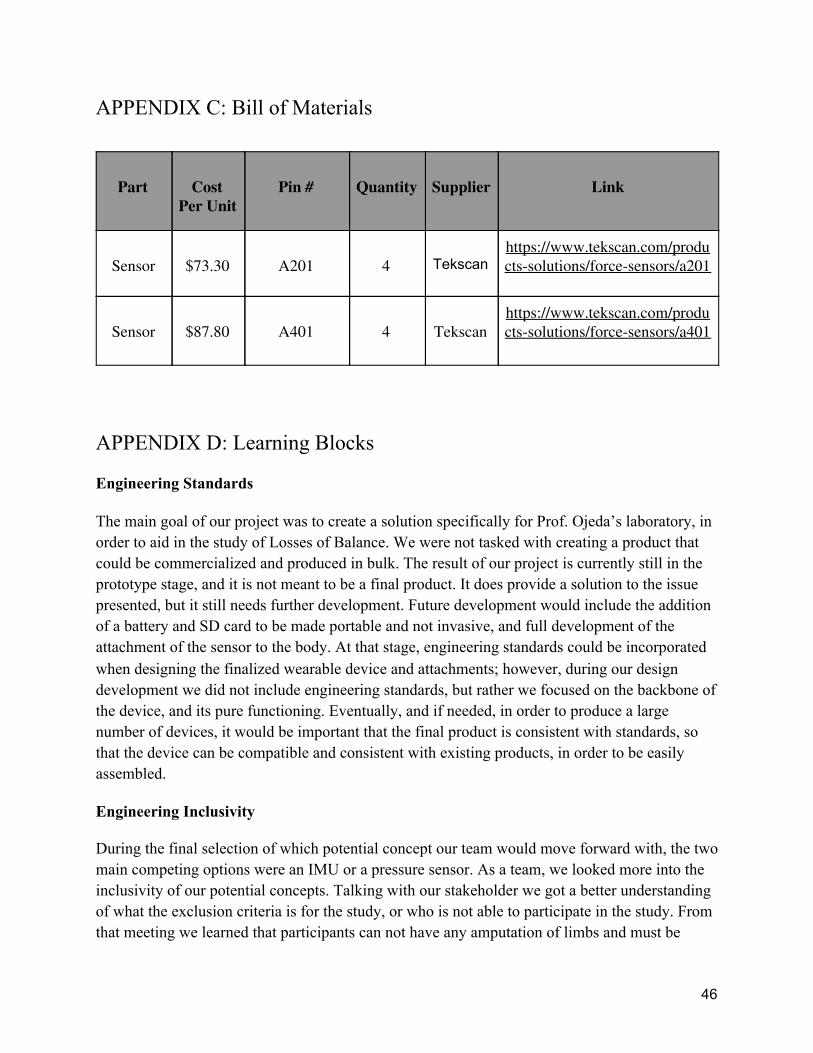
APPENDIX C: Bill of Materials
APPENDIX D: Learning Blocks
Engineering Standards
The main goal of our project was to create a solution specifically for Prof. Ojeda’s laboratory, in order to aid in the study of Losses of Balance. We were not tasked with creating a product that could be commercialized and produced in bulk. The result of our project is currently still in the prototype stage, and it is not meant to be a final product. It does provide a solution to the issue presented, but it still needs further development. Future development would include the addition of a battery and SD card to be made portable and not invasive, and full development of the attachment of the sensor to the body. At that stage, engineering standards could be incorporated when designing the finalized wearable device and attachments; however, during our design development we did not include engineering standards, but rather we focused on the backbone of the device, and its pure functioning. Eventually, and if needed, in order to produce a large number of devices, it would be important that the final product is consistent with standards, so that the device can be compatible and consistent with existing products, in order to be easily assembled.
Engineering Inclusivity
During the final selection of which potential concept our team would move forward with, the two main competing options were an IMU or a pressure sensor. As a team, we looked more into the inclusivity of our potential concepts. Talking with our stakeholder we got a better understanding of what the exclusion criteria is for the study, or who is not able to participate in the study. From that meeting we learned that participants can not have any amputation of limbs and must be
46
Part
Cost
Per Unit
Pin #
Quantity
Supplier
Link
Sensor
$73.30
A201
4
Tekscan
https://www.tekscan.com/products-solutions/force-sensors/a201
Sensor
$87.80
A401
4
Tekscan
https://www.tekscan.com/products-solutions/force-sensors/a401
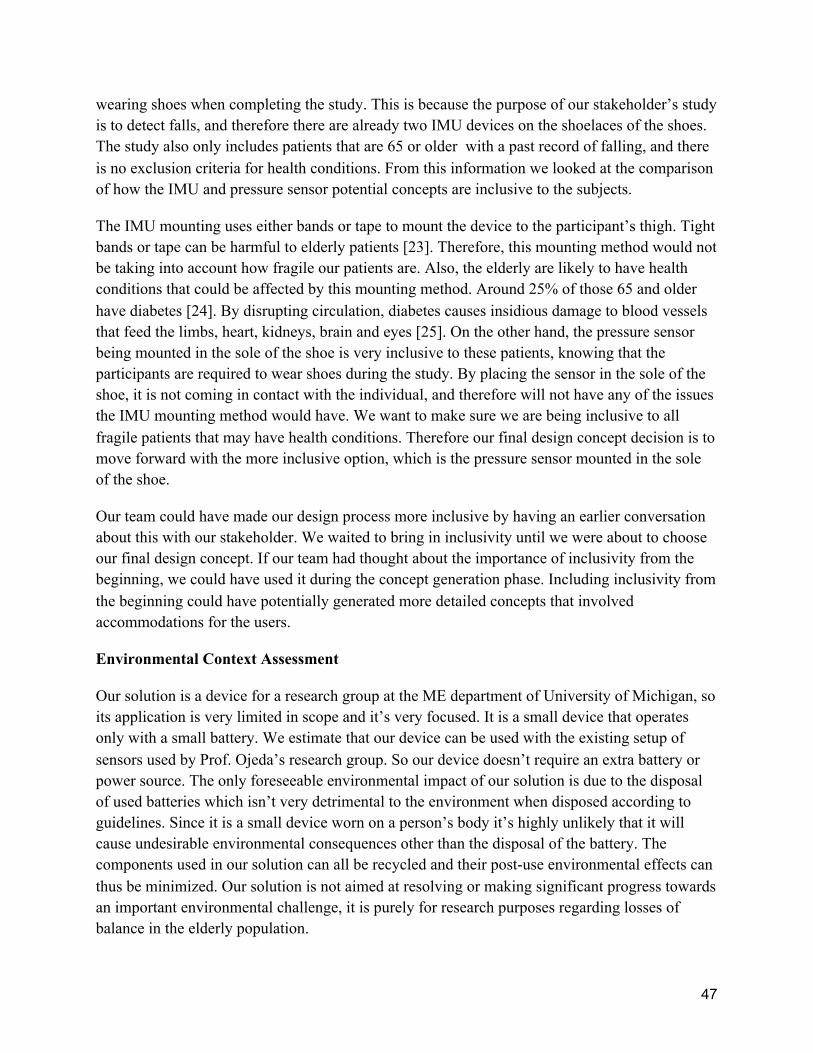
wearing shoes when completing the study. This is because the purpose of our stakeholder’s study is to detect falls, and therefore there are already two IMU devices on the shoelaces of the shoes. The study also only includes patients that are 65 or older with a past record of falling, and there is no exclusion criteria for health conditions. From this information we looked at the comparison of how the IMU and pressure sensor potential concepts are inclusive to the subjects.
The IMU mounting uses either bands or tape to mount the device to the participant’s thigh. Tight bands or tape can be harmful to elderly patients [23]. Therefore, this mounting method would not be taking into account how fragile our patients are. Also, the elderly are likely to have health conditions that could be affected by this mounting method. Around 25% of those 65 and older have diabetes [24]. By disrupting circulation, diabetes causes insidious damage to blood vessels that feed the limbs, heart, kidneys, brain and eyes [25]. On the other hand, the pressure sensor being mounted in the sole of the shoe is very inclusive to these patients, knowing that the participants are required to wear shoes during the study. By placing the sensor in the sole of the shoe, it is not coming in contact with the individual, and therefore will not have any of the issues the IMU mounting method would have. We want to make sure we are being inclusive to all fragile patients that may have health conditions. Therefore our final design concept decision is to move forward with the more inclusive option, which is the pressure sensor mounted in the sole of the shoe.
Our team could have made our design process more inclusive by having an earlier conversation about this with our stakeholder. We waited to bring in inclusivity until we were about to choose our final design concept. If our team had thought about the importance of inclusivity from the beginning, we could have used it during the concept generation phase. Including inclusivity from the beginning could have potentially generated more detailed concepts that involved accommodations for the users.
Environmental Context Assessment
Our solution is a device for a research group at the ME department of University of Michigan, so its application is very limited in scope and it’s very focused. It is a small device that operates only with a small battery. We estimate that our device can be used with the existing setup of sensors used by Prof. Ojeda’s research group. So our device doesn’t require an extra battery or power source. The only foreseeable environmental impact of our solution is due to the disposal of used batteries which isn’t very detrimental to the environment when disposed according to guidelines. Since it is a small device worn on a person’s body it’s highly unlikely that it will cause undesirable environmental consequences other than the disposal of the battery. The components used in our solution can all be recycled and their post-use environmental effects can thus be minimized. Our solution is not aimed at resolving or making significant progress towards an important environmental challenge, it is purely for research purposes regarding losses of balance in the elderly population.
47

Social Context Assessment
During our concept selection, we wanted to choose a concept that is self-sustaining in the market and affordable compared to other alternatives. We continuously spoke with our stakeholder, professor Lauro Ojeda, to gain a better understanding of existing products being used to solve the problem of detecting STS transitions. After examining existing solutions, we selected to use a pressure sensor to detect the transition of sitting to standing transitions. A pressure sensor can be affordable and sustainable for the primary market of the elderly population that experience LOBs affected by their STS transitions. Comparing this sensor to other devices currently being used to solve this problem, such as IMU devices, this product is affordable and utilizes less material. The APDM Opal IMU sensor, used in the current setup, weighs 25 grams and is made of polycarbonate and glass material. [12] The Tekscan 401 pressure sensors cost $87.80 for 4 ($21.95 each) and are made of polyester material and have a 25.4 mm (1 in.) diameter sensing area. [26] Compared to other alternative sensors, the pressure sensor is affordable to purchase and is made of durable material resulting in less maintenance/replacement costs.
If this pressure sensor becomes so economically successful that there is a high demand for it can ultimately increase the electricity usage as you need to charge the battery of the sensor. A high demand for these pressure sensors will also increase the material and manufacturing costs as more sensors need to be produced. Therefore, having a high demand for these pressure sensors may impact people economically and also increase harm to the environment.
The pressure sensor technology is believed to be resilient to disruptions in business because people who deal with LOBs are going to want this product to detect STS transitions. Comparing the pressure sensor to other technologies used to detect STS transitions, the pressure sensor introduces a new way of detecting the STS transition by measuring the change in force distribution under the feet.
Ethical Decision Making
Over the time course of this project Team 19 did not encounter many ethical issues, but four main ethical decisions were prevalent throughout: time, money, honesty, and safety. Trying to stay cost-effective may make it hard to make ethical decisions because oftentimes when an engineer speaks up and changes need to be made, money needs to be spent. Another factor that may make it challenging is a deadline. Time is one of the hardest things to overcome when making decisions and knowing that reporting a noncompliant test result may delay production would possibly cause an engineer to not say anything. Time and money played a role in each step of the process, all the way from the idea origin, to the design prototype. Team 19 had to constantly make decisions based on the deadlines set by the professors, as well as the budget of $400. Each decision made during each step of the project was made with the next step in mind: always looking forward by gauging time and money left over.
48

By doing this, we were able to finish a prototype of the sensor within the designated timeframe and budget. Safety played a role mainly in the design process, as we were focused on creating a product that was non-invasive, and not harmful to the participants. For these eldery participants, we had to think of the issues they may face in their daily lives, such as fall/trip risks, interference with blood flow/pressure, and comfortability, and how to create a design solution that would not interfere or exacerbate these issues. Throughout the course of our project Team 19 emphasised honesty with each other, the stakeholder, and our professor as we knew the outcome of this final design would affect everyone involved. We made sure to report any encounters we had during solution development as well as solution verification to make sure all issues were addressed and resolved.
49
APPENDIX E: Failure Mode and Effects Analysis An early stage FMEA was evaluated to determine the risk factors associated with the prototype of our final device. The risk priority number (RPN) for each risk factor was calculated using the equation 5 below.
(RPN) = (SEV) x (OCC) x (DET) Eq. (5) Where severity (SEV) represents how severe the effect is to the customer, “1” being a high impact and “10” being a low impact; occurrence (OCC) represents how frequently is this likely to occur, “1” being not likely to occur and “10” being inevitable; and detection (DET) represents how easy it is to detect the risk, “1” being very likely to be detected and “10” being not likely to be detected. A complete FMEA can be found here: https://docs.google.com/spreadsheets/d/1HW8tcq1wIwt6yZQnDKyF0am08lLxgr-iDHz8apoQmi
Q/edit#gid=0
50

APPENDIX F: Test Setup Images
Task chair Stool
Couch Armchair
51
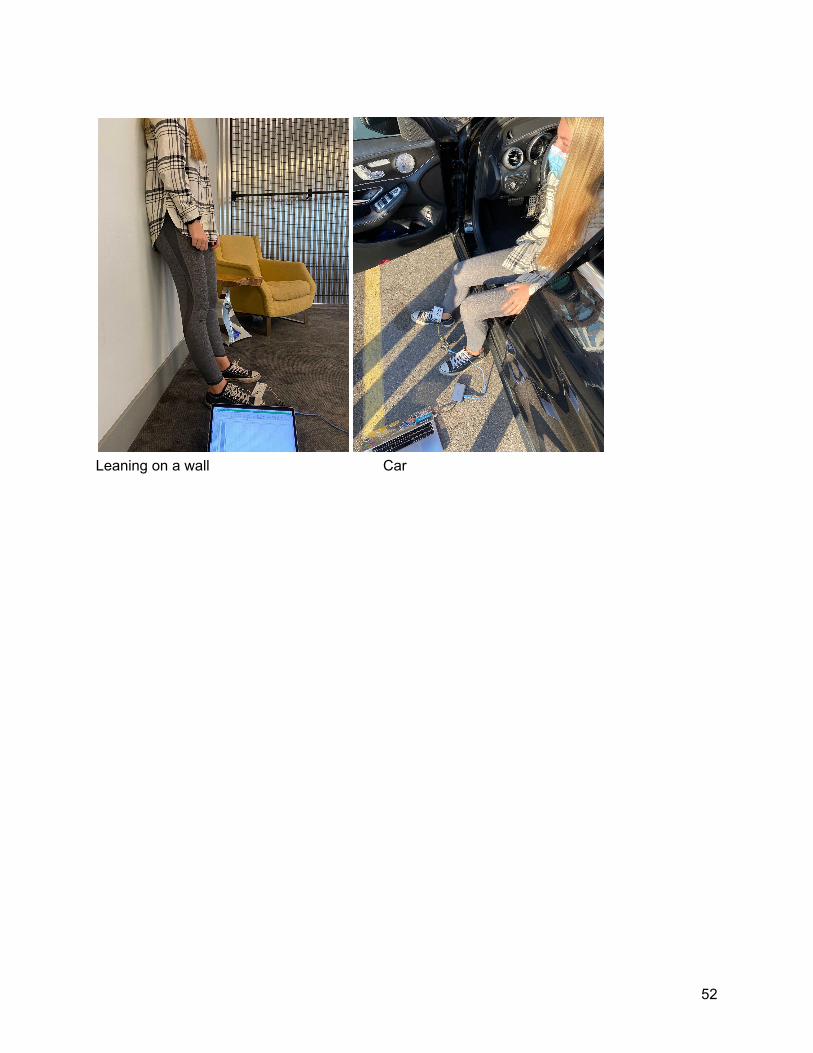
Leaning on a wall Car
52