Deviation from the Target Capital Structure and ... · PDF fileDeviation from the Target...
46
Deviation from the Target Capital Structure and Acquisition Choices ∗ August 31, 2009 Vahap B. Uysal 307 West Brooks, Adams Hall 205-A, University of Oklahoma Norman, Oklahoma 73019 Phone: (405) 325 5672 [email protected] Abstract This study finds that the deviation from a firm’s target capital structure plays an important role in acquisition decisions. Firms that are overleveraged relative to their target debt ratios are less likely to make acquisitions, acquire smaller targets, pay lower premiums and receive favorable market reactions to acquisitions. Furthermore, managers actively rebalance their capital structures in anticipation of acquisitions when they are overleveraged. ∗ I would like to thank Andres Almazan, Aydogan Alti, Louis Ederington, Chitru Fernando, Jay Hartzell, Mark Leary (AFA Discussant), Scott Linn, David North (FMA Discussant), William Megginson, Michael Roberts, John Robinson, Sheridan Titman, Ivo Welch, Roberto Wessels and Pradeep Yadav. I am also grateful to seminar participants at the University of Texas at Austin, at Koc University and at the AFA and FMA Meetings.
Transcript of Deviation from the Target Capital Structure and ... · PDF fileDeviation from the Target...
Deviation from the Target Capital Structure and Acquisition
Choices∗
August 31, 2009
Vahap B. Uysal 307 West Brooks, Adams Hall 205-A,
University of Oklahoma Norman, Oklahoma 73019
Phone: (405) 325 5672 [email protected]
Abstract This study finds that the deviation from a firm’s target capital structure plays an important role in acquisition decisions. Firms that are overleveraged relative to their target debt ratios are less likely to make acquisitions, acquire smaller targets, pay lower premiums and receive favorable market reactions to acquisitions. Furthermore, managers actively rebalance their capital structures in anticipation of acquisitions when they are overleveraged.
∗ I would like to thank Andres Almazan, Aydogan Alti, Louis Ederington, Chitru Fernando, Jay Hartzell, Mark Leary (AFA Discussant), Scott Linn, David North (FMA Discussant), William Megginson, Michael Roberts, John Robinson, Sheridan Titman, Ivo Welch, Roberto Wessels and Pradeep Yadav. I am also grateful to seminar participants at the University of Texas at Austin, at Koc University and at the AFA and FMA Meetings.
1
Traditional theories of capital structure suggest that firms have target debt ratios that are
determined by balancing the costs and benefits of debt financing. However, firms deviate from
their target capital structures due to debt overhang, expected inflation, transaction costs and
asymmetric information.1 The deviation from the target debt ratio (henceforth, leverage deficit)2
can potentially affect corporate investment choices through two channels. First, overleveraged
firms may forgo positive NPV investments in the presence of market imperfections as positive
leverage deficit constrains firms raising capital to finance new projects (financial constraint
hypothesis)3. Second, Jensen (1986) suggests that managers of underleveraged firms may make
negative NPV investment choices that benefit them personally (free cash flow hypothesis).
Although these two channels predict a negative association between acquisition activity
and leverage deficit, they have different implications for underleveraged and overleveraged
firms. On the one hand, the free cash flow hypothesis predicts that underleveraged firms are
more likely to make acquisitions, pay higher premiums and receive unfavorable announcement
returns relative to a control group of firms that do not deviate from their target capital structures
(moderately leveraged firms). On the other hand, the financial constraint hypothesis suggests that
overleverage prevents firms from pursuing all positive NPV projects; thereby overleveraged
firms will only pursue the most value-enhancing acquisitions. These imply lower acquisition
activity, lower premiums and higher market reaction to overleveraged acquirers relative to the
control group. However, the free cash flow hypothesis does not imply these predictions as debt
1 See Frank and Goyal (2009) for a review of factors influencing deviation from the target capital structure. 2 Leverage deficit is defined as actual minus target debt ratio. Based on this definition, overleveraged firms have excessively positive leverage deficit (largest leverage deficit quartile), and underleveraged firms fall in the lowest leverage deficit quartile. 3 Studies on the role of financing frictions on investment decisions include, but are not limited to, Myers (1977), Greenwald, Stiglitz and Weiss (1984) and Hart and Moore (1995).

2
loses its ability to constrain managers from undertaking (poor) acquisitions when the debt is
excessive (Zwiebel (1996)).
In this paper, I empirically examine how the deviation from a firm’s target leverage ratio
influences its firm and asset acquisition decisions. I focus on acquisitions since there is detailed
information about these investments, allowing an in-depth evaluation of the potential differences
between the acquisition choices of underleveraged and overleveraged firms. Specifically, I
examine whether a firm’s leverage deficit affects the likelihood of making an acquisition, as well
as the method of payment, announcement returns and premiums paid to the target. Finally, I
examine ex ante managerial decisions on capital structure prior to acquisitions.
To empirically examine the effect of the leverage deficit on acquisition choices I utilize a
two-step estimation procedure that is similar to Hovakimian, Opler and Titman (2001). In the
first step, I estimate the target leverage ratio by running a regression of leverage ratios on the
main determinants of capital structure considered in the prior studies.4 In the second stage
regressions, I examine whether the deviation from the predicted target capital structure affects
acquisition decisions.
Results in this paper indicate that the estimated leverage deficit is strongly related to
acquisitions choices: a one standard deviation decrease in the leverage deficit increases the
likelihood of making an acquisition by 10.8% and increases the size of acquisition by 5.2
percent. However, the effect of leverage deficit on the likelihood of making an acquisition is not
symmetric for underleveraged and overleveraged firms. While the effect of overleverage is
negative and significant, underleverage has insignificant effect on the acquisition probability.
The results hold for both firm and asset acquisitions and for both within- and cross-industry
acquisitions. I also find significant effects of leverage deficit, which is driven by overleveraged 4 See, e.g., Harris and Raviv (1991); Rajan and Zingales (1995); Frank and Goyal (2004).
3
firms, in payment choices and premiums paid to targets; overleveraged acquirers pay lower
premiums and are less likely to use cash in their offers. Furthermore, acquisition announcement
returns increase with leverage deficit. Specifically, this effect is significant for overleveraged
acquirers and is even stronger when the offer is unexpected. These findings are not in line with
the free cash flow hypothesis, but rather are consistent with the financial constraint hypothesis.
Finally, I examine whether managers attempt to mitigate the negative effect of overleverage prior
to acquisitions. I find that overleveraged firms lower their leverage deficit by 5.0% relative to
their industry peers when they have a high likelihood of acquisitions. Collectively, these findings
suggest that leverage deficit affects the ability to acquire as well as the terms of the deal, and
managers actively rebalance their capital structures in anticipation of acquisitions when they are
overleveraged.
These findings complement Harford et al. (2009) who also document the role of leverage
deficit in method of payment conditional on making an acquisition. I show effects of leverage
deficit in the ability to make acquisitions and ex ante capital structure decisions. Specifically, a
positive leverage deficit decreases the premium paid by overleveraged acquirers; thereby it
unconditionally limits the ability to make acquisitions and affects ex ante capital structure
changes for overleveraged firms. These findings contribute to studies on the effects of leverage
deficit on corporate policies. In particular, Frank and Goyal (2009) report firms adjusting debt
ratios more quickly when they are overleveraged. The significant effect of overleverage and
insignificant effect of underleverage on acquisitions documented in this paper suggest that a
higher likelihood of forgoing acquisition opportunities may yield quicker leverage adjustments
for overleveraged firms. I find further evidence confirming this prediction: overleveraged firms
reduce leverage when they have high probability of undertaking an acquisition. These findings

4
also contribute to a growing number of studies examining the role of anticipation of investment
opportunities on capital structure decisions. Specifically, Almazan et al. (2009) and Morellec and
Zhdanov (2008) show that firms accumulate financial slack when they have acquisition
opportunities. The findings in this paper establish a link between acquisitions and security
issuance decisions through leverage deficit while extending the role of leverage deficit in
security issuance5 to real investment decisions.
This paper is also related to studies examining the role of financing frictions on corporate
policies. In frictionless capital markets, firms should be able to finance all positive NPV projects
with no restrictions on their forms of financing (Modigliani and Miller (1958)). However,
financing frictions limit a firm’s ability to fund new investments (Myers (1977), Myers and
Majluf (1984), Jensen (1986), Hart and Moore (1995)). Using acquisitions in this study allows
me to test whether overleverage constrains managers in investment decisions as well as the form
and the level of financing. I show that overleveraged firms are less likely to go to debt markets
and are more likely to use equity to finance their acquisitions if they are able to acquire. In
addition, using equity does not suffice for overleveraged firms to offer premiums as high as other
firms. This, in turn, constrains the acquisition activity of overleveraged firms. Therefore, this
study suggests that excess positive leverage deficit not only limits the access to debt markets, but
also constrains the exploitation of equity market, which, collectively, decreases the acquisition
activity of overleveraged firms.
This paper also contributes to the literature on the effects of acquirers’ leverage on
acquisition announcement returns. There is no consensus on the role of leverage in acquisitions.
For example, Maloney, McCormick and Mitchell (1993) find that market reactions increase with
5 See Fama and French (2002), Flannery and Rangan (2004), and Kayhan and Titman (2007) for the role of leverage deficit in security issuance decisions.
5
the acquirers’ debt ratios, while Moeller, Schlingemann and Stulz (2004) find no significant
effect of leverage on market reactions to takeover announcements. The evidence in this paper
suggests that leverage plays an important role in market reactions as long as excessive positive
leverage deficit exists.
The paper is organized as follows. Section 1 provides details of sample selection and
descriptive statistics of the data. Section 2 explains the determinants and estimation procedure of
the target leverage ratio. Section 3 examines the empirical findings of the second stage
regressions. Section 4 concludes.
1. Literature Review and Hypothesis Development
Consistent with traditional theories of capital structure, Graham and Harvey (2001) report
that 81% of CFOs claim to have target debt ratios, which are determined by the costs and
benefits of debt financing. Firms, however, deviate from their target capital structures due to debt
overhang (Myers (1977)), expected inflation (Frank and Goyal (2007)), transaction costs (Leary
and Roberts (2005)) and asymmetric information (Myers and Majluf (1984)). Hovakimian et al.
(2001) show that deviations from the target capital structures influence security issuance
decisions. Firms that are overleveraged relative to their target capital structures are more likely to
issue equity while underleveraged firms are more likely to issue debt to move their debt ratios
towards their target capital structures.
Deviations from the target capital structure are also likely to affect acquisition decisions.
The free cash flow hypothesis suggests that managers of underleveraged firms more easily raise
capital to make acquisitions benefitting them personally at the expense of shareholders (Jensen

6
(1986)). Acquisitions, in fact, may serve in the interest of managers in many forms (Morck et al.
(1990)). As managerial compensation increases with the size of the company (Murphy (1999)),
managers have incentives to manage larger firms. Managing a larger corporation may also
generate non-monetary benefits. For example, managing large corporations might be more
fulfilling due to hubris (Roll (1986); Moeller et al. (2004)). Furthermore, managers may prefer
acquisitions due to career concerns (Shleifer and Vishny (1989)). As human capital of managers
is not diversified and is tied to the survival of the company (Amihud and Lev (1981)), managers
are tempted to reduce the firm risk through acquisitions of (unrelated) targets (Morck et al.
(1990)). Overall, financial slack generated by unused debt capacity may provide means for
managers to undertake acquisitions motivated by managers’ personal preferences, which may not
be in line with economic benefits for shareholders (Lang, Stulz and Walkling (1991)). Therefore,
managers of underleveraged firms are more likely to make acquisitions, and these acquisitions
are likely to result in overpayment for the target, and, thereby, negative market reaction to
acquisition announcements. Notably, the free cash flow hypothesis does not necessarily imply
overleveraged firms making good acquisitions as debt loses its ability to constrain managers
from undertaking (poor) acquisitions when it is excessive (Zwiebel (1996)). In sum, the free cash
flow hypothesis predicts that underleveraged firms are more likely to make acquisitions, pay
higher premiums and receive unfavorable market reactions to acquisition announcements than
are moderately leveraged firms.
Alternatively, the presence of market imperfections may enhance the effect of deviation
from the target capital structure on acquisitions. In frictionless capital markets, firms finance all
positive NPV projects with no restrictions on their forms of financing (Modigliani and Miller (
1958)). However, financing frictions limit an (overleveraged) firm’s ability to fund new
7
investments.6 This would imply a lower likelihood of acquisitions for overleveraged firms. Even
if overleveraged firms do make acquisitions, they will only pursue the most value-enhancing
acquisitions. Therefore, they are more likely to pay lower premiums while receiving favorable
market reactions to their acquisition announcements. It is important to note that based on the
financial constraint hypothesis, underleveraged firms are not less conservative in selecting
acquisition targets relative to moderately leveraged firms as both moderately and underleveraged
firms would accept all positive NPV projects. Therefore, returns to underleveraged firms are not
different from those to moderately leveraged firms.
Managers are likely to anticipate the limitations generated by financial constraints for
future acquisitions. As acquisitions impact long run valuations, which are more likely to affect ex
ante capital structure decisions (Strebulaev (2007)), managers are likely to mitigate the negative
effect of excess positive leverage deficit on acquisitions through debt reduction. Consistent with
this view, Almazan et al. (2009) and Morellec and Zhdanov (2008) show that firms accumulate
financial slack when they have acquisition opportunities. Thus, the financial constraint
hypothesis predicts that managers of overleveraged firms will reduce their leverage deficit when
they anticipate a high likelihood of acquisitions.
2. Sample Selection and Descriptive Statistics
I use firms covered in COMPUSTAT and CRSP from 1990 to 2007 to estimate the target
debt ratio. Following previous studies on capital structure7, I exclude financial firms (6000-6999)
6 Studies on the role of financing frictions on investment decisions include, but are not limited to, Myers (1977), Myers and Majluf (1984), Greenwald, Stiglitz and Weiss (1984), Hart and Moore (1995) and Lang et al. (1996). 7 See Hovakimian, Opler and Titman (2001), Fama and French (2002), Flannery and Rangan (2005), Leary and Roberts (2005) and Kayhan and Titman (2005)

8
and regulated utilities (4900-4999). I drop firms with sales less than 10 million in 1990 dollars.
In order to eliminate the effect of outliers, all variables are winsorized at the top and bottom 1%
levels. I estimate the target leverage ratio for 60,630 firm-years over sample period by running a
regression of leverage ratios on main determinants of capital structure considered in prior
studies. I define leverage deficit as actual leverage minus predicted leverage, following
Hovakimian et al. (2001), and examine whether leverage deficit affects acquisition decisions. For
all firms in the sample, I obtain all completed acquisitions in the U.S. listed in the Securities Data
Company’s (SDC) Mergers and Acquisitions Database as a merger, an acquisition of majority
interest, asset acquisition or acquisition of certain assets with transaction value greater than 1
million dollars. This process generates 10,807 acquisitions with average transaction value of
$357 million. Of these transactions, only 15.8% are all-stock offers whereas 84.2% of the deals
have a cash component. In particular, 29.9% of acquisitions are all-cash deals. As most cash
deals are financed with debt (Bharadwaj and Shivdasani (2003); Harford et al. (2009)), these
findings provide preliminary evidence on the importance of leverage deficit in financing
acquisitions.
Table 1 reports the descriptive statistics of firms in the sample. The average total asset of
firms in the sample is $2.656 billion. The market leverage has an average of 0.378 and has large
standard deviation (0.245) around the mean.8 The mean market leverage deficit is zero indicating
that, on average, actual leverage is equal to target debt ratio. However, large variance around the
mean implies that a subgroup of firms deviate from their target debt ratios. Specifically, 25% of
firms in our sample are underleveraged by less than -13.6% and another 25%is overleveraged by
more than 12.2 percent. The large variation of leverage deficit in the sample allows me to test the
effect of leverage deficit on acquisitions. Table 1 also indicates that acquisitions play an 8 Variable definitions are in the Data Appendix.

9
important role in the sample: 13.6% of firms in our sample make at least one acquisition during
the study period and average annual transaction volume constitute 3.8% of total assets.
Furthermore, the average number of acquisitions per firm per year is 0.184 and a firm makes as
many as 34 acquisitions in a year.
[Insert Table 1 here]
3. Empirical Methodology and Results
3.1 Estimation Procedure
Tests to disentangle the financial constraint and free cash flow hypotheses require
identification of over and underleveraged firms. As the capital structure theories suggest that
optimum amount of debt varies across firms, such identification should depend on the deviation
from the firm’s target capital structure.9 I follow previous studies (e.g., Fama and French (2002))
to utilize a two-step estimation procedure. First, I estimate the target capital structure by
regressing market leverage on determinants of capital structure (Xi) used in previous studies in
equation 1.10 These determinants include proxies for profitability, size, growth opportunities,
product uniqueness and tangible assets ratio. In order to control for industry effects, changes in
9 For example, Jensen (1986, p.328) states: “The (free cash flow) theory implies managers of firms with unused debt borrowing power (i.e. financing slack)… are more likely to undertake low-benefit or even value-destroying mergers.” The unused debt capacity is excess of the optimum amount of debt which is determined by the future growth opportunities, asset types and tax gains (see, e.g., Rajan and Zingales, 1995; Titman and Wessels, 1988) as well as by industry characteristics (Frank and Goyal, 2009).Thus, a firm may be overleveraged while another may be underleveraged even if the two firms have the same debt ratios. 10 I test the robustness of these findings using Book Leverage Deficit and Net Market Leverage Deficit constructs which are residuals of regressions of Book Leverage and Net Market Leverage on the determinants of the target debt ratio in equation 1. The results hold for these alternative definitions of leverage deficit and are available upon request.

10
tax rates and macroeconomic changes over years, the regression includes year dummies and
industry dummies based on 3-digit SIC industry groupings.11 The fitted value of this regression
is defined as the target leverage ratio. From this variable, I construct a leverage deficit variable
defined as actual debt minus the estimated target leverage from the first stage.
itiit XLeverageM 11,arket εγ +′= − (1)
In the second stage, the leverage deficit variable is then used in an estimation of
likelihood of making an acquisition, the ratio of transaction value to total assets and the method
of payment in equations 2, 3 and 4. In addition, I test whether leverage deficit of the acquirer
affects premiums paid to target and acquisition announcement returns in equations 5 and 6. I
follow Officer (2003) and define Acquisition Premium as the ratio of value of components of the
offer (i.e., aggregate value of cash, stock and other securities) to the market value of target 40
days prior to the announcement date. Following Fuller et al. (2002), I use cumulative abnormal
returns to bidders (CAR) which are calculated over a five-day event window (two days before
and two days after the announcement date). The benchmark returns are the value-weighted index
of returns including dividends for the combined New York Stock Exchange, American Stock
Exchange and NASDAQ.
( ) ( )iZDeficitLeverageAcquirerP ⋅+⋅+Φ== 110 1 βββ (2)
Total M&A Transaction/TA= iiZDeficitLeverage 2110 εααα +⋅+⋅+ (3)
P(All Cash=1)= iiZDeficitLeverage 2110 εααα +⋅+⋅+ (4)
Acquisition Premium= iiZDeficitLeverage 2110 εααα +⋅+⋅+ (5)
iii ZDeficitLeverageCAR 3110 εθθθ +⋅+⋅+= (6)
11 The results are qualitatively similar when I use Fama-French industry definitions.
11
3.2 Determinants of the Target Leverage Ratio
In this section, I examine the determinants of target leverage ratio and estimate the
leverage deficit. Following the standard methodology in the target capital structure literature, the
target leverage regression in equation (1) controls for profitability, size, growth opportunity,
product uniqueness and tangible assets ratio (see Rajan and Zingales (1995); Hovakimian et al.
(2001)).
Large firms are more diversified and have less volatile cash flows. This decreases
financial distress cost and increases target leverage ratio (Rajan and Zingales (1995)).
Furthermore, they have easy access to capital markets. In order to capture the effect of firm size
on the target capital structure, I include the natural logarithm of net sales in the regression.
Growth opportunities of a firm also affect its target capital structure. As Myers (1977) indicates,
debt overhang may prevent firms from investing in positive future NPV projects. In particular,
this effect is costly for growth firms. Furthermore, Goyal et al. (2002) show that firms in the
defense industry increase their leverage ratios as their growth opportunities shrink. I use two
proxies for growth opportunities: market-to-book ratio and stock return.
I use the ratio of research and development (R&D) expenditures to total assets, RD/TA, as
a proxy for product uniqueness (Titman and Wessels (1988)). Product uniqueness of a firm
increases financial distress cost, thereby decreasing the target leverage ratio. Another important
determinant of target leverage ratio is asset tangibility. Firms with liquid assets are more likely to
borrow against their assets and have lower bankruptcy cost resulting in a higher target leverage
ratio (Titman and Wessels (1988)). I use the ratio of tangible assets to the book value of total
12
assets as a proxy for asset tangibility. In this paper, profitability is proxied by earnings before
taxes, preferred dividends and interest payments over total assets, EBITDA/TA.
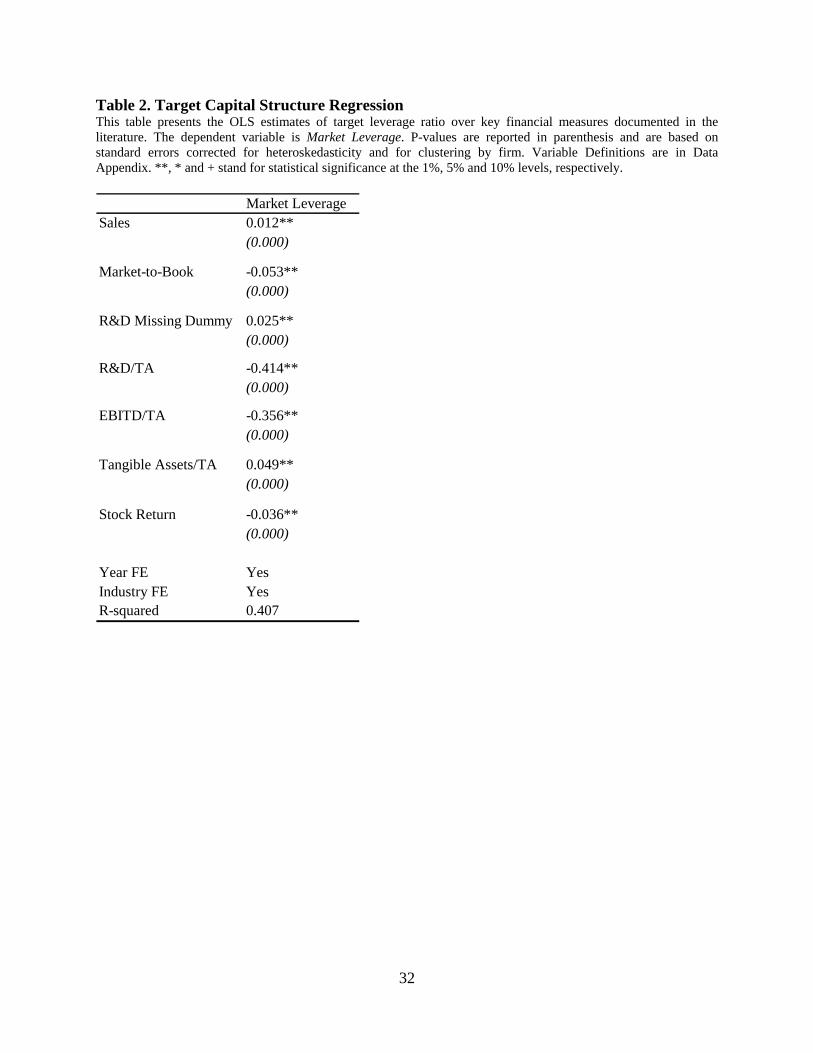
Table 2 summarizes coefficient estimates of the target leverage ratio regression and
reports p-values based on standard errors which are corrected for heteroskedasticity and for
clustering by firms. The estimates are consistent with those found in previous studies. The target
capital structure increases with sales (Hovakimian et al. (2001)), and decreases with the market
to book ratio (Frank and Goyal (2009)). The target debt ratio is negatively associated with
profitability (Fama and French (2002)), R&D expenses (Titman and Wessels (1988)) and stock
return (Hovakimian et al. (2001)). I find a positive association between tangible assets and
market leverage (Rajan and Zingales (1995)).
[Insert Table 2 here]
3.3 The Second Stage Analysis
3.3.1 Does leverage deficit affect acquisition decisions?
This section presents evidence that relates a firm’s leverage deficit to its acquisition
activity. Table 3 reports the mean values for acquisition variables for firm-per-year in the sample
by market leverage quartiles and standard errors to estimate the significance of the difference is
robust-clustered by firm. Firms in the fourth (first) quartile have the largest (lowest) leverage
deficit and are defined as overleveraged (underleveraged). Table 3 indicates difference
acquisition choices across overleveraged and underleveraged firms. Unconditional probability of
acquiring a target is 14.9% for the underleveraged sub-sample whereas it is only 8.8% for the
overleveraged firms. The difference is 6.2% (p<0.01) and corresponds to 45.6% relative to

13
unconditional probability of being an acquirer (13.6%). Similarly, overleveraged firms are less
likely to acquire another firm (3.7% vs. 6.8%) and to acquire assets (5.8% vs. 9.7%). This
relationship continues to hold for within- (4.8% vs. 7.7%) and cross-industry acquisitions (4.5%
vs. 8.6%).
[Insert Table 3 here]
In addition, Table 3 documents that the per-year value of a firm’s acquisitions as a
percentage of its total assets is also smaller in the subsample of overleveraged firms relative to
that of underleveraged firms (2.5% vs. 4.3%). The difference is 57.4% relative to the average
ratio of transaction value to total assets in the sample (3.8%). Similarly, overleveraged firms
acquire smaller firms (1.2% vs. 2.2%) and smaller assets (0.9% vs. 1.5%). I also find smaller
transactions of overleveraged firms for within- (1.1% vs. 1.8%) and cross-industry (0.9 vs. 1.7%)
acquisition groupings. It is important to note that the relationship between leverage deficit and
acquisitiveness is non-linear. Firms in the second quartile attain the highest acquisitiveness ratios
while the sub-sample of overleveraged firms has the lowest acquisitiveness measures of all
groups.
The univariate evidence on the negative association between leverage deficit and
acquisition measures does not account for several important factors that affect the likelihood of
making an acquisition. Therefore, I conduct multivariate analysis which controls for firm and
industry characteristics considered in previous studies. Large firms are more likely to make
acquisitions (Almazan et al. (2009)) as they are more diversified which enables them to raise
capital on short notice to finance acquisitions. Thus, I include the natural logarithm of sales to

14
control for firm size. As better performing firms are more likely to make acquisitions (Harford
(1999)), I add both stock price (Stock return) and accounting performance measures
(EBITD/TA). While the Market-to-book ratio variable proxies for growth opportunities in the
multivariate regression, it may also indicate overvaluation of equity which may increase the
likelihood of making acquisitions (Shleifer and Vishny (2003)). In order to control for the
liquidity of the market for corporate assets within an industry (e.g., M&A wave), I include the
Industry M&A Liquidity construct of Schlingemann et al. (2002). Firms in a highly concentrated
industry have fewer targets available for acquisitions within the industry, which may limit
within-industry acquisitions while enhancing the likelihood of cross-industry acquisitions.
Therefore, the Herfindahl Index is included in the analysis. The analysis also includes year
dummies to account for macroeconomic changes in the time series.
I use the probit analysis to estimate the likelihood of making an acquisition and report
marginal effects of the probit model as the probit coefficient estimates are hard to interpret.
Marginal effects of continuous variables are found at their means, while marginal effects of
dummy variables are calculated through the difference in the cumulative distribution functions
for discrete changes of dummy variables from zero to one. I implement tobit analysis to estimate
the ratio of sum of acquisition value to the firm’s total assets, since the dependent variable is
censored at zero. The p-values in both probit and tobit analyses are based on standard errors
corrected for clustering by firm.
Table 4 presents probit analysis in odd-numbered models and tobit analysis in even-
numbered models. Both analyses show significant effects of leverage deficit on acquisitions. A
one standard deviation (0.188) increase in leverage deficit decreases the probability of making an
acquisition by 10.8% (Model 1) and decreases the ratio of total transaction value to total assets

15
by 5.2% (Model 2). I continue to find significant effects of leverage deficit on firm and asset
acquisitions as well as on within- and cross-industry acquisitions. These findings substantiate the
view that leverage deficit affects acquisition decisions.
[Insert Table 4 here]
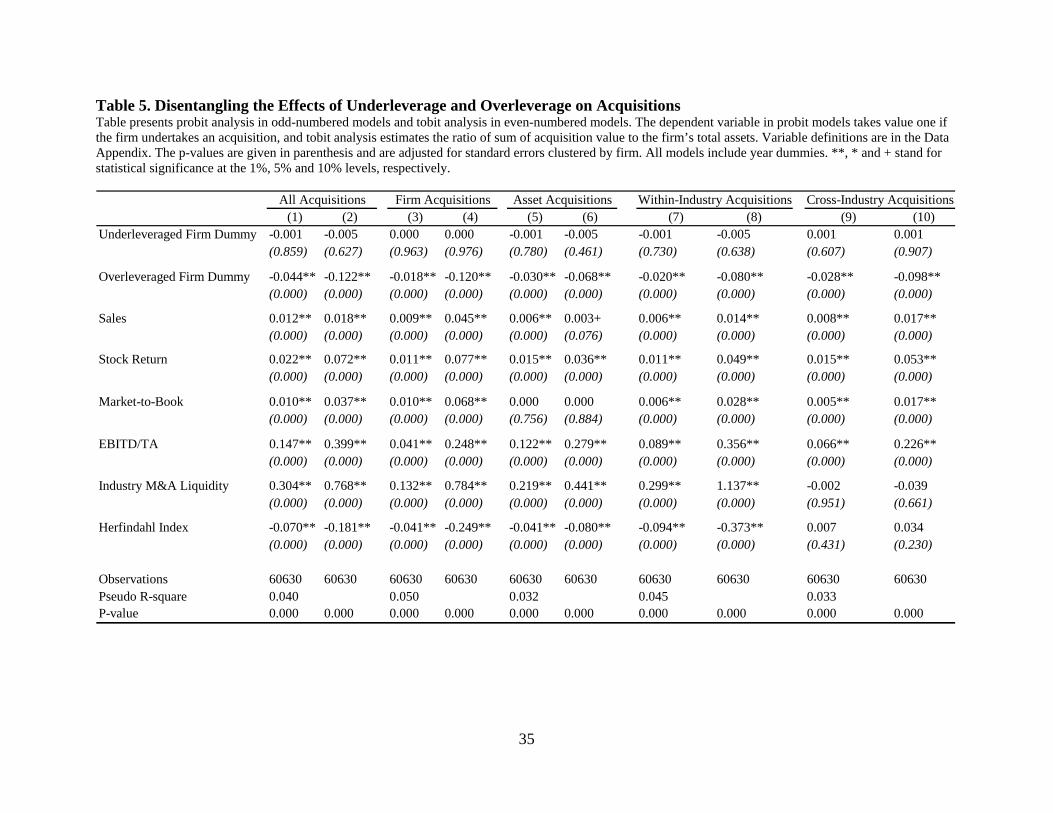
Next, I study the reason for this phenomenon. On the one hand, the free cash flow
hypothesis predicts that underleveraged firms are more likely to make acquisitions relative to a
control group of firms that do not deviate from their target capital structures. On the other hand,
the financial constraint hypothesis suggests lower acquisition activity relative to this control
group. In order to disentangle the effects of free cash flow and financial constraints, Table 5
includes dummy variables for overleveraged and underleveraged firms in the probit and tobit
analyses. The effect of overleverage is statistically and economically significant, whereas that of
underleverage is not. Overleveraged firms are 4.4% less likely to make an acquisition, a decrease
of 32.4% over the sample average (Model 1). They are also less likely to acquire another firm
(1.8%) and assets (3.0%). The negative effect of overleverage is robust for both within (2.0%)
and cross-industry acquisitions (2.8%). Consistent with the lower likelihood of acquisition, they
also have a smaller volume of transactions relative to total assets. The volume is smaller by 12%
in firm acquisitions and 6.8% in asset acquisitions. These findings continue to be true for within-
and cross-industry acquisitions. Collectively, these findings confirm that the effect of leverage
deficit on acquisitions is mainly driven by overleveraged firms and support the financial
constraint hypothesis.
16
[Insert Table 5 here]
However, I fail to find significant effect of underleverage on acquisition measures. The
effect of underleverage on likelihood of acquisition is insignificant. This is consistent with the
univariate analysis, which reports that the firms in the second quartile are as acquisitive as
underleveraged firms. This finding does not support the free cash flow hypothesis.
The estimates for explanatory variables are in line with previous studies. For example,
the coefficient estimates for Sales are significant in all models, confirming that large firms are
more likely to be acquirers (Harford (1999)). Firms with higher market-to-book are also more
likely to make acquisitions (Cai and Vijh (2007)). Furthermore, performance measures (Stock
Return and EBITD/TA) are positively associated with likelihood of acquisitions (Almazan et al.
(2009)). Industry M&A Liquidity and Herfindahl Index have a positive and a negative effect,
respectively, on within-industry acquisitions although these variables do not have explanatory
power on the likelihood of cross-industry acquisitions. This suggests strong influence of industry
structure on within industry acquisition decisions while industry characteristics do not affect
cross-industry acquisitions.
3.3.2 Does leverage deficit affect method of payment?
This section presents evidence relating leverage deficit to financing decisions in
acquisitions. Table 6 reports probit analysis of the likelihood of all-cash offer in odd-numbered
columns, and even-numbered columns are tobit analysis on percentage of cash used in the offer.
The p-values are calculated based on standard errors that are corrected for heteroskedasticity and
for clustering by firm. Previous studies show a number of factors influencing the method of

17
payment in acquisitions including asymmetric information (Hansen (1987); Travlos (1987);
Eckbo et al. (1990)), competition for the target (Berkovitch and Narayanan (1990)), growth
opportunities (Martin (1996)), agency problems (Bruner (1988)), and stock overvaluation
(Shleifer and Vishny (2003)). Therefore, the regressions include several acquirer (e.g., size,
profitability, stock return and market-to-book ratio), target (e.g., relative deal size and target’s
organizational form), deal (e.g., dummy variables for within-industry acquisitions and multiple
bidders) and industry characteristics (e.g., Industry M&A Liquidity and Herfindahl Index).
Furthermore, I add year dummies in the regressions to account for macroeconomic changes in
the time series.
[Insert Table 6 here]
The results in Table 6 indicate that leverage deficit significantly affect method of
payment. A one standard deviation increase in leverage deficit decreases the likelihood of all-
cash offer by 15.9% (Model 1) and the percentage of cash in the deal by 2.5 percent (Model 2).
The significant effect of leverage deficit variable transcends to both firm and asset acquisitions:
A one standard deviation increase in leverage deficit decreases the likelihood of all-cash offer by
21.6% in firm acquisitions and 9.5% in asset acquisitions. Models 3 and 4 report the effects of
overleveraged and underleveraged variables on method of payments. Overleveraged firms are
6.9% less likely to offer an all-cash deal, a decrease of 23.1% over the sample average.
Furthermore, they have 5.1% less cash in their offers. The effects of underleverage on percentage
of cash and likelihood of all-cash offer are positive, but lack statistical significance. I also find
negative and significant effects of overleverage on likelihood of all-cash offer in firm
18
acquisitions (-9.9%) and asset acquisitions (-3.9%) while underleverage does not have
statistically significant estimates in these regressions.
Collectively, these findings indicate that leverage deficit influences the method of
payment. The effect is mainly driven by overleveraged firms reducing the cash component in
their acquisition deals. Furthermore, underleveraged firms do not necessarily offer a higher
fraction of cash in their deals. Overall, these findings suggest that difficulty in raising capital for
acquisitions, rather than ease of issuing debt, plays an important role in how acquirers structure
their deals.
Findings confirm that large firms are more likely to offer all-cash deals as they have more
stable cash flows and have better access to debt markets (Titman and Wessels (1984)). Profitable
firms also use a higher percentage of cash in their offers. Firms sweeten the deals by including a
larger fraction of cash when there are multiple bidders for the target. This finding is in line with
strategic use of cash in acquisitions to deter potential bidders (Berkovitch and Narayanan
(1990)). Consistent with positive effects of growth opportunities (e.g., Martin (1996)) and stock
overvaluation (e.g., Shleifer and Vishny (2003)) on all-stock acquisitions, firms are less likely to
make all-cash offers when they have higher market-to-book ratios and higher stock returns.
Acquirers are more likely to use stock when their industries have high M&A liquidity. This is in
line with the increase in the all-stock offers during merger waves (Harford (2005)). Firms
undertaking within-industry asset acquisitions are more likely to use stock. Relative transaction
size decreases the likelihood of all-cash offers in firm acquisitions confirming that large targets
are less likely to be acquired with cash as it is difficult to raise debt to finance large transactions.
However, the relative size variable has a positive effect on the percentage of cash in asset

19
acquisitions. This is consistent with the view that the effect of seller’s information about the asset
on the method of payment increases with the relative size of the asset (Hege et al. (2009))
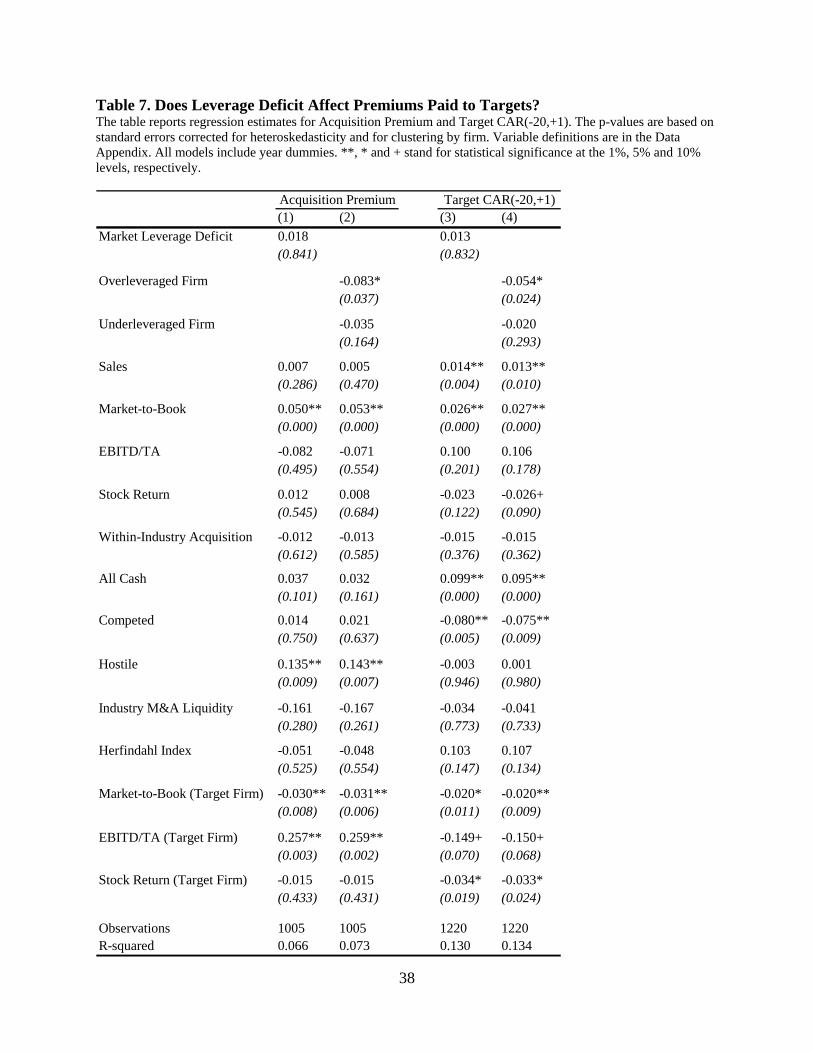
3.3.3 Does leverage deficit affect premiums paid to targets?
The free cash flow hypothesis suggests that managers of underleveraged firms are more
likely to overpay in acquisitions while the financial constrain hypothesis predicts lower
premiums for overleveraged acquirers. As the premium data are only available for the sub-
sample of public firm acquisitions, I test these predictions for this sub-sample.
I follow Officer (2003) to construct the Acquisition Premium variable which is the
aggregate value of cash, stock and other securities offered to the target divided by the market
capitalization of the target 40 days prior to the announcement. Consistent with Officer (2003), I
truncate the variable between zero and two. I also use cumulative abnormal returns to the target
firm (Target CAR) over the period starting 20 days prior to the announcement to 1 day after the
announcement day to assess the premium paid to the target.12 In addition to control variables
used in previous sections, the premium regressions account for market-to-book ratio, stock return
and profitability of the target firm. Table 7 reports the insignificant effects of leverage deficit on
the acquisition premium and Target CAR. However, the effect of leverage deficit becomes
significant when I disentangle the effects of overleveraged and underleveraged firms.
Specifically, overleveraged acquirers pay 8.3% lower premiums (p<0.05), whereas the estimate
for underleveraged firm is not statistically different from zero (p>0.1) in Model 2. The negative
effect of overleverage on Target CAR in Model 4 also confirms that overleverage constrains
12 Hartzell et al.(2004 ) also use 21-day event window (-20,+1) to assess the target premium. The results are qualitatively similar when I use Target CAR(-15,+1) and Target CAR(-10,+1). These results are not reported, but are available upon request.

20
firms from paying high premiums. This finding and a low likelihood of all-cash offers for
overleveraged acquirers reported in Table 6 jointly suggest that overleveraged firms’ resorting
to equity offers in acquisitions does not generate premiums as large as other firms. Furthermore,
the lower premium associated with overleveraged firms is consistent with their lower probability
of making the acquisitions documented in Table 5. These findings are in line with the financial
constraint hypothesis, but do not support the free cash flow hypothesis.
[Insert Table 7 here]
3.3.4 Does leverage deficit affect abnormal announcement returns?
In previous sections, I showed that overleveraged firms pay lower premiums and are less
likely to make acquisitions. In this section, I examine the effect of leverage deficit on CAR to
acquirer to assess whether capital markets recognize leverage deficit in response to acquisition
announcements. I follow prior literature and control for acquirer, target, deal and industry
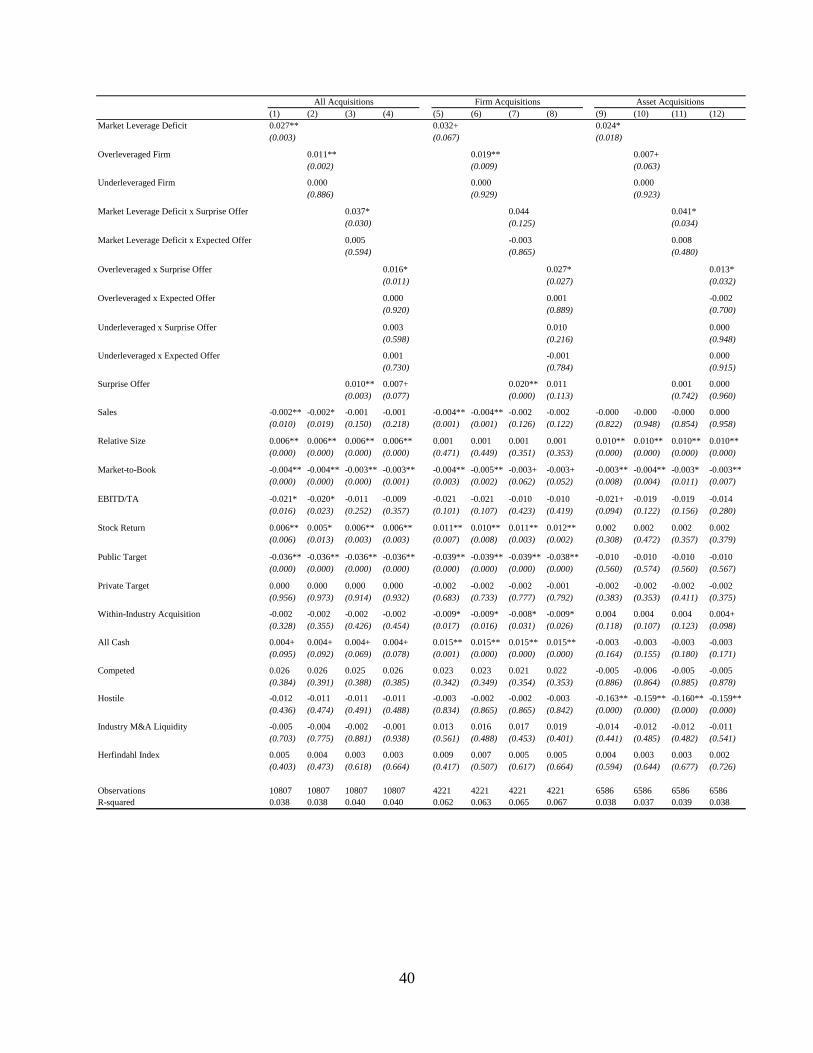
characteristics.13 Table 8 reports the coefficient estimates of regressions of CAR on leverage
deficit, annual dummies and control variables. The models have R2 of 3.8% for acquisitions,
6.2% for firm acquisitions and 3.8% for asset acquisitions. These are comparable to CAR
regressions in previous studies.14 The p-values are calculated based on White’s (2009) correction
for heteroskedasticity and incorporate clustering of acquirers.
Table 8 reports that the coefficients of leverage deficit are positive and significant in all
models. Specifically, CARs to acquirers increase by 42 basis points in response to a one standard
13 See, e.g., Andrade et al.(2001) and Fuller et al.(2002) for review factors influencing announcement returns. 14 Masulis et al. (2007), for instance, report R2 in CAR regressions ranging from 4.2 to 8 percent. The R2 in Moeller et al (2004) takes values between 5.2% and 5.5 percent.
21
deviation increase in leverage deficit, an increase of 29.4% over the sample average (Model 1).
Such an increase in leverage deficit also increases CAR to acquirer in firm acquisitions by 60
basis points (Model 5) and that of asset acquirers by 45 basis points (Model 9).
[Insert Table 8 here]
As leverage deficit is negatively associated with acquisition probability, investors may
use ex ante leverage deficit to form expectations on the likelihood of acquisitions. As a result,
stock prices of firms with low probabilities of undertaking acquisitions (e.g., overleveraged
firms) are less likely to incorporate potential valuation effects of acquisitions prior to
announcement dates and are more likely to reflect the investors’ valuations on acquisitions at the
announcement dates relative to firms with a higher likelihood of being an acquirer. This, in turn,
may generate systematic differences in stock returns to firms at the acquisition announcement
dates based on their leverage deficit. In order to correct for investor anticipation effect, I use the
methodology in Harford (1999) which classifies firms as expected and unexpected bidders. Such
classification allows me to identify the effects of leverage deficit on stock prices for unexpected
overleveraged and underleveraged bidders. Following Harford (1999), I construct intervals in
increments of 0.01 from zero to maximum expected probability based on the probit model in
Table 4 and calculate the percentages of bidders and non-bidders for each interval. This
procedure generates two distributions of bidder and non-bidder percentages between zero and
maximum expected probability, and the crossover point of the two distributions indicates the
cutoff point for expected bidders. Firms having greater predicted probability than the cutoff point
are categorized as expected bidders, and those with lower probabilities are considered as

22
unexpected bidders. The cutoff point for expected acquirers is 0.13. I also calculate cut-off
probabilities for acquirers of firms (0.06) and assets (0.09). Model 3 reports that leverage deficit
coefficient for an unexpected bidder is positive and significant. There are also positive and
significant effects of leverage deficit on CAR in subsamples of firm and asset acquisitions when
the firm is unexpected firm and unexpected asset bidder, respectively. These findings
substantiate the view that investors take leverage deficit in consideration in evaluating
acquisitions.
Next, I examine whether there are differences in market reactions to underleveraged and
overleveraged acquirers relative to moderately leveraged firms. The free cash flow hypothesis
suggests negative market reaction to underleveraged acquirers, whereas the financial constraint
hypothesis predicts positive market reaction to overleveraged acquirers. As debt does not prevent
managers from undertaking poor acquisitions when it is excessive (Zwiebel (1996)), the free
cash flow hypothesis does not imply positive market reaction to overleveraged acquirers. Model
2 reports that CAR to overleveraged acquirers is 110 basis points higher relative to moderately
leveraged acquirers (p<0.01) while the Underleveraged Firm variable is not significant. The
effects of overleverage on CAR are also significant for sub-samples of firm and asset
acquisitions, whereas underleverage has an insignificant effect on CAR. I also find significant
the effect of overleverage when the firm is an unexpected bidder in Model 4.15 To the extent that
the effect of expected bids is already incorporated in stock prices, this finding suggests that our
previous estimate of overleverage conservatively predicts the market reaction. Nevertheless, the
effect of underleverage continues to be insignificant for unexpected bidders.
15 In unreported analysis, I replicate Model 3 for the sub-sample of unexpected bidders and continue to find significant effect of overleverage and insignificant effect of underleverage on CAR.
23
Finally, I address the endogenity of payment method in the CAR regression. As leverage
deficit affects the method of payment, the All Cash variable is endogenous in the regression.
Since Industry M&A Liquidity is negatively associated with All Cash (Table 6) and does not have
significant effect on CAR (Table 8), I use it as an instrument for All Cash in the CAR
regression.16 While the effect of overleverage on CAR continues to be positive and significant
,underleverage is not significantly associated with CAR.17 Overall, the significant effect of
overleverage and insignificant effect of underleverage on CAR reported in Table 8 lend support
to the financial constraint hypothesis but are not in line with the free cash flow hypothesis.
Our results are consistent with previous studies. I confirm a result reported by Moeller et
al. (2004) with our finding that CAR decreases with firm size. Furthermore, CAR is negatively
associated with the market-to-book ratio18 (Masulis et al. (2007)) and the public status of the
target (Fuller et al. (2002)). There is a positive association between CAR and relative deal size
which is consistent with (Asquith et al. (1983)).
3.3.5 Capital structure adjustments prior to acquisitions
Lastly, I study adjustments to capital structures in anticipation of acquisitions. Morellec
and Zhdanov (2008) suggest that future acquisition opportunities will affect ex ante capital
structure decisions. Specifically, firms with a higher likelihood of acquisitions are more likely to
reduce their ex ante leverage deficits. Therefore, I examine leverage adjustments for firms with a
high likelihood of acquisitions.
16 This CAR regression excludes the Industry M&A Liquidity variable as the variable is used as an instrument for All Cash. 17 This result is not reported, but is available upon request. 18 This is also consistent with Rau and Vermaelen (1998) who find that firms with high market-to-book ratios have poor post-acquisition performance.
24
Table 9 presents evidence that overleveraged firms reduce their debt ratios and move
toward their debt ratios when they anticipate high likelihood of acquisitions. Specifically, they
reduce debt ratio by 1.7% and leverage deficit by 4.6% prior to acquisition announcement.
Industry adjusted changes in leverage deficit is also significant. In fact, underleveraged increase
their debt ratios. This finding is in line with the result that leverage deficit does not affect the
acquisition measures and deal terms for underleveraged firms (as reported in Model 2 of Table
5). Hence, they are more likely to take advantage of tax benefits of debt prior to acquisitions.
[Insert Table 9 here]
3.3.6 Robustness
This section examines alternative explanations for the findings reported in the paper.
Leverage deficit may proxy for financial synergies, which are generated in acquisitions of low
financial slack firms by high slack companies (Myers and Majlus (1984)). This hypothesis
suggests a high (low) likelihood of acquisition for underleveraged (overleveraged) firms. To the
extent that financial synergies are realized, this hypothesis also implies a positive relationship
between underleverage and CAR. Although I find negative association between overleverage and
the probability of undertaking an acquisition, I fail to find support for a high likelihood of
acquisition for underleveraged firms. Furthermore, there is no significant positive effect of
underleverage on CAR. Therefore, findings do not support the financial synergies hypothesis.
It is also possible that transfer wealth from shareholders to bondholders may make
acquisitions more valuable to underleveraged firms (Maquieira, Megginson and Nail (1998)).
25
Therefore, managers of overleveraged firms, assuming they behave in the best interest of
shareholders, may shy away from acquisitions. In addition to predicting a low likelihood of
acquisition probability for overleveraged firms, this hypothesis suggests that overleverage has a
negative effect on CAR as acquisition surplus for shareholders decreases with leverage deficit.
Although the findings confirm the former prediction, positive effect of overleverage on CAR
reported in Table 8 is inconsistent with the latter. Therefore, findings in this paper are not in line
with the wealth transfer hypothesis.
4. Conclusions
This paper sheds light on the link between a firm’s deviation from its target capital
structure and its acquisition choices. I find that firms that are overleveraged relative to their
target leverage ratios pay lower premiums, are less likely to make acquisitions, and are less
likely to use cash in their offers. Furthermore, they receive more favorable market reaction to
their acquisitions. Finally, managers actively rebalance their capital structures in anticipation of
acquisitions when they are overleveraged. These findings lend support to the financial constraint
hypothesis, but are not in line with the free cash flow hypothesis.
This paper contributes to studies examining the role of financing frictions on corporate
policies. By using acquisitions in this study, I document that overleverage limits managers in
investment decisions as well as the form and the level of financing. I show that overleveraged
firms are less likely to go to debt markets and are more likely to use equity to finance their
acquisitions. Furthermore, using equity does not suffice for overleveraged firms to offer
premiums as high as other firms. This, in turn, constrains the acquisition activity of

26
overleveraged firms. Therefore, this study suggests that excess positive leverage deficit not only
limits the access to debt markets, but also constrains the exploitation of equity market, which,
collectively, decreases the acquisition activity of overleveraged firms.
This study supports the usefulness of the target capital structure concept. It shows that the
deviation from the target capital structure affects the ability to make acquisitions as well as
influencing the method of payment. Furthermore, it improves our understanding on why firms
adjust debt ratios more quickly when they are overleveraged (Leary and Roberts, 2005). The
findings in this paper indicate that a higher likelihood of forgoing acquisition opportunities
yields quicker leverage adjustments for overleveraged firms. These findings also shed some light
on the role of anticipation of investment opportunities on capital structure decisions. The
findings in this paper establish a link between acquisitions and security issuance decisions
through leverage deficit while extending the role of leverage deficit in security issuance to real
investment decisions.

27
References
Almazan, A., A. de Motta, S. Titman, and V. Uysal, “Financial Structure, Acquisition Opportunities, and Firm Locations,” Journal of Finance, (Forthcoming 2009). Amihud, Y., and B. Lev, “Risk Reduction as a Managerial Motive for Conglomerate Mergers,” Bell Journal of Economics, 1981, Vol. 12, pp. 605-617. Andrade, G., M. Mitchell and E. Stafford, “New Evidence and Perspectives on Mergers,” Journal of Economic Perspectives, 2001, Vol. 15, pp. 103-120. Asquith, P., R.F. Bruner, and D.W. Mullins, Jr., “The Gains to Bidding Firms from Mergers,” Journal of Financial Economics, 1983, Vol. 11, pp. 121–139 Baker, M., and J. Wurgler, “Market Timing and Capital Structure,” Journal of Finance, 2002, Vol. 57(1), pp. 1-32. Berkovitch, E., and M.P. Narayanan, “Competition and the Medium of Exchange in Takeovers,” Review of Financial Studies, 1990, Vol. (3), pp. 153–174. Bharadwaj, A., and A. Shivdasani, “Valuation Effects of Bank Financing in Acquisitions,” Journal of Financial Economics, 2003, Vol. 67(1), pp. 113-48. Bruner, R. F. “The Use of Excess Cash and Debt Capacity as a Motive for Merger” Journal of Financial and Quantitative Analysis, 1988, Vol. (23), pp. 199-217 Cai, J. and A.M. Vijh, “Incentive Effects of Stock and Option Holdings of Target and Acquirer CEOs,” Journal of Finance, 2007, Vol. 62(4), pp. 1891-1933 Eckbo, E.E., R.M. Giammarino, and R.L. Heinkel, “Asymmetric Information and the Medium of Exchange in Takeovers: Theory and Evidence,” Review of Financial Studies, 1990, Vol. 3, pp. 651–675. Fama, E.F., and K.R. French, “Testing Trade-Off and Pecking Order Predictions about Dividends and Debt,” Review of Financial Studies, 2002, Vol. 15, pp.1-33 Flannery, M.J., and K. P. Rangan, “Partial Adjustment toward Target Capital Structures,” Journal of Financial Economics, 2006, Vol. 79, pp. 469-506 Frank, M. Z., and V. K. Goyal “Testing the Pecking Order Theory of Capital Structure” Journal of Financial Economics, 67 (2003), 217-248 Frank, M., and V. Goyal, "Trade-off and Pecking Order Theories of Debt" forthcoming in Espen Eckbo (ed.) Handbook of Corporate Finance: Empirical Corporate Finance, Vol. 2, 2009.

28
Frank, M., and V. Goyal, 2007, "Capital Structure Decisions: Which Factors are Reliably Important?," Working paper, University of Minnesota and HKUST Fuller, K., J. Netter, and M. Stegemoller, “What Do Returns to Acquiring Firms Tell Us? Evidence from Firms that Make Many Acquisitions,” Journal of Finance, 2002, Vol. 57, pp. 1763–1794. Goyal, V.K., K. Lehn, and S. Racic, “Growth Opportunities and Corporate Debt Policy: The Case of the U.S. Defense Industry,” Journal of Financial Economics, 2002, Vol. 64, pp. 35-59 Graham, J.R., and C.R. Harvey, “The Theory and Practice of Corporate Finance: Evidence from the Field,” Journal of Financial Economics, 2001, Vol. 60, pp. 187-243. Greenwald, B., J.E. Stiglitz, and A. Weiss, “Informational Imperfections in the Capital Market and Macroeconomic Fluctuations,” American Economic Review, 1984, Vol. 74(2), pp. 194-99 Hansen, R.G., “A Theory for the Choice of Exchange Medium in Mergers and Acquisitions,” Journal of Business, 1987. Vol. 60, 75–95. Harford, J. “Corporate Cash Reserves and Acquisitions” Journal of Finance, 1999, Vol. 54, pp. 1969-1997 Harford, J., S. Klasa, and N. Walcott, “Do Firms Have Leverage Targets? Evidence from Acquisitions” Journal of Financial Economics, 2009, Vol. 93, 1-14 Harris, M., and A. Raviv, “The Theory of Capital Structure,” Journal of Finance, 1991, Vol. 46(1), pp. 297-355 Hart, O., and J. Moore, “Debt and Seniority: An Analysis of the Role of Hard Claims in Constraining Management,” American Economic Review, 1995, Vol. 85(3), pp. 567-85 Hartzell, J.C., E. Ofek, and D. Yermack, “What’s In It for Me? CEOs Whose Firms Are Acquired,” Review of Financial Studies, 2004, Vol. 17(1), pp. 37-61. Hege, U., S. Lovo, M.B. Slovin, and M.E. Sushka, “Equity and Cash in Intercorporate Asset Sales: Theory and Evidence,” Review of Financial Studies, 2009, Vol. 22(2), pp. 681-714 Hovakimian, A., G. Hovakimian, and H. Tehranian, “Determinants of Target Capital Structure: The Case of Dual Debt and Equity Issues” Journal of Financial Economics, 2004, Vol. 71, pp. 517-540 Hovakimian, A., T. Opler; and S. Titman, “The Debt-Equity Choice.” Journal of Financial and Quantitative Analysis, 2001, Vol. 36, pp. 1-24

29
Jensen, M.C. “Agency Costs of Free Cash Flow, Corporate Finance, and Takeovers” American Economic Review, 1986, Vol. 76, pp. 323-329 Kayhan, A., and S. Titman, “Firms’ Histories and Their Capital Structures,” Journal of Financial Economics, 2007, Vol. 83, pp. 1-32 Lang, L..; R.M. Stulz; and R.A. Walkling, “A Test of Free Cash Flow Hypothesis: The Case of Bidder Returns” Journal of Financial Economics, 1991, Vol. 29, pp. 315-336 Lang, L., E. Ofek, and R.M. Stulz, “Leverage, Investment, and Firm Growth,” Journal of Financial Economics, 1996, Vol. 40(1), pp. 3-29 Leary, M.T., and M.R. Roberts, “Do Firms Rebalance Their Capital Structures?,” Journal of Finance, 2005, Vol. 60, pp. 2575-2619 Maloney, M.T., R.E. McCormick, and M.L. Mitchell, “Managerial Decision Making and Capital Structure,” Journal of Business, 1993, Vol. 66, pp.189-217 Maquieira, C.P., W.L. Megginson, and L. Nail, “Wealth Creation versus Wealth redistribution In Pure Stock-for-Stock Mergers,” Journal of Financial Economics, Vol. 48, pp. 3-33. Martin, K., “The Method of Payment in Corporate Acquisitions, Investment Opportunities, and Management Ownership” Journal of Finance, 1996, Vol. 51, pp. 1227-1246 Masulis, R.W., C. Wang, and F. Xie, “Corporate Governance and Acquirer Returns,” Journal of Finance, 2007, Vol. 62(4), pp. 1851-89 Modigliani, F., and M. Miller, “The Cost of Capital, Corporation Finance, and the Theory of Investment,” American Economic Review, 1958, Vol. 48, pp. 267-297 Moeller, S.B., F. P. Schlingemann, and R.M. Stulz. “Firm Size and the Gains from Acquisitions” Journal of Financial Economics, 2004, Vol. 73, pp. 201-228 Morck, R., A. Shleifer, and R.W. Vishny, “Do Managerial Objectives Drive Bad Acquisitions?,” Journal of Finance, 1990, Vol. 45(1), pp. 31-48 Morellec, E., and A. Zhdanov, “Financing and Takeovers,” Journal of Financial Economics, 2008, Vol. 87(3), pp. 556-81 Murphy, K. J., Executive Compensation. In Ashenfelter, O., Card, D. (Ed.), Handbook of Labor Economics, Elsevier Science North Holland, 1999. Myers, S.C., “Determinants of Corporate Borrowing,” Journal of Financial Economics, 1977, Vol. 5, pp. 147-175 Myers, S.C., and N.S. Majluf ,“Corporate Financing and Investment Decisions when Firms

30
Have Information that Investors do not Have,” Journal of Financial Economics, 1984, Vol. 13, pp. 187-221. Officer, M., “Termination Fees in Mergers and Acquisitions” Journal of Financial Economics, 2003, Vol. 69, pp. 431-67. Petersen, M.A., “Estimating Standard Errors in Finance Panel Data Sets: Comparing Approaches,” Review of Financial Studies, 2009, Vol. 22, 435-480.
Rajan, R.G., and L. Zingales “What Do We Know about Capital Structure? Some Evidence from International Data” Journal of Finance, 1995, Vol. 50, pp. 1421-60. Rau, P.R. and T. Vermaelen, “Glamour, Value and the Post-Acquisition Performance of Acquiring Firms” Journal of Financial Economics, 1998, Vol. 49, pp. 223-53 Roll, R., “The Hubris Hypothesis of Corporate Takeovers,” Journal of Business, 1986, Vol. 59, pp. 197-216 Schlingemann, F.P., R.M. Stulz, and R.A. Walkling, “Divestitures and the Liquidity of the Market for Corporate Assets,” Journal of Financial Economics, 2002, Vol. 64(1), pp. 117-44 Shleifer, A., and R.W. Vishny, “Management Entrenchment: The Case of Manager-Specific Investments,” Journal of Financial Economics, 1989, Vol. 25(1), pp. 123-39 Shleifer, A., and R.W. Vishny, “Stock Market Driven Acquisitions,” Journal of Financial Economics, 2003, Vol. 70, pp. 295-311 Strebulaev, I., “Do Tests of Capital Structure Theory Mean What They Say?,” Journal of Finance, 2007, Vol. 62(4), pp. 1747-87. Titman, S., and R. Wessels, “The Determinants of Capital Structure Choice” Journal of Finance, 1988, Vol. 43, pp. 1-19 Travlos, N., “Corporate Takeover Bids, Methods of Payments and Bidding Firms’ Stock Returns” Journal of Finance, 1987, Vol. 42, pp. 943-963. Welch, I., “Capital Structure and Stock Returns,” Journal of Political Economy, 2004, Vol. 112(1), pp. 106-31 White, H. “A Heteroskedasticity-consistent Covariance Matrix Estimator and a Direct Test for Heteroskedasticity” Econometrica, 1980, Vol. 48, pp. 817-38. Zwiebel, J., “Dynamic Capital Structure under Managerial Entrenchment,” American Economic Review, 1996, Vol. 86(5), pp. 1197-1215

31
Table 1. Summary Statistics The table reports descriptive statistics for the sample. Panel A and Panel B report firm and deal characteristics, respectively. Variable definitions are in the Data Appendix. Panel A. Firm Characteristics Variable Obs Mean Std. Dev. Min Max Total Assets ($ million) 60630 2656 14625 1 795337 Market Value ($ million) 60630 4389 22023 2 1029870 Sales 60630 5.368 1.858 2.389 10.291 Stock Return 60630 0.167 0.698 -0.833 3.568 Market-to-Book 60630 1.811 1.282 0.587 8.462 EBITD/TA 60630 0.125 0.150 -0.436 0.600 Tangible Assets /TA 60624 0.293 0.227 0.000 1.000 R&D/TA 60630 0.040 0.084 0.000 2.847 Market Leverage 60630 0.378 0.245 0.021 0.954 Market Leverage Deficit 60630 0.000 0.188 -0.696 0.948 Ratio of Acquirers 60630 0.136 0.342 0.000 1.000 Ratio of Firm Acquirers 60630 0.061 0.239 0.000 1.000 Ratio of Asset Acquirers 60630 0.089 0.285 0.000 1.000 Number of Acquisitions 60630 0.184 0.584 0.000 34.000 Number of Firm Acquisitions 60630 0.072 0.343 0.000 34.000 Number of Asset Acquisition 60630 0.112 0.424 0.000 21.000 Acquisitions Value/TA 60630 0.038 0.152 0.000 1.097 Firm Acquisitions Value/TA 60630 0.019 0.101 0.000 0.791 Asset Acquisitions Value/TA 60630 0.013 0.062 0.000 0.454
Panel B. Deal Characteristics Variable Obs Mean Std. Dev. Min Max All Cash 10807 0.299 0.458 0 1 Combo 10807 0.543 0.498 0 1 All Stock 10807 0.158 0.364 0 1 Public Target 10807 0.165 0.371 0 1 Private Target 10807 0.484 0.500 0 1 Within-Industry Acquisition 10807 0.495 0.500 0 1 Firm Acquisition 10807 0.391 0.488 0 1
32
Table 2. Target Capital Structure Regression This table presents the OLS estimates of target leverage ratio over key financial measures documented in the literature. The dependent variable is Market Leverage. P-values are reported in parenthesis and are based on standard errors corrected for heteroskedasticity and for clustering by firm. Variable Definitions are in Data Appendix. **, * and + stand for statistical significance at the 1%, 5% and 10% levels, respectively.
Market LeverageSales 0.012**
(0.000)
Market-to-Book -0.053**(0.000)
R&D Missing Dummy 0.025**(0.000)
R&D/TA -0.414**(0.000)
EBITD/TA -0.356**(0.000)
Tangible Assets/TA 0.049**(0.000)
Stock Return -0.036**(0.000)
Year FE YesIndustry FE YesR-squared 0.407

33
Table 3. Firm Characteristics by Market Leverage Deficit Quartiles This table reports means of key variables of 60,630 firm-years recorded in the COMPUSTAT between 1990 and 2007. The p-values are for differences of means test from the first to the fourth quartile. Variable definitions are in the Data Appendix. **, * and + stand for statistical significance at the 1%, 5% and 10% levels, respectively.
Whole sample1 (Lowest) 2 3 4 (Largest) 1-4 p-value
Ratio of Acquirers 0.136 0.149 0.165 0.141 0.088 0.062 0.000 **Ratio of Firm Acquirers 0.061 0.068 0.076 0.062 0.038 0.030 0.000 **Ratio of Asset Acquirers 0.089 0.097 0.108 0.093 0.058 0.040 0.000 **Ratio of Within-Industry Acquirers 0.072 0.077 0.086 0.075 0.048 0.029 0.000 **Ratio of Cross-Industry Acquirers 0.075 0.086 0.093 0.076 0.045 0.040 0.000 **Ratio of Public Acquirers 0.027 0.030 0.035 0.028 0.015 0.015 0.000 **Acquisitions Value/TA 0.038 0.043 0.046 0.037 0.025 0.018 0.000 **Firm Acquisitions Value/TA 0.019 0.022 0.023 0.018 0.012 0.009 0.000 **Asset Acquisitions Value/TA 0.013 0.015 0.016 0.014 0.009 0.006 0.000 **Within-Industry Acquisitons Value/TA 0.016 0.018 0.019 0.017 0.011 0.007 0.000 **Cross-Industry Acquisitions Value/TA 0.015 0.017 0.019 0.014 0.009 0.008 0.000 **Public Acquisitions Value/TA 0.007 0.008 0.009 0.008 0.004 0.004 0.000 **
Leverage Deficit Quartiles

34
Table 4. Does Leverage Deficit Affect Acquisition Decisions? Table presents probit analysis in odd-numbered models and tobit analysis in even-numbered models. The dependent variable in probit models takes value one if the firm undertakes an acquisition, and tobit analysis estimates the ratio of sum of acquisition value to the firm’s total assets. Variable definitions are in the Data Appendix. The p-values are given in parenthesis and are adjusted for standard errors clustered by firm. All models include year dummies. **, * and + stand for statistical significance at the 1%, 5% and 10% levels, respectively.
(1) (2) (3) (4) (5) (6) (7) (8) (9) (10)Market Leverage Deficit -0.108** -0.275** -0.048** -0.290** -0.071** -0.144** -0.047** -0.174** -0.071** -0.227**
(0.000) (0.000) (0.000) (0.000) (0.000) (0.000) (0.000) (0.000) (0.000) (0.000)
Sales 0.012** 0.019** 0.009** 0.046** 0.006** 0.004* 0.006** 0.015** 0.008** 0.018**(0.000) (0.000) (0.000) (0.000) (0.000) (0.025) (0.000) (0.000) (0.000) (0.000)
Stock Return 0.020** 0.065** 0.010** 0.070** 0.014** 0.033** 0.010** 0.044** 0.014** 0.048**(0.000) (0.000) (0.000) (0.000) (0.000) (0.000) (0.000) (0.000) (0.000) (0.000)
Market-to-Book 0.010** 0.036** 0.010** 0.067** 0.000 -0.000 0.006** 0.028** 0.004** 0.017**(0.000) (0.000) (0.000) (0.000) (0.943) (0.916) (0.000) (0.000) (0.000) (0.000)
EBITD/TA 0.151** 0.411** 0.043** 0.257** 0.125** 0.287** 0.091** 0.364** 0.069** 0.235**(0.000) (0.000) (0.000) (0.000) (0.000) (0.000) (0.000) (0.000) (0.000) (0.000)
Industry M&A Liquidity 0.311** 0.787** 0.135** 0.804** 0.224** 0.451** 0.303** 1.150** 0.002 -0.025(0.000) (0.000) (0.000) (0.000) (0.000) (0.000) (0.000) (0.000) (0.927) (0.777)
Herfindahl Index -0.072** -0.188** -0.042** -0.257** -0.043** -0.084** -0.095** -0.378** 0.005 0.029(0.000) (0.000) (0.000) (0.000) (0.000) (0.000) (0.000) (0.000) (0.543) (0.313)
Observations 60630 60630 60630 60630 60630 60630 60630 60630 60630 60630Pseudo R-square 0.040 0.050 0.032 0.045 0.033P-value 0.000 0.000 0.000 0.000 0.000 0.000 0.000 0.000 0.000 0.000
All Acquisitions Firm Acquisitions Asset Acquisitions Within-Industry Acquisitions Cross-Industry Acquisitions
35
Table 5. Disentangling the Effects of Underleverage and Overleverage on Acquisitions Table presents probit analysis in odd-numbered models and tobit analysis in even-numbered models. The dependent variable in probit models takes value one if the firm undertakes an acquisition, and tobit analysis estimates the ratio of sum of acquisition value to the firm’s total assets. Variable definitions are in the Data Appendix. The p-values are given in parenthesis and are adjusted for standard errors clustered by firm. All models include year dummies. **, * and + stand for statistical significance at the 1%, 5% and 10% levels, respectively.
(1) (2) (3) (4) (5) (6) (7) (8) (9) (10)Underleveraged Firm Dummy -0.001 -0.005 0.000 0.000 -0.001 -0.005 -0.001 -0.005 0.001 0.001
(0.859) (0.627) (0.963) (0.976) (0.780) (0.461) (0.730) (0.638) (0.607) (0.907)
Overleveraged Firm Dummy -0.044** -0.122** -0.018** -0.120** -0.030** -0.068** -0.020** -0.080** -0.028** -0.098**(0.000) (0.000) (0.000) (0.000) (0.000) (0.000) (0.000) (0.000) (0.000) (0.000)
Sales 0.012** 0.018** 0.009** 0.045** 0.006** 0.003+ 0.006** 0.014** 0.008** 0.017**(0.000) (0.000) (0.000) (0.000) (0.000) (0.076) (0.000) (0.000) (0.000) (0.000)
Stock Return 0.022** 0.072** 0.011** 0.077** 0.015** 0.036** 0.011** 0.049** 0.015** 0.053**(0.000) (0.000) (0.000) (0.000) (0.000) (0.000) (0.000) (0.000) (0.000) (0.000)
Market-to-Book 0.010** 0.037** 0.010** 0.068** 0.000 0.000 0.006** 0.028** 0.005** 0.017**(0.000) (0.000) (0.000) (0.000) (0.756) (0.884) (0.000) (0.000) (0.000) (0.000)
EBITD/TA 0.147** 0.399** 0.041** 0.248** 0.122** 0.279** 0.089** 0.356** 0.066** 0.226**(0.000) (0.000) (0.000) (0.000) (0.000) (0.000) (0.000) (0.000) (0.000) (0.000)
Industry M&A Liquidity 0.304** 0.768** 0.132** 0.784** 0.219** 0.441** 0.299** 1.137** -0.002 -0.039(0.000) (0.000) (0.000) (0.000) (0.000) (0.000) (0.000) (0.000) (0.951) (0.661)
Herfindahl Index -0.070** -0.181** -0.041** -0.249** -0.041** -0.080** -0.094** -0.373** 0.007 0.034(0.000) (0.000) (0.000) (0.000) (0.000) (0.000) (0.000) (0.000) (0.431) (0.230)
Observations 60630 60630 60630 60630 60630 60630 60630 60630 60630 60630Pseudo R-square 0.040 0.050 0.032 0.045 0.033P-value 0.000 0.000 0.000 0.000 0.000 0.000 0.000 0.000 0.000 0.000
All Acquisitions Firm Acquisitions Asset Acquisitions Within-Industry Acquisitions Cross-Industry Acquisitions

36
Table 6. Does Leverage Deficit Affect the Method of Payment? Table presents probit analysis in odd-numbered models and tobit analysis in even-numbered models. The dependent variable in probit models is All-Cash, and tobit analysis estimates the percentage of cash in the acquisition offer. The p-values in both probit and tobit analyses are based on standard errors corrected for clustering by firm. Variable definitions are in the Data Appendix. All models include year dummies. **, * and + stand for statistical significance at the 1%, 5% and 10% levels, respectively.
<< Table on the next page >>

37
(1) (2) (3) (4) (5) (6) (7) (8) (9) (10) (11) (12)Market Leverage Deficit -0.159** -13.327** -0.216** -17.879** -0.095* -7.042+
(0.000) (0.000) (0.000) (0.000) (0.012) (0.081)
Overleveraged Firm -0.069** -5.095** -0.099** -8.073** -0.039* -2.257(0.000) (0.001) (0.000) (0.000) (0.018) (0.204)
Underleveraged Firm 0.003 0.559 0.001 -0.175 0.001 0.437(0.799) (0.620) (0.967) (0.911) (0.947) (0.767)
Sales 0.009** 1.095** 0.008** 1.032** -0.004 0.510 -0.005 0.429 0.021** 1.916** 0.020** 1.884**(0.003) (0.002) (0.010) (0.003) (0.385) (0.315) (0.237) (0.396) (0.000) (0.000) (0.000) (0.000)
Relative Size -0.035** 0.473 -0.035** 0.467 -0.065** -2.957** -0.065** -2.958** -0.005 3.655** -0.005 3.650**(0.000) (0.192) (0.000) (0.198) (0.000) (0.000) (0.000) (0.000) (0.229) (0.000) (0.219) (0.000)
Market-to-Book -0.006+ -2.211** -0.005 -2.148** -0.020** -3.674** -0.019** -3.628** 0.015** 0.640 0.016** 0.695(0.096) (0.000) (0.166) (0.000) (0.000) (0.000) (0.000) (0.000) (0.002) (0.218) (0.001) (0.181)
EBITD/TA 0.228** 17.638** 0.220** 17.097** 0.379** 26.192** 0.373** 25.649** 0.097* 6.061 0.091+ 5.702(0.000) (0.000) (0.000) (0.000) (0.000) (0.000) (0.000) (0.000) (0.037) (0.222) (0.050) (0.249)
Stock Return -0.032** -2.490** -0.029** -2.219** -0.006 -0.480 -0.000 0.034 -0.046** -3.593** -0.044** -3.467**(0.000) (0.000) (0.000) (0.001) (0.566) (0.577) (0.964) (0.969) (0.000) (0.000) (0.000) (0.000)
Within-Industry Acquisition -0.016+ -2.088* -0.017+ -2.142* -0.019 -1.248 -0.019 -1.312 -0.015 -2.779* -0.016 -2.806*(0.074) (0.047) (0.066) (0.041) (0.157) (0.418) (0.153) (0.389) (0.205) (0.031) (0.196) (0.030)
Public Target -0.036** -3.027+ -0.035* -2.935+ 0.068** 3.327 0.067** 3.325 -0.109+ 1.069 -0.109+ 0.993(0.008) (0.059) (0.010) (0.068) (0.002) (0.137) (0.002) (0.139) (0.065) (0.862) (0.066) (0.872)
Private Target -0.106** -5.541** -0.106** -5.510** -0.092** -8.205** -0.093** -8.226** -0.083** -2.124+ -0.082** -2.098+(0.000) (0.000) (0.000) (0.000) (0.000) (0.000) (0.000) (0.000) (0.000) (0.083) (0.000) (0.088)
Competed 0.208** 21.356* 0.207** 21.285* 0.233** 23.845** 0.231** 23.601** 0.032 11.417 0.037 11.686(0.000) (0.023) (0.000) (0.020) (0.000) (0.008) (0.000) (0.006) (0.777) (0.337) (0.744) (0.324)
Industry M&A Liquidity -0.201** -17.301* -0.208** -17.835* -0.236* -14.357 -0.254* -15.518+ -0.199* -21.086* -0.203* -21.365*(0.004) (0.028) (0.003) (0.022) (0.021) (0.115) (0.013) (0.088) (0.033) (0.048) (0.030) (0.043)
Herfindahl Index -0.025 0.210 -0.022 0.492 -0.002 7.850 0.007 8.649+ -0.035 -3.435 -0.034 -3.339(0.393) (0.947) (0.460) (0.875) (0.968) (0.132) (0.874) (0.093) (0.353) (0.364) (0.371) (0.377)
Observations 10807 10807 10807 10807 4221 4221 4221 4221 6586 6586 6586 6586(Pseudo) R-square 0.067 0.070 0.067 0.069 0.146 0.160 0.148 0.160 0.042 0.048 0.042 0.048
All Acquisitions Firm Acquisitions Asset Acquisitions
38
Table 7. Does Leverage Deficit Affect Premiums Paid to Targets? The table reports regression estimates for Acquisition Premium and Target CAR(-20,+1). The p-values are based on standard errors corrected for heteroskedasticity and for clustering by firm. Variable definitions are in the Data Appendix. All models include year dummies. **, * and + stand for statistical significance at the 1%, 5% and 10% levels, respectively.
(1) (2) (3) (4)Market Leverage Deficit 0.018 0.013
(0.841) (0.832)
Overleveraged Firm -0.083* -0.054*(0.037) (0.024)
Underleveraged Firm -0.035 -0.020(0.164) (0.293)
Sales 0.007 0.005 0.014** 0.013**(0.286) (0.470) (0.004) (0.010)
Market-to-Book 0.050** 0.053** 0.026** 0.027**(0.000) (0.000) (0.000) (0.000)
EBITD/TA -0.082 -0.071 0.100 0.106(0.495) (0.554) (0.201) (0.178)
Stock Return 0.012 0.008 -0.023 -0.026+(0.545) (0.684) (0.122) (0.090)
Within-Industry Acquisition -0.012 -0.013 -0.015 -0.015(0.612) (0.585) (0.376) (0.362)
All Cash 0.037 0.032 0.099** 0.095**(0.101) (0.161) (0.000) (0.000)
Competed 0.014 0.021 -0.080** -0.075**(0.750) (0.637) (0.005) (0.009)
Hostile 0.135** 0.143** -0.003 0.001(0.009) (0.007) (0.946) (0.980)
Industry M&A Liquidity -0.161 -0.167 -0.034 -0.041(0.280) (0.261) (0.773) (0.733)
Herfindahl Index -0.051 -0.048 0.103 0.107(0.525) (0.554) (0.147) (0.134)
Market-to-Book (Target Firm) -0.030** -0.031** -0.020* -0.020**(0.008) (0.006) (0.011) (0.009)
EBITD/TA (Target Firm) 0.257** 0.259** -0.149+ -0.150+(0.003) (0.002) (0.070) (0.068)
Stock Return (Target Firm) -0.015 -0.015 -0.034* -0.033*(0.433) (0.431) (0.019) (0.024)
Observations 1005 1005 1220 1220R-squared 0.066 0.073 0.130 0.134
Acquisition Premium Target CAR(-20,+1)

39
Table 8. OLS Regressions of Acquirer Returns The table reports coefficient estimates of acquirer returns which are calculated over a five-day event window (two days before and two days after the announcement date). The benchmark returns are the value-weighted index of returns including dividends for the combined New York Stock Exchange, American Stock Exchange and NASDAQ. Variable definitions are in the Appendix. The p-values are given in parenthesis and are adjusted for heteroskedasticity and for clustering by firm. All regressions include year dummies. **, * and + stand for statistical significance at the 1%, 5% and 10% levels, respectively.
<< Table on the next page >>
40
(1) (2) (3) (4) (5) (6) (7) (8) (9) (10) (11) (12)Market Leverage Deficit 0.027** 0.032+ 0.024*
(0.003) (0.067) (0.018)
Overleveraged Firm 0.011** 0.019** 0.007+(0.002) (0.009) (0.063)
Underleveraged Firm 0.000 0.000 0.000(0.886) (0.929) (0.923)
Market Leverage Deficit x Surprise Offer 0.037* 0.044 0.041*(0.030) (0.125) (0.034)
Market Leverage Deficit x Expected Offer 0.005 -0.003 0.008(0.594) (0.865) (0.480)
Overleveraged x Surprise Offer 0.016* 0.027* 0.013*(0.011) (0.027) (0.032)
Overleveraged x Expected Offer 0.000 0.001 -0.002(0.920) (0.889) (0.700)
Underleveraged x Surprise Offer 0.003 0.010 0.000(0.598) (0.216) (0.948)
Underleveraged x Expected Offer 0.001 -0.001 0.000(0.730) (0.784) (0.915)
Surprise Offer 0.010** 0.007+ 0.020** 0.011 0.001 0.000(0.003) (0.077) (0.000) (0.113) (0.742) (0.960)
Sales -0.002** -0.002* -0.001 -0.001 -0.004** -0.004** -0.002 -0.002 -0.000 -0.000 -0.000 0.000(0.010) (0.019) (0.150) (0.218) (0.001) (0.001) (0.126) (0.122) (0.822) (0.948) (0.854) (0.958)
Relative Size 0.006** 0.006** 0.006** 0.006** 0.001 0.001 0.001 0.001 0.010** 0.010** 0.010** 0.010**(0.000) (0.000) (0.000) (0.000) (0.471) (0.449) (0.351) (0.353) (0.000) (0.000) (0.000) (0.000)
Market-to-Book -0.004** -0.004** -0.003** -0.003** -0.004** -0.005** -0.003+ -0.003+ -0.003** -0.004** -0.003* -0.003**(0.000) (0.000) (0.000) (0.001) (0.003) (0.002) (0.062) (0.052) (0.008) (0.004) (0.011) (0.007)
EBITD/TA -0.021* -0.020* -0.011 -0.009 -0.021 -0.021 -0.010 -0.010 -0.021+ -0.019 -0.019 -0.014(0.016) (0.023) (0.252) (0.357) (0.101) (0.107) (0.423) (0.419) (0.094) (0.122) (0.156) (0.280)
Stock Return 0.006** 0.005* 0.006** 0.006** 0.011** 0.010** 0.011** 0.012** 0.002 0.002 0.002 0.002(0.006) (0.013) (0.003) (0.003) (0.007) (0.008) (0.003) (0.002) (0.308) (0.472) (0.357) (0.379)
Public Target -0.036** -0.036** -0.036** -0.036** -0.039** -0.039** -0.039** -0.038** -0.010 -0.010 -0.010 -0.010(0.000) (0.000) (0.000) (0.000) (0.000) (0.000) (0.000) (0.000) (0.560) (0.574) (0.560) (0.567)
Private Target 0.000 0.000 0.000 0.000 -0.002 -0.002 -0.002 -0.001 -0.002 -0.002 -0.002 -0.002(0.956) (0.973) (0.914) (0.932) (0.683) (0.733) (0.777) (0.792) (0.383) (0.353) (0.411) (0.375)
Within-Industry Acquisition -0.002 -0.002 -0.002 -0.002 -0.009* -0.009* -0.008* -0.009* 0.004 0.004 0.004 0.004+(0.328) (0.355) (0.426) (0.454) (0.017) (0.016) (0.031) (0.026) (0.118) (0.107) (0.123) (0.098)
All Cash 0.004+ 0.004+ 0.004+ 0.004+ 0.015** 0.015** 0.015** 0.015** -0.003 -0.003 -0.003 -0.003(0.095) (0.092) (0.069) (0.078) (0.001) (0.000) (0.000) (0.000) (0.164) (0.155) (0.180) (0.171)
Competed 0.026 0.026 0.025 0.026 0.023 0.023 0.021 0.022 -0.005 -0.006 -0.005 -0.005(0.384) (0.391) (0.388) (0.385) (0.342) (0.349) (0.354) (0.353) (0.886) (0.864) (0.885) (0.878)
Hostile -0.012 -0.011 -0.011 -0.011 -0.003 -0.002 -0.002 -0.003 -0.163** -0.159** -0.160** -0.159**(0.436) (0.474) (0.491) (0.488) (0.834) (0.865) (0.865) (0.842) (0.000) (0.000) (0.000) (0.000)
Industry M&A Liquidity -0.005 -0.004 -0.002 -0.001 0.013 0.016 0.017 0.019 -0.014 -0.012 -0.012 -0.011(0.703) (0.775) (0.881) (0.938) (0.561) (0.488) (0.453) (0.401) (0.441) (0.485) (0.482) (0.541)
Herfindahl Index 0.005 0.004 0.003 0.003 0.009 0.007 0.005 0.005 0.004 0.003 0.003 0.002(0.403) (0.473) (0.618) (0.664) (0.417) (0.507) (0.617) (0.664) (0.594) (0.644) (0.677) (0.726)
Observations 10807 10807 10807 10807 4221 4221 4221 4221 6586 6586 6586 6586R-squared 0.038 0.038 0.040 0.040 0.062 0.063 0.065 0.067 0.038 0.037 0.039 0.038
All Acquisitions Firm Acquisitions Asset Acquisitions
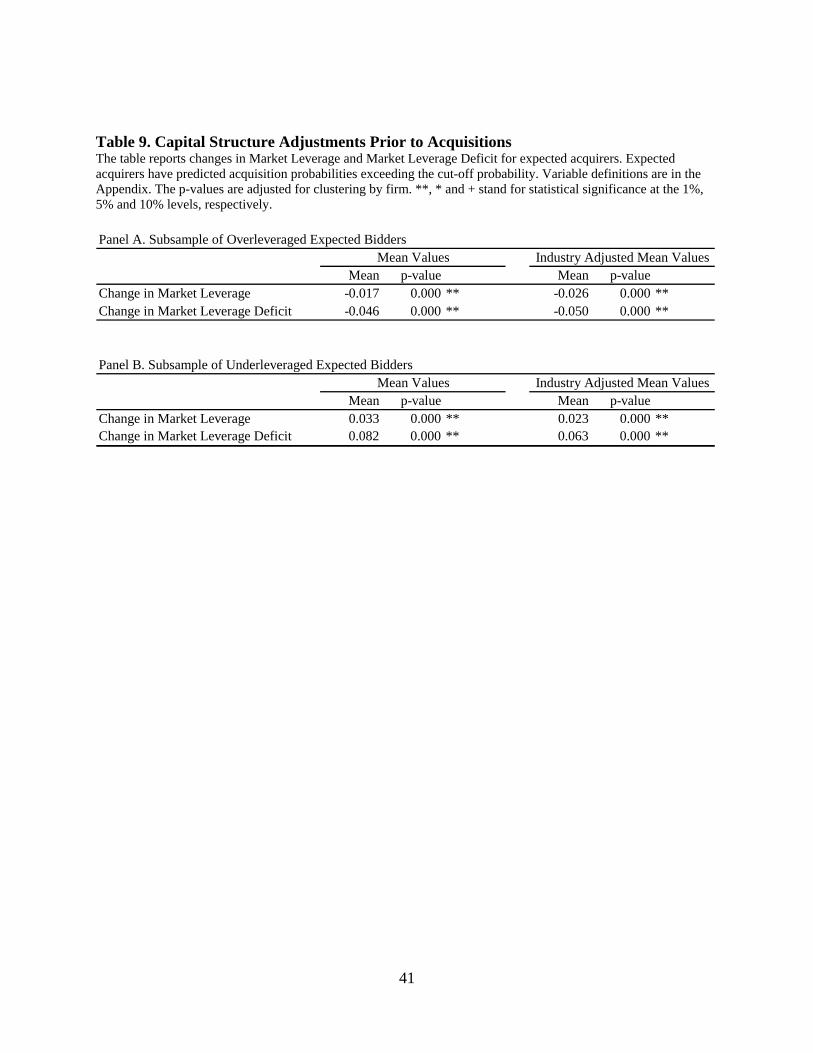
41
Table 9. Capital Structure Adjustments Prior to Acquisitions The table reports changes in Market Leverage and Market Leverage Deficit for expected acquirers. Expected acquirers have predicted acquisition probabilities exceeding the cut-off probability. Variable definitions are in the Appendix. The p-values are adjusted for clustering by firm. **, * and + stand for statistical significance at the 1%, 5% and 10% levels, respectively.
Mean p-value Mean p-valueChange in Market Leverage -0.017 0.000 ** -0.026 0.000 **Change in Market Leverage Deficit -0.046 0.000 ** -0.050 0.000 **
Mean p-value Mean p-valueChange in Market Leverage 0.033 0.000 ** 0.023 0.000 **Change in Market Leverage Deficit 0.082 0.000 ** 0.063 0.000 **
Panel A. Subsample of Overleveraged Expected BiddersMean Values Industry Adjusted Mean Values
Panel B. Subsample of Underleveraged Expected BiddersMean Values Industry Adjusted Mean Values

42
DATA APPENDIX (in alphabetical order)
- (All) Acquisitions refers to all domestic transactions in the U.S. for $1 million or more over a year
listed in the SDC-M&A database as an acquisition of majority interest, merger, asset acquisition or
acquisition of certain assets.
- Acquisition Premium is the ratio of value of components of the offer (i.e., aggregate value of cash,
stock and other securities) to the market capitalization of the target 40 days prior to the announcement
date.
- Acquisitions Value / TA is the ratio of the total dollar volume of (All) Acquisitions made by the firm
during a year to the firm’s Total Assets (Item AT) at the beginning of the year.
- All Cash takes value one if the transaction is paid with all cash.
- All Stock refers to all-stock financed All Acquisitions.
- Asset Acquisitions refers to all domestic transactions in the U.S. for $1 million or more over a
calendar year listed in the SDC-M&A database as an asset acquisition or acquisition of certain assets.
- Asset Acquisitions Value / TA is the ratio of the total dollar volume of Asset Acquisitions made by the
firm during a year to the firm’s Total Assets (Item AT) at the beginning of the year.
- Acquirer is a dummy variable that takes a value of one if the firm is identified as an acquirer in All
Acquisitions by the SDC M&A database, and of zero otherwise.
- Book Debt is Total Assets (Item AT) minus Book Equity (as defined below).
- Book Equity is defined as Total Assets (Item AT) minus liabilities (Item LT) plus balance sheet
deferred taxes and investment tax credit (Item TXDITC) minus Preferred Stock (as defined below).
- Book Leverage is Book Debt over Total Assets (Item AT).
- CAR is the cumulative abnormal returns to bidders which are calculated over a five-day event window
(two days before and two days after the announcement date). The benchmark returns are the value-
weighted index of returns including dividends for the combined New York Stock Exchange,
American Stock Exchange and NASDAQ.
- Cash Percentage is the percentage of cash offered in the transaction.
- Combo takes value one if the transaction is paid with a mix of cash, equity and other considerations.
- Competed takes value one if there is more than one bidder.
- Cross-Industry Acquisitions refers to All Acquisitions in which the acquirer and the target do not
belong to the same 3-digit SIC.
- Cross-Industry Acquisitions Value / TA is the ratio of the total dollar volume of Cross-Industry
Acquisitions made by the firm during a year to the firm’s Total Assets (Item AT) at the beginning of
the year.

43
- Cross-Industry Acquirer is a dummy variable that takes a value of one if the firm is identified as an
acquirer in a Cross-Industry Acquisition, and of zero otherwise.
- Expected Offer takes value one if the predicted probability of being an (All, Firm and Asset) Acquirer
in equation 2 exceeds the cut-off probability. The cut-off probabilities for All, Firm and Asset
Acquisitions are 0.13, 0.06 and 0.09, respectively. Please see page 21 on further information on
calculation of cut-off probabilities.
- Firm Acquisitions refers to all domestic transactions in the U.S. for $1 million or more over a
calendar year listed in the SDC-M&A database as an acquisition of majority interest or merger.
- Firm Acquisitions Value / TA is the ratio of the total dollar volume of Firm Acquisitions made by the
firm during a year to Total Assets (Item AT) at the beginning of the year.
- Herfindahl Index is sum of the squares of the market shares of all firms sharing the same three-digit
SIC, where market share is defined as sales of a firm (Item Sale) to sum of sales with the industry.
- Industry M&A Liquidity is sum of Acquisitions Value for each year and three-digit SIC code divided
by the Total Assets (Item AT) of all COMPUSTAT firms in the same three-digit SIC and year.
- (Market) Leverage Deficit is Market Leverage minus Target Leverage (as defined below).
- Market Equity is common shares outstanding (Item CSHO) times the stock price (Item PRCC_F).
- Market Leverage is Book Debt over Market Value (as defined below).
- Market-to-Book ratio is Market Value (as defined below) over Total Assets (Item AT).
- Market Value is defined as liabilities (Item LT) minus balance sheet deferred taxes and investment tax
credit (Item TXDITC) plus Preferred Stock (as defined below) plus Market Equity (Item CSHO x Item
PRCC_F).
- Net Book Leverage is Book Debt minus cash and marketable securities (Item CHE) over Total Assets
(Item AT).
- Net Market Leverage is Book Debt minus cash and marketable securities (Item CHE) over Market
Value.
- Number of Acquisitions is the total number of Acquisitions undertaken in a year.
- Number of Asset Acquisitions is the total number of Asset Acquisitions undertaken in a year.
- Number of Firm Acquisitions is the total number of Firm Acquisitions undertaken in a year.
- Overleveraged Firm Dummy takes value one if Leverage Deficit falls in the largest quartile.
- Preferred Stock is equal to liquidating value (Item PSTKL) if available, else redemption value (Item
PSTKRV) if available, else carrying value (Item PSTK).
- Public Acquisitions refers to All Acquisitions in which the target (as defined by the SDC M&A
database) is a public firm.

44
- Public Acquisitions Value / TA is the ratio of the total dollar volume of Public Acquisitions made by
the firm during a year to the firm’s Total Assets (Item AT) at the beginning of the year.
- Public Acquirer is a dummy variable that takes a value of one if the firm is identified as an acquirer in
Public Acquisitions by the SDC M&A database, and of zero otherwise.
- R&D Dummy is a dummy variable that takes a value of one if COMPUSTAT reports R&D expense
(Item XRD) as missing, and of zero otherwise .
- R&D / TA is defined as R&D expenses (Item XRD) over Total Assets (Item AT).
- Ratio of Acquirers is the proportion of firms that are listed as acquirers in acquisitions of majority
interest, mergers, asset acquisitions or acquisitions of certain assets as defined in the SDC-M&A
database.
- Ratio of Asset Acquirers is the proportion of firms that are listed as acquirers in an asset acquisition or
in an acquisition of certain assets as defined in the SDC-M&A database.
- Ratio of Firm Acquirers is the proportion of firms that are listed as acquirers in an acquisition of
majority interest or in a merger as defined in the SDC-M&A database.
- Ratio of Public Acquirers is the proportion of firms that are listed as acquirers in acquisitions of
majority interest, mergers, asset acquisitions or acquisitions of certain assets as defined in the SDC-
M&A database, and in which the target is a public firm.
- Ratio of Within-Industry Acquirers is the proportion of firms that are listed as Within-Industry
Acquirers.
- Ratio of Cross-Industry Acquirers is the proportion of firms that are listed as Cross-Industry
Acquirers.
- Relative Size is the natural logarithm of the ratio of Transaction Value to Total Assets of the acquirer
at the end of the fiscal year prior to the acquisition announcement.
- Sales is the natural logarithm of sales (Item SALE) in 1990 dollars.
- Stock Return is the firm’s annual stock return.
- Surprise Offer takes value one if the predicted probability of being an acquirer in equation 2 is lower
than the cut-off probability. The cut-off probabilities for Acquisitions, Firm and Asset Acquisitions are
0.13, 0.06 and 0.09. Please see page 21 on further information on calculation of cut-off probabilities.
- Target CAR is the cumulative abnormal returns to target over the period starting 20 days prior to the
announcement to 1 day after the announcement day. The benchmark returns are the value-weighted
index of returns including dividends for the combined New York Stock Exchange, American Stock
Exchange and NASDAQ.
- Tangible Assets / TA is net property, plant and equipment (Item PPENT) over Total Assets (Item AT).
- Target Leverage is the fitted value of the leverage regression (equation 1).

45
- Total Assets (TA) is measured as the book value of assets (Item AT)
- Transaction Value is the total value of considerations paid by the acquirer, excluding fees and
expenses.
- Underleveraged Firm Dummy takes value one if Market Leverage Deficit falls in the lowest quartile.
- Within-Industry Acquisitions refers to All Acquisitions in which the acquirer and the target belong to
the same 3-digit SIC.
- Within-Industry Acquisitions Value / TA is the ratio of the total dollar volume of Within-Industry
Acquisitions made by the firm during a year to the firm’s Total Assets (Item 6) at the beginning of the
year.
- Within-Industry Acquirer is a dummy variable that takes a value of one if the firm is identified as an
acquirer in a Within-Industry Acquisition, and of zero otherwise.