Developments in the GDP-GNI Gap in Hungary and the CEE Region* · Developments in the GDP-GNI Gap...
28
57 Developments in the GDP-GNI Gap in Hungary and the CEE Region* Eszter Balogh – Anna Boldizsár – Bence Gerlaki – Balázs Kóczián With the progress of globalisaon, due to the cross-border movement of the factors of producon, there is a gap between the output of the Hungarian economy and the primary income generated by producon, allocable to residents. The GDP-GNI gap shows the difference between the performance of the domesc economy and the primary income allocable to the individual sectors of the economy, and it also provides useful informaon on the current burdens of the country’s accumulated net foreign liabilies. This paper presents the factors that have influenced the changes in the GDP-GNI gap in recent years and examines how the income of the individual economic sectors has changed, breaking down the available data by industries and countries. We examine the correlaon between the GDP-GNI gap and the development of the economy by analysing the internaonal developments and regional trends, and then try to survey the trends that determine the domesc GDP-GNI gap over the short and long term. We find that, due to the ancipated growth in the income of foreign-owned companies, the GDP-GNI gap may increase over the short run, while its long-term trend depends significantly on whether the convergence of the Hungarian economy with the Western countries is implemented from external or internal funds. Journal of Economic Literature (JEL) codes: E01, F41, F43 Keywords: gross naonal income, GDP-GNI gap, primary income balance 1. Introducon In the past decades, an increasing demand has emerged in economics for macroeconomic indicators that can provide a more accurate picture of a naon’s disposable income compared to the Gross Domesc Product (GDP), since this indicator does not provide a full view of households’ income posion, and social and economic welfare (BEA 2015). Several studies highlighted the fact that in decision- making it is not sufficient to analyse the output level, but – depending on the economic policy and social objecve – various alternaves and supplements may Financial and Economic Review, Vol. 17 Issue 3, September 2018, pp. 57–84. * The papers in this issue contain the views of the authors which are not necessarily the same as the official views of the Magyar Nemze Bank. Eszter Balogh is a Junior Analyst at the Magyar Nemze Bank. E-mail: [email protected] Anna Boldizsár is an Analyst at the Magyar Nemze Bank. E-mail: [email protected] Bence Gerlaki is a Junior Analyst at the Magyar Nemze Bank. E-mail: [email protected] Balázs Kóczián is an Economic Analyst at the Magyar Nemze Bank. E-mail: [email protected] The Hungarian manuscript was received on 12 March 2018. DOI: hp://doi.org/10.25201/FER.17.3.5784
Transcript of Developments in the GDP-GNI Gap in Hungary and the CEE Region* · Developments in the GDP-GNI Gap...
57
Developments in the GDP-GNI Gap in Hungary and the CEE Region*
Eszter Balogh – Anna Boldizsár – Bence Gerlaki – Balázs Kóczián
With the progress of globalisation, due to the cross-border movement of the factors of production, there is a gap between the output of the Hungarian economy and the primary income generated by production, allocable to residents. The GDP-GNI gap shows the difference between the performance of the domestic economy and the primary income allocable to the individual sectors of the economy, and it also provides useful information on the current burdens of the country’s accumulated net foreign liabilities. This paper presents the factors that have influenced the changes in the GDP-GNI gap in recent years and examines how the income of the individual economic sectors has changed, breaking down the available data by industries and countries. We examine the correlation between the GDP-GNI gap and the development of the economy by analysing the international developments and regional trends, and then try to survey the trends that determine the domestic GDP-GNI gap over the short and long term. We find that, due to the anticipated growth in the income of foreign-owned companies, the GDP-GNI gap may increase over the short run, while its long-term trend depends significantly on whether the convergence of the Hungarian economy with the Western countries is implemented from external or internal funds.
Journal of Economic Literature (JEL) codes: E01, F41, F43Keywords: gross national income, GDP-GNI gap, primary income balance
1. Introduction
In the past decades, an increasing demand has emerged in economics for macroeconomic indicators that can provide a more accurate picture of a nation’s disposable income compared to the Gross Domestic Product (GDP), since this indicator does not provide a full view of households’ income position, and social and economic welfare (BEA 2015). Several studies highlighted the fact that in decision-making it is not sufficient to analyse the output level, but – depending on the economic policy and social objective – various alternatives and supplements may
Financial and Economic Review, Vol. 17 Issue 3, September 2018, pp. 57–84.
* The papers in this issue contain the views of the authors which are not necessarily the same as the official views of the Magyar Nemzeti Bank.
Eszter Balogh is a Junior Analyst at the Magyar Nemzeti Bank. E-mail: [email protected] Boldizsár is an Analyst at the Magyar Nemzeti Bank. E-mail: [email protected] Gerlaki is a Junior Analyst at the Magyar Nemzeti Bank. E-mail: [email protected]ázs Kóczián is an Economic Analyst at the Magyar Nemzeti Bank. E-mail: [email protected]
The Hungarian manuscript was received on 12 March 2018.
DOI: http://doi.org/10.25201/FER.17.3.5784

58 Studies
Eszter Balogh – Anna Boldizsár – Bence Gerlaki – Balázs Kóczián
be necessary (Costanza et al. 2009; Stiglitz et al. 2008). The increase in the mobility of capital and labour force intensified the need to use new economic indicators (Capelli – Vaggi 2013). The underlying reason for this was primarily the fact that, due to the intensive capital flows, the gap between the production performed in the territory of the respective country and the income of the economic agents is widening both in the developed and in the developing countries. As a result of this, the analyses focusing solely on GDP may show an incomplete picture as they are not sufficiently representative of the degree to which the resident economic agents share in the income generated in the territory of the country.
Policy-makers in Hungary have also long been concerned with the question of the volume of income effectively received by the domestic sectors from the gross product produced in Hungary and the volume of income leaving the country. Accordingly, it is also important to have a clear idea of the alternative indicators, supplementing the GDP and better capturing Hungary’s income position. Such indicators include, among other things, the gross national income (GNI), which adjusts the GDP (the volume of income produced in the territory of the country in the reporting period) for the owners’ profit transfers between the resident and non-resident sectors and for the current transfers, which are also stated under primary incomes. In this respect, GNI is a useful and easily accessible indicator, which is closely related to the non-macroeconomic indicators of quality of life (e.g. life expectancy at birth, children’s school enrolment ratio) (World Bank 2017). In addition, gross national disposable income (GNDI) – less often used in the technical literature – is also a useful indicator, which in addition to GNI, also takes into account unilateral current transfers from abroad, stated under secondary incomes. However, secondary incomes also contain items (e.g. the contribution by the Hungarian state to the EU budget), which can only be interpreted together with the capital transfers falling outside the scope of the income categories to be examined by us, and thus this paper primarily focuses on the changes in GNI. At the same time, it should be noted that for this reason examination of the GNDI indicator – which is less wide-spread in economic literature but bears outstanding importance in terms of an economy’s ultimate consumption, investment and saving and also considering capital transfers – may represent an interesting additional direction of research.
This analysis focuses on GNI, and on the GNI-GDP gap, since this indicator reflects the (primary) distribution of the incomes generated by the production of a national economy between residents and non-residents. While GNDI and adjusted GNDI include unilateral income transfers, GNI only considers (apart from wage incomes and current transfers) the interest and FDI income realised on the net outstanding foreign liabilities or assets. Due to this, GNI may be able to show the incomes from the activity of the economic agents much better, as it does not include the unilateral transfers – often one-off items – which may have an impact on the country’s position vis-à-vis the non-resident sector. GNI – in addition to quantifying the current burdens of an economy’s outstanding net foreign liabilities – also provides
59
Developments in the GDP-GNI Gap in Hungary and the CEE Region
information on the sustainability of the growth in debt and the factors impacting the dynamics of external debt (Oblath 2011). In this respect, it is particularly important to examine the developments in GNI and the GDP-GNI gap in small and open countries, similar to Hungary.
In emerging countries with high FDI stock, the GNI level typically falls short of the volume of GDP. In most cases, this is due to the profit of non-resident companies, which obviously does not form part of resident sectors’ income. However, it should be noted that higher GDP growth than GNI growth (and thereby the widening of the GDP-GNI gap) also does not necessarily represent an unfavourable development for the economy – since it is possible that without the foreign investments which entail the outflow of profit the level of GNI would be even lower. It is important to bear in mind that this largely depends on the type of external funds, as well as on the absorption capacity of the host country (Balatoni – Pitz 2012). While in the case of investments realised from foreign direct investment the productivity of the host country may improve, in the case of foreign loans or portfolio investments no such positive externality can be expected. Accordingly, in Hungary, for example, FDI-type funds have proved to be the most favourable form of financing in past decades, despite the fact that based on the implied yields they can be regarded as more expensive funds than foreign loans or portfolio investments. In addition to the indirect, obvious impacts of FDI funds (rising investments, increase in tax revenues, job creation), the indirect effects (technology spillover, headway of suppliers in international markets) are also key to the developments in the host country’s gross national income.
Ireland is also a good example of the magnitude of the impact that globalisation can exert on a country’s economic indicators. The GDP growth observed in recent years in Ireland (e.g. 25 per cent in 2015) was mostly related to the free flow of capital linked to the country’s favourable tax conditions, and thus it is not a coincidence that the employees of the Irish Statistical Office support the use of alternative indicator(s), other than GDP, for the measurement of economic performance1 (Stapel-Weber – Verrinder 2016). The example of Ireland highlights the fact that it makes sense to know the GDP-GNI gap, capturing the difference between the income generated in the economy and the primary income allocable to the resident economic agents – the value of which is one of the highest in Ireland in an international comparison – and the underlying factors, more precisely. In addition, analysis of the GDP-GNI gap is also important in terms of examining the external vulnerability of a country, as it quantifies the expenses represented for an economy by the incomes paid on external liabilities.
1 The proposed indicator sets out from GNI, also adjusted for the „impact of globalisation” (the minor difference between the official and the adjusted GNI index). They expect the new indicator to be more stable and less sensitive to shocks or one-off effects. Although the adjusted GNI moves away from GDP, this does not mean that the living conditions of Irish economic agents is worse – at the same time, the debt ratio calculated as a proportion of this is higher than the GDP-proportionate ratio, which may impact investors’ perceptions of the economy or payments to or from the EU.
60 Studies
Eszter Balogh – Anna Boldizsár – Bence Gerlaki – Balázs Kóczián
This paper primarily deals with the changes in the Hungarian GDP-GNI gap in recent years, as well as with the factors influencing that. In the first part, we make a brief overview of the exact definition of GNI and then examine the development in the GDP-GNI gap in Hungary. Thereafter, we focus on the breakdown, by industry and country, of the incomes related to foreign direct investment, which is particularly important for Hungary. This is followed by the presentation of the share of the household, corporate and public sectors in gross national income, and then by a review of the GDP-GNI gap in the neighbouring countries. We highlight the relationship between the indicator and economic development, and at the end of the paper we attempt to determine the anticipated path of the GDP-GNI gap in the coming years.
2. Definition of gross national income
Gross national income is an indicator calculated from GDP; however, while GDP is determined based on the regional status for statistical purposes, GNI is determined on the basis of the resident status for statistical purposes. The relation between the two indicators can be expressed by the following formula:
Gross National Income (GNI) = Gross Domestic Product (GDP)+ Primary incomes of domestic residents received from abroad– Primary incomes paid to foreign residents from home
Primary incomes include earned income, property income – within that FDI income (profit) and income from loans (interest) – and certain current transfers2 (HCSO 2009):
• compensation of employees: balance of the wage income received by Hungarian citizens temporarily working abroad (for less than one year) and by non-residents temporarily working in Hungary;
• equity income: the difference between the equity incomes of non-resident actors from Hungary and of resident actors from abroad, which shows the volume of income in net terms that is due to non-resident income holders on their direct investments;
• interest payments: balance of the debt service paid on residents’ outstanding borrowing and debt securities (bonds, treasury bills, etc.). from the non-resident sector and the debt service received by resident actors on their loans granted and debt securities issued to the non-resident sector;
• current transfer: the largest part of the item stated in the balance of payments statistics under other primary income comes from the agricultural subsidies received from the European Union – in addition, the product and production taxes, subsidies and rental incomes are also stated here.
2 Current transfers included in other primary incomes

61
Developments in the GDP-GNI Gap in Hungary and the CEE Region
In the GNI indicator, of the factors adjusting GDP – the incomes and current transfers – the role of capital incomes (interest and equity income) is the most salient. This is due to the fact that compared to the current transfers they are of higher volume and were generated in relation to production, and thus they carry more useful information with regard to the economic position of a country.
3. GDP-GNI gap in Hungary
3.1. Developments in the GDP-GNI gapIn 2016, real GNI growth substantially exceeded the rise in GDP, and thus the real growth of GNI reached the pre-crisis level. Until 2013, the gap between the annual real growth in GDP and GNI was negligible, which meant that the growth rate in the real income of the resident and the non-resident economic agents acting in Hungary was similar. However, in the past years, the two indicators developed differently: the real growth in GNI dynamically rose, while the GDP growth rate gradually declined. Consequently, in 2016 real GNI growth – which exceeded GDP growth by roughly 2 percentage points – amounted to 4.3 per cent, and thus GNI reached the pre-crisis level (Figure 1).
Figure 1Annual real growth of GDP and GNI
–8
–6
–4
–2
0
2
4
6
–8
–6
–4
–2
0
2
4
6
1996
1997
1998
1999
2000
2001
2002
2003
2004
2005
2006
2007
2008
2009
2010
2011
2012
2013
2014
2015
2016
Per cent Per cent
DifferenceGNI growth rateGDP growth rate
Note: In 2008, there was a methodological change in the recognition of FDI income (for more details, see Appendix 2).Source: HCSO (2018)

62 Studies
Eszter Balogh – Anna Boldizsár – Bence Gerlaki – Balázs Kóczián
In the pre-crisis period, the GDP-GNI gap was relatively stable, around 4–6 per cent of GDP. In Hungary, the GDP-GNI gap remained stable between the end of 1990s and 2006 which was mainly attributable to the profit of non-resident companies. In the mid-2000s – as a result joining the European Union – both the substantial rise in the compensation of employees and the inflow of transfers relevant for GNI contributed to the minor decrease in the GDP-GNI gap. At the same time, in the pre-crisis years, due to the simultaneous growth in equity incomes and interest expenses paid to the non-resident sector, the GDP-GNI gap reached a historic high, rising to above 6 per cent of GDP. In the years of the crisis, the interest expense paid to the non-resident sector on the swiftly mounting outstanding debt continued to increase, which pointed to widening of the GDP-GNI gap. However, this impact was more than counterbalanced by the decline in the profit of non-resident companies and the rise in current transfers from the EU.
After the crisis, as a result of the dynamically increasing compensation of employees and the decrease in interest expenses due to deleveraging, a trend decrease was observed in the GDP-GNI gap. The decrease in the gap was moderately restrained
Figure 2Changes in the components of the GDP–GNI gap (as a percentage of GDP)
–10
–8
–6
–4
–2
0
2
4
–10
–8
–6
–4
–2
0
2
4
1995
1996
1997
1998
1999
2000
2001
2002
2003
2004
2005
2006
2007
2008
2009
2010
2011
2012
2013
2014
2015
2016
Per cent Per cent
875 HUFbillions
Interest paymentsEquity incomeCompensation of employees
Transfers*GNI-GDP
Note: In 2008, there was a methodological change in the recognition of FDI income (for more details, see Appendix 2).* Transfers included among other primary incomes.Source: HCSO (2018), MNB (2018)

63
Developments in the GDP-GNI Gap in Hungary and the CEE Region
by the growth in the profit of non-resident companies, which approximated its pre-crisis level. In 2014–2015, the profit of non-resident companies operating in Hungary rose substantially due to a one-off item of a multinational company, which led to a surge in the GDP-GNI gap (MNB 2016b). After this, in 2016 there was a substantial decrease in the profit of the industry affecting the gap (MNB 2017c), and thus the gap narrowed to 2.4 per cent of GDP. The decrease was significantly supported by the declining interest expenses resulting from the decline in gross external debt and the implied interest rate thereof, as well as the more moderate – compared to the previous year’s outlier – level of corporate profits (Figure 2).
3.2. Which industries determine the outflow of FDI incomes the most?The GDP-GNI gap was determined primarily by the income of manufacturing (car and pharmaceutical industry) and the other supplementary business services. The income flows between GNI and GDP are fundamentally determined by the income of foreign-owned companies. This income is the ordinary business profit/loss of foreign direct investments operating in Hungary (accounting for almost 50 per cent of GDP in terms of the balance of investments). This indicator contains the total profit of the companies, which later on the companies pay out as dividend to the owner or reinvest in the Hungarian economy. However, it should be pointed out that – as emphasised in the paper by Balatoni – Pitz (2012) – the growth effect of working capital is substantial, and thus, despite the fact that the implied return on working capital exceeded that of the alternative sources of finance, on the whole the impact thereof on the gross national income may be positive.
Almost half of the FDI income is related to the manufacturing industries (Figure 3). The profit of the sector was attributable, among other things, to the rising income of vehicle manufacturing – as a result of the new factories built and the run-up of production – as well as to the increasing profit of drug manufacturing and the industries related to the manufacturing of electronic products. In addition, the dynamics in the income of non-resident companies between 2014 and 2016 were substantially influenced by the income of the other supplementary business services sector. A large part of this may be attributed to a single multinational corporation operating in Hungary, the profit of which substantially rose in 2014–2015, followed by a decline in 2016, which also had a material impact on the balance of FDI incomes (MNB 2016b).

64 Studies
Eszter Balogh – Anna Boldizsár – Bence Gerlaki – Balázs Kóczián
3.3. Which countries benefited from the outflow of income?In accordance with the source countries of the investments, the incomes from foreign direct investments, which are a key factor in the GDP-GNI gap, primarily flow to the euro area core countries. The GDP-GNI gap is determined by the income from foreign direct investments. Since a substantial part of the foreign direct investments comes to Hungary from EU core countries, most of the income is generated by subsidiaries from these countries. Until 2011, the largest volume of FDI income flowed to Germany, the most important source country of the FDI stock in Hungary (Figure 4). Thereafter, the incomes flowing to Austria and the Netherlands rose significantly, but in the case of the Dutch companies, the Netherlands is presumably not the ultimate source of the capital (due to corporate organisation and taxation reasons, several multinational companies regard the Netherlands as an interim station). The incomes from Dutch and Austrian foreign direct investments are also partly attributable to German investments (for more details, see MNB 2016a).
Figure 3Breakdown of the income balance related to foreign direct investments by sector
–7
–6
–5
–4
–3
–2
–1
0
1
–7
–6
–5
–4
–3
–2
–1
0
1
2008 2009 2010 2011 2012 2013 2014 2015 2016
As a percentage of GDP As a percentage of GDP
Financial intermediationTrade
Other supplementaryManufacturingMining, quarrying
Other
Note: In analysing the income of foreign-owned companies, the global production chains of multinatio-nal corporations and the incomes related to capital-in-transit transactions substantially distort both the income and expense sides – and thus to analyse corporate incomes we used the balances.Source: MNB (2018)

65
Developments in the GDP-GNI Gap in Hungary and the CEE Region
When examining the balance of the incomes constituting GNI in a breakdown by country, due to the incomes of employees temporarily working abroad, the income flow related to the German-speaking countries increases Hungarian GNI, while the United States plays a larger role in the financing of government debt (Figure 5). As regards the breakdown of the GDP-GNI gap by country (ignoring the other primary incomes,3 which we usually state under current transfers), different dynamics were observed compared to income from foreign direct investments. Prior to 2012, the balance related to Germany and Austria reduced GNI. However, in 2012, with the easing of the German regulations related to foreign employment and the related rise in the compensation of employees, the volume of incomes transferred to Germany and Austria declined substantially. In this regard, it should be noted that although wages increase the Hungarian GNI value, they are not transferred to Hungary in full, as they also include the taxes and the consumption of those temporarily living abroad (Csortos – Kóczián 2017).
The role of the Netherlands is also outstanding in the total incomes, while the incomes transferred to the United States and Luxembourg show a decline between
3 We do not examine these, since our country breakdown cannot be mapped in the same way as the other incomes; these income flows take place vis-à-vis the EU institutions.
Figure 4Breakdown of the income from direct equity investments by country
–7
–6
–5
–4
–3
–2
–1
0
–7
–6
–5
–4
–3
–2
–1
0
2008 2009 2010 2011 2012 2013 2014 2015 2016
As a percentage of GDP As a percentage of GDP
FranceNetherlandsAustriaGermany
Other
Note: Net of income related to intercompany loans.Source: MNB (2018)

66 Studies
Eszter Balogh – Anna Boldizsár – Bence Gerlaki – Balázs Kóczián
2013 and 2016. This may be attributable to the fact that in recent years, due to the strengthening in household and bank financing, the government securities holdings of non-residents declined and the government’s interest expenditure also fell as a result of the lower interest rates.
3.4. Developments in the income of sectorsSince the outbreak of the crisis, the GDP-GNI gap has gradually declined, i.e. the income of resident actors falls short of the value of the income produced domestically (GDP) to a smaller degree than 10 years ago. As emphasised earlier, after the 2007 „peak”, the GDP-GNI gap started to narrow, as a result of which it fell to HUF 875 billion by 2016. The narrowing of the GDP-GNI gap means that a larger volume of the income generated in 2016 remains with resident agents than before, as the volume of income flowing abroad declined. In the following, we try to identify how the generated income is distributed among the resident sectors, and – in connection with this – the income of which domestic sector has been augmented by the decline in the outflow of income abroad, observed in recent years. The breakdown by sectors (Figure 6) shows that in terms of domestic sectors the strongest growth was seen in corporate and government GNI, while there was a trend decrease in the GDP-proportionate primary incomes of households.
Figure 5Breakdown of primary incomes* included in GNI
–8
–7
–6
–5
–4
–3
–2
–1
0
1
–8
–7
–6
–5
–4
–3
–2
–1
0
1
2008 2009 2010 2011 2012 2013** 2014 2015 2016
As a percentage of GDP As a percentage of GDP
Austria GermanyUnited Kingdom NetherlandsLuxembourg United States of AmericaOther
Note: *Net of the income from international reserves and other primary incomes.**Before 2013, the country breakdown of incomes is not comprehensive.Source: MNB

67
Developments in the GDP-GNI Gap in Hungary and the CEE Region
The share of households in GNI has gradually declined, which is mostly attributable to the decrease in the ratio of the compensation of employees (Figure 7). Household GNI decreased by 7.7 percentage points between 1995 and 2007, followed by a further decrease of 3 percentage points by 2016. The decomposition shows that a significant part of the decrease in the proportion seen since 1995 is attributable to the 6 percentage point decrease in the ratio of the compensation of employees, in addition to which the proportion of property incomes and the operating surplus of households also declined by 2 percentage points each. The decrease in the GDP-proportionate value of the compensation of employees can be compared with the decline in the wage share observed globally (MNB 2017b). Whether this indeed reduces the national economy’s GDP-proportionate gross national income depends on whether the company employing the respective household is resident or non-resident. When non-resident companies benefit from the decline in the households’ compensation of employees, GNI decreases and in parallel with that the GDP-GNI gap widens – which played a role in the developments between 1995 and 2007. However, when this income appears at resident companies in the form of higher operating surplus, GNI on the whole does not change, only the distribution thereof by sector – this was the case after 2007. A large part of the decline in the share of
Figure 6GNI as a percentage of GDP, and the breakdown thereof by sectors
50
55
60
65
70
75
80
85
90
95
100
50
55
60
65
70
75
80
85
90
95
100 19
95
1996
1997
1998
1999
2000
2001
2002
2003
2004
2005
2006
2007
2008
2009
2010
2011
2012
2013
2014
2015
2016
Per cent Per cent
Household sectorCorporate sectorGeneral governmentGNI-GDP gap GNI/GDP
Source: HCSO (2018)

68 Studies
Eszter Balogh – Anna Boldizsár – Bence Gerlaki – Balázs Kóczián
property incomes is attributable to decreasing interest incomes – related to the low interest environment and the transformation of the pension system, while the operating surplus contains the value of the own home service, the developments in which are substantially influenced by housing market prices.
The government’s GNI as a percentage of GDP rose from 13.9 per cent in 2001 to 17.6 per cent by 2016, which is primarily connected to the rise in consumption taxes (Figure 8). Consumption taxes (VAT, excise tax) account for a major portion of the government’s primary income; these taxes decreased until 2006 and then started to rise significantly. In addition to higher income from consumption taxes, the government’s revenue was also boosted by the introduction of a variety of sectoral taxes (e.g. public utility tax, advertising tax, financial transaction levy, telecommunication tax, etc.). Finally, the growth in primary income was also supported by the decrease in the government’s interest expenditures.
Figure 7Decomposition of households’ GNI* as a percentage of GDP
55.751.9 49.9
10.7
8.78.3
5.7
3.93.4
72.1
64.561.6
40
45
50
55
60
65
70
75
40
45
50
55
60
65
70
75
1995 2007 2016
Per cent Per cent
GNI as a proportion of GDPCompensation of employeesOperating surplusProperty income
Note: * The mixed income within household income was divided into compensation of employees and operating surplus in accordance with the proportions observed in the national economy.Source: HCSO (2018)

69
Developments in the GDP-GNI Gap in Hungary and the CEE Region
The rise in companies’ GDP-proportionate primary incomes after the crisis is primarily attributable to the growth in the operating surplus, contributed to by SMEs to larger degree and by corporations to a smaller degree (Figure 9). Corporate GNI comprises the operating surplus and property income, with the latter including profit distribution to the resident and non-resident owners and the net interest expenditures. The operating surplus of corporations of various sizes rose to a similar degree until the outbreak of the financial crisis. In the years after the crisis, SMEs’ income fell substantially, while the operating surplus of large companies continued to rise moderately. After 2012, the dynamic growth in SMEs’ income outstripped that of the large companies; nevertheless, the gross operating surplus of the sub-sector still falls short of that of large companies.4 The rise in the income of the corporate sector seen in recent years may be due to the fact that households’ declining compensation of employees is manifested at resident companies through the rise in operating surplus, while the improving terms of trade resulting from the decline in oil prices also substantially improved the profitability of the sector. Since 2008, corporations’ property income reduced the sector’s GNI by 6–8 per cent of GDP, while after the crisis the decline in interest expenditures resulting from deleveraging was a major factor (the rise in 2014–2015 was more attributable to one-off factors).
4 It is also worth bearing in mind that corporations’ GDP-proportionate operating surplus in 2015 was distributed among roughly 1,500 companies in the case of large corporations and more than 400,000 companies in the case of SMEs – and thus major differences may exist in the income „per company”.
Figure 8Developments in the government’s GNI as a percentage of GDP
0 2 4 6 8
10 12 14 16 18 20
0 2 4 6 8 10 12 14 16 18 20
2001
2002
2003
2004
2005
2006
2007
2008
2009
2010
2011
2012
2013
2014
2015
2016
Per cent Per cent
Consumption taxesSectoral taxesGeneral Government GNI
Source: HCSO (2018)

70 Studies
Eszter Balogh – Anna Boldizsár – Bence Gerlaki – Balázs Kóczián
4. International review
In pre-crisis period, the Hungarian GDP-GNI gap was high by regional standards, but it has declined substantially in recent years and is now among the lowest in the region (Figure 10). In connection with the high outstanding external debt, the outflow of income was the highest in Hungary and in the Czech Republic in the pre-crisis years. However, whereas in the Czech Republic the outflow of income was attributable almost exclusively to non-resident companies, in Hungary the income balance deficit was also increased by the interest burdens of the mounting gross external debt, in addition to the profit. Although after the outbreak of the crisis the profit of non-resident companies declined significantly, increasing interest expenses kept the GDP-GNI gap wide in Hungary in particular. After the trough, it is a general phenomenon in the region that the outflow of equity income, in line with the rise in the profits of corporations, rose, with higher volatility observed in Slovakia and Hungary. With the continuously decreasing interest expenditures observed in recent years, the balance of the compensation of employees and transfer incomes5 made a positive contribution to the rise in incomes in all countries of the region but reduced the GNI-GDP gap in Hungary the most.
5 Transfers stated under other primary incomes.
Figure 9Decomposition of the GNI of the entire (financial and non-financial) corporate sector
–10
–5
0
5
10
15
20
25
30
–10
–5
0
5
10
15
20
25
30
1997
1998
1999
2000
2001
2002
2003
2004
2005
2006
2007
2008
2009
2010
2011
2012
2013
2014
2015
2016
Per cent Per centO
perating surplus
Large enterprisesSMEs
Property incomeGNI
Note: The operating surplus of the national accounts was distributed between large corporations and SMEs based on the NTCA (tax authority) database. The 2015-2016 data are estimates based on develop-ments in previous years.Source: HCSO (2018), MNB calculation based on the NTCA database, MNB (2018)

71
Developments in the GDP-GNI Gap in Hungary and the CEE Region
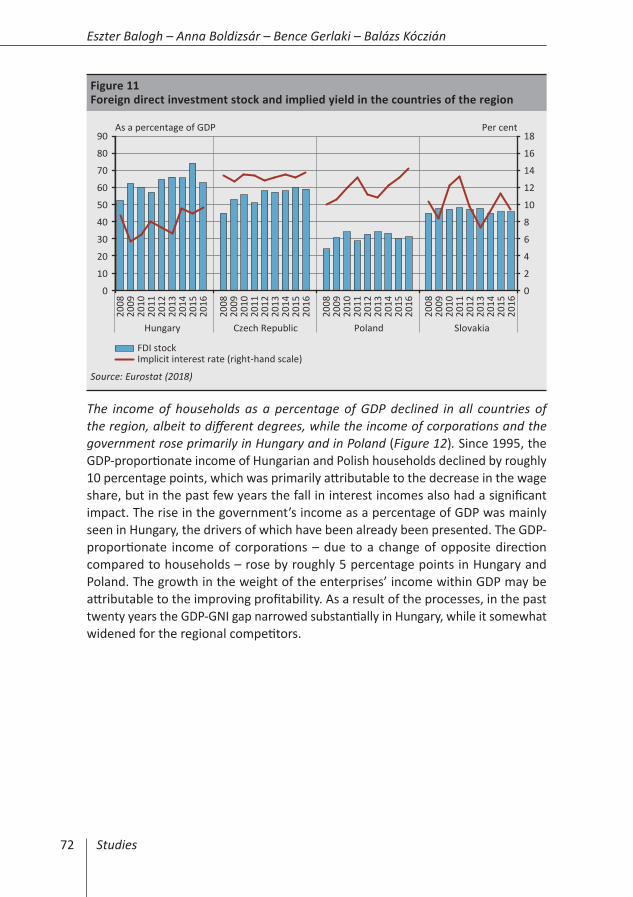
In Hungary, the underlying reason for the outflow of incomes on FDI liabilities is primarily the high FDI stock, while the implied return on working capital lags behind the regional level (Figure 11). Before the crisis, foreign direct investments in Hungary amounted to roughly 50 per cent of GDP, which was substantially higher than the regional average. By contrast, the implied return on FDI in Hungary lagged behind the value of 12–14 per cent observed in the neighbouring countries. It is also typical of the post-crisis period that the cost of the capital import is the lowest in Hungary – in addition to Slovakia – accompanied by the highest gross FDI stock in the region. While in Hungary the high outflow of FDI income is primarily attributable to the high FDI stock, in the Czech Republic both the stock and the rate of return on the working capital are high. Among the countries of the region, the gross FDI stock as a percentage of GDP is the lowest in Poland, which – despite the high implied yield – is not accompanied by major outflow of FDI income.
Figure 10Breakdown of the GDP-GNI gap by factors in the countries of the region (as a percentage of GDP )
–10
–8
–6
–4
–2
0
2
4
–10
–8
–6
–4
–2
0
2
4
2004
20
05
2006
20
07
2008
20
09
2010
20
11
2012
20
13
2014
20
15
2016
20
04
2005
20
06
2007
20
08
2009
20
10
2011
20
12
2013
20
14
2015
20
16
2004
20
05
2006
20
07
2008
20
09
2010
20
11
2012
20
13
2014
20
15
2016
20
04
2005
20
06
2007
20
08
2009
20
10
2011
20
12
2013
20
14
2015
20
16
Hungary Czech Republic Poland Slovakia
Per cent Per cent
GNI–GDP
Compensation of employees
Equity incomeInterest payments
Transfers*
Note: In 2008, there was a methodological change in the recognition of Hungarian FDI income (for more details, see Appendix 2).*Transfers included among other primary incomes.Source: Eurostat (2018)
72 Studies
Eszter Balogh – Anna Boldizsár – Bence Gerlaki – Balázs Kóczián
The income of households as a percentage of GDP declined in all countries of the region, albeit to different degrees, while the income of corporations and the government rose primarily in Hungary and in Poland (Figure 12). Since 1995, the GDP-proportionate income of Hungarian and Polish households declined by roughly 10 percentage points, which was primarily attributable to the decrease in the wage share, but in the past few years the fall in interest incomes also had a significant impact. The rise in the government’s income as a percentage of GDP was mainly seen in Hungary, the drivers of which have been already been presented. The GDP-proportionate income of corporations – due to a change of opposite direction compared to households – rose by roughly 5 percentage points in Hungary and Poland. The growth in the weight of the enterprises’ income within GDP may be attributable to the improving profitability. As a result of the processes, in the past twenty years the GDP-GNI gap narrowed substantially in Hungary, while it somewhat widened for the regional competitors.
Figure 11Foreign direct investment stock and implied yield in the countries of the region
0
2
4
6
8
10
12
14
16
18
0
10
20
30
40
50
60
70
80
90
2008
20
09
2010
20
11
2012
20
13
2014
20
15
2016
2008
20
09
2010
20
11
2012
20
13
2014
20
15
2016
2008
20
09
2010
20
11
2012
20
13
2014
20
15
2016
2008
20
09
2010
20
11
2012
20
13
2014
20
15
2016
Hungary Czech Republic Poland Slovakia
Per centAs a percentage of GDP
FDI stockImplicit interest rate (right-hand scale)
Source: Eurostat (2018)

73
Developments in the GDP-GNI Gap in Hungary and the CEE Region
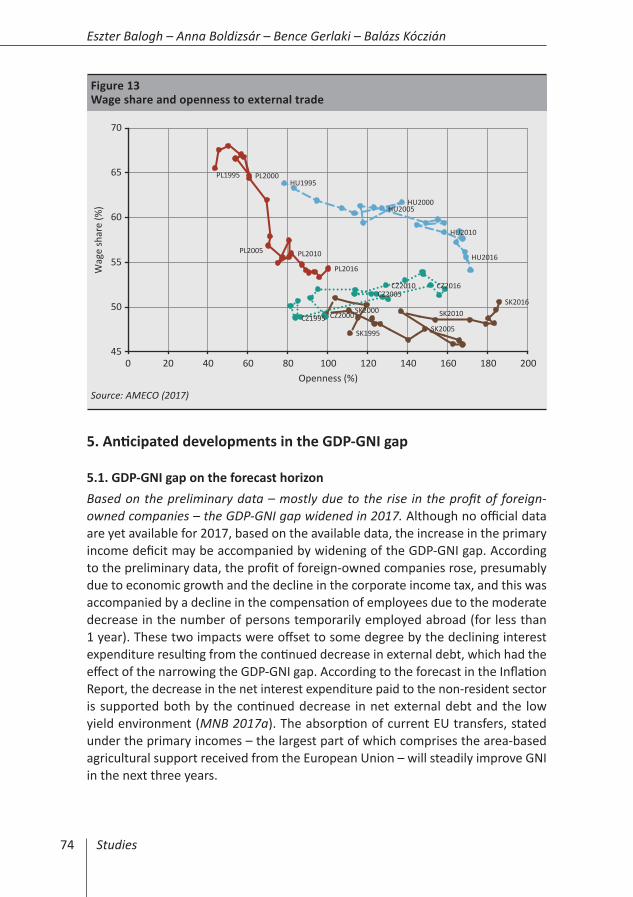
The decline in the Hungarian and Polish household GNI may be partially attributable to the decrease in the wage share. There is more or less a consensus in the international technical literature that globalisation and the cross-border movement of products and services reduce the wage share. One reason for this is that the import-intensive sectors (manufacturing, commerce) must compete with countries with lower labour cost – and import competition encourages businesses to change over to capital-intensive production, thereby reducing the wage share. On the other hand, as a result of the decline in the wage share, businesses may use a smaller part of the earned income for employees and distribute the larger part thereof among owners. As regards the Visegrád countries, no such straightforward relation can be observed. While in the case of Hungary and Poland the increase in the openness of external trade – the sum of exports and import as a percentage of GDP – was accompanied by a decrease in the wage share, it remained more or less steady in the Czech Republic and Slovakia during the period under review. Accordingly, these processes may have made a major contribution to the fact that the decline in the GDP-proportionate household GNI was much larger than in the Czech Republic and Slovakia. At the same time, it should be noted that despite the fact that of the four countries, Poland can be regarded as the most closed economy, this is where the wage share declined to the largest degree. As a result of the developments and with varying degrees of economic openness, the wage shares in the countries of the region were at a similar level in 2016, around 50-55 per cent of GDP (Figure 13).
Figure 12Breakdown of the GDP-GNI gap by sector
75
80
85
90
95
100
105
–15
–10
–5
0
5
10
15
1995
19
97
1999
20
01
2003
20
05
2007
20
09
2011
20
13
2015
19
95
1997
19
99
2001
20
03
2005
20
07
2009
20
11
2013
20
15
1995
19
97
1999
20
01
2003
20
05
2007
20
09
2011
20
13
2015
19
95
1997
19
99
2001
20
03
2005
20
07
2009
20
11
2013
20
15
Hungary Czech Republic Poland Slovakia
Per cent Per cent
Household sectorCorporate sectorGeneral governmentGNI GNI/GDP (right-hand scale)
Note: Left-hand scale: change in the GDP-proportionate values, 1995=0Source: Eurostat (2018)
74 Studies
Eszter Balogh – Anna Boldizsár – Bence Gerlaki – Balázs Kóczián
5. Anticipated developments in the GDP-GNI gap
5.1. GDP-GNI gap on the forecast horizonBased on the preliminary data – mostly due to the rise in the profit of foreign-owned companies – the GDP-GNI gap widened in 2017. Although no official data are yet available for 2017, based on the available data, the increase in the primary income deficit may be accompanied by widening of the GDP-GNI gap. According to the preliminary data, the profit of foreign-owned companies rose, presumably due to economic growth and the decline in the corporate income tax, and this was accompanied by a decline in the compensation of employees due to the moderate decrease in the number of persons temporarily employed abroad (for less than 1 year). These two impacts were offset to some degree by the declining interest expenditure resulting from the continued decrease in external debt, which had the effect of the narrowing the GDP-GNI gap. According to the forecast in the Inflation Report, the decrease in the net interest expenditure paid to the non-resident sector is supported both by the continued decrease in net external debt and the low yield environment (MNB 2017a). The absorption of current EU transfers, stated under the primary incomes – the largest part of which comprises the area-based agricultural support received from the European Union – will steadily improve GNI in the next three years.
Figure 13Wage share and openness to external trade
HU1995
HU2000HU2005
HU2010
HU2016
CZ1995 CZ2000
CZ2005CZ2010 CZ2016
PL1995 PL2000
PL2005 PL2010
PL2016
SK1995
SK2000
SK2005
SK2010SK2016
45
50
55
60
65
70
0 20 40 60 80 100 120 140 160 180 200
Wag
e sh
are
(%)
Openness (%)
Source: AMECO (2017)

75
Developments in the GDP-GNI Gap in Hungary and the CEE Region
Looking ahead, over the short run, the rise in the FDI income of foreign-owned companies may be more or less offset by the decline in net interest expenditure, and thus the GNI-GDP gap may become stable (Figure 14). Export performance is a key factor in the expected development of the income of foreign-owned companies. Based on historic data, income on foreign direct investments shows significant co-movement with developments in the export performance of businesses (MNB, 2017c). The underlying reason for this is that the vast majority of foreign-owned companies produce mostly for export, and these companies play a major role in the development of the export performance of the economy. Accordingly, export performance is a determinant of the expected developments in the income from foreign direct investments, which – according to the Inflation Report (MNB 2017a) – is expected to expand further. At the same time, this process may be more or less offset in the coming years by the fact that – according to the net lending forecast in the Inflation Report – the volume of interest expenditure to be paid abroad may decline, in an environment of decreasing external debt and the current low level of interest rates.
Figure 14GNI-GDP gap on the forecast horizon (as a percentage of GDP)
90
92
94
96
98
100
102
104
–10
–8
–6
–4
–2
0
2
4
2006 2007 2008 2009 2010 2011 2012 2013 2014 2015 2016 2017 2018 2019 2020
Per cent Per cent
Compensation of employeesProperty income
Current EU-transfers
Gross national income (right-hand scale)
OFFICIAL DATA FORECASTPRELI-MINA-
RYDATA
Source: HCSO (2018), MNB (2017a), own calculation

76 Studies
Eszter Balogh – Anna Boldizsár – Bence Gerlaki – Balázs Kóczián
5.2. Developments in the GDP-GNI gap over the long runOver the long term, in addition to external factors, the GDP-GNI gap will continue to be influenced primarily by the financing structure of the Hungarian economy. The area-based EU support represent a stable net inflow of income for Hungary over the longer run as well, while the outflow of income related to external debt may decline in parallel with the anticipated decrease in external debt. The return of Hungarian citizens working abroad to the Hungarian labour market (in line with the economic policy objectives) and the rise in the income of foreign employees working in Hungary (due to the increasing labour shortage in the economy) may reduce the net inflow of wage income, and thus have the effect of widening the GDP-GNI gap. The stock of foreign direct investments in Hungary is a condition which also substantially influences the volume of the outflow of FDI income, accounting for the largest part of the GDP-GNI gap. The long-term path of the GDP-GNI gap depends substantially on the financing structure of the Hungarian economy’s convergence to the Western countries: if the investments supporting economic growth are financed from external liabilities, the GDP-GNI gap may widen, while it may narrow if they are financed from domestic savings.
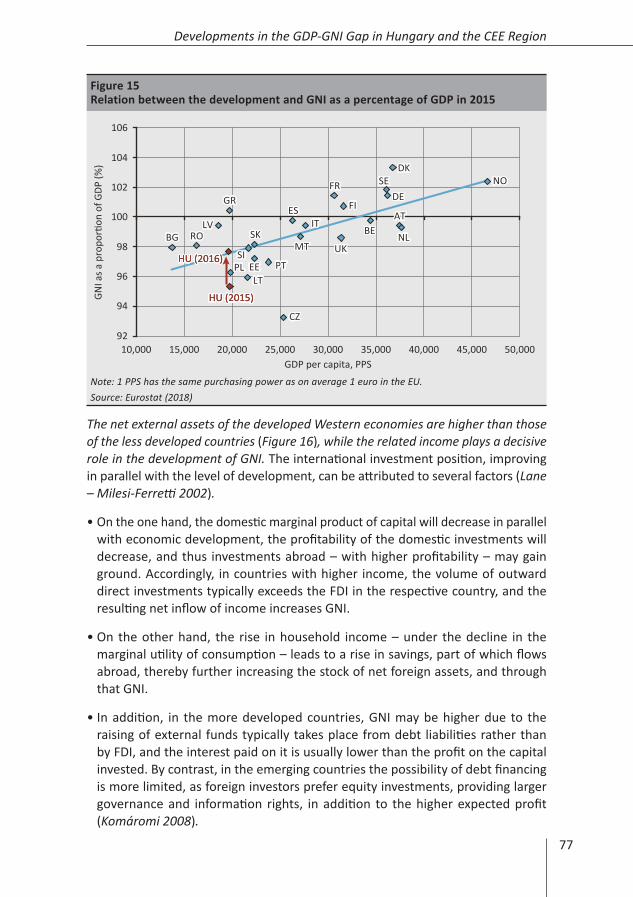
There is a positive correlation between the level of development and changes in the GDP-GNI gap. In Europe, the GDP-GNI gap is typically smaller in the countries with higher GDP per capita: in the Western European and Scandinavian countries with the highest GDP per capita, GNI even exceeds GDP (Figure 15). This is primarily attributable to the fact that these countries are net lenders to the non-resident sector (Lucas 1990), while the net inflow of FDI income increases GNI. It should be noted that a positive net inflow of FDI income is possible not only in the case of a positive net international investment position, but also when the outstanding liabilities exceed foreign assets, if the return on foreign assets significantly exceeds the implied yield paid on the liabilities. In contrast to the aforementioned countries with positive primary balances, the Visegrád countries and the Baltic states – where financing from FDI is of significant degree – are net borrowers, with net outflows of income. It is worth highlighting the situation of the Czech Republic, where GNI falls short of GDP to a much larger degree than would be justified by its level of development, which is primarily attributable to the high profitability of the foreign-owned companies (the net interest expense is very low, as the foreign receivables of the Czech Republic even exceed its external debt).
77
Developments in the GDP-GNI Gap in Hungary and the CEE Region
The net external assets of the developed Western economies are higher than those of the less developed countries (Figure 16), while the related income plays a decisive role in the development of GNI. The international investment position, improving in parallel with the level of development, can be attributed to several factors (Lane – Milesi-Ferretti 2002).
• On the one hand, the domestic marginal product of capital will decrease in parallel with economic development, the profitability of the domestic investments will decrease, and thus investments abroad – with higher profitability – may gain ground. Accordingly, in countries with higher income, the volume of outward direct investments typically exceeds the FDI in the respective country, and the resulting net inflow of income increases GNI.
• On the other hand, the rise in household income – under the decline in the marginal utility of consumption – leads to a rise in savings, part of which flows abroad, thereby further increasing the stock of net foreign assets, and through that GNI.
• In addition, in the more developed countries, GNI may be higher due to the raising of external funds typically takes place from debt liabilities rather than by FDI, and the interest paid on it is usually lower than the profit on the capital invested. By contrast, in the emerging countries the possibility of debt financing is more limited, as foreign investors prefer equity investments, providing larger governance and information rights, in addition to the higher expected profit (Komáromi 2008).
Figure 15Relation between the development and GNI as a percentage of GDP in 2015
BEBG
CZ
DK
DE
EE
GRES
FR
ITLV
LT
HU (2015)HU (2015)
MTNL
AT
PL PT
RO
SI
SK
FI
SE
UKHU (2016)HU (2016)
NO
92
94
96
98
100
102
104
106
10,000 15,000 20,000 25,000 30,000 35,000 40,000 45,000 50,000
GNI a
s a p
ropo
rtion
of G
DP (%
)
GDP per capita, PPS
Note: 1 PPS has the same purchasing power as on average 1 euro in the EU.Source: Eurostat (2018)

78 Studies
Eszter Balogh – Anna Boldizsár – Bence Gerlaki – Balázs Kóczián
Hungary’s successful convergence to countries with higher income may result in narrowing of the GDP-GNI gap over the longer term. Hungary’s net international investment position may improve in parallel with the rise in the development of the domestic economy (Koroknai 2008), which may reduce net outflow of income to the non-resident sector. In addition, improved competitiveness of the Hungarian economy may also support the rise of the income of Hungarian companies operating abroad, which – together with the financing of the Hungarian economy – may reduce the net outflow of FDI income and thereby also the GDP-GNI gap.
6. Summary
In the past decades, with the spread of globalisation, the gap between the output of the domestic economy and the income of residents has developed, and thus an increasing demand appeared in economics for macroeconomic indicators, which – as a supplement to the GDP indicator – can provide additional information on the distribution of incomes among the individual economic agents. Gross national income adjusts GDP for the balance of income from Hungary of residents living abroad and the income of domestic residents from abroad, and thus the departure thereof from GDP captures the difference of the domestic economic performance and incomes allocable to the domestic economic agents, and also provides useful information on the current burdens of the country’s accumulated net outstanding foreign liabilities. In Hungary, prior to the crisis, the GDP-GNI gap was high in
Figure 16Correlation between development and net external assets (average of 2010 – 2016)
BE
BG
CZ
DKDE
EE
GR
ES
FR
HR
ITLV
LT
HU
MTNL
AT
PL
PO
RO SISK
FI
SEUK
CH
y = 0.0061x – 182 R = 0.73
–150
–100
–50
0
50
100
150
0 10,000 20,000 30,000 40,000 50,000
Net
inte
rnati
onal
inve
stm
ent p
ositi
on
as a
per
cent
age
of G
DP (%
)
GDP per capita, PPS
Note: 1 PPS has the same purchasing power as on average 1 euro in the EU.Source: Eurostat (2018)
79
Developments in the GDP-GNI Gap in Hungary and the CEE Region
a regional comparison, but after the crisis, it gradually decreased to the average of the region. This decline was the combined result of several factors: while the growth in the outflow of equity and foreign direct investment income (business profit) increased the GDP-GNI gap, the decline in interest expenditures resulting from the low yield environment and lower gross external debt, as well as the dynamic growth in the wage incomes from abroad – similarly to most of the countries in the region – reduced the GDP-GNI gap.
The income of foreign-owned companies operating in Hungary accounts for a large part of the GDP-GNI gap. The incomes from foreign direct investments, determining the GDP-GNI gap, are mostly related to manufacturing, and flow to the core countries of the euro area, and particularly to Germany and the Netherlands. The narrowing of the GDP-GNI gap – broken down by sectors – took place in conjunction with a rise in the GDP-proportionate income of the government and the corporate sector, while household income gradually declined. The underlying reasons for these developments were mainly the decrease in the wage share, observed internationally, the decline in interest expenditures and the rise in the government’s tax revenues.
Looking ahead, the GDP-GNI gap is expected to increase moderately in the short run, as economic growth is still significant, and the cut in the corporate income tax may lead to a rise in the capital income of foreign-owned companies. In addition, domestic wage dynamics may support the return of Hungarian citizens working abroad to the Hungarian labour market, which – through the decline in the compensation of employees from abroad – in its own right suggests widening of the GDP-GNI gap, while the repatriation of Hungarian employees has a positive effect on growth over the long run. By contrast, the EU area aids represent a stable net inflow of income for Hungary over the longer term as well, in addition to which the interest expenditure linked to the decreasing external debt continues to help narrow the GDP-GNI gap. In the light of international experience, in parallel with the convergence of the Hungarian economy, the gap may narrow over the longer run, since in the more developed countries the GDP-GNI gap is typically smaller, which is attributable to the net international investor position, usually improving in parallel with the level of development. The long-term trend of the gap substantially depends on whether the convergence of the Hungarian economy to the Western countries is financed from external or domestic funds.
80 Studies
Eszter Balogh – Anna Boldizsár – Bence Gerlaki – Balázs Kóczián
References
AMECO (2017): AMECO database. Economic and financial affairs, European Commission. 9 November. http://ec.europa.eu/economy_finance/ameco/user/serie/SelectSerie.cfm
Balatoni, A. – Pitz, M. (2012): A működőtőke hatása a bruttó nemzeti jövedelemre Magyarországon (The effect of direct investment on Hungary s gross national income). Közgazdasági Szemle, 59(1): 1–30.
BEA (2015): Measuring the Economy: A Primer on GDP and the National Income and Product Accounts. Bureau of Economic Analysis, U. S. Department of Commerce. Washington, DC, December. https://www.bea.gov/national/pdf/nipa_primer.pdf
Capelli, C. – Vaggi, G. (2013): A better indicator of standards of living: The Gross National Disposable Income. DEM Working Paper Series 062, University of Pavia, Department of Economics and Management.
Costanza, R. – Hart, M. – Posner, S. – Talberth J. (2009): Beyond GDP: The Need for New Measures of Progress. The Pardee Papers No. 4., Boston University, January.
Csortos, O. – Kóczián, B. (2017): An Analysis of the Incomes and Current Personal Transfers of Hungarians Living Abroad. Financial and Economic Review, 16(2): 5–27. http://doi.org/10.25201/FER.16.2.527
Eurostat (2018): Statistics Database. http://epp.eurostat.ec.europa.eu/portal/page/portal/statistics/search_database. Downloaded: 10 January 2018.
HCSO (2009): GNI Inventory 2.1. Hungarian version. Hungarian Central Statistical Office https://www.ksh.hu/docs/hun/xftp/modsz/gni_inventory_ver2.1hun.pdf
HCSO (2018): STADAT tables. Hungarian Central Statistical Office. http://www.ksh.hu/stadat. Downloaded: 10 January 2018.
Komáromi, A. (2008): A külső forrásbevonás szerkezete: Kell-e félnünk az adóssággal való finanszírozástól? (The structure of external financing: Is there a reason to worry about financing through debt?). MNB Bulletin, 2008(April): 14–23.
Koroknai, P. (2008): Magyarország külföldi tartozása nemzetközi összehasonlításban (Hungary’s external liabilities in an international comparison). MNB Bulletin, 2008(December): 13–18.
Lane, P.R. – Milesi-Ferretti, G.M. (2002): Long-Term Capital Movements, NBER Chapters. In: NBER Macroeconomics Annual 2001, Volume 16, pages 73–136 National Bureau of Economic Research, Inc. https://doi.org/10.1086/654435
81
Developments in the GDP-GNI Gap in Hungary and the CEE Region
Lucas, R. (1990): Why doesn’t Capital Flow from Rich to Poor Countries? American Economic Review, 80(2): 92–96.
MNB (2014): Report on the Balance of Payments. Magyar Nemzeti Bank, September.
MNB (2016a): A külföldiek magyarországi közvetlentőke-befektetés állományának végső befektetők szerinti bontása (Breakdown of inward FDI positions according to the country of the ultimate investor). Magyar Nemzeti Bank. http://www.mnb.hu/letoltes/a-kozvetlentoke-befektetes-allomany-vegso-befektetore-allokallasa-honlapra.pdf. Downloaded: 10 January 2018.
MNB (2016b): Report on the Balance of Payments. Magyar Nemzeti Bank, October.
MNB (2017a): Inflation Report. Magyar Nemzeti Bank, December.
MNB (2017b): Growth Report. Magyar Nemzeti Bank, December.
MNB (2017c): Report on the Balance of Payments. Magyar Nemzeti Bank, October.
MNB (2018): Balance of payments, foreign direct investments, international investment position. Magyar Nemzeti Bank. https://www.mnb.hu/statisztika/statisztikai-adatok-informaciok/adatok-idosorok/viii-fizetesi-merleg-kozvetlen-tokebefektetesek-kulfolddel-szembeni-allomanyok/fizetesi-merleg-kulfolddel-szembeni-allomanyok/bpm6-modszertan-szerinti-adatok. Downloaded: 10 January 2018.
Oblath, G. (2011): Makrostatisztika (Macrostatistics). Department of Economics at the Faculty of Social Sciences of the Eötvös Lóránd University.
Stapel-Weber, S. – Verrinder, J. (2016): Globalisation at work in statistics – Questions arising from the ’Irish case’. Eurona, 2: 29–44. https://ec.europa.eu/eurostat/cros/system/files/euronaissue2-2016-art2.pdf. Downloaded: 10 January 2018.
Stiglitz, J.E. – Sen, A. – Fitoussi, J-P. (2008): Report by the Commission on the Measurement of Economic Performance and Social Progress. ECB. http://ec.europa.eu/eurostat/documents/118025/118123/Fitoussi+Commission+report. Downloaded: 10 January 2018.
World Bank (2017): Why use GNI per capita to classify economies into income groupings? World Bank. https://datahelpdesk.worldbank.org/knowledgebase/articles/378831-why-use-gni-per-capita-to-classify-economies-into. Downloaded: 28 February 2018.

82 Studies
Eszter Balogh – Anna Boldizsár – Bence Gerlaki – Balázs Kóczián
Appendix 1: Changes in the GDP-GNI gap of countries that successfully concluded the convergence process
At the end of the successful convergence period, the GDP-GNI gap typically closed (Figure 17). According to the experiences of the countries that successfully concluded the convergence process, the GDP-GNI gap gradually decreased during convergence:
• in Singapore, the FDI inflow was an important financing item throughout convergence, and a substantial part of the investments were realised from foreign direct investments. Accordingly, in the initial period of convergence, the GDP-GNI gap widened substantially. However, as a result of outward investments – primarily of debt type – characterising the years after the mid-1980s, this gap started to close.
• In Finland, the initially significant inflow of funds decelerated during convergence, which led to the closing of the GDP-GNI gap.
• In South Korea and Austria, there was hardly any gap between GNI and GDP, which may have been due to the negligible volume of net external financing.
• Ireland is an exception, as the FDI inflow attributable to the favourable tax system caused GDP to soar, also accompanied by a significant rise in debt liabilities. These factors together led to a large GDP-GNI gap, the narrowing of which took place only after the adjustment, commencing at the end of the 1980s and impacting the debt liabilities.
On the whole, it can be stated that in the countries that have concluded the convergence process successfully, the GDP-GNI gap usually decreased close to zero by the end of the convergence period.
Figure 17GDP-GNI gap in the states that concluded convergence successfully
90
92
94
96
98
100
102
104
106
108
110
90
92
94
96
98
100
102
104
106
108
110
1964
19
66
1968
19
70
1972
19
74
1976
19
64
1966
19
68
1970
19
72
1974
19
76
1978
19
76
1978
19
80
1982
19
84
1986
19
88
1990
19
88
1990
19
92
1994
19
79
1981
19
83
1985
19
87
Austria Finland Ireland SouthKorea Singapore
Per cent Per cent
Source: World Bank
83
Developments in the GDP-GNI Gap in Hungary and the CEE Region
Appendix 2: What does the FDI income in GNI show?
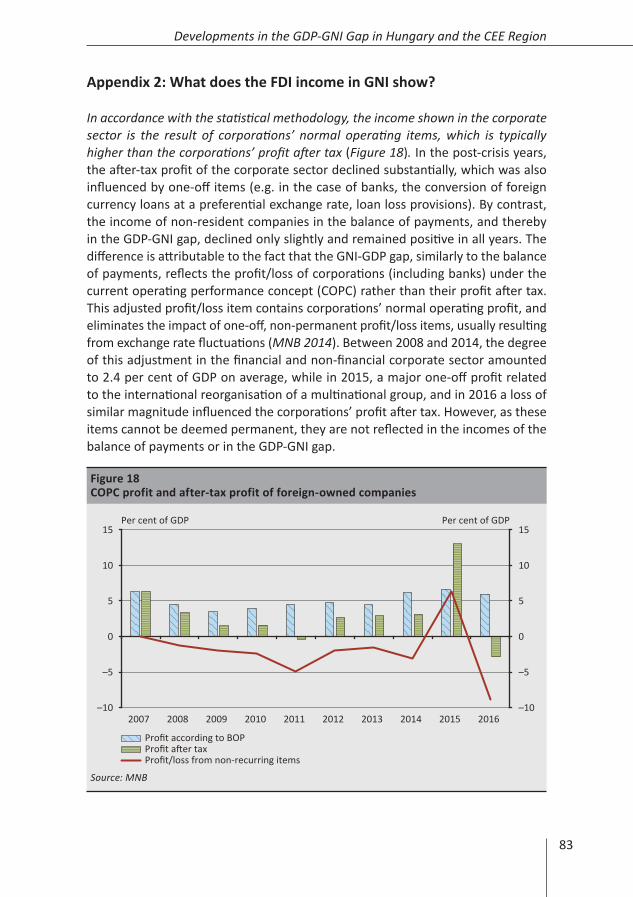
In accordance with the statistical methodology, the income shown in the corporate sector is the result of corporations’ normal operating items, which is typically higher than the corporations’ profit after tax (Figure 18). In the post-crisis years, the after-tax profit of the corporate sector declined substantially, which was also influenced by one-off items (e.g. in the case of banks, the conversion of foreign currency loans at a preferential exchange rate, loan loss provisions). By contrast, the income of non-resident companies in the balance of payments, and thereby in the GDP-GNI gap, declined only slightly and remained positive in all years. The difference is attributable to the fact that the GNI-GDP gap, similarly to the balance of payments, reflects the profit/loss of corporations (including banks) under the current operating performance concept (COPC) rather than their profit after tax. This adjusted profit/loss item contains corporations’ normal operating profit, and eliminates the impact of one-off, non-permanent profit/loss items, usually resulting from exchange rate fluctuations (MNB 2014). Between 2008 and 2014, the degree of this adjustment in the financial and non-financial corporate sector amounted to 2.4 per cent of GDP on average, while in 2015, a major one-off profit related to the international reorganisation of a multinational group, and in 2016 a loss of similar magnitude influenced the corporations’ profit after tax. However, as these items cannot be deemed permanent, they are not reflected in the incomes of the balance of payments or in the GDP-GNI gap.
Figure 18COPC profit and after-tax profit of foreign-owned companies
–10
–5
0
5
10
15
–10
–5
0
5
10
15
2007 2008 2009 2010 2011 2012 2013 2014 2015 2016
Per cent of GDP Per cent of GDP
Profit according to BOPProfit after taxProfit/loss from non-recurring items
Source: MNB

84 Studies
Eszter Balogh – Anna Boldizsár – Bence Gerlaki – Balázs Kóczián
In addition to the recognition for the purpose of statistics, the FDI incomes included in GNI are also influenced by the individual tax optimisation decisions of companies. If the income of corporations is reallocated among the individual countries already before taxation (e.g. a company pays licence fee to the parent company), it results – in addition to the growth in other items (typically imports) in the balance of payments – in a decrease in the income from profit. The law prescribes the use of arms’ length prices for the settlement of the transactions between related companies, which in theory prevents abuses, but in the case of multinational companies, sales even at such arm’s length prices may result in major reallocation of revenues. In the absence of aggregated data, it is not possible to quantify the magnitude and direction of the effect of these strategies on the domestic net outflow of FDI income, but it is worth highlighting the role of this in the changes in the GDP-GNI gap.
Although the entire corporate income reduces the value of GNI, this does not mean that the companies distributed this income to the owners, as a large part thereof was reinvested in the economy – however, this appears as external liability at the companies. Although the GDP-GNI includes the total corporate income, this does not mean that these incomes are transferred to the home country. The GDP-GNI gap only reflects the difference between the income holders. The generated income can be broken down further at the companies based on whether the owner thereof has distributed it as dividend (practically transferred to the home country) or reinvested it in the respective economy. That is, part of the corporate income reflected in the GDP-GNI gap does not effectively leave the economy, but the owners reinvest it and it finances the continued operation and investments of the company.