Development/Plasticity/Repair ... · Development/Plasticity/Repair ... such as occurs after stroke,...
13
Development/Plasticity/Repair Extensive Cortical Rewiring after Brain Injury Numa Dancause, 1,2 Scott Barbay, 1,2 Shawn B. Frost, 1,2 Erik J. Plautz, 1,2 Daofen Chen, 4 Elena V. Zoubina, 1,2 Ann M. Stowe, 1,2 and Randolph J. Nudo 1,2,3 1 Department of Molecular and Integrative Physiology, 2 Mental Retardation Research Center, and 3 Landon Center on Aging, The University of Kansas Medical Center, Kansas City, Kansas 66160, and 4 National Institute of Neurological Disorders and Stroke, Neuroscience, Bethesda, Maryland 20892 Previously, we showed that the ventral premotor cortex (PMv) underwent neurophysiological remodeling after injury to the primary motor cortex (M1). In the present study, we examined cortical connections of PMv after such lesions. The neuroanatomical tract tracer biotinylated dextran amine was injected into the PMv hand area at least 5 months after ischemic injury to the M1 hand area. Comparison of labeling patterns between experimental and control animals demonstrated extensive proliferation of novel PMv terminal fields and the appearance of retrogradely labeled cell bodies within area 1/2 of the primary somatosensory cortex after M1 injury. Furthermore, evidence was found for alterations in the trajectory of PMv intracortical axons near the site of the lesion. The results suggest that M1 injury results in axonal sprouting near the ischemic injury and the establishment of novel connections within a distant target. These results support the hypothesis that, after a cortical injury, such as occurs after stroke, cortical areas distant from the injury undergo major neuroanatomical reorganization. Our results reveal an extraordinary anatomical rewiring capacity in the adult CNS after injury that may potentially play a role in recovery. Key words: cortex; neuroanatomy; plasticity; squirrel monkey; stroke; PMv Introduction A disturbance in blood supply to the brain, as occurs in stroke, results in death of neuronal tissue in the affected region. Conse- quent to a stroke in the cerebral cortex, survivors often have numerous motor impairments, including loss of fine motor skills in the upper limb (Bucy, 1944; Passingham et al., 1983; Hoffman and Strick, 1995). This impairment leads to a decrease of function and, consequently, of the individual’s overall autonomy, quality of life, and productivity (Olsen, 1990). Although some spontane- ous recovery occurs in the weeks and months after injury (Dun- can and Lai, 1997), between 15 and 30% of stroke survivors are permanently disabled, making stroke a leading cause of long- term disability (Muntner et al., 2002). Recent results from human and animal studies suggest that, after a stroke, the cerebral cortex is capable of significant reorganization (Nudo, 1999). To the ex- tent that neuroplasticity may contribute to restitution of func- tion, it is important to understand its underlying mechanisms. A proposed mechanism to support recovery after a cortical infarct in the primary motor cortex (M1) is the remodeling of other intact, more distant regions of the brain, such as premotor areas. This possibility is supported by various changes known to occur in distant areas after a central lesion (Chollet et al., 1991; Lee and van Donkelaar, 1995; Witte and Stoll, 1997; Nudo, 1999). Particularly, the premotor cortex has been suggested to play an active role in motor recovery after stroke in nonhuman primates (Liu and Rouiller, 1999; Frost et al., 2003) and humans (Miyai et al., 1999, 2002). One mode by which functional remodeling of premotor cor- tex could occur is through rewiring of its anatomical connec- tions. Large-scale corticocortical sprouting of axons in the adult CNS after damage is still a matter of debate (Pearson et al., 2001). Only a few studies, all involving peripheral injury, support this mechanism. For example, in studies in visual cortex of adult cats after retinal lesions and in somatosensory cortex of adult mon- keys after peripheral nerve injury, anatomical rewiring was lim- ited to a few millimeters (Darian-Smith and Gilbert, 1994; Flo- rence et al., 1998). However, it appears that a cortical injury creates a particularly favorable environment for sprouting to oc- cur in the remaining, intact cortex (Napieralski et al., 1996; Car- michael et al., 2005). Although anatomical reorganization also occurs in the cortex immediately adjacent to a stroke-induced injury (Carmichael et al., 2001), the extension of this phenome- non to distant but interconnected areas has not been demon- strated in adult mammals. Because the ventral premotor cortex (PMv) shares extensive connections with M1 (Dum and Strick, 2005), after M1 injury, targets of PMv intracortical axons degen- erate. It is reasonable to hypothesize that these PMv neurons would seek novel targets during the postinfarct period. To determine whether anatomical reorganization parallels neurophysiological reorganization in PMv, we induced a cortical infarct destroying the M1 hand representation in adult squirrel monkeys and examined the cortical connections of PMv several Received Aug. 3, 2005; revised Sept. 9, 2005; accepted Sept. 23, 2005. N.D. is supported by a fellowship from the Canadian Institutes of Health Research. R.J.N. is supported by National Institutes of Health (NIH)–National Institute of Neurological Disorders and Stroke Grant NS30853, NIH–National Institute on Deafness and Other Communication Disorders Grant HD02528, and a Bugher Award from the American Heart Association. We thank Dr. Jon Kaas for commenting on myelin-stained sections for case 1662 and Katherine A. Brennan and Kelsey D. Needham for help in the production of anatomical data. Correspondence should be addressed to Dr. Numa Dancause, Department of Molecular and Integrative Physiol- ogy, University of Kansas Medical Center, 3901 Rainbow Boulevard, Kansas City, KS 66160. E-mail: [email protected]. DOI:10.1523/JNEUROSCI.3256-05.2005 Copyright © 2005 Society for Neuroscience 0270-6474/05/2510167-13$15.00/0 The Journal of Neuroscience, November 2, 2005 • 25(44):10167–10179 • 10167
Transcript of Development/Plasticity/Repair ... · Development/Plasticity/Repair ... such as occurs after stroke,...

Development/Plasticity/Repair
Extensive Cortical Rewiring after Brain Injury
Numa Dancause,1,2 Scott Barbay,1,2 Shawn B. Frost,1,2 Erik J. Plautz,1,2 Daofen Chen,4 Elena V. Zoubina,1,2
Ann M. Stowe,1,2 and Randolph J. Nudo1,2,3
1Department of Molecular and Integrative Physiology, 2Mental Retardation Research Center, and 3Landon Center on Aging, The University of KansasMedical Center, Kansas City, Kansas 66160, and 4National Institute of Neurological Disorders and Stroke, Neuroscience, Bethesda, Maryland 20892
Previously, we showed that the ventral premotor cortex (PMv) underwent neurophysiological remodeling after injury to the primarymotor cortex (M1). In the present study, we examined cortical connections of PMv after such lesions. The neuroanatomical tract tracerbiotinylated dextran amine was injected into the PMv hand area at least 5 months after ischemic injury to the M1 hand area. Comparisonof labeling patterns between experimental and control animals demonstrated extensive proliferation of novel PMv terminal fields and theappearance of retrogradely labeled cell bodies within area 1/2 of the primary somatosensory cortex after M1 injury. Furthermore,evidence was found for alterations in the trajectory of PMv intracortical axons near the site of the lesion. The results suggest that M1 injuryresults in axonal sprouting near the ischemic injury and the establishment of novel connections within a distant target. These resultssupport the hypothesis that, after a cortical injury, such as occurs after stroke, cortical areas distant from the injury undergo majorneuroanatomical reorganization. Our results reveal an extraordinary anatomical rewiring capacity in the adult CNS after injury that maypotentially play a role in recovery.
Key words: cortex; neuroanatomy; plasticity; squirrel monkey; stroke; PMv
IntroductionA disturbance in blood supply to the brain, as occurs in stroke,results in death of neuronal tissue in the affected region. Conse-quent to a stroke in the cerebral cortex, survivors often havenumerous motor impairments, including loss of fine motor skillsin the upper limb (Bucy, 1944; Passingham et al., 1983; Hoffmanand Strick, 1995). This impairment leads to a decrease of functionand, consequently, of the individual’s overall autonomy, qualityof life, and productivity (Olsen, 1990). Although some spontane-ous recovery occurs in the weeks and months after injury (Dun-can and Lai, 1997), between 15 and 30% of stroke survivors arepermanently disabled, making stroke a leading cause of long-term disability (Muntner et al., 2002). Recent results from humanand animal studies suggest that, after a stroke, the cerebral cortexis capable of significant reorganization (Nudo, 1999). To the ex-tent that neuroplasticity may contribute to restitution of func-tion, it is important to understand its underlying mechanisms.
A proposed mechanism to support recovery after a corticalinfarct in the primary motor cortex (M1) is the remodeling ofother intact, more distant regions of the brain, such as premotorareas. This possibility is supported by various changes known to
occur in distant areas after a central lesion (Chollet et al., 1991;Lee and van Donkelaar, 1995; Witte and Stoll, 1997; Nudo, 1999).Particularly, the premotor cortex has been suggested to play anactive role in motor recovery after stroke in nonhuman primates(Liu and Rouiller, 1999; Frost et al., 2003) and humans (Miyai etal., 1999, 2002).
One mode by which functional remodeling of premotor cor-tex could occur is through rewiring of its anatomical connec-tions. Large-scale corticocortical sprouting of axons in the adultCNS after damage is still a matter of debate (Pearson et al., 2001).Only a few studies, all involving peripheral injury, support thismechanism. For example, in studies in visual cortex of adult catsafter retinal lesions and in somatosensory cortex of adult mon-keys after peripheral nerve injury, anatomical rewiring was lim-ited to a few millimeters (Darian-Smith and Gilbert, 1994; Flo-rence et al., 1998). However, it appears that a cortical injurycreates a particularly favorable environment for sprouting to oc-cur in the remaining, intact cortex (Napieralski et al., 1996; Car-michael et al., 2005). Although anatomical reorganization alsooccurs in the cortex immediately adjacent to a stroke-inducedinjury (Carmichael et al., 2001), the extension of this phenome-non to distant but interconnected areas has not been demon-strated in adult mammals. Because the ventral premotor cortex(PMv) shares extensive connections with M1 (Dum and Strick,2005), after M1 injury, targets of PMv intracortical axons degen-erate. It is reasonable to hypothesize that these PMv neuronswould seek novel targets during the postinfarct period.
To determine whether anatomical reorganization parallelsneurophysiological reorganization in PMv, we induced a corticalinfarct destroying the M1 hand representation in adult squirrelmonkeys and examined the cortical connections of PMv several
Received Aug. 3, 2005; revised Sept. 9, 2005; accepted Sept. 23, 2005.N.D. is supported by a fellowship from the Canadian Institutes of Health Research. R.J.N. is supported by National
Institutes of Health (NIH)–National Institute of Neurological Disorders and Stroke Grant NS30853, NIH–NationalInstitute on Deafness and Other Communication Disorders Grant HD02528, and a Bugher Award from the AmericanHeart Association. We thank Dr. Jon Kaas for commenting on myelin-stained sections for case 1662 and Katherine A.Brennan and Kelsey D. Needham for help in the production of anatomical data.
Correspondence should be addressed to Dr. Numa Dancause, Department of Molecular and Integrative Physiol-ogy, University of Kansas Medical Center, 3901 Rainbow Boulevard, Kansas City, KS 66160. E-mail:[email protected].
DOI:10.1523/JNEUROSCI.3256-05.2005Copyright © 2005 Society for Neuroscience 0270-6474/05/2510167-13$15.00/0
The Journal of Neuroscience, November 2, 2005 • 25(44):10167–10179 • 10167

months later. These data were compared with the pattern of con-nections in uninjured animals.
Materials and MethodsExperiments were performed in eight adult squirrel monkeys (genusSaimiri). All animal use was in accordance with a protocol approved bythe Institutional Animal Care and Use Committee of the University ofKansas Medical Center. Briefly, after determination of each animal’sdominant hand, neurophysiological mapping experiments were con-ducted to delineate motor and somatosensory representations in thecontralateral frontal and parietal cortex. Animals in an experimentalgroup (n � 4) then received an ischemic infarct to the contralateral M1hand area. Several months later, a neuroanatomical tract tracer was in-jected into the PMv hand representation. Subsequent postmortem his-tologic analysis revealed retrograde and anterograde labeling patternswithin the cerebral cortex. The results were compared with a group ofcontrol animals (n � 4) that underwent similar procedures, except forthe cortical infarct.
Behavioral assessmentsUsing a modified “Kluver board” to assess manual performance on areach and retrieval task (Glees, 1961; Nudo et al., 1992), a “preferencescore” was calculated as the average of the percentage of left- or right-hand initial reaches and percentage of left- or right-hand pellet retrievalsfor all wells. If the percentage score was higher than 50% for the left-hand, the monkey was considered left-handed (i.e., dominant hand isleft-hand). The extent and time course of motor recovery using thisinfarct model has been described in detail in previous studies (Frost et al.,2003). They are briefly summarized in Results.
Derivation of motor mapsMicroelectrode stimulation mapping in anesthetized animals was used todelineate the M1 and PMv forelimb and adjacent motor representations.This information was used to direct the location of the tracer injectionsite (see below) and to identify the areas sharing connections with PMv inthe frontal cortex. Surgeries were performed using aseptic techniquesand halothane-nitrous oxide anesthesia on the hemisphere contralateralto the dominant hand (Nudo et al., 1992). A craniotomy exposed the M1,PMv, and primary somatosensory cortex (S1) hand areas. A plastic cyl-inder was fitted over the opening and used to contain warm, sterilesilicone oil. A digital photograph of the exposed cortex was taken andsubsequently used to create a two-dimensional map of motor represen-tations superimposed on the vascular landmarks. Then the halothanewas withdrawn, ketamine–acepromazine or ketamine–valium (diaze-pam) was administered intravenously, and vital signs were monitoredthroughout the remainder of the experiment. A microelectrode, madefrom a glass micropipette tapered to a fine tip and filled with 3.5 M NaCl,was used for electrical stimulation applied at a depth of �1750 �m (layerV). Typical intracortical microstimulation (ICMS) parameters were used(Nudo et al., 1992, 1996), pulse trains were repeated at 1 Hz intervals, andcurrent was limited to 30 �A or less. After appropriate positioning of themicroelectrode, the intensity of the current was gradually increased untilthe elicited movement could be unambiguously identified by one exper-imenter and confirmed by another. Movements were described usingconventional terminology (Gould et al., 1986). Joint movements conse-quent to the electrical stimuli were indicated on the digital photograph atthe precise locations of the electrode penetrations. ICMS was delivered tosequential sites, and evoked motor responses were defined until the distalforelimb area was surrounded either by sites evoking proximal move-ments or no visible response. For the experimental animals, M1 wasmapped at relatively low resolution (500 �m interpenetration distances)and PMv at relatively high resolution (250 �m interpenetration dis-tances) before and 3 months after the M1 lesion. The lower resolution inM1 was sufficient for defining the borders of the hand representation andthus the intended lesion area. The higher resolution was used to definemore precisely the changes in neurophysiological organization of PMv(Frost et al., 2003).
M1 and PMv hand representations were defined by these responsesand their borders specified on the photograph (Fig. 1). To be consistent
with our previous publications, the term “hand representation” is usedinstead of “distal forelimb representation.” We defined and included inthe hand representation all sites at which electrical stimulation elicitedmovements of the digits, wrist, or forearm. We included sites evokingforearm and wrist movements in the hand representation for two rea-sons. First, in our experience using ICMS mapping procedures in squirrelmonkeys, we have generally found that digits, wrist, and forearm repre-sentations are intermingled and circumscribed by representations of el-bow and shoulder. In that respect, the forearm appears to be more relatedfunctionally to distal representations than proximal. Second, in a reach-ing movement, the positioning of the shoulder and elbow are more re-mote to the target and thus associated with a more general or globalpositioning of the limb. Conversely, the forearm allows more refined andprecise orientation of digits in relation to the target. Thus, sites at whichthe stimulation elicited movement of the elbow, shoulder, orofacial area,or no response determined the physiological border of the hand repre-sentation. For additional details of these procedures and a discussion ofthe possible sources of variation in ICMS-defined motor maps, see Strickand Preston (1982), Donoghue et al. (1992), and Nudo et al. (1992,1996). Details of hand representation areas for each animal are summa-rized in Table 1.
Identification of supplementary motor cortex (SMA) and dorsal pre-motor cortex (PMd) was based on previous neurophysiological datafrom our laboratory. The identification of remaining frontal areas wasbased on general landmarks and reports from other investigators (Preussand Goldman-Rakic, 1989; Guldin et al., 1992).
Derivation of somatosensory mapsAdditional mapping of the S1 was achieved in three cases (367E, 9406,and 21B). This information was used to help identify parietal areas shar-ing connections with PMv. To derive somatosensory maps in S1, tech-niques for microelectrode recording of multiunit neuronal activity wereused to define cutaneous and muscle/joint fields in areas 3a, 3b, and 1/2(Snow et al., 1988; Nudo, 1997; Barbay et al., 1999). Briefly, a glass mi-cropipette similar to that used for ICMS procedures was used for somato-sensory recording (impedance, 1–1.5 M�). The microelectrode was low-ered perpendicular to the cortical surface, and the depth was adjusted tooptimize the sensory signal (depth range of 400 –1000 �m). Signals werefiltered, amplified, and played over a loudspeaker for monitoring. Min-imal cutaneous receptive fields were defined by determining the skin fieldover which cortical neurons were driven by just visible indentation of theskin with a fine glass probe. Adequate thresholds for cutaneous responseswere then determined by modified von Frey hairs (Semmes-Weinsteinmonofilaments, i.e., using a filament smaller than 3.61). Deep receptivefields were defined by high-threshold stimulation and joint manipula-tion. Because area 3b was originally the focus for our studies, fewer pen-etrations were made in area 1/2. Whereas cutaneous and muscle-jointresponses can also be recorded in M1 (area 4), the ICMS-derived motormaps, using the techniques and parameters described above, reliablydetermine the boundary between area 4 and area 3a. That is, the caudalboundary of the motor hand area closely corresponds to the cytoarchi-tectonic boundary between area 4 and area 3a as determined in parasag-ittal sections stained for Nissl substance (Nudo et al., 1992). An addi-tional two rostrocaudal rows of microelectrode penetrations were madeat a similar resolution to identify the area 3b/area 1/2 border (Kaas,1993). Although this method did not provide great details on the internalorganization of these areas, it allowed precise identification of borders,particularly between area 3a and 3b, between area 3b and 1/2, and themedial and lateral limits of the area 3b hand representation.
Identification of other somatosensory areas in the parietal cortex wasbased on topographic location and myeloarchitecture as described inprevious reports in nonhuman primates (Krubitzer and Kaas, 1990b,1992). We grouped areas 7b/anterior intraparietal area, secondary so-matosensory area (S2), and parietal ventral area (PV) into a collective“posterior operculum/inferior parietal cortex” area. Although this con-servative definition provided a reasonable level of confidence, the evalu-ation of any potential differences in connections of PMv with these areaswill await additional studies. For details of classification of anatomicalareas, see Dancause et al. (2005).
10168 • J. Neurosci., November 2, 2005 • 25(44):10167–10179 Dancause et al. • Sprouting after Brain Injury

Cortical infarct methodsElectrocoagulation techniques were used to permanently occlude theblood vessels supplying the delimited M1 hand area (i.e., the corticalterritory in which electrical stimulation resulted in movements of the
hand) by passing electrical current between the tips of microforceps con-nected to a bipolar electrocoagulator. The resulting lesions using thistechnique are quite reliable and specific. They consistently correspond tothe intended infarct zone and extend through all six layers of cortical gray
Figure 1. BDA injection location. A, Left, Diagram illustrating the location of the M1 and PMv hand representations in cerebral cortex of a squirrel monkey. Movement representations as definedby microelectrode stimulation techniques are shown 3 months after an ischemic lesion in the M1 hand area. Sites whose stimulation evoked movements of the digits (red), wrist, and forearm (green)comprised the hand representation. Stimulation of surrounding sites evoked proximal (elbow, shoulder, and trunk; blue) or orofacial (yellow) movements or no response (gray hatching). Lesionlocation is shown in gray. Right, Demonstration of alignment of anatomical and physiological data. A1 shows the injection core in case 9406. Asterisks indicate locations of selected blood vessels, andcross indicates location of injection site. A2 shows the location of the PMv hand representation (outlined in red) in relation to the surface blood vessel pattern. Asterisks indicate locations of selectedblood vessels at which they penetrate radially into the cortical gray matter. These reference markers provided a means to coregister the anatomical and physiological data. Because of shrinkage inthe histological processing of the tissue, scaling was required to achieve optimal coregistration. A3 shows these two sets of data superimposed with an outline of the injection core. Finally, A4 showsthe complete map of movement representations in PMv with respect to the dense core of the BDA injection. Scale bar, 1 mm. B, Location of injection core in each of the animals in the study (4 controlcases on the left, 4 experimental cases on the right). BDA injections were well confined within the PMv hand representation in cases 9406, 21B, and 1662. In case 367E, the injection extendedsomewhat into nonresponsive and unmapped territory. However, because this case showed a similar pattern of connections when compared with other experimental cases, it was retained foradditional analysis. Color code for movement representations is identical to A. Scale bar, 1 mm.
Dancause et al. • Sprouting after Brain Injury J. Neurosci., November 2, 2005 • 25(44):10167–10179 • 10169

matter without directly affecting the underlying white matter. The extentof electrocoagulation lesions was verified by three different techniques atthree time points: (1) the ischemic borders of the lesion using laser Dopp-ler blood flow imaging (Moor Instruments, Wilmington, DE) at 1 h afterinfarct, (2) the boundaries of ICMS-evoked motor responses elicited atthe time of tracer injection several months later, and (3) the histologicallydefined necrosis in the postmortem tissue. All three techniques showedclose correspondence of the limits of the infarcted zone. For more detailsregarding the electrocoagulation infarct technique and discussion of itslimitations, see Nudo et al. (2003).
Neuronal tracer injectionsAfter completion of all neurophysiological procedures (motor and sen-sory mapping), the neuronal tracer biotinylated dextran amine (BDA)[5% BDA in saline solution; 10,000 molecular weight (MW) conjugatedto lysine; Molecular Probes, Eugene, OR] was injected into the center ofthe PMv hand area to visualize anterograde and retrograde connectivity.The most important variable for evaluation of the relative efficacy of theinjection across cases is the size of the tracer injection site as derived fromexamination of the histological sections after processing. BDA injectionlocations with respect to the forelimb representation of PMv are shownin Figure 1. Injections in 9406 and 1662 were performed using a pneu-matic picopump (PV830; World Precision Instruments, Sarasota, FL)and delivered through a tapered, graduated micropipette (5 �l capacity,1 �l gradations, Fisherbrand; Fisher Scientific, Houston, TX) (for 9406,30 �m outer diameter, 250 nl; for 1662, 40 �m outer diameter, 200 nl).These injections were performed � 8 and � 31 months after the M1lesion for 9406 and 1662, respectively. Injections in 367E and 21B weremade via pressure injection with a microsyringe pump controller �5months after the M1 lesion (UPP2-1; World Precision Instruments) witha 1 �l Hamilton syringe (200 and 150 nl, respectively). Injections weremade at multiple depths to label a column of PMv cortex through alllayers of the gray matter. In general, we produced two very small injec-tions in 21B and 1662 and two relatively larger injections in 367E and9406, although conservative in relation to injections reported in mostcontemporary studies of intracortical tract tracing (Stepniewska et al.,1993; Ghosh and Gattera, 1995).
Histological proceduresAfter the injection of BDA, 12 d of incubation were allowed for transportof the label. The animal was then killed with a lethal dose of Euthasol(Delmarva Laboratories, Midlothian, VA) injected intra-abdominallyand then perfused with a solution of 0.2% heparin/lidocaine with 0.9%saline, followed by 3% paraformaldehyde in phosphate buffer, pH 7.4.Then the brain was removed, and the cerebral cortex was separated fromthe rest of the brain. The cortex was then trimmed to remove and discardthe temporal and occipital lobes. The remaining parietal and frontalcortex was carefully “unfolded” and gently flattened between two glassslides (Gould and Kaas, 1981). It was then postfixed in a solution of 20%
glycerol/4% paraformaldehyde in 0.1 M phosphate buffer for 2 h, 20%glycerol/2% DMSO in 0.1 M phosphate buffer for �12 h, and 20% glyc-erol in 0.1 M phosphate buffer for �24 h. The cortex was then sectionedtangential to the cortical surface (thickness of 50 �m) using a freezingmicrotome. Tangential sections were used to allow the visualization ofprojection patterns within single histological sections and the coregistra-tion of myeloarchitectonic and neurophysiologic data with reconstruc-tions of tracer distribution (see below). The accuracy of these techniqueswas aided by the choice of species, because the frontal and parietal cortexof the squirrel monkey brain is relatively smooth, except for a shallowcentral sulcus roughly separating M1 from S1.
BDA processing. Every third section was used for histological process-ing to examine the presence of BDA, allowing us to document the pat-terns of axonal projections from and to PMv at steps of �150 �m (ap-proximate, because some compression probably occurred duringflattening) through the depths of the cortical gray matter.
Processing was performed using a Vectastain ABC kit (Elite; VectorLaboratories, Burlingame, CA). After sectioning, the tissue was passedthrough two 10 min rinses in cold 0.05 M potassium phosphate buffer insaline solution (KPBS), followed by two 30 min washes in 0.4% TritonX-100. Sections were rinsed three times (10 min each) in 0.05 M KPBSand then incubated overnight in the Vectastain “AB” solution (two dropsof “A” and “B” per 5 ml of 0.05 KPBS; Elite; Vector Laboratories).
The following day, the tissue was rinsed (10 min) four times in 0.1 M
KPBS and then incubated in a DAB solution [10 mg of DAB in 20 ml of0.1 M KPBS and 6.7 �l of 30% H2O2 (formula modified from Dolleman-Van der Weel et al., 1994)] for 5–10 min. After three rinses in 0.1 M KPBS,the sections were mounted on subbed slides and dried overnight. Thenext day, a DAB intensification process was begun. First, sections weredehydrated and transferred to xylene for 4 d. They were then rehydrated,placed in H2O for 5 min, and then incubated in a 1.42% AgNO3 solutionfor 1 h at 56°C. Sections were subsequently passed through H2O (15min), 0.2% HAuCl4 (10 min), H2O (15 min), 5% Na2S2O3 (5 min), andH2O (15 min). Sections were finally dehydrated again, followed by 5 minin xylene before being coverslipped the same day.
Myelin staining. Every third section was used for myelin staining tofurther delineate somatosensory areas of the parietal cortex. Particularly,myelin was useful in identifying the area 3b hand and orofacial represen-tations (Qi and Kaas, 2004), S2 and PV (Krubitzer and Kaas, 1990a,1992). Briefly, mounted sections were reacted with pyridine/acetic anhy-dride solution and then hydrated and reacted with increasing acetic acidsolution. Sections were then incubated in silver nitrate solution for 1 hand then returned to the acetic acid solution. Finally, a solution of anhy-drous sodium carbonate, ammonium nitrate, silver nitrate, silicotungsticacid, and formaldehyde was used as the developer. Sections were repeti-tively passed through the developer and potassium ferricyanide to in-crease contrast between areas. Several functional areas, such as area 3b ofS1 or orofacial representations, became more darkly stained with this
Table 1. Evaluation of injection size and location
Group CaseM1 handarea (mm2)
PMv handarea (mm2)a
Injection area(mm2)
Injection sizecategory
Movements evoked within the injection core
No response(%)
Proximal(%)
Hand (%)
Wrist/forearm Digits Total
Control 1934 14.97 5.15 3.33 Largeb 1.2 13.5 68.5 16.8 85.3Control 1892 12.87 3.98 1.93c Large 0 32.1 5.7 62.2 67.9Control 9409 8.51 3.77 0.87 Small 0 16.2 13.7 70.1 83.8Control 3024 14.04 3.54 0.84 Small 11.9 0 54.8 33.3 88.1Experimental 21B 0.75 5.08 1.06 Small 0 3.8 47.2 49.0 96.2Experimental 367E 4.12 2.90 4.31 Large 36.5 30.1 22.7 10.7 33.4Experimental 1662 1.15 3.86 0.34 Small 0 0 84.2 15.8 100Experimental 9406 0.46 3.71 1.74 Large 0 8.0 2.9 89.1 92.0aNote the high individual variability in the absolute size of PMv (and other motor) maps. Thus, it is not readily apparent that the size of the PMv differs between groups. However, when the PMv hand area of each animal was compared beforeand after the lesion (paired comparisons), there was a significant difference between the groups in the amount of increase in total hand area (Frost, et al., 2003). On average, the increase in hand representation of PMv for the experimentalgroup in the present study was 35.3 � 22.6%.bThe injections are large compared with others in the current study. However, they are relatively small compared with most other cortical connectivity studies.cNumber is approximate because a portion of the injection core was absent (see Materials and Methods).
10170 • J. Neurosci., November 2, 2005 • 25(44):10167–10179 Dancause et al. • Sprouting after Brain Injury

process. Particularly, this procedure allowed identification of the caudalborder of 3b, as well as the hand/face septum corresponding to the lateralborder of the 3b hand representation. In some sections, specific digitzones in 3b were clearly delineated.
Neuroanatomical analysisReconstruction of BDA-reacted sections. To document the distribution ofBDA-labeled cell bodies, varicosities (terminal boutons), and fiberswithin the hemisphere ipsilateral to the injection in PMv, a neuroana-tomical reconstruction system was used consisting of a computer-interfaced microscope and associated software (Neurolucida; Micro-BrightField, Colchester, VT). The reconstruction system recorded the xand y coordinates of each of the BDA-labeled objects relative to thesection outline (Figs. 2, 3). In addition, the locations of selected largeblood vessels were documented using the same reconstruction system foruse as fiducial markers.
(1) Cell bodies or somata were approximately round in shape (becauseof tangential sectioning) containing dense black granules of BDA label.We required the labeled cell body to have at least two thin projections,considered to be dendrites or axons. Occasionally, cell bodies were sointensely labeled that they appeared solid dark brown.
(2) Varicosities were considered to be terminals or boutons if theyappeared as small, darkly labeled spheres contacting a small fiber. Be-cause the time required to fully analyze all labeled terminals in everysection was prohibitively long, we sampled two slides per animal atdepths approximately corresponding to middle and deep layers (situatedat depths of �300 – 600 and �1600 –1800 �m, respectively). We sampledthe selected sections using a grid pattern overlaid on the section image. If
at least two terminals were located within asquare of the grid (100 � 100 �m), a markerwas placed in the center of the square. Becauseeach section had a finite depth (50 �m), thevolumetric unit “voxel” is used in the presentdescription. The voxel method is particularlyuseful for the precise documentation of the ter-minal locations in a reasonable time. However,the resulting resolution of 0.01 mm 2 per 50-�m-thick grid (or 0.0005 mm 3) provided lim-ited information on absolute synapse densityand thus on total synapse numbers (one voxelcan have between two and hundreds of syn-apses). The resulting numbers of labeled voxelsare more directly correlated with the total cor-tical volume occupied by terminals from PMv.This should be considered in the interpretationof quantitative results. High-resolution photo-graphs of the remaining BDA-processed sec-tions were scanned visually (but not enteredinto the computerized neuroanatomical sys-tem) to ensure representative sampling. Thistissue was not found to differ in any substantialway from the reconstructed data.
(3) Large fibers consisting of darkly stainedstrands with large diameter and relativelystraight trajectories were considered to be pro-jection axons. These axons contained no synap-tic boutons and were longer than 200 �m.Large fibers coursing in tangential sectionswere presumed to reflect pathways betweenPMv and other cortical areas. Axonal patternswere specifically documented and selected forquantitative analysis of fiber trajectories at therostrolateral border of M1 (polar histograms;see below). Small fibers consisting of darklystained strands of small diameter with mean-dering trajectories and attached synaptic bou-tons were considered to be axonal arbors. Be-cause these fibers represent end arbors of PMvcortical projections and thus provide redun-dant information to terminal plotting, they
were specifically not used for quantitative analysis.(4) Finally, we documented the distribution of blood vessels in the
three main areas of interest: PMv, M1, and S1. In tangential sections,blood vessels appeared as small holes, with distribution patterns nearlyidentical from section to section through the different depths of thecortex (Xiao and Felleman, 2004). In neuroanatomical reconstructions,the locations of selected blood vessels were indicated with a specificmarker that was placed in the middle of the hole (Neurolucida; Micro-BrightField). The blood vessels thus served as fiducial markers for align-ment of reconstructed data from multiple sections and of the photographof cortical surface blood vessels used for the coregistration of the physi-ological maps (see below).
Verification of injection core size. A critical factor to allow comparisonof the pattern of PMv connections between cases was the precise identi-fication of the size of the effective injection core. The effective size wasestimated in each case using the section with the largest dense core, asidentified using a dissecting microscope. Then, under higher magnifica-tion using a light microscope, the dense core was defined as the areaaround the center of the injection in which labeled cell bodies and termi-nals could not be easily differentiated. The dense core boundary wasdrawn on the slide reconstruction in Neurolucida (MicroBrightField) atthe area of transition at which individual terminals, cell bodies, and fibersbegan to be identifiable (Fig. 1). Finally, the Neurolucida program wasused to calculate the total area (Table 1).
Coregistration of section reconstructions and neurophysiological maps. InPMv, a coregistration technique was used to determine the BDA injec-tion location with respect to the neurophysiological maps of distal fore-
Figure 2. Pattern of terminal labeling from PMv in control animals. Reconstruction of the typical distribution of terminalsobserved in flattened, tangential sections through the frontoparietal cortex in a control case (1934; large injection, 2 sections).Because this animal received the largest BDA injection of any in the study and displayed the most extensive and densest distribu-tion of terminals, it provides a reasonable estimate of the limits of normal PMv connectivity. Contours delineate physiologically orhistologically defined areas. A gray arrowhead indicates the location of the hand/face septum. A black downward arrow indicatesthe location of area 1/2 of S1. Terminal labeling in the frontal cortex was found in areas rostral to PMv, the anterior operculum, therostrolateral portion of M1, the PMd, and the SMA. Terminal labeling in the parietal cortex was confined primarily to the posterioroperculum/inferior parietal cortex (PO/IP; area 7b, S2, and PV; black arrowheads) and the posterior parietal cortex. Very sparselabeling can be seen in the primary somatosensory cortex. CS, Central sulcus; CMA, cingulated motor area. Scale bar, 5 mm.
Dancause et al. • Sprouting after Brain Injury J. Neurosci., November 2, 2005 • 25(44):10167–10179 • 10171

limb movements. First, because the surface vasculature penetrates thecortical tissue in a radial manner (i.e., perpendicular to the surface), thepenetration locations of large blood vessels could be used to align multi-ple sections through the entire depth of the cortical gray matter.
The coregistration of the neurophysiological map with the alignedsections was done in a second step by identifying the penetration loca-tions of large vessels that were identifiable on the digital photograph ofthe cortex. These penetration locations could then be precisely matchedwith the locations of large blood vessels identified in tangential sections.To coregister the injection core location with the neurophysiologicaldata, reconstruction of the BDA-stained section with the injection coreoutline and surrounding blood vessel pattern was superimposed on thepattern of large blood vessel penetrations indicated on the digital photo-graphs of the brain surface used in the physiological mapping procedure.Once the pattern match was maximized, the precise location of the core
in relation to the physiologically identified PMv hand representation wasachieved (Fig. 1). This alignment procedure was performed separately foreach local area (e.g., M1, PMv, S1, etc.), because alignment errors in-crease with increasing distance from the selected fiducial markers.
A similar approach was used for the localization of cell bodies, termi-nals, and fibers near the infarcted M1 hand representation and in S1.However, in S1, to further ensure the precision of the localization,myelin-stained sections were coregistered with the BDA reconstructionsand neurophysiological maps (Gallyas, 1979; Krubitzer and Kaas,1990a). Using the same strategy, large blood vessels were readily visible insections stained for myelin and thus could be easily coregistered with thesections stained for BDA.
Quantification of BDA-labeled terminals and cell bodies. To quantify thedifference in PMv corticocortical connections between experimental andcontrol groups, for each functional area of the ipsilesional hemisphere,(1) the total number of voxels containing labeled terminals (or terminalvoxels) and (2) the total number of cell bodies was tallied with the aid ofa neuroanatomical analysis program (Neuroexplorer; MicroBright-Field). To account for differences attributable to injection size, numbersof terminal voxels and cell bodies were transformed to percentages ac-cording to the following equation: Total L in area X/(Total L in hemi-sphere � Total L in PMv � Total L in M1 hand), where L is the numberof terminal voxels or cell bodies, and X is the cortical area of interest. Notethat total L in M1 hand in experimental cases equals 0. Thus, the numbersof terminal voxels and cell bodies were subtracted from the hemispheretotals in control animals for comparable comparisons between groups.Because the tissue near the injection core in PMv contained the greatestproportion of labeled terminal voxels and cell bodies, numbers in PMvwere subtracted from the total to avoid minimizing the percentage labelin other areas. The percentages of terminals and cell bodies in control andexperimental cases were then compared for each cortical area using un-paired, two-tailed t tests.
Analysis of fiber orientation. To quantify evidence for rerouting of ax-ons (i.e., large fibers) along the rostrolateral border of the M1 lesion, weexamined fiber orientation in five to eight sections per case. For eachsection, we first aligned the center of the injection core and the middle ofthe cluster of BDA-labeled terminals in SMA along the vertical axis(SMA, 270°; injection core, 90°). SMA was chosen for reference because,in all cases, it consisted of a small, concise, and easily identifiable clusterof labeled cell bodies and terminals that were coextensive with the SMAhand representation. We then defined a 6.0 mm 2 rectangular analysiswindow (1.2 � 5 mm) that was large enough to include the rostralboundaries of the lesion in the M1 hand area and the immediately adja-cent intact tissue, a region in which injury-induced atypical trajectorieswere observed. The total size of the analysis window was selected so thatit was substantially smaller than the terminal field of PMv axons withinM1, as defined in control cases, i.e., approximately one-fourth of therostrolateral M1 size). In control animals, to provide an equivalent loca-tion to that of the experimental cases, the analysis window was placedwithin the cluster of labeled terminals in the rostrolateral portion of M1,in the area corresponding to the edge of the hand representation.
Using a neuroanatomical analysis program (Neuroexplorer; Micro-BrightField), each large BDA-labeled fiber within the analysis windowwas subdivided into a series of straight line segments (minimum lengthof �30 �m). Line segments were then separated into 10° bins accordingto directional orientation and then tallied and displayed in a polar histo-gram. For each case, the total fiber length within a given orientation binwas divided by the total number of sections examined. Finally, the aver-age orientation vector for each group (control or experimental) was cal-culated from the composite histograms using trigonometric functions(extraction of � from the sum of X and Y components of each vector ofthe 10° blocks of the histogram). A statistical analysis to test the differencein vector distribution between experimental and control groups was per-formed using a Watson–Williams F test (� � 0.05). This is a standard testto determine whether the mean angles of two independent circular ob-servations differ significantly from each other (Batschelet, 1981).
Figure 3. Pattern of terminal labeling from PMv in experimental animals (�5 months afterinjury). A, Distribution of PMv terminal labeling in experimental case 9406 (large injection; 2sections). Terminal labeling was found in each of the regions noted in the control cases. Addi-tionally, atypical labeling was observed caudal to the area 3b hand representation, i.e., in thearea 1/2 hand representation (black downward arrow). This same result was replicated in eachof the other experimental cases. Note that the atypical terminals were located rostral to thetypical labeling found in posterior operculum/inferior parietal cortex (PO/IP; delimited by largeblack arrowheads). Gray arrowhead indicates the location of the hand/face septum. B, Distri-bution of PMv terminal labeling in experimental case 1662 (small injection; 2 sections). Scalebar, 5 mm. CS, Central sulcus.
10172 • J. Neurosci., November 2, 2005 • 25(44):10167–10179 Dancause et al. • Sprouting after Brain Injury

Figure 4. Relationship of atypical labeling in the parietal cortex with anatomical and physiological boundaries. Example of alignment of myelin-stained section with a somatosensory map. A,Myelin-stained section in experimental case 21B. The hand/face septum is indicated by a thick black line. The boundary between area 3b and area 1/2 is demarcated by a sharp transition from denseto light myelin staining (thin black line). Caudal border of the ischemic lesion in M1 is indicated by a white triangle. As in Figure 1, asterisks represent fiducial markers indicating the locations ofselected large blood vessels observable in the same location throughout the depths of the cortical gray matter. CS, Central sulcus. Scale bar, 1 mm. B, Photograph of cortical surface vasculature in thesame case (21B). Somatosensory mapping data are superimposed on the vascular pattern. In the collection of physiological data, microelectrode penetration sites (red, white, and yellow dots) arelocated with reference to the surface vasculature. Asterisks indicate the location of surface blood vessels at which they penetrate radially into the cortex. Locations correspond to those of large bloodvessels identified in the myelin-stained sections. C, Alignment of blood vessel pattern in both anatomical and physiological datasets allowed confirmation of the border between areas 3b and 1/2.These data were then superimposed on the reconstructions of BDA labeling using the same approach. Gray rectangle indicates the location of higher-power photomicrographs shown in D. D, Left,Photomicrograph from area 1/2 in same experimental case (21B). Numerous BDA-labeled terminal arbors and fibers can be observed. Asterisk corresponds to largest asterisk in A. Gray box showslocation of higher-magnification photomicrograph on the right. Scale bar, 100 �m. Right, Small fiber with varicosities (arrowheads). Scale bar, 1 �m. E, Photomicrograph of area 1/2 in a controlcase with a large injection (1934). Area 1/2 is virtually devoid of BDA labeling. Scale bar, 100 �m. F, Photomicrograph of the area 1/2 of an experimental case with a large injection (9406). Here, inaddition to the numerous terminal arbors and fibers, a labeled somata can be seen. Scale bar, 10 �m.
Dancause et al. • Sprouting after Brain Injury J. Neurosci., November 2, 2005 • 25(44):10167–10179 • 10173

ResultsTo briefly reiterate the experimental design, the ipsilateral corti-cocortical connections of PMv were analyzed in four adult squir-rel monkeys at least 5 months after injury to the M1 forelimb areaand compared with the connections in four control monkeys.PMv and M1 forelimb representations were defined using ICMStechniques. Then an ischemic infarct destroyed the M1 hand rep-resentation. After several months, BDA was placed in the centerof the PMv hand representation. Postmortem analysis of BDA-labeled terminals, cell bodies, and large fibers was performed tocompare labeling patterns in the two groups. Results consist of(1) neurophysiological mapping data delineating the hand rep-resentations of M1 and PMv, (2) neurophysiological and histo-chemical data delineating the hand representation of S1, (3) an-atomical and physiological characterization of the BDA injectionsite, (4) analysis of BDA-labeled terminals and cell bodies, and (5)analysis of BDA-labeled fiber trajectories.
Neurophysiological mapping resultsM1 and PMv forelimb representations were found in their typicallocations (Frost et al., 2003). The M1 forelimb representation waslocated immediately rostral to the central sulcus (Donoghue etal., 1992; Nudo et al., 1992), whereas the PMv hand area waslocated ventral and rostral to M1.
Recordings of neural activity in S1 evoked by cutaneous stim-ulation of the hand verified that area 3b was arranged in a soma-totopic manner, with receptive fields on digit 5 and the ulnaraspect of the hand located medially and those on digit 1 and theradial aspect of the hand located laterally. Progressing in a rostro-caudal direction, receptive fields were ordered from the distal toproximal phalanges, respectively. Caudal to the digit area, recep-tive fields were found on the palmar surface. In particular, theborder between area 3b and 1/2 could be precisely identified bythe reversal of somatotopic gradients (Kaas, 1993). The area 1/2hand representation was also characterized by markedly largerreceptive fields, as well as a higher percentage of multi-digit re-ceptive fields compared with area 3b. In sections stained for my-elin (Gallyas, 1979), area 3b appeared darker. Additionally,within 3b, the border between the hand and facial representation(hand/face septum) was clearly identifiable. As reported by otherinvestigators (Jain et al., 1998), we found close correspondencebetween physiologically and histochemically identified borders(Fig. 4A). No statistical difference was observed for the size of the3b hand representation between the control and experimentalgroups (defined by physiological mapping: meanexp � 8.9 � 1.2mm 2; meancont � 10.2 � 1.0 mm 2; t � 1.414; p � 0.230, un-paired two-tailed t test; defined by myelin staining: meanexp �11.1 � 2.5 mm 2; meancont � 11.6 � 1.2 mm 2 after correction forhistological shrinkage; t � 0.367; p � 0.727).
As reported previously, after the ischemic lesion destroyingthe M1 hand representation, recovery of motor deficits occurredgradually during the postinfarct period, especially during the firstmonth. However, at the time of the anatomical experiments (atleast 5 months after infarct), residual deficits in fine motor skillremained. Enlargement of the PMv hand representation was ob-served after 3 months of recovery (Frost et al., 2003).
Location and size of BDA injectionThe location and extent of the BDA injection core was deter-mined in each case with respect to the PMv hand representation.Then, the neurophysiological map of PMv was coregistered withthe BDA dense core using vascular landmarks as registration
markers. In general, we produced two experimental cases withsmall injections (21B and 1662) and two with relatively largerinjections (367E and 9406). Injection sizes in experimentaland control cases were comparable (meancont � 4.11 mm 2;meanexp � 3.89 mm 2; t � 0.12; p � 0.91). Also, injections clas-
Figure 5. Coregistration of terminal labeling with neurophysiological maps of hand repre-sentations in S1. Left, Typical pattern of terminal labeling observed in parietal areas of controlcases (case 1934; large injection). Middle and Right, Pattern of terminal labeling in two exper-imental cases (21B and 367E, respectively). Outlines of area 3b functional representations ofdigits and palm are shown. Arrowheads indicate the caudal border of the posterior operculum/inferior parietal cortex (black) and hand/face septum (gray), respectively. Black downwardarrows point to the area 1/2 hand representation. Dotted line indicates the approximate loca-tion of the lateral fissure. Scale bar, 1 mm.
10174 • J. Neurosci., November 2, 2005 • 25(44):10167–10179 Dancause et al. • Sprouting after Brain Injury

sified as “large” used injection volumes comparable with thoseused in other contemporary studies of cortical connectivity inNew World primates (Boyd et al., 2000). Most importantly, thelocation of the injection core in relation to the PMv hand repre-sentation was precisely identified. Locations and sizes of the in-jection cores are documented in Figure 1 and Table 1. Overall,1662 contained the smallest injection and was smaller than any ofthe injections performed in control cases. In three of four exper-imental cases and four of four control cases, the core was smallerthan, and fully located within, the defined PMv forelimb area,primarily within the hand area. In the case containing the largestinjection (367E), the dense core spread somewhat beyond thephysiologically defined area. However, this case displayed a pat-tern of connections that was similar to the other experimentalcases and thus was retained for additional analysis.
Quantitative comparison of BDA labeling in control versusexperimental animalsIn general, the cortical distribution of BDA-labeled terminals andcell bodies in experimental cases was similar to that reportedpreviously in naive, or control, squirrel monkeys (Fig. 2). In bothfrontal and parietal areas, intensely labeled cell bodies typicallywere distributed among labeled dendrites, axons, and terminalboutons, supporting the reciprocity of intracortical connections.
In each of the experimental cases, but none of the control
cases, a very large number of labeled ter-minals was observed in S1 (Fig. 3). Labeledcell bodies were also observed in S1 inthree of four experimental cases (all exceptcase 1662, the case with the smallest BDAinjection). On the basis of coregistrationof BDA labeling with myelin stains, thelabeled terminals and cell bodies were lo-cated immediately caudal to area 3b in re-gions corresponding to the area 1/2 handrepresentation. The unusual localizationof the terminals and cell bodies in area 1/2was reconfirmed in three cases in whichsomatosensory representations were de-termined using neurophysiological re-cording techniques in S1 (367E, 9406, and21B) (Figs. 4, 5).
Each of the regions with labeled termi-nals and/or cell bodies was examined forquantitative differences between experi-mental and control groups. To normalizedifferences in total labeling across cases, thenumbers of terminal voxels and cell bodieswere expressed as a percentage of total ter-minal voxels or cell bodies in each case, ex-clusive of labeling in PMv and M1 hand rep-resentations. No area outside of S1 showed astatistically significant difference betweengroups (Fig. 6). Details of the distribution ofS1 labeling are shown in Figure 7. In experi-mental cases, labeled terminals and cell bod-ies were many times greater in area 1/2 com-pared with control cases (terminals: meanexp
� 6.3 � 1.8%; meancont � 0.5 � 0.8%; t �6.53; p � 0.0006; cell bodies: meanexp �12.0 � 6.8%; meancont � 0.71 � 0.63%; t �4.49; p � 0.0042; unpaired two-tailed t tests;n � 4 per group).
Fiber orientation at the site of M1 lesionBecause histological sections were cut tangential to the corticalsurface, in every case, large, BDA-labeled fibers, presumed to beintracortical axons, continued for several hundreds of microme-ters, and sometimes a few millimeters, in the same section, allow-ing qualitative and quantitative examination of their orientationsand trajectories. In experimental cases, axonal orientations wereatypical at the rostral border of the M1 lesion, revealing abruptchanges in trajectory and altered orientation patterns comparedwith control animals (Fig. 8). In some instances, axons initiallycoursed toward the injured M1 cortex, altered course by �90°near the border of the injury (Fig. 8B), and then followed thelateral border of the injury, often for �1 mm. The majority ofthese axons assumed a caudolateral orientation, i.e., in the direc-tion of the somatosensory hand representations in parietal cor-tex. In control cases, axons with this particular caudal and lateralorientation were rarely seen (Fig. 8B). An example of a morecomplete reconstruction of fiber trajectories (9406) shows axonsthat appear to course along the border of the M1 lesion, turnmore ventral, and subsequently more caudomedial (Fig. 8C).
To quantify differences in fiber trajectories between experi-mental and control groups, polar histograms describing the ori-entation of axons at the rostral border of the lesion (Fig. 9) werecompared with those from a homotopic location in control cases.
Figure 6. Distribution of labeling in the ipsilateral hemisphere. A, Cell body distribution (excluding S1) in experimental groupcompared with control group. B, Distribution of terminal labeling (excluding S1) in experimental group compared with controlgroup. Proportions of extrinsic PMv inputs and outputs are shown.
Dancause et al. • Sprouting after Brain Injury J. Neurosci., November 2, 2005 • 25(44):10167–10179 • 10175

This analysis revealed a substantial change in orientation of PMvaxons (Fig. 10). In control cases, the orientation of fibers wasrather unfocused, with a mean vector reflecting the position ofM1 relative to PMv (mean, 202° or caudomedial; n � 3). In theexperimental cases, this relatively diffuse orientation became muchmore focused with a mean vector that did not reflect the position ofM1 relative to PMv (mean, 173° or caudolateral; n � 4). A Watson–Williams F test confirmed that the fiber orientations were signifi-cantly different between groups (F � 15.65; p � 0.0001).
DiscussionThese results provide evidence for proliferation of novel, injury-induced corticocortical connections between PMv and area 1/2 ofS1 after an infarct in M1. These morphological alterations areaccompanied by functional recovery and expansion of the PMvhand representation (Frost et al., 2003). Furthermore, we provideevidence for altered trajectories of axons originating in PMv.Thus, we hypothesize that, when a principal cortical target ofPMv axons is destroyed, intracortical axons seek new targets insurviving, intact tissue.
Although the alteration in terminal labeling is clear, the valid-ity of increased cell body labeling in S1 might be questioned.Because BDA (10,000 MW) is a reliable anterograde but less re-liable retrograde tracing agent, the intensity of labeled cells variedconsiderably across animals. Nevertheless, the close correspon-dence of the location of labeled terminals and cell bodies pro-vided assurance of the validity of the results. Comparisons withcontrol animals showed significant increases in the number ofcell bodies labeled after M1 infarct, paralleling the results de-scribed for terminal boutons.
The drastic change in labeled terminals and cell bodies wefound in area 1/2 of S1 cannot easily be attributed to differencesin injection size, injection location, efficacy of absorption ortransport of the label, size of the animal, or histological process-ing differences. The reproducibility of the novel connections inall experimental animals, the similarity in the pattern of connec-tions at all other ipsilateral locations in both experimental andcontrol animals, and the similarity to the projection pattern re-ported in other tract-tracing studies (Barbas and Pandya, 1987;Ghosh and Gattera, 1995) are strong arguments against the pos-sibility that these differences merely reflect normal intersubjectvariability.
Implications of novel connections with S1 in recovery afterM1 injuryThe present data implicate a potential role of S1 in the recoveryfrom an infarct in M1. The M1 hand area is known to receiveprojections from parietal cortex, primarily from areas 1, 2, 5, and7 (Stepniewska et al., 1993). Not surprisingly, somatosensory im-pairments after damage to M1 in nonhuman primates have beenreported, and sensory recovery seems to parallel motor recovery(Friel et al., 2005). Furthermore, field potential recordings fromS1 have revealed an enhancement of its premovement activityafter temporary local cooling of M1 during repeated execution ofvisually initiated hand movements (Sasaki and Gemba, 1984).Finally, results from functional magnetic resonance imagingstudies have suggested a role for S1 in motor recovery from stroke(Pineiro et al., 2001; Jang et al., 2002). In the case of a large infarctof the M1 hand area, because corticocortical targets for neuronsin both the premotor and somatosensory cortex are damaged, it isreasonable to expect that neurons in both locations would un-dergo adaptive changes.
These are not the first results of widespread reorganizationinvolving S1. Pons et al. (1991) found that, 12 years after experi-mental injury to peripheral nerves innervating the upper extrem-ity in macaque monkeys, the face representation in areas 3b and 1had expanded over a distance of 10 –14 mm. Because the ar-borization of thalamocortical fibers in area 3b is �1–2 mm (Gar-raghty et al., 1989), unmasking of inputs from divergingthalamocortical axons may explain the limited topographicchanges that occur within the first several minutes after deaffer-entation (Cusick, 1996; Barbay et al., 2002) but not the morewidespread changes in long-standing peripheral injuries. Growthof primary afferents into deafferented regions at the level of thespinal cord and brainstem might account for additional but notall expansion (Pons et al., 1991; Florence et al., 1998). However,after long-term deafferentation, Florence et al. (1998) found that,although thalamocortical connectivity remained relatively un-changed, corticocortical connections in areas 3b and 1 extended4 –5 mm beyond that seen in control animals. It would appearthat, at least in long-standing peripheral nerve injuries, anatom-ical reorganization occurs at multiple levels of the neuraxis. Thepresent results provide strong evidence that widespread cortico-cortical sprouting is a significant phenomenon accompanyingfunctional reorganization after cortical injury as well.
Stability of corticocortical connections of PMv with othermotor areas after M1 injuryThe absence of significant changes in connectivity of PMv withvarious other cortical areas, especially other motor areas such asSMA, PMd, cingulated motor area, and the surviving M1 tissueadjacent to the infarct, is also of considerable interest. Each ofthese areas has corticospinal projections at least to lower cervical
Figure 7. Distribution of labeled cell bodies and terminals in S1. Distribution of labeled cellbodies and (voxels with labeled) terminals in areas 3a, 3b, and 1/2 of control and experimentalcases. Proportions of extrinsic PMv inputs and outputs are shown. *p � 0.05, statisticallysignificant differences.
10176 • J. Neurosci., November 2, 2005 • 25(44):10167–10179 Dancause et al. • Sprouting after Brain Injury

levels (Martino and Strick, 1987; Dum and Strick, 1991; He et al.,1993; Galea and Darian-Smith, 1994), and electrical stimulationof each of these areas results in movement of musculature of theupper extremity. In particular, contrary to our original hypothe-sis, there was no difference between experimental and controlgroups in the proportion of terminals or cell bodies in the prox-imal representations adjacent to the injury in M1. Previous stud-ies in rodent models have demonstrated synaptogenesis in theperi-infarct tissue (Stroemer et al., 1995).
Because PMv shares prominent cortical connections with M1and because PMv is known to exert powerful facilitation of M1output (Shimazu et al., 2004), it is possible that this phenomenonmight be unique to PMv. However, the validity of negative resultsin other areas must be considered in light of limitations in thequantitative methods used here. The difference in labeling be-tween experimental and control groups in area 1/2 was so largethat statistical analysis was somewhat superfluous. Few, if any,connections existed in uninjured animals. However, more subtledifferences may require more sensitive approaches to uncover.Quantitative changes may have occurred in areas of particularlydense termination but were undetected because of the samplingmethod (voxel counts). A more accurate estimate of terminalsmight be obtained using unbiased stereological approaches and
an alternative scheme for sampling sec-tions than that used here. In addition, be-cause cell body labeling is not optimal us-ing BDA (10,000 MW), it is possible thatthese numbers are not reliable enough todemonstrate statistical differences.
Alteration of axonal trajectory at thelesion borderOur data reveal significant alterations inthe orientation of PMv axons at the rostralborder of the infarct. Physiological (Nudoet al., 1996) and anatomical (Carmichaelet al., 2001) reorganization of the cortexsurrounding a cortical lesion has beendocumented previously. More recently, ithas been shown that stroke induces se-quential waves of neuronal growth-promoting genes (Carmichael et al., 2005)that could support anatomical reorganiza-tion. Our results suggest that this favor-able environment can also be exploited bydistant areas. Considering that any corti-cal and/or subcortical areas sharing con-nections with the site of a neuronal injurymight undergo similar reorganization,these results reveal an unanticipated ex-traordinary anatomical rewiring capacityin the adult CNS after injury.
The precise location in which PMv ax-ons branch to form novel S1 connectionscan only be inferred indirectly from thepresent set of data. Based on changes inaxonal trajectories documented here, itseems logical to suggest that axons origi-nating in PMv that normally terminate inthe destroyed M1 hand area sprout newprocesses near the borders of the infarct.This would potentially implicate axonalsprouting over distances of 6 –12 mm,
from frontal to parietal cortex, a distance that is substantiallylonger than observed in any other studies of intracortical axonalsprouting in adult cortex (Darian-Smith and Gilbert, 1994; Flo-rence et al., 1998). This is an especially long distance when con-sidered in proportion to the relatively small size of the squirrelmonkey brain (squirrel monkey, brain weight, 20 g; body weight,750 g) (Emmersand and Akert, 1963) compared with macaquebrains in previous studies (e.g., rhesus macaque, brain weight,54 g; body weight, 3300 g) (Nudo and Masterton, 1990).
However, we cannot rule out that novel terminals may origi-nate from a different subset of corticocortical fibers. For example,it is possible that the existing intracortical pathway from PMv tothe posterior operculum/inferior parietal area may provide asource of new terminals in S1, although no evidence for branch-ing from these fibers was found. Alternatively, and perhaps leastlikely because of the distances involved, new axonal processesmay originate in close proximity to the PMv cell bodies. Finally,the few preexisting terminals that normally exist in S1 may sproutto form multiple terminals locally. This process would only in-volve local increases in synaptic proliferation and axonal sprout-ing limited to very short distances. In light of our results, none ofthese possibilities can be ruled out, and this specific aspect of therewiring process should await subsequent studies.
Figure 8. Abrupt changes in fiber trajectory at the site of lesion. In each of the four experimental cases, abrupt changes in fibertrajectory were observed at the rostral border of the lesion in M1. A, Diagram indicating the locations of the photomicrographs andreconstructions. B, Photomicrographs of BDA-labeled fibers at the rostral border of the M1 lesion in experimental cases 1662 (top)and 9406 (middle) showing fibers that abruptly changed trajectory by 90° or more (black arrowheads). A photomicrograph takenat a corresponding location in a control case 9409 (bottom) is shown for comparison. Note that the large-diameter fibers coursingover long distances are less abundant in the control case and most of the labeling consisted of small terminal arbors. Also note thatthe orientation of fibers is more variable. Scale bar, 500 �m. C, Reconstruction of small BDA-labeled fibers in experimental case(9406; 1 section). Fibers appear to loop around area 3b to terminate in area 1/2 of S1. Scale bar, 1 mm. CS, Central sulcus.
Dancause et al. • Sprouting after Brain Injury J. Neurosci., November 2, 2005 • 25(44):10167–10179 • 10177
Although any hypothesis regarding thecausative role of these phenomena infunctional recovery is preliminary, thisnovel finding of significant increase ofPMv connections with area 1/2 of S1should be considered as a potential com-pensatory mechanism through which theCNS accomplishes functional recovery af-ter a central injury. The support for majorneuroanatomical plasticity associatedwith recovery from a cerebral vascular in-farct enlarges the spectrum of knownmechanisms of reorganization after astroke. Understanding of the phenomenaimplicated in the reorganization of theCNS after a central lesion are essential todevelopment of post-stroke interventionsthat seek to maximize functional recovery.
ReferencesBarbas H, Pandya DN (1987) Architecture and
frontal cortical connections of the premotorcortex (area 6) in the rhesus monkey. J CompNeurol 256:211–228.
Barbay S, Peden EK, Falchook G, Nudo RJ (1999)Sensitivity of neurons in somatosensory cortex(S1) to cutaneous stimulation of the hindlimbimmediately following a sciatic nerve crush.Somatosens Mot Res 16:103–114.
Barbay S, Peden EK, Falchook G, Nudo RJ (2002)An index of topographic normality in ratsomatosensory cortex: application to a sciaticnerve crush model. J Neurophysiol 88:1339–1351.
Batschelet E (1981) Circular statistics in biology.London: Academic.
Boyd JD, Mavity-Hudson JA, Casagrande VA(2000) The connections of layer 4 subdivi-sions in the primary visual cortex (V1) of theowl monkey. Cereb Cortex 10:644 – 662.
Bucy PC (1944) The precentral motor cortex.Urbana, IL: Bucy.
Carmichael ST, Wei L, Rovainen CM, Woolsey TA(2001) New patterns of intracortical projec-tions after focal cortical stroke. Neurobiol Dis8:910 –922.
Carmichael ST, Archibeque I, Luke L, Nolan T,Momiy J, Li S (2005) Growth-associatedgene expression after stroke: evidence for agrowth-promoting region in peri-infarct cor-tex. Exp Neurol 193:291–311.
Chollet F, DiPiero V, Wise RJ, Brooks DJ, DolanRJ, Frackowiak RS (1991) The functionalanatomy of motor recovery after stroke in hu-mans: a study with positron emission tomog-raphy. Ann Neurol 29:63–71.
Cusick CG (1996) Extensive cortical reorganiza-tion following sciatic nerve injury in adult ratsversus restricted reorganization after neonatalinjury: implications for spatial and temporallimits on somatosensory plasticity. Prog BrainRes 108:379 –390.
Dancause N, Barbay S, Frost SB, Plautz EJ, StoweAM, Friel KM, Nudo RJ (2005) Ipsilateral con-nections of the ventral premotor cortex in a NewWorld primate. J Comp Neurol, in press.
Darian-Smith C, Gilbert CD (1994) Axonalsprouting accompanies functional reorganiza-tion in adult cat striate cortex. Nature368:737–740.
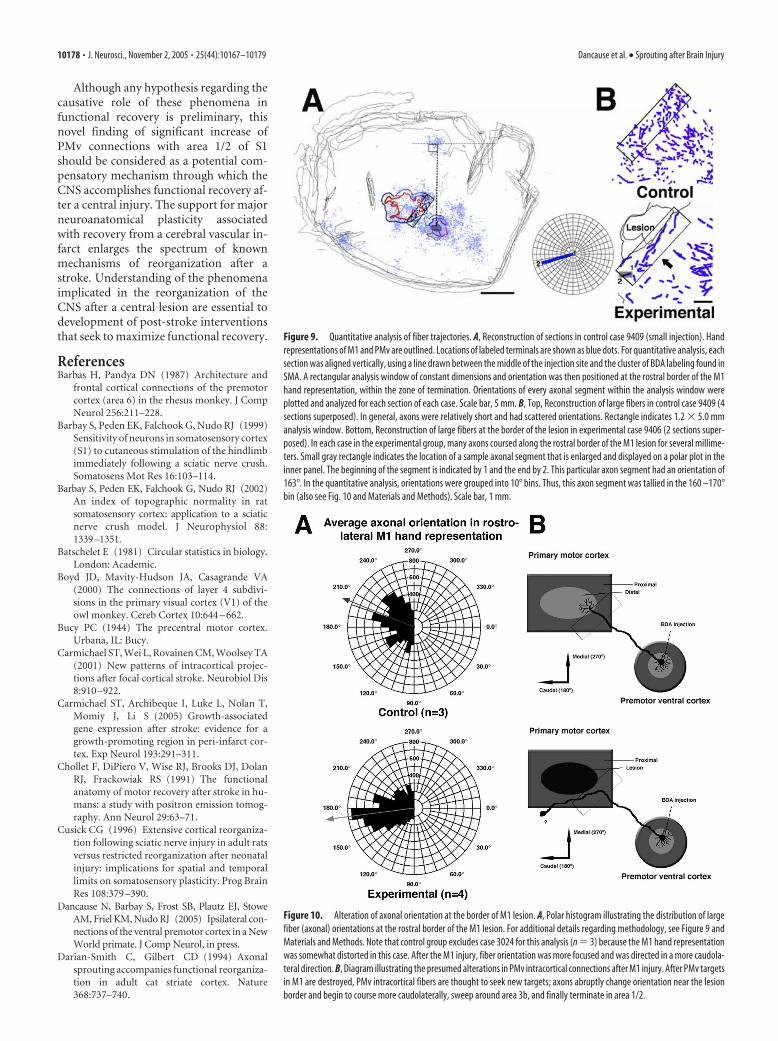
Figure 9. Quantitative analysis of fiber trajectories. A, Reconstruction of sections in control case 9409 (small injection). Handrepresentations of M1 and PMv are outlined. Locations of labeled terminals are shown as blue dots. For quantitative analysis, eachsection was aligned vertically, using a line drawn between the middle of the injection site and the cluster of BDA labeling found inSMA. A rectangular analysis window of constant dimensions and orientation was then positioned at the rostral border of the M1hand representation, within the zone of termination. Orientations of every axonal segment within the analysis window wereplotted and analyzed for each section of each case. Scale bar, 5 mm. B, Top, Reconstruction of large fibers in control case 9409 (4sections superposed). In general, axons were relatively short and had scattered orientations. Rectangle indicates 1.2 � 5.0 mmanalysis window. Bottom, Reconstruction of large fibers at the border of the lesion in experimental case 9406 (2 sections super-posed). In each case in the experimental group, many axons coursed along the rostral border of the M1 lesion for several millime-ters. Small gray rectangle indicates the location of a sample axonal segment that is enlarged and displayed on a polar plot in theinner panel. The beginning of the segment is indicated by 1 and the end by 2. This particular axon segment had an orientation of163°. In the quantitative analysis, orientations were grouped into 10° bins. Thus, this axon segment was tallied in the 160 –170°bin (also see Fig. 10 and Materials and Methods). Scale bar, 1 mm.
Figure 10. Alteration of axonal orientation at the border of M1 lesion. A, Polar histogram illustrating the distribution of largefiber (axonal) orientations at the rostral border of the M1 lesion. For additional details regarding methodology, see Figure 9 andMaterials and Methods. Note that control group excludes case 3024 for this analysis (n � 3) because the M1 hand representationwas somewhat distorted in this case. After the M1 injury, fiber orientation was more focused and was directed in a more caudola-teral direction. B, Diagram illustrating the presumed alterations in PMv intracortical connections after M1 injury. After PMv targetsin M1 are destroyed, PMv intracortical fibers are thought to seek new targets; axons abruptly change orientation near the lesionborder and begin to course more caudolaterally, sweep around area 3b, and finally terminate in area 1/2.
10178 • J. Neurosci., November 2, 2005 • 25(44):10167–10179 Dancause et al. • Sprouting after Brain Injury

Dolleman-Van der Weel MJ, Wouterlood FG, Witter MP (1994) Multipleanterograde tracing, combining Phaseolus vulgaris leucoagglutinin withrhodamine-andbiotin-conjugateddextranamine. JNeurosciMethods51:9–21.
Donoghue JP, Leibovic S, Sanes JN (1992) Organization of the forelimb areain squirrel monkey motor cortex: representation of digit, wrist, and elbowmuscles. Exp Brain Res 89:1–19.
Dum RP, Strick PL (1991) The origin of corticospinal projections from thepremotor areas in the frontal lobe. J Neurosci 11:667– 689.
Dum RP, Strick PL (2005) Frontal lobe inputs to the digit representations ofthe motor areas on the lateral surface of the hemisphere. J Neurosci25:1375–1386.
Duncan PW, Lai SM (1997) Stroke recovery. Top Stroke Rehabil 4:51–58.Emmersand R, Akert K (1963) A stereotaxic atlas of the brain of the squirrel
monkey (Saimir Sciureus). Madison, WI: University of Wisconsin.Florence SL, Taub HB, Kaas JH (1998) Large-scale sprouting of cortical con-
nections after peripheral injury in adult macaque monkeys. Science282:1117–1121.
Friel KM, Barbay S, Frost SB, Plautz EJ, Hutchinson DM, Stowe AM, Dan-cause N, Zoubina EV, Quaney BM, Nudo RJ (2005) Dissociation of thesensorimotor deficits after rostral vs. caudal lesions in the primary motorcortex hand representation. J Neurophysiol 94:1312–1324.
Frost SB, Barbay S, Friel KM, Plautz EJ, Nudo RJ (2003) Reorganization ofremote cortical regions after ischemic brain injury: a potential substratefor stroke recovery. J Neurophysiol 89:3205–3214.
Galea MP, Darian-Smith I (1994) Multiple corticospinal neuron popula-tions in the macaque monkey are specified by their unique cortical ori-gins, spinal terminations, and connections. Cereb Cortex 4:166 –194.
Gallyas F (1979) Silver staining of myelin by means of physical develop-ment. Neurol Res 1:203–209.
Garraghty PE, Pons TP, Sur M, Kaas JH (1989) The arbors of axons termi-nating in middle cortical layers of somatosensory area 3b in owl monkeys.Somatosens Mot Res 6:401– 411.
Ghosh S, Gattera R (1995) A comparison of the ipsilateral cortical projec-tions to the dorsal and ventral subdivisions of the macaque premotorcortex. Somatosens Mot Res 12:359 –378.
Glees P (1961) Experimental neurology. Oxford: Clarendon.Gould III HJ, Kaas JH (1981) The distribution of commissural terminations
in somatosensory areas I and II of the grey squirrel. J Comp Neurol196:489 –504.
Gould III HJ, Cusick CG, Pons TP, Kaas JH (1986) The relationship ofcorpus callosum connections to electrical stimulation maps of motor,supplementary motor, and the frontal eye fields in owl monkeys. J CompNeurol 247:297–325.
Guldin WO, Akbarian S, Grusser OJ (1992) Cortico-cortical connectionsand cytoarchitectonics of the primate vestibular cortex: a study in squirrelmonkeys (Saimiri sciureus). J Comp Neurol 326:375– 401.
He SQ, Dum RP, Strick PL (1993) Topographic organization of corticospi-nal projections from the frontal lobe: motor areas on the lateral surface ofthe hemisphere. J Neurosci 13:952–980.
Hoffman DS, Strick PL (1995) Effects of a primary motor cortex lesion onstep-tracking movements of the wrist. J Neurophysiol 73:891– 895.
Jain N, Catania KC, Kaas JH (1998) A histologically visible representation ofthe fingers and palm in primate area 3b and its immutability followinglong-term deafferentations. Cereb Cortex 8:227–236.
Jang SH, Han BS, Chang Y, Byun WM, Lee J, Ahn SH (2002) FunctionalMRI evidence for motor cortex reorganization adjacent to a lesion in aprimary motor cortex. Am J Phys Med Rehabil 81:844 – 847.
Kaas JH (1993) The functional organization of somatosensory cortex in pri-mates. Anat Anz 175:509 –518.
Krubitzer LA, Kaas JH (1990a) The organization and connections of so-matosensory cortex in marmosets. J Neurosci 10:952–974.
Krubitzer LA, Kaas JH (1990b) Cortical connections of MT in four speciesof primates: areal, modular, and retinotopic patterns. Vis Neurosci5:165–204.
Krubitzer LA, Kaas JH (1992) The somatosensory thalamus of monkeys:cortical connections and a redefinition of nuclei in marmosets. J CompNeurol 319:123–140.
Lee RG, van Donkelaar P (1995) Mechanisms underlying functional recov-ery following stroke. Can J Neurol Sci 22:257–263.
Liu Y, Rouiller EM (1999) Mechanisms of recovery of dexterity followingunilateral lesion of the sensorimotor cortex in adult monkeys. Exp BrainRes 128:149 –159.
Martino AM, Strick PL (1987) Corticospinal projections originate from thearcuate premotor area. Brain Res 404:307–312.
Miyai I, Suzuki T, Kang J, Kubota K, Volpe BT (1999) Middle cerebral arterystroke that includes the premotor cortex reduces mobility outcome.Stroke 30:1380 –1383.
Miyai I, Yagura H, Oda I, Konishi I, Eda H, Suzuki T, Kubota K (2002) Premo-tor cortex is involved in restoration of gait in stroke. Ann Neurol 52:188–194.
Muntner P, Garrett E, Klag MJ, Coresh J (2002) Trends in stroke prevalencebetween 1973 and 1991 in the US population 25 to 74 years of age. Stroke33:1209 –1213.
Napieralski JA, Butler AK, Chesselet MF (1996) Anatomical and functionalevidence for lesion-specific sprouting of corticostriatal input in the adultrat. J Comp Neurol 373:484 – 497.
Nudo RJ (1997) Remodeling of cortical motor representations after stroke:implications for recovery from brain damage. Mol Psychiatry 2:188 –191.
Nudo RJ (1999) Recovery after damage to motor cortical areas. Curr OpinNeurobiol 9:740 –747.
Nudo RJ, Masterton RB (1990) Descending pathways to the spinal cord. III.Sites of origin of the corticospinal tract. J Comp Neurol 296:559 –583.
Nudo RJ, Jenkins WM, Merzenich MM, Prejean T, Grenda R (1992) Neu-rophysiological correlates of hand preference in primary motor cortex ofadult squirrel monkeys. J Neurosci 12:2918 –2947.
Nudo RJ, Wise BM, SiFuentes F, Milliken GW (1996) Neural substrates forthe effects of rehabilitative training on motor recovery after ischemicinfarct. Science 272:1791–1794.
Nudo RJ, Larson D, Plautz EJ, Friel KM, Barbay S, Frost SB (2003) A squirrelmonkey model of poststroke motor recovery. ILAR J 44:161–174.
Olsen TS (1990) Arm and leg paresis as outcome predictors in stroke reha-bilitation. Stroke 21:247–251.
Passingham RE, Perry VH, Wilkinson F (1983) The long-term effects ofremoval of sensorimotor cortex in infant and adult rhesus monkeys. Brain106:675–705.
Pearson PP, Arnold PB, Oladehin A, Li CX, Waters RS (2001) Large-scalecortical reorganization following forelimb deafferentation in rat does notinvolve plasticity of intracortical connections. Exp Brain Res 138:8 –25.
Pineiro R, Pendlebury S, Johansen-Berg H, Matthews PM (2001) Func-tional MRI detects posterior shifts in primary sensorimotor cortex acti-vation after stroke: evidence of local adaptive reorganization? Stroke32:1134 –1139.
Pons TP, Garraghty PE, Ommaya AK, Kaas JH, Taub E, Mishkin M (1991)Massive cortical reorganization after sensory deafferentation in adult ma-caques. Science 252:1857–1860.
Preuss TM, Goldman-Rakic PS (1989) Connections of the ventral granularfrontal cortex of macaques with perisylvian premotor and somatosensoryareas: anatomical evidence for somatic representation in primate frontalassociation cortex. J Comp Neurol 282:293–316.
Qi HX, Kaas JH (2004) Myelin stains reveal an anatomical framework forthe representation of the digits in somatosensory area 3b of macaquemonkeys. J Comp Neurol 477:172–187.
Sasaki K, Gemba H (1984) Compensatory motor function of the somato-sensory cortex for the motor cortex temporarily impaired by cooling inthe monkey. Exp Brain Res 55:60 – 68.
Shimazu H, Maier MA, Cerri G, Kirkwood PA, Lemon RN (2004) Macaqueventral premotor cortex exerts powerful facilitation of motor cortex out-puts to upper limb motoneurons. J Neurosci 24:1200 –1211.
Snow PJ, Nudo RJ, Rivers W, Jenkins WM, Merzenich MM (1988) Soma-totopically inappropriate projections from thalamocortical neurons tothe SI cortex of the cat demonstrated by the use of intracortical micro-stimulation. Somatosens Res 5:349 –372.
Stepniewska I, Preuss TM, Kaas JH (1993) Architectonics, somatotopic or-ganization, and ipsilateral cortical connections of the primary motor area(M1) of owl monkeys. J Comp Neurol 330:238 –271.
Strick PL, Preston JB (1982) Two representations of the hand in area 4 of aprimate. I. Motor output organization. J Neurophysiol 48:139 –149.
Stroemer RP, Kent TA, Hulsebosch CE (1995) Neocortical neural sprout-ing, synaptogenesis, and behavioral recovery after neocortical infarctionin rats. Stroke 26:2135–2144.
Witte OW, Stoll G (1997) Delayed and remote effects of focal cortical infarc-tions: secondary damage and reactive plasticity. Adv Neurol 73:207–227.
Xiao Y, Felleman DJ (2004) Projections from primary visual cortex to cyto-chrome oxidase thin stripes and interstripes of macaque visual area 2.Proc Natl Acad Sci USA 101:7147–7151.
Dancause et al. • Sprouting after Brain Injury J. Neurosci., November 2, 2005 • 25(44):10167–10179 • 10179