Development of WSIP Climate Scenarios for use in HEC5Q San_ClimateScenariosForHEC5… · T E C H N...
30
TECHNICAL MEMORANDUM Development of WSIP Climate Scenarios for use in HEC5Q PREPARED BY: David Julian/CH2M and Robert Leaf/CH2M DATE: August 1, 2017 Introduction This technical memorandum describes the updates to HEC5Q that were necessary for performing temperature benefits analysis to support preparation of project applications to the California Water Commission (Commission) for the Water Storage Investment Program (WSIP). This technical memorandum documents the development of the Without Project climate scenarios for the HEC5Q model and is supplemental to the Surface Water Operations and Temperature Modeling Technical Memorandum (CH2M, 2017). Background HEC5Q Model Background and Limitations Over the last 15 years, the US Bureau of Reclamation (Reclamation) has developed applications of the US Army Corps of Engineers HEC5Q model for evaluation of water temperatures on the Sacramento River, American River, and Stanislaus Rivers. Reclamation made substantial revisions to these models for use in their NEPA EIS analysis of the Coordinate Long-Term Operations of the Central Valley Project and State Water Project (LTO EIS) (Reclamation, 2015). The HEC5Q model was designed to work with the model results of the CalSim-II model and was calibrated for historical meteorological conditions. For the LTO EIS analysis, procedures were established to incorporate operational assumptions related to selective withdrawal features at Shasta Lake (temperature control device) and Folsom Lake (temperature control shutters). HEC5Q is listed in Table 4-14 of the WSIP Technical Reference document as one of the applicable water quality models that can be used to quantify physical changes in water temperatures for quantification of benefits for a WSIP application (Commission, 2016b). The regulations for the WSIP require that the models used in the evaluation of the Project incorporate changes associated with the WSIP 2030 and 2070 climate scenarios (Commission, 2016a). This required establishing Without Project versions of the HEC5Q models that reflected the change in temperatures associated with the WSIP 2030 and 2070 climate scenarios. For the WSIP climate scenarios the LTO EIS HEC5Q models for the Sacramento River and American River were modified to adjust for increases in temperature associated with each climate condition. Further, the operational assumptions related to selective withdrawal features at Shasta Lake and Folsom Lake were adjusted to consider the effects of each climate condition
-
Upload
truongtruc -
Category
Documents
-
view
214 -
download
1
Transcript of Development of WSIP Climate Scenarios for use in HEC5Q San_ClimateScenariosForHEC5… · T E C H N...

T E C H N I C A L M E M O R A N D U M
Development of WSIP Climate Scenarios for use in HEC5Q
PREPARED BY: David Julian/CH2M and Robert Leaf/CH2M
DATE: August 1, 2017
Introduction
This technical memorandum describes the updates to HEC5Q that were necessary for performing temperature benefits analysis to support preparation of project applications to the California Water Commission (Commission) for the Water Storage Investment Program (WSIP). This technical memorandum documents the development of the Without Project climate scenarios for the HEC5Q model and is supplemental to the Surface Water Operations and Temperature Modeling Technical Memorandum (CH2M, 2017).
Background
HEC5Q Model Background and Limitations
Over the last 15 years, the US Bureau of Reclamation (Reclamation) has developed applications of the US Army Corps of Engineers HEC5Q model for evaluation of water temperatures on the Sacramento River, American River, and Stanislaus Rivers. Reclamation made substantial revisions to these models for use in their NEPA EIS analysis of the Coordinate Long-Term Operations of the Central Valley Project and State Water Project (LTO EIS) (Reclamation, 2015). The HEC5Q model was designed to work with the model results of the CalSim-II model and was calibrated for historical meteorological conditions. For the LTO EIS analysis, procedures were established to incorporate operational assumptions related to selective withdrawal features at Shasta Lake (temperature control device) and Folsom Lake (temperature control shutters).
HEC5Q is listed in Table 4-14 of the WSIP Technical Reference document as one of the applicable water quality models that can be used to quantify physical changes in water temperatures for quantification of benefits for a WSIP application (Commission, 2016b). The regulations for the WSIP require that the models used in the evaluation of the Project incorporate changes associated with the WSIP 2030 and 2070 climate scenarios (Commission, 2016a). This required establishing Without Project versions of the HEC5Q models that reflected the change in temperatures associated with the WSIP 2030 and 2070 climate scenarios.
For the WSIP climate scenarios the LTO EIS HEC5Q models for the Sacramento River and American River were modified to adjust for increases in temperature associated with each climate condition. Further, the operational assumptions related to selective withdrawal features at Shasta Lake and Folsom Lake were adjusted to consider the effects of each climate condition

on the management of reservoir release temperatures and the extent to which water temperature objectives could be achieved within the critical reaches downstream of these reservoirs.
The HEC5Q models calculate the change over time in water temperatures in reservoirs and rivers based on estimates of equilibrium water temperature and the rate at which heat exchange in the water will change as it approaches equilibrium. These estimates are based on meteorological and environmental information associate with the geographic location being studied. Based on temperature information included in the WSIP statewide gridded monthly data products (Commission, 2016c) model inputs for equilibrium temperatures were adjusted for the WSIP climate scenarios.
In applying the HEC5Q models, water temperature objectives downstream of Shasta Lake and Folsom Lake are required for the model to select what elevation to withdrawal releases from. The temperature of water varies with depth in a reservoir depending on the degree to which the profile is stratified (due to temperature and density variation). Warmer water is less dense than cooler water and will move to the top of the reservoir. Much of the warming of a reservoir over the spring and early summer months comes from solar radiation through the surface of the lake. To meet temperature objectives downstream of the reservoir, water is selectively withdrawn at an elevation that provides water cool enough to meet the downstream objective. Both the Shasta Lake and Folsom Lake schedules are varied each year of simulation based on reservoir storage and inflow conditions and expected changes in water temperature that occur between the reservoirs and the objective locations in the rivers. Based on reiterative analysis, schedules of temperature objectives are modified to reflect the effects of the WSIP climate conditions.
The HEC5Q model provides a projection of how the water temperature trends with changes in storage and flows in the water resources system. The model does not provide a prediction of what future water temperatures will be. This model is intended for use in comparative analysis and demonstration of potential effects in the setting of hydrologic information considering historical variability and the effects of climate change. It should be recognized that the HEC5Q model is a simplified and generalized representation of complex hydrodynamic and thermodynamic processes in the riverine environment. While the HEC5Q model can provide 6-hour to daily timestep information at any location within the model domain, evaluation of the model results should consider the limitations of the information used to calibrate the model and the inputs to the model for the specific conditions being evaluated. Because the CalSim-II model results used are subject to specific location and monthly timestep limitations, care must be used in drawing any conclusion from the HEC5Q model results that is finer in spatial and temporal resolution than the CalSim-II model used. Nevertheless, HEC5Q is the best available tool for this evaluation of system effects related to the Project.
Approach
Modifications of the HEC5Q models
Updates were made to the Trinity-Sacramento and American River Reclamation HEC5Q models used for the Coordinated Long-Term Operations of the Central Valley Project and State Water Project Environmental Impact Study (LTO EIS) to support temperature modeling for the

WSIP Application process. The following changes were made to better simulate water temperatures at Current Conditions, and in the 2030 and 2070 climate scenarios developed by the Commission for the WSIP Application process: 1) increasing the equilibrium temperatures based on the calculated increase in air temperature for the WSIP 2030 and 2070 climate scenarios, 2) adjusting the Shasta release temperature schedule assumptions in the Trinity-Sacramento HEC5Q model and 3) adjusting the Folsom release temperature schedule assumptions in the American River HEC5Q model.
Equilibrium Temperature Adjustment
Changes in climate can have a myriad of potential and unpredictable effects on water temperatures. However, several studies indicate that increasing air temperatures result in increased water temperatures, regardless of climate scenario (Webb and Walsh 2004, Cushing 1997, Isaak et al. 2012). Since air temperatures are predicted to increase under the WSIP 2030 and 2070 climate scenarios, an increase in water temperature is assumed.
With the limited data provided, equilibrium temperatures were increased based on the increased air temperature in the WSIP 2030 and 2070 climate scenarios. This approach was supported with an analysis between observed air temperature data from the Gerber and Nicolaus CIMIS stations and the calculated equilibrium temperatures at those two stations. The equilibrium temperatures were developed as part of the Sacramento River Water Quality Extension effort conducted by Reclamation (Smith et al. 2013). The period of record of the observed air temperature data was 01Jan2001 to 31Dec2011. The observed air temperature was averaged by month and then plotted against the calculated current climate equilibrium temperature as shown in Figures 1 and 2. Two linear regressions were performed on the data, one regression for the fall and winter months (October-March) and one regression for the spring and summer months (April-September). Regressions at Gerber indicate a 1:1 ratio of air temperature to equilibrium temperature during fall and winter months and 1:0.8 ratio of air temperature to equilibrium temperature in spring and summer months. Regressions at Nicolaus indicate a 1:1 ratio, year-round. The calculation of the climate adjusted equilibrium temperature, based on these regressions, is described in the next section.

Figure 1: Gerber CIMIS Station Monthly Average Observed Air Temperature vs. Monthly Average Calculated Equilibrium Temperature
Figure 2: Nicolaus CIMIS Station Monthly Average Observed Air Temperature vs. Monthly Average Calculated Equilibrium Temperature

After performing the regressions to determine the seasonal adjustment factor, the following process was used to calculate the climate scenario adjusted equilibrium temperatures. The WSIP climate scenario data was obtained from the Commission website (Commission, 2016d). The data comes in files that correspond to grid cells with different latitude and longitudes. In order to perform the equilibrium temperature adjustments, the latitude and longitude coordinates of the Gerber and Nicolaus California Irrigation Management Information System (CIMIS) stations the meteorology data is based from were obtained and then matched with the closest WSIP climate scenario grid cell (Table 1). The climate scenario data that corresponded to that grid cell was then retrieved for the two CIMIS stations.
Table 1: CIMIS Station Latitude and Longitude coordinates and the corresponding WSIP grid cell coordinates
Station CIMIS WSIP Latitude Longitude Latitude Longitude
Gerber 40.05 122.16 40.03125 122.15625
Nicolaus 38.87 121.55 38.84375 121.53125
After retrieving the data, the maximum and minimum monthly air temperatures (Tmax & Tmin) in the WSIP climate scenario data were converted to Fahrenheit from Celsius to match the units of the HEC5Q model. For each WSIP climate scenario, the average monthly air temperature (Tavg) was calculated by averaging the maximum and minimum monthly air temperatures (Tmax + Tmin)/2. Then, the monthly average temperature shifts from Current Climate to WSIP 2030 and 2070 were calculated by subtracting the WSIP Current Climate Tavg from the 2030 Tavg and the 2070 Tavg, respectively. Gerber temperature shifts for April to September were multiplied by 0.8 to reflect the equilibrium temperature ratio described earlier. This difference was added to the existing HEC5Q Current Climate Equilibrium Temperature time series (described earlier) to calculate the climate adjusted equilibrium temperature for 2030 and 2070. Figures A1 to A6 in Appendix A show the 2030 and 2070 temperature shifts for each of the Gerber and Nicolaus CIMIS stations.
It should be noted that the WSIP Current Climate and the LTO EIS HEC5Q Current Climate are based on different climate analyses that do not reflect the same set of assumptions. However, for the WSIP climate updates, it was assumed that both represent the same current climate. In addition, the California Department of Water Resources 2015 Delivery Capability Report (DCR 2015) CalSim II model was used to analyze the benefits of Sites reservoir under current climate conditions. The WaterFix HEC5Q Current Climate inputs are used for DCR 2015. See Figure 3 for a schematic of the climate adjustment process and climate scenarios used. With project and without project refer to without or with Sites Reservoir.

Figure 3: Climate scenarios and climate update process used to update equilibrium temperature for the Sites Reservoir WSIP Application.
Shasta Release Temperature Targeting Adjustments
The HEC5Q model simulates the Shasta Temperature Control Device (Shasta TCD) to manage temperature downstream at the following four temperature compliance locations: Clear Creek at Bonnyview Bridge, Balls Ferry, Jelly’s Ferry, and Bend Bridge. The Shasta TCD modeling code requires a temperature release target for Shasta to operate to. These temperature target schedules are developed as a series of annual temperature target schedules in a pre-processing spreadsheet tool for each temperature compliance location. The assumptions behind the temperature target spreadsheet tool are described in Appendix 6B.C of the LTO EIS (Reclamation 2015). For the Sites WSIP Application, two adjustments were made to the assumptions of the temperature target spreadsheet tool to demonstrate the Sacramento River temperature benefits of the changed operations at Shasta due to the operational flexibility provided by Sites Reservoir. These adjustments are described below.
California WaterFix
Current Climate
WSIP Current
Climate
2030 and 2070
Air Temperature Shift from
WSIP Current Climate
2030 and 2070
Equilibrium Adjustment
WSIP 2030 Without
and With Project
WSIP 2070 Without
and With Project
Equilibrium
Temperature
DCR 2015 Without
and With Project
WSIP 2030
Future Climate
Air
Temperature
WSIP 2070
Future Climate

Storage Tier Adjustments
In the HEC5Q model that was used for the LTO EIS, the model sets a monthly outflow temperature target schedule for Shasta operations, based on the End-of-April storage in Shasta each year. Different End-of-April storage levels in Shasta indicate the compliance location to which Shasta will operate to. The LTO EIS HEC5Q model uses storage levels based on Reclamation’s current operations (Appendix 6B.C of the LTO EIS). Two adjustments were made to this approach.
First, for the Sites WSIP Application, the maximum of April and May end-of-month storage was used to specify that year’s compliance location. This adjustment was made because End-of-May is greater than End-of-April storage in some years. Allowing flexibility between End-of-April and End-of-May storage gives a more complete picture of how much cold water pool is available for the temperature management season than if just End-of-April storage was used as the indicator of available cold water pool.
Second, the storage tiers were adjusted due to the change in inflows and air temperatures in the WSIP 2030 and 2070 climate scenarios. The changes in climate variables requires a greater volume of water to meet temperature compliance at the targeted compliance location (e.g. it will take more storage volume to meet temperature compliance at Balls Ferry throughout the year).
An iterative approach was used to adjust the storage levels for both the WSIP 2030 and 2070 climate scenarios. An initial HEC5Q run was completed that utilizes the Maximum End-of-April or May Shasta Storage levels (see Table 2). After the run was completed, temperature outputs for the four compliance locations were loaded into the spreadsheet along with Shasta storage data from CalSim II. The average of July and August temperature for each year of the 81 year period of record was calculated for each compliance location. The average between July and August was used because it represents the two months with the highest expected temperatures. The furthest downstream location that had a July-August temperature below 56 degrees was the compliance location that was met for that year. For example, if the July-August temperature is 54.5, 55, 55.8, and 56.2 for Bonnyview, Balls Ferry, Jellys Ferry, and Bend Bridge respectively, then the compliance location that was met was Jellys Ferry, since it is the most downstream location that is below 56 degrees. The compliance location based on the Maximum End-of-April or May Shasta storage was also calculated. The number of years where the compliance location was different between the July-August average temperature and the Maximum End-of-April or May Shasta storage was tabulated. The Maximum End-of-April or May Shasta storage levels were then adjusted until the smallest difference was achieved.
The Shasta temperature target schedules were then recomputed for each year and the HEC5Q model was then rerun. The new temperature results at the compliance locations were loaded into the spreadsheet and the same process of changing the Maximum End-of-April or May Shasta storage levels was performed. The final Maximum End-of-April or May Shasta storage levels were settled upon after the third iteration for the WSIP 2030 and WSIP 2070 climate scenarios, as shown in Table 2 below. The values in the table show the maximum storage necessary for each compliance location.

Table 2: Adjusted End-of-April Shasta Storage Levels
Compliance Location
Maximum End-of-April or May Shasta Storage
Current Conditions 2030 2070
Bend Bridge 9999 9999 9999
Jelly’s Ferry 4425 4500 4500
Balls Ferry 4000 4300 4400
Below Clear Creek 3600 3600 4000
None 2000 2000 2000
Temperature Target Adjustments
A temperature schedule was developed for each temperature compliance location. These temperature schedules are Shasta release temperatures that are calculated based on the amount of warming that will occur between Shasta and the four compliance locations. The amount of warming that occurs was calculated using an exceedance based approach, which is also described in Appendix 6B.C of the LTO EIS. The exceedance percentages for the LTO EIS were determined to meet compliance percentages at the different compliance locations that are specified in the 2009 NMFS BO, but did not make full use of the cold water pool in Shasta. With the change in operations to Shasta with Sites Reservoir in place, these exceedance percentages were adjusted in order to demonstrate the potential amount of temperature benefit Sites Reservoir can provide. The June to October exceedance percentages were lowered, which calculates a higher warming that occurs between Shasta and the compliance locations for which Shasta has to adjust to by lowering its release temperature target. Lowering the release temperature targets means Shasta uses more of the cold water pool that is available. The exceedance percentages were adjusted to save cold water in the cold water pool for August and September. See Table 3 for the June to September LTO EIS exceedance percentages used for the without project scenarios and the adjusted exceedance percentages used to characterize warming in the river for the with project scenarios in the Sites WSIP Application.
Table 3: June to October exceedance percentages used to characterize warming between Shasta and the temperature compliance locations on the Sacramento River
Compliance Location
Exceedance Percentages June July August September
W/O Sites W Sites W/O Sites W Sites W/O Sites W Sites W/O Sites W Sites
Clear Creek 75% 5% 50% 5% 15% 5% 5% 5%
Balls Ferry 75% 10% 50% 10% 15% 5% 5% 5%
Jellys Ferry 75% 15% 50% 15% 15% 5% 5% 5%
Bend Bridge 75% 25% 50% 25% 15% 5% 5% 5%
After setting the exceedance percentages, the HEC5Q model was run three times in order to settle in on the Shasta release temperatures based on these new exceedances. This process was done for the three climate scenarios. See Attachment B for the final Shasta Release temperature schedules for the three climate scenarios.
Folsom Release Temperature Targeting Adjustments
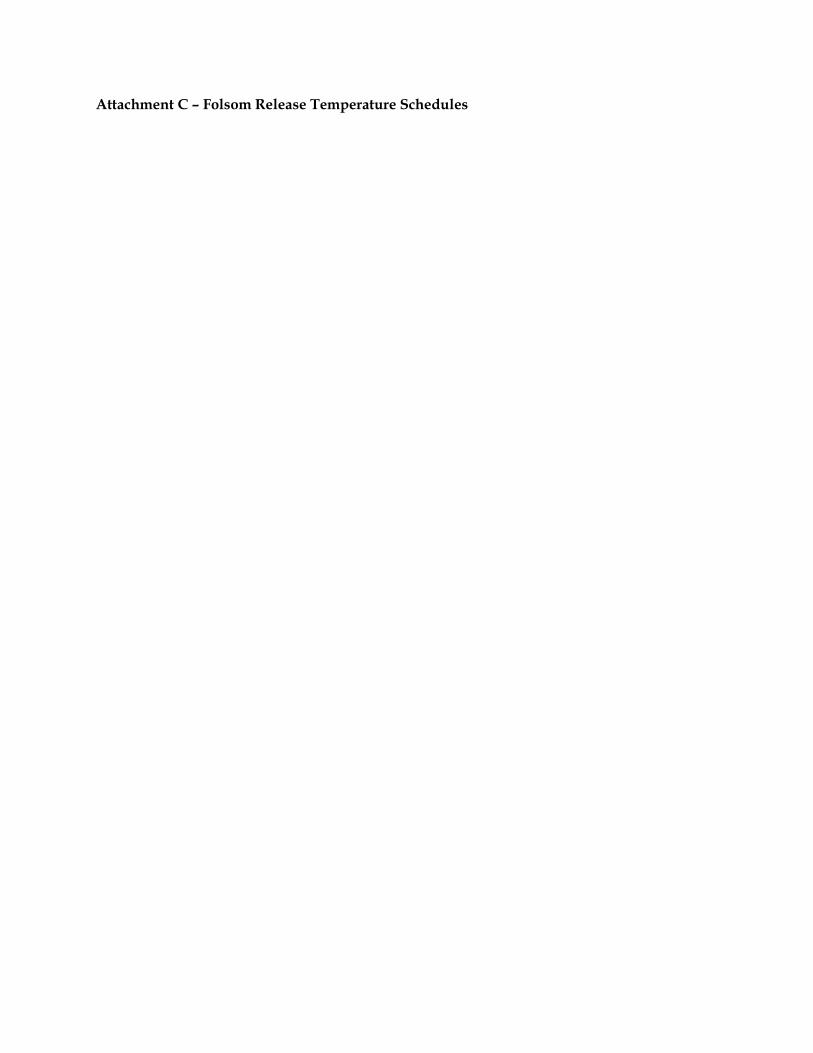
Similar to Shasta, Folsom operates using a temperature control device (Folsom TCD) to manage temperatures downstream. Folsom is only required to meet temperature compliance at one location, Watt Avenue. A schedule of Folsom release targets are used to simulate the Folsom TCD. The schedule of release targets for any given year are based on Folsom’s End-of-May storage plus predicted June-September inflow, with different storage plus inflow tiers corresponding to different release temperature schedules. With changing hydrology and increased equilibrium temperatures under the WSIP 2030 and 2070 climate scenarios, these storage plus inflow tiers will change, with more storage plus inflow required to achieve the same temperature target schedules as the current climate. The temperature schedules are created in a pre-processing spreadsheet tool. The assumptions and process for developing the Folsom release targets are described in Appendix 6B.C.12 of the LTO EIS (Reclamation 2015). This spreadsheet tool was updated for the 2030 and 2070 climate scenarios, for both without and with project, using the same processes described in Appendix 6B.C.12. The final temperature target schedules are shown in Attachment C.
Results
After making the necessary adjustments to the climate updates described above, the Without-Project CalSimII models for each of the three climate scenarios provided by the Commission were run through the updated Trinity-Sacramento and American River HEC5Q models to quantify the river temperatures on the Sacramento and American Rivers under the Without Project condition. This established the river temperature baselines for the three climate scenarios that river temperature benefits of the With-Project conditions would be quantified from. Attachment D shows river temperature results on the Sacramento River at Jellys Ferry and Attachment E shows river temperature results on the American River at Watt Avenue. The results for both the Sacramento River and American River show that river temperatures increase between the Current Conditions climate, the WSIP 2030 climate scenario, and the WSIP 2070 climate scenario. There are two major factors for this change, the shift in equilibrium temperature based on the increased air temperature and the change in operations based on the change in hydrologic conditions between the climate scenarios.
References
California Water Commission (Commission). 2016a. Regulation filed with Office of
Administrative Law, Water Storage Investment Program. California Water Commission. Sacramento CA. November, 2016.
(https://cwc.ca.gov/Documents/2017/WSIP/2017-0123-03S_App.pdf)
______________. 2016b. Technical Reference, Water Storage Investment Program. California
Water Commission. Sacramento CA. November, 2016.
(https://cwc.ca.gov/Documents/2017/WSIP/TechnicalReference.pdf)

______________. 2016c. Application Resources (data and model products), Water Storage
Investment Program. California Water Commission. Sacramento CA. November, 2016. (https://cwc.ca.gov/Pages/ApplicationResources.aspx)
______________. 2016d. Water Storage Investment Program Climate Change and Sea Level Rise Data and Model Products Update. California Water Commission.
(https://cwc.ca.gov/Documents/2017/WSIP/WSIP_Data_and_Model_Product_De
scription_2-22-17.pdf)
CH2M. 2017. Surface Water Operations and Temperature Modeling Technical
Memorandum. Prepared for Sacramento Regional County Sanitation District. August 2017.
Cushing, C. 1997. Freshwater Ecosystems and Climate Change in North America. A Regional Assessment. Advances in Hydrological Processes.
Edinger, J., Brady, D., Geyer, J. 1974. Heat Exchange and Transport in the Environment. Electric Power Research Institute.
Isaak, D. Wollrab, S., Horan, D., Chandler, G. 2012. Climate Change Effects on Stream and River Temperatures Across the Northwest US from 1980-2009 and Implications for
Salmonid Fishes. Climatic Change.
National Marine Fisheries Service (NMFS). 2009. Biological Opinion and Conference
Opinion on the Long-Term Operations of the Central Valley Project and State Water
Project. June 4. Southwest Region. Long Beach, CA.
United States Bureau of Reclamation (Reclamation). 1990. U.S. Bureau of Reclamation
Monthly Temperature Model Sacramento River Basin. United States Bureau of Reclamation.
______________. 2015a. Final Environmental Impact State for the Coordinated Long-Term Operations of the Central Valley Project and State Water Project (LTO EIS). United
States Bureau of Reclamation. Mid-Pacific Region. Sacramento, California.
November, 2015. (http://www.usbr.gov/mp/BayDeltaOffice/coordinated-long-term.html)
______________. 2015b. Final Environmental Impact State for the Coordinated Long-Term Operations of the Central Valley Project and State Water Project (LTO EIS):
Appendix 6B.C. United States Bureau of Reclamation. Mid-Pacific Region.
Sacramento, California. November, 2015.
University of Washington. 2017. Washington State Water Temperature Projections.
(https://cig.uw.edu/datasets/washington-state-water-temperature-projections)

Webb, B., Walsh, A. 2004. Changing UK River Temperatures and Their Impact on Fish
Populations. Hydrology: Science & Practice for the 21st Century. Volume II. British Hydrological Society.

Attachment A – Equilibrium Temperature Shifts

This attachment shows the results of the equilibrium temperature shifts for the Gerber, and Nicolaus CIMIS stations described in the Equilibrium Temperature Adjustment section.
Figure A1: Gerber CIMIS station equilibrium temperature shifts for 2030 and 2070 climate scenarios.
Figure A2: Nicolaus CIMIS station equilibrium temperature shifts for 2030 and 2070 climate scenarios.

Attachment B – Shasta Release Temperature Schedules

This attachment shows the final Shasta release temperature schedules that were developed for the Sacramento River HEC5Q model for Current Conditions, WSIP 2030, and WSIP 2070 climate scenarios.
Table B1: Shasta Release Temperature Schedules for Current Conditions.
Location
Max EO-
Apr or May
Storage
Temperature (F) Schedules for Shasta Dam Release This table is for temperature target with Percent Exceedances
Jan Feb Mar Apr May Jun Jul Aug Sep Oct Nov Dec
0 60.8 60.8 60.8 53.6 53.6 52.0 51.6 51.2 49.9 55.0 56.2 56.4
None 2000 60.8 60.8 60.8 53.6 53.6 52.0 51.6 51.2 49.9 55.0 56.2 56.4
Clear Creek
3600 60.8 60.8 60.8 53.6 53.6 52.0 51.6 51.2 49.9 55.0 56.2 56.4
Balls Ferry
4000 60.8 60.8 60.8 53.6 53.6 50.1 50.5 49.8 48.4 54.5 56.6 57.2
Jellys Ferry
4425 60.8 60.8 60.8 53.6 53.6 47.9 48.8 48.2 46.7 54.1 56.9 58.0
Bend Bridge
9999 60.8 60.8 60.8 53.6 53.6 47.5 47.9 47.0 45.5 53.7 57.2 58.5
Table B2: Shasta Release Temperature Schedules for WSIP 2030.
Location
Max EO-
Apr or May
Storage
Temperature (F) Schedules for Shasta Dam Release This table is for temperature target with Percent Exceedances
Jan Feb Mar Apr May Jun Jul Aug Sep Oct Nov Dec
0 60.8 60.8 60.8 53.6 53.6 52.5 52.6 51.6 50.9 54.8 56.2 56.2
None 2000 60.8 60.8 60.8 53.6 53.6 52.5 52.6 51.6 50.9 54.8 56.2 56.2
Clear Creek
3600 60.8 60.8 60.8 53.6 53.6 52.5 52.6 51.6 50.9 54.8 56.2 56.2
Balls Ferry
4300 60.8 60.8 60.8 53.6 53.6 50.2 50.9 49.6 48.9 54.1 56.7 57.5
Jellys Ferry
4500 60.8 60.8 60.8 53.6 53.6 48.4 49.3 48.0 47.2 53.5 57.1 58.4
Bend Bridge
9999 60.8 60.8 60.8 53.6 53.6 47.7 48.8 46.7 46.0 53.2 57.4 58.9

Table B3: Shasta Release Temperature Schedules for WSIP 2070.
Location
Max EO-
Apr or May
Storage
Temperature (F) Schedules for Shasta Dam Release This table is for temperature target with Percent Exceedances
Jan Feb Mar Apr May Jun Jul Aug Sep Oct Nov Dec
0 60.8 60.8 60.8 53.6 53.6 51.4 51.4 50.5 49.4 54.1 56.1 56.5
None 2000 60.8 60.8 60.8 53.6 53.6 51.4 51.4 50.5 49.4 54.1 56.1 56.5
Clear Creek
4000 60.8 60.8 60.8 53.6 53.6 51.4 51.4 50.5 49.4 54.1 56.1 56.5
Balls Ferry
4400 60.8 60.8 60.8 53.6 53.6 50.0 50.4 48.8 47.8 53.4 56.5 57.6
Jellys Ferry
4500 60.8 60.8 60.8 53.6 53.6 48.4 49.0 46.8 45.9 52.8 56.8 58.6
Bend Bridge
9999 60.8 60.8 60.8 53.6 53.6 47.7 48.3 45.5 44.4 52.4 57.2 59.2
Attachment C – Folsom Release Temperature Schedules

This attachment shows the final Folsom release temperature schedules that were developed for the American River HEC5Q model for both the without and with project scenarios for Current Conditions, WSIP 2030, and WSIP 2070 climate.
Table C1: Folsom Release Temperature Schedules for Current Conditions without project.
Storage plus
Inflow
Temperature (F) Schedule for Folsom Dam Release
Shift Factors
-4.000 degrees 0.700 0.800 0.800 1.200 0.600 0.400 0.200 0.000 Jan Feb Mar Apr May Jun Jul Aug Sep Oct Nov Dec
0 52.0 52.0 52.0 59.0 66.8 66.0 66.0 63.0 67.5 68.0 60.5 56.0 600 52.0 52.0 52.0 59.0 66.8 66.0 66.0 63.0 67.5 68.0 60.5 56.0 700 52.0 52.0 52.0 59.0 65.9 65.2 66.2 63.3 66.7 68.1 60.6 56.0 750 52.0 52.0 52.0 59.0 66.3 65.6 65.6 62.9 67.0 67.3 59.7 56.0 850 52.0 52.0 52.0 59.0 65.6 65.0 66.0 63.5 66.3 67.5 59.8 56.0 900 52.0 52.0 52.0 59.0 65.8 65.2 65.2 62.8 66.4 66.6 58.8 56.0 1000 52.0 52.0 52.0 59.0 65.0 64.4 65.4 63.1 65.6 66.7 58.9 56.0 1050 52.0 52.0 52.0 59.0 65.2 64.6 64.6 62.4 65.7 65.8 57.9 56.0 1150 52.0 52.0 52.0 59.0 64.3 63.8 64.8 62.7 64.9 65.9 58.0 56.0 1200 52.0 52.0 52.0 59.0 64.5 64.0 64.0 62.0 65.0 63.0 58.0 56.0 1300 52.0 52.0 52.0 59.0 63.7 63.2 64.2 62.3 64.2 63.1 58.1 56.0 1350 52.0 52.0 52.0 59.0 63.7 63.2 63.2 61.3 64.2 63.1 58.1 56.0 1450 52.0 52.0 52.0 59.0 62.9 62.4 63.4 61.6 63.3 63.2 58.1 56.0 1500 52.0 52.0 52.0 59.0 62.9 62.4 62.4 60.6 63.3 63.2 58.1 56.0 1600 52.0 52.0 52.0 59.0 61.9 61.4 62.4 60.6 62.3 63.2 58.1 56.0 1650 52.0 52.0 52.0 59.0 62.0 61.6 61.6 59.9 62.5 58.3 57.2 56.0 1750 52.0 52.0 52.0 59.0 61.0 60.6 61.6 59.9 61.5 58.3 57.2 56.0 1800 52.0 52.0 52.0 59.0 61.0 60.6 60.6 58.9 61.5 58.3 57.2 56.0 1900 52.0 52.0 52.0 59.0 60.0 59.6 60.6 58.9 60.5 58.3 57.2 56.0 1950 52.0 52.0 52.0 59.0 60.0 59.6 59.6 57.9 60.5 58.3 56.2 56.0 2050 52.0 52.0 52.0 59.0 59.0 58.6 59.6 57.9 59.5 57.3 56.2 56.0 2100 52.0 52.0 52.0 59.0 59.0 58.6 58.6 56.9 59.5 56.3 55.2 56.0 2200 52.0 52.0 52.0 59.0 58.0 57.6 58.6 56.9 58.5 55.3 55.2 56.0

Table C2: Folsom Release Temperature Schedules for WSIP 2030 without project.
Storage plus
Inflow
Temperature (F) Schedule for Folsom Dam Release
Shift Factors
-4.000 degrees 0.700 0.800 0.800 1.200 0.600 0.400 0.200 0.000 Jan Feb Mar Apr May Jun Jul Aug Sep Oct Nov Dec
0 52.0 52.0 52.0 59.0 66.0 64.5 66.0 63.0 68.3 68.8 60.5 56.0 750 52.0 52.0 52.0 59.0 66.0 64.5 66.0 63.0 68.3 68.8 60.5 56.0 850 52.0 52.0 52.0 59.0 65.6 64.3 66.6 63.9 67.6 69.0 60.7 56.0 900 52.0 52.0 52.0 59.0 66.0 64.8 66.0 63.5 67.9 68.1 59.8 56.0 1000 52.0 52.0 52.0 59.0 65.4 64.3 66.4 64.1 67.1 68.3 59.9 56.0 1050 52.0 52.0 52.0 59.0 65.8 64.8 65.8 63.7 67.4 67.4 59.0 56.0 1100 52.0 52.0 52.0 59.0 65.0 64.0 66.0 64.0 66.5 67.5 59.0 56.0 1200 52.0 52.0 52.0 59.0 65.2 64.3 65.2 63.3 66.6 66.6 58.1 56.0 1250 52.0 52.0 52.0 59.0 64.2 63.3 65.2 63.3 65.6 66.6 58.1 56.0 1350 52.0 52.0 52.0 59.0 64.2 63.3 64.2 62.3 65.6 63.6 58.1 56.0 1400 52.0 52.0 52.0 59.0 63.2 62.3 64.2 62.3 64.6 63.6 58.1 56.0 1500 52.0 52.0 52.0 59.0 63.2 62.3 63.2 61.3 64.6 63.6 58.1 56.0 1550 52.0 52.0 52.0 59.0 62.2 61.3 63.2 61.3 63.6 63.6 58.1 56.0 1600 52.0 52.0 52.0 59.0 62.2 61.3 62.2 60.3 63.6 63.6 58.1 56.0 1700 52.0 52.0 52.0 59.0 61.2 60.3 62.2 60.3 62.6 63.6 58.1 56.0 1750 52.0 52.0 52.0 59.0 61.2 60.3 61.2 59.3 62.6 58.6 57.1 56.0 1850 52.0 52.0 52.0 59.0 60.2 59.3 61.2 59.3 61.6 58.6 57.1 56.0 1900 52.0 52.0 52.0 59.0 60.2 59.3 60.2 58.3 61.6 58.6 57.1 56.0 1950 52.0 52.0 52.0 59.0 59.2 58.3 60.2 58.3 60.6 58.6 57.1 56.0 2050 52.0 52.0 52.0 59.0 59.2 58.3 59.2 57.3 60.6 58.6 56.1 56.0 2100 52.0 52.0 52.0 59.0 58.2 57.3 59.2 57.3 59.6 57.6 56.1 56.0 2200 52.0 52.0 52.0 59.0 58.2 57.3 58.2 56.3 59.6 56.6 55.1 56.0 2250 52.0 52.0 52.0 59.0 57.2 56.3 58.2 56.3 58.6 55.6 55.1 56.0

Table C3: Folsom Release Temperature Schedules for WSIP 2070 without project.
Storage plus
Inflow
Temperature (F) Schedule for Folsom Dam Release
Shift Factors
-4.000 degrees 0.700 0.800 0.800 1.200 0.600 0.400 0.200 0.000 Jan Feb Mar Apr May Jun Jul Aug Sep Oct Nov Dec
0 52.0 52.0 52.0 59.0 65.7 63.9 65.7 59.4 66.6 67.4 60.2 56.0 600 52.0 52.0 52.0 59.0 65.7 63.9 65.7 59.4 66.6 67.4 60.2 56.0 700 52.0 52.0 52.0 59.0 65.4 63.8 66.4 60.8 66.2 67.8 60.4 56.0 750 52.0 52.0 52.0 59.0 66.1 64.7 66.1 61.2 66.8 67.2 59.6 56.0 850 52.0 52.0 52.0 59.0 65.6 64.4 66.6 62.3 66.3 67.5 59.8 56.0 900 52.0 52.0 52.0 59.0 66.0 64.8 66.0 62.0 66.6 66.7 58.9 56.0 950 52.0 52.0 52.0 59.0 65.2 64.1 66.2 62.3 65.7 66.8 58.9 56.0 1050 52.0 52.0 52.0 59.0 65.2 64.1 65.2 61.3 65.7 65.8 57.9 56.0 1100 52.0 52.0 52.0 59.0 64.2 63.1 65.2 61.3 64.7 65.8 57.9 56.0 1200 52.0 52.0 52.0 59.0 64.2 63.1 64.2 60.3 64.7 62.8 57.9 56.0 1250 52.0 52.0 52.0 59.0 63.2 62.1 64.2 60.3 63.7 62.8 57.9 56.0 1350 52.0 52.0 52.0 59.0 63.2 62.1 63.2 59.3 63.7 62.8 57.9 56.0 1400 52.0 52.0 52.0 59.0 62.2 61.1 63.2 59.3 62.7 62.8 57.9 56.0 1500 52.0 52.0 52.0 59.0 62.2 61.1 62.2 58.3 62.7 62.8 57.9 56.0 1550 52.0 52.0 52.0 59.0 61.2 60.1 62.2 58.3 61.7 62.8 57.9 56.0 1650 52.0 52.0 52.0 59.0 61.2 60.1 61.2 57.3 61.7 57.8 56.9 56.0 1700 52.0 52.0 52.0 59.0 60.2 59.1 61.2 57.3 60.7 57.8 56.9 56.0 1800 52.0 52.0 52.0 59.0 60.2 59.1 60.2 56.3 60.7 57.8 56.9 56.0 1850 52.0 52.0 52.0 59.0 59.2 58.1 60.2 56.3 59.7 57.8 56.9 56.0 1950 52.0 52.0 52.0 59.0 59.2 58.1 59.2 55.3 59.7 57.8 55.9 56.0 2000 52.0 52.0 52.0 59.0 58.2 57.1 59.2 55.3 58.7 56.8 55.9 56.0 2100 52.0 52.0 52.0 59.0 58.2 57.1 58.2 54.3 58.7 55.8 54.9 56.0 2150 52.0 52.0 52.0 59.0 57.2 56.1 58.2 54.3 57.7 54.8 54.9 56.0

Attachment D – Sacramento River at Jellys Ferry Without Project Climate Scenario Temperature Comparisons

Shasta Lake Storage (Beginning of Month) Keswick Dam Flow Jelly's Ferry Temperature
0
500
1000
1500
2000
2500
3000
3500
4000
4500
0% 20% 40% 60% 80% 100%
Sto
rag
e (
TA
F)
January - Storage
DCR 2015 Without Project LTO
WSIP 2030 Without Project LTO
WSIP 2070 Without Project LTO
0
2000
4000
6000
8000
10000
12000
14000
16000
0% 20% 40% 60% 80% 100%
Flo
w (
CF
S)
January - Flow
DCR 2015 Without Project LTO
WSIP 2030 Without Project LTO
WSIP 2070 Without Project LTO
40
42
44
46
48
50
52
54
56
0% 20% 40% 60% 80% 100%
Te
mp
era
ture
(D
eg
ree
F)
January - Temperature
DCR 2015 Without Project LTO
WSIP 2030 Without Project LTO
WSIP 2070 Without Project LTO
0
500
1000
1500
2000
2500
3000
3500
4000
4500
0% 20% 40% 60% 80% 100%
Sto
rag
e (
TA
F)
February - Storage
DCR 2015 Without Project LTO
WSIP 2030 Without Project LTO
WSIP 2070 Without Project LTO
0
2000
4000
6000
8000
10000
12000
14000
16000
0% 20% 40% 60% 80% 100%
Flo
w (
CF
S)
February - Flow
DCR 2015 Without Project LTO
WSIP 2030 Without Project LTO
WSIP 2070 Without Project LTO
40
42
44
46
48
50
52
54
56
0% 20% 40% 60% 80% 100%
Te
mp
era
ture
(D
eg
ree
F)
February - Temperature
DCR 2015 Without Project LTO
WSIP 2030 Without Project LTO
WSIP 2070 Without Project LTO
0
500
1000
1500
2000
2500
3000
3500
4000
4500
0% 20% 40% 60% 80% 100%
Sto
rag
e (
TA
F)
March - Storage
DCR 2015 Without Project LTO
WSIP 2030 Without Project LTO
WSIP 2070 Without Project LTO
0
2000
4000
6000
8000
10000
12000
14000
16000
0% 20% 40% 60% 80% 100%
Flo
w (
CF
S)
March - Flow
DCR 2015 Without Project LTO
WSIP 2030 Without Project LTO
WSIP 2070 Without Project LTO
42
44
46
48
50
52
54
56
58
0% 20% 40% 60% 80% 100%
Te
mp
era
ture
(D
eg
ree
F)
March - Temperature
DCR 2015 Without Project LTO
WSIP 2030 Without Project LTO
WSIP 2070 Without Project LTO

Shasta Lake Storage (Beginning of Month) Keswick Dam Flow Jelly's Ferry Temperature
0
500
1000
1500
2000
2500
3000
3500
4000
4500
0% 20% 40% 60% 80% 100%
Sto
rag
e (
TA
F)
April - Storage
DCR 2015 Without Project LTO
WSIP 2030 Without Project LTO
WSIP 2070 Without Project LTO
0
2000
4000
6000
8000
10000
12000
14000
16000
0% 20% 40% 60% 80% 100%
Flo
w (
CF
S)
April - Flow
DCR 2015 Without Project LTO
WSIP 2030 Without Project LTO
WSIP 2070 Without Project LTO
46
48
50
52
54
56
58
60
62
0% 20% 40% 60% 80% 100%
Te
mp
era
ture
(D
eg
ree
F)
April - Temperature
DCR 2015 Without Project LTO
WSIP 2030 Without Project LTO
WSIP 2070 Without Project LTO
0
500
1000
1500
2000
2500
3000
3500
4000
4500
0% 20% 40% 60% 80% 100%
Sto
rag
e (
TA
F)
May - Storage
DCR 2015 Without Project LTO
WSIP 2030 Without Project LTO
WSIP 2070 Without Project LTO
0
2000
4000
6000
8000
10000
12000
14000
16000
0% 20% 40% 60% 80% 100%
Flo
w (
CF
S)
May - Flow
DCR 2015 Without Project LTO
WSIP 2030 Without Project LTO
WSIP 2070 Without Project LTO
48
50
52
54
56
58
60
62
64
0% 20% 40% 60% 80% 100%
Te
mp
era
ture
(D
eg
ree
F)
May - Temperature
DCR 2015 Without Project LTO
WSIP 2030 Without Project LTO
WSIP 2070 Without Project LTO
0
500
1000
1500
2000
2500
3000
3500
4000
4500
0% 20% 40% 60% 80% 100%
Sto
rag
e (
TA
F)
June - Storage
DCR 2015 Without Project LTO
WSIP 2030 Without Project LTO
WSIP 2070 Without Project LTO
0
2000
4000
6000
8000
10000
12000
14000
16000
0% 20% 40% 60% 80% 100%
Flo
w (
CF
S)
June - Flow
DCR 2015 Without Project LTO
WSIP 2030 Without Project LTO
WSIP 2070 Without Project LTO
50
52
54
56
58
60
62
64
66
0% 20% 40% 60% 80% 100%
Te
mp
era
ture
(D
eg
ree
F)
June - Temperature
DCR 2015 Without Project LTO
WSIP 2030 Without Project LTO
WSIP 2070 Without Project LTO

Shasta Lake Storage (Beginning of Month) Keswick Dam Flow Jelly's Ferry Temperature
0
500
1000
1500
2000
2500
3000
3500
4000
4500
0% 20% 40% 60% 80% 100%
Sto
rag
e (
TA
F)
July - Storage
DCR 2015 Without Project LTO
WSIP 2030 Without Project LTO
WSIP 2070 Without Project LTO
0
2000
4000
6000
8000
10000
12000
14000
16000
0% 20% 40% 60% 80% 100%
Flo
w (
CF
S)
July - Flow
DCR 2015 Without Project LTO
WSIP 2030 Without Project LTO
WSIP 2070 Without Project LTO
52
54
56
58
60
62
64
66
0% 20% 40% 60% 80% 100%
Te
mp
era
ture
(D
eg
ree
F)
July - Temperature
DCR 2015 Without Project LTO
WSIP 2030 Without Project LTO
WSIP 2070 Without Project LTO
0
500
1000
1500
2000
2500
3000
3500
4000
4500
0% 20% 40% 60% 80% 100%
Sto
rag
e (
TA
F)
August - Storage
DCR 2015 Without Project LTO
WSIP 2030 Without Project LTO
WSIP 2070 Without Project LTO
0
2000
4000
6000
8000
10000
12000
14000
16000
0% 20% 40% 60% 80% 100%
Flo
w (
CF
S)
August - Flow
DCR 2015 Without Project LTO
WSIP 2030 Without Project LTO
WSIP 2070 Without Project LTO
54
56
58
60
62
64
66
68
70
0% 20% 40% 60% 80% 100%
Te
mp
era
ture
(D
eg
ree
F)
August - Temperature
DCR 2015 Without Project LTO
WSIP 2030 Without Project LTO
WSIP 2070 Without Project LTO
0
500
1000
1500
2000
2500
3000
3500
4000
4500
0% 20% 40% 60% 80% 100%
Sto
rag
e (
TA
F)
September - Storage
DCR 2015 Without Project LTO
WSIP 2030 Without Project LTO
WSIP 2070 Without Project LTO
0
2000
4000
6000
8000
10000
12000
14000
16000
0% 20% 40% 60% 80% 100%
Flo
w (
CF
S)
September - Flow
DCR 2015 Without Project LTO
WSIP 2030 Without Project LTO
WSIP 2070 Without Project LTO52
54
56
58
60
62
64
66
68
0% 20% 40% 60% 80% 100%
Te
mp
era
ture
(D
eg
ree
F)
September - Temperature
DCR 2015 Without Project LTO
WSIP 2030 Without Project LTO
WSIP 2070 Without Project LTO

Shasta Lake Storage (Beginning of Month) Keswick Dam Flow Jelly's Ferry Temperature
0
500
1000
1500
2000
2500
3000
3500
4000
4500
0% 20% 40% 60% 80% 100%
Sto
rag
e (
TA
F)
October - Storage
DCR 2015 Without Project LTO
WSIP 2030 Without Project LTO
WSIP 2070 Without Project LTO
0
2000
4000
6000
8000
10000
12000
14000
16000
0% 20% 40% 60% 80% 100%
Flo
w (
CF
S)
October - Flow
DCR 2015 Without Project LTO
WSIP 2030 Without Project LTO
WSIP 2070 Without Project LTO
50
52
54
56
58
60
62
64
66
0% 20% 40% 60% 80% 100%
Te
mp
era
ture
(D
eg
ree
F)
October - Temperature
DCR 2015 Without Project LTO
WSIP 2030 Without Project LTO
WSIP 2070 Without Project LTO
0
500
1000
1500
2000
2500
3000
3500
4000
4500
0% 20% 40% 60% 80% 100%
Sto
rag
e (
TA
F)
November - Storage
DCR 2015 Without Project LTO
WSIP 2030 Without Project LTO
WSIP 2070 Without Project LTO
0
2000
4000
6000
8000
10000
12000
14000
16000
0% 20% 40% 60% 80% 100%
Flo
w (
CF
S)
November - Flow
DCR 2015 Without Project LTO
WSIP 2030 Without Project LTO
WSIP 2070 Without Project LTO
46
48
50
52
54
56
58
60
62
0% 20% 40% 60% 80% 100%
Te
mp
era
ture
(D
eg
ree
F)
November - Temperature
DCR 2015 Without Project LTO
WSIP 2030 Without Project LTO
WSIP 2070 Without Project LTO
0
500
1000
1500
2000
2500
3000
3500
4000
4500
0% 20% 40% 60% 80% 100%
Sto
rag
e (
TA
F)
December - Storage
DCR 2015 Without Project LTO
WSIP 2030 Without Project LTO
WSIP 2070 Without Project LTO
0
2000
4000
6000
8000
10000
12000
14000
16000
0% 20% 40% 60% 80% 100%
Flo
w (
CF
S)
December - Flow
DCR 2015 Without Project LTO
WSIP 2030 Without Project LTO
WSIP 2070 Without Project LTO
42
44
46
48
50
52
54
56
58
0% 20% 40% 60% 80% 100%
Te
mp
era
ture
(D
eg
ree
F)
December - Temperature
DCR 2015 Without Project LTO
WSIP 2030 Without Project LTO
WSIP 2070 Without Project LTO

Attachment E – American River at Watt Avenue Without Project Climate Scenario Temperature Comparisons

Folsom Lake Storage (Beginning of Month) Watt Ave Flow Watt Ave Temperature
0
100
200
300
400
500
600
700
800
900
0% 20% 40% 60% 80% 100%
Sto
rag
e (
TA
F)
January - Storage
DCR 2015 Without Project
WSIP 2030 Without Project
WSIP 2070 Without Project
0
1000
2000
3000
4000
5000
6000
7000
8000
9000
0% 20% 40% 60% 80% 100%
Flo
w (
CF
S)
January - Flow
DCR 2015 Without Project
WSIP 2030 Without Project
WSIP 2070 Without Project
40
42
44
46
48
50
52
54
56
58
60
0% 20% 40% 60% 80% 100%
Te
mp
era
ture
(D
eg
ree
F)
January - TemperatureDCR 2015 Without Project
WSIP 2030 Without Project
WSIP 2070 Without Project
0
100
200
300
400
500
600
700
800
900
0% 20% 40% 60% 80% 100%
Sto
rag
e (
TA
F)
February - Storage
DCR 2015 Without Project
WSIP 2030 Without Project
WSIP 2070 Without Project
0
1000
2000
3000
4000
5000
6000
7000
8000
9000
0% 20% 40% 60% 80% 100%
Flo
w (
CF
S)
February - Flow
DCR 2015 Without Project
WSIP 2030 Without Project
WSIP 2070 Without Project
40
42
44
46
48
50
52
54
56
58
60
0% 20% 40% 60% 80% 100%
Te
mp
era
ture
(D
eg
ree
F)
February - TemperatureDCR 2015 Without Project
WSIP 2030 Without Project
WSIP 2070 Without Project
0
100
200
300
400
500
600
700
800
900
0% 20% 40% 60% 80% 100%
Sto
rag
e (
TA
F)
March - Storage
DCR 2015 Without Project
WSIP 2030 Without Project
WSIP 2070 Without Project
0
1000
2000
3000
4000
5000
6000
7000
8000
9000
0% 20% 40% 60% 80% 100%
Flo
w (
CF
S)
March - Flow
DCR 2015 Without Project
WSIP 2030 Without Project
WSIP 2070 Without Project
44
46
48
50
52
54
56
58
60
62
64
0% 20% 40% 60% 80% 100%
Te
mp
era
ture
(D
eg
ree
F)
March - TemperatureDCR 2015 Without Project
WSIP 2030 Without Project
WSIP 2070 Without Project

Folsom Lake Storage (Beginning of Month) Watt Ave Flow Watt Ave Temperature
0
100
200
300
400
500
600
700
800
900
0% 20% 40% 60% 80% 100%
Sto
rag
e (
TA
F)
April - Storage
DCR 2015 Without Project
WSIP 2030 Without Project
WSIP 2070 Without Project
0
1000
2000
3000
4000
5000
6000
7000
8000
9000
0% 20% 40% 60% 80% 100%
Flo
w (
CF
S)
April - Flow
DCR 2015 Without Project
WSIP 2030 Without Project
WSIP 2070 Without Project
48
50
52
54
56
58
60
62
64
66
68
0% 20% 40% 60% 80% 100%
Te
mp
era
ture
(D
eg
ree
F)
April - Temperature
DCR 2015 Without Project
WSIP 2030 Without Project
WSIP 2070 Without Project
0
100
200
300
400
500
600
700
800
900
0% 20% 40% 60% 80% 100%
Sto
rag
e (
TA
F)
May - Storage
DCR 2015 Without Project
WSIP 2030 Without Project
WSIP 2070 Without Project
0
1000
2000
3000
4000
5000
6000
7000
8000
9000
0% 20% 40% 60% 80% 100%
Flo
w (
CF
S)
May - FlowDCR 2015 Without Project
WSIP 2030 Without Project
WSIP 2070 Without Project
56
58
60
62
64
66
68
70
72
74
76
0% 20% 40% 60% 80% 100%
Te
mp
era
ture
(D
eg
ree
F)
May - TemperatureDCR 2015 Without Project
WSIP 2030 Without Project
WSIP 2070 Without Project
0
100
200
300
400
500
600
700
800
900
0% 20% 40% 60% 80% 100%
Sto
rag
e (
TA
F)
June - Storage
DCR 2015 Without Project
WSIP 2030 Without Project
WSIP 2070 Without Project
0
1000
2000
3000
4000
5000
6000
7000
8000
9000
0% 20% 40% 60% 80% 100%
Flo
w (
CF
S)
June - Flow
DCR 2015 Without Project
WSIP 2030 Without Project
WSIP 2070 Without Project
58
60
62
64
66
68
70
72
74
76
78
0% 20% 40% 60% 80% 100%
Te
mp
era
ture
(D
eg
ree
F)
June - Temperature
DCR 2015 Without Project
WSIP 2030 Without Project
WSIP 2070 Without Project
Folsom Lake Storage (Beginning of Month) Watt Ave Flow Watt Ave Temperature
0
100
200
300
400
500
600
700
800
900
0% 20% 40% 60% 80% 100%
Sto
rag
e (
TA
F)
July - Storage
DCR 2015 Without Project
WSIP 2030 Without Project
WSIP 2070 Without Project
0
1000
2000
3000
4000
5000
6000
7000
8000
9000
0% 20% 40% 60% 80% 100%
Flo
w (
CF
S)
July - Flow
DCR 2015 Without Project
WSIP 2030 Without Project
WSIP 2070 Without Project
62
64
66
68
70
72
74
76
78
80
82
0% 20% 40% 60% 80% 100%
Te
mp
era
ture
(D
eg
ree
F)
July - TemperatureDCR 2015 Without Project
WSIP 2030 Without Project
WSIP 2070 Without Project
0
100
200
300
400
500
600
700
800
900
0% 20% 40% 60% 80% 100%
Sto
rag
e (
TA
F)
August - Storage
DCR 2015 Without Project
WSIP 2030 Without Project
WSIP 2070 Without Project0
1000
2000
3000
4000
5000
6000
7000
8000
9000
0% 20% 40% 60% 80% 100%
Flo
w (
CF
S)
August - Flow
DCR 2015 Without Project
WSIP 2030 Without Project
WSIP 2070 Without Project
62
64
66
68
70
72
74
76
78
80
82
0% 20% 40% 60% 80% 100%
Te
mp
era
ture
(D
eg
ree
F)
August - TemperatureDCR 2015 Without Project
WSIP 2030 Without Project
WSIP 2070 Without Project
0
100
200
300
400
500
600
700
800
900
0% 20% 40% 60% 80% 100%
Sto
rag
e (
TA
F)
September - Storage
DCR 2015 Without Project
WSIP 2030 Without Project
WSIP 2070 Without Project
0
1000
2000
3000
4000
5000
6000
7000
8000
9000
0% 20% 40% 60% 80% 100%
Flo
w (
CF
S)
September - Flow
DCR 2015 Without Project
WSIP 2030 Without Project
WSIP 2070 Without Project
60
62
64
66
68
70
72
74
76
78
80
0% 20% 40% 60% 80% 100%
Te
mp
era
ture
(D
eg
ree
F)
September - TemperatureDCR 2015 Without Project
WSIP 2030 Without Project
WSIP 2070 Without Project

Folsom Lake Storage (Beginning of Month) Watt Ave Flow Watt Ave Temperature
0
100
200
300
400
500
600
700
800
900
0% 20% 40% 60% 80% 100%
Sto
rag
e (
TA
F)
October - Storage
DCR 2015 Without Project
WSIP 2030 Without Project
WSIP 2070 Without Project
0
1000
2000
3000
4000
5000
6000
7000
8000
9000
0% 20% 40% 60% 80% 100%
Flo
w (
CF
S)
October - Flow
DCR 2015 Without Project
WSIP 2030 Without Project
WSIP 2070 Without Project
54
56
58
60
62
64
66
68
70
72
74
0% 20% 40% 60% 80% 100%
Te
mp
era
ture
(D
eg
ree
F)
October - Temperature
DCR 2015 Without Project
WSIP 2030 Without Project
WSIP 2070 Without Project
0
100
200
300
400
500
600
700
800
900
0% 20% 40% 60% 80% 100%
Sto
rag
e (
TA
F)
November - Storage
DCR 2015 Without Project
WSIP 2030 Without Project
WSIP 2070 Without Project
0
1000
2000
3000
4000
5000
6000
7000
8000
9000
0% 20% 40% 60% 80% 100%
Flo
w (
CF
S)
November - Flow
DCR 2015 Without Project
WSIP 2030 Without Project
WSIP 2070 Without Project
46
48
50
52
54
56
58
60
62
64
66
0% 20% 40% 60% 80% 100%
Te
mp
era
ture
(D
eg
ree
F)
November - Temperature
DCR 2015 Without Project
WSIP 2030 Without Project
WSIP 2070 Without Project
0
100
200
300
400
500
600
700
800
900
0% 20% 40% 60% 80% 100%
Sto
rag
e (
TA
F)
December - Storage
DCR 2015 Without Project
WSIP 2030 Without Project
WSIP 2070 Without Project
0
1000
2000
3000
4000
5000
6000
7000
8000
9000
0% 20% 40% 60% 80% 100%
Flo
w (
CF
S)
December - FlowDCR 2015 Without Project
WSIP 2030 Without Project
WSIP 2070 Without Project
40
42
44
46
48
50
52
54
56
58
60
0% 20% 40% 60% 80% 100%
Te
mp
era
ture
(D
eg
ree
F)
December - Temperature
DCR 2015 Without Project
WSIP 2030 Without Project
WSIP 2070 Without Project


![ENERGY&RETROFIT&SCENARIOS:& MATERIAL&FLOWS… · ∑&Total&Flows&(in/out)& 40t & 30km& 50km& Volume [m³] Weight [t] Scenarios X Z X Z ∑Outflows 9 143 1,880 247,338 ∑Inflows 50](https://static.fdocuments.in/doc/165x107/607fd31081f11b5d5c7b88d5/energyretrofitscenarios-materialflows-atotalflowsinout.jpg)