Development of Thin Bonded Concrete Overlay of Asphalt ...
42
April 2020 Technical Memorandum: UCPRC-TM-2019-01 Authors: Angel Mateos and John Harvey Partnered Pavement Research Center (PPRC) Strategic Plan Element Number 4.67: Development of Thin Bonded Concrete Overlay on Asphalt Design Method (DRISI Task 3198) PREPARED FOR: PREPARED BY: California Department of Transportation Division of Research, Innovation, and System Information Office of Materials and Infrastructure University of California Pavement Research Center UC Davis, UC Berkeley • li:dircul5· UNIVERSITY of CALIFORNIA I PAVEMENT RESEARCH Davis • Berkeley CENTER Development of Thin Bonded Concrete Overlay of Asphalt Design Method: Evaluation of Existing Mechanistic- Empirical Design Methods
Transcript of Development of Thin Bonded Concrete Overlay of Asphalt ...

April 2020 Technical Memorandum: UCPRC-TM-2019-01
Authors: Angel Mateos and John Harvey
Partnered Pavement Research Center (PPRC) Strategic Plan Element Number 4.67: Development of Thin Bonded Concrete Overlay on Asphalt Design Method (DRISI Task 3198)
PREPARED FOR: PREPARED BY:
California Department of Transportation Division of Research, Innovation, and System Information Office of Materials and Infrastructure
University of California Pavement Research Center
UC Davis, UC Berkeley
• li:dircul5· UNIVERSITY of CALIFORNIA I PAVEMENT RESEARCH
Davis • Berkeley CENTER
Development of Thin Bonded Concrete Overlay of Asphalt Design Method: Evaluation of Existing Mechanistic
Empirical Design Methods


TECHNICAL REPORT DOCUMENTATION PAGE 1. REPORT NUMBER UCPRC-TM-2019-01
2. GOVERNMENT ASSOCIATION NUMBER
3. RECIPIENT’S CATALOG NUMBER
4. TITLE AND SUBTITLE Development of Thin Bonded Concrete Overlay of Asphalt Design Method: Evaluation of Existing Mechanistic-Empirical Design Methods
5. REPORT PUBLICATION DATE April 2020
6. PERFORMING ORGANIZATION CODE
7. AUTHOR(S) A. Mateos (ORCID No. 0000-0002-3614-2858) and J. Harvey (ORCID No. 0000-0002-8924-6212)
8. PERFORMING ORGANIZATION REPORT NO.
UCPRC-TM-2019-01
9. PERFORMING ORGANIZATION NAME AND ADDRESS University of California Pavement Research Center Department of Civil and Environmental Engineering, UC Davis 1 Shields Avenue Davis, CA 95616
10. WORK UNIT NUMBER
11. CONTRACT OR GRANT NUMBER 65A0628
12. SPONSORING AGENCY AND ADDRESS California Department of Transportation Division of Research, Innovation, and System Information P.O. Box 942873 Sacramento, CA 94273-0001
13. TYPE OF REPORT AND PERIOD COVERED
September 2018 to December 2018
14. SPONSORING AGENCY CODE
15. SUPPLEMENTAL NOTES
16. ABSTRACT The California Department of Transportation (Caltrans) is interested in advancing the technology needed to implement thin bonded concrete overlay of asphalt (BCOA) on its road network. Recent accelerated pavement tests showed that thin BCOA exhibited promising results for structural performance and constructability in California’s dry environment when made with the high early-strength concrete mixes typically used by Caltrans. However, to continue moving forward, Caltrans needs to adopt a thin BCOA design method since the current Caltrans Highway Design Manual does not consider this type of pavement. In order to help Caltrans decide how to adopt a thin BCOA design method, this technical memorandum includes an evaluation of two existing mechanistic-empirical methods: BCOA-ME, developed by the University of Pittsburgh, and MEPDG, as implemented in Pavement ME Design versions 2.3 (2016) and later. The evaluation includes a sensitivity analysis that considered the most important factors in thin BCOA performance. The evaluation results show that the BCOA-ME and MEPDG methods are both based on sound mechanistic-empirical principles, but that they currently have technical and practical limitations that render them difficult to use for thin BCOA design in California. Based on the analysis presented in this technical memorandum, it is recommended that additional model development be performed to produce a design method that is more suitable for thin BCOA for the Caltrans road network. If Caltrans chooses this option, it is recommended that the new design method incorporate some models already used in BCOA-ME and MEPDG. Regardless of whether Caltrans decides to adopt an existing design method without changes or to further develop models to produce a more suitable method, the selected method will still need to be calibrated for California-specific materials and construction practices, in particular, the use of high early-strength materials; traffic; and climate conditions, with a focus on the prolonged drying that occurs throughout the state.
17. KEY WORDS Thin BCOA, thin bonded concrete overlay of asphalt, thin whitetopping, mechanistic-empirical pavement design, Pavement ME
18. DISTRIBUTION STATEMENT No restrictions. This document is available to the public through the National Technical Information Service, Springfield, VA 22161
19. SECURITY CLASSIFICATION (of this report)
Unclassified
20. NUMBER OF PAGES 42
21. PRICE None
Reproduction of completed page authorized
UCPRC-TM-2019-01 i

UCPRC ADDITIONAL INFORMATION 1. DRAFT STAGE
Final 2. VERSION NUMBER
1
3. PARTNERED PAVEMENT RESEARCH CENTER STRATEGIC PLAN ELEMENT NUMBER 4.67
4. DRISI TASK NUMBER 3198
5. CALTRANS TECHNICAL LEAD AND REVIEWER(S) Deepak Maskey
6. FHWA NUMBER CA203198A
7. PROPOSALS FOR IMPLEMENTATION This technical memorandum is expected to help Caltrans make a decision regarding a thin BCOA design method to be used on the Caltrans road network; more specifically, it is intended to help Caltrans decide whether to adopt either the BCOA-ME or MEPDG method without changes or to develop additional modeling to produce a design method that specifically covers California conditions.
8. RELATED DOCUMENTS None
9. LABORATORY ACCREDITATION The UCPRC laboratory is accredited by AASHTO re:source for the tests listed in this report
10. SIGNATURES
A. Mateos FIRST AUTHOR
J.T. Harvey TECHNICAL REVIEW
D. Spinner EDITOR
J.T. Harvey PRINCIPAL INVESTIGATOR
D. Maskey CALTRANS TECH. LEADS
T.J. Holland CALTRANS CONTRACT MANAGER
Reproduction of completed page authorized
UCPRC-TM-2019-01 ii
TABLE OF CONTENTS
LIST OF FIGURES ............................................................................................................................................. iv LIST OF TABLES ............................................................................................................................................... iv PROJECT OBJECTIVES................................................................................................................................... vi LIST OF ABBREVIATIONS............................................................................................................................. vii 1 INTRODUCTION......................................................................................................................................... 1
1.1 Project Objective ..................................................................................................................................... 2 1.2 Scope ....................................................................................................................................................... 2 1.3 Design Method versus Design Tool ........................................................................................................ 3
2 EXISTING METHODS FOR THIN BCOA DESIGN: A SUMMARY ................................................... 4 2.1 BCOA-ME .............................................................................................................................................. 4
2.1.1 Mechanistic Component of BCOA-ME .......................................................................................... 4 2.1.2 Empirical Component of BCOA-ME .............................................................................................. 5
2.2 MEPDG................................................................................................................................................... 6 2.2.1 Mechanistic Component of MEPDG .............................................................................................. 6 2.2.2 Empirical Component of MEPDG .................................................................................................. 6
3 IMPORTANT FACTORS FOR THIN BCOA PERFORMANCE IN CALIFORNIA .......................... 9 4 SENSITIVITY ANALYSIS OF EXISTING TOOLS FOR DESIGNING THIN BCOA ..................... 12
4.1 Reference Section and Sensitivity Analysis Approach ......................................................................... 12 4.2 Sensitivity Analysis Factorial ................................................................................................................ 13 4.3 Results of Sensitivity Analysis for BCOA-ME and Pavement ME ...................................................... 13
4.3.1 Climate Zone ................................................................................................................................. 15 4.3.2 Traffic Level.................................................................................................................................. 18 4.3.3 PCC Flexural Strength .................................................................................................................. 18 4.3.4 PCC Type ...................................................................................................................................... 18 4.3.5 PCC CTE....................................................................................................................................... 19 4.3.6 Slab Thickness .............................................................................................................................. 20 4.3.7 Asphalt Thickness ......................................................................................................................... 20 4.3.8 Asphalt Base Condition ................................................................................................................. 20 4.3.9 Slab Size........................................................................................................................................ 21 4.3.10 Shoulder Type ............................................................................................................................... 22 4.3.11 Transverse Joint LTE .................................................................................................................... 23 4.3.12 Foundation..................................................................................................................................... 23 4.3.13 Elaboration on Foundation Effects ................................................................................................ 24
5 ADVANTAGES AND LIMITATIONS OF EXISTING DESIGN METHODS.................................... 27 6 SUMMARY, CONCLUSIONS, AND RECOMMENDATIONS............................................................ 29 REFERENCES.................................................................................................................................................... 31
UCPRC-TM-2019-01 iii

LIST OF FIGURES
Figure 1.1: Layout and typical cracking pattern of half-lane-width slabs. .............................................................. 2 Figure 4.1: Thin BCOA reference section and reference design. ......................................................................... 12 Figure 4.2: BCOA-ME sensitivity analysis at 50 percent reliability. ................................................................... 16 Figure 4.3: Pavement ME sensitivity analysis at 50 percent reliability. ............................................................... 16 Figure 4.4: BCOA-ME sensitivity analysis at 85 percent reliability. ................................................................... 17 Figure 4.5: Pavement ME sensitivity analysis at 85 percent reliability. ............................................................... 17 Figure 4.6: Pavement ME sensitivity versus the quality of the subgrade soil. ...................................................... 25 Figure 4.7: Stiffness assigned by Pavement ME to different soil types. ............................................................... 26
LIST OF TABLES
Table 1.1: Examples of Design Method and Design Tool Options for Caltrans ..................................................... 3 Table 2.1: Summary of BCOA-ME and MEPDG Design Methods ....................................................................... 8 Table 3.1: Important Design Factors to Consider in BCOA-ME and Pavement ME ........................................... 11 Table 4.1: Factorial Design of the Sensitivity Analysis ........................................................................................ 14
UCPRC-TM-2019-01 iv

DISCLAIMER
This document is disseminated in the interest of information exchange. The contents of this report reflect the views
of the authors who are responsible for the facts and accuracy of the data presented herein. The contents do not
necessarily reflect the official views or policies of the State of California or the Federal Highway Administration.
This publication does not constitute a standard, specification or regulation. This report does not constitute an
endorsement by the Department of any product described herein.
For individuals with sensory disabilities, this document is available in alternate formats. For information, call
(916) 654-8899, TTY 711, or write to California Department of Transportation, Division of Research, Innovation
and System Information, MS-83, P.O. Box 942873, Sacramento, CA 94273-0001.
UCPRC-TM-2019-01 v

PROJECT OBJECTIVES
The goal of Partnered Pavement Research Center Strategic Plan Element (PPRC SPE) Project 4.67, “Development
of Thin Bonded Concrete Overlay on Asphalt Design Method,” is to propose a mechanistic-empirical (ME) design
method applicable to thin BCOA for the Caltrans road network and to develop recommendations and guidelines
for use of the proposed method. The proposed method may be a new one developed as part of project 4.67 or
modification of an existing procedure. In either case, field calibration/recalibration will be required to improve
the reliability of BCOA performance prediction for Caltrans road network traffic, materials, pavement structures,
and weather conditions. The project includes these tasks:
1. Analysis of Pros and Cons of the Different ME Design Options
2. Caltrans will decide if the project goes forward based on the results of Task 1.
3. Build Experimental Database for Calibration of the Procedure
4. Define Mechanistic-Empirical Framework
5. Calibration of the Design Method
6. Validation (Sensitivity Analysis) of the Design Method
7. Tool Finalization
The objective of the work presented in this technical memorandum is to help Caltrans decide whether to adopt the
BCOA-ME or MEPDG thin BCOA design method as they are except for calibration, or to develop a new design
method, completing the work of Task 1. To inform that decision, this memo includes the following:
A summary of the current BCOA-ME and MEPDG design methods (Chapter 2)
A summary of the main factors expected to impact thin BCOA performance in California (Chapter 3)
Elaboration on how those main impact factors are addressed in the current ME design methods (BCOA-
ME and MEPDG), including a sensitivity analysis (Chapter 4)
Discussion of the current ME design methods’ advantages and limitations (Chapter 5)
A recommendation for how to move forward
UCPRC-TM-2019-01 vi

LIST OF ABBREVIATIONS
ACI American Concrete Institute
ACPA American Concrete Pavement Association
AASHTO American Association of State Highway and Transportation Officials
BCOA Bonded concrete overlay of asphalt
CSA Calcium sulfoaluminate
CTE Coefficient of thermal expansion
ELTG Equivalent linear temperature gradient
EELTG Effective equivalent linear temperature gradient
EICM Enhanced Integrated Climatic Model
FD Fatigue damage
FEM Finite element method
HD High Desert
HDM Highway Design Manual
HMA Hot mix asphalt
HVS Heavy Vehicle Simulator
IRI International Roughness Index
JPCP Jointed plain concrete pavement
LTE Load transfer efficiency
ME Mechanistic-empirical
MEPDG Mechanistic-Empirical Pavement Design Guide
MR Modulus of rupture
PCC Portland cement concrete
PPRC Partnered Pavement Research Center
RSC Rapid strength concrete
SC South Coast
SJPCP Short jointed plain concrete pavement
UCPRC University of California Pavement Research Center
UCPRC-TM-2019-01 vii

SI* (MODERN METRIC) CONVERSION FACTORS APPROXIMATE CONVERSIONS TO SI UNITS
Symbol When You Know Multiply By To Find Symbol LENGTH
in inches 25.4 Millimeters mm ft feet 0.305 Meters m yd yards 0.914 Meters m mi miles 1.61 Kilometers Km
AREA in2 square inches 645.2 Square millimeters mm2
ft2 square feet 0.093 Square meters m2
yd2 square yard 0.836 Square meters m2
ac acres 0.405 Hectares ha mi2 square miles 2.59 Square kilometers km2
VOLUME fl oz fluid ounces 29.57 Milliliters mL gal gallons 3.785 Liters L ft3 cubic feet 0.028 cubic meters m3
yd3 cubic yards 0.765 cubic meters m3
NOTE: volumes greater than 1000 L shall be shown in m3
MASS oz ounces 28.35 Grams g lb pounds 0.454 Kilograms kg T short tons (2000 lb) 0.907 megagrams (or "metric ton") Mg (or "t")
TEMPERATURE (exact degrees) °F Fahrenheit 5 (F-32)/9 Celsius °C
or (F-32)/1.8 ILLUMINATION
fc foot-candles 10.76 Lux lx fl foot-Lamberts 3.426 candela/m2 cd/m2
FORCE and PRESSURE or STRESS lbf poundforce 4.45 Newtons N lbf/in2 poundforce per square inch 6.89 Kilopascals kPa
APPROXIMATE CONVERSIONS FROM SI UNITS Symbol When You Know Multiply By To Find Symbol
LENGTH mm millimeters 0.039 Inches in m meters 3.28 Feet ft m meters 1.09 Yards yd km kilometers 0.621 Miles mi
AREA mm2 square millimeters 0.0016 square inches in2
m2 square meters 10.764 square feet ft2
m2 square meters 1.195 square yards yd2
ha Hectares 2.47 Acres ac km2 square kilometers 0.386 square miles mi2
VOLUME mL Milliliters 0.034 fluid ounces fl oz L liters 0.264 Gallons gal m3 cubic meters 35.314 cubic feet ft3
m3 cubic meters 1.307 cubic yards yd3
MASS g grams 0.035 Ounces oz kg kilograms 2.202 Pounds lb Mg (or "t") megagrams (or "metric ton") 1.103 short tons (2000 lb) T
TEMPERATURE (exact degrees) °C Celsius 1.8C+32 Fahrenheit °F
ILLUMINATION lx lux 0.0929 foot-candles fc cd/m2 candela/m2 0.2919 foot-Lamberts fl
FORCE and PRESSURE or STRESS N newtons 0.225 Poundforce lbf kPa kilopascals 0.145 poundforce per square inch lbf/in2
*SI is the symbol for the International System of Units. Appropriate rounding should be made to comply with Section 4 of ASTM E380 (Revised March 2003).
UCPRC-TM-2019-01 viii

1 INTRODUCTION
Thin bonded concrete overlay of asphalt (BCOA), formerly known as thin whitetopping, is a pavement
rehabilitation alternative that consists of placement of a concrete overlay 4 to 7 inches thick (0.3 to approximately
0.6 ft) on an existing asphalt-surfaced pavement (flexible, composite, or semi-rigid). This rehabilitation technique
has been used frequently on highways and conventional roads in several US states as well as in other countries,
although its use has been very limited in California (1).
The California Department of Transportation (Caltrans) is interested in implementing thin bonded concrete
overlay of asphalt (BCOA) on its road network since recent accelerated pavement testing in Partnered Pavement
Research Center Strategic Plan Element (PPRC SPE) project 4.58B, showed that thin BCOA exhibited promising
results for good structural performance and constructability in California’s environment when made with the high
early-strength concrete mixes typically used by Caltrans (2). However, to continue moving forward, Caltrans
needs to adopt a BCOA design method.
Several mechanistic-empirical (ME) design methods already developed can be used for thin BCOA designs:
1. The Colorado Thin Whitetopping Design method (3) developed in 2004
2. The BCOA Thickness Designer of the American Concrete Pavement Association (ACPA) (4), which was
developed in 2008
3. The BCOA-ME design method developed at the University of Pittsburgh in 2013 (5)
4. The Mechanistic-Empirical Pavement Design Guide (MEPDG), as implemented in Pavement ME Design,
versions 2.3 (2016) and later (6)
BCOA-ME and MEPDG are the most widely accepted of these design methods.
The current Caltrans Highway Design Manual does not consider thin BCOA, and Caltrans does not currently
require or recommend any specific method or tool for designing this type of pavement. Caltrans’s current interest
in developing thin BCOA for California, coupled with the need for a recommended design method and tool, led
to PPRC SPE 4.67, “Development of Bonded Concrete Overlay on Asphalt Design Method.” This project’s
primary goal is to develop and implement a mechanistic-empirical method for designing thin BCOA adapted for
the Caltrans road network (7). Two general options were considered to achieve the goals of SPE 4.67:
Option 1: Adopt either the BCOA-ME or the MEPDG design method without changes other than
recalibration or validation for Caltrans road network conditions.
Option 2: Adapt existing models and develop additional models as needed for a California BCOA design
method as part of project 4.67. This updated method would be calibrated for Caltrans road network
conditions.
UCPRC-TM-2019-01 1

Left wheelpath
Right wheelpath
Bottom‐up longitudinal cracking
1.1 Project Objective
The objective of the work presented in this technical memorandum is to help Caltrans decide whether to adopt the
BCOA-ME or MEPDG thin BCOA design method or to develop an updated design method. To inform that
decision, this memo includes the following:
A summary of the current BCOA-ME and MEPDG design methods (Chapter 2)
A summary of the main factors expected to impact thin BCOA performance in California (Chapter 3)
Elaboration on how those main impact factors are addressed in the current ME design methods (BCOA-
ME and MEPDG), including a sensitivity analysis (Chapter 4)
Discussion of the current ME design methods’ advantages and limitations (Chapter 5)
A recommendation for how to move forward
1.2 Scope
The evaluation presented in this memorandum focuses on thin BCOA with half-lane-width slabs in dry California
climates. Typical half-lane-width slabs are 5 to 7 ft wide and are arranged with their longitudinal joints either
between lanes or halfway between the left and right vehicle wheelpaths (Figure 1.1). Because truck wheelpaths
lie at the middle of the half-lane-width slabs, cracking typically occurs longitudinally, at roughly the middle of
the slab. This cracking is due to tensile stresses that occur at the slab bottom under traffic loading (8). The typical
transverse joint spacing of half-lane-width slabs is also 5 to 7 feet.
Figure 1.1: Layout and typical cracking pattern of half-lane-width slabs.
Thin BCOA with full-lane-width slabs (e.g., 12×12 ft) have been and continue to be built in some US states,
including Iowa and Minnesota. Other states, such as Colorado, abandoned full-lane-width slabs. Based on results
from Caltrans/UCPRC research project 4.58B, use of full-lane-width slabs is not recommended for California
conditions. As stated in the 4.58B summary report (2), “the increase in slab size from 6×6 to 12×12 resulted in
UCPRC-TM-2019-01 2

three negative effects: 1) much worse transverse joint load transfer efficiency (LTE) performance, 2) much larger
corner deflections, and 3) much larger concrete tensile strains under traffic loading.”
Only two of the design methods mentioned earlier consider longitudinal cracking of half-lane-width slabs: BCOA-
ME and MEPDG. The ACPA method focuses on corner cracking, which is critical for ultrathin BCOA with its
very short slabs (e.g., 4×4). The Colorado Department of Transportation method focuses on transverse cracking,
which is critical for thin BCOA with full-lane-width slabs. Consequently, only the BCOA-ME and MEPDG
methods are considered as candidates for implementation in California.
1.3 Design Method versus Design Tool
Conceptually, a design method is quite different than a design tool. A design method includes a collection of
models and procedures that can be used to estimate pavement performance. A design tool is the way the design
method is implemented, that is, the design tool is the instrument used to conduct the design. The MEPDG method’s
design tool is the Pavement ME Design software (referred to in this technical memorandum as Pavement ME) and
the design tool used in the BCOA-ME method is a web-based application. The same distinctions will apply to the
Caltrans thin BCOA design method, regardless of whether Caltrans adopts Option 1 (an existing design method)
or Option 2 (an updated design method). Table 1.1 shows combinations for the design method and the design tool
options being looked into.
Table 1.1: Examples of Design Method and Design Tool Options for Caltrans
Option Design Method Design (Implementation) Tool Option 1 MEPDG, with local calibration factors Catalog Option 1 MEPDG, with local calibration factors Pavement ME Option 1 BCOA-ME, with local calibration
factors Catalog
Option 2 New method, to be developed in SPE 4.67
Catalog
Option 2 New method, to be developed in SPE 4.67
Web-based application
Option 2 New method, to be developed in SPE 4.67
Catalog (for less experienced users) and a web-based application
UCPRC-TM-2019-01 3

2.1.1 Mechanistic Component of BCOA-ME
2 EXISTING METHODS FOR THIN BCOA DESIGN: A SUMMARY
2.1 BCOA-ME
As with any mechanistic-empirical design method, BCOA-ME includes a mechanistic component and an
empirical component. Both are described below.
The mechanistic component of the BCOA-ME method consists of determining the tensile stresses under a 18 kip
standard axle and an effective thermal gradient, respectively (5). For half-lane-width slabs, the BCOA-ME method
determines the stress due to a standard axle by using Equation [1], which was developed using a structural
response database generated with the finite element method (FEM) software Abaqus. This stress (σ18)—the tensile
stress at the bottom of the slabs at the transverse joints in the transverse direction— is supposed to result in
bottom-up longitudinal cracking of the slabs. The FEM calculations used to develop the equation assumed a
continuous asphalt base and full bonding between the base and the PCC. For the thermal-related stress, BCOA-
ME adopted Equation [2], which was developed as part of the Colorado design procedure.
[1]
where HHMA and HPCC are HMA and PCC thickness, respectively, in inches; NA is depth of neutral axis in inches; k is modulus of subgrade reaction in psi/in.; and EHMA is HMA stiffness in psi.
[2] where ΔT is the effective equivalent linear temperature gradient (EELTG) in °F/in.
BCOA-ME determines the asphalt base stiffness (for use in Equation [1]) and the effective equivalent linear
temperature gradient, EELTG (for use in Equation [2]), by employing two sets of equations that were developed
using the Enhanced Integrated Climatic Model (EICM) as well as mechanic-empirical principles (the EICM is the
climate model implemented in Pavement ME). In developing the two sets of equations, EICM was used to predict
hourly temperature profiles in the slab and asphalt base of a number of BCOA sections at a large number of US
locations. Then the two sets of equations were developed, as summarized below. Further details are available in
the BCOA-ME theory manual (5).
According to the BCOA-ME, an asphalt mixture’s stiffness changes depending on the BCOA section’s
characteristics and on which climate zone (defined by the annual mean daily average air temperature) it is in. In
the development of BCOA-ME, a predefined dense-graded aggregate gradation was adopted for the asphalt
mixture, and the type of binder was predetermined following recommendations from the software
LTTPBind3.1 (9). Then the mixture stiffness was estimated by using the Witczak dynamic modulus predictive
UCPRC-TM-2019-01 4

2.1.2 Empirical Component of BCOA-ME
equation (10), which is also implemented in Pavement ME. The modulus was reduced to account for damage
present in the asphalt mixture: 5 and 12 percent reductions, respectively, for asphalt pavements with zero to 8 and
8 to 20 percent of the wheelpaths with fatigue cracking. Finally, the set of equations were calibrated. The equations
allow determination of the effective asphalt base stiffness, for use in Equation [1], as a function of pavement
location, slab thickness, and asphalt base thickness.
EELTG is the temperature gradient that, when applied to the slabs, results in the same fatigue damage as the actual
temperature gradient distribution over the design life of the overlay. In developing the set of EELTG prediction
equations, the hourly slab temperature profiles were first used to determine the hourly equivalent linear
temperature gradients (ELTG), then these hourly ELTGs were used with mechanistic-empirical principles to
determine the effective values (EELTG), and these effective values were finally used to calibrate the set of EELTG
prediction equations. The equations allow the determination of the EELTG, for use in Equation [2], as a function
of pavement location, slab thickness, asphalt base thickness, and concrete flexural strength.
It should be noted that, for a particular thin BCOA section, BCOA-ME adopts constant, effective, values for
asphalt base stiffness and EELTG. The effective values are representative of the overlay’s design life.
The empirical part of BCOA-ME consists of the determination of the design stress—by combining the traffic and
thermal-related stresses following Equation [3]—and the determination of the number of load repetitions to failure
(Nf)—by using the Riley PCC fatigue model, Equation [4]. (The Riley fatigue model [11] was originally
developed for the ACPA design method.)
[3] where FStress is a field calibration factor
[4]
where SR is the stress ratio (PCC design tensile stress divided by flexural strength), and R is reliability expressed as a decimal (>0 and <1).
An important difference between BCOA-ME and its predecessors (ACPA and Colorado) is that it has been field
calibrated. The calibration was based on the performance of 11 thin BCOA sections with half-lane-width slabs:
three in Minnesota, two in Illinois, and six in Colorado. The calibration sections included transverse joint spacings
from 5 to 6 ft, PCC thicknesses from 3 to 6 in., and HMA thicknesses from 3 to 10 in. The field calibration factor,
FStress, was assumed to depend on HMA thickness, PCC thickness, and flexural strength (Equation [5]).
UCPRC-TM-2019-01 5

2.2.1 Mechanistic Component of MEPDG
2.2.2 Empirical Component of MEPDG
[5]
where HHMA and HPCC are HMA and PCC thickness, respectively, in inches, and MR is PCC flexural
strength in psi.
A summary of BCOA-ME’s design features is included in Table 2.1.
The BCOA-ME method is implemented using the web-based tool available at www.engineering.pitt.edu/
Vandenbossche/BCOA-ME/. The tool’s output is the calculated slab design thickness.
2.2 MEPDG
The preliminary research conducted for this project found only one source that documented the MEPDG thin
BCOA design procedure: the training webinar that accompanied the release of PavementME, version 2.3 (12).
This webinar included some general information about the design procedure but lacked the detail needed to fully
support the analysis presented in this memorandum. Therefore, some reverse-engineering analysis was conducted
as part of this study to complement the information in the webinar. The information presented below is based on
both the webinar and the reverse-engineering analysis.
The mechanistic component of MEPDG thin BCOA design consists of determining the tensile stresses under
traffic loading while considering thermal gradients. MEPDG calculations are based on a full traffic-loading
spectrum rather than on an 18 kip standard axle. Tensile stresses are determined using a neural network structural
model that was calibrated using a database generated with the FEM software ISlab2000 (13). The stress predicted
by the neural network model is the tensile stress at the bottom of the slabs at the transverse joints in the transverse
direction, which is supposed to result in bottom-up longitudinal cracking of the half-lane-width slabs. Full bonding
between the PCC and asphalt base was assumed in those FEM calculations, based on the BCOA-ME assumption.
Jointed asphalt base was also assumed. The MEPDG uses the EICM to determine PCC temperature gradients and
HMA temperatures. The latter are used to determine HMA stiffness, based on the dynamic modulus master curve,
while the PCC temperature gradients are used with traffic loading to determine PCC tensile stresses.
The empirical component of MEPDG thin BCOA design consists of determining the cumulative fatigue damage
(FD) throughout the section’s design life—as shown in Equation [6]—and determining the percentage of cracked
slabs by using the transfer function shown in Equation [7]. Equation [6] represents the application of Miner’s law
UCPRC-TM-2019-01 6

to the different loading scenarios the thin BCOA will undergo throughout its design life. The different loading
scenarios are represented by the sub-indexes i, j, k, l, m, and n, which refer to age, month, axle type, axle load,
temperature gradient, and wheelpath offset, respectively. The allowable number of load repetitions is determined
by using the fatigue law shown in Equation [8], which was calibrated based on standard jointed plain concrete
pavement (JPCP) cracking performance.
[6]
where ni,j,k,l,m,n is the number of load applications under certain loading conditions, and Ni,j,k,l,m,n is the allowable number of load repetitions under the same conditions.
[7]
where C4 and C5 are field calibration coefficients: C4 = 0.40 and C5 = -2.21.
[8]
where σi,j,k,l,m,n is tensile stress under the loading conditions represented by i, j, k, l, m, and n, and MRi is PCC flexural strength at age i.
The MEPDG thin BCOA design procedure was calibrated based on the cracking performance of 30 thin BCOA
sections with half-lane-width slabs in Minnesota, Illinois, and Colorado. The calibration sections included
transverse joint spacings from 5 to 6 ft, PCC thicknesses from 4 to 6 in., and HMA thicknesses from 3 to 8 in.
MEPDG design reliability is based on the standard deviation of the cracking prediction model error. This standard
deviation can be estimated with Equation [8], which is an output of the field calibration of the design procedure.
Once the standard error (SECr) is determined, the cracking at any reliability level can be estimated by multiplying
SECr by the corresponding z-value (cumulative standard normal distribution corresponding to R).
[9] where Cr is predicted cracking at 50% reliability (Equation [7])
MEPDG thin BCOA design is implemented in the Pavement ME software, version 2.3 and later. The
Pavement ME software refers to thin BCOA to as short jointed plain concrete pavement (SJPCP).
UCPRC-TM-2019-01 7

Pavement ME’s output is not the slab design thickness. Rather, slab thickness is a Pavement ME input. Instead,
the program’s output is the expected evolution of slab longitudinal cracking, at 50 percent and R reliability levels,
throughout section’s design life. In practice, the designer reruns the software until a slab thickness and other design
variables (slab dimensions, asphalt thickness, etc.) that satisfy the required traffic and reliability are found.
Table 2.1: Summary of BCOA-ME and MEPDG Design Methods
Design Feature BCOA-ME MEPDG Overall approach Non-incremental Incremental non-recursive
Climate Sets of equations that were developed based on EICM and mechanistic-empirical principles
Hourly temperature and moisture determined with the EICM
Traffic ESALs Traffic loading spectrum
Stress calculation
Load-related stress: equation based on Abaqus FEM software results; Thermal-related stress: Colorado thin BCOA equation
Neural network based on ISLAB2000 software results
Cracking calculation Riley fatigue equation (predicts cracking based on stress ratio and reliability)
Two-step approach: 1) calculate cumulative damage using Miner’s law, and 2) relate damage to cracking by using a field-calibrated transfer function
Reliability Included in Riley fatigue equation Based on standard error of the estimation
Field calibration 11 sections in Minnesota, Illinois, and Colorado
30 sections in Minnesota, Illinois, and Colorado
Range of slab dimensions 6×6 and 7×7 3–6.5 in. PCC thickness
5×5, 6×6, 7×7, and 8×8 4–8 in. PCC thickness
Software output Slab thickness Prediction of cracking throughout section’s design life
Implementation Web-based application Pavement ME computer software
UCPRC-TM-2019-01 8

3 IMPORTANT FACTORS FOR THIN BCOA PERFORMANCE IN CALIFORNIA
The goal of the recently completed PPRC SPE 4.58B research project was to develop recommendations and
guidance on the use of thin BCOA as a rehabilitation alternative in California. As part of that project, 11 full-scale
thin BCOA sections were tested with the Heavy Vehicle Simulator (HVS). The HVS testing revealed that three
design factors had a large impact on the performance of this type of pavement (14):
Asphalt base thickness. This factor was found to have a considerable impact on the load transfer efficiency
(LTE) performance of the transverse joints. During HVS testing of sections with a thin (2.5 in.) asphalt
base LTE dropped considerably, but it remained stable during tests on sections with a thick (over 4 in.)
asphalt base. The asphalt base thickness also had a considerable impact on the strains measured at the
bottom of the concrete slabs under the HVS traffic, as expected.
Asphalt base condition. Under HVS traffic, one of the sections with asphalt fatigue cracking and a
deteriorated concrete-asphalt interface showed worse LTE performance and larger strains at the slab
bottom than the sections where the asphalt base was in fair condition.
Slab size. This factor was found to have a considerable impact on the LTE of the transverse joints, as
expected. It was also found that the 12×12 ft slabs presented concrete-asphalt debonding along their
perimeter. The 8×8 ft slabs also presented concrete-asphalt debonding and poor LTE, although less than
the 12×12 ft slabs.
The research conducted in project 4.58B also revealed other design factors with important roles in thin BCOA
performance, although secondary to the three factors noted above.
Asphalt mix type. The use of new rubberized asphalt base (RHMA-G) resulted in improved LTE
performance, compared to old HMA. The improved LTE performance was attributed to the rubberized
mix’s greater fatigue resistance.
Widened slab. Widening the slabs (into the shoulder) resulted in a considerable reduction of the traffic-
related strains at the edges of the slabs and a consequent reduction of transverse cracking risk. Conversely,
widening the slabs increased the risk of top-down longitudinal cracking.
Concrete curing procedure. This factor was evaluated based on the performance of six full-scale thin
BCOA sections whose structural response to ambient environment was monitored for 15 months. One of
the sections, treated with a shrinkage-reducing admixture spray, presented much smaller drying shrinkage
than the sections where the concrete was cured with curing compound. The relevance of the curing
procedure is particularly applicable to dry and warm weather conditions in California.
UCPRC-TM-2019-01 9

The research conducted in project 4.58B also revealed that thermal and drying shrinkage deformations have a
large impact on the LTE of transverse joints and slab deflection under HVS traffic. Based on that finding, the
coefficient of thermal expansion (CTE) and drying shrinkage of concrete are regarded as important properties that
impact thin BCOA performance.
The concrete types considered in the research were 4-hour opening time concrete made with Type III portland
cement or with calcium sulfoaluminate (CSA) cement, and 10-hour opening time concrete made with Type I/II
portland cement. Other than the effects of CTE and drying shrinkage, the concrete type selected did not produce
any remarkable effects on the sections’ performance under HVS traffic. This outcome is explained by the fact that
cracking only occurred on one of the sections—and this was during an extended HVS test conducted on that
section only. Consequently, no comparative analysis could be conducted. In the field, the concrete’s mechanical
properties are expected to impact its cracking fatigue life. Long-term durability, which is strongly related to the
properties of concrete, was not evaluated in project 4.58B.
Slab thickness was another design factor evaluated in project 4.58B and it too produced no remarkable effects on
the sections’ performance under HVS traffic. The study found that this was due to the sound concrete-asphalt
bonding in the sections where the effect of slab thickness was evaluated. In the field, however, long-term concrete-
asphalt bonding is not guaranteed. Once debonding (full or partial) takes place, the additional slab thickness results
in lower tensile stresses at the bottom of the slabs under traffic loading, extending cracking fatigue life.
It is also believed that climate conditions and the bearing capacity of a pavement’s foundation (subbase/subgrade)
affect thin BCOA performance, although these factors were not evaluated in project 4.58B.
Table 3.1 summarizes some of the factors described above that each design procedure considers. The summary is
based on a review of BCOA-ME and Pavement ME documentation and input variables.
UCPRC-TM-2019-01 10

Table 3.1: Important Design Factors to Consider in BCOA-ME and Pavement ME
Design Factor BCOA-ME Pavement ME Asphalt base thickness Yes Yes Asphalt base condition Yes No
Slab size Yes Yes Type of asphalt mix No No
Widened slab No No Concrete curing procedure No Yes
Concrete type and properties No Yes Slab thickness Yes Yes
Concrete-asphalt debonding No No Climate Yes Yes
Foundation (subbase/subgrade) Yes Yes
UCPRC-TM-2019-01 11
6 in.
10 in.
PCC, 6×6 slabs
HMA
Aggregate subbase
Milling
20 ft depth
Silty subgrade, AASHTO A‐4 (e.g. ML with LL<40 and PI<10)
water table
4 SENSITIVITY ANALYSIS OF EXISTING TOOLS FOR DESIGNING THIN BCOA
A sensitivity analysis was performed as part of this project to compare the designs generated using the BCOA-
ME and Pavement ME tools. The purpose of the sensitivity analysis was to determine whether the tools produce
similar results for typical California situations, and to evaluate whether the results seem reasonable based on the
findings of the 4.58B project and experiences in other states found in the literature.
4.1 Reference Section and Sensitivity Analysis Approach
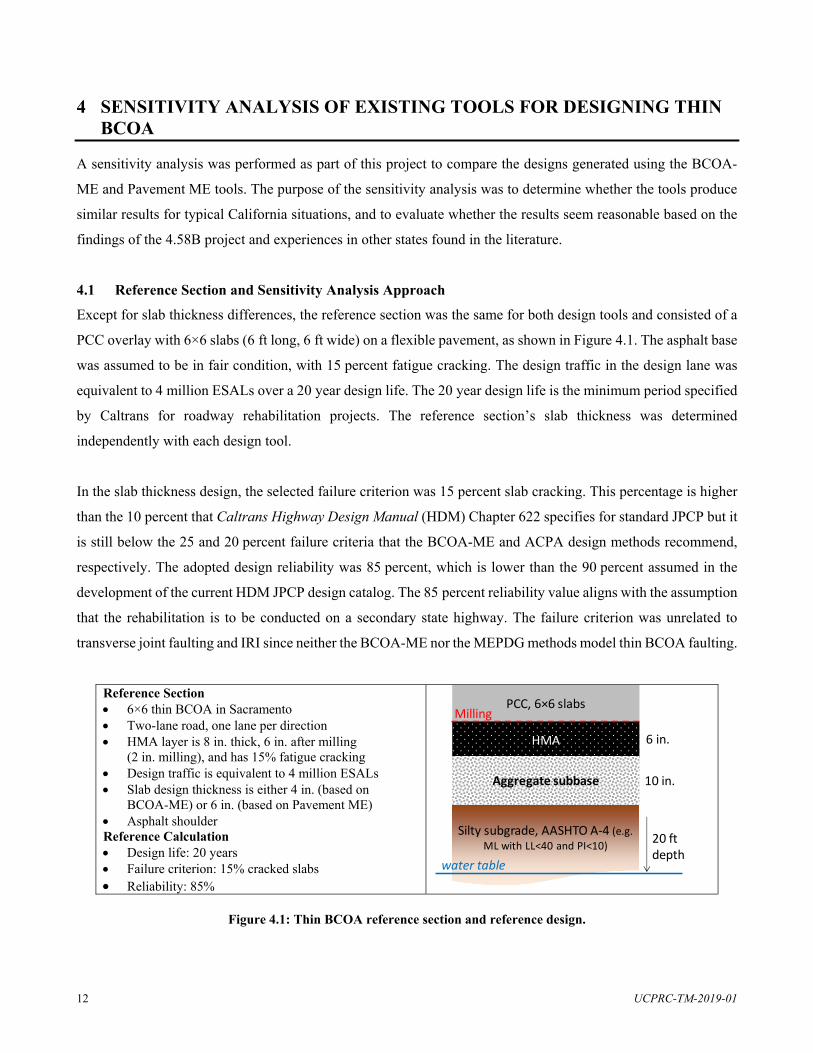
Except for slab thickness differences, the reference section was the same for both design tools and consisted of a
PCC overlay with 6×6 slabs (6 ft long, 6 ft wide) on a flexible pavement, as shown in Figure 4.1. The asphalt base
was assumed to be in fair condition, with 15 percent fatigue cracking. The design traffic in the design lane was
equivalent to 4 million ESALs over a 20 year design life. The 20 year design life is the minimum period specified
by Caltrans for roadway rehabilitation projects. The reference section’s slab thickness was determined
independently with each design tool.
In the slab thickness design, the selected failure criterion was 15 percent slab cracking. This percentage is higher
than the 10 percent that Caltrans Highway Design Manual (HDM) Chapter 622 specifies for standard JPCP but it
is still below the 25 and 20 percent failure criteria that the BCOA-ME and ACPA design methods recommend,
respectively. The adopted design reliability was 85 percent, which is lower than the 90 percent assumed in the
development of the current HDM JPCP design catalog. The 85 percent reliability value aligns with the assumption
that the rehabilitation is to be conducted on a secondary state highway. The failure criterion was unrelated to
transverse joint faulting and IRI since neither the BCOA-ME nor the MEPDG methods model thin BCOA faulting.
Reference Section 6×6 thin BCOA in Sacramento Two-lane road, one lane per direction HMA layer is 8 in. thick, 6 in. after milling
(2 in. milling), and has 15% fatigue cracking Design traffic is equivalent to 4 million ESALs Slab design thickness is either 4 in. (based on
BCOA-ME) or 6 in. (based on Pavement ME) Asphalt shoulder Reference Calculation Design life: 20 years Failure criterion: 15% cracked slabs Reliability: 85%
Figure 4.1: Thin BCOA reference section and reference design.
UCPRC-TM-2019-01 12

As shown in Figure 4.1, BCOA-ME and Pavement ME yielded very different slab design thicknesses. BCOA-ME
generated a 4.0 in. slab while Pavement ME yielded in a 5.7 in. slab (rounded up to 6 in.). One reason for this
significant difference is the different asphalt damage levels assumed in the two design procedures. This topic is
elaborated on in Section 4.3.8, Asphalt Base Condition.
In the sensitivity analysis, identical changes were made to the two reference designs’ input variables, and the
changes to the predicted percent cracking were examined.
4.2 Sensitivity Analysis Factorial
Selection of the design factors for the sensitivity analysis was based on the conclusions presented in Chapter 3.
Those factors are presented in Table 4.1. The table includes each design’s reference value (under the heading
“Reference Section”) and two alternative values adopted in the sensitivity analysis.
4.3 Results of Sensitivity Analysis for BCOA-ME and Pavement ME
The BCOA-ME sensitivity analysis results are presented in Figure 4.2 and Figure 4.4, which correspond to
longitudinal cracking predictions at 50 and 85 percent reliability, respectively. The Pavement ME sensitivity
analysis results with those same respective reliability levels are presented in Figure 4.3 and Figure 4.5. The
sensitivity analysis focused on the percentage of cracked slabs each model predicted at the end of the design life.
This variable is an output of Pavement ME but not of the BCOA-ME web implementation tool, which has instead
a design thickness output. For this reason, reverse-engineering was required to determine the percentage of
cracked slabs predicted by BCOA-ME at the end of the design life (trial and error would have been another option).
The two design procedures’ sensitivity analysis results are discussed below.
UCPRC-TM-2019-01 13
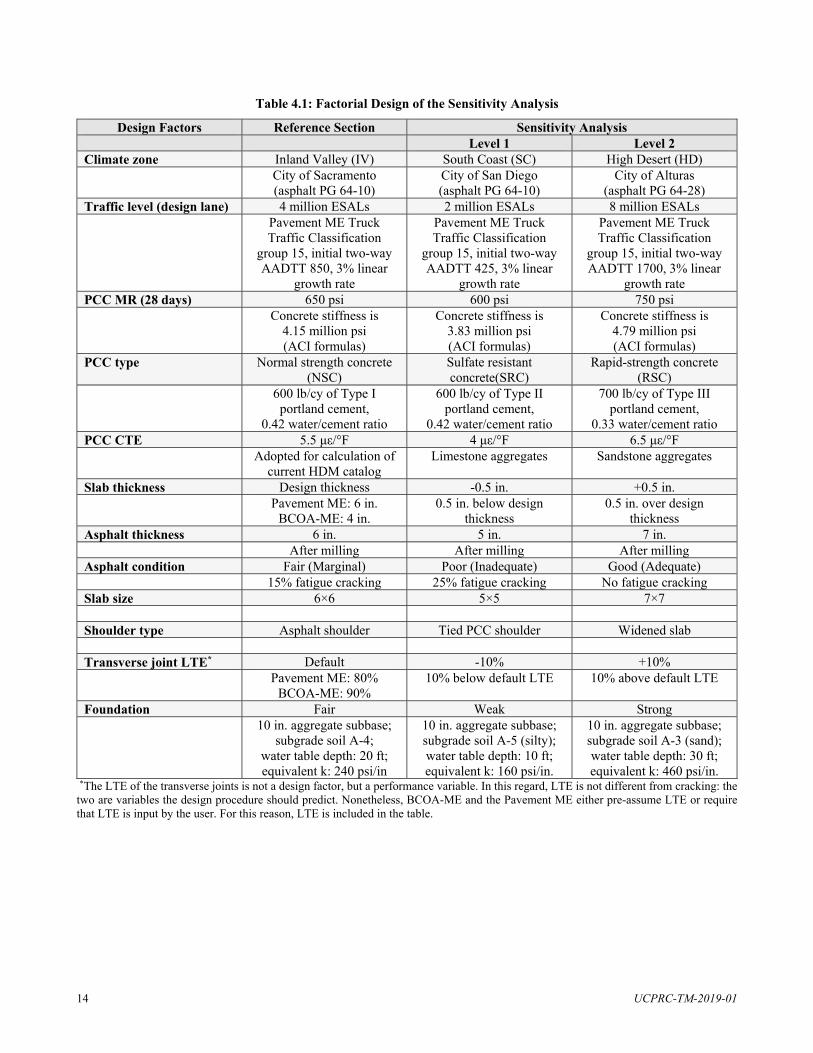
Table 4.1: Factorial Design of the Sensitivity Analysis
Design Factors Reference Section Sensitivity Analysis Level 1 Level 2
Climate zone Inland Valley (IV) South Coast (SC) High Desert (HD) City of Sacramento (asphalt PG 64-10)
City of San Diego (asphalt PG 64-10)
City of Alturas (asphalt PG 64-28)
Traffic level (design lane) 4 million ESALs 2 million ESALs 8 million ESALs Pavement ME Truck Traffic Classification
group 15, initial two-way AADTT 850, 3% linear
growth rate
Pavement ME Truck Traffic Classification
group 15, initial two-way AADTT 425, 3% linear
growth rate
Pavement ME Truck Traffic Classification
group 15, initial two-way AADTT 1700, 3% linear
growth rate PCC MR (28 days) 650 psi 600 psi 750 psi
Concrete stiffness is 4.15 million psi (ACI formulas)
Concrete stiffness is 3.83 million psi (ACI formulas)
Concrete stiffness is 4.79 million psi (ACI formulas)
PCC type Normal strength concrete (NSC)
Sulfate resistant concrete(SRC)
Rapid-strength concrete (RSC)
600 lb/cy of Type I portland cement,
0.42 water/cement ratio
600 lb/cy of Type II portland cement,
0.42 water/cement ratio
700 lb/cy of Type III portland cement,
0.33 water/cement ratio PCC CTE 5.5 με/°F 4 με/°F 6.5 με/°F
Adopted for calculation of current HDM catalog
Limestone aggregates Sandstone aggregates
Slab thickness Design thickness -0.5 in. +0.5 in. Pavement ME: 6 in.
BCOA-ME: 4 in. 0.5 in. below design
thickness 0.5 in. over design
thickness Asphalt thickness 6 in. 5 in. 7 in.
After milling After milling After milling Asphalt condition Fair (Marginal) Poor (Inadequate) Good (Adequate)
15% fatigue cracking 25% fatigue cracking No fatigue cracking Slab size 6×6 5×5 7×7
Shoulder type Asphalt shoulder Tied PCC shoulder Widened slab
Transverse joint LTE* Default -10% +10% Pavement ME: 80%
BCOA-ME: 90% 10% below default LTE 10% above default LTE
Foundation Fair Weak Strong 10 in. aggregate subbase;
subgrade soil A-4; water table depth: 20 ft; equivalent k: 240 psi/in
10 in. aggregate subbase; subgrade soil A-5 (silty); water table depth: 10 ft; equivalent k: 160 psi/in.
10 in. aggregate subbase; subgrade soil A-3 (sand); water table depth: 30 ft; equivalent k: 460 psi/in.
*The LTE of the transverse joints is not a design factor, but a performance variable. In this regard, LTE is not different from cracking: the two are variables the design procedure should predict. Nonetheless, BCOA-ME and the Pavement ME either pre-assume LTE or require that LTE is input by the user. For this reason, LTE is included in the table.
UCPRC-TM-2019-01 14
4.3.1 Climate Zone
Weather conditions in each climate zone are expected to impact thin BCOA performance in a number of ways,
although BCOA-ME only accounts for the impact on asphalt base temperature (stiffness) and PCC temperature
gradients, and Pavement ME does something similar. As shown in Figure 4.2 through Figure 4.5, both design
procedures show sensitivity to the climate zone, although the resulting effects from BCOA-ME are much larger
and go in the opposite direction than the effects resulting from Pavement ME.
It is unclear why the effects of climate zone differ so much between the BOCA ME and Pavement ME procedures,
particularly because they follow similar approaches to account for these effects and are both based on a
temperature that EICM determines. The fact that Pavement ME results show less cracking in the High Desert
(HD) zone than in the other two zones does not seem reasonable.
Based on the HDM JPCP design catalog, design slab thicknesses for a pavement with a traffic index between 10.5
and 11 (approximately 4 million ESALs), no shoulder support, and an asphalt base are 10.8 in. for the Inland
Valley (IV), 9.6 in. for the South Coast (SC), and 11.4 in., and High Desert (HD) climate zones. This means that
for an equal slab thickness, slab cracking should be lowest in the SC and the highest in the HD, an outcome that
does not agree with BCOA-ME and Pavement ME. It should be noted that the HDM catalog is not applicable to
thin BCOA, which may explain the observed differences.
Further analysis would be required to determine which design procedure would yield the more realistic
consideration of the effects of climate zone in California.
UCPRC-TM-2019-01 15

20%
18%
16%
14%
12%
10%
8%
6%
4%
2%
0%
Cracked slabs at the end of design life Sensitivity analysis
3.5 in SC
Reference section
HD 5.0 in
600 psi
6.5 Cannot 5.5
8 4.0 Weak Cannot Cannot
be IV 4 650 modeled με/°F 4.0
(no effect)
6×6 be be 6.0 Fair 7×7 modeled modeled Fair
(no effect) 2
mill. ESALs 7.0 Strong 750 4.5
Good
Climate
zone
Traffic
level
PCC
MR
PCC
type
PCC
CTE
Slab
thick.
Asphalt
thick.
Asphalt
condition
Slab
size
Shoulder
type
Transv.
joint LTE
Founda‐
tion
20%
18%
16%
14%
12%
10%
8%
6%
4%
2%
0%
Cracked slabs at the end of design life Weak
Sensitivity analysis
Reference section
5.5 in
70%
5.0 in
8 mill. ESALs
600 psi Tied
RSC NSC 6.5
IV 4 650 SRC 5.5 6.0 Cannot be
6.0 modeled 6×6 Un‐tied 80% Fair
(no effect) 4.0SC 2 750 με/°F HD
6.5 7.0 7×7 5×5 90% Strong
Climate
zone
Traffic
level
PCC
MR
PCC
type
PCC
CTE
Slab
thick.
Asphalt
thick.
Asphalt
condition
Slab
size
Shoulder
type
Transv.
joint LTE
Founda‐
tion
Figure 4.2: BCOA-ME sensitivity analysis at 50 percent reliability.
Figure 4.3: Pavement ME sensitivity analysis at 50 percent reliability.
UCPRC-TM-2019-01 16

60%
50%
40%
30%
20%
10%
0%
Cracked slabs at the end of design life
SC 3.5 in
Sensitivity analysis
Reference section
HD
600 psi
5.0 in
6.5 Cannot 5.5
8 Weak
Cannot Cannot be 4.0
IV 4 650 modeled με/°F (no effect)
2
4.0 6.0 6×6 be be
Fair 7×7 modeled modeled Fair (no effect)
mill. ESALs
750 4.5
7.0 Good Strong
Climate
zone
Traffic
level
PCC
MR
PCC
type
PCC
CTE
Slab
thick.
Asphalt
thick.
Asphalt
condition
Slab
size
Shoulder
type
Transv.
joint LTE
Founda‐
tion
60%
50%
40%
30%
20%
10%
0%
Cracked slabs at the end of design life Sensitivity analysis
Reference section
Weak
8 mill. ESALs
5.5 in 5.0 in 70%
6.5600 psi
RSC 5.5 NSC 4.0 Cannot be
Tied
Un‐IV 4 650 SRC με/°F
(no effect) SC HD 2 750
6.0
6.5
6.0 modeled 6×6 7×7 5×5
7.0
80%tied
90%
Fair
Strong
Climate Traffic PCC PCC PCC Slab Asphalt Asphalt Slab Shoulder Transv. Founda‐
zone level MR type CTE thick. thick. condition size type joint LTE tion
Figure 4.4: BCOA-ME sensitivity analysis at 85 percent reliability.
Figure 4.5: Pavement ME sensitivity analysis at 85 percent reliability.
UCPRC-TM-2019-01 17

4.3.2 Traffic Level
4.3.3 PCC Flexural Strength
4.3.4 PCC Type
Traffic level effects were evaluated by either doubling or halving the reference traffic (4 million ESALs).
Although the traffic level input to BCOA-ME is number of ESALs, Pavement ME uses truck traffic loading
spectrum for this input. Nonetheless, number of ESALs is an output of Pavement ME and it has been used in this
sensitivity analysis.
As shown in Figure 4.2 and Figure 4.4, a change in traffic level produces very little change in the cracking
predicted by BCOA-ME, which seems to present very little sensitivity to this input. For example: the calculated
slab thicknesses of the reference section are 4.00, 4.36, and 4.66 in., respectively, for 4, 40, and 400 million
ESALs, the latter being a traffic level far beyond the capacity of any thin BCOA.
As shown in Figure 4.3 and Figure 4.5, the change in traffic level produces a reasonable change in the cracking
predicted by Pavement ME at the end of the design life. More specifically, doubling or dividing the design traffic
produces an effect comparable to decreasing or increasing the slab thickness by 0.5 in.
PCC 28-day flexural strength (MR) in the reference section was 650 psi. As shown in Figure 4.2 through
Figure 4.5, a change in flexural strength to either 600 or 750 psi produced a reasonable impact on the cracking
predicted by BCOA-ME and Pavement ME at the end of the section’s design life.
It should be noted that level 3 inputs were selected for the concrete mechanical properties in Pavement ME; more
specifically, 28-day flexural strength was the only input. For this case, Pavement ME uses ACI formulas to first
determine concrete compressive strength based on the flexural strength, and then uses that compressive strength
result to determine concrete elastic modulus. Then, Pavement ME uses a predefined time function to determine
the time evolution of flexural strength and elastic modulus. The predefined time function is based on normal
strength concrete and is not applicable to the rapid-strength concrete Caltrans would typically use in thin BCOA
rehabilitation projects.
The concrete mix used for the reference section was a normal-strength concrete with 600 lb/cy of Type I portland
cement and a 0.42 water/cement ratio. This concrete mix is typically designed to meet the 28 day opening strength
requirement. The sensitivity of Pavement ME to the type of concrete was evaluated by considering two other
concrete types: 1) a sulfate-resistant concrete that uses Type II portland cement (Type II cement usually generates
UCPRC-TM-2019-01 18
4.3.5 PCC CTE
heat at a slower rate than Type I cement), and 2) a rapid-strength concrete that incorporates 700 lb/cy of Type III
portland cement and has a 0.33 water/cement ratio. In practice, the type of concrete and the flexural strength after
28 days are linked. Nonetheless, they were evaluated as two independent variables in this sensitivity analysis. By
doing so, the effects of each of the variables could be quantified.
As shown in Figure 4.3 and Figure 4.5, the concrete type (i.e., cement type, cement content, and water/cement
ratio) produced no effects on the cracking predicted by Pavement ME. This was an unexpected result since
Pavement ME uses the mix properties to determine drying shrinkage by using the RILEM B3 model. The fact that
the change in mix properties did not produce any change in the predicted cracking suggests that the Pavement ME
thin BCOA design does not consider slab warping due to variable drying shrinkage. The validity of this hypothesis
was verified: changing concrete drying shrinkage (input level 1) did not produce any change in the Pavement ME
output.
It was also verified that the Pavement ME thin BCOA design tool considers the permanent curl-warp effective
temperature difference. Although the output of Pavement ME was sensitive to this parameter, the effects went in
the opposite direction of what was expected: a change from -10°F (default value) to 0°F resulted in increased
cracking at the end of the design life (approximately twice as much cracking) while a change to -20°F resulted in
decreased cracking. It should be noted that the default value for this parameter, -10°F, was backcalculated during
the initial development of the MEPDG (15). The backcalculation was based on the cracking performance of
standard JPCP and, consequently, the applicability of this value to thin BCOA design is debatable.
The only mechanical properties of concrete that BCOA-ME accounts for are strength and stiffness, so its
applicability for modeling different concrete types is limited.
The concrete CTE in the reference section was 5.5 με/°F, and the effects of CTE were evaluated by changing its
value to 4.0 and 6.5 με/°F. These alternate values are typical of portland cement concrete made with limestone
and sandstone aggregates, respectively. The typical range of CTE in California, based on UCPRC research and
values input by contractors into the Caltrans CTE database, is 3.5 to 7 με/°F.
BCOA-ME output was not sensitive to concrete CTE, as shown in Figure 4.2 and Figure 4.4. This outcome is due
to the approach BCOA-ME uses to determine thermal-related stresses in half-lane-width slabs, which is based on
Equation [2]. That equation does not consider concrete CTE.
UCPRC-TM-2019-01 19

4.3.6 Slab Thickness
4.3.7 Asphalt Thickness
4.3.8 Asphalt Base Condition
Cracking output from Pavement ME barely changed with changing concrete CTE, as shown in Figure 4.3 and
Figure 4.5. This outcome contrasts with the significance that MEPDG 2004 documentation attributes to concrete
CTE (15).
The reference section’s slab thickness was 4 in. based on BCOA-ME and 6 in. based on Pavement ME. The
sensitivity of the two design procedures to slab thickness was evaluated by respectively increasing and decreasing
the thickness by 0.5 in. As shown in Figure 4.2 through Figure 4.5, a change in slab thickness produces a
reasonable impact on the cracking predicted by BCOA-ME and Pavement ME at the end of the section’s design
life.
The reference section’s asphalt thickness was 6 in. The sensitivity of the BCOA-ME and Pavement ME design
procedures to asphalt thickness was evaluated by respectively increasing and decreasing the thickness by 1 in. As
shown in Figure 4.2 through Figure 4.5, the change in asphalt thickness produced a reasonable impact on the
cracking predicted by BCOA-ME and Pavement ME at the end of the section’s design life. For Pavement ME, a
1 in. change in asphalt base thickness produced an impact on cracking similar to a 0.5 in. change in slab thickness.
For BCOA-ME, the impact of a 1 in. change in asphalt base thickness was smaller than the impact of a 0.5 in.
change in slab thickness. This outcome seems reasonable since the original slab thickness was only 4 in.
The reference section’s asphalt base was assumed to have 15 percent fatigue cracking. In this memorandum, that
condition is referred to as “fair.” Two other asphalt condition levels were adopted to evaluate the two procedures’
sensitivity to asphalt base condition: 1) 25 percent fatigue cracking, which is referred to as “poor,” and 2) no
fatigue cracking, which is referred to as “good.”
It should be noted that, for both BCOA-ME and Pavement ME, the only effect resulting from a change to the
asphalt base condition was a change in the layer’s stiffness: the worse the condition, the lower the stiffness, and
vice versa. Therefore, for the sensitivity analysis presented in this technical memorandum, the term “asphalt
condition effect” could be used interchangeably with the term “asphalt stiffness effect.”
UCPRC-TM-2019-01 20
4.3.9 Slab Size
Asphalt base condition is an input to BCOA-ME, although this method only allows two alternative levels. These
two levels are referred to as “adequate” (0 to 8 percent fatigue cracking) and “marginal” (8 to 20 percent fatigue
cracking). The latter matches asphalt conditions in the reference section (fair) while the former matches Option 2
of the sensitivity analysis (good). BCOA-ME accounts for asphalt damage following the methodology developed
as part of the MEPDG initial calibration (15). According to that methodology, asphalt stiffness is first determined
for the undamaged condition using the dynamic modulus master curve. Then, the undamaged modulus is corrected
for damage. The correction consists of reducing the undamaged modulus by a percentage that depends on asphalt
cracking. The adequate (good) and marginal (fair) BCOA-ME asphalt base conditions correspond to, respectively,
5 and 12.5 percent reductions of the undamaged modulus. As shown in Figure 4.2 and Figure 4.4, changing the
asphalt condition from marginal to adequate resulted in a reasonable reduction of the fatigue cracking predicted
by BCOA-ME.
Pavement ME accounts for the damage of the existing asphalt layers by following the same methodology
described above. The percentage of asphalt fatigue cracking is a design input, which Pavement ME uses to
determine the asphalt damage. Finally, it uses the damage value to determine the percentage reduction of the
modulus of the undamaged asphalt. Pavement ME makes use of this methodology in rehabilitation projects. In
particular, the methodology is applicable to a standard JPCP built on an existing asphalt base and to thin BCOA
design. In the latter case, it was found that the user cannot change the fatigue cracking value of the existing asphalt
base. This means that the user cannot specify asphalt condition in a thin BCOA design. Instead, Pavement ME
assumes 65 percent fatigue cracking. This cracking level corresponds to an approximate 50 percent reduction of
the undamaged modulus, which may be too conservative for most thin BCOA projects.
The 65 percent asphalt fatigue cracking that Pavement ME assumes is based on the calibration of the thin BCOA
design procedure. As explained in Section 2.2, this design procedure was calibrated based on the cracking
performance of 30 sections. For each of the 30 sections, asphalt base cracking was used as a fitting parameter, i.e.,
it was changed to fit actual measured cracking. The resulting asphalt cracking ranged from 50 to 75 percent, with
an average value of 65 percent, which was used for every section in the calibration of the cracking model. Finally,
65 percent was set as a constant calibration factor in the software.
The reference section’s thin BCOA slabs were assumed to be 6 ft long by 6 ft wide (6×6). Two other slab sizes
were adopted in the sensitivity analysis: 5×5 and 7×7. The former could only be modeled with Pavement ME,
while the latter could be modeled with both BCOA-ME and Pavement ME.
UCPRC-TM-2019-01 21

4.3.10 Shoulder Type
As shown in Figure 4.2 and Figure 4.4, the change in slab size did not affect the BCOA-ME output. This is because
Equation [1], which is used in BCOA-ME to determine concrete tensile stress under the standard axle, does not
include slab size as an input variable.
As shown in Figure 4.3 and Figure 4.5, the slab size change had very little impact on the Pavement ME cracking
prediction. The fact that predicted cracking was the same for 6×6 and 7×7 slabs does not seem reasonable.
Because the evaluation in this memorandum focuses on thin BCOA with half-lane-width slabs, which are typically
5 to 7 feet long and 5 to 7 feet wide, the sensitivity analysis presented in Figure 4.2 through Figure 4.5 only
included 5×5, 6×6, and 7×7 slabs. However, slab design thicknesses were also determined for 12×12 slabs. Based
on BCOA-ME, the calculated design thickness for 12×12 slabs was 5.6 in. (it was 4.0 in. for 6×6 slabs). Based on
Pavement ME, the calculated design thickness for 12×12 slabs was 7.1 in. (it was 5.7 in. for 6×6 slabs). In short,
increasing the slab size from 6×6 to 12×12 required an increase in slab thickness of 1.6 in. based on BCOA-ME
and 1.4 in. based on Pavement ME.
In Pavement ME, a thin BCOA with 12×12 slabs is a standard JPCP pavement where the PCC slab and asphalt
base remain bonded throughout section’s design life. Pavement ME’s structural response models and field
calibration factors differ between thin BCOA (referred to as SJPCP in Pavement ME) and JPCP. One of the
differences is that the LTE of the transverse joints is an input to SJPCP design (e.g., 6×6 slabs) while it is an
output for a standard JPCP design (e.g., 12×12 slabs). For the particular 12×12 section modeled in this project,
the LTE of the transverse joints was approximately 40 percent throughout section’s design life. Another difference
between SJPCP and JPCP modeling is that the latter includes faulting and IRI. For the particular 12×12 section
modeled in this project, because the transverse joints were not doweled, faulting and IRI did not achieve the
performance requirements when the slab thickness was 7.1 in. To keep faulting below 0.1 in. and IRI below
170 inches/mile (with both at an 85 percent reliability level), the slab thickness had to be further increased
to 8.5 in.
The reference section had an asphalt shoulder, and two other shoulder types were introduced in the sensitivity
analysis: tied concrete shoulder and widened slab. However, neither design method could consider the full set of
alternatives: BCOA-ME cannot model different shoulder types, and Pavement ME can model either an untied
shoulder or a tied concrete shoulder but not a widened slab. Pavement ME assumes lane-shoulder LTE is
20 percent when the shoulder is not tied concrete and 40 percent when the shoulder is tied concrete.
UCPRC-TM-2019-01 22

4.3.11 Transverse Joint LTE
4.3.12 Foundation
As shown in Figure 4.3 and Figure 4.5, Pavement ME predicts more cracking when there is a tied concrete
shoulder than when there is not. This outcome seems very unreasonable.
The Pavement ME design of the reference section assumed the tool’s default LTE value of 80 percent. Two other
LTE levels were introduced in the sensitivity analysis: 1) 10 percent below the default value, and 2) 10 percent
above the default value. Transverse joint LTE is an input to calculations in Pavement ME but in BCOA-ME it is
a fixed value. In BCOA-ME, LTE is driven by the fact that the concrete and asphalt are assumed to be bonded
and the asphalt base is assumed to be continuous. Taken together, both hypotheses result in a very large LTE:
90 percent according to Reference (12).
As shown in Figure 4.3 and Figure 4.5, a 10 percent change in transverse joint LTE resulted in a very large change
in the cracking predicted by Pavement ME. This great sensitivity to predicted cracking and uncertainty in LTE
prediction, coupled with the fact that LTE is expected to change during a thin BCOA section’s design life,
represent serious limitations of the Pavement ME design procedure. Something similar also applies to BCOA-
ME, where LTE was very high due to the procedure’s assumption of both a continuous asphalt base and full PCC-
asphalt bonding.
Based on results of the HVS testing conducted in project 4.58B, the LTE values assumed in BCOA-ME and the
default value in Pavement ME seem too high.
The reference section had a 10 in. thick aggregate subbase on top of a silty soil with low plasticity. The Unified
and AASHTO soil classification systems label this soil type ML (silty soil with low liquid limit) and A-4,
respectively. The water table was assumed to be 20 ft below the surface. This foundation is referred to as “fair”
in this sensitivity analysis. Two other bearing capacity levels were considered in this sensitivity analysis: 1) the
same aggregate subbase on top of a silty soil classified as ML and A-5 (e.g., LL=45 and PI=3) with the water table
at a depth of 10 ft; and 2) the same aggregate subbase on top of a sandy soil classified as SW (well-graded sand)
and A-3 (no plasticity) with the water table at a depth of 30 ft. In this sensitivity analysis, the former is referred to
as a “weak” foundation and the latter is referred to as “strong” foundation.
The equivalent modulus of subgrade reaction, which represents all layers below the asphalt base, is an input to
the BCOA-ME design procedure. No seasonal variation is considered in this procedure. In Pavement ME, the user
selects the soil and granular materials types and either defines their elastic modulus or lets the software estimate
UCPRC-TM-2019-01 23

4.3.13 Elaboration on Foundation Effects
it. The latter option was followed in all calculations presented in this technical memorandum. The software also
allowed the introduction of seasonal variations in the stiffness of these materials. The Pavement ME software
reports the equivalent modulus of subgrade reaction (combination of the subbase and the subgrade) for each
month. The average values that Pavement ME reported for the weak, fair, and strong foundations were 160, 240,
and 460 psi/in., respectively. These average values were used in the evaluation of BCOA-ME sensitivity.
As shown in Figure 4.2 through Figure 4.5, the BCOA-ME and Pavement ME cracking predictions reflected the
quality of the foundation. Nonetheless, the sensitivity of the BCOA-ME predictions was much less than the
sensitivity of the Pavement ME predictions. In BCOA-ME, a change in foundation quality impacted predicted
cracking less than a change in slab thickness, asphalt base thickness, concrete flexural strength, or climate zone.
Conversely, in Pavement ME, a change in foundation quality impacted predicted cracking more than a change to
any other design variable. This outcome is partly related to the fact BCOA-ME assumes a continuous asphalt base,
while Pavement ME assumes a jointed asphalt base with the joints aligning with the joints in the concrete.
Nonetheless, further analysis would be required to determine which of the two design procedures produced the
more realistic consideration of the effects of foundation.
The extreme sensitivity to foundation quality that Pavement ME’s cracking predictions showed was unexpected.
This sensitivity came as a surprise because a sensitivity analysis conducted in developing the current HDM JPCP
design catalog showed the opposite result (16): in that sensitivity analysis, the quality of the subgrade had very
little effect on the cracking predicted by the MEPDG (version 0.8, 2007). Despite the fact that the 2007 outcome
was applicable to standard JPCP while the outcome presented in this memorandum is applicable to thin BCOA, it
is evident that an apparent contradiction exists that deserves further analysis. For this reason, another sensitivity
analysis was conducted where the subgrade soil type was changed while the rest of the design inputs were left
unchanged. The results of this sensitivity analysis are presented in Figure 4.6. The data in this figure show in
greater detail Pavement ME’s extreme predicted cracking sensitivity to the type of subgrade soil present with thin
BCOA.
As shown in Figure 4.6, the predicted cracking did not consistently increase as the soil quality increased (A-4,
A-5, A-6, etc.), as would have been expected. In fact, the worst result was obtained for the silty soil A-5, and the
more plastic clay soil A-7-6 performed better than the less plastic clay soil A-7-5. These outcomes occurred no
matter whether Pavement ME was allowed to modify soil stiffness based on predicted soil moisture content or
not. In the first case, the initial soil stiffness (which is representative of construction moisture content) was
UCPRC-TM-2019-01 24

16%
14%
12%
10%
8%
6%
4%
2%
0% A‐3 A‐4 A‐5 A‐6 A‐7‐5 A‐7‐6
Subgrade soil (AASHTO classification)
Constant stiffness
Variable stiffness (depending on soil moisture)
30%Cracked slabs at the end of design life
25%
20%
15%
10%
5%
0%
Cracked slabs at the end of design life
A‐3 A‐4 A‐5 A‐6 A‐7‐5 A‐7‐6
Subgrade soil (AASHTO classification)
Constant stiffness
Variable stiffness (depending on soil moisture)
50% reliabilty 85% reliability
modified based on the moisture content predicted by the EICM throughout section’s design life. In the second
case (constant stiffness), the soil stiffness was assumed to be constant and equal to the initial stiffness. It should
be noted that the input to Pavement ME is the initial soil stiffness which, again, is representative of construction
moisture content.
Figure 4.6: Pavement ME sensitivity versus the quality of the subgrade soil.
Pavement ME combines all the layers below the asphalt base into a unique foundation characterized by its modulus
of subgrade reaction (k). The k values that Pavement ME reports for each subgrade soil type are presented in
Figure 4.7. As shown in this figure, the silty soil A-5 had the lowest stiffness and the less moisture-susceptible
clay soil A-7-5 was softer than the more moisture-susceptible clay soil A-7-6. According to the results shown in
Figure 4.7, Pavement ME assumes soils A-5 and A-7-5 have a low bearing capacity. These soils have a relatively
high liquid limit and a relatively low plasticity index. Conversely, Pavement ME assumed a relatively high
stiffness for soils A-6 and A-7-6. These are plastic soils that might present large volumetric changes due to
variations in moisture content.
UCPRC-TM-2019-01 25

Note: Yearly average k values are shown for “Pavement ME, variable stiffness” series.
Figure 4.7: Stiffness assigned by Pavement ME to different soil types.
It was also observed (in Figure 4.7) that the k values determined by the ACPA k-Value Calculator were much
larger than the k values reported by Pavement ME (constant stiffness), despite both sets of calculations being
based on exactly the same soil stiffness. This outcome is related—at least in part—to the fact that Pavement ME
determines equivalent k values based on the complete pavement structure (including asphalt base and slabs) while
the ACPA calculator considers only subbase and subgrade. This consideration biases the k values toward the
stiffness of the subbase layer, which is much greater than the stiffness of the subgrade soil.
The ACPA k-Value Calculator is the tool recommended by BCOA-ME web implementation tool.
UCPRC-TM-2019-01 26

5 ADVANTAGES AND LIMITATIONS OF EXISTING DESIGN METHODS
As part of its effort to facilitate implementation of thin BCOA in California, Caltrans could start by adopting either
the BCOA-ME or MEPDG method. However, before doing so, their advantages and disadvantages would need
to be weighed.
For example, it would be advantageous to adopt one of the procedures because both are recognized as having a
sound theoretical basis and have been empirically calibrated. Further, adopting one of them would eliminate the
need for a research effort to develop new models since both methods include models that have already been
formulated. However, the current versions of both procedures also have technical and practical limitations that
would make their adoption disadvantageous. Some of these are explained below.
Like any design method, BCOA-ME and MEPDG have technical limitations. Below are some of the ones believed
to be relevant for Caltrans design of thin BCOA:
Lack of models for a number of relevant performance variables. The two methods include a cracking
model only. They lack models for predicting other relevant performance variables, in particular concrete-
asphalt debonding, transverse joint LTE, transverse joint faulting, and longitudinal unevenness (IRI).
BCOA-ME is expected to incorporate a faulting model soon and the MEPDG may do the same.
Nonetheless, because neither method has included implementation of an LTE model or a debonding
model, major limitations remain that hinder their usefulness for thin BCOA design, based on the results
of project 4.58B. The full-scale evaluation conducted in that project showed that traffic-related loss of
LTE and concrete-asphalt debonding are two of the main distress mechanisms that thin BCOA is expected
to present in California (14).
Lack of consideration of variables that are relevant to thin BCOA cracking. As explained in Section 4.3,
slab size, concrete CTE, concrete drying shrinkage (or curing procedure), type of asphalt base, and type
of shoulder cannot be adequately modeled with either of these design procedures. The same applies to the
condition of the asphalt base in MEPDG.
Lack of calibration for California climate conditions. The two design procedures have been calibrated
based on thin BCOA performance in Minnesota, Illinois, and Colorado, but none of those states have the
same dry and warm weather conditions that can be expected in most of California (although eastern
Colorado is drier than Minnesota and Illinois, which both have considerable summertime humidity and
rainfall). It should be noted that Pavement ME allows the user to introduce local calibration factors while
the BCOA-ME web implementation tool does not. Another important fact to mention is the existence of
NCHRP Project 01-61, “Evaluation of Bonded Concrete Overlays on Asphalt Pavements,” one of whose
UCPRC-TM-2019-01 27

goals is to gather design and performance data for a number of thin BCOA projects in the US. Data from
that project, which are expected to be available in summer 2019, may be used for recalibration of existing
design methods or calibration of a new one.
Limited consideration of design reliability. The reliability approach implemented in each of the two design
procedures does not consider the variability of design factors within a project. The two reliability
approaches are based on the performance of relatively short sections.
Lack of applicability to short construction windows. The two design procedures are conceived and
calibrated for normal-strength portland cement concrete. This represents an important limitation because
rapid-strength concrete (RSC), including portland cement and other cement types, are likely to be
extensively used by Caltrans. For example, the first Caltrans thin BCOA, on SR-113 in Woodland, is
being built with a RSC designed to be opened to traffic in 18 hours. Neither BCOA-ME nor MEPDG can
model early-age traffic and high early strength mixes.
Uncertainty in the models’ predictions. The sensitivity analysis presented in this technical memorandum
showed that even with all input variables held equal, the design slab thickness differed considerably
between the two methods. The sensitivity analysis also revealed that BCOA-ME and Pavement ME
consider climate and subgrade differently.
Adopting either of the two design procedures would also present several practical limitations:
Lack of flexibility to design for local conditions. Caltrans would be unable to adapt the design methods to
the construction practices and policies applicable in California.
Lack of information about the design procedure. This limitation is only applicable to the MEPDG. As
explained in Section 2.2, very little published information is available about the MEPDG thin BCOA
design procedure.
Large cost associated with the design. This limitation is only applicable to the MEPDG. In addition to the
cost of maintaining the Pavement ME license, the cost of hand labor (and perhaps testing) associated with
the design may be very high.
o The number of inputs to a thin BCOA design is on the order of 50, excluding traffic and climate
inputs and using level 3 for most input variables (level 3 is the least comprehensive input level).
Determining all the inputs might require a huge effort. Further, many of those inputs, like those
related to concrete mix design, will have no effect on the Pavement ME output.
o Because of the complexity of the Pavement ME inputs and the way they impact cracking
prediction, only personnel with extensive background regarding mechanistic-empirical principles
and specific training on Pavement ME would be able to conduct an adequate design process.
UCPRC-TM-2019-01 28

6 SUMMARY, CONCLUSIONS, AND RECOMMENDATIONS
The analysis presented in this technical memorandum shows that the BCOA-ME and MEPDG pavement design
methods are based on sound mechanistic-empirical principles but that they have technical and practical limitations
that currently make them unsuitable for thin BCOA design in California. Specifically, they lack models for a
number of BCOA performance variables (concrete-asphalt debonding, transverse joint load transfer efficiency,
faulting, and IRI), they cannot consider input variables relevant to thin BCOA cracking (slab size, concrete CTE,
concrete drying shrinkage, type of asphalt base, and type of shoulder), they have not been calibrated for California
climate conditions, their consideration of design reliability is limited, and they lack applicability to the short
construction windows most likely to occur in thin BCOA rehabilitation activity on the Caltrans road network.
As stated in the introduction, the workplan for PPRC SPE 4.67 considered two main options for developing a
Caltrans thin BCOA design method: Option 1, adopting either BCOA-ME or MEPDG, and Option 2, adapting
existing models and developing additional models as needed for a California BCOA design method as part of
project 4.67. This updated method would be calibrated for Caltrans road network conditions. Based on the analysis
presented in this technical memorandum, it is believed that Option 2 is the more reliable alternative for designing
thin BCOA for the Caltrans road network.
For Option 2, the models already used in the BCOA-ME and MEPDG thin BCOA design methods that are
recommended for inclusion in the updated design method for California are:
EICM (the MEPDG climate model) thermal modeling (Note: EICM calculations have already been
implemented in CalME, the Caltrans mechanistic-empirical design method for asphalt pavements, without
the need to run EICM.)
The BCOA-ME load-related stress calculation (Equation [1])
The MEPDG concrete fatigue model (Equations [6] and [8])
The MEPDG concrete cracking transfer function (Equation [7]), after calibration for local conditions
The MEPDG truck traffic loading spectrum estimation tool, developed for Caltrans as part of
PPRC SPE 5.08
The faulting model developed by the University of Pittsburgh as part of PPRC SPE 4.58B
The IRI, load transfer efficiency, and concrete-asphalt debonding models to be developed as part of
PPRC SPE 4.67
Regardless of whether Caltrans decides to adopt an existing design method without changes or to create an updated
one, the selected method will need to be calibrated for California-specific materials, construction practices, and
traffic and climate conditions.
UCPRC-TM-2019-01 29

Finally, Caltrans must also decide what type of thin BCOA design implementation tool to use. For example,
Caltrans may choose between a catalog (Options 1 and 2), a web-based application (Option 2 only), or the
Pavement ME software (Option 1 only), or a combination of a software application and a catalog.
UCPRC-TM-2019-01 30

REFERENCES
1. Mateos, A., J. Harvey, J. Paniagua, and F. Paniagua. 2015. Development of Improved Guidelines and Designs
for Thin Whitetopping: Literature Review. University of California Pavement Research Center, Technical
Memorandum: UCPRC-TM-2015-01.
2. Mateos, A., J. Harvey, F. Paniagua, J. Paniagua, and R. Wu. 2019. Development of Improved Guidelines and
Designs for Thin BCOA: Summary, Conclusions, and Recommendations. University of California Pavement
Research Center, Summary Report: UCPRC-SR-2018-01.
3. Sheehan, M.J., S.M. Tarr, and S.D. Tayabji. 2004. Instrumentation and Field Testing of Thin Whitetopping
Pavement in Colorado and Revision of the Existing Colorado Thin Whitetopping Procedure. Colorado
Department of Transportation, Report No. CDOT-DTD-R-2004-12.
4. Roesler, J., A. Bordelon, M. Beyer, and D. Wang. 2008. Design and Concrete Material Requirements for
Ultra-Thin Whitetopping. University of Illinois at Urbana-Champaign, Research Report FHWA-ICT-08-016.
5. Li, Z., N. Dufalla, F. Mu, and J.M. Vandenbossche. 2013. Bonded Concrete Overlay of Asphalt Pavements
Mechanistic-Empirical Design Guide (BCOA-ME): Theory Manual. University of Pittsburgh, FHWA Pooled
Fund Project: TPF-5-165.
6. AASHTO. 2015. Mechanistic-Empirical Pavement Design Guide: A Manual of Practice. American
Association of State Highway and Transportation Officials.
7. Mateos, A., J. Harvey, R. Wu, J.D. Lea, J. Lea, and J. Paniagua. 2018. Development of Bonded Concrete
Overlay on Asphalt Design Method: Work Plan. University of California Pavement Research Center,
Workplan: UCPRC-WP-2018-01.01.
8. Li, Z., and J.M. Vandenbossche. 2013. Redefining the Failure Mode for Thin and Ultrathin Whitetopping with
1.8-×1.8-m Joint Spacing. Transportation Research Record: Journal of the Transportation Research Board:
Vol. 2368(1): 133–44. trrjournalonline.trb.org/doi/abs/10.3141/2368-13. (Accessed January 2019).
Available from journals.sagepub.com/doi/10.3141/2368-13.
9. Pavement Systems LLC. 2005. LTTPBind, version 3.1, Superpave Binder Selection Program. Developed by
Pavement Systems LLC for Federal Highway Administration.
10. Andrei, D., M.W. Witczak, and M.W. Mirza. 1999. Development of a Revised Predictive Model for the
Dynamic (Complex) Modulus of Asphalt Mixtures. National Cooperative Highway Research Program
(NCHRP), Projects 1-37A.
11. Riley, R.C., L. Titus-Glover, J. Mallela, S. Waalkes, and M. Darter. 2005. Incorporation of Probabilistic
Concepts into Fatigue Analysis of Ultrathin Whitetopping as Developed for the American Concrete Pavement
Association. In Proceedings of the International Conference on Best Practices for Ultrathin and Thin
Whitetoppings, Denver, CO.
UCPRC-TM-2019-01 31

12. AASHTOWare: Pavement ME Design. FY16 Enhancements. Training Webinar. (Internet). 2016. www.me-
design.com/MEDesign/Webinars.html (Accessed December 2018)
13. Khazanovich L., H.T. Yu, S. Rao, K. Galasova, E. Shats. R. Jones. 2000. ISLAB2000 – Finite Element
Analysis Program for Rigid and Composite Pavements. User’s Guide. ERES Consultants Division of Applied
Research Associates, Inc., Champaign, IL.
14. Mateos, A., J. Harvey, R. Wu, F. Paniagua, and J. Paniagua. 2019. Development of Improved Guidelines and
Designs for Thin Whitetopping: HVS Testing of Full-Scale BCOA Sections. University of California
Pavement Research Center, Research Report: UCPRC-RR-2017-06. (In progress.)
15. National Cooperative Highway Research Program. 2004. AASHTO Mechanistic-Empirical Design Guide,
NCHRP Project 1-37a. Transportation Research Board, Washington, DC.
16. Kannekanti, V., and J. Harvey. 2006. Sensitivity Analysis of 2002 Design Guide Distress Prediction Models
for Jointed Plain Concrete Pavement. Transportation Research Record: Journal of the Transportation Research
Board: Vol. 1947(1): 91–100.
UCPRC-TM-2019-01 32