Development of the Pressure Method for Determining...
15
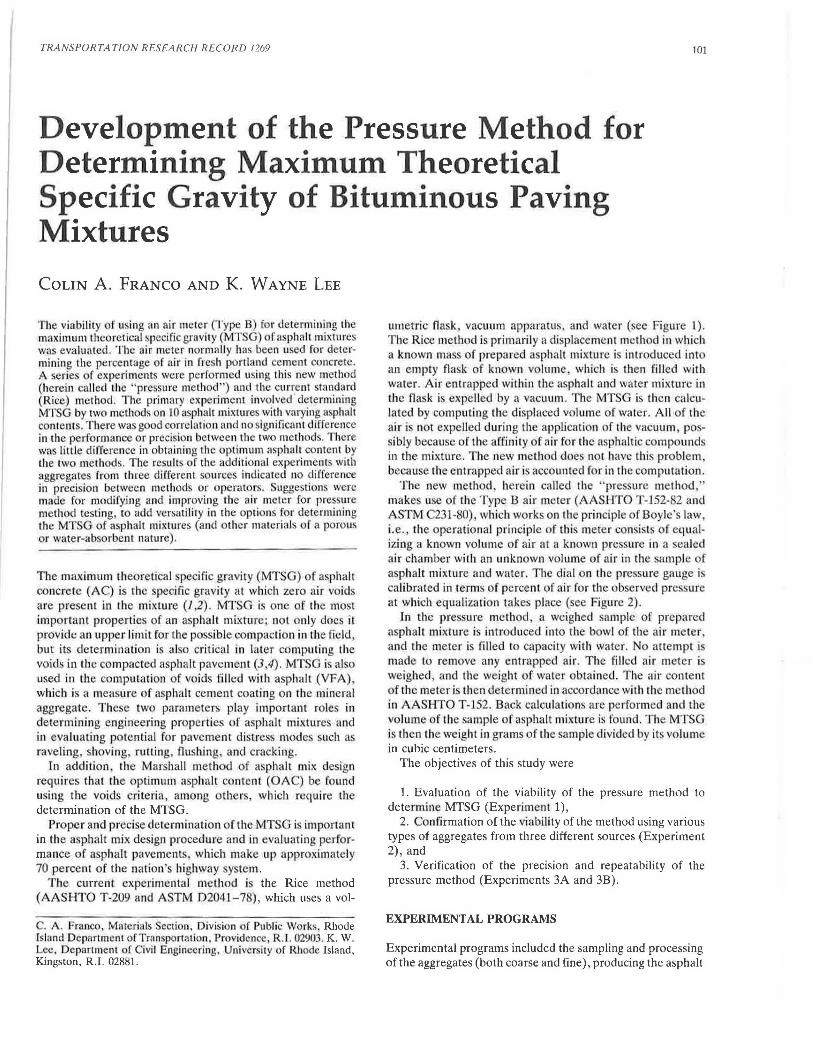
TRANSPORTA TJON RESEARCH RECORD 1269 101 Development of the Pressure Method for Determining Maximum Theoretical Specific Gravity of Bituminous Paving Mixtures COLIN A. FRANCO AND K. w AYNE LEE The viabi.lity of usin g an air meter (Type B) for determining the maxi mum theoretic al specifi c gravity (MTSG) or a phalr mhrure wa evaluated. The air meter normall y has been used for deter- mining the percentage fair in fr h portland cement concret . A eries of experiments were performed using this new method (herein called the "pressure method") and the current standard (Rice) method.. The primary experi men t involved ' determining MTSG by two meth od. on 1011. phalt mixtures with varying a phalt contents. There was good correlation and no significa nt difference in th e perfo rmance or precision between the two methods. There was Ii tile difference i11 obtaining th e optimum aspha lt content by the two methods. The result of the additional experiments ' ith aggregates from threu different source indicated no ditference in precision between methods or operntors. uggestions were made for modifying and improving the a ir merer for pres ·u.re method testing to add versatility in the op ti on for determining the MT G of asphalt mixtures (and other material of a p rou or water-absorbent nature). The maxi mum theoret ical ·pecific grav ity (MT G) of asplrnlt co. ncrete (A ) i the specific gravity at whic h zero air void are pre e nt in the mixLUre (J ,2). MTSG is one of the most import a nt properties of an asphalt mixture· n t only doe it provide an upper limit for the pos ibl.e compacti n in the field but it cl termination is al o critical in lat er computing the voids in the compacted a phalt pavement ( 4). MT G i !l also us ed in the comp utation of voids filled with asphalt (VFA) which i a mea ure of asphalt cement coating on the min ral aggregate. The e two parameters play important role in det ermining engineering properties of asphalt mixtures and in eva luating J' tential for pavement di tress modes uch as rav ling filloving rutting flushin g, and cracking. In addition the Marshall met hod f a phalt mix desigu requires that the optimum as phalt conten t (OA ) be found using Lhe voids criteria, among ot her which require th determination of the MTSG. Proper and precise dete rmination oft he MTSG i' importa nt in the asphalt mix design proce dur e and in evalu at in g perfor· mance of asphalt pavement , which make up app roximately 70 percent of the nation' hi ghway y tern. The current experimental meth od i the Rice method (AASBTO T-209 and ASTM 0 204 L-7 ), which uses a vol- C. A. Franco, Materials ect i on. Division of Public Works, Rhode ls la.nd Depiirtmcnt ofTransportali on, Providence R .1. 02903. K. W. Department or Civi.I Engi neering, Univer ity of RJ1ode Island , Kmgston, R .I. 02881. umetr ic fla k vacuum apparatus, and \ ater (see Figure 1). The Rice method is primarily a di placement method in which a known mass of prepared a pha lt mixture i introduced into an e mpt y fl ask of kn wn volume which is rhen filled with water. Air ent rapped within the aspha lt and water mixture in th e fla k i expe ll ed by a vacuum. The MT G i then calc u- lated by computing the displaced volume of water. All of the air i not expe ll ed during the application of th e vacuum, po • sibly because of the affinity of a ir for the asphall ic compo unds in the mixture. The new met hod does n t have thi. problem, because the e ntrapp ed air is accou nt ed for in the co mput alion. The new method , here in ca ll ed the " pressure method .' make use of th e Type Bair meter (AASHTO T-152- 2 and ASTM C2Jl-80), which works on the principle of Boyle's law i.e. the opera tional principle of this meter consist of eq ual- izing a known volume of air at a known pre ·sure in a ea l ed air c hamber with an unknown volume of air in Lhe ample of aspha lt mi xture and water. Tbe di al on the pre. sure gauge i · calibrated in term of percent f a ir fo r the ob erved pres ure at which eq ualiz at i on t ake · plac (see igure 2). In the pre ure met hod a weighed sampl of prepared a phalt mixture is introduced into the bowl of the air met r, and the mete r is fiUed to capac it y with water. o atte mpt i mad e to remove any entr apped air. The filled air meter is weighed and the weight of water obtained. The air content of the meter i then determined in accordance with the me t11 od in AASHTO T-152. Back calculations are performed and th volume of th e samp le of asphalt mixture is fou nd . Th e MTSG is then th e weight in grams of the sampl divided by its volume in cubic centimeters. The objectives of this study were 1. Evaluation of th e viability of the pressure method to detennin e MTSG (Experiment 1), 2. Confirmation of the viability of the method using various types of aggregates from three different sources (Experiment 2), and 3. Verification of the precision and repeat ability of th e pressure method (Experiments 3A and 3B). EXPERIMENT AL PROGRAMS Experimental programs included the sampling and processing of the aggregates (both coarse and fine), producing the asphalt
Transcript of Development of the Pressure Method for Determining...
TRANSPORTA TJON RESEARCH RECORD 1269 101
Development of the Pressure Method for Determining Maximum Theoretical Specific Gravity of Bituminous Paving Mixtures
COLIN A. FRANCO AND K. w AYNE LEE
The viabi.lity of using an air meter (Type B) for determining the maxi mum theoretical specific gravity (MTSG) or a phalr mhrure wa evaluated. The air meter normally has been used for determining the percentage fair in fr h portland cement concret . A eries of experiments were performed using this new method (herein called the "pressure method") and the current standard (Rice) method .. The primary experimen t involved ' determining MTSG by two method. on 1011. phalt mixtures with varying a phalt contents. There was good correlation and no significant difference in the performance or precision between the two methods. There was Ii tile difference i11 obtaining the optimum asphalt content by the two methods. The result of the additional experiments ' ith aggregates from threu different source indicated no ditference in precision between methods or operntors. uggestions were made for modifying and improving the air merer for pres ·u.re method testing to add versatility in the option for determining the MT G of asphalt mixtures (and other materia l of a p rou or water-absorbent nature) .
T he maximum theoretica l ·pecific gravity (MT G) of asplrnlt co.ncre te (A ) i the specific gravity a t which zero air void are pre ent in the mixLUre (J ,2) . MTSG is one of the most important properties of an aspha lt mixture· n t on ly doe it provide an uppe r limit for the pos ibl.e compacti n in the field but it cl termination is a l o critica l in later computing the voids in the compacted a phalt pavement ( 4). MT G i!l also used in the computa tion of voids filled with asphalt (VFA) which i a mea ure of asphalt cement coating on the min ral aggregate. The e two parameters play important role in dete rmining e ngineering properties of asphalt mixtures and in eva lua ting J' tential for pavement di tress modes uch as rav ling filloving rutting flushing, and cracking.
In a ddition the Marshall method f a phalt mix desigu requires that the optimum asphalt content (OA ) be found using Lhe voids criteria, among other which require th determination of the MTSG.
Proper and precise determin ation oft he MTSG i' important in the asphalt mix design procedure and in eva luating perfor· mance of asphalt pavement , which make up approximately 70 percent of the nation ' highway y tern.
The current experimental me thod i the Rice method (AASBTO T-209 and ASTM 0 204 L-7 ), which uses a vol-
C. A. Franco, Materials ect ion. Division of Public Works, Rhode lsla.nd Depiirtmcnt ofTransportalion, Providence R .1. 02903. K. W. L~e, Department or Civi.I Engineering, Univer ity of RJ1ode Island , Kmgston, R .I. 02881.
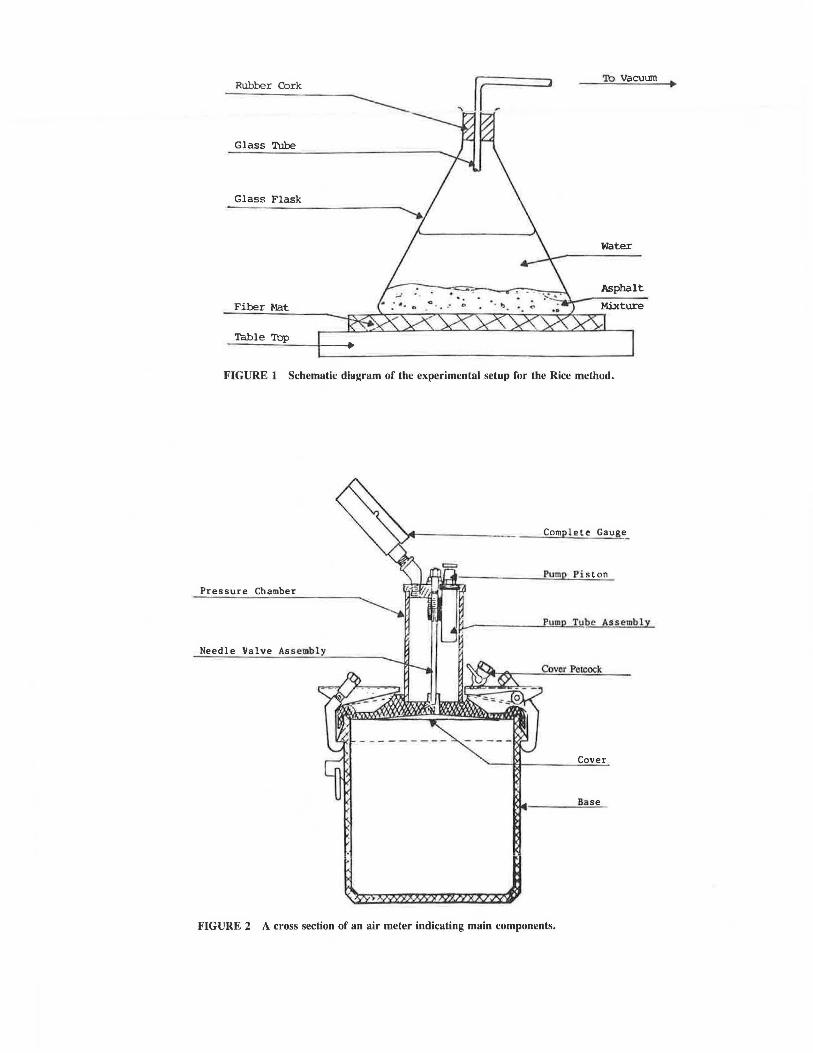
umetric fla k vacuum apparatus, and \ ater (see Figure 1). The Rice method is primarily a di placement method in which a known mass of prepared a phalt mixture i introduced into an empty fl ask of kn wn volume which is rhen filled with water. Air entrapped within the asphalt and water mixture in the fla k i expelled by a vacuum. The MT G i then calculated by computing the displaced volume of water. All of the a ir i not expelled during the application of the vacuum, po • sibly because of the affi nity of air for the asphallic compounds in the mixture. The new method does n t have thi. problem, because the entrapped air is accou nted for in the computalion.
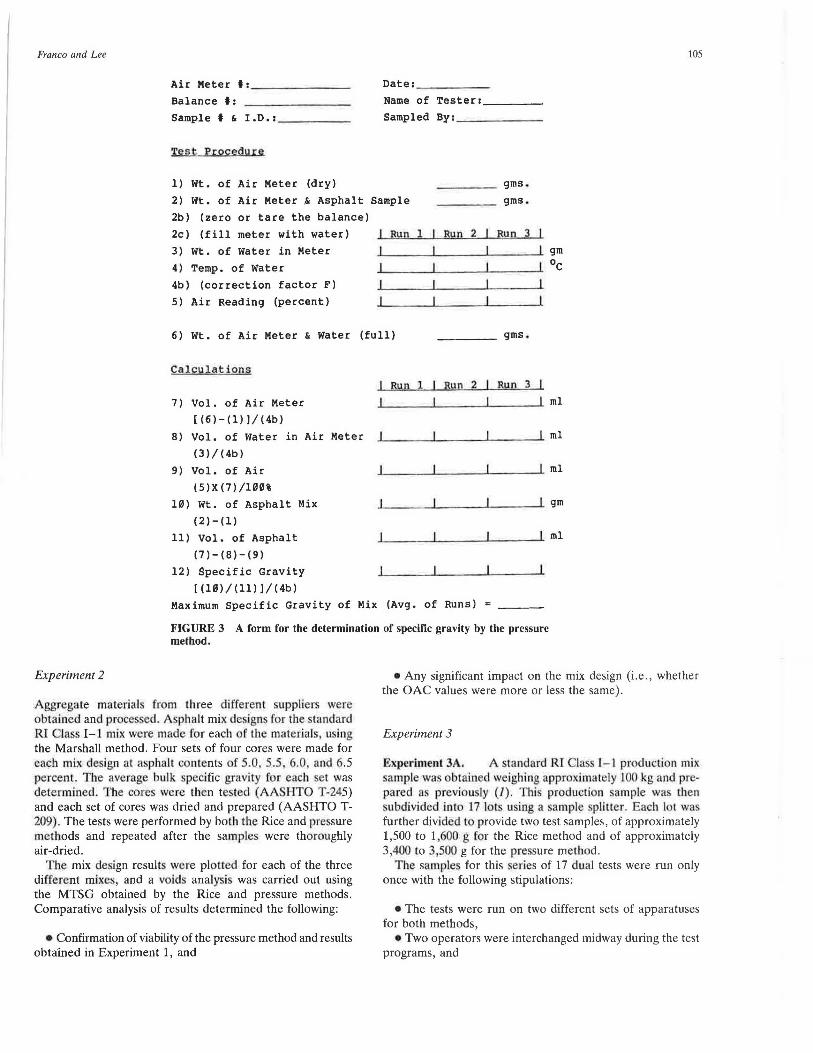
The new method , he re in called the " pressure method .' make use of the Type Bair meter (AASHTO T-152- 2 and ASTM C2Jl-80), which works on the principle of Boyle's law i.e. the operational principle of this meter consist of eq ualizing a known volume of air at a known pre ·sure in a ealed air chamber with an unknown volume of air in Lhe ample of asphalt mixture and water. Tbe di al on the pre. sure gauge i · calibra ted in term of percent f a ir fo r the ob erved pres ure at which equalizat ion take · plac (see igure 2).
In the pre ure method a weighed sampl of prepared a phalt mixture is introduced into the bowl of the air met r , and the meter is fiUed to capacit y with water. o attempt i made to remove any e ntrapped air. The filled air meter is weighed and the weight of water obtained. The air content of the meter i then determined in accordance with the me t11od in AASHTO T-152. Back calcu lations are performed and th volume of the sample of asphalt mixture is fou nd . The MTSG is then the weight in grams of the sampl divided by its volume in cubic centimeters.
The objectives of this study were
1. Evaluation of the viability of the pressure method to detennine MTSG (Experiment 1),
2. Confirmation of the viability of the method using various types of aggregates from three different sources (Experiment 2), and
3. Verification of the precision and repeatability of the pressure method (Experiments 3A and 3B).
EXPERIMENT AL PROGRAMS
Experimental programs included the sampling and processing of the aggregates (both coarse and fine), producing the asphalt
Rubber Cork To Vacuum
Glass Tube
Glass Flask
Water
Asphalt
Fiber Mat
Table 'Top
FIGURE 1 Schematic diagram of the experimental setup for the Rice method.
Complete Gauge_
Pump Piston
Pressure Chamber
Pum Tube Assembly
Needle Yalve Assembly
Cover Pcicock
Cover
Base
FIGURE 2 A cross section of an air meter indicating main components.

Franco and Lee 103
mixtures, fabrication of Marshall core specimens when required, testing of specimens, comparative analysis of the methods used, and drawing conclusions.
Materials
For Experiment I, aggregate were ob1ained from one upplier and sieved into individual izes in suffici nt quantity to produce enough material for LO ets of core . For "xpcriment 2, aggregates were obta ined from lhree different ·upplicr and ·ieved into individual sizes in sufficienr quantity to produce enough material for 4 sets of cores.
Mineral Aggregates
Coar e aggr gates from 1hrce local supplier · were u ed. Two o.f the aggregate source were of fine-~rained, trap r ck with low absorption characteri tic . The other omce was a crushed gravel which als had low absorption characteristics (see Table 1) . The aggregates were sieved into their individual sizes. Th fine aggregates consisted f cru hed- t ne Md natural . and ; their characteristics are presented in Table 2. The aggregates were sieved into individual-sized fractions as presented in Column C of Table 3. Both crushed and fine aggregates were blended to have the gradation of Rhode Island Class I-1 standard-surface course mix with a maximum size of % in.
Asphalt Cement
AC-20 from a single source was used; it was obtained in a number of quart-sized containers.
Plant Asphalt Hot-Mix
In conducting Experiment 3, a production mix from one of the three suppliers, consisting of the same class of asphalt mixture, i.e., Class 1-1 surface course, was used.
TABLE 1 PHYSICAL PROPERTIES OF COARSE AGGREGATE
I I I I
Aggregate J Apparent Absorption I Unit weight I Bulk I Supplier I Specific (percent) (lbs./ I Specific!
I Gravity cu. ft.) I Gravity
------------!----------- --~--------- 1 -------------1---------- 1
Gammino Inc.
Forte Bros.
Cardi Corp.
I 2.757 1.10 I 102.90 ! I I I
I 2.789 0.97 I 100.73 I
I I
2.674
2.715
I I I I 2.668 1.16 I 94.80 II
I I 2.588
I I I
TABLE 2 PHYSICAL PROPERTIES OF FINE AGGREGATE
Aggregate I Apparent I Absorption 1 Unit Wt. I Bulk '1
Supplier I Spec~fic I (percent) I (lbs./ I Specific
,---------- 1-::~~==:--1------------ 1-=~: -~::~-1 ------------! I I I I I I Gammino 2.738 J 1.10 117.14 I 2.659 I I Inc. I I I I
Forte Bros.
Cardi Corp.
I I I I I 2.777 I o.45 119.10 I 2.750 I I I I l I I I I I 2.668 II 0.71 121.9 I 2.618 I I I I I I I I

104 TRANSPOR TATION R ESEARCH RECORD 1269
TABLE 3 GRADATION OF RHODE ISLAND CLASS I-1 MIX FOR SURFACE COURSE
: (A) I (B) I (C) ! (0) I
• Sieve I Percent I Aggregate 'j Percent of I I Opening 1 Passing I Size Individual Size
1 1---------- -----------------------------------------------! I 3/4 11 100.0 I 3/4" - 1/2 11 10.0 I
I 1/2" 90.0 I 1/2 11 - 3/8" 10.0 I
I 3/8 11 80.0 I 3/8" - #4 20.0 I
I :: :::: ! :: ~ ::0 :::: I l #30 23.5 ! #30 - #50 5 . 5 I
I #50 18.0 I #50 - #100 6 . 0 I l uoo 12. o I uoo - #200 6. 5 I I #200 5.5 I passing #200 5.5 I I I I
Testing Programs
Experiment 1
Asphalt cores were made by combining the coarse and fine aggregate together with the AC. In 10 different sets of four cores each, the asphalt content val ues were. 4.0, 4.3, 4.6, 4.9, 5.2, 5.5 , 5.8, 6. L, 6.4. and 6.7 percent. The bulk specific ·gravity was determi ned for each et of core according to Method B of AASHTO T-166. T he core were then tested for stability and flow according to Sections 4 and 5 of AASHTO T-245.
Preparation of Samples. T he four cores of the set were heated in an oven at 105°C to remove traces of moisture and to separate the particle of the sample · de cribed in the Rice method procedures. The separated sample was then plit into two portions, wi th tile:: port ion for the Rice method weighing approximately 1,500 to 1,600 g.
Rice Method. T he MTSG wa determined according t
the Rice method procedure (AASHTO T-209 Section 6.7 Flask Determination). This ample portion wa · then retained air-dried , and rerun to obtain a econd re. ult . T he av rag f two results was taken for ana ly i and comparison.
Pressure Method. The MTSG was determined for the sec-ond portion of samples according to the following procedures:
1. The air meter to be used was cleaned, calibrated, and weighed. The initial air line was determined before commencement of the experiment.
2. The volume of the air meter was ascertained by fil ling the bowl with distilled water and introducing additional water
into the petcocks until overflow occurred. The temperature of the water was noted, as well as the weight of the air meter filled with water. From the differences in weight, the amount of water required to fill the meter was determined. Then , using the temperature correction factor for the water, the volume of the air meter was calculated to the nearest 0.1 mL. The water was then discarded, and the meter was dried completely .
3. The sample was weighed accurately in the dry bowl of the meter to the nearest 0.1 g.
4. Distilled water was introduced to the bowl with the sample, and the bowl was agitated by tapping on the sides to expel large air bubbles.
5. The top of the meter was then placed securely to the bowl, and additional water was inserted through the petcocks until overflow occurred.
6. The pump was primed until the needle rested on the initial pressure line.
7. The petcocks were closed, and the meter was wiped dry so as not to leave any overflow water on the outside.
8. The air meter, water, and sample were then weighed to the nearest 0.1 g.
9. The air valve was opened to equalize the pressure between the chambers , and the percentage of air was read on the dial (AASHTO T-152, Section 7.3).
10. This procedure was repeated twice to obtain two more air percentage readings.
11. The pressure was then released, and the temperature of the water in the meter was recorded.
12. The sample was saved, air-dried, and retained to obtain the second set of air percentage readings.
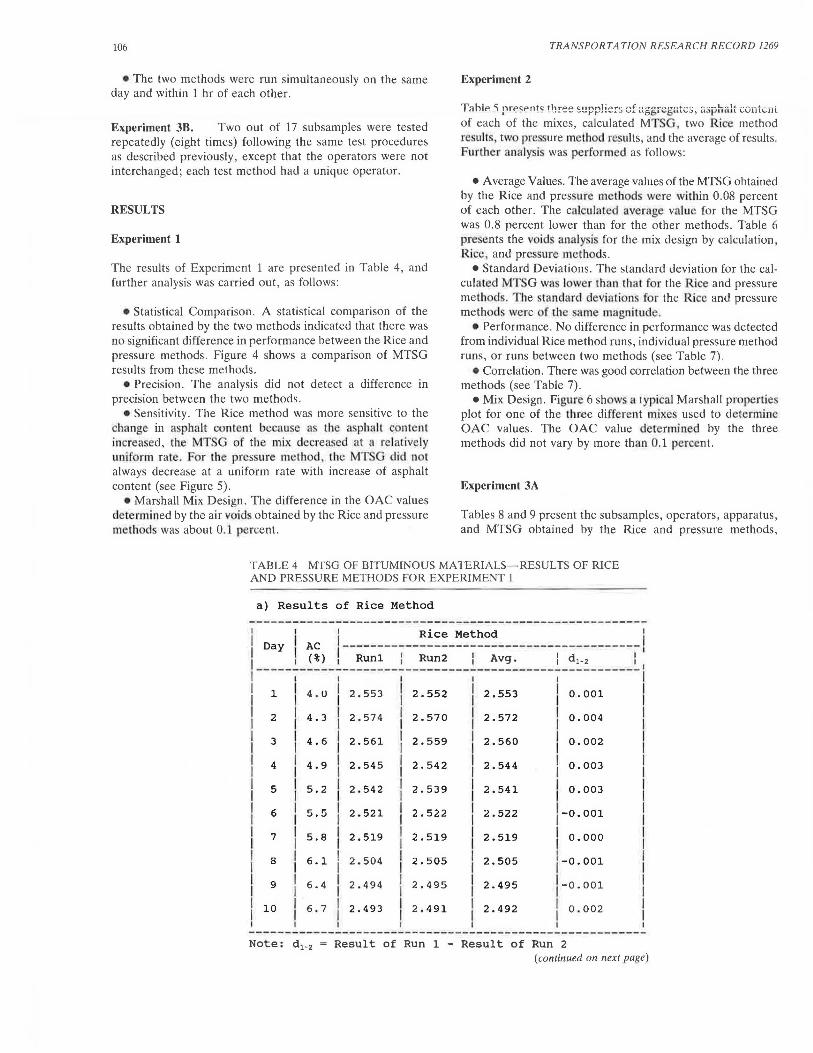
13. The MTSG was calculated with temperature correction . The reported MTSG was then the average of the three results. A form for determination of specific gravity by the pressure method is shown in Figure 3.
Franco and Lee 105
Air Meter I: ______ _ Date: ____ _
Balance I: Name of Tester: ___ _
Sample I & I.D.: ____ _ Sampled By: _____ _
Test Procedure
1) Wt. of Air Meter (dry) 2) Wt. of Air Meter & Asphalt Sample 2b) (zero or tare the balance)
____ gms. ____ gms.
2c) (fill meter with water) 3) wt. of water in Meter 4) Temp. of Water 4b) (correction factor F)
5) Air Reading (percent)
Run 1 Run 2 Run 3
6) Wt. of Air Meter & Water (full) ____ gms.
Calculat ions
7) Vol. of Air Meter [ ( 6 ) - ( 1 ) J / ( 4b )
8) Vol. of Water in Air Meter (3)/(4b)
9) Vol. of Air (5)X(7)/11Hl%
10) Wt. of Asphalt Mix (2)-(1)
11) Vol. of Asphalt (7)-(8)-(9)
12) Specific Gravity
[ C 10 l I c 11 l J / C 4b l
Run 1 Run 2 Run 3
-'----'----__,, ___ __.. ml
-'----'----__,, ___ __._ gm
-'-- - -'---_ __,, ___ ....... ml
Maximum Specific Gravity of Mix (Avg. of Runs) =
FIGURE 3 A form for the determination of specific gravity by the pressure method.
Experiment 2
Aggregate materials from three different uppliers were obtained and proces ed. Asphalt mix designs for the tandard RI Class 1-J mix were made for each of the materials , u i.ng the Marshall method. Four sets of four cores were made for each mix de ign at asphalt contents of 5.0 5.5, 6.0, and 6.5 percent. The average bulk specific gravity for each et was determined . The cores were then tested (AASE-JTO T-245) and each set of cores was dried and prepared (AASHTO T-209). The tests were performed by both the Rice and pressure methods and repeated after the samples were thoroughly air-dried.
The mix de ign results were plotted for each of the three different mixes, and a voids analysi was carried out using the MTSG obtained by the Rice and pressure methods. Comparative analysis of results determined the following:
• Confirmation of viability of the pressure method and results obtained in Experiment 1, and
•Any significant impact on the mix design (i.e., whether the OAC values were more or less the same).
Experiment 3
Experiment 3A. A standard RI la s 1- l production mix ample was obtained weighing approximately 100 kg and pre
pared as previously (J). This production sample wa then ubdivided into 17 lots u ing a sample plitrer. Each lot was
further divided to provide two test samples, of approximately 1,500 to 1,600 g for the Rice method and of approximately 3,400 to 3,500 g for the pressure method.
The sample for this series of 17 dual tests were run only once with the following stipulations:
• The tests were run on two different sets of apparatuses for both methods,
• Two operators were interchanged midway during the test programs, and
106
• The two methods were run simultaneously on the same day and within 1 hr of each other.
Experiment 38. Two out of 17 subsamples were tested repeatedly (eight times) following the same test procedures as described previously, except that the operators were not interchanged; each test method had a unique operator.
RESULTS
Experiment 1
The results of Experiment 1 are presented in Table 4, and further analysis was carried out, as follows:
• Statistical Comparison. A statistical comparison of the results obtained by the two methods indicated that there was no significant difference in performance between the Rice and pressure methods. Figure 4 shows a comparison of MTSG results from these methods.
• Precision. The analysis did not detect a difference in precision between the two methods.
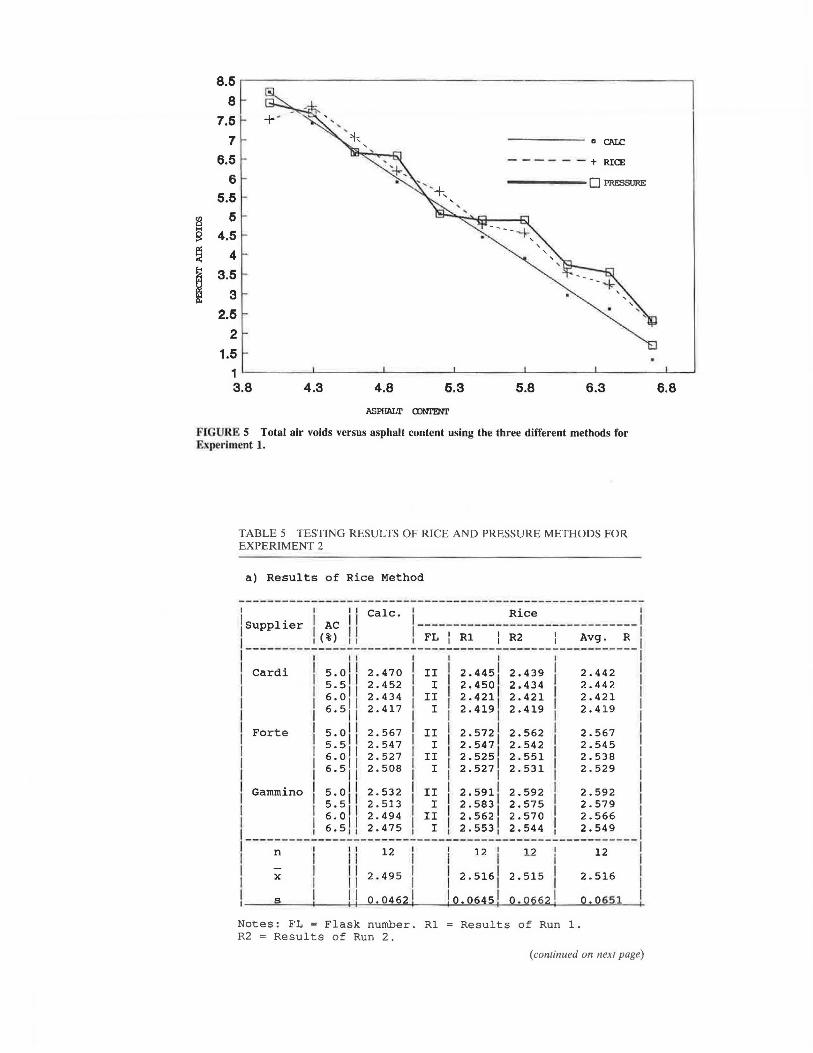
• Sensitivity. The Rice method was more sensitive to the change in asphalt content becau. c a the a pha lt on tent increased, th.e MT. G of the mix decreased at a relatively un iform rate. For the pres ·ure method , the MT G did n l always decrease at a uniform rate with increase of asphalt content (see Figure 5).
•Marshall Mix Design. The difference in the OAC values determined by the air void obtained by the Rice and pressure method. was about 0.1 percent.
TRANSPORTATION RESEARCH RECORD 1269
Experiment 2
T;:ihlP. ';; pres~!!!S !hr~e supp!!e!"s cf ~ggr,...gatc:;, usµha!t conte:11t of each of the mixes, calculated MTSG, two Rice method results, two pressure method remits, and the average of results. Further analysis was performed as follows:
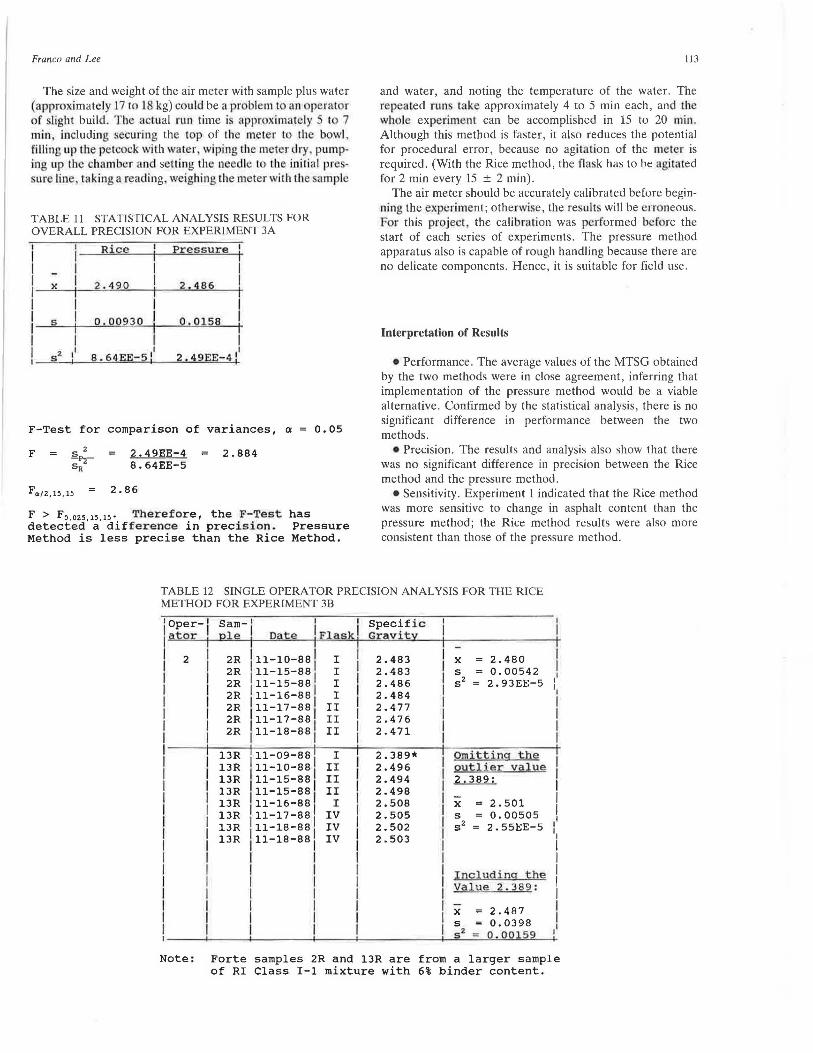
• Average Values. The average values of the MTSG obtained by the Rice and pres ure method were within 0.08 percent of each other. The cal.cu lated average value for the MTSG was 0.8 percent lower than for the other methods. Table 6 presents the voids analysi for the mix design by calculation, Rice, and pressure methods.
• Standard Deviations. The standard deviation for the calculated MTSG was lower than that for the Rice and pressure methods. The standard dev.ialio.n. for the Ri.cc and pressure methods were of the ame magnitude.
• Performance. No difference in performance was detected from individual Rice method runs, individual pressure method runs, or runs between two methods (see Table 7).
• Correlation. There was good correlation between the three methods (see Table 7).
•Mix Design. Figur 6 show a typical Marshall properties plot for one of the three different mixes used to determine OAC values. The OAC value determined by the three methods did not vary by more than 0.1 percent.
Experiment 3A
Tables 8 and 9 present the subsamples, operators, apparatus, and MTSG obtained by the Rice and pressure methods,
TABLE 4 MTSG OF BITUMINOUS MATERIALS-RESULTS OF RICE AND PRESSURE METHODS FOR EXPERIMENT 1
a) Results of Rice Method
I Day l AC i-----------~~==-~=th~~--------- -------~--1 1-----t-~~:-1-~~~~--t--~~~:---t--~~~:-----t-~~'------~ 1 II 1 I 4. u I 2. 553 I 2. 552 I 2 . 553 I 0. 001 I
2 I 4.3 I 2. 574 I 2.510 I 2.512 I 0.004 I
I 3 I 4. 6 I 2. 561 2. 559 1' 2 . 560 I 0. 002 I I
4 I 4.9 II 2.545 2.542 2.544 l 0.003 I I 5 I 5.2 2 .542 2.539 I 2.541 1' 0.003 I
I I I I _ I
6 I 5.5 I 2 .521 2.522 I 2.522 I 0.001 I
7 I 5. a I 2. 519 2. 519 2. 519 o. ooo I I 8 I 6.1 I 2.504 2.505 II 2 . 505 1-0.001 I II 9 I 6.4 I 2.494 2.495 2.495 1-0.001 I
I I I I I I lo I 6.1 I 2.493 2 .491 I 2.492 I 0.002 I I I I I I I
Note: d 1_2 = Result of Run 1 - Result of Run 2 (continued on next page)
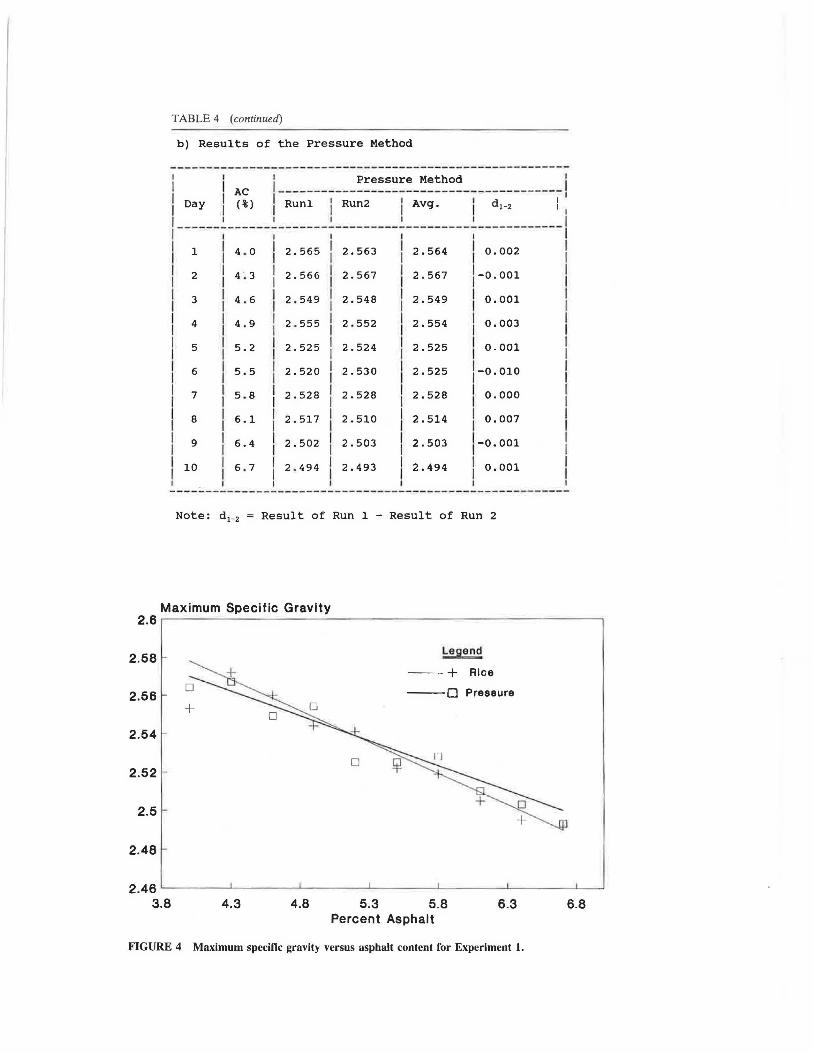
TABLE 4 (continued)
b) Results of the Pressure Method
•1 'I Pressure Method I AC ---------- - ------------- -----------~---
I _::~~l-~:~ __ l_:::~ __ l_:::: ____ l_~::~ ____ l __ :~:------~ ' I I I I I I I I 1 I 4 . 0 I 2. 565 ! 2. 563 ! 2. 564 I 0. 002 l I 2 I 4 : 3 l 2.566 I 2.567 I 2.567 1-0.001 I I I I I I I I 3 I 4.6 I 2.549 I 2.548 I 2.549 I 0.001 I
I 4 I 4.9 I 2.555 l 2.552 l 2.554 I o.003 '!
I 5 I 5.2 II 2.525 1 2.524 '1 2.525 l 0.001
I 6 I 5.5 I 2.520 I 2.530 I 2.525 l-0.010 I I 7 I 5.8 I 2.528 I 2.528 l 2.528 I o.ooo I I 8 I 6.1 l 2.517 l 2.510 I 2.514 I 0.007 l I 9 l 6. 4
1 2. 502 l 2. 503 j 2. 503 j-o. 001 I
I I I I I I I 10 I 6.7 I 2.494 I 2.493 I 2.494 I 0.001 I I I I I I
Note: d 1_2 = Result of Run 1 - Result of Run 2
Maximum Specific Gravity 2.5 .--~~~~~~~~~~~~~~~~~~~~~~~~~~~---,
2.58
2.56 +
2.54
2.52
2.5
2.48
0
Legend
--+ Rice
--O Pressure
2.46 ~~~~~~~~~~~-~~~~~~~~~-~~~..___.
3.8 4.3 4.8 5.3 5.8 6.3 6.8 Percent Asphalt
FIGURE 4 Maximum specific gravity versus asphalt content for Experiment 1.
8.5 8
7.5 7 - ---- "CAI£
6.5 - - - - - - +RICE
6 -----0 PRESSURE
5.5 -
jg 6 ..... B 4.5
~ 4
~ 3.5
3
2.5 2
1.5 1 3.8 4.3 4.8 5.3 5.8 6.3
ASPHALT ~
l<'IGURE 5 Total air voids versus asphalt content using the three different methods for Experiment 1.
TABLE 5 TESTING RESULTS OF RICE AND PRESSURE METHODS FOR EXPERIMENT 2
a) Results of Rice Method
I I I I Cale. I Rice I
!supplier I AC I I !---------------------- ---------' I ! ( % ) l I 1 FL I Rl I R2 I Avg. R I 1-:::::---1- :~:1:-:~ :~:-1-::-1- :~:::--:~:::-,---: ~:::---! I I 5.51 1 2.452 I I I 2.450 2.434 I 2.442 I 1 1
6.011
2.434 I II 1
2 . 421 2.421 2.421 1 I I 6.5 ! I 2.417 I ! 2.419 2.419 I 2.419 I
I Forte I 5 o ! I 2.567 I II 2.572 2.562 I 2.567 I I I . I I I
I 5.5 ,, 2.547 I I 2.547 2.542 I 2.545 I
I 6.0 11 2.527 II I 2 . 525 2.551 I 2.538 I
I 6.5 ,, 2 . 508 I I 2.527 2.531 I 2.529 I
I II I I I I Garnrnino
1
5.0l I 2.532 I II I 2.591 2.592 I 2.592 I 5.5 ,, 2.513 I I I 2 . 583 2.575 I 2.579 I
I 6.0 ,, 2.494 I II 2.562 2.570 I 2.566 I I 6.5 , 2.475 I I 2.553 2.544 I 2 . 549 I
----:------- - -11-:~:::-r----1-:~::: r-: ~:::-r---:~:::-- -i s ! I o.0462 ! , o.0645 1 0 .0662! 0.0651 !
Notes: FL Flask number. Rl R2 =Results of Run 2.
Results of Run 1.
(continued on next page)
6.8
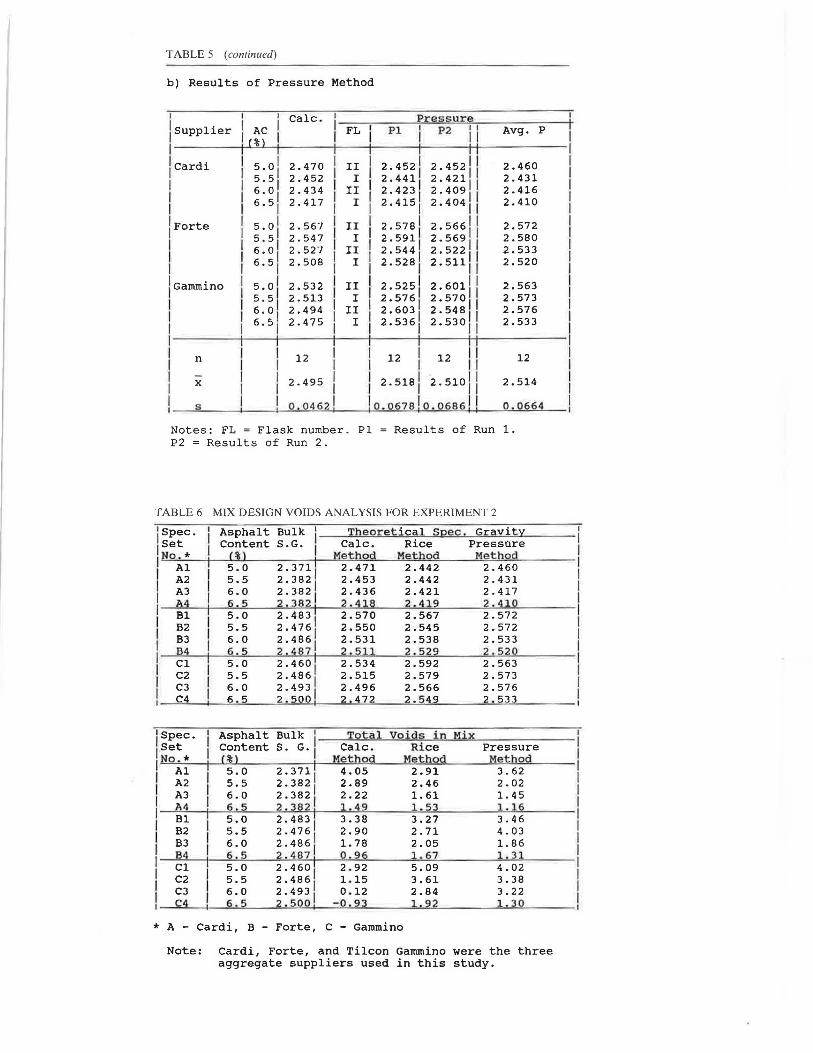
TABLE 5 (continued)
b) Results of Pressure Method
1 1 I Cale. 1 -----~Pwr~. e~s~s=u~r~e=---------t-l Supplier I(~~ I I FL Pl. I P2 i I Avg. P
I l 11 I I ii
11cardi
55 .. 0
5 2.470
1
III 2.4521
2.45211 2.452 2.4411 2.4211 1
2.460 2.431 2.416 2.410
I 6.0 2.434 I II 2.4231 2.409'1 I 6.5 2.417 I I 2.415 1 2.4041
!Forte 5.0 2.567
1
1 III 2.578! 2.566! I I 5. 5 2. 541 2. 591
1 2. 569 I I
I
I 6.0 2.52"/ I II 2.5441 2.52211
2.572 2.580 2.533 2.520 6.5 2.508 I I 2.5281 2.511 1 1
IGammino 5.0 2.532 I II 2.5251 2.6011 I 5.5 2.513 I I 2.5761 2.5701 1
2.563 2.573 2.576 2.533
I 6.0 2.494 I II 2.6031 2.548 I I 6.5 2.475 I I 2.5361 2.53011 1~~~-+-~-4-~~~1~--1-~~~1~~-+-l-·~~~~-
I I I n 12 I I 12 12 I I I I 11
12
2.495 I I 2.518 1 2.510 ' I 0 .04 62 1 lo.0678!0. 068 6! I
x
s
2.514
0.0664
Notes: FL = Flask number. Pl P2 =Results of Run 2.
Results of Run 1.
TABLE 6 MIX DESIGN VOIDS ANALYSIS FOR EXPERIMENT 2
1
1Spec. Set
!No. *
I Al A2 A3
I A4 I Bl I B2 I B3 I B4 I Cl
I C2 C3
I C
Al I A2 I A3
A4
I ~; I B3
B4 jg I
C3 C4
Asphalt Content
% 5.0 5.5 6.0 6.5 5.0 5.5 6.0 6.5 5.0 5.5 6.0 6.5
Bulk 1--T=h,.,_e=o=r"-'e=-t=i=· c=a"-'l._.S~p""e""c,_, • ......,,G~r=a'-"v-=i=t"-"y __ _ S.G. I Cale. Rice Pressure
Method Method Method 2.371 2.471 2.442 2.460 2.382 1 2.453 2.442 2.431 2.382 2.436 2.421 2.417 2.3821 2.418 2.419 2 .4 10 2.483 1 2.570 2.567 2.572 2.476 2.550 2.545 2.572 2.486 2.531 2.538 2 . 533 2 .4 87 2 . 1 2.52 2.520 2.4601 2.534 2.592 2 . 563 2.486 2.515 2.579 2.573 2.493 2.496 2.566 2.576 2.50D 2.472 2.549 2.533
Asphalt Bulk 1 --~T~o~t=a~l_V~o=i~·d~s,,_,i~n_,__..M~i~x.._ _ _ ___ _ Content S. G. I Cale. Rice Pressure
5.0 5.5 6.0 6.5 5.0 5.5 6.0 6.5 5.0 5.5 6.0 6.5
2.371 1 2.382 1 2.3821 2.3821 2.4831 2.476 1 2.4861 2.4871 2.4601 2 . 486 1 2.493 1 2.500
Method Met od Method 4.05 2.91 3.62 2.89 2.46 2.02 2.22 1.61 1.45 1 .4 9 1 .53 1.16 3.38 3.27 3.46 2.90 2.71 4.03 1.78 2.05 1.86 0. 96 l. 67 1. 31 2.92 5.09 4.02 1.15 3.61 3.38 0.12 2.84 3.22
-0.93 1 .9 2 1.30
* A - Cardi, B - Forte, c - Gammino
Note: Cardi, Forte, and Tilcon Gammino were the three aggregate suppliers used in this study.

110 TRANSPORTATION RESEARCH RECORD 1269
TABLE 7 COMPUTATIONS FOR PERFORMANCE ANALYSIS FOR EXPERIMENT 2
1supplier AC I Rl-R2 I Pl-P2 R-P l R-C l P-C l jcardi 5.o l 0.0060 j -0.0150 l -o.0115 j -o.028o j -o.0105 j I 5.5
1 0 . 0160 I 0.0200 I 0.0110
1-0.0100
1-0.0210
1
I 6.o1
0 . 0000 j 0.0140 I 0.00501-0.0130
1-0.0180
I 6.5 1 0.0000 0.0110 I 0.0095 1 0.00201-0.0075
IForte 5.01 0 . 0100 I 0.0120 1-o.0050 ! 0 . 0000 1 0.0050
1
1 I 5.5
1 0.0050 I 0.0220
1-0.0355
1-0.0025
1 o.o33o
I 6.0 ,-0.0260 I 0.0220 I 0.00501
0.0110
1
0.0060
1
I 6.5 - 0 . 0040 I 0.0170 I 0.0095 1 0.0210 0.0115
IGammino 5.0 1-0.0010 I - 0.0760 1-0.02851 0.05951 0.03101 I 5.5 , 0 . 0080 I 0.0060 I 0.0060 1 0.0660 1 0.0600 1 I 6.o -0 . 0080 I 0.0550 -0.0095 0.0120
1 0.0815
1 l 6.51
0 . 0090 I 0.0060 I 0.0155
1
o.0135 I o.os8o
I n I 12 I 12 I 12 I 12 I 12
II ,I 0 . 0013 ' 0 . 0078 ! 0.0019 1 0.0210 0.0191!
Xd I I I I
I
I 11
11
1,
11
11
11
11
11
11
,1
I sd ,
1
0 . 0109 11
0.0309 11
0.016111
0 . 0367 0 . 033611
I u I 0 . 0069 l 0.0196 I 0.0106 1 0 . 0233 0.02131
I r;>ifference I I II I I in I I
1 rerformanc~ No I No I No I No No I I I I I I I ,---------------------------------------------------------1
Note: R indicates results of Rice Method P indicates results of Pressure Method c indicates results of Calculation Method
If :xd/<u, a difference in performance is not indicated.
respectively. The statistical analysis of the results is presented in Tables 10 and 11.
• Precision. T he statistical analysis did not detect any difference in the precision between the two n1 thods or between the four sets of tests, i.e., 2R, 13R, 2A, and 13A (see Table 14 and the Appendix). •Average Value . The difference in the average MTSG
values between the two methods was 0.14 percent. • Standard Deviation. The standard deviation of the MTSG
for the pressure method was greater than that for the Rice method.
• Performance. No significant difference in performance between the two methods (see Table 10) was discernable.
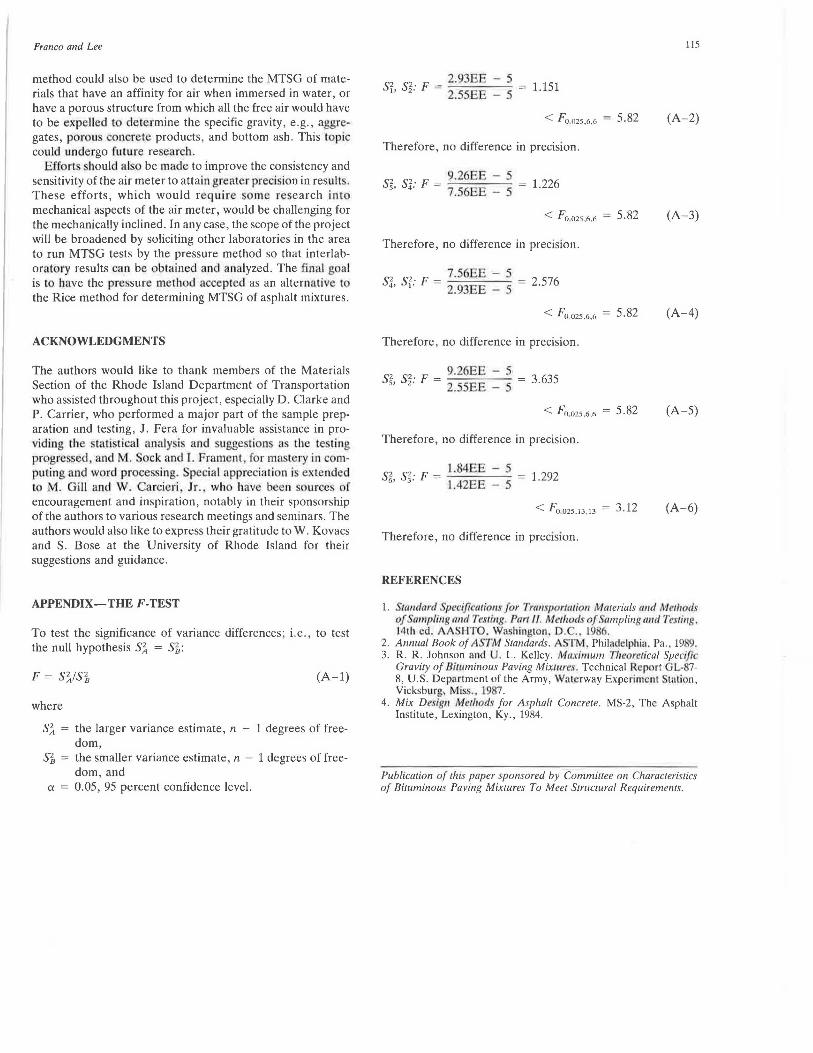
• Precision. The analysis detected a difference in precision between the two methods. Though the Rice method was more precise , the difference was not significant (see Table 11) .
Experiment 3B
Tables 12 and 13 present results of the single-operator precision study for better methods. Further analysis was carried out as follows:
•Average Values. The differences in average MTSG values for samples 2R and 13R were 0.21 and 0.25 percent, respectively .
• Standard Deviation . The standard deviation for the pressure method was greater than for the Rice method.
DISCUSSION OF RESULTS
Comparison for the Time and Performance
The Rice method is simple, but needs a laboratory setup primarily because of the necessity of a vacuum . Relatively easy to perform, the Rice method requires a moderate amount of technique to obtain good consistency. It has a 15-min actual run time for the expulsion of air from the· flask and requires an additional 5 to 10 min to prepare the weighing of the sample and water in the flask. Shoulci the method need to be repeated, 20 to 25 min would be added. Generally , one run of the test after sample preparation takes between 25 and 30 min.
The pressure method requires the use of a calibrated air meter and balance accurate to 0.1 g. This method does not require a laboratory setup and could be easily used in the fie ld, mak ing it a versatile method for comp·uting the MT G of an asphalt mix. I t is r latively ea y to perform and doe. not require much skill , except that care should be taken to ensure that the weights and temperatures are recorded accurately.

Bulk DenaJty - Obe.lcu.ft.) Marshall Stablllty (Iba.) (X 1000)
148.7
148.3
147.9
147.5...,_~~~-~------t 4.8 5.2 5.6 6.0 . 6.4 .
Percent Asphalt
Flow - Unch)
0.14
0.12
0.10 0
0.08....._~ _ __._ ___ _.__, 4.8 5.2 5.8 6.0 . 6.4
Percent Aephalt
V.M.A.
16.2
' I ,. 15.7
15.2 >- ......... ... . ... · ·/~/ ~ D
14. 7.___._....._._ _ _._ _ _.____. 4.8 5.2 5.8 6.0 6.4
Percent Asphalt
2.9 D
2.8
2.7 D
2.6
2.5
2.4 /\ 4.8 5.2 5.6 6.0 . 6.4 .
4.0
3.5
3.0
2.5
2.0
1.5
1.0
Percent Asphalt
'Iii Aw Voids
4.~8_5 ___ 2_5~.6--6~.0--6~.4--'
Percent Asphalt
V.F.A.
88.
83.
78.
73. _~_...._ _ _.___,,....,.._~--t
4.8 5.2 5.6 6.0 6.4 Percent Aephalt
Legend: Rice + - - - - Pressure a - Cale.•--
FIGURE 6 A typical Marshall mix design plot for the Cardi mix for Experiment 2.
TABLE 8 OVERALL PRECISION ANALYSIS FOR THE RICE METHOD FOR EXPERIMENT 3A
Sample l Operator I Date I Flask l Spec~f ic j 1 1 1 Gravity I
--- ~----~--~-----~~~=;~:;;~----~~------;~~~;---1 2 110-31-88 1 r 2.481 I •3 110-31-88 II 2.485 I 4 10-31-881 I 2. 493 I 5 111-01-00 I II 2. 506 I 6 ! 11-01-00 1 r 2.482 I 7 111-01-88 1 II 2.472 I 8 11-02-88 I 2.492 9 111-04-88 II 2.488 I
10 111-04-881 I 2. 496 I 11 2 111-07-881 II 2. 482 I 12 1. 11-07-881 I 2.479 I 13 11-09-88 I 2.389* 14 l 11-09-881 II 2. 499 I 15 11-09-88 I I 2. 489 16 11-10-881 II 2 . 491 I
1 11-10-00 I I 2. 505 ! Note: Samples with 6% asphalt content from Forte
(supplier) were divided into 17 subsamples.
Note: Sample No. 13 is an outlier- Therefore sample No. 13 was not included in computation.

TABLE 9 OVERALL PRECISION ANALYSIS FOR THE PRESSURE METHOD FOR EXPERIMENT 3A
jsamle
1 2 3 4 5 6 7 8 9
10 11 12 13 14 15 16 17
/oper- 1
'ator Date 2
1
10-31-88 10-31-88 11
110-31-88 I 11-01-88 I j 11-01-88 I 11-01-88 1
111-02-88 I 11-02-8s j
111-04-88 111-04-88 1 11-09-88 1
111-09-88 1 '11-09-88 1 I 11-10-88 I I 11-10-88 j 111-10-88 I 11-14- 881 I I
Meter F947 F947 F947 F947 F947 F947 F947 F947 0676 0676 0676 0676 0676 0676 0676 0676 0676
~~~~~ Readinqs 1
2.491 2.449 2.476 2.493 2.509 2.484 2 . 481 2.462 2.487 2.520 2.490 2.510 2.494 2.504 2.481 2.487 2 .4 91
2 I
2.486 2.446 2.475 2.492 2.481 2.482 2.478 2.464 2.489 2.504 2.486 2.500 2 . 488 2.505 2.476 2.483 2 .488
3 2.486 2.450 2 .477 2.485 2.508 2.486 2.475 2.463 2.488 2.505 2.485 2 .511 2.487 2.502 2.480 2.483 2.488
1Avera el 2.488 2.448 2.476 2.490 2.499 2.484 2.478 2.463 2.488 2.510 2.487 2.507 2.490* 2.504 2.479 2.484 2 . 489
Notes: Samples were 6 percent asphalt content from Forte supplies and were divided into 17 subsamples. Sample No. 13 is an outlier. Therefore sample No. 13 was not included in computation.
TABLE 10 COMPUTATIONS FOR PERFORMANCE ANALYSIS FOR EXPERIMENT 3A
' Sam- 1 Rice lple I
n I I
x I I
s I I
u I I
2.492 2.481 2.485 2.493 2.506 2.482 2 .472 2.492 2 . 488 2.496 2.482 2.479 2.389* 2.499 2.489 2.491 2 . 505
16
2.490
0.00930
Pressure
2.488 2.448 2.476 2.490 2.499 2.484 2.478 2.463 2.488 2.510 2.487 2.507 2.490* 2.504 2.479 2.484 2.489
16
2.486
0.0158
-0.004 -0.033 -0.009 -0 . 003 -0.007
0.002 0.006
-0.029 0.000 0.014 0.005 0.028
0.005 -0.010 -0.007 - 0. 016
16
-0.003625
0.01494
0.007959
xd/<u . Therefore, the pressure method does not differ from the Rice Method in performance.
Note 1: Forte sample with 6% binder was divided into 17 subsamples.
Note 2: Sample no. 13 is an outlier. Therefore, sample no. 13 was not included in computation.
Franco and Lee
The size and weight of the air meter with sample plus water (approximately 17 to 18 kg) could be a problem to an perator of slight build . The acwal run time i. approx imately 5 to 7 min , including securi ng the top of the meter ro the bowl, fi ll ing up the petcock with water, wiping the meter dry, pumping up the chamber and setting the needle to the initial pre ·sure line tak ing a reading weighing the meter wi th the ample
TABLE 11 STATISTICAL ANALYSIS RESULTS FOR OVERALL PRECISION FOR EXPERIMENT 3A
I Rice I Pre ssure I
I I I I I I
x I 2 . 49 0 I 2.4 8 6 I I I I I I I
s I 0.00930 I 0.0158 I I I I I
sz ,1 I I
I 8.64EE-5i 2. 49EE-41
F-Test for comparison of variances, a = 0.05
F 2.49EE-4 8.64EE-5
Fa12 ,15 ,15 2.86
2.884
F > F0.025 15 ,15 . Therefore, the F-Test has detected' a dif f e r ence in preci s i on. Pressure Method is less precise than the Rice Method.
113
and water, and noting the temperature of the water. The repeated runs take approximately 4 to 5 min each, and 1he who! experiment can be accomplished in 15 to 20 min. Although this method is faster, it also reduces the potential for procedural error, because no agita tion of the meter is required. (With the Rice method, the flask has to be agitated for 2 min every 15 ± 2 min).
The air meter should be accurately calibrated before beginni ng the experiment; otherwise, the resul ts will be erroneous. For this project the calibration was performed bef re the start of each series of experiments. The pressure method apparatus also is capable of rough handling because there are no delicate components. Hence, it is suitable for field use.
Interpretation of Results
• Performance. The average values of the MTSG obtained by the two methods were in close agreement, inferring that implementation of the pressure method would be a viable alternative . Confirmed by the statistical analysis, there is no significant difference in performance between the two methods.
• Precision. The results and analysis also show that there was no significant difference in precision between the Rice method and the pressure method.
• Sensitivity. Experiment 1 indicated that the Rice method was more sensitive to change in asphalt content than the pressure method; the Rice method results were also more consistent than those of the pressure method.
TABLE 12 SINGLE OPERATOR PRECISION ANALYSIS FOR THE RICE METHOD FOR EXPERIMENT 3B
1oper- I ato r I
2 I I I I I I I
Sam- ' I I
p le I Date IFla s k l
2R 11-10-881 I I 2R !11-15-881 I I 2R 11-15-88 I I 2R 11-16-88 1 I I 2R 111-17-88 II I 2R 11-17-88 1 II I 2R 11-18-88 1 II I I I
13R !11-09-88 1 I I 13R 11-10-88 II 13R 111-15-881 II I 13R 111-15-88 II II
13R 111-16-88 I 13R 111-17-88 IV 13R 111-18-88 IV I 13R 111-10-081 IV I
I I I I I
I l l I I I I I I
! ! I
Specific Grav ity
2.483 2.483 2.486 2.484 2.477 2.476 2.471
2.389* 2.496 2.494 2.498 2.508 2.505 2.502 2.503
~ : ~:~~~42 I s 2
= 2.93EE-5 ::
Omitti ng t h e outlie r value 2.389:
x = 2.501 s = 0.00505 s 2 = 2. 55EE-5
I ncluding t he Value 2. 389 :
-x = 2.487 s = 0.0398 s 2 = 0. 00159
I I
I I
Note: Forte samples 2R and 13R are from a larger sample of RI Class I-1 mixture with 6% binder content.

114 TRANSPORT A T!ON RESEARCH RECORD 1269
TABLE 13 SINGLE OPERATOR PRECISION ANALYSIS FOR THE PRESSURE METHOD FOR EXPERIMENT 3B
I i oper-i Sam- i Readina a t o r le I Date Me t er i I 2 I 3
I 1
I 2A 11-14-88 0676 ,2.478 2.477,2.475 2A 111-17-88 F947 2A 111-18-88 1 F947
,2.468 , 2.471 2.469
I I 2A 111-21-88 1 F947 ,2.48512.480 , 2.488 1
I I 2A '11-22-88 F947 12.477,2.476,2.478 1
I I 2A I 11- 22 - 88 F947 , 2.488 2.486,2.4841
I I 2 111-23-881 f 9 47 , 2.46912.470,2.463
I I , 2 . 462 , 2 . 462,2 . 46 41
I I I
13A 11-09-88 0676 ,2.494 12.48812.487 1 2.490 13A 11-17-88 F947 2.503
I I 13A 11-18-88 F947 , 2.506 2.504 2.5001
2.492 I 13A 11-21-88 F947
,2.493,2.492,2.4911 2.508
I I 11-21-88 I 12.510
12.508
12.506
1 13A F947 ,2.49412.498,2.493 1 2.495 13A 11-22-88 F947 2.478
I 13A 111-23 - 88 F9 47 , 2.473 2.482,2.4801
2 . 4 6 I 2.4 6 2.497 .4
Note: Forte sample 2R, 13R are from a larger sample of RI Class I-1 mixture with 6% binder content.
Note: Sample x 1 s s 1
---====---if------=----i1- -=-----+--=--- '1
2A
13A
2A + 13A
TABLE 14 ANALYSIS FOR SINGLE OPERATOR PRECISION FOR EXPERIMENT 3B
2 .475
2. 495
2 . 485
j ~~~~-.,.~-"'R=i=c=e~~M=e=t~h=o=d'---~-.,.-.,.~~-.,.---1- 'I 1 ' Repeat 1
I I I 2 ,1 ,1
1
o er~tor Sam le Runs x s
1 2R 7 2.480
1 2.93EE-511 1
I Flasks: I 13R 7 12.501
1 2.55EE-5l2I
II . II . IV ,2R+13R 14 ,2 . 49 0 l . 42EE- 4,31
1 Pressure Method I 1Repeatj lo e r a t or Sa lei Runs
2 2A 7 I Meters: I 13A 7 l o67 6 . F947 ! 2A+l3 A 14
, 2.4751 ,2.49511 , 2.4851 ,
I I
I I I I
6 2 I I 7.56EE-5 14 1
9.26EE-5l5 I 1. 84EE-4 I 6 !
Suggested Improvements for the Apparalus uf lh~ Pressure Method
Some improvements for the apparatus of the pressure method are as follows:
1. The air meter is a cumbersome piece of equipment weighing approximately 8.3 kg empty and approximately 17.5 kg filled. Reducing its size and weight would allow smaller samples to be taken and decrease the physical strain on the operator, making the testing effort much easier.
I I I I I 1o.00864I 7 . 56ee-5
1 I I I I I I 1o.00962 I 9 . 26ee-s
1
10. 136 I l. 84ee- 4l
2. The air meter dial has a logarithmic scale running from 0 to 100 percent. In this experiment, the air percentage readings were in the range of 0 to 2 percent. It would be an improvement if the range of the air meter could be reduced to 0 to 5 percent , and spread out over the present scale. The intermediate graduations could also be given to the nearest 0.01 percent, which would increase the accuracy of the reading. Interpolation was used to determine the air percentage to the nearest 0.01 percent. This process is difficult because it is more natural to interpolate arithmetically than logarithmically.
3. The pressure-sensing mechanism consists of a curved, hollow tube connected to the air chamber at the open end , which deflects under change of pressure in the chamber. At the closed end, a ratchet system is connected to the spring dial, which then reads the air percentage in the chamber on a logarithmic scale. In order to obtain more consistent and precise readings , mechanical improvements to this system should be further investigated.
CONCLUSIONS AND RECOMMENDATIONS
The pressure method is a viable tool for the determination of the MTSG of asphalt mixture . With the current apparatus, the pressure method would be appropriate for use in the Marshall mix design procedures, acceptance testing, and as a rapid test method in the field. For research and where sophisticated evaluation of the MTSG of an asphalt mixture is desired, the Rice method could be used concurrently. The pressure
Franco and Lee
method could also be used to determine the MTSG of materials that have an affinity for air when immersed in water, or have a porous structure from which all the free air would have to be expelled to dete rmine the specific gravity, e.g., aggregates, porous concrete products, and bottom ash. This topic could undergo future re earch.
Efforts should al be made to improve the consistency and sensitivity of the air meter to attain greater precision in results. These efforts, which would requ ire s me research into mechanical aspects of the air meter, would be challenging for the mechanically inclined. In any case, the scope of the project will be broadened by soliciting other laboratories in the area to run MTSG tests by the pressure method so that interlaboratory results can be obtained and analyzed. The fi nal goa l is to have the pressure method accepted as an alte rna tive to the Rice method for determining MTSG of asphalt mixtures.
ACKNOWLEDGMENTS
The authors would like to thank members of the Materials Section of the Rhode Island Department of Transportation who assisted throughout this project, especially D. Clarke and P. Carrier, who performed a major part of the sample preparation and testing, J. Fera for invaluable assistance in providing the statistical analysis and ugge tion as the testing progressed , and M. Sock and I. Frament , for mastery in computing and word processi11g. pecial appreciation i · extended to M. Gill and W. a rcieri, Jr. who have been ·ources of encouragement and inspiration, notably in their sponsorship of the authors to various research meetings and seminars. The authors would also like to express their gratitude to W. Kovacs and S. Bose at the University of Rhode Island for their suggestions and guidance.
APPENDIX-THE F-TEST
To test the significance of variance differences; i.e ., to test the null hypothesis S~ = S1:
(A-1)
where
S~ = the larger variance estimate, n - 1 degrees of freedom,
S1 = the smaller variance estimate, n - 1 degrees of freedom, and
a = 0.05, 95 percent confidence level.
115
2.93EE - 5 S?, sr F = 2.55EE - 5 1.151
< Foo25.6.6 5.82 (A-2)
Therefore, no difference in precision .
9.26EE - 5 S~, S~: F = 7 .56EE - 5 1.226
< Fa 025.6 ,6 5.82 (A-3)
Therefore, no difference in precision.
7.56EE - 5 si, Si: F = 2.93E . _ 5 = 2.576
< Fo.oi5.6,6 5.82 (A-4)
Therefore, no difference in precision .
52 52 . F = 9.26EE - 5 5
' 2
· 2.55EE - 5 3.635
< Fo.025.6,6 5.82 (A-5)
Therefore, no difference in precision .
S2 52. - l.84EE - 5 29 6' 3 · F - l.42EE - 5 1. 2
< Foo25.JJ.1J = 3.12 (A-6)
Therefore, no difference in precision.
REFERENCES
1. umdard Speciflcarions for Tmn port111io11 Mmerials mu/ 1\!/erllod. of 'ampling and Testing. Part If. Methods of nmpling and Tming, l4th ed. AASHTO. W;1shing1on, D . .. 1986.
2. Annual Book of ASTM Slandards. A TM. Philadelphia, Pa., 1989. 3. R. R . Johnson and U. L. Kelley. Maximum Theoretical Specific
Gravity of Biwminous Paving Mixtures . Technical Report GL-87-8, U.S. Department of the Army, Wutcrway Experiment Stnlion, Vicksburg Miss. , 1987.
4. Mix Design Method for Asphalt Concrele. MS-2, The Asphalt Institute, Lexington, Ky., 1984.
Publicalion of this paper sponsored by Cammi/lee on Characrerisrics of Bituminous Paving Mixtures To Meet S1ructural Requirements.