Development of the Controlled Atmosphere Cone Calorimeter ...
13
This is a repository copy of Development of the Controlled Atmosphere Cone Calorimeter to Simulate Compartment Fires. White Rose Research Online URL for this paper: http://eprints.whiterose.ac.uk/157370/ Version: Published Version Proceedings Paper: Irshad, A, Andrews, GE, Phylaktou, H orcid.org/0000-0001-9554-4171 et al. (1 more author) (2019) Development of the Controlled Atmosphere Cone Calorimeter to Simulate Compartment Fires. In: Proceedings of the Ninth International Seminar on Fire and Explosion Hazards. Vol. 2. Ninth International Seminar on Fire and Explosion Hazards, 21-26 Apr 2019, St Petersburg, Russia. Saint-Petersburg Polytechnic University Press , pp. 1066-1077. ISBN 978-5-7422-6498-9 10.18720/spbpu/2/k19-90 Protected by copyright. Uploaded in accordance with the publisher's self-archiving policy. [email protected] https://eprints.whiterose.ac.uk/ Reuse Items deposited in White Rose Research Online are protected by copyright, with all rights reserved unless indicated otherwise. They may be downloaded and/or printed for private study, or other acts as permitted by national copyright laws. The publisher or other rights holders may allow further reproduction and re-use of the full text version. This is indicated by the licence information on the White Rose Research Online record for the item. Takedown If you consider content in White Rose Research Online to be in breach of UK law, please notify us by emailing [email protected] including the URL of the record and the reason for the withdrawal request.
Transcript of Development of the Controlled Atmosphere Cone Calorimeter ...
This is a repository copy of Development of the Controlled Atmosphere Cone Calorimeter to Simulate Compartment Fires.
White Rose Research Online URL for this paper:http://eprints.whiterose.ac.uk/157370/
Version: Published Version
Proceedings Paper:Irshad, A, Andrews, GE, Phylaktou, H orcid.org/0000-0001-9554-4171 et al. (1 more author) (2019) Development of the Controlled Atmosphere Cone Calorimeter to Simulate Compartment Fires. In: Proceedings of the Ninth International Seminar on Fire and Explosion Hazards. Vol. 2. Ninth International Seminar on Fire and Explosion Hazards, 21-26 Apr 2019, St Petersburg, Russia. Saint-Petersburg Polytechnic University Press , pp. 1066-1077. ISBN 978-5-7422-6498-9
10.18720/spbpu/2/k19-90
Protected by copyright. Uploaded in accordance with the publisher's self-archiving policy.
[email protected]://eprints.whiterose.ac.uk/
Reuse Items deposited in White Rose Research Online are protected by copyright, with all rights reserved unless indicated otherwise. They may be downloaded and/or printed for private study, or other acts as permitted by national copyright laws. The publisher or other rights holders may allow further reproduction and re-use of the full text version. This is indicated by the licence information on the White Rose Research Online record for the item.
Takedown If you consider content in White Rose Research Online to be in breach of UK law, please notify us by emailing [email protected] including the URL of the record and the reason for the withdrawal request.

Proceedings of the Ninth International Seminar on Fire and Explosion Hazards (ISFEH9), pp. 1066-1077
Edited by Snegirev A., Liu N.A., Tamanini F., Bradley D., Molkov V., and Chaumeix N.
Published by Saint-Petersburg Polytechnic University Press
ISBN: 978-5-7422-6498-9 DOI: 10.18720/spbpu/2/k19-90
1066
Development of the Controlled Atmosphere Cone Calorimeter to
Simulate Compartment Fires
Irshad A.1, Andrews G.E.
2, *, Phylaktou H.N.
2, Gibbs B.M.
2
1 University of Engineering & Technology, Lahore, Pakistan
2 University of Leeds, School of Chemical and Process Engineering, Leeds, West Yorkshire, UK
*Corresponding author’s email: [email protected]
ABSTRACT
The cone calorimeter with the controlled atmosphere compartment was used to control the fire air ventilation and to simulate the behaviour of materials in compartment fires, with rich burning under post flashover conditions. The standard cone calorimeter with controlled atmosphere design has to be improved, by compartment wall insulation, to reduce heat losses which reduced the fire temperature. Heat losses from the test section to the water cooled load cell were shown to be significant and the test specimen was insultated from the support. A chimney was added to the cone outlet to enable the measurement of the mean composition of the raw discharge gases. A method was developed for determining the mean gas sample and to prevent back flow of external air. This improved design was used to create under ventilated fires with pine wood where the equivalence ratio was controlled by the air flow into the compartment. These modified procedures for the cone calorimeter greatly extend its usefulness in material testing to conditions close to those encountered in post flashover compartment fires.
KEYWORDS: Compartment fire, cone calorimeter, ventilation, toxicity.
INTRODUCTION
The testing of fire materials for heat release rate (HRR) and visible smoke production has used the freely ventilated cone calorimeter for many years [1, 2]. The development of the cone calorimeter to simulate a compartment fire is detailed in this paper, using the controlled atmosphere version of the cone calorimeter [2, 3], coupled with direct sampling of the exit gases from the fire to determine fire raw gas toxic gas emissions. The controlled atmosphere modification to the cone calorimeter involves enclosing the fire test section in an air sealed box with the air for combustion controlled so that the fire equivalence ratio can be controlled. Originally, the controlled atmosphere calorimeter was developed for combustion testing in the vitiated atmosphere that occurs in the later stages of fires [3]. However, the equipment can equally well be used to simulate ventilation controlled fires by metering the air flow to the fire compartment and this equipment as used in the present work is shown in Fig. 1. This paper follows the development of the equipment for the primary HRR (PHRR) measurement and toxic gas emissions. Three major problems have to be solved:
1. Heat losses to the compartment walls that reduced the fire temperature; 2. Heat losses from the sample holder downward to the water cooled load cell; 3. Oxygen back flow down the chimney so that the raw mixture appeared to be lean when a
metered rich burning condition had been set up with the air flow control; 4. Obtaining a mean gas sample at the chimney outlet, as the chimney gases were not well mixed.

Part 6. Material Behavior in Fires
1067
Stec and Hull [3] have claimed that the cone calorimeter is an unrealistic test method for toxic gas analysis as it uses diluted samples where post fire oxidation of the primary fire products from the cone could occur. However, there is a criticism that could be made of all current fire behaviour material testing techniques, all of which dilute the sample with entrained air to avoid water
Fig. 1. Cone calorimeter with the controlled atmosphere campartment around the test section.
condensation of the fire product gases if cold gas sampling is used. This includes the furnace test method for toxic gas measurements that Stec and Hull favour [3]. Dilution of the fire products gases can be avoided if heated gas sampling systems are used and heating toxic gas analysers are used so that no dilution is necessary as the water vapour is kept in the gas phase in the hot sample and no post fire oxidation of the fire products can occur [4]. To achieve direct raw gas analysis of the products of the cone calorimeter test specimen fire a chimney was fitted to the cone heater outlet and the hot discharge gases from the primary combustion was sampled directly [4] with heated sample lines, filters and pumps.
The controlled atmosphere fire compartment with oxygen analysis in the discharge gases can be used to determine the PHRR with the main cone calorimeter determining the total HRR (THRR). This enables any secondary oxidation outside the compartment fire to be determined, so that the concerns of Stec and Hull [3] in regard to post primary fire oxidation can be quantified. The key problem areas that have to be solved were: how to obtain a mean gas sample, with no external air dilution, at the exit from the cone heater; how to minimise the heat losses so that the temperature of the fire was not unrealistically low; how to determine the PHRR from the raw undiluted hot gases from the cone and how to keep the load cell from overheating.
EXPERIMENTAL EQUIPMENT
The cone calorimeter that was used is shown in Fig. 1. It had a sealed enclosure box around the test specimen. This was a 38 cm deep, 30 cm wide and 33 cm high air sealed box. This enclosure box had a opening sealed door with a glass window for observation of the fire flame throughout the test. This box had a metered air flow, using a variable area flowmeter, so that the equivalence ratio, Ø, of the fire could be controlled. The test fire load was supported on a load cell that determined the mass burning rate. The load cell was calibrated using reference weights before and after each test and was stable. The load cell was water cooled using a water cooled insert plate that was not fully effective.

Proceedings of the Ninth International Seminar on Fire and Explosion Hazards (ISFEH9)
1068
There was a consistent problem of overheating the load cell during tests and the load cell ceased to operate if overheated. This load cell problem was caused by conduction of heat from the test fire down the support stem to the load cell and this showed that the fire temperature was lowered by this downward heat loss from the base of the material being tested.
The fire load was five sticks of pine construction wood with 20mm side square cross section, 100mm long placed in the 100mm square test section of the cone calorimeter, Only the top surface of the specimen was exposed to the cone radiation and air was only available at that surface. Type K mineral insulated thermocouples 2 mm below the wood surface were used to determine the temperature of the wood. Primary air was supplied to the compartment from two pipes in the bottom of the compartment. The air flow has been expressed in the results as flow per surface area of the test specimen, g/(m2s). The sample was exposed to the conical heating of the cone calorimeter at 50 and 70 kW/m2. It was found that 70 kW/m2 resulted in the load cell overheating and this indicates that there were significant heat losses through the supporting metal rod to the water cooled load cell enclosure. At 50 kW/m2 there were reduced problems with load cell overheating.
To determine the heat release and toxic gases from the restricted ventilation cone calorimeter a 75 mm internal diameter chimney 210 mm high was added to the discharge from the central 80 mm hole in the cone heater outlet. Obtaining a mean gas sample from the chimney was problematic and the development of a reliable method is discussed in this paper. The hot raw gas sample from the chimney was pumped via a PTFE tube inside a heated sample line to a heated filter and pump assembly and then via a further heated line to a heated Gasmet CR-series FTIR spectrometer. The temperature of the heated filter, pump, and heated line to and from the pump was maintained at 180 oC to keep the volatiles in the gas phase, so that the composition of the gas was determined correctly with no sample system losses of hydrocarbons [4].
The Gasmet CR 2000 FTIR was a purpose built portable multicomponent gas analyser that has UK Environmental Agency MCERT approval for legislated flue gas composition measurements. It was calibrated by the manufacturer for 60 gaseous species. This FTIR has been used for in vehicle real world exhaust gas measurement as well as in large scale compartment fires [4-6]. This analyzer uses a liquid nitrogen cooled MCT (mercury-cadmium telluride) spectrometer detector that enables the resolution of 8 or 4 cm-1 and gives 0.3 – 2 ppm minimum detection limits, depending on the gas. As it is fully heated it measures the total water vapour present in the sample and this is used to convert the dry oxygen measurement in the chimney gases to a wet concentration prior to the oxygen consumption calorimetry calculation of HRR. The oxygen analyser was a Servomex paramagnetic oxygen analyser and this was placed in the outlet of the hot FTIR with an ice bath water condenser followed by a silica gel water vapour absorber to dry the sample prior to oxygen analysis. The recorded FTIR sample spectra were analysed using Gasmet Calcmet software. Calcmet can analyse the sample for more than 50 components. However, it is not recommended to analyse more than 50 components at one time for the best accuracy of analysis. The analysis was based on detemining the most important gases present and then optimising the calibration for these gases. H2 is not absorbed by infrared and cannot be detected by FTIR. It was calculated from the water gas shift reaction, as in equilibrium with the CO measurements.
RESULTS AND DISCUSSION
The initial fire tests showed a number of problems, as summarised in the Introduction. Firstly, the heat losses from the metal compartment walls were significant and if a small scale test was to be representative of a compartment fire it should not have excessive heat losses so that the fire temperature was too low. The conditions inside the compartment should be as adiabatic as possible. Modifications to the base equipment were applied step by step, by identifying the possible reasons

Part 6. Material Behavior in Fires
1069
for the problems and then developing solutions. Tests were performed in the following development order.
Configuration 1: the compartment in its original baseline state with the chimney on the top of the cone heater outlet from the compartment for raw hot gas sampling using a single-hole probe.
Configuration 2: insulation of the enclosure box walls and door using 20mm thick ceramic fibre board.
Configuration 3 used 20mm thick ceramic fibre insulating board below the fire test material to reduce conduction heat losses down the metal support rod to the water cooled load cell. A thicker wood sample (40mm) was also shown to achieve the same effect, as the extra wood thickness acted as an insulation for the surface fire above it.
Configuration 4 used a grid plate type restrictor to prevent backflow of air into the chimney.
Configuration 5 added a mean multi-hole gas sampler to achieve a reliable mean composition from the primary compartment fire. Several designs were investigated relative to the base line single hole.
The final design with all the above changes incorporated was used to investigate the toxic emissions from rich combustion for pine wood fires.
Configuration 1: initial setup results
The original configuration had metal compartment walls and a single point gas sample probe in the chimney. The maximum possible HRR based on the air flow was the air flow in g/(m2s) times the heat release per mass of air, which is 3.05 MJ/kgair, or 13 MJ/kg of oxygen. The metered air to fuel flow ratio by mass, A/F, for the pine wood samples were determined from the measured constant air flow and the measured rate of mass consumption of the biomass. This was then converted to a metered equivalence ratio, Øm, using the stoichiometric A/F for the pine wood of 5.7 on a dry ash free basis (daf). This metered equivalence ratio, Øm, is shown as a function of time in Fig. 2a & b for a range of air flows and for 20mm thick pine wood (a) and 40mm (b). Fig. 2 shows that the aim of this work, to create controlled rich burning conditions, was achieved. Fig. 2a also shows that changing the air flow for pine at 50 kW/m2 radiant heat flux decreased the Øm from about 2.5 at the lowest air flow to 1.3 at the highest air flow. Fig. 2a also shows for 9 g/m2s and 70kW/m2 that Øm was richer for Ash than for pine and this was due to the different stoichiometric A/F for Ash (6.0 daf) and its lower volatile content. All the results in Fig.2 show that there was an initial fast mass burn rate followed by a steady state burner phase between about 200 – 600s and the average mass burn rate, HRR and toxic emissions over this period were used in the later plots as a function of Øm. In the later stage of the fire there was a char burn out phase that had a much lower mass loss rate.
Fig. 2. Metered equivalence ratio (Øm) for tests with (a) 20 mm thick wood load (5 sticks) (b) 40 mm thick
wood load (10 sticks, 2 layers of 5 sticks) at 12.8 g/(m2·s).

Proceedings of the Ninth International Seminar on Fire and Explosion Hazards (ISFEH9)
1070
Figure 2b shows that for the 40 mm thick pine the influence of the radiant heating (50 to 70 kW/m2) was significant at constant air flow, with richer mixtures due to more volatile release at the higher temperatures associated with high radiant flux. Comparison of the influence of the pine wood thickness in Fig. 2a shows that, for 40 and 20 mm wood thickness at 50 kW, with the same air flow of 12.8 g/(m2·s), the steady state portion of the fire between 500 and 1000s Øm was 3 for 40 mm pine wood and Ø = 2 for 20 mm thick pinewood. This shows more volatiles were released for the thicker wall giving richer overall mixtures. The thicker wood self insulates the top surface so that there are lower heat losses with the 40 mm wood thickness. This was why ceramic fibre board was used as an insulation to reduce downward heat transfer to the water cooled the load cell and the effect was the same as using thicker pine.
Fig. 3. Equivalence ratio Øe by carbon balance for tests with 20 mm thick wood load.
Fig. 4. % CO from primary burning zone for 20 mm thick wood load (a) 70 kW/m2 (b) 50 kW/m2.
Fig. 5. (a) % CO from primary burning zone for 40 mm thick wood load at air flow 12.8 g/(m2·s);
(b) THC emissions during gasification of 5 wood sticks at heat flux 70 kW/m2.

Part 6. Material Behavior in Fires
1071
Figure 3 shows the single tube chimney emissions based (carbon balance) equivalence ratio, Øe, for the tests with 20 mm thick wood load. This shows that all the tests were lean in the steady state flame combustion phase, except for pine wood after 600 s at 70 kW/m2. So it was concluded that in spite of the fact that box was provided with the limited air flow that should have provided rich combustion, as shown in Fig. 3, actual conditions appeared to be lean inside the compartment. However, this could be due to the single point gas sampling probe not giving a mean gas sample and this problem is addressed later. However, the very large difference between Fig. 2 and Fig. 3 shows that the task of getting a mean gas sample was essential in the development of this method.
The CO concentration, in the raw single point sample from the outlet from the rich burning zone, is shown in Fig 4. It can be seen in Fig. 4a that in all tests with a heat flux of 70 kW/m2, the peak CO emissions occurred during the first stage of combustion, when the mixture was richer, as shown in Fig. 2a. In the 500 – 1000 s steady state combustion period the CO was higher (1%) for the 70 kW/m2 radiant heating than the 50 kW/m2 heating (0.5%), because the mixture was richer. In the 70 kW/m2 tests with an air flow of 9 g/(m2·s) CO increased due to the richer mixtures, as shown in Fig. 2. In tests with a heat flux of 50 kW/m2 Fig. 4b shows that CO was reduced to less than 1% for the steady state fire, with almost 0% with an airflow 25.6 g/(m2·s). This was due to the leaner mixtures shown in Fig. 2a as the air flow was increased. For 40 mm thick wood the CO was higher in the test with heat flux 70 kW/m2, as shown in Fig 5a due to the richer mixture shown in Fig. 2b. The very high hydrocarbon emissions in Fig. 5b indicate conditions were far from adiabatic equilibrium as THC should be zero at equilibrium.
Configuration 2: Tests with insulation of the box and test sample of cone calorimeter
The top surface and the door of the compartment was insulated from the outside, while the rest of the compartment was insulated from the inside. The compartment wall insulation was 25 mm thick superwool insulation board. After insulation, the internal dimensions of the compartment were 330 mm long, 275 mm wide and 305 mm high. Tests were conducted at 50 kW/m2 with an air flow of 12.8 g/m2s to compare with previous test without insulation. It was found that the average value of mass loss rate was increased from 0.05 to 0.075 g/s, and the average metered Øm from 2.5 to 3.5 after the insulation of the box.
Figure 6a shows that the oxygen levels were reduced with wall insulation as a result of the richer combustion, which was also found for Øe as shown in Fig. 6b. The leaner Øe after 1000s and the related increase in oxygen was due to the end of flaming combustion and the onset of char combustion at a much lower HRR. The residual O2 with rich combustion was due to the combustion inefficiency. However, it was considered that the main problem was that the single hole gas sample tube was not obtaining a mean gas sample.
Fig. 6 Heat flux 50 kW/m2, air flow 12.8 g/(m2·s): (a) O2 % vol. vs time; (b) Øe vs time.

Proceedings of the Ninth International Seminar on Fire and Explosion Hazards (ISFEH9)
1072
The impact of insulating the controlled atmosphere volume walls was to increase the CO and THC emissions due to the richer mixtures, as shown in Fig. 7.
The reduction of heat losses by insulating the compartment should have increased the temperature of combustion. This was investigated using thermocouples inserted 2mm from top and bottom surfaces in the 40mm thick wood load with air flow 12.8 g/(m2.s) at 70 kWm2. Comparison was made for wood temperatures with and without the insulated compartment. Fig 8a shows that the compartment insulation increased the top thermocouple temperature by about 50oC. The emissions of CO are shown in Fig 8b which shows that the CO was higher with insulation of the compartment due to the richer mixtures. At 600s only the top wood layer was partly burned and the bottom layer was not touched by the fire and acted as an insulating layer to the top 20mm wood.
Fig. 7. Heat flux 50 kW/m2, air flow 12.8 g/(m2·s): (a) CO % vol. vs time; (b) THC % vol. vs time.
Fig. 8. (a) Comparison of temperature vs time for 40 mm thick pine wood (2 layers of 5 sticks) 5mm from top surface with and without insulation at 70 kW/m2 airflow 12.8 g/(m2.s) (b) Comparison of % CO with different
testing configurations including insulation of box and 20mm thick insulation under pine layer.
Configuration 3: Insulation of the fire load to reduce heat losses to the load cell support
In order to check this explanation another experiment was performed at same conditions of heat flux and air flow (insulated box, 70 kW/m2, 12.8 g/ (m2.s) with 5 pine wood sticks with an insulation of superwool board 20mm thick under the 20mm thick wood so that the total bed thickness was 40mm. The CO emissions are shown in Fig 8b and in the steady burning phase were higher than the test of 10 pine sticks (2 layers of 5 sticks, insulated box). This indicated richer mixtures due to the reduced heat losses from the test specimen to the load cell. This shows that test specimens should be insulated underneath in the cone calorimeter.
Configuration 4: Variation of gas sampling techniques to obtain better mixed products
The gas sampling for all the above tests used a single hole probe inserted into the centreline of the chimney 60 mm above the chimney inlet. Initial work with this simple gas sampling system had two problems: the carbon balance did not give the same Ø as that metered and was much leaner, as

Part 6. Material Behavior in Fires
1073
shown above by comparing Figs. 2a and 3. Part of this problem was that oxygen was present in the sample when rich mixture combustion was used and the combustion efficiency (CO and THC emissions energy content) was relatively low, whereas it should have been high for rich mixtures. The analysis assumed that the fire product gases were mixed after flowing through the cone heater and into the chimney. It also assumed that no air from outside the chimney could be entrained back into the chimney to dilute the product gases and oxidise some of them. Both of these assumptions were incorrect. Part of the oxygen entrainment problem was that the FTIR sample flow rate was 4 lpm which was significant relative to the compartment air flow, which at its lowest was only 6 lpm.
The problems were inter-related: there was significant oxygen in the gas sample and the sample was not mixed, as moving the one tube sample probe changed the sample composition. The solution to these problems was separate and the first to be dealt with was the issue of getting a better mean gas sample. This was done first as the oxygen problem could have been contributed to by unmixedness. All the initial tests were to improve the gas sample as a measure of the mean composition and the problem of the oxygen dilution by reverse suction by the gas sample probe was investigated last. In retrospect it would have been better to investigate the entrainment of air from the chimney exit first as this was found to be the dominant problem.
The following tests were carried out in addition to the tests performed with the original single hole probe .
1. Traverse of a single hole sample tube. 2. Traverse of the single hole sample tube with a grid plate mixer at the entry to the chimney. 3. Four hole sample probe with grid plate mixer at the entry to the chimney. 4. 76mm diameter 20 hole ‘X’ probe at the bottom of the chimney and no inlet grid plate. The
20 hole gas sampler was mounted in its own supporting wall and flanges to connected to the chimney and this added 48mm to the total chimney length which increased to 258mm.
5. A chimney exit backpressure grid plate was added with 90% blockage and the 20 hole ‘X’ gas sample probe was located at the bottom of the chimney. This immediately cured the problem and sensible gas analysis results were achieved.
All the above tests were performed with the insulated compartment and 20mm insulation below the test fuel at an air flow 9 g/(m2.s) and a heat flux of 70 kW/m2.
An attempt to improve the mixing in the chimney was made by placing a four hole grid plate at the base of the chimney, to generate flow turbulence and mixing. Radial single point traverses were carried out with this configuration. A single hole gas sampling probe was traversed across the chimney starting from the wall of the chimney. The traverses were carried out during the near steady state combustion period between 300 and 800s, as shown in Figs. 1-3. The probe was held for 45-50 s at each location. The % CO and the emission based equivalence ratio Øe by carbon balance is shown as a function of radial distance for single hole probe in Fig 9. This shows that the chimney was not well mixed and was rich in the centre and lean at the chimney wall.
Fig. 9. Traverse with single hole orifice plate with and without mixing orifice plate (a) Emission based Øe vs
distance (b) % CO vs distance.

Proceedings of the Ninth International Seminar on Fire and Explosion Hazards (ISFEH9)
1074
All the methods to achieve a better mixed sample are compared in Figs. 10 and 11. They will not be discussed in detail as only configuration 5 achieved better mixing. The four hole sample probe was also equally ineffective. All this was because the main problem was air being drawn from the chimney exit into the chimney and promoting oxidation of the gases from the rich fire combustion, which was why the CO and THC emissions were lower than expected for rich mixtures and why the equivalence ratio based on carbon balance was so much lower than that metered in Figs. 2 and 3. Using a 20 hole mean gas sampler on its own at the base of the chimney was also equally ineffective, with very high oxygen levels. This was due to the static pressure drop across the X probe causing the static pressure in the chimney to fall and more air to be entrained into the chimney.
Fig. 10. Tests with different gas sampling methods at heat flux 70 kW/m2, air flow 9 g/(m2·s): (a) emission
based Øe vs time; (b) CO % vol. vs time.
Fig. 11. Tests with different gas sampling methods at heat flux 70 kW/m2, air flow 9 g/(m2·s): (a) THC vs time; (b) O2 % vol. vs time.
To prove that air entrainment from the exhaust chimney was the problem, tests were carried out with N2 at the same flow rate as the air. The standard single hole gas sample probe was used. It was found that even at high flow rates of nitrogen, the O2 analyser downstream of FTIR was reading 10% O2. This showed that air was entering the sampling system from the exit of the chimney. To prevent this, a grid plate with 90% restriction of the total chimney exit area was placed at the chimney exit. This 90% chimney exit blockage was found as the minimum required to achieve 0% oxygen when the metered equivalence ratio was very rich. This ensured that the static pressure in the chimney was always greater than atmospheric pressure, so that back flow of air into the chimney was prevented. The O2 analyser read zero with nitrogen as the compartment flow and was zero after the initial fire at 150 s in Fig. 11b. The results in Figs. 10 and 11 show that the next best gas sampling system was the original single hole probe 60 mm above the cone outlet. Essentially the
Part 6. Material Behavior in Fires
1075
other gas sample probes had been located further up the chimney and so encountered more external air entrained into the chimney.
Fig 10a shows that the impact of the chimney exit grid plate was to make the mean mixture much richer, as there was now no backflow of air. By co-incidence the mean mixture was close to that for the central single hole sampling probe without an exit plane orifice. The CO and THC were high and the oxygen near zero after 150 s, all as expected for rich mixtures. However, there was still a big difference between the metered equivalence ratio in Fig. 2 and that by carbon balance in Fig. 10a. For example in Fig 10a at 9 g/(m2· s) and 70 kW/m2 Ø was 1.9 at 300 s using the developed 20 hole gas sampler with 90% blockage grid plate at the end of the chimney. In Fig. 2a at the same test conditions Ø was 4.5, much richer that that based on carbon balance. The problem was due to the use of the stoichiometric A/F of pine for the equivalence ratio definition. However, there is no such gas with the composition of wood and the equivalence ratio should be based on the stoichiometry of the gases evolved at a particular time in the fire. In related work nitrogen flows have been used instead of air with the radiant heater on, to determine the composition of the volatiles as a function of time. This will enable the actual gas equivalence ratio to be determined.
Performance of the developed system for compartment fires using the cone calorimeter
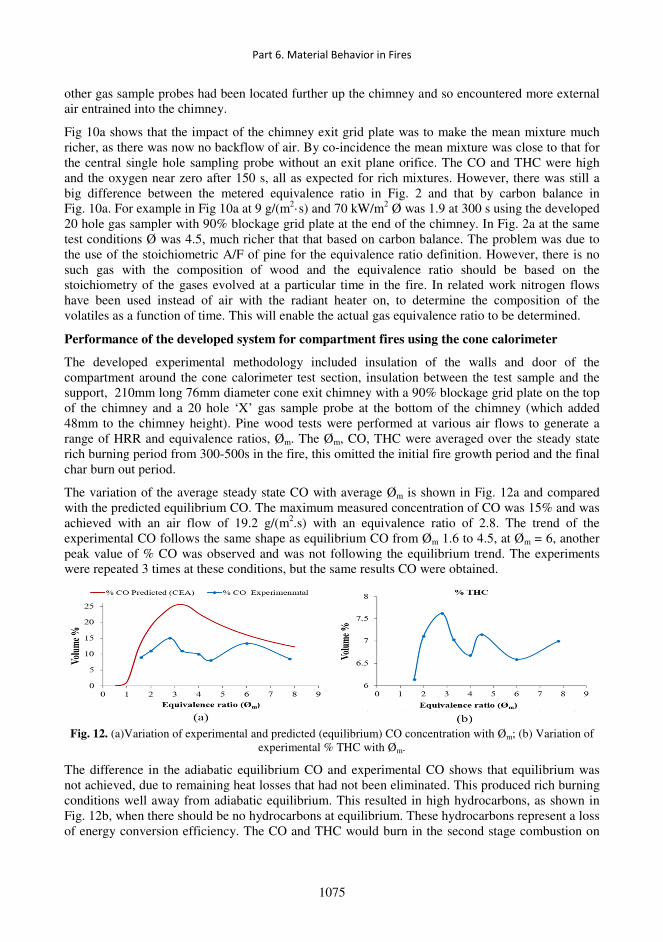
The developed experimental methodology included insulation of the walls and door of the compartment around the cone calorimeter test section, insulation between the test sample and the support, 210mm long 76mm diameter cone exit chimney with a 90% blockage grid plate on the top of the chimney and a 20 hole ‘X’ gas sample probe at the bottom of the chimney (which added 48mm to the chimney height). Pine wood tests were performed at various air flows to generate a range of HRR and equivalence ratios, Øm. The Øm, CO, THC were averaged over the steady state rich burning period from 300-500s in the fire, this omitted the initial fire growth period and the final char burn out period.
The variation of the average steady state CO with average Øm is shown in Fig. 12a and compared with the predicted equilibrium CO. The maximum measured concentration of CO was 15% and was achieved with an air flow of 19.2 g/(m2.s) with an equivalence ratio of 2.8. The trend of the experimental CO follows the same shape as equilibrium CO from Øm 1.6 to 4.5, at Øm = 6, another peak value of % CO was observed and was not following the equilibrium trend. The experiments were repeated 3 times at these conditions, but the same results CO were obtained.
Fig. 12. (a)Variation of experimental and predicted (equilibrium) CO concentration with Øm; (b) Variation of
experimental % THC with Øm.
The difference in the adiabatic equilibrium CO and experimental CO shows that equilibrium was not achieved, due to remaining heat losses that had not been eliminated. This produced rich burning conditions well away from adiabatic equilibrium. This resulted in high hydrocarbons, as shown in Fig. 12b, when there should be no hydrocarbons at equilibrium. These hydrocarbons represent a loss of energy conversion efficiency. The CO and THC would burn in the second stage combustion on
Proceedings of the Ninth International Seminar on Fire and Explosion Hazards (ISFEH9)
1076
discharge from the chimney. This is equivalent to the flames seen exiting open windows from compartment fires.
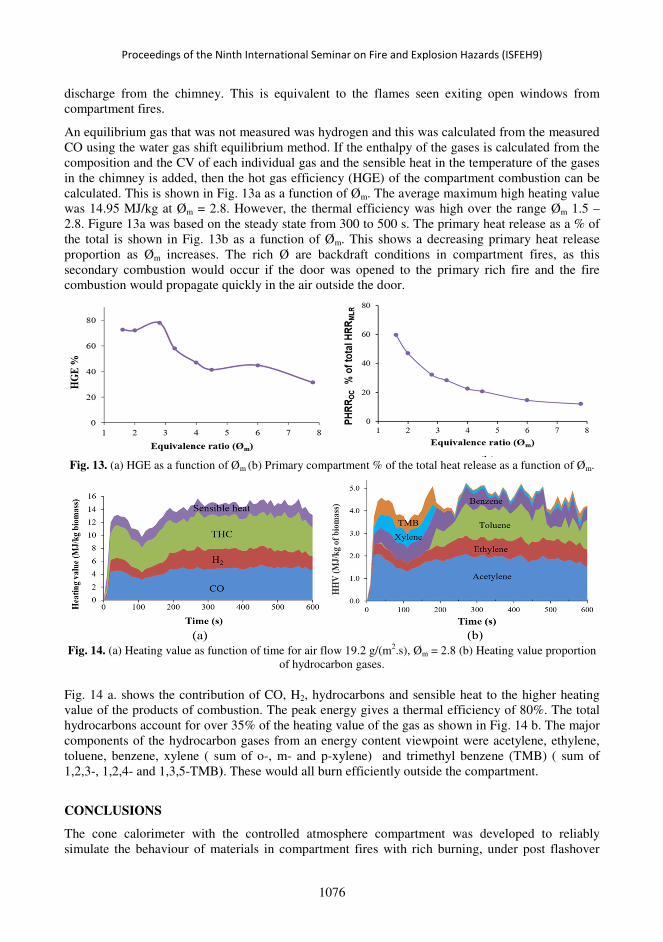
An equilibrium gas that was not measured was hydrogen and this was calculated from the measured CO using the water gas shift equilibrium method. If the enthalpy of the gases is calculated from the composition and the CV of each individual gas and the sensible heat in the temperature of the gases in the chimney is added, then the hot gas efficiency (HGE) of the compartment combustion can be calculated. This is shown in Fig. 13a as a function of Øm. The average maximum high heating value was 14.95 MJ/kg at Øm = 2.8. However, the thermal efficiency was high over the range Øm 1.5 – 2.8. Figure 13a was based on the steady state from 300 to 500 s. The primary heat release as a % of the total is shown in Fig. 13b as a function of Øm. This shows a decreasing primary heat release proportion as Øm increases. The rich Ø are backdraft conditions in compartment fires, as this secondary combustion would occur if the door was opened to the primary rich fire and the fire combustion would propagate quickly in the air outside the door.
Fig. 13. (a) HGE as a function of Øm (b) Primary compartment % of the total heat release as a function of Øm.
Fig. 14. (a) Heating value as function of time for air flow 19.2 g/(m2.s), Øm = 2.8 (b) Heating value proportion
of hydrocarbon gases.
Fig. 14 a. shows the contribution of CO, H2, hydrocarbons and sensible heat to the higher heating value of the products of combustion. The peak energy gives a thermal efficiency of 80%. The total hydrocarbons account for over 35% of the heating value of the gas as shown in Fig. 14 b. The major components of the hydrocarbon gases from an energy content viewpoint were acetylene, ethylene, toluene, benzene, xylene ( sum of o-, m- and p-xylene) and trimethyl benzene (TMB) ( sum of 1,2,3-, 1,2,4- and 1,3,5-TMB). These would all burn efficiently outside the compartment.
CONCLUSIONS
The cone calorimeter with the controlled atmosphere compartment was developed to reliably simulate the behaviour of materials in compartment fires with rich burning, under post flashover

Part 6. Material Behavior in Fires
1077
conditions. However, the baseline equipment had to be improved to enable the measurement of the composition of the raw discharge gases from the compartment outlet through the 76mm exit to the cone. This was done by adding a major chimney so that a mean gas sample could be made. Air entrainment into the chimney was a problem and this was controlled by placing a 90% blockage grid plate at the exit from the chimney. Various ways of obtaining a mean gas sample was investigated and a 20 hole ‘X’ probe was the best, located at the bottom of the chimney. The original compartment had excessive heat losses and these were reduced by wall thermal insulation. Also heat losses from the test section to the water cooled load cell were significant and the test specimen was insulated from the support. This system was shown to give rich burning, with the equivalence ratio controlled by the air flow into the compartment. The gases emerging from the chimney were shown to contain up to 80% of the energy in the fuel, depending on the equivalence ratio. For very rich mixtures only 20% of the energy in the fuel was release in the primary compartment fire and the rest was released in the secondary fire. This is the energy that forms backdraft or in compartment fires with a window open is the energy in the visible external flame. This shows that the modified procedures for the cone calorimeter greatly extend its usefulness in material testing to conditions close to those encountered in post flashover compartment fires.
REFERENCES
[1] BS ISO 5660-1:2015: Reaction-to-fire tests. Heat release, smoke production and mass loss rate. Heat release rate (cone calorimeter method) and smoke production rate (dynamic measurement). British Standards Institute.
[2] V. Babrauskas, R.H. Harris, E. Braun, B. Levin, M. Paabo, R.G. Gann, The Role of Bench Scale Test Data in Assessing Real-Scale Fire Toxicity, NIST Technical Note 1284, 1991.
[3] A.A. Stec, T.R. Hull, Eds., Fire Toxicity, Woodhead Publishing Ltd, Cambridge, 2010.
[4] A.A. Alarifi, H.N. Phylaktou, and G.E. Andrews. Heated Raw Gas Sampling with Heated FTIR Analysis of Toxic Effluents from Small and Large Scale Fire Tests, In: 10th Asia-Oceania Symposium on Fire Science and Technology, 2015, Tsukuba, Japan, IAFSS.
[5] H. Li, K. Ropkins, G.E. Andrews, B. Daham, M. Bell, J. Tate, G. Hawley, Evaluation of a FTIR Emission Measurement System for Legislated Emissions Using a SI Car, In: SAE International, 2006.
[6] B. Daham, G.E. Andrews, H. Li, R. Ballesteros, M.C. Bell, J. Tate, K. Ropkins, Application of a Portable FTIR for Measuring On-road Emissions, In: SAE International, 2005.
[7] E.M. Fitzpatrick, A.B. Ross, J. Bates, G. Andrews, J.M. Jones, H. Phylaktou, M. Pourkashanian, A. Williams, Emission of Oxygenated Species from the Combustion of Pine Wood and its Relation to Soot Formation, Proc. Saf. Environ. Prot. 85 (2007) 430-440.
[8] Z.A. Zainal, R. Ali, C.H. Lean, K.N. Seetharamu, Prediction of performance of a downdraft gasifier using equilibrium modeling for different biomass materials, Energy Convers. Manage. 42 (2001) 1499-1515.