Development of Steel Shear Walls Capable of Structural ...
124
Title Development of Steel Shear Walls Capable of Structural Condition Assessment by Using Double-Tapered Links( Dissertation_全文 ) Author(s) He, Liusheng Citation 京都大学 Issue Date 2015-03-23 URL https://doi.org/10.14989/doctor.k18977 Right 許諾条件により本文は2016/01/01に公開 Type Thesis or Dissertation Textversion ETD Kyoto University
Transcript of Development of Steel Shear Walls Capable of Structural ...

TitleDevelopment of Steel Shear Walls Capable of StructuralCondition Assessment by Using Double-Tapered Links(Dissertation_全文 )
Author(s) He, Liusheng
Citation 京都大学
Issue Date 2015-03-23
URL https://doi.org/10.14989/doctor.k18977
Right 許諾条件により本文は2016/01/01に公開
Type Thesis or Dissertation
Textversion ETD
Kyoto University

Development of Steel Shear Walls
Capable of Structural Condition Assessment
by Using Double-Tapered Links
2015
Liusheng HE


- i -
TABLE OF CONTENTS
CHAPTER 1 Introduction
1.1 Background 1-1
1.1.1 Steel slit shear walls 1-1
1.1.2 Post-earthquake inspection 1-2
1.2 Objective 1-3
1.3 Organization 1-4
REFERENCES 1-5
LIST OF PUBLICATIONS 1-7
CHAPTER 2 Previous research on steel slit shear walls
2.1 Introduction 2-1
2.2 SSSWs with rectangular links 2-1
2.2.1 Without buckling constraint 2-1
2.2.2 With buckling constraint 2-5
2.3 SSSWs with tapered links 2-7
2.4 Summary 2-9
REFERENCES 2-10
CHAPTER 3 Design of double-tapered links for structural condition assessment
3.1 Introduction 3-1
3.1.1 Background 3-1
3.1.2 Organization 3-3
3.2 Shape design of double-tapered links 3-3
3.3 Parametric analysis 3-4
3.3.1 Numerical model 3-4
3.3.2 Material property 3-6
3.3.3 Mesh sensitivity study 3-6
3.3.4 Effect of width-thickness ratio 3-7
3.3.5 Effect of aspect ratio 3-9
3.3.6 Double-tapered link versus rectangular link 3-11
3.4 Test Preparation 3-11
3.4.1 Test specimens 3-11
3.4.2 Criterion for notable torsional deformation 3-14
3.4.3 Test setup and instrumentation 3-14
3.4.4 Loading protocol 3-16
3.5 Test results 3-17
3.5.1 Yielding at quarter-height section 3-17
3.5.2 Criterion for notable torsional deformation 3-18

- ii -
3.5.3 Initiation and growth of torsional deformation 3-18
3.5.4 Difference in rotation angle of links within specimen 3-20
3.5.5 Behavior of panel for condition assessment 3-22
3.5.6 Accuracy of FE analysis 3-22
3.6 Enhancement of objectivity in visual inspection 3-23
3.6.1 In-plane reference 3-23
3.6.2 Test specimens 3-25
3.6.3 Test results 3-25
3.7 Summary 3-27
REFERENCES 3-28
CHAPTER 4 Condition assessment performance of double-tapered links under earthquake
loading
4.1 Introduction 4-1
4.1.1 Loading protocol 4-1
4.1.2 Organization 4-3
4.2 Condition assessment performance of double-tapered links in simulation 4-4
4.2.1 Earthquake loading 4-4
4.2.2 Behavior under incremental two-cycle loading 4-6
4.2.3 Behavior under earthquake loading 4-7
4.2.4 Two representative earthquake loadings 4-9
4.3 Test Preparation 4-9
4.3.1 Test specimens 4-9
4.3.2 Loading protocol 4-10
4.4 Test results 4-11
4.4.1 Under incremental two-cycle loading 4-11
4.4.2 Under earthquake loading 4-13
4.5 Summary 4-16
REFERENCES 4-17
CHAPTER 5 Enhancement of energy dissipation and design of end plate connection
5.1 Introduction 5-1
5.2 Steel slit shear walls with double-tapered links 5-2
5.2.1 Strength and stiffness 5-2
5.2.2 Experimental validation 5-5
5.3 Enhancement of energy dissipation 5-11
5.3.1 Steel slit shear walls with rectangular links 5-11
5.3.2 Rectangular link versus double-tapered link 5-13
5.3.3 Low yield point steel 5-14
5.3.4 Experimental validation 5-15
5.4 A double-layer dual-function system 5-18
5.4.1 Test specimens 5-19
5.4.2 Test results 5-20
5.5 Design of end plate connection 5-21

- iii -
5.5.1 Deflection of end plate 5-21
5.5.2 Test preparation 5-23
5.5.3 Test results 5-25
5.6 Summary 5-27
REFERENCES 5-28
CHAPTER 6 System validation through large-scale tests 6.1 Introduction 6-1
6.2 Test Preparation 6-2
6.2.1 Material property and numerical model 6-2
6.2.2 Number of rows of links 6-3
6.2.3 Test specimens 6-3
6.2.4 Test setup, instrumentation and loading protocol 6-5
6.3 Test results 6-7
6.3.1 Performance of end plate 6-7
6.3.2 Performance of condition assessment 6-8
6.3.3 Strength and stiffness 6-10
6.3.4 Energy dissipation 6-10
6.3.5 Shear deformation distribution among rows 6-11
6.4 Proposal for practical application 6-14
6.5 Design procedure 6-15
6.6 Summary 6-15
6.7 Future work 6-16
REFERENCES 6-17
CHAPTER 7 Summary and conclusions
ACKNOWLEDGMENTS


1 - 1
CHAPTER 1
Introduction
1.1 Background
In urban societies characterized by factors such as density, promptness and globalization, continuity
of living and business activities is essential for society’s survival. Many occurrences, both natural
and social, are responsible for impeding this continuity. In many earthquake-prone countries such
as Japan, damaging earthquakes are a major factor blocking normal living and business activities.
While quick inspection and evaluation of building damage after major earthquake events is
necessary to make a decision whether to evacuate or continue normal operations, the condition
assessment of structural components is not an easy task. A new and innovative method that enables
rapid condition assessment is highly desirable.
In seismic design of buildings, passive dampers are widely used to improve the seismic
performance. The specially designated damage on dampers dissipates the earthquake energy and
hence reduces the level of damage on the gravity-resisting system. The steel slit shear wall, a kind
of passive damper device, concentrates damage on links between slits, which could use as a
damage indicator for the structural condition in terms of the experienced maximum lateral
deformation after an earthquake.
1.1.1 Steel slit shear walls
Shear wall systems using steel plates are very common in the field of earthquake engineering with
their large stiffness, lightness, and ductility. Among the many types of steel shear walls, the steel
plate shear wall (SPSW) and steel slit shear wall (SSSW) are the most common in practice. The
SPSW is widely accepted in North America and is included in design standards [1, 2]. It resists
shear deformation with tension field action after the onset of buckling and presents substantial
pinching behavior in its hysteretic loop [3-5]. Because a SPSW require rigid plate boundaries, the
four sides of the plate need to be fixed to stiff boundary members or an equivalent stiff boundary
system [6]. The SSSW is fairly popular in Japan, which is only connected between beams. As
illustrated in Figure 1.1, each rectangular link between slits behaves as a flexural member, and its
yielding and hysteresis becomes a source of energy dissipation similar to conventional steel
hysteresis dampers [7]. One noteworthy feature of the wall is that the stiffness and strength of the
wall can be adjusted flexibly by changing the slit arrangement, such as length, interval and number
of rows of slits. Since Hitaka and Matsui introduced the design philosophy of slit shear walls, many
studies, including practical applications to real buildings, have been reported [8-16].

1 - 2
Angle
Flexural links
Bolt
Slit
Figure 1.1 Steel slit shear wall.
1.1.2 Post-earthquake inspection
The traditional post-earthquake inspection relies on trained inspectors who evaluate the condition of
building from appearance such as cracking in concrete, fracture or buckling of steel members, or
residual deformations. Procedures for conducting post-earthquake inspection were presented in
many papers, for example, [17-19] and technical reports/guidelines as well, for example, [20-25].
With those procedures, the time needed usually is not short, especially when there are a large
number of damaged buildings. In recent years, structural health monitoring (SHM) that utilizes
electric sensors attracts much attention, which provides objective information based on engineering
data [26, 27]. However, the application of SHM to buildings requires inevitable associated cost
including large initial investment on sensors and long-term operating fee and among others. In
addition, the uncertainty on the effectiveness, unfamiliarity on how SHM works and difficulty of
cost-benefit analysis all hinder its extensive application. With that said, a new and innovative
method that enables rapid condition assessment is highly desirable.
There is an interesting phenomenon of SSSWs that links between slits buckled out of plane
after experiencing a certain lateral drift, which might be used as a means of condition assessment.
There were early attempts along with this concept [12-14]. In their development, a few links with
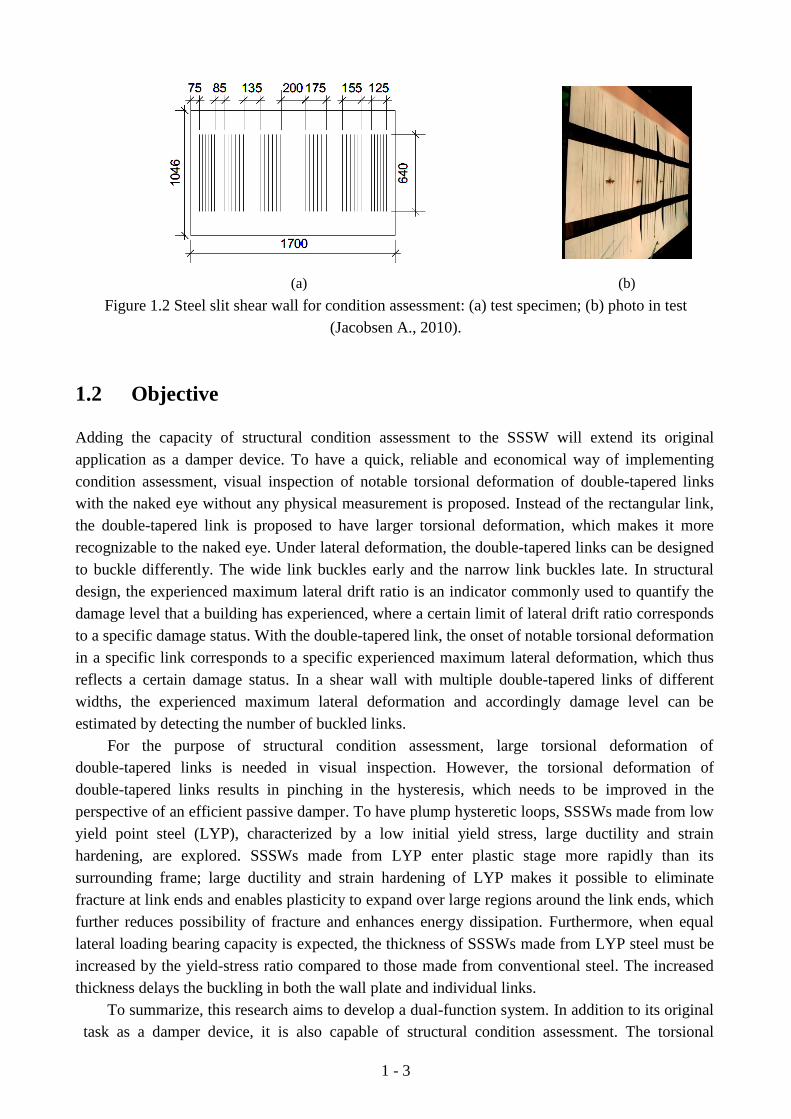
different widths were arranged in a wall, as shown in Figure 1.2. Under incremental cyclic loading,
the wider links buckled earlier, followed by the buckling of narrower links. The experienced
maximum lateral drift can be estimated based on the number of torsionally deformed links. The
concept for condition assessment was found feasible, but the following two problems were
identified. One was the degree of torsional deformation, and the other was fracture initiated at the
ends of the link. Although each link buckled and showed corresponding torsional deformation, the
degree of torsional deformation was not necessarily significantly large, which had made it rather
difficult to judge whether or not it sustained “notable” torsional deformation. As the link behaved as
a flexural member, the maximum strain (and the corresponding plastic hinge) occurred at the ends
of the link. The large strain triggered fracture at that location, which in return made the growth of
torsional deformation unstable and inconsistent, and also lessened the dissipation of energy.
1 - 3
(a) (b)
Figure 1.2 Steel slit shear wall for condition assessment: (a) test specimen; (b) photo in test
(Jacobsen A., 2010).
1.2 Objective
Adding the capacity of structural condition assessment to the SSSW will extend its original
application as a damper device. To have a quick, reliable and economical way of implementing
condition assessment, visual inspection of notable torsional deformation of double-tapered links
with the naked eye without any physical measurement is proposed. Instead of the rectangular link,
the double-tapered link is proposed to have larger torsional deformation, which makes it more
recognizable to the naked eye. Under lateral deformation, the double-tapered links can be designed
to buckle differently. The wide link buckles early and the narrow link buckles late. In structural
design, the experienced maximum lateral drift ratio is an indicator commonly used to quantify the
damage level that a building has experienced, where a certain limit of lateral drift ratio corresponds
to a specific damage status. With the double-tapered link, the onset of notable torsional deformation
in a specific link corresponds to a specific experienced maximum lateral deformation, which thus
reflects a certain damage status. In a shear wall with multiple double-tapered links of different
widths, the experienced maximum lateral deformation and accordingly damage level can be
estimated by detecting the number of buckled links.
For the purpose of structural condition assessment, large torsional deformation of
double-tapered links is needed in visual inspection. However, the torsional deformation of
double-tapered links results in pinching in the hysteresis, which needs to be improved in the
perspective of an efficient passive damper. To have plump hysteretic loops, SSSWs made from low
yield point steel (LYP), characterized by a low initial yield stress, large ductility and strain
hardening, are explored. SSSWs made from LYP enter plastic stage more rapidly than its
surrounding frame; large ductility and strain hardening of LYP makes it possible to eliminate
fracture at link ends and enables plasticity to expand over large regions around the link ends, which
further reduces possibility of fracture and enhances energy dissipation. Furthermore, when equal
lateral loading bearing capacity is expected, the thickness of SSSWs made from LYP steel must be
increased by the yield-stress ratio compared to those made from conventional steel. The increased
thickness delays the buckling in both the wall plate and individual links.
To summarize, this research aims to develop a dual-function system. In addition to its original
task as a damper device, it is also capable of structural condition assessment. The torsional
1 - 4
deformation of double-tapered links serves as an indicator for condition assessment. To have
better energy dissipation in view of the pinched hysteresis of double-tapered links, the LYP steel
is used, which gives the plump hysteretic loops without the need of out-of-plane restrainers. Along
the line of SSSWs, step-by-step objectives of this dissertation are to design double-tapered links
for condition assessment, verify the condition assessment performance experimentally, improve
energy dissipation capacity, validate the system considering practical application, and finally give
the design procedure.
1.3 Organization
Design of condition assessment
(Chapter 3)
Condition assessment under
earthquake loading
(Chapter 4)
Previous research on slit walls
(Chapter 2)
Background & objective
(Chapter 1)
System validation through
large-scale tests
(Chapter 6)
Summary and conclusions
(Chapter 7)
Energy dissipation &
End plate connection
(Chapter 5)
Condition assessment Energy dissipation
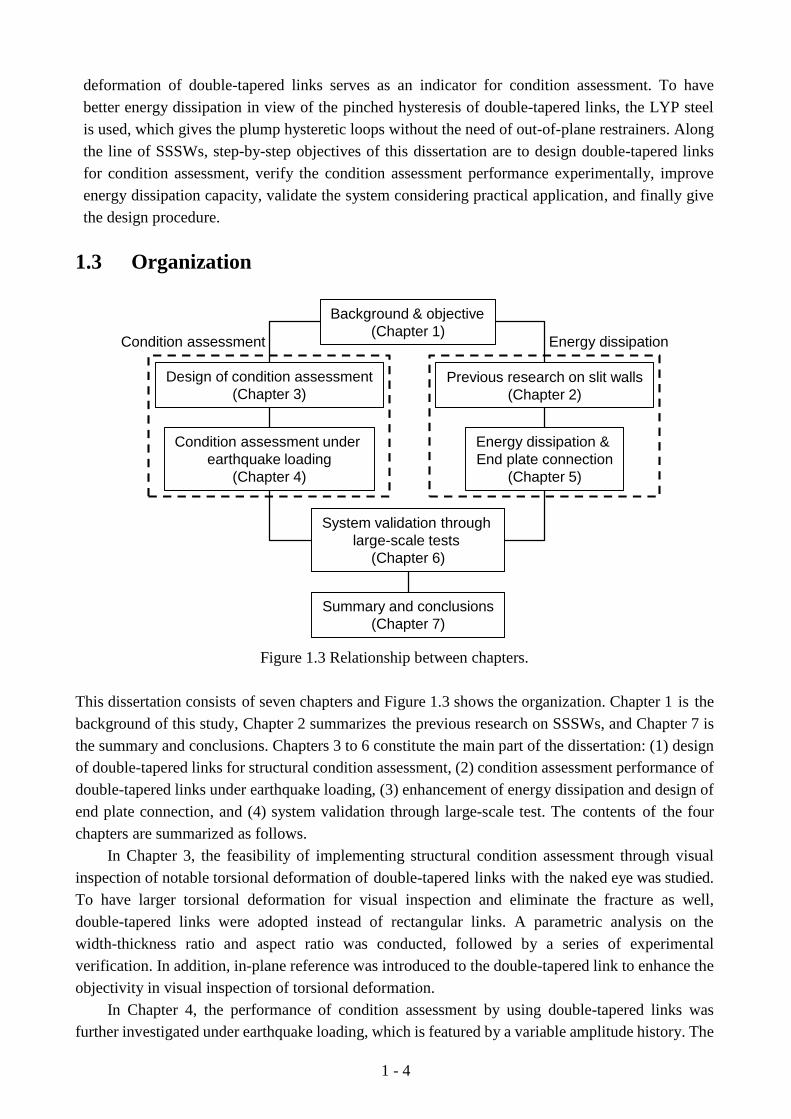
Figure 1.3 Relationship between chapters.
This dissertation consists of seven chapters and Figure 1.3 shows the organization. Chapter 1 is the
background of this study, Chapter 2 summarizes the previous research on SSSWs, and Chapter 7 is
the summary and conclusions. Chapters 3 to 6 constitute the main part of the dissertation: (1) design
of double-tapered links for structural condition assessment, (2) condition assessment performance of
double-tapered links under earthquake loading, (3) enhancement of energy dissipation and design of
end plate connection, and (4) system validation through large-scale test. The contents of the four
chapters are summarized as follows.
In Chapter 3, the feasibility of implementing structural condition assessment through visual
inspection of notable torsional deformation of double-tapered links with the naked eye was studied.
To have larger torsional deformation for visual inspection and eliminate the fracture as well,
double-tapered links were adopted instead of rectangular links. A parametric analysis on the
width-thickness ratio and aspect ratio was conducted, followed by a series of experimental
verification. In addition, in-plane reference was introduced to the double-tapered link to enhance the
objectivity in visual inspection of torsional deformation.
In Chapter 4, the performance of condition assessment by using double-tapered links was
further investigated under earthquake loading, which is featured by a variable amplitude history. The

1 - 5
occurrence of notable torsional deformation under earthquake loading was mostly consistent with
that under incremental two-cycle loading, which indicated that the incremental two-cycle loading
could be used as the base loading protocol in the design of double-tapered links. A series of
experiments were conducted to verify this hypothesis. Furthermore, the performance of in-plane
reference was also investigated.
In Chapter 5, energy dissipation capacity of SSSWs was investigated both theoretically and
experimentally. Strength and stiffness of shear walls with double-tapered links were predicted and
verified experimentally. To reduce the pinching in hysteresis of double-tapered links for better
energy dissipation, slit walls made from LYP were proposed, by taking advantage of the large strain
hardening of LYP. A double-layer system, with one layer of double-tapered links and the other layer
of rectangular links made from LYP, was investigated experimentally to examine the feasibility of
having functions of both condition assessment and sound energy dissipation simultaneously. Last,
end plate connection was proposed as a simple design of connection between double-tapered links
and beams.
In Chapter 6, performance of both condition assessment and energy dissipation was investigated
using large-scale tests. Four 1/2-scaled slit-wall specimens were designed, two for condition
assessment and the other two for energy dissipation. Based on test results, a configuration for both
condition assessment and energy dissipation was proposed for practical application. Last, a design
procedure was described.
REFERENCES
[1] American Institute of Steel Construction: Seismic provisions for structural steel buildings.
Chicago, Illinois, 2010.
[2] Canadian Standard Association: CSA S16-09: Design of Steel Structures (7th edition). Toronto,
Canada, 2009.
[3] Roberts T. M. and Ghomi S. Sabouri. Hysteretic Characteristics of Unstiffened Plate Shear
Panels. Thin-Walled Struct. 1991; 12(2): 145-162.
[4] Vian D. Steel plate shear walls for seismic design and retrofit of building structures. Ph.D.
dissertation. SUNY at Buffalo: Buffalo, New York, 2005.
[5] Qu B, Bruneau M, Lin CH, Tsai KC. Testing of full-scale two-story steel plate shear wall with
reduced beam section connections and composite floors. J. Struct. Eng. 2008; 134(3): 364-373.
[6] Kurata M., Leon. T. R., DesRoches R. and Nakashima M. Steel Plate Shear Wall with
Tension-Bracing for Seismic Rehabilitation of Steel Frames. J. Const. Steel Research 2012; 71:
92-103.
[7] Martinez-Rueda J. E. On the evolution of energy dissipation devices for seismic design.
Earthquake Spectra 2002; 18(2): 309-346.
[8] Hitaka T., Matsui C., Tsuda K. and Yanagida Y. Elasticplastic behavior of building steel frame
with steel bearing wall with slits. Proc., 12th WCEE 2000, 833/6/A.
[9] Hitaka T. and Matsui C. Experimental study on steel shear wall with slits. J. Struct. Eng. 2003;
129(5): 586-595.
[10] Chan R. and Albermani F. Experimental study of steel slit damper for passive energy
dissipation. Engineering Structures 2008; 30(4):1058-1066.
[11] Cortes G. and Liu J. Experimental evaluation of steel slit panel frames for seismic resistance. J.

1 - 6
Const. Steel Research 2011; 67: 181-191.
[12] Jacobsen A. Development of steel slit wall dampers with embedded condition assessment
capabilities. Ph.D. dissertation, Kyoto University, 2010.
[13] Jacobsen A., Hitaka T. and Nakashima M. Online test of building frame with slit wall dampers
capable of condition assessment. J. Const. Steel Research 2010; 66: 1320-1329.
[14] Okamura, T., Kurata, M., and Nakashima, M. Development of Slitted Steel Shear Walls
Capable of Detecting Damage States. Proc., 15th WCEE 2012.
[15] Ito M., Taniguchi Y., Tsuboyama N., Hoki K. and Nakashima M. Stiffening methods for
enhancement of hysteretic performance of slitted steel shear walls. Proc., 15th WCEE 2012,
Lisboa.
[16] Chen Y. and Ke K. Improvement in SSWS design and study of the performance of steel
frame-SSWS system. Proc., 10th International conference on urban earthquake engineering
2013, Tokyo, Japan.
[17] Dandoulaki M., Panoutsopoulou M. and Ioannides K. An over view of post-earthquake
building inspection practices in Greece and the introduction of a rapid building usability
evaluation procedure after the 1996 Knotsa earthquake. 11th European conference on
earthquake engineering 1998, Balkema, Rotterdam.
[18] Huyck C.K., Adams B.J., Cho S., Eguchi R.T., Mansouri B. and Houshmand B. Methodologies
for Post-Earthquake Building Damage Detection Using SAR and Optical Remote Sensing:
Application to the August 17, 1999 Marmara, Turkey Earthquake. Technical report
MCEER-04-0004, 6/15/2004.
[19] Nakano Y., Maeda M., Kuramoto H. and Murakami M. Guideline for post-earthquake damage
evaluation and rehabilitation of RC buildings in Japan. Proc., 13th WCEE 2004, Vancouver,
B.C., Canada, Paper No. 124.
[20] ATC-20. Procedures for postearthquake Safety Evaluation of Buildings. Applied Technology
Council, California, 1989.
[21] ATC-2-2. Addendum to the ATC-20 building Safety procedures. Applied Technology Council,
California, 1995.
[22] FEMA 267. Interim Guidelines: Evaluation, repair, modification and design of welded steel
moment frame structures. Federal Emergency Management Agency, 1995.
[23] FEMA 306. Evaluation of Earthquake-Damaged Concrete and Masonry Wall Buildings, Basic
Procedures Manual. Federal Emergency Management Agency, 1998.
[24] FEMA 352. Recommended post-earthquake evaluation and repair criteria for welded steel
moment-frame buildings, Federal emergency management agency. Federal Emergency
Management Agency, 2000.
[25] https://www.eeri.org/projects/learning-from-earthquakes-lfe/post-earthquake-investigation-fiel
d-guide/
[26] Jerome P. Lynch and Kenneth J. Loh. A summary review of wireless sensors and sensor
networks for structural health monitoring. The shock and vibration digest 2006; Vol. 38, No. 2,
91-128.
[27] Kalkan E, Banga K, Ulusoy HS, Fletcher JPB, Leith WS, Reza S and Cheng T. Advanced
earthquake monitoring system for U.S. Department of Veterans Affairs medical
buildings-instrumentation. U.S. Geological Survey Open-File Report 2012-1241, 143 p, 2012.

1 - 7
LIST OF PUBLICATIONS
Referred papers:
[1] He L., Kurata M., Fukihara K., Hayashi K. and Nakashima M. Dual functional steel slit shear
wall with X-shaped links. Journal of Constructional Steel, Japanese Society of Steel
Construction, 2013, 21: 679-684.
[2] Kurata M., He L. and Nakashima M. Steel slit shear walls with double-tapered links capable of
condition assessment. Earthquake Engineering and Structural Dynamics. (in press)
http://dx.doi.org/10.1002/eqe.2517
[3] Togo T., He L., Kurata M., Hayashi K. and Nakashima M. Improving performance of a
hysteretic damper capable of structural condition assessment. Journal of Constructional Steel,
Japanese Society of Steel Construction, 2014, 22: 531-537. (in Japanese)
[4] Togo T., He L., Hayashi K., Kurata M. and Nakashima M. Development of multi-row slit shear
walls using low yield point steel. Journal of Structural and Construction Engineering,
Architectural Institute of Japan.(in press, in Japanese)
[5] He L., Kurata M. and Nakashima M. Condition assessment of steel shear walls with tapered
links under various loadings. Earthquakes and Structures. (under review)
[6] He L., Togo T., Hayashi K., Kurata M. and Nakashima M. Cyclic behavior of multi-row slit
shear walls made from low yield point steel. Journal of Structural Engineering. (under review)
International Conference paper:
[7] He L., Fukihara K., Kurata M., Hayashi K. and Nakashima M. Steel Plate Shear Wall with
X-shaped Links as a Structural Component Capable of Condition Assessment. Proc. of Pacific
Structural Steel Conference 2013, Singapore.
Domestic conference paper:
[8] He Liusheng, Fukihara Kei, Kurata Masahiro, Hayashi Kazuhiro, Taniguchi Yudai and
Nakashima Masayoshi. Steel slit shear walls with X-shaped links capable of structural condition
assessment: Part 1: Concept and numerical analysis. Summaries of Technical Papers of Annual
Meeting Kinki Branch AIJ, 541-544, 2013-05-24.
[9] Fukihara Kei, He Liusheng, Kurata Masahiro, Hayashi Kazuhiro, Taniguchi Yudai and
Nakashima Masayoshi. Steel slit shear walls with X-shaped links capable of structural condition
assessment: Part 2: Experimental study. Summaries of Technical Papers of Annual Meeting
Kinki Branch AIJ, 545-548, 2013-05-24. (in Japanese)
[10] He Liusheng, Fukihara Kei, Kurata Masahiro, Hayashi Kazuhiro, Taniguchi Yudai and
Nakashima Masayoshi. Structural condition assessment using steel slit shear wall with X-shaped
links: Part 1: Concept and numerical analysis. Summaries of Technical Papers of Annual
Meeting AIJ, 857-858, 2013-08-30.
[11] Fukihara Kei, He Liusheng, Kurata Masahiro, Hayashi Kazuhiro, Taniguchi Yudai and
Nakashima Masayoshi. Structural condition assessment using steel slit shear wall with X-shaped
links: Part 2: Experimental study. Summaries of Technical Papers of Annual Meeting AIJ,

1 - 8
859-860, 2013-08-30. (in Japanese)
[12] He Liusheng, Togo Takuma, Kurata Masahiro, Hayashi Kazuhiro and Nakashima Masayoshi.
Structural condition assessment using steel plate shear walls with improved X-shaped links: Part
1: Visual inspection enhancement and earthquake-type loading. Summaries of Technical Papers
of Annual Meeting Kinki Branch AIJ, 557-560, 2014-06-21.
[13] Togo Takuma, He Liusheng, Kurata Masahiro, Hayashi Kazuhiro and Nakashima Masayoshi.
Structural condition assessment using steel plate shear walls with improved X-shaped links: Part
2: Experimental verification and enhancement in energy dissipaiton. Summaries of Technical
Papers of Annual Meeting Kinki Branch AIJ, 561-564, 2014-06-21. (in Japanese)
[14] He Liusheng, Togo Takuma, Kurata Masahiro, Hayashi Kazuhiro and Nakashima Masayoshi.
Dual functional steel slit shear walls with improved X-shaped links: Part 1: Visual inspection
enhancement and earthquake-type loading. Summaries of Technical Papers of Annual Meeting
AIJ, 1143-1144, 2014-09-13.
[15] Togo Takuma, He Liusheng, Kurata Masahiro, Hayashi Kazuhiro and Nakashima Masayoshi.
Dual functional steel slit shear walls with improved X-shaped links: Part 2: Experimental
verification. Summaries of Technical Papers of Annual Meeting AIJ, 1145-1146, 2014-09-13. (in
Japanese)

2 - 1
CHAPTER 2
Previous research on steel slit shear walls
2.1 Introduction
The innovative way of putting vertical slits into shear walls to increase their ductility and energy
dissipation capacity was introduced first in Japan [1-3]. A 36-story building used the new system of
slitted reinforced concrete wall was reported in [2], which was considered as the first energy
dissipation system used in the structures of Japan [4]. The slitted wall was a reinforced concrete
wall with slits located at mid-height of the wall. The slits were made by cutting the concrete and
reinforcement. With slits, the wall was more ductile than the solid reinforced concrete shear wall.
At small drifts, the slitted wall worked as a shear wall limiting inter-story drifts; at large drifts, it
worked as a series of flexural links subjected in shear deformation dissipating energy. However,
with limited ductility improved but added weight and rapid deterioration of reinforced concrete,
slitted reinforce concrete walls gradually gave way to metallic yielding devices [5]. Borrowing the
idea of cutting slits, the steel slit shear wall (SSSW hereinafter) attracts much attention, due to the
lightness, large stiffness and ductility.
As opposed to the steel plate shear wall (SPSW hereinafter) which is connected to boundary
beams and columns of a structure, the SSSW is connected to beams only without requiring
beam-column moment connection, which reduces the demands on significantly large boundary
elements. It is noteworthy that the strength and stiffness of a SSSW can be designed separately by
adjusting the length and width of the link and the number of rows of links, which makes the design
flexible and rational.
2.2 SSSWs with rectangular links
2.2.1 Without buckling constraint
To prevent the premature global buckling of the wall before the yielding of links, edge stiffeners are
commonly used in the SSSW. To facilitate the narrative, SSSWs with edge stiffeners are classified
as the type without buckling constraint here.
Wada A. et al. [6] developed a new hysteretic steel damper, called steel slit damper. As shown
in Figure 2.1, it consisted of a steel plate with many narrow openings, which formed small columns
yielding under bending moment. Stable hysteresis was obtained with strength hardening observed at
large drifts. With dampers installed in a 26-story building, seismic response was reduced.

2 - 2
(a) (b)
Figure 2.1 Steel slit damper: (a) specimen; (b) hysteretic curve (Wada A. et al., 1997).
Hitaka and Matsui conducted a thorough experimental and analytical study of the SSSW [7].
They studied the effect of width-thickness, aspect ratio, number of slit rows, and the effect of edge
stiffeners. The width-height ratio for all specimens was 1:1. Main findings were that
width-thickness ratio controlled the out-of-plane buckling of links. As shown in Figure 2.2,
hysteretic loops of the specimen with wide links (big width-thickness ratio) showed more obvious
pinching than narrow links (small width-thickness ratio). Specimens with width-thickness ratios
less than 10 did not display obvious out-of-plane buckling up to a drift ratio of 2.5%; the minimum
aspect ratio of 2.5 was proposed to ensure the flexural behavior of links instead of shear failure
under lateral drift; welded edge stiffening enhanced the maximum strength and restrained the
out-of-plane deformation of the slit wall. Equations to predict the initial stiffness and ultimate
strength were given, which were widely adopted by later researchers in the field of SSSWs.
(a)
(b)
Figure 2.2 Steel slit shear walls: (a) a specimen with narrow links and its hysteretic curve; (b)
a specimen with wide links and its hysteretic curve (Hitaka T. and Matsui C., 2003).

2 - 3
In a separate study [8], they conducted experiments on steel frames with SSSWs, as shown in
Figure 2.3(a). The main purpose was to investigate bearing wall’s behavior in frame and mutual
effect between frame and wall. They found that beam’s deformation made the slit walls relatively
unstable compared to those tested under idealized boundary condition. Bearing capacity of frame
did not change much with or without the slit walls. With the slit wall, energy dissipation capacity
was largely enhanced at small lateral drifts. For the walls with large strength close to the shear
buckling strength, edge stiffeners were not enough for transverse stiffening. They also did tests in
concrete-filled tubular (CFT) column frame systems, as shown in Figure 2.3(b). All SSSWs showed
larger ductility and provided the structure with large stiffness and energy dissipation capacity at
small drift levels. With SSSWs, the axial force induced in the columns was larger, which caused
larger residual axial shortening of the columns. An equivalent brace model of SSSWs was found
applicable for frame analysis.
(a) (b)
Figure 2.3 Panel-frame: (a) one-story frame; (b) three-story CFT column frame (Hitaka T. et
al., 2007).
R. Chen and F. Albermani developed another type of steel slit damper for passive energy
dissipation [9], as shown in Figure 2.4. Different with others, their slit damper was fabricated from
a standard structural wide-flange section with slits cut from the web, which made the manufacture
easy and weld-free. Tests exhibited stable hysteretic loops. The damper was more flexible with
longer or wider slits; the damper with short or narrow slits possessed higher stiffness, dissipated
energy at a higher rate but suffered from earlier failure.
2 - 4
(a) (b)
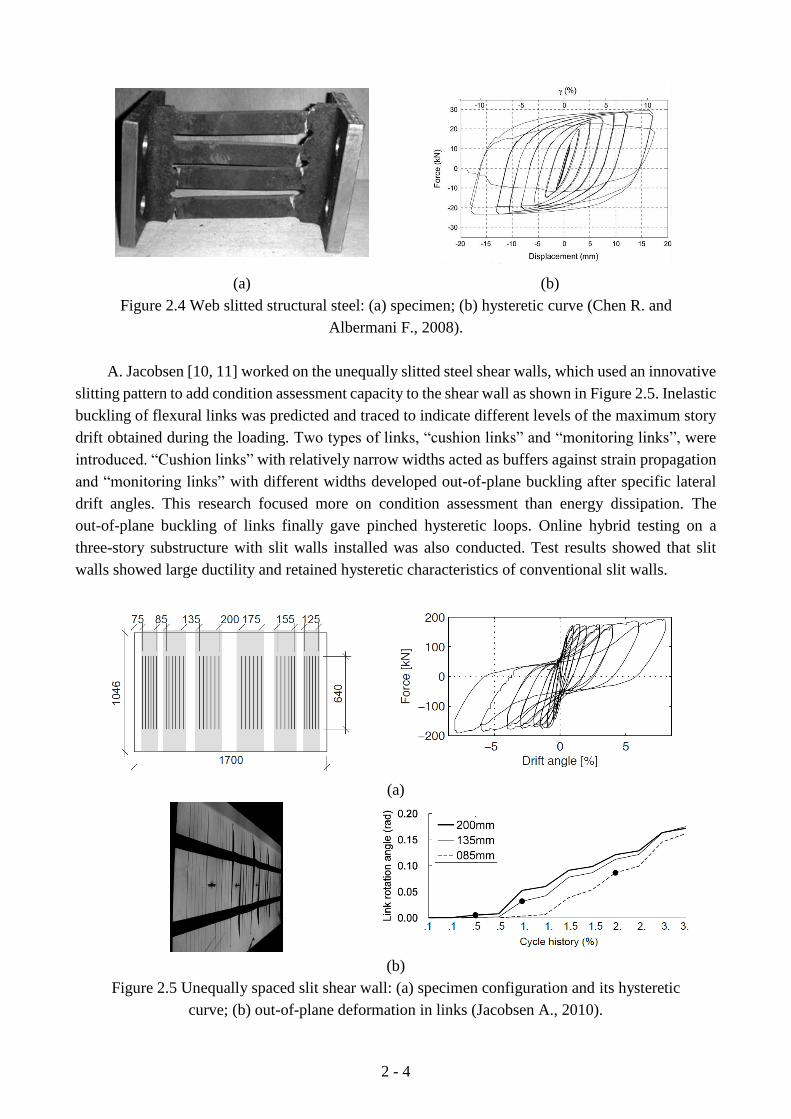
Figure 2.4 Web slitted structural steel: (a) specimen; (b) hysteretic curve (Chen R. and
Albermani F., 2008).
A. Jacobsen [10, 11] worked on the unequally slitted steel shear walls, which used an innovative
slitting pattern to add condition assessment capacity to the shear wall as shown in Figure 2.5. Inelastic
buckling of flexural links was predicted and traced to indicate different levels of the maximum story
drift obtained during the loading. Two types of links, “cushion links” and “monitoring links”, were
introduced. “Cushion links” with relatively narrow widths acted as buffers against strain propagation
and “monitoring links” with different widths developed out-of-plane buckling after specific lateral
drift angles. This research focused more on condition assessment than energy dissipation. The
out-of-plane buckling of links finally gave pinched hysteretic loops. Online hybrid testing on a
three-story substructure with slit walls installed was also conducted. Test results showed that slit
walls showed large ductility and retained hysteretic characteristics of conventional slit walls.
(a)
(b)
Figure 2.5 Unequally spaced slit shear wall: (a) specimen configuration and its hysteretic
curve; (b) out-of-plane deformation in links (Jacobsen A., 2010).

2 - 5
Chen and Ke [12] also conducted the research on SSSWs, as shown in Figure 2.6. They
particularly studied the bolt force in connection and the influence of axial force applied in SSSWs.
They suggested denser bolts arranged at wall edge to prevent slippage under large drift. Parametric
study on axial load applied in SSSWs suggested that its effect would be minor when the axial load
within half of the corresponding buckling load. They also gave a design procedure with energy
dissipation considered.
(a) (b)
Figure 2.6 Steel slit shear wall: (a) specimen; (b) hysteretic curve (Chen Y. and Ke K., 2013).
2.2.2 With buckling constraint
To prevent premature out-of-plane bucking in both links and walls, different types of buckling
constraint were studied. Considering the observed insufficient constraint provided by edge stiffeners,
Hitaka and Matsui [7] investigated mortar panels instead of vertical edge stiffeners, as shown in
Figure 2.7. Compared with the specimen with edge stiffeners, mortar panels successfully restrained
the out-of-plane deformation of slit wall up to a larger drift ratio of 2% and the hysteretic loops
were plumper. They concluded that mortar panels might be used for transverse stiffening, when the
shear capacity of slit wall was large and close to the buckling strength.
Figure 2.7 Stiffened by mortal panels (Hitaka T. et al., 2007).
X. Ma et al. [13] tested SSSWs with buckling constraint, as shown in Figure 2.8. Two types of
buckling constraint were used, one using backing plates at link ends and the other by sandwiched
channels. For the backing-plate connection, link ends were welded to an extended thicker plate,
which provided partial out-of-plane bracing; channels on both sides were installed to restrain
buckling of links. Both delayed strength degradation, but with limited impact. Unfortunately,

2 - 6
restraining buckling also gave earlier and severer strain concentration at link ends. The
backing-plate connection was also a viable design alternative for the connection with reinforced
concrete walls.
(a)
(b)
Figure 2.8 Buckling constrained slit wall: (a) constrained by backing plates and its hysteretic
curve; (b) constrained by channels and its hysteretic curve (Ma X. et al., 2010).
Gortes and Liu [14] studied the behavior of SSSWs as an independent unit to resist the entire
base shear instead of just a portion in the design by Hitaka and Matsui [7]. Another difference was
the wall’s width-height ratio of 1:2 instead of 1:1 by Hitaka and Matsui. Three specimens were
designed with edge stiffeners, as shown in Figure 2.9(a). The first specimens had three rows of nine
links in each row (T1), second specimen had two rows of eight links in each row with a stiff stub
beams at the top and bottom to increase stiffness (T2) and third specimen was with the same
dimensions as the first except for the existence of buckling restraint channels (BR). Existence of the
stub beam allowed a smaller height for the wall and therefore, a higher stiffness. The stub beam
needed to satisfy a minimum stiffness for reducing the influence on wall’s stiffness. With the
restraint channels, strength was increased and stiffness reduction was smaller. Severe fracture at slit
ends was also observed. Wall-frames were also tested as shown in Figure 2.9(b), which confirmed
that the stiffness of SSSWs was affected by the flexural rigidity of the beams connected.
2 - 7
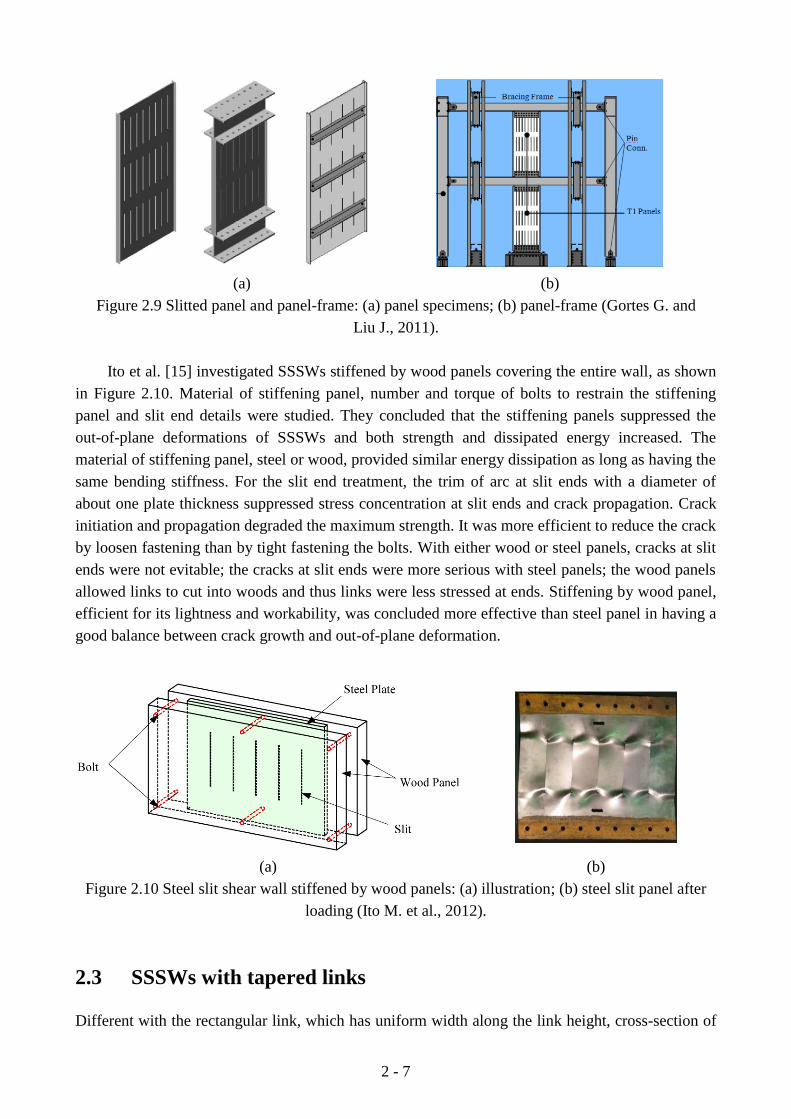
(a) (b)
Figure 2.9 Slitted panel and panel-frame: (a) panel specimens; (b) panel-frame (Gortes G. and
Liu J., 2011).
Ito et al. [15] investigated SSSWs stiffened by wood panels covering the entire wall, as shown
in Figure 2.10. Material of stiffening panel, number and torque of bolts to restrain the stiffening
panel and slit end details were studied. They concluded that the stiffening panels suppressed the
out-of-plane deformations of SSSWs and both strength and dissipated energy increased. The
material of stiffening panel, steel or wood, provided similar energy dissipation as long as having the
same bending stiffness. For the slit end treatment, the trim of arc at slit ends with a diameter of
about one plate thickness suppressed stress concentration at slit ends and crack propagation. Crack
initiation and propagation degraded the maximum strength. It was more efficient to reduce the crack
by loosen fastening than by tight fastening the bolts. With either wood or steel panels, cracks at slit
ends were not evitable; the cracks at slit ends were more serious with steel panels; the wood panels
allowed links to cut into woods and thus links were less stressed at ends. Stiffening by wood panel,
efficient for its lightness and workability, was concluded more effective than steel panel in having a
good balance between crack growth and out-of-plane deformation.
(a) (b)
Figure 2.10 Steel slit shear wall stiffened by wood panels: (a) illustration; (b) steel slit panel after
loading (Ito M. et al., 2012).
2.3 SSSWs with tapered links
Different with the rectangular link, which has uniform width along the link height, cross-section of

2 - 8
the tapered link varies along the height. The benefit of having a tapered shape is the relocation of
yielding away from link ends, though bending moment is the maximum at link ends under shear
deformation. Kobori et al. [16] proposed the honeycomb damper, which was made from steel plates
with honeycomb-shaped openings, as shown in Figure 2.11(a). With the rigid walls extended from
mid-span upper and lower story beams, story drift was concentrated in the damper. 20 mm thick
plate was used and almost square hysteretic loops were obtained even at large drifts (Figure
2.11(b)).
(a) (b)
Figure 2.11 Honeycomb plate: (a) specimen; (b) hysteretic curve (Kobori T. et al., 1992).
X. Ma et al. [13] worked on highly ductile fuses for energy dissipation in rocking system. The
fuse of tapered shape was named butterfly fuse, as shown in Figure 2.12. The ratio of end-section
width over mid-section width was determined as 3, to eliminate strain concentration at link ends
while at quarter-height section. As shear deformation increased, yielding propagated around quarter
height and eventually buckled out of plane. The buckling was controlled by the width. Wider links
buckled earlier than thicker links, which produced pinching in hysteretic loops. The butterfly fuse
reduced fractures at link ends to a large extent. When the link was thick enough, buckling was
prevented and bending behavior was the only dominant mode until the ultimate failure due to
low-cycle fatigue.
(a) (b)
Figure 2.12 Butterfly shape links: (a) specimen; (b) hysteretic curve (Ma X. et al., 2010).
They also tested fuses with welded backing plate connection, as shown in Figure 2.13. The
restraining effect on reducing strength degradation was not as notable. Links gouged against
backing plates as they twisted, which gave frictional force that contributed to total shear resistance.

2 - 9
(a) (b)
Figure 2.13 Constrained by backing plates: (a) specimen; (b) hysteretic curve (Ma X. et al.,
2010).
2.4 Summary
The past research on SSSWs has shown that the SSSW system has a large initial stiffness, ultimate
strength and ductility. The width-thickness ratio is the controlling parameter for restraining
out-of-plane buckling in links. Through careful design, full plasticity can be developed at link ends
and becomes the source of energy dissipation.
Unfortunately, the following issues related to SSSWs have not yet well addressed. In SSSWs,
strain concentration at link ends and subsequent fracture were identified. Fracture at link ends caused
strength degradation and accordingly lessened energy dissipation. An effective solution to eliminate
the fracture has not been given. Besides, the hysteretic loops of SSSWs were not that plump as
desired, in view of an efficient passive damper. Certainly, thicker plates would give more plump
loops, because of the later and less amount of out-of-plane deformation of links. However, in view of
the cost and added weight to the gravity-resisting system, relatively thin plates are more preferable in
practice. Within the domain of thin plates, several restraining methods were used to restrain the
out-of-plane buckling in both the wall and links, including edge stiffeners, partially sandwiched
channels and whole wood/mortar/steel plates, which certainly delayed strength degradation and
enhanced energy dissipation. However, the way of restraining is not considered as effective. First,
leaving aside the complex design and fabricating, improvement of energy dissipation with restraining
was not that notable compared to without restraining. Second, adverse effect was observed with
restraining, that is, the early initiation of fracture. Since the link cannot buckle out of plane, strain
concentration is more severe and consequently fracture propagation is accelerated, which may give a
more brittle failure.
In the perspective of having good energy dissipation capacity by using SSSWs, how to eliminate
fracture at the ends of the link and obtain plump hysteretic loops, while with no/little demand of
out-of-plane constraint and complex treatment, is expected.

2 - 10
REFERENCES
[1] Ohmori N., Toyama K., Cho T. and Takahashi T. Studies on reinforced concrete slit walls.
Summaries of Technical Papers of Annual Meeting AIJ (41) 1966, 204 (in Japanese).
[2] Muto K. Earthquake resistant design of 36-storied Kasumigaseki building. Proc., 4th World
Conference on Earthquake Engineering 1969, 3, J-4, pp. 16-33.
[3] Muto K., Ohmori N. and Takahashi T. Study on slitted walls. Concrete Journal 1974; Vol. 12,
No. 4, pp. 15-25 (in Japanese).
[4] Nakashima M. and Chulsip P. A partial view of Japanese post-kobe seismic design and
construction practices. Earthquake Engineering and Engineering Seismology 2003; 4(1):3-13.
[5] Juan Enrique Martı´nez-Rueda. On the Evolution of Energy Dissipation Devices for Seismic
Design. Earthquake Spectra 2002; Vol. 18, No. 2, pp. 309-346.
[6] Huang Y.H., Yamada T. and A. Wada, etc. Actual size and real time speed tests for hysteretic
steel damper. Proc., STESSA 1997, Kyoto, Japan.
[7] Hitaka T. and Matsui C. Experimental study on steel shear wall with slits. Journal of Structural
Engineering 2003; 129:5, 586-595.
[8] Hitaka T, Matsui C and Sakai J. Cyclic tests on steel and concrete-filled tube frames with Slit
Walls. Earthquake Engineering and Structural Dynamics 2007; 36(6):707-727.
[9] Chan R. and Albermani F. Experimental study of steel slit damper for passive energy dissipation.
Engineering Structures 2008; 30(4):1058-1066.
[10] Jacobsen A., Hitaka T. and Nakashima M. Online test of building frame with slit-wall dampers
capable of condition assessment. Journal of Constructional Steel Research 2010; 66(11):
1320-1329.
[11] Jacobsen A. Development of steel slit wall dampers with embedded condition assessment
capabilities. Ph.D dissertation, Kyoto University, 2010.
[12] Chen Y. and Ke K. Improvement in SSWS design and study of the performance of steel
frame-SSWS system. Proc., 10th International conference on urban earthquake engineering
2013, Tokyo, Japan.
[13] Ma X., Borchers E., Peña A., Krawinkler H., Billington S. and Deierlein G. Design and behavior
of steel shear plates with openings as energy-dissipating fuses. John A. Blume Earthquake
Engineering Center Technical Report 173, Stanford Digital Repository, 2010. (Available from
http://purl.stanford.edu/hq943jb9995)
[14] Cortes G. and Liu J. Analysis and design of steel slit panel frames (SSPFs) for seismic areas.
Engineering Journal 2011; 48 (1): 1-17.
[15] Ito M., Taniguchi Y., Tsuboyama N., Hoki K. and Nakashima M. Stiffening methods for
enhancement of hysteretic performance of slitted steel shear walls. Proc., 15th World
Conference of Earthquake Engineering 2012, Lisboa.
[16] Kobori T, Miura Y, Fukusawa E, Yamada T, Arita T, Takenake Y and Akiba I. Development and
application of hysteretic steel dampers. Proc., 11th world conference on earthquake engineering
1992, Madrid, Spain, 2341-2346.

3 - 1
CHAPTER 3
Design of double-tapered links for structural condition assessment
3.1 Introduction
3.1.1 Background
Adding the capacity of structural condition assessment to the steel slit shear wall in addition to its
original task as a passive damper is the primary objective of this study. The concept of having a
steel shear wall function for structural health monitoring is not new and there were attempts [1-3].
In their development, slit shear walls shown in Figure 3.1, were designed and tested. A few links
with different widths were arranged in the wall and were loaded cyclically with increasing
amplitudes. The wider links buckled earlier, followed by the buckling of narrower links. In that
study, the concept for monitoring using slit shear walls was found feasible, but the following two
problems were identified. One was the degree of buckling, and the other was cracks initiated from
the edge of the link. Although each link exhibited buckling and corresponding out-of-plane
deformation involving torsional deformation, the degree of the deformation was not significantly
large, which had made it rather difficult to judge whether or not it sustained “notable” deformation.
As the link behaved as a flexural member, the maximum strain (and the corresponding plastic hinge)
occurred at the end of the link, i.e., the slit edge. The large strain at the edge triggered fracture at
that location, which in turn made the growth of torsional deformation unstable and inconsistent, and
lessened the dissipation of energy.
(a) (b)
Figure 3.1 Previous research: (a) test specimen; (b) at a drift ratio of 1% (Jacobsen A., 2010).
This work proposes the steel slit wall with monitoring links of a novel double-tapered shape.

3 - 2
The concept of the new slit shear wall is illustrated in Figure 3.2(a). It is made of a steel plate with
many diamond-shaped openings (manufactured using laser-cutting) and each segment is bounded
by two adjacent openings, named the double-tapered link (Figure 3.2(b)). Unlike the rectangular
links which were common in the slit shear wall [4-8], the new shape is no longer uniform in width
along the height but narrowed toward the mid-height. When the wall sustains in-plane shear
deformation (named lateral drift), each link behaves as a flexural member at the point of inflection
located at mid-height, yields and later involves torsional deformation. The summation of the
energies dissipated in individual links equates to the energy dissipated by the slit wall. As shown in
Figure 3.2(c), each link exhibits torsional deformation after experiencing a certain level of inelastic
cyclic lateral drift. Here torsional deformation is meant to be the out-of-plane rotation of the link
caused by the buckling of the plate. Initiation of torsional deformation is controlled by the width of
the link, i.e., earlier torsional deformation occurs in a wider link. The rotation angle steadily
increases for larger lateral drifts to a degree such that torsional deformation is apparent to the eye.
Enlightened by this observation, the following inspection procedure by which the maximum lateral
drift experienced by the slit shear wall can be estimated is proposed.
Beam
Co
lum
n
Rigid element
Beam
Colu
mn
Rigid element
Double-tapered link
Opening
Isometric
Top-down
(a) (b) (c)
Figure 3.2 Schematic diagram: (a) installation illustration; (b) a reference shear wall with
double-tapered links; (c) torsional deformation.
Suppose the slit shear wall consists of three links of different widths (Figure 3.2(b)), with the
widest link (Link A) exhibiting notable torsional deformation at a lateral drift ratio of 1% (the
lateral drift divided by the link height), the second widest link (Link B) at a lateral drift ratio of 2%,
and the narrowest link (Link C) at a lateral drift ratio of 3%. If no link shows notable torsional
deformation, the maximum lateral drift ratio sustained by the wall is no greater than 1%. If only
Link A shows notable torsional deformation, the maximum lateral drift ratio is greater than 1% but
smaller than 2%. If Links A and B show notable torsional deformation, the maximum lateral drift
ratio is between 2% and 3%, and so forth.
The concept of double-tapered steel component is not new but had been explored in the past,
such as added damping and stiffness (ADAS) elements [9-11], honeycomb damper [12], and
so-called butterfly fuse [13]. They used this component for the means of energy dissipation. The
primary intention of the tapered shape proposed here is not the enhanced energy dissipation but the
relocation of the plastic hinge away from the edge of the link, by which initiation and growth of the
cracks would be avoided. Another, more important aspect of this shape is that the degree of
torsional deformation can be significantly amplified relative to the conventional rectangular shape.
3 - 3
3.1.2 Organization
This chapter first introduces how the shape of the double-tapered link is designed. Second,
parametric study on two parameters, the aspect ratio and width-thickness ratio, was conducted to
study the controlling parameter for the initiation and growth of torsional deformation. Ten pairs of
specimens were designed to verify the numerical findings. Finally, two types of in-plane reference
were designed and tested to examine the effectiveness of the prosed in-plane reference in improving
the easiness and objectivity in visual inspection.
3.2 Shape design of double-tapered links
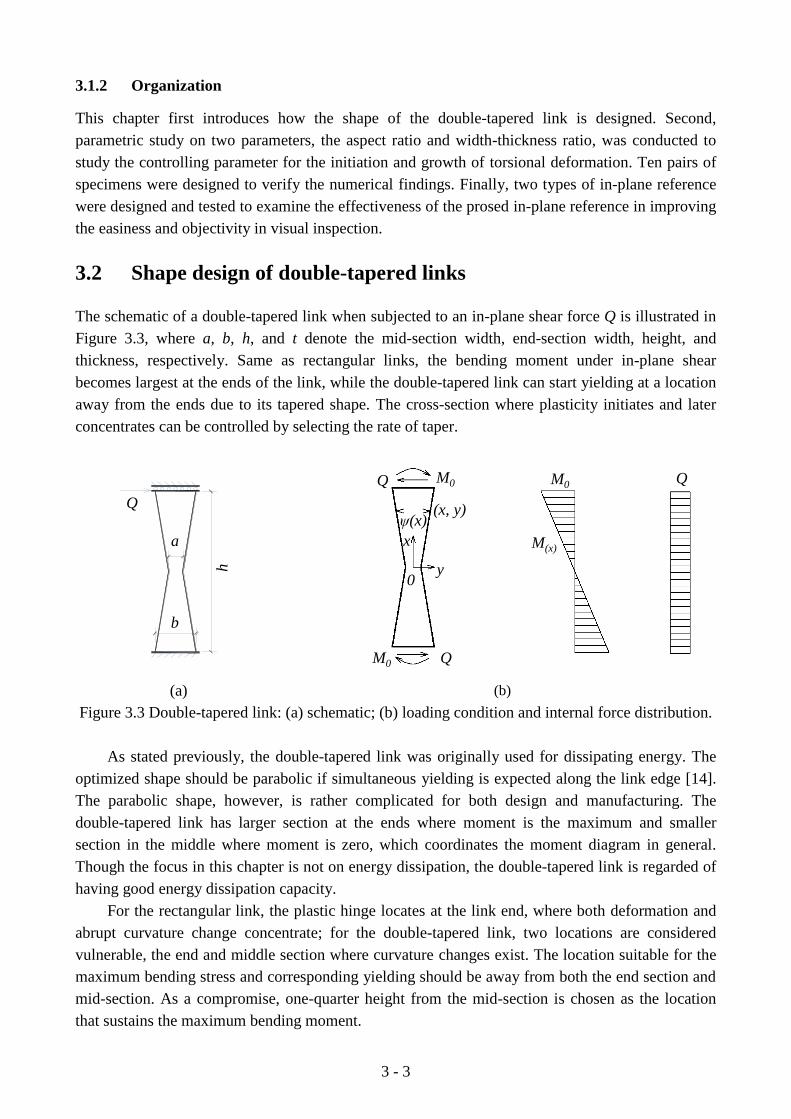
The schematic of a double-tapered link when subjected to an in-plane shear force Q is illustrated in
Figure 3.3, where a, b, h, and t denote the mid-section width, end-section width, height, and
thickness, respectively. Same as rectangular links, the bending moment under in-plane shear
becomes largest at the ends of the link, while the double-tapered link can start yielding at a location
away from the ends due to its tapered shape. The cross-section where plasticity initiates and later
concentrates can be controlled by selecting the rate of taper.
Q
a
b
h
M0Q
M0 Q
ψ(x)
y
x
0
(x, y)
M0
M(x)
Q
(a) (b)
Figure 3.3 Double-tapered link: (a) schematic; (b) loading condition and internal force distribution.
As stated previously, the double-tapered link was originally used for dissipating energy. The
optimized shape should be parabolic if simultaneous yielding is expected along the link edge [14].
The parabolic shape, however, is rather complicated for both design and manufacturing. The
double-tapered link has larger section at the ends where moment is the maximum and smaller
section in the middle where moment is zero, which coordinates the moment diagram in general.
Though the focus in this chapter is not on energy dissipation, the double-tapered link is regarded of
having good energy dissipation capacity.
For the rectangular link, the plastic hinge locates at the link end, where both deformation and
abrupt curvature change concentrate; for the double-tapered link, two locations are considered
vulnerable, the end and middle section where curvature changes exist. The location suitable for the
maximum bending stress and corresponding yielding should be away from both the end section and
mid-section. As a compromise, one-quarter height from the mid-section is chosen as the location
that sustains the maximum bending moment.

3 - 4
The plastic hinge can be found by locating the maximum stress. The ratio of end-section width
to mid-section width (b/a) is a key parameter for determining the configuration of the
double-tapered link. The following derivation gives b/a that leads to the plastic hinge formed at the
quarter-height section.
The location of first yielding corresponds to the location of maximum bending stress. With the
coordinate system shown in Figure 3.3, the bending stress along the link edge is calculated as
0( ) 1σ( )
2( )2
3
( )
M x y M
I x ht
h
xb a a
xx
(3.1)
where ( )M x is the bending moment at the cross-section whose ordinate is x, with M0 the bending
moment at the end section, and 3
x 2y /12I t the moment of inertia at the cross-section
whose ordinate is x. The maximum bending stress is derived by solving the first order differential
equation: / 0d dx , which leads to
0
max
3
2 ( )
M
at b a
, when
2( - )
ahx
b a . (3.2)
Inserting / 4x h in Equation (3.2), / 3b a is attained. This means that the link should be
tapered so that the width of the mid-section is made 1/3 the width at the end.
3.3 Parametric analysis
Given the thickness of the link t and the width ratio between the end section and mid-section,
/ 3b a , the mid-section width a and height h are the two variables that would control the
behaviour of the double-tapered link. Two parameters are defined first for the parametric analysis,
one is the width-thickness ratio and the other is the aspect ratio . As the quarter height from
the mid-section would yield first and trigger the post-yielding behaviour including buckling and
succeeding torsional deformation, the quarter height, with the width of 2a, was taken as the critical
section. Thus, width of quarter height 2a, instead of mid-section width a, is used in the parameter
definition: the width-thickness ratio defined as 2 /a t and the aspect ratio as / 2h a .
3.3.1 Numerical model
To understand the post-yielding behaviour of the double-tapered link, preliminary analysis was
conducted using a commercial finite element (FE) code, ABAQUS 6.10 [15]. In the FE model,
three-dimensional four-node shell element with reduced integration (S4R) was adopted to represent
the link. S4R is a general purpose linear 4-sided shell element valid for both thick and thin shell
problems. Compared with the S4 element with four integration points, the S4R element uses a
reduced integration rule with one integration point, which makes this element computationally less
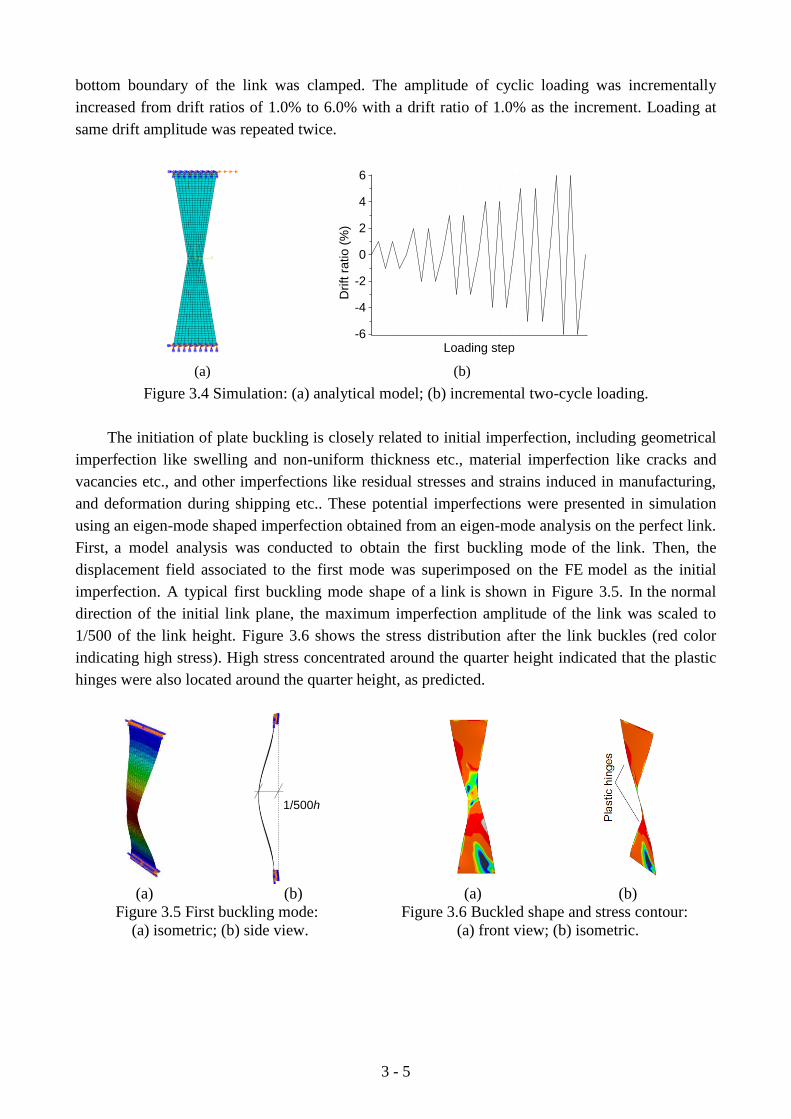
expensive. Figure 3.4 shows the analytical model and loading history used in simulation.
Displacement-controlled cyclic loading was applied to the top boundary of the link, while the
3 - 5
bottom boundary of the link was clamped. The amplitude of cyclic loading was incrementally
increased from drift ratios of 1.0% to 6.0% with a drift ratio of 1.0% as the increment. Loading at
same drift amplitude was repeated twice.
-6
-4
-2
0
2
4
6
Drift r
atio (
%)
Loading step
(a) (b)
Figure 3.4 Simulation: (a) analytical model; (b) incremental two-cycle loading.
The initiation of plate buckling is closely related to initial imperfection, including geometrical
imperfection like swelling and non-uniform thickness etc., material imperfection like cracks and
vacancies etc., and other imperfections like residual stresses and strains induced in manufacturing,
and deformation during shipping etc.. These potential imperfections were presented in simulation
using an eigen-mode shaped imperfection obtained from an eigen-mode analysis on the perfect link.
First, a model analysis was conducted to obtain the first buckling mode of the link. Then, the
displacement field associated to the first mode was superimposed on the FE model as the initial
imperfection. A typical first buckling mode shape of a link is shown in Figure 3.5. In the normal
direction of the initial link plane, the maximum imperfection amplitude of the link was scaled to
1/500 of the link height. Figure 3.6 shows the stress distribution after the link buckles (red color
indicating high stress). High stress concentrated around the quarter height indicated that the plastic
hinges were also located around the quarter height, as predicted.
1/500h
(a) (b) (a) (b)
Figure 3.5 First buckling mode:
(a) isometric; (b) side view.
Figure 3.6 Buckled shape and stress contour:
(a) front view; (b) isometric.
3 - 6
3.3.2 Material property
Considering the structural steel plate available in market and proper lightness of future specimens so
that one person can easily carry in small-scale tests later, a 4.5 mm thick steel plate was first
determined to be used in manufacturing double-tapered links and accordingly the same thickness was
used in numerical analysis.
Mild steel SS400, a Japanese steel grade equivalent to ASTM A36, is one of the most commonly
used hot rolled general structural steel. To get the basic mechanic property, tensile coupon tests were
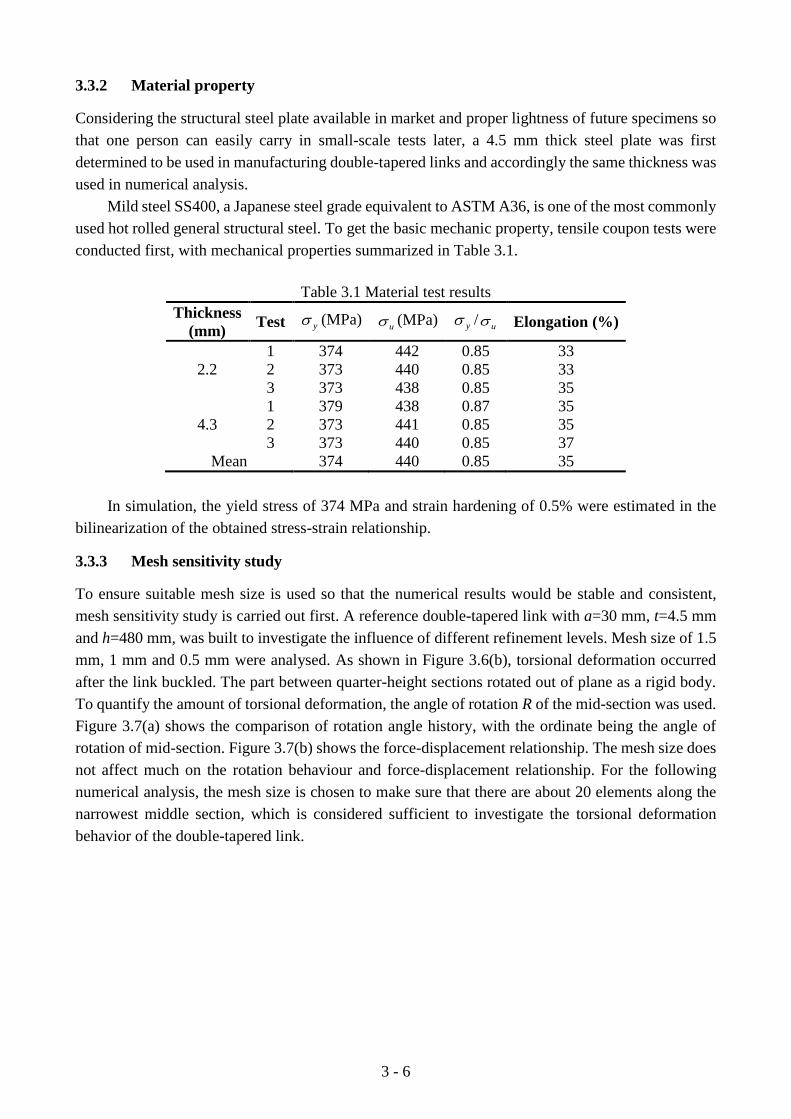
conducted first, with mechanical properties summarized in Table 3.1.
Table 3.1 Material test results
Thickness
(mm) Test y (MPa)
u (MPa) y /u Elongation (%)
2.2
1 374 442 0.85 33
2 373 440 0.85 33
3 373 438 0.85 35
4.3
1 379 438 0.87 35
2 373 441 0.85 35
3 373 440 0.85 37
Mean 374 440 0.85 35
In simulation, the yield stress of 374 MPa and strain hardening of 0.5% were estimated in the
bilinearization of the obtained stress-strain relationship.
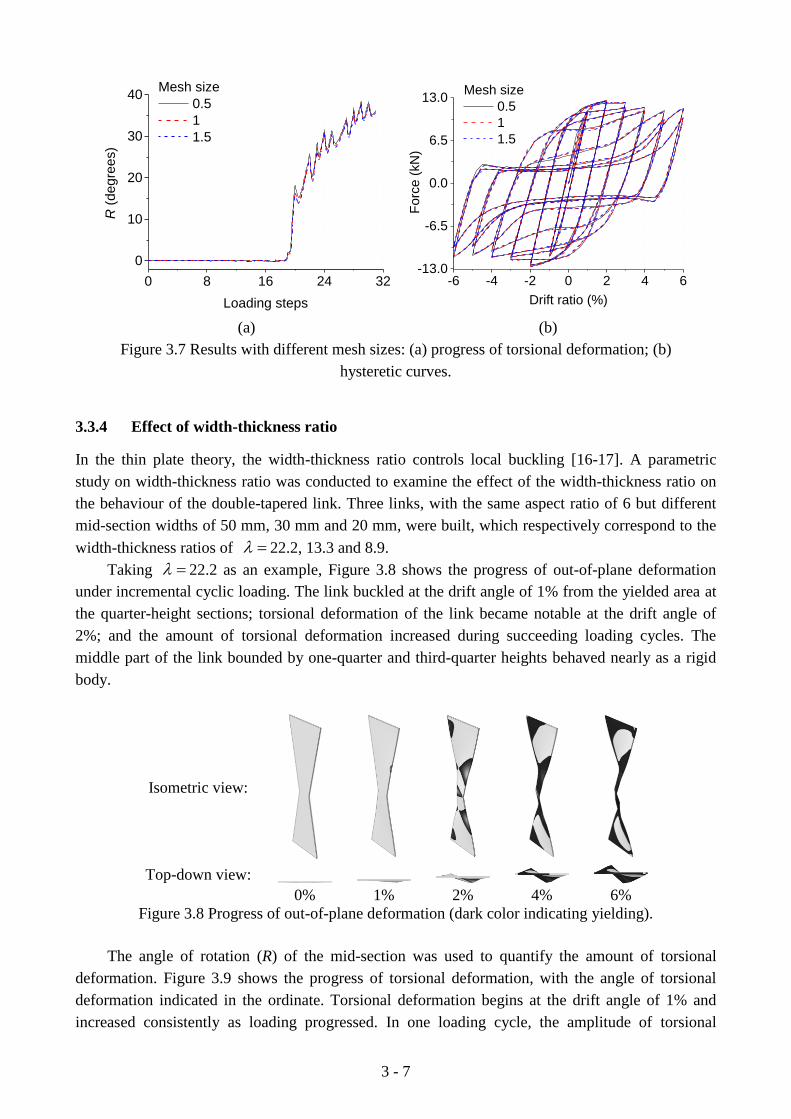
3.3.3 Mesh sensitivity study
To ensure suitable mesh size is used so that the numerical results would be stable and consistent,
mesh sensitivity study is carried out first. A reference double-tapered link with a=30 mm, t=4.5 mm
and h=480 mm, was built to investigate the influence of different refinement levels. Mesh size of 1.5
mm, 1 mm and 0.5 mm were analysed. As shown in Figure 3.6(b), torsional deformation occurred
after the link buckled. The part between quarter-height sections rotated out of plane as a rigid body.
To quantify the amount of torsional deformation, the angle of rotation R of the mid-section was used.
Figure 3.7(a) shows the comparison of rotation angle history, with the ordinate being the angle of
rotation of mid-section. Figure 3.7(b) shows the force-displacement relationship. The mesh size does
not affect much on the rotation behaviour and force-displacement relationship. For the following
numerical analysis, the mesh size is chosen to make sure that there are about 20 elements along the
narrowest middle section, which is considered sufficient to investigate the torsional deformation
behavior of the double-tapered link.
3 - 7
0 8 16 24 32
0
10
20
30
40R
(degre
es)
Loading steps
Mesh size
0.5
1
1.5
-6 -4 -2 0 2 4 6-13.0
-6.5
0.0
6.5
13.0
Fo
rce
(kN
)
Drift ratio (%)
Mesh size
0.5
1
1.5
(a) (b)
Figure 3.7 Results with different mesh sizes: (a) progress of torsional deformation; (b)
hysteretic curves.
3.3.4 Effect of width-thickness ratio
In the thin plate theory, the width-thickness ratio controls local buckling [16-17]. A parametric
study on width-thickness ratio was conducted to examine the effect of the width-thickness ratio on
the behaviour of the double-tapered link. Three links, with the same aspect ratio of 6 but different
mid-section widths of 50 mm, 30 mm and 20 mm, were built, which respectively correspond to the
width-thickness ratios of 22.2, 13.3 and 8.9.
Taking 22.2 as an example, Figure 3.8 shows the progress of out-of-plane deformation
under incremental cyclic loading. The link buckled at the drift angle of 1% from the yielded area at
the quarter-height sections; torsional deformation of the link became notable at the drift angle of
2%; and the amount of torsional deformation increased during succeeding loading cycles. The
middle part of the link bounded by one-quarter and third-quarter heights behaved nearly as a rigid
body.
Isometric view:
Top-down view:
0% 1% 2% 4% 6%
Figure 3.8 Progress of out-of-plane deformation (dark color indicating yielding).
The angle of rotation (R) of the mid-section was used to quantify the amount of torsional
deformation. Figure 3.9 shows the progress of torsional deformation, with the angle of torsional
deformation indicated in the ordinate. Torsional deformation begins at the drift angle of 1% and
increased consistently as loading progressed. In one loading cycle, the amplitude of torsional

3 - 8
deformation is the largest at the maximum drift angle and decreases as the link is unloaded to zero
displacement. It is natural because of the elastic component present at the maximum drift angle. The
ratio of reduction of torsional deformation by unloading is large right after the onset of buckling but
becomes smaller with the increase of amplitude. This observation is important since the condition
assessment of the wall is performed after a major earthquake, in which the residual story drift is
commonly not so significant.
-6 -4 -2 0 2 4 6
0
10
20
30
40
50
R (
degre
es)
Drift ratio (%)
Figure 3.9 Progress of torsional deformation ( 22.2).
Figure 3.10 shows the progress of torsional deformation with respect to the drift angle. Note
that the angle R in ordinate is the angle measured at the instant when two cycles of each amplitude
are completed and the drift angle returns to zero. It is clear that the initiation and growth of torsional
deformation differs with . The values adopted here, i.e., 22.2, 13.3 and 8.9 were chosen
such that they would exhibit torsional deformation at the drift angles of 1%, 2% and 4%,
respectively.
0 1 2 3 4 5 6
0
10
20
30
40
50 Width-thickness ratio
(Aspect ratio of 6)
22.2
13.3
8.9
R (
de
gre
es)
Drift ratio (%)
Figure 3.10 Progress of torsional deformation for links with various width-thickness ratios.
Figure 3.11 shows the progress of torsional deformation at different levels of residual
deformation, with dashed lines indicating the rotation at zero residual deformation. The lower and
upper solid lines correspond to the rotation angle at the residual drift ratio of 20% and 40% of the
maximum drift ratio before and after the completion of two-cycle loading. The rotation at the
residual drift ratio of 40% of the maximum drift ratio was larger than that at the residual drift ratio
of 20% of the maximum drift ratio, however, with minor difference. Besides, for each
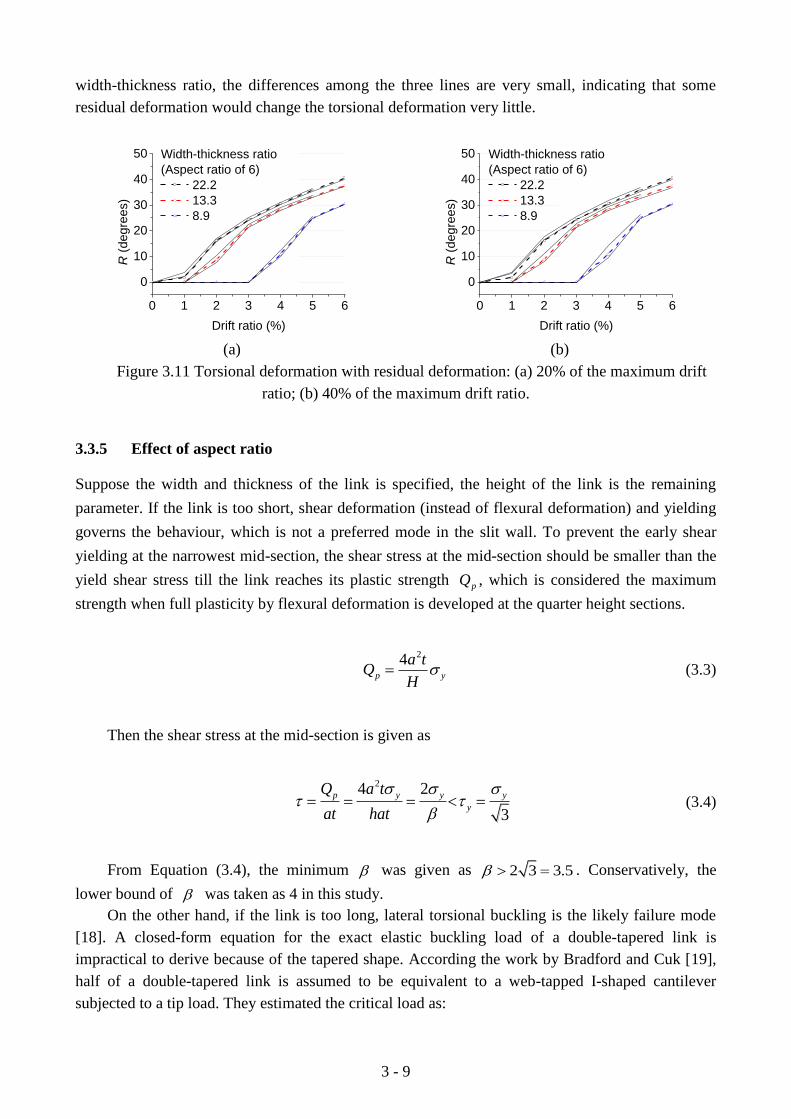
3 - 9
width-thickness ratio, the differences among the three lines are very small, indicating that some
residual deformation would change the torsional deformation very little.
0 1 2 3 4 5 6
0
10
20
30
40
50 Width-thickness ratio
(Aspect ratio of 6)
22.2
13.3
8.9
R (
de
gre
es)
Drift ratio (%)
0 1 2 3 4 5 6
0
10
20
30
40
50 Width-thickness ratio
(Aspect ratio of 6)
22.2
13.3
8.9
R (
de
gre
es)
Drift ratio (%)
(a) (b)
Figure 3.11 Torsional deformation with residual deformation: (a) 20% of the maximum drift
ratio; (b) 40% of the maximum drift ratio.
3.3.5 Effect of aspect ratio
Suppose the width and thickness of the link is specified, the height of the link is the remaining
parameter. If the link is too short, shear deformation (instead of flexural deformation) and yielding
governs the behaviour, which is not a preferred mode in the slit wall. To prevent the early shear
yielding at the narrowest mid-section, the shear stress at the mid-section should be smaller than the
yield shear stress till the link reaches its plastic strength pQ , which is considered the maximum
strength when full plasticity by flexural deformation is developed at the quarter height sections.
24p y
a tQ
H (3.3)
Then the shear stress at the mid-section is given as
24 2
3
p y y y
y
Q a t
hatat
(3.4)
From Equation (3.4), the minimum was given as 2 3 3.5 . Conservatively, the
lower bound of was taken as 4 in this study.
On the other hand, if the link is too long, lateral torsional buckling is the likely failure mode
[18]. A closed-form equation for the exact elastic buckling load of a double-tapered link is
impractical to derive because of the tapered shape. According the work by Bradford and Cuk [19],
half of a double-tapered link is assumed to be equivalent to a web-tapped I-shaped cantilever
subjected to a tip load. They estimated the critical load as:

3 - 10
0
2
( )y
lt
EI GJQ
l
(3.5)
where l is half length of the link; is the coefficient against the beam torsion parameter
0( )wEIk
l GJ
, with wEI as the warping rigidity and GJ as the torsional stiffness; and the
subscript 0 indicating the rigidities at the largest root section.
An associated empirical equation for is as:
3.24 3.94k (3.6)
To study the effect of aspect ratio, double-tapered links having the mid-section width of 30
mm and thickness t of 4.5 mm, was considered as the prototype links. For 10 as an example,
the elastic lateral torsional buckling load ltQ is 80.8 kN, while the load corresponding to the shear
yield strength yQ is 60.6 kN. This means that the elastic lateral torsional buckling is not a
dominant mode to promote the out-of-plane deformation. Following the equation, the height of
2,250 mm is needed if the link of a=30 mm and t=4.5 mm buckles in the lateral torsional mode at
the load of yQ . The corresponding aspect ratio is 12.5, which is greater than the range of
aspect ratios commonly used for slit walls, i.e., between 3 and 10.
For the prototype double-tapered links, Figure 3.12 shows the progress of torsional
deformation for various aspect ratios ranging from 4 to 10. For larger aspect ratios, the growth of
rotation is somewhat slower, but overall the difference is considered minor as compared to the
difference observed for different width-thickness ratios. These observations indicate that the
width-thickness ratio is the major parameter that would control the out-of-plane deformations and
according torsional deformation for the proposed double-tapered links having a proper range of
aspect ratios.
0 1 2 3 4 5 6
0
10
20
30
40
50
R (
de
gre
es)
Drift ratio (%)
Aspect ratio
(Width-thickness ratio of 13.3)
4
5
6
7
8
9
10
Figure 3.12 Progress of torsional deformation for links with various aspect ratios.
3 - 11
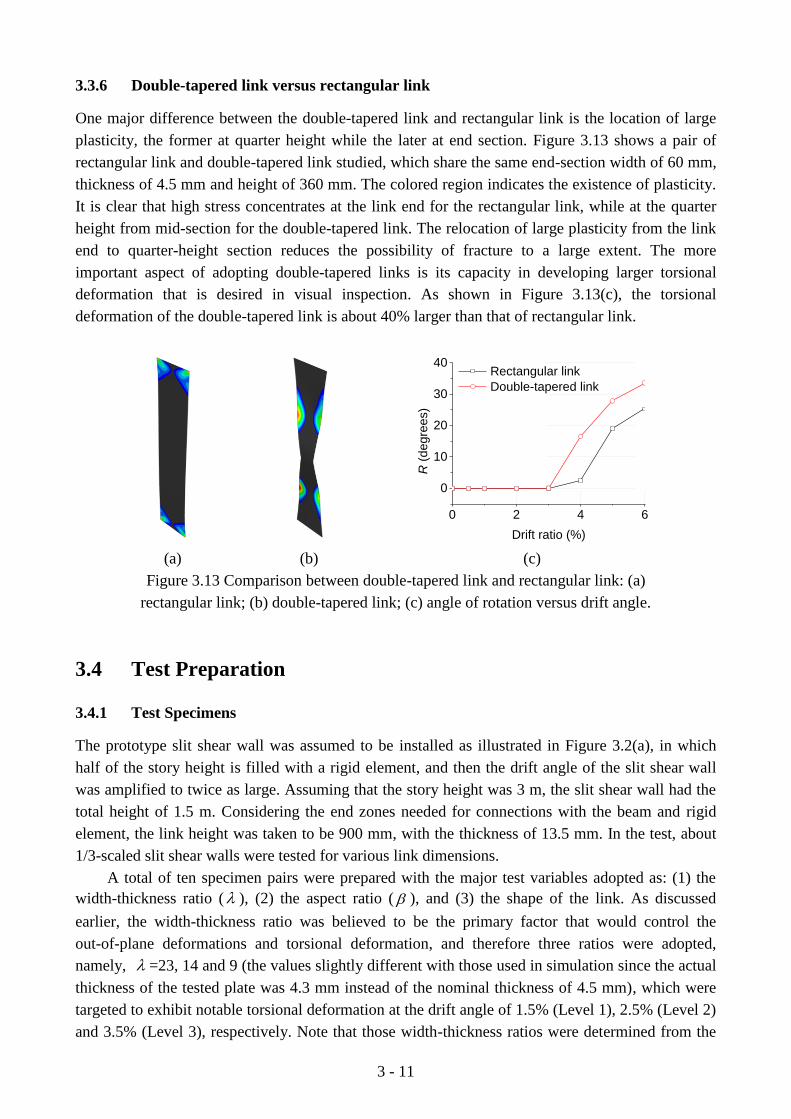
3.3.6 Double-tapered link versus rectangular link
One major difference between the double-tapered link and rectangular link is the location of large
plasticity, the former at quarter height while the later at end section. Figure 3.13 shows a pair of
rectangular link and double-tapered link studied, which share the same end-section width of 60 mm,
thickness of 4.5 mm and height of 360 mm. The colored region indicates the existence of plasticity.
It is clear that high stress concentrates at the link end for the rectangular link, while at the quarter
height from mid-section for the double-tapered link. The relocation of large plasticity from the link
end to quarter-height section reduces the possibility of fracture to a large extent. The more
important aspect of adopting double-tapered links is its capacity in developing larger torsional
deformation that is desired in visual inspection. As shown in Figure 3.13(c), the torsional
deformation of the double-tapered link is about 40% larger than that of rectangular link.
0 2 4 6
0
10
20
30
40
R (
degre
es)
Drift ratio (%)
Rectangular link
Double-tapered link
(a) (b) (c)
Figure 3.13 Comparison between double-tapered link and rectangular link: (a)
rectangular link; (b) double-tapered link; (c) angle of rotation versus drift angle.
3.4 Test Preparation
3.4.1 Test Specimens
The prototype slit shear wall was assumed to be installed as illustrated in Figure 3.2(a), in which
half of the story height is filled with a rigid element, and then the drift angle of the slit shear wall
was amplified to twice as large. Assuming that the story height was 3 m, the slit shear wall had the
total height of 1.5 m. Considering the end zones needed for connections with the beam and rigid
element, the link height was taken to be 900 mm, with the thickness of 13.5 mm. In the test, about
1/3-scaled slit shear walls were tested for various link dimensions.
A total of ten specimen pairs were prepared with the major test variables adopted as: (1) the
width-thickness ratio ( ), (2) the aspect ratio ( ), and (3) the shape of the link. As discussed
earlier, the width-thickness ratio was believed to be the primary factor that would control the
out-of-plane deformations and torsional deformation, and therefore three ratios were adopted,
namely, =23, 14 and 9 (the values slightly different with those used in simulation since the actual
thickness of the tested plate was 4.3 mm instead of the nominal thickness of 4.5 mm), which were
targeted to exhibit notable torsional deformation at the drift angle of 1.5% (Level 1), 2.5% (Level 2)
and 3.5% (Level 3), respectively. Note that those width-thickness ratios were determined from the

3 - 12
FE analysis introduced in the previous section. Furthermore, two different links whose thicknesses
were different (2.2 mm and 4.3 mm) but whose width-thickness ratios remained the same (achieved
by the change of width) were tested to demonstrate that the behaviour would be similar for the same
width-thickness ratio. The aspect ratio was considered as not a controlling but a minor parameter,
and to verify it, two heights, namely 300 mm and 200 mm, were adopted. In addition, a specimen
having the aspect ratio of 3 (beyond the recommendation of at least 4, chosen to avoid shear
yielding at mid-sections) was also included to verify the recommendation. To demonstrate the
effectiveness, i.e., more enhanced torsional deformation, achieved by the double-tapered links,
conventional rectangular links were also tested for comparison. Finally, one more specimen was
added, in which the three links assigned for Levels 1, 2 and 3 were installed in one slit shear wall.
This last specimen was tested to verify the procedure to visually estimate the maximum drift angle
experienced by the wall.
Table 3.2 shows the list of ten specimen pairs, Pairs 1 to 10, and Figure 3.14 shows the
specimen dimensions. Pairs 1 to 4 were for Level 1; Pairs 5 to 8 were for Level 2; Pair 9 was for
Level 3; and Pair 10 was for the combination. Pairs 4 and 8 were with rectangular links for
comparison, with b, and in Table 3.2 as the width, /h b and /b t , respectively.
The depth of the end zone, c , defined as the distance from the hole center to the link end is also
summarized in the table. The word “Pair” was used for the specimen designation because two
identical or nearly identical specimens were tested for each loading whose detail will be presented
in the next section. In Pairs 1, 2, 4 and 8, one specimen was made of a single plate in which three
identical links were formed, while in the other specimen, three identical elements each of which had
just one link were placed together as an assembly (Figure 3.14(a), (b), (d) and (h), respectively).
This treatment was made to observe whether or not the close boundaries between the adjacent links
within a single plate would affect torsional deformation behaviour of individual links. The shaded
region denotes the part contacted with two angles that served to fix the specimen to the loading
setup (with a width of 60 mm). The circles in the shaded region are the openings for bolting. The
links were shaped by laser-cutting with a numerically controlled machine, which was found to be
very useful and accurate.
Table 3.2 Summary of test specimens
Category Pair Link dimension (mm) λ β c
Level 1
1 a/t/h=25/2.2/300 22.7 6 60
2 a/t/h=25/2.2/200 22.7 4 110
3 a/t/h=50/4.3/300 23.3 3 60
4 b/t/h=50/2.2/300 22.7 6 60
Level 2
5 a/t/h=15/2.2/300 13.6 10 60
6 a/t/h=15/2.2/200 13.6 6.7 110
7 a/t/h=30/4.3/300 14.0 5 60
8 b/t/h=30/2.2/300 13.6 10 60
Level 3 9 a/t/h=20/4.3/300 9.3 7.5 60
Combination 10 Combination of links from Pairs 3, 7 and 9

3 - 13
300
48
0
253
0
30
0
30
170 10
48
0
25
30
30
0
30
530
300
48
0
25
80
3
00
8
0
(a)-1 (a)-2 (b)-1
170 104
8025
80
2
00
8
0
530
540
48
0
503
0
30
0
30
300
48
050
30
3
00
3
0
(b)-2 (c) (d)-1
170 10
48
050
30
3
00
3
0
530
540
48
0
15
30
30
0
30
540
48
0
15
80
2
00
8
0
(d)-2 (e) (f)
540
48
0
30
30
30
0
30
300
48
030
30
30
0
30
110 10
48
030
30
30
0
30
470
(g) (h)-1 (h)-2
540
48
0
20
30
30
0
30
540
48
0
20
30
30
0
30
30 50
(i) (j)
Figure 3.14 Details of specimens (unit: mm): (a)-(j) Pairs 1-10.
The material of steel used is the conventional mild steel SS400, whose property was

3 - 14
summarized in Table 3.1 in Section 3.3.2.
3.4.2 Criterion for notable torsional deformation
In this study, observation of notable torsional deformation is done by visual inspection relying upon
naked eyes. Although sounding rather subjective, notable torsional deformation is recognized very
clearly by human once the out-of-plane displacement of the outmost edge fibers along
quarter-height sections exceeds one thickness of the link as shown in Figure 3.15. This criterion of
“off-one-thickness” corresponded to the angle of rotation (R) of 5, 8 and 12 degrees for Level 1
( =23), Level 2 ( =14), and Level 3 ( =9), respectively. Figure 3.16 shows the angle of rotation
versus drift angle relationships predicted for Pair 1 (Level 1), Pair 5 (Level 2), and Pair 9 (Level 3)
by the FE analysis. The horizontal dashed lines indicate the angle of rotations that correspond to the
“off-one-thickness” criterion. The lateral drifts when notable torsional deformation occurred were
estimated at drift ratios of 1.5%, 2.5% and 3.5% for Levels 1 to 3 respectively.
Torsional
deformation
Quarter-height
a
t
R
After bucklingBefore buckling
R min = t / a
(a) (b)
Figure 3.15 Definition of notable torsional deformation: (a) torsional deformation; (b)
“off-one-thickness” criterion and rotation angle calculation.
0 1 2 3 4 5 6-10
0
10
20
30
40
R (
de
gre
es)
Drift ratio (%)
Simulation
Pair 1
Pair 5
Pair 9
1.5% 2.5% 3.5%
Figure 3.16 Progress of torsional deformation of Pairs 1, 5 and 9.
3.4.3 Test setup and instrumentation
The specimen was installed with the rotation of 90 degrees in a steel frame made of three
wide-flange columns (H-250 250 9 14 mm) as shown in Figure 3.17. The two exterior columns
were securely posted on the base frame, while the middle column was attached to the vertical jack

3 - 15
and moved vertically. To make the middle column oriented vertically, both ends of the middle
column are clamped by restrainers and rollers. With this setup, the specimens sustained shear
displacement by the vertical movement of the middle column whose movement was controlled by
the vertical jack. Two (nearly) identical specimens were installed as one pair, one specimen
installed on each side of the middle column to check the variability of the seemingly two identical
specimens.
(a) (b)
Figure 3.17 Test setup: (a) schematic; (b) photo in test.
Two displacement transducers were used at both the front and back sides of the middle loading
column to measure the lateral drift. The rotation angle ( R ) of the mid-section was measured by
attaching two wires at the mid-section perpendicular to the loading plane, with the other ends of the
wires connected to two displacement transducer. The angle of rotation of each link was estimated as
the difference between the two displacement transducers divided by the distance between the two
wires. A wood plate was glued along the mid-section to make the wire attachment easier (Figure
3.18(b)). Figure 3.18(a) demonstrates how to calculate the rotation angle, where 0l is the wire’s
original length before loading; a is the mid-section width; il is the wire length after loading; V
il is
the component of il after loading, in the direction parallel to the original wire axis; D is the link’s
drift; id is the displacement transducer’s recorded value; is the wire’s rotation angle due to the
in-plane displacement. The equations below were used in calculating the rotation angle of the
mid-section.
0
arctan( )1
2 l
D (3.7)
0 ( 1,2)V
i i il l cos l d cos i (3.8)
1 2arcsin
V Vl
a
lR
(3.9)

3 - 16
(a) (b)
Figure 3.18 Instrumentation: (a) calculation of R; (b) experimental implementation.
3.4.4 loading protocol
A displacement-controlled cyclic loading was applied quasi-statically. The loading protocol adopted
for preliminary FE analysis (Figure 3.4(b)) was slightly modified to increase the resolution in the
amplitude corresponding to torsional deformation. In addition to the basic drift angles, i.e. 1% to
6% with the increment of 1%, the small increment of 0.5% was adopted near the expected drift
angle for torsional deformation. For example, Level 1 (the target drift angle of 1.5%) specimens
was subject to cyclic loading with the drift angle of 0.5%, 1%, 1.5%, 2%, 3%, 4%, 5% and 6%,
successively. The loading protocols were summarized in Table 3.3. The displacement was
expressed in terms of the drift ratio, defined as the shear deformation relative to the link height.
Table 3.3 Loading protocol
Drift ratio Loading cycles
Level 1 Level 2 Level 3 Combination
0.5% 2 - - -
1.0% 2 2 2 2
1.5% 2 2 - 2
2.0% 2 2 2 2
2.5% - 2 - 2
3.0% 2 2 2 2
3.5% - - 2 2
4.0% 2 2 2 2
4.5% - - 2 -
5.0% 2 2 2 2
6.0% 2 2 2 2
Note: “-” means without loading for that drift ratio.
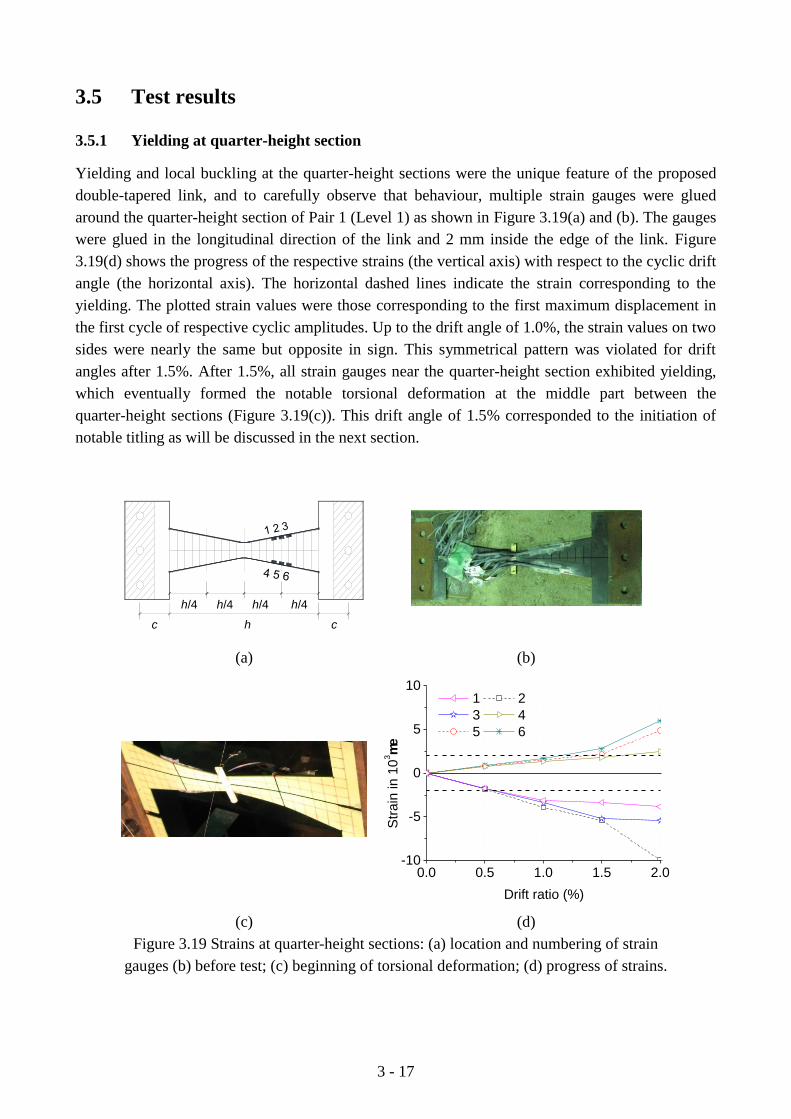
3 - 17
3.5 Test results
3.5.1 Yielding at quarter-height section
Yielding and local buckling at the quarter-height sections were the unique feature of the proposed
double-tapered link, and to carefully observe that behaviour, multiple strain gauges were glued
around the quarter-height section of Pair 1 (Level 1) as shown in Figure 3.19(a) and (b). The gauges
were glued in the longitudinal direction of the link and 2 mm inside the edge of the link. Figure
3.19(d) shows the progress of the respective strains (the vertical axis) with respect to the cyclic drift
angle (the horizontal axis). The horizontal dashed lines indicate the strain corresponding to the
yielding. The plotted strain values were those corresponding to the first maximum displacement in
the first cycle of respective cyclic amplitudes. Up to the drift angle of 1.0%, the strain values on two
sides were nearly the same but opposite in sign. This symmetrical pattern was violated for drift
angles after 1.5%. After 1.5%, all strain gauges near the quarter-height section exhibited yielding,
which eventually formed the notable torsional deformation at the middle part between the
quarter-height sections (Figure 3.19(c)). This drift angle of 1.5% corresponded to the initiation of
notable titling as will be discussed in the next section.
c h c
h/4 h/4 h/4 h/4
(a) (b)
0.0 0.5 1.0 1.5 2.0-10
-5
0
5
10
Str
ain
in
10
3m
e
Drift ratio (%)
1 2
3 4
5 6
(c) (d)
Figure 3.19 Strains at quarter-height sections: (a) location and numbering of strain
gauges (b) before test; (c) beginning of torsional deformation; (d) progress of strains.

3 - 18
3.5.2 Criterion for notable torsional deformation
In Pair 1, besides the mid-sections, the out-of-plane displacement of the outmost edge fibers along
the quarter-height section was also measured. For comparison, rotation of quarter-height section,
defined as the relative out-of-plane displacement of the outmost two points at quarter-height section
(for example, Points 2 and 5 in Figure 3.19) divided by the distance, was used to quantify the
out-of-plane deformation at quarter-height section. The distance between the two points after
buckling occurred would not be the same as that before buckling because of the curved section.
Nevertheless, the distance was assumed as constant at the early stage of torsional deformation.
Figure 3.20 shows the comparison of rotation angle of the two sections. Rotation initiated at the
same time, which verified the reasonableness of the proposed “off-one-thickness” criterion for
notable torsional deformation. With the growth of torsional deformation, the distance between the
two outmost edge points at the quarter-height section became smaller, which explained why the
rotation angle of the quarter-height section was smaller than that of the mid-section at large drift
ratios.
0 1 2 3 4 5 6
0
10
20
30
40
R (
degre
es)
Drift ratio (%)
Mid-section
Quarter-height section
Figure 3.20 Comparison of torsional deformation at the mid- and quarter-height section.
3.5.3 Initiation and growth of torsional deformation
Figure 3.21 shows the progress of torsional deformation (quantified by the angle of rotation R) with
respect to the drift angle. The vertical axis shows the angle of rotation observed at the completion
(meaning zero drift angle) of each amplitude with two cycles. Among Pairs 1 to 9, Pairs 3, 5, 6, 7
and 9 had identical specimens in each pair; In Pairs 1, 2, 4 and 8, the two specimens were slightly
different, one as a single panel configured with links, while the other as an assembly of individual
links. The torsional deformation comparison between the single panel specimen and individual link
in Pairs 1, 2, 4 and 8 will be explicated in the next section. In Figure 3.21, the angle of rotation
plotted is the one at the middle link of the single panel specimen.
Figure 3.21(a) plots the four pairs in Level 1, in which all links have the same width-thickness
ratio. Pairs 1 and 2 exhibited nearly the same behaviour and reached the level of notable torsional
deformation (according to the “off-one-thickness” criterion) at the drift angle of 1.5% as expected
before the test. The difference between Pair 1 and Pair 2 was the aspect ratio, β (6 versus 4), and
this test result verified the discussion on that the aspect ratio would not be a controlling factor. Pair

3 - 19
3 had the same width-thickness ratio, but the torsional deformation behaviour was somewhat
different. This was attributed to a small aspect ratio adopted in the link, a value that was smaller
than the recommended value of 4. The resulting early shear yielding at mid-section made the middle
part between the quarter-height sections no longer behaved as a rigid body and showed different
rotation. In Pair 4 with rectangular links, the initiation of torsional deformation was similar, but the
growth of torsional deformation was significantly smaller than double-tapered links. One of the
motivations to adopt the double-tapered link was the more significant torsional deformation, which
was evidenced by the difference in the growth of torsional deformation between the double-tapered
and rectangular links.
Figure 3.21(b) plots the four pairs in Level 2, where the target drift angle for notable torsional
deformation was 2.5%. Pairs 5 and 6 with different aspect ratios reached the target angle of rotation
at the drift angle of 2.5%, which means the torsional deformation was as expected. On the other
hand, Pair 7 showed a little earlier and larger torsional deformation than Pairs 5 and 6, which was
most likely caused by the flexibility difference of the end zone (made of a thicker plate of 4.3 mm
for Pair 7, while of 2.3 mm for Pairs 5 and 6). The thicker end zone (therefore stiffer) contributed to
a slightly larger net drift angle for Pair 7 and thus earlier torsional deformation. This influence from
end zone will be further discussed in the next section. Pair 8 was with rectangular links, and the
torsional deformation progressed slower than double-tapered links. This comparison again shows
the advantage of the double-tapered link over the rectangular link in terms of visual inspection.
Figure 3.21(c) plots the pair for Level 3, and as expected the notable torsional deformation
occurred at the drift angle of 3.5%. Thus, at all levels the test showed that the proposed
double-tapered links exhibited notable torsional deformation at the target drift angles.
0 1 2 3 4 5 6-10
0
10
20
30
40
R (
de
gre
es)
Drift ratio (%)
Pair 1
Pair 2
Pair 3
Pair 4
0 1 2 3 4 5 6-10
0
10
20
30
40
R (
de
gre
es)
Drift ratio (%)
Pair 5
Pair 6
Pair 7
Pair 8
(a) (b)

3 - 20
0 1 2 3 4 5 6-10
0
10
20
30
40
R (
de
gre
es)
Drift ratio (%)
Pair 9
(c)
Figure 3.21 Progress of torsional deformation for three levels: (a)-(c) Levels 1-3.
3.5.4 Difference in rotation angle of links within specimen
In Pairs 1, 2 and 4, one specimen was made of a single panel with three links, while the other
specimen was the assembly of three individual links; likewise, Pair 8 consisted of a single panel and
an assembly of individual links. Figure 3.22 shows the progress of the angle of rotation with respect
to the drift angle for Pairs 1, 2, 4 and 8. The “1st” in Figure 3.22 means the exterior link and “2
nd”
means the middle link in each specimen. Except for Pair 2, all links in each pair were very similar
to each other until a very large angle of rotation of 20 degrees. This closeness between the links in
the panel and individual links, also the boundary link and middle link, indicates the independency
of link’s torsional deformation even neighboured by other links and little sensitivity of the growth
of out-of-plane deformations once the shape was specified. Exception was Pair 2, in which the
growth of torsional deformation was more promoted for the assembly specimen than for the
individual links. In this pair, the link’s length was shorter, which resulted in a larger end zone (110
mm in depth for Pair 2, while 60 mm in depth for Pair 1 that had the link’s height of 300 mm).
Because of this relatively large end zone, the end zone showed a whole sustained out-of-plane
deformation with the increase of drift angle (Figure 3.23). This had resulted in a somewhat smaller
net drift angle to the double-tapered link itself. This behaviour suggests that the end zone should be
stiff enough (or at least mainly in plane) so that the shear deformation of the panel and the link’s
displacement are identical.

3 - 21
0 1 2 3 4 5 6
0
10
20
30
40
R (
de
gre
es)
Drift ratio (%)
1st link of Panel
2nd
link of Panel
1st individual link
2nd
individual link
0 1 2 3 4 5 6
0
10
20
30
40
R (
de
gre
es)
Drift ratio (%)
1st link of Panel
2nd
link of Panel
1st individual link
2nd
individual link
(a) (b)
0 1 2 3 4 5 6
0
10
20
30
40
R (
degre
es)
Drift ratio (%)
1st link of Panel
2nd
link of Panel
1st individual link
2nd
individual link
0 1 2 3 4 5 6
0
10
20
30
40
R (
degre
es)
Drift ratio (%)
1st link of Panel
2nd
link of Panel
1st individual link
2nd
individual link
(c) (d)
Figure 3.22 Individual link versus panel for Pairs 1, 2, 4 and 8: (a)-(d) Pairs 1, 2, 4 and 8,
respectively.
(a) (b) (c)
Figure 3.23 End zone deformation of Pair 2: (a) whole view in loading; (b) east panel; (c) west
individual links.
End zone
Deformed
Deformed
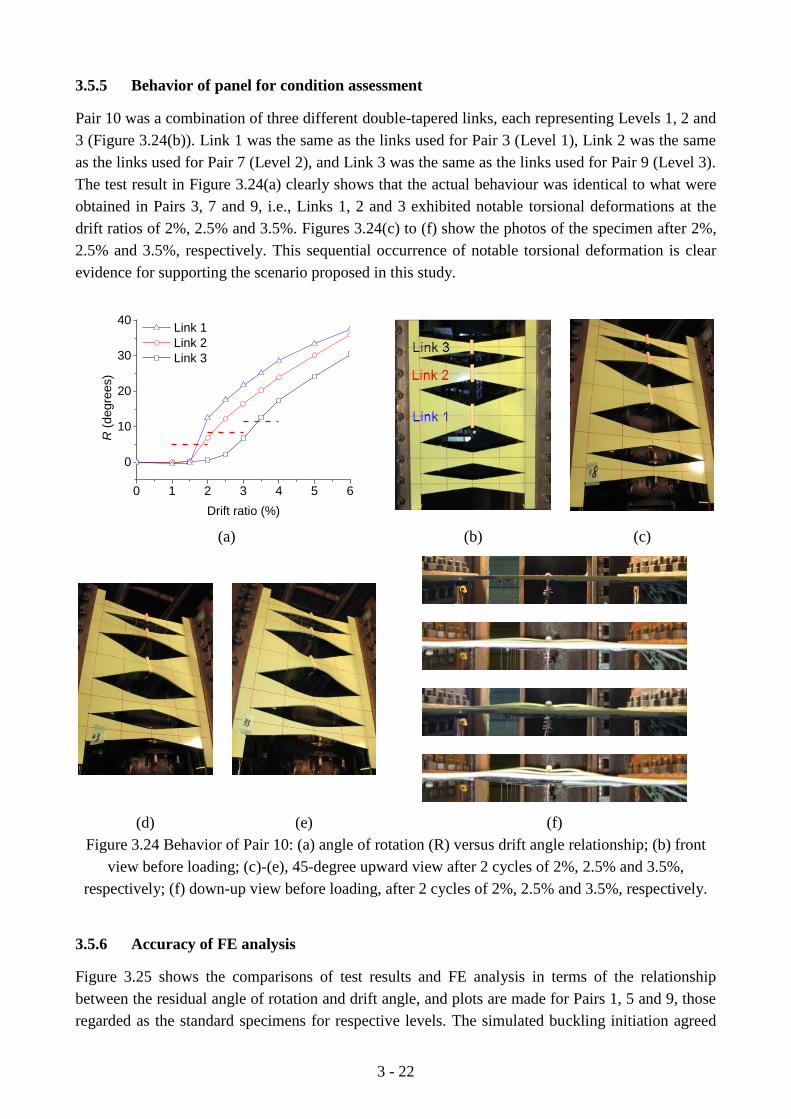
3 - 22
3.5.5 Behavior of panel for condition assessment
Pair 10 was a combination of three different double-tapered links, each representing Levels 1, 2 and
3 (Figure 3.24(b)). Link 1 was the same as the links used for Pair 3 (Level 1), Link 2 was the same
as the links used for Pair 7 (Level 2), and Link 3 was the same as the links used for Pair 9 (Level 3).
The test result in Figure 3.24(a) clearly shows that the actual behaviour was identical to what were
obtained in Pairs 3, 7 and 9, i.e., Links 1, 2 and 3 exhibited notable torsional deformations at the
drift ratios of 2%, 2.5% and 3.5%. Figures 3.24(c) to (f) show the photos of the specimen after 2%,
2.5% and 3.5%, respectively. This sequential occurrence of notable torsional deformation is clear
evidence for supporting the scenario proposed in this study.
0 1 2 3 4 5 6
0
10
20
30
40
R (
de
gre
es)
Drift ratio (%)
Link 1
Link 2
Link 3
(a) (b) (c)
(d) (e) (f)
Figure 3.24 Behavior of Pair 10: (a) angle of rotation (R) versus drift angle relationship; (b) front
view before loading; (c)-(e), 45-degree upward view after 2 cycles of 2%, 2.5% and 3.5%,
respectively; (f) down-up view before loading, after 2 cycles of 2%, 2.5% and 3.5%, respectively.
3.5.6 Accuracy of FE analysis
Figure 3.25 shows the comparisons of test results and FE analysis in terms of the relationship
between the residual angle of rotation and drift angle, and plots are made for Pairs 1, 5 and 9, those
regarded as the standard specimens for respective levels. The simulated buckling initiation agreed
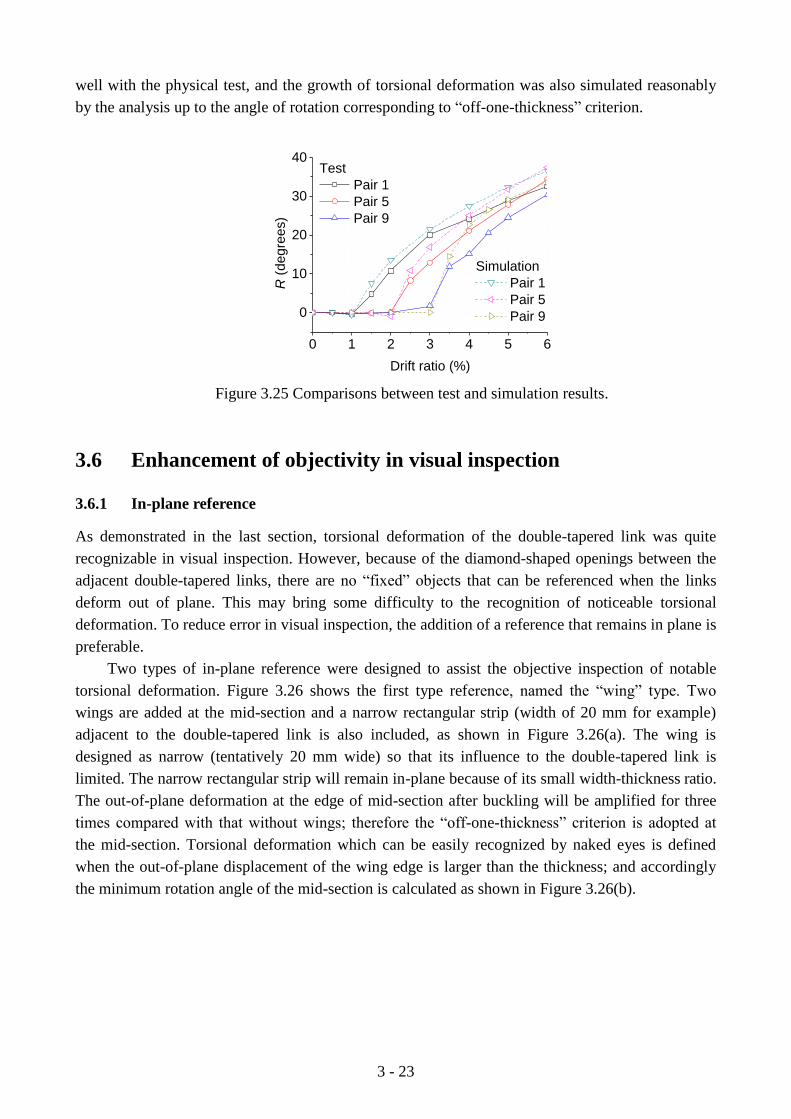
3 - 23
well with the physical test, and the growth of torsional deformation was also simulated reasonably
by the analysis up to the angle of rotation corresponding to “off-one-thickness” criterion.
0 1 2 3 4 5 6
0
10
20
30
40
Simulation
Pair 1
Pair 5
Pair 9
R (
de
gre
es)
Drift ratio (%)
Test
Pair 1
Pair 5
Pair 9
Figure 3.25 Comparisons between test and simulation results.
3.6 Enhancement of objectivity in visual inspection
3.6.1 In-plane reference
As demonstrated in the last section, torsional deformation of the double-tapered link was quite
recognizable in visual inspection. However, because of the diamond-shaped openings between the
adjacent double-tapered links, there are no “fixed” objects that can be referenced when the links
deform out of plane. This may bring some difficulty to the recognition of noticeable torsional
deformation. To reduce error in visual inspection, the addition of a reference that remains in plane is
preferable.
Two types of in-plane reference were designed to assist the objective inspection of notable
torsional deformation. Figure 3.26 shows the first type reference, named the “wing” type. Two
wings are added at the mid-section and a narrow rectangular strip (width of 20 mm for example)
adjacent to the double-tapered link is also included, as shown in Figure 3.26(a). The wing is
designed as narrow (tentatively 20 mm wide) so that its influence to the double-tapered link is
limited. The narrow rectangular strip will remain in-plane because of its small width-thickness ratio.
The out-of-plane deformation at the edge of mid-section after buckling will be amplified for three
times compared with that without wings; therefore the “off-one-thickness” criterion is adopted at
the mid-section. Torsional deformation which can be easily recognized by naked eyes is defined
when the out-of-plane displacement of the wing edge is larger than the thickness; and accordingly
the minimum rotation angle of the mid-section is calculated as shown in Figure 3.26(b).

3 - 24
3a
3a
20Mid-section
1.5a
t
R
After bucklingBefore buckling
R min = t / 1.5a
(a) (b)
Figure 3.26 The “wing” type reference: (a) “wing” type reference;
(b) “off-one-thickness” at mid-section.
Figure 3.27 shows the second type, named the “whole-height” type. A reference strip is added
next to the double-tapered link, with a small gap in between so that interaction between the
double-tapered link and the reference does not occur when buckling initiates, as shown in Figure
3.26(a). In contrast to the double-tapered link, the reference narrows towards the ends while
broadening towards the middle. The end section of the reference is designed as narrow (width of 20
mm for example) so that it will remain in-plane until a large lateral drift. In addition, the
two-segmental edge of the reference has the same inclination with that of the double-tapered link
edge. The edges of the reference along the whole height are expected to work as the baseline for
measuring relative out-of-plane deformation after the link buckles. While the relative deformation
at any height works for inspection, the “off-one-thickness” criterion is applied at the quarter-height
section, as illustrated in Figure 3.27(b). Notable torsional deformation is defined when the
out-of-plane deformation at the outmost fibers of the quarter-height section edge (U3) is larger than
the thickness of the double-tapered link.
a
3a
Quarter-height
a
t
After bucklingBefore buckling
U3 min = t
(a) (b)
Figure 3.27 The “whole-height” type reference: (a) “whole-height” reference;
(b) “off-one-thickness” at the quarter-height section.

3 - 25
3.6.2 Test specimens
To verify the effectiveness of the proposed in-plane reference, two specimens were designed, as
shown in Figure 3.28. Three different double-tapered links with mid-section widths of 30 mm, 22 mm
and 18 mm using a 4.5 mm thick plate (actual thickness of 4.3 mm) were designed. Specimen 1 was
the combination of three double-tapered links with and without “wing” type reference. There were
four identical double-tapered links in Specimen 2, whose dimensions were the same as the
double-tapered link with the mid-section width of 30 mm in Specimen 1. One out of the four
double-tapered links was bounded by two “whole-height” type reference. Both types of reference
were with the end-section width of 20 mm, which gave a small width-thickness of 4.6 and ensured the
mainly in-plane behavior until a large lateral drift.
The loading setup, instrumentation and loading history were same as used in the previous tests,
as described in Sections 3.4.3 and 3.4.4.
20
30 22 18 30 22 18
48
0
20 20
36
0
540
36
0
20
30
540
480
(a) (b)
Figure 3.28 Details of specimens (unit: mm): (a) Specimen 1 with “wing” type
reference; (b) Specimen 2 with “whole-height” type reference.
3.6.3 Test results
Performance of the “wing” type reference
Specimen 1 had double-tapered links with and without the “wing” type references (Figure 29(a)). At
the drift ratio of 2.5%, only the widest Link 1 showed notable torsional deformation (marked with a
red circle), and the other two links remained mainly in-plane (Figure 29(b)). With wings and
reference strips, “off-one-thickness” criterion was accurately quantified and judgment of notable
torsional deformation was more objective and easier. At the drift ratio of 3.5%, the middle wide Link
2 started torsional deformation notably (marked with a red circle), the widest Link 1 deformed larger
and the narrowest Link 3 still remained mainly in-plane (Figure 29(c)); at the drift ratio of 4.5%, the
narrowest Link 3 started torsional deformation notably (marked with a red circle), and Link 2 and
Link 3 deformed larger (Figure 29(d)). This distinct sequential occurrence of notable torsional
deformation, starting from the widest link to the narrowest, again provided clear evidence supporting
the scenario of condition assessment proposed in this study.
Figure 3.29(e) shows the progress of measured torsional deformation, represented by the
rotation angle of mid-section. Based on the “off-one-thickness” criterion, notable torsional

3 - 26
deformation occurred at drift ratios of 2.5%, 3.5% and 4.5% respectively.
Lin
k 1
Lin
k 2
Lin
k 3
(a) (b) (c)
0 1 2 3 4 5
0
10
20
30
R (
de
gre
es)
Drift ratio (%)
Link 1
Link 2
Link 3
(d) (e)
Figure 3.29 Progress of torsional deformation of Specimen 1: (a) before loading; (b)-(d) at drift
ratios of 2.5%, 3.5% and 4.5% respectively; (e) progress of torsional deformation.
Performance of the “whole-height” type reference
Specimen 2 had four identical double-tapered links, whose dimensions were of the same as those of
Link 1 in Specimen 1, but with the “whole-height” type reference (Figure 3.30(a)). At the drift ratio
of 2.5%, out-of-plane deformation at the edge of quarter-height section was notably observed
(marked with red circles) as shown in Figure 3.30(b) and (c). The judgment of notable torsional
deformation occurrence was easier and more objective with the “whole-height” type reference.
Figure 3.30(d) shows the progress of normalized out-of-plane deformation (out-of-plane deformation
divided by plate thickness) at the edge of quarter-height section. The normalized out-of-plane
deformation at the edge of quarter-height section exceeded unity at the drift ratio of 2.5%, which met
the “off-one-thickness” criterion. The occurrence of notable torsional deformation was the same as
Link 1 in Specimen 1.
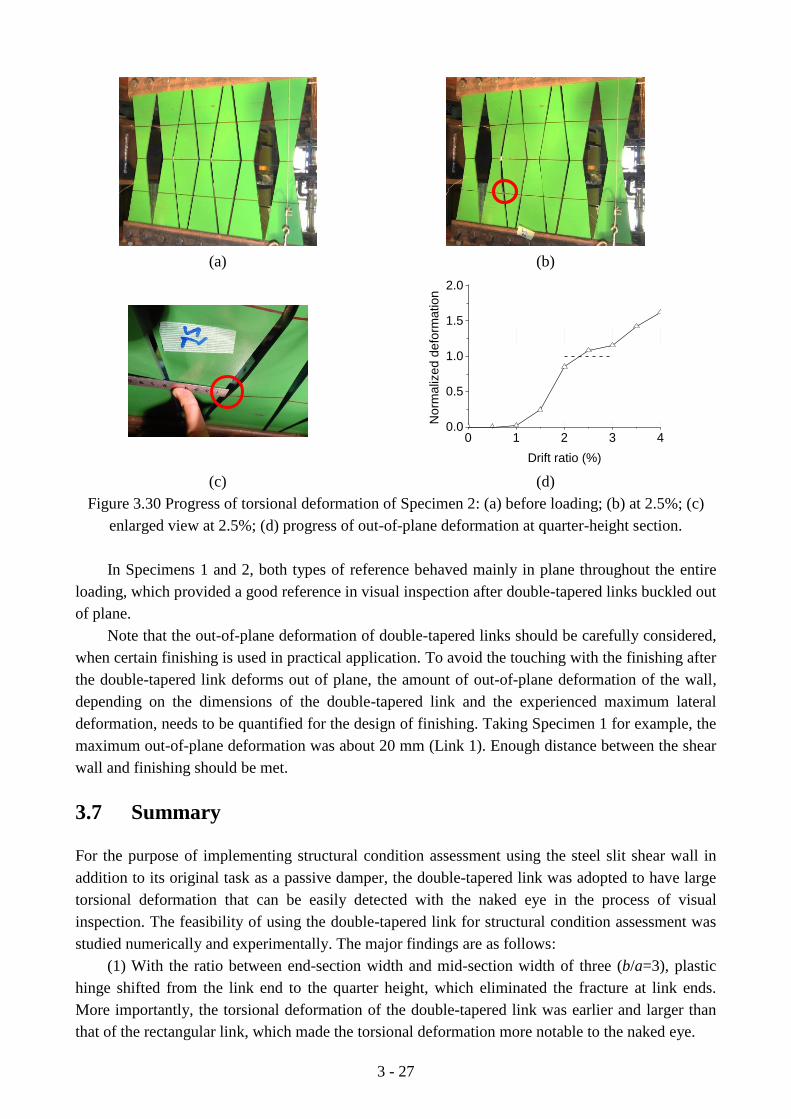
3 - 27
(a) (b)
0 1 2 3 40.0
0.5
1.0
1.5
2.0
Norm
aliz
ed d
efo
rmation
Drift ratio (%)
(c) (d)
Figure 3.30 Progress of torsional deformation of Specimen 2: (a) before loading; (b) at 2.5%; (c)
enlarged view at 2.5%; (d) progress of out-of-plane deformation at quarter-height section.
In Specimens 1 and 2, both types of reference behaved mainly in plane throughout the entire
loading, which provided a good reference in visual inspection after double-tapered links buckled out
of plane.
Note that the out-of-plane deformation of double-tapered links should be carefully considered,
when certain finishing is used in practical application. To avoid the touching with the finishing after
the double-tapered link deforms out of plane, the amount of out-of-plane deformation of the wall,
depending on the dimensions of the double-tapered link and the experienced maximum lateral
deformation, needs to be quantified for the design of finishing. Taking Specimen 1 for example, the
maximum out-of-plane deformation was about 20 mm (Link 1). Enough distance between the shear
wall and finishing should be met.
3.7 Summary
For the purpose of implementing structural condition assessment using the steel slit shear wall in
addition to its original task as a passive damper, the double-tapered link was adopted to have large
torsional deformation that can be easily detected with the naked eye in the process of visual
inspection. The feasibility of using the double-tapered link for structural condition assessment was
studied numerically and experimentally. The major findings are as follows:
(1) With the ratio between end-section width and mid-section width of three (b/a=3), plastic
hinge shifted from the link end to the quarter height, which eliminated the fracture at link ends.
More importantly, the torsional deformation of the double-tapered link was earlier and larger than
that of the rectangular link, which made the torsional deformation more notable to the naked eye.
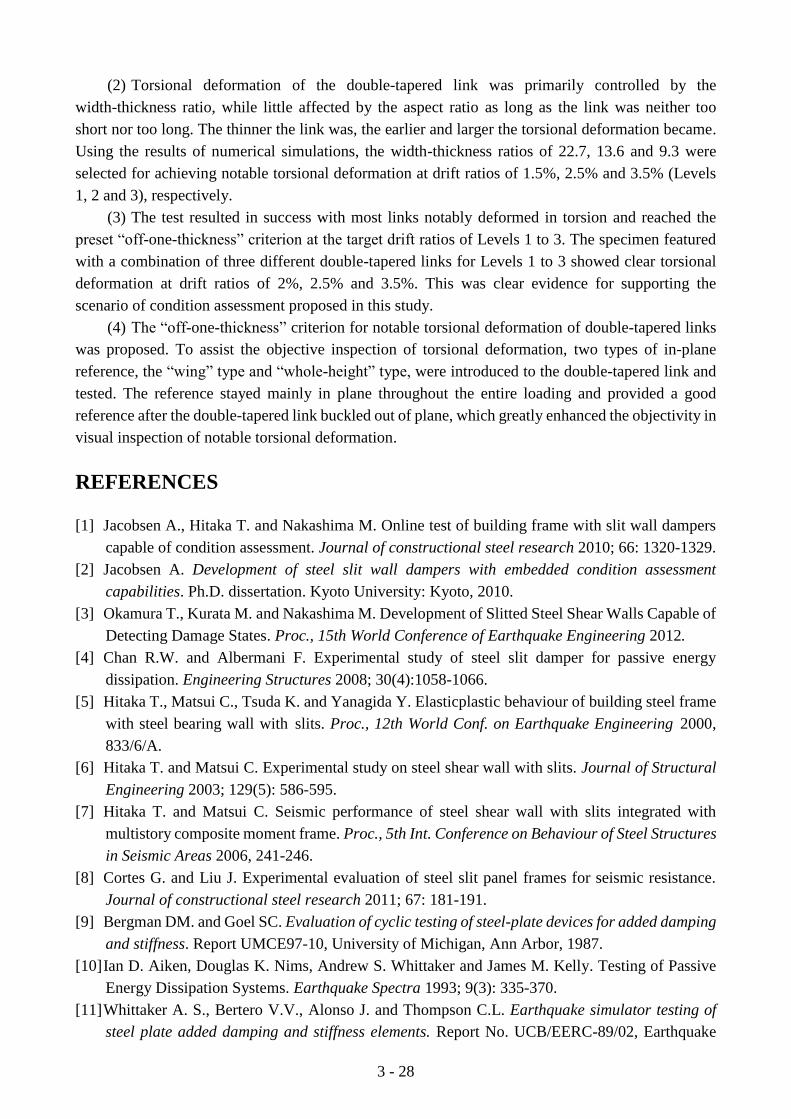
3 - 28
(2) Torsional deformation of the double-tapered link was primarily controlled by the
width-thickness ratio, while little affected by the aspect ratio as long as the link was neither too
short nor too long. The thinner the link was, the earlier and larger the torsional deformation became.
Using the results of numerical simulations, the width-thickness ratios of 22.7, 13.6 and 9.3 were
selected for achieving notable torsional deformation at drift ratios of 1.5%, 2.5% and 3.5% (Levels
1, 2 and 3), respectively.
(3) The test resulted in success with most links notably deformed in torsion and reached the
preset “off-one-thickness” criterion at the target drift ratios of Levels 1 to 3. The specimen featured
with a combination of three different double-tapered links for Levels 1 to 3 showed clear torsional
deformation at drift ratios of 2%, 2.5% and 3.5%. This was clear evidence for supporting the
scenario of condition assessment proposed in this study.
(4) The “off-one-thickness” criterion for notable torsional deformation of double-tapered links
was proposed. To assist the objective inspection of torsional deformation, two types of in-plane
reference, the “wing” type and “whole-height” type, were introduced to the double-tapered link and
tested. The reference stayed mainly in plane throughout the entire loading and provided a good
reference after the double-tapered link buckled out of plane, which greatly enhanced the objectivity in
visual inspection of notable torsional deformation.
REFERENCES
[1] Jacobsen A., Hitaka T. and Nakashima M. Online test of building frame with slit wall dampers
capable of condition assessment. Journal of constructional steel research 2010; 66: 1320-1329.
[2] Jacobsen A. Development of steel slit wall dampers with embedded condition assessment
capabilities. Ph.D. dissertation. Kyoto University: Kyoto, 2010.
[3] Okamura T., Kurata M. and Nakashima M. Development of Slitted Steel Shear Walls Capable of
Detecting Damage States. Proc., 15th World Conference of Earthquake Engineering 2012.
[4] Chan R.W. and Albermani F. Experimental study of steel slit damper for passive energy
dissipation. Engineering Structures 2008; 30(4):1058-1066.
[5] Hitaka T., Matsui C., Tsuda K. and Yanagida Y. Elasticplastic behaviour of building steel frame
with steel bearing wall with slits. Proc., 12th World Conf. on Earthquake Engineering 2000,
833/6/A.
[6] Hitaka T. and Matsui C. Experimental study on steel shear wall with slits. Journal of Structural
Engineering 2003; 129(5): 586-595.
[7] Hitaka T. and Matsui C. Seismic performance of steel shear wall with slits integrated with
multistory composite moment frame. Proc., 5th Int. Conference on Behaviour of Steel Structures
in Seismic Areas 2006, 241-246.
[8] Cortes G. and Liu J. Experimental evaluation of steel slit panel frames for seismic resistance.
Journal of constructional steel research 2011; 67: 181-191.
[9] Bergman DM. and Goel SC. Evaluation of cyclic testing of steel-plate devices for added damping
and stiffness. Report UMCE97-10, University of Michigan, Ann Arbor, 1987.
[10] Ian D. Aiken, Douglas K. Nims, Andrew S. Whittaker and James M. Kelly. Testing of Passive
Energy Dissipation Systems. Earthquake Spectra 1993; 9(3): 335-370.
[11] Whittaker A. S., Bertero V.V., Alonso J. and Thompson C.L. Earthquake simulator testing of
steel plate added damping and stiffness elements. Report No. UCB/EERC-89/02, Earthquake

3 - 29
Engineering Research Center, University of California, Berkeley, 1989-01.
[12] Kobori T, Miura Y, Fukusawa E, Yamada T, Arita T, Takenake Y and Akiba I. Development and
application of hysteretic steel dampers. Proc., 11th world conference on earthquake engineering
1992, Madrid, Spain, 2341-2346.
[13] Ma X., Borchers E., Peña A., Krawinkler H., Billington S. and Deierlein G. Design and behavior
of steel shear plates with openings as energy-dissipating fuses. John A. Blume Earthquake
Engineering Center Technical Report 173, Stanford Digital Repository, 2010. (Available from
http://purl.stanford.edu/hq943jb9995)
[14] Ghabraie K., Chan R.W., Huang X. and Xie Y.M. Shape optimization of metallic yielding
devices for passive mitigation of seismic energy. Engineering Structures 2010; 32:2258-2267.
[15] Dassault Systèmes. ABAQUS Ver. 6.10 User’s Manual. http://www.abaqus.com
[16] Timoshenko S.P. and Gere J.M. Theory of elastic stability (2nd edition). McGraw-Hill: New
York, 1961.
[17] Johnston B.G. Guide to stability design criteria for metal structures (6th edition). John Wiley &
Sons, Inc: New York, 2010.
[18] Trahair N.S. Flexural-Torsional Buckling of Structures. CRC press: Boca Raton, 1993.
[19] Bradford M. and Cuk P. Elastic Buckling of Tapered Monosymmetric I-Beams. Journal of
Structural Engineering 1988; 114(5): 977–996.


4 - 1
CHAPTER 4
Condition assessment performance of double-tapered links under
earthquake loading
4.1 Introduction
4.1.1 Loading protocol
Quasi-static cyclic tests are commonly conducted to conservatively account for the damage effects in
case of an earthquake [1]. In the cyclic tests of a certain structural component, a loading protocol is
needed and required to be representative of the load/deformation history that the component will
undergo in an earthquake. Major loading protocols proposed for different structural component tests
considering common earthquakes (not the near-fault type) in code/provision [2-9] are shown in
Figure 4.1.
-3
-2
-1
0
1
2
3
FM
E
Loading cycles
SDP
-5-4-3-2-1012345
Loading cycles
ATC-24
(a) (b)
-5-4-3-2-1012345
Drift r
angle
(%
)
Loading cycles
SAC
-1.0
-0.5
0.0
0.5
1.0
Loading cycles
CUREE
(c) (d)
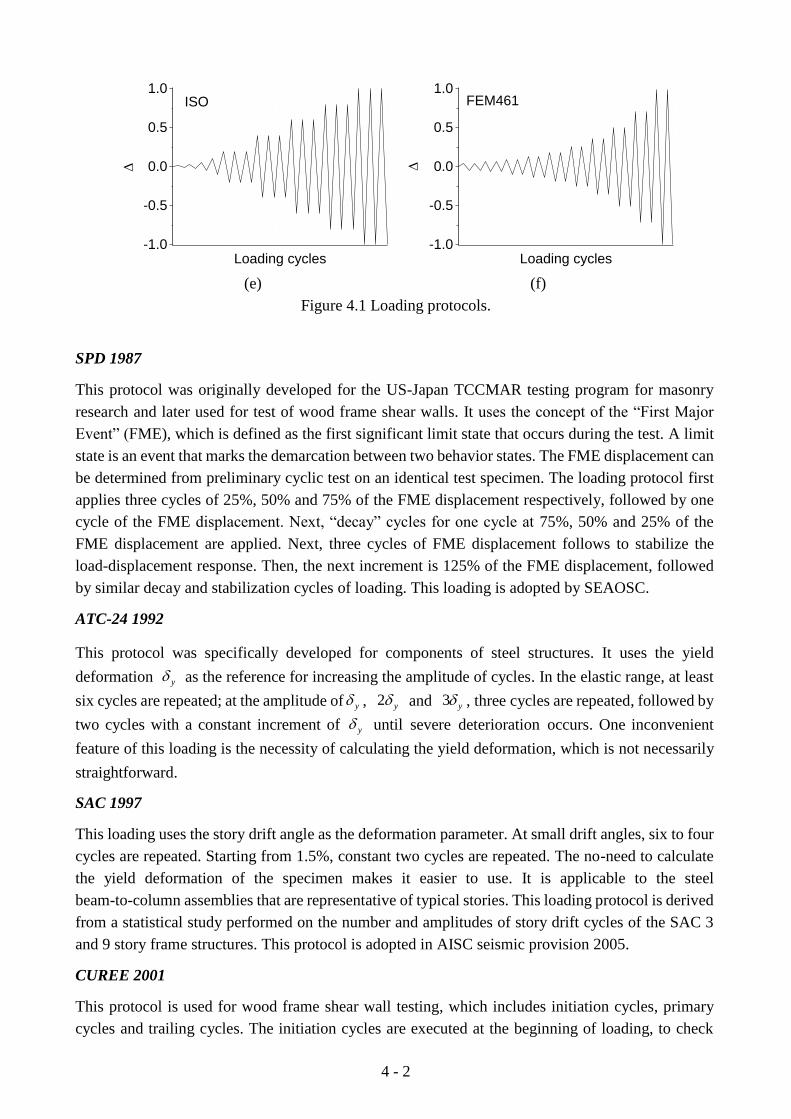
4 - 2
-1.0
-0.5
0.0
0.5
1.0
Loading cycles
ISO
-1.0
-0.5
0.0
0.5
1.0
Loading cycles
FEM461
(e) (f)
Figure 4.1 Loading protocols.
SPD 1987
This protocol was originally developed for the US-Japan TCCMAR testing program for masonry
research and later used for test of wood frame shear walls. It uses the concept of the “First Major
Event” (FME), which is defined as the first significant limit state that occurs during the test. A limit
state is an event that marks the demarcation between two behavior states. The FME displacement can
be determined from preliminary cyclic test on an identical test specimen. The loading protocol first
applies three cycles of 25%, 50% and 75% of the FME displacement respectively, followed by one
cycle of the FME displacement. Next, “decay” cycles for one cycle at 75%, 50% and 25% of the
FME displacement are applied. Next, three cycles of FME displacement follows to stabilize the
load-displacement response. Then, the next increment is 125% of the FME displacement, followed
by similar decay and stabilization cycles of loading. This loading is adopted by SEAOSC.
ATC-24 1992
This protocol was specifically developed for components of steel structures. It uses the yield
deformation y as the reference for increasing the amplitude of cycles. In the elastic range, at least
six cycles are repeated; at the amplitude of y , 2 y and 3 y , three cycles are repeated, followed by
two cycles with a constant increment of y until severe deterioration occurs. One inconvenient
feature of this loading is the necessity of calculating the yield deformation, which is not necessarily
straightforward.
SAC 1997
This loading uses the story drift angle as the deformation parameter. At small drift angles, six to four
cycles are repeated. Starting from 1.5%, constant two cycles are repeated. The no-need to calculate
the yield deformation of the specimen makes it easier to use. It is applicable to the steel
beam-to-column assemblies that are representative of typical stories. This loading protocol is derived
from a statistical study performed on the number and amplitudes of story drift cycles of the SAC 3
and 9 story frame structures. This protocol is adopted in AISC seismic provision 2005.
CUREE 2001
This protocol is used for wood frame shear wall testing, which includes initiation cycles, primary
cycles and trailing cycles. The initiation cycles are executed at the beginning of loading, to check
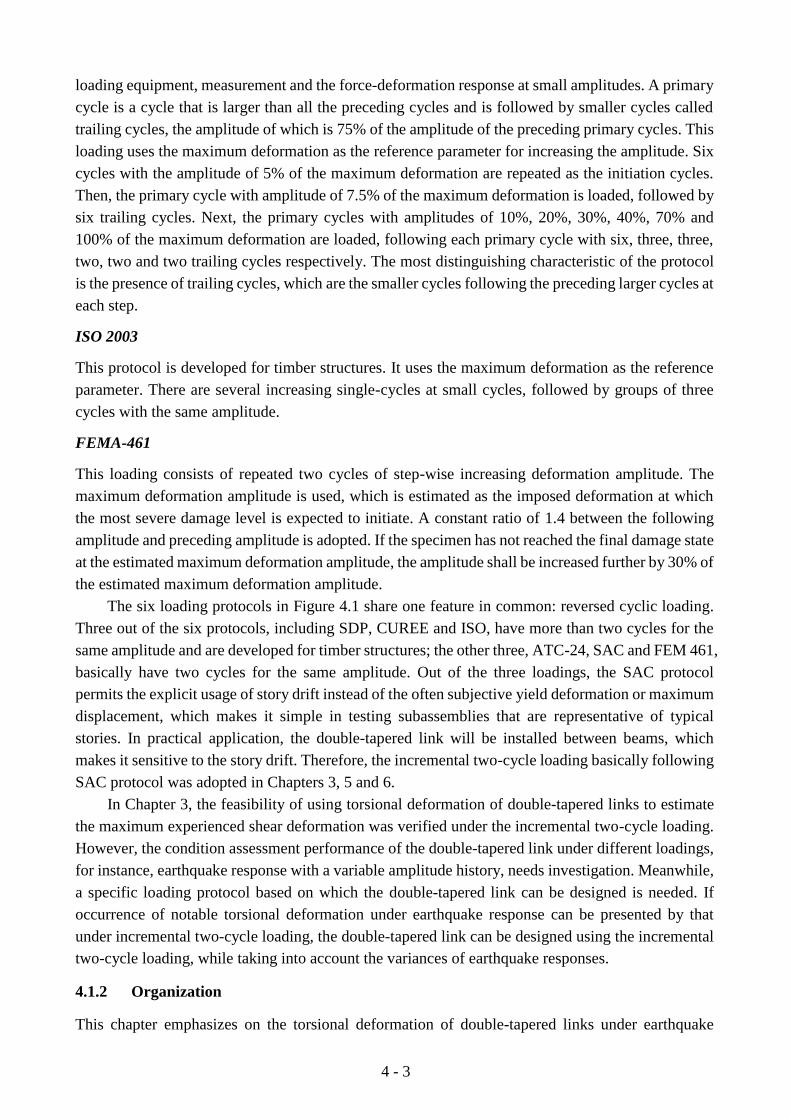
4 - 3
loading equipment, measurement and the force-deformation response at small amplitudes. A primary
cycle is a cycle that is larger than all the preceding cycles and is followed by smaller cycles called
trailing cycles, the amplitude of which is 75% of the amplitude of the preceding primary cycles. This
loading uses the maximum deformation as the reference parameter for increasing the amplitude. Six
cycles with the amplitude of 5% of the maximum deformation are repeated as the initiation cycles.
Then, the primary cycle with amplitude of 7.5% of the maximum deformation is loaded, followed by
six trailing cycles. Next, the primary cycles with amplitudes of 10%, 20%, 30%, 40%, 70% and
100% of the maximum deformation are loaded, following each primary cycle with six, three, three,
two, two and two trailing cycles respectively. The most distinguishing characteristic of the protocol
is the presence of trailing cycles, which are the smaller cycles following the preceding larger cycles at
each step.
ISO 2003
This protocol is developed for timber structures. It uses the maximum deformation as the reference
parameter. There are several increasing single-cycles at small cycles, followed by groups of three
cycles with the same amplitude.
FEMA-461
This loading consists of repeated two cycles of step-wise increasing deformation amplitude. The
maximum deformation amplitude is used, which is estimated as the imposed deformation at which
the most severe damage level is expected to initiate. A constant ratio of 1.4 between the following
amplitude and preceding amplitude is adopted. If the specimen has not reached the final damage state
at the estimated maximum deformation amplitude, the amplitude shall be increased further by 30% of
the estimated maximum deformation amplitude.
The six loading protocols in Figure 4.1 share one feature in common: reversed cyclic loading.
Three out of the six protocols, including SDP, CUREE and ISO, have more than two cycles for the
same amplitude and are developed for timber structures; the other three, ATC-24, SAC and FEM 461,
basically have two cycles for the same amplitude. Out of the three loadings, the SAC protocol
permits the explicit usage of story drift instead of the often subjective yield deformation or maximum
displacement, which makes it simple in testing subassemblies that are representative of typical
stories. In practical application, the double-tapered link will be installed between beams, which
makes it sensitive to the story drift. Therefore, the incremental two-cycle loading basically following
SAC protocol was adopted in Chapters 3, 5 and 6.
In Chapter 3, the feasibility of using torsional deformation of double-tapered links to estimate
the maximum experienced shear deformation was verified under the incremental two-cycle loading.
However, the condition assessment performance of the double-tapered link under different loadings,
for instance, earthquake response with a variable amplitude history, needs investigation. Meanwhile,
a specific loading protocol based on which the double-tapered link can be designed is needed. If
occurrence of notable torsional deformation under earthquake response can be presented by that
under incremental two-cycle loading, the double-tapered link can be designed using the incremental
two-cycle loading, while taking into account the variances of earthquake responses.
4.1.2 Organization
This chapter emphasizes on the torsional deformation of double-tapered links under earthquake

4 - 4
loading. First, twenty earthquake loadings were obtained and used as the loading in the numerical
analysis of double-tapered links. Then, three slit-wall specimens with double-tapered links were
designed and tested using two representative earthquake loadings to verify the numerical findings.
4.2 Condition assessment performance of double-tapered links in
simulation
In this section, earthquake loading, defined as a variable amplitude history, was first obtained. Then
it was used as the input lateral drift for double-tapered links. Last, two representative earthquake
loadings were selected for the experimental verification in a later section.
4.2.1 Earthquake loading
The terminology of “earthquake loading” is not the real story response in case of an earthquake but
a variable amplitude history. The incremental two-cycle loading is ascending in amplitudes with
each amplitude repeated twice; the variable amplitude history focuses more on the non-stationary
amplitude distribution, as observed in earthquake response. The variable amplitude history is
obtained from the displacement response history of a single degree of freedom (SDOF) system
subjected to ground motion. An SDOF system can be used to substitute a multi degree of freedom
system in obtaining the story responses, and the elastic histories show similar tapered decays in the
ordered relative excursions with the inelastic histories [9]. For simplicity, a linear SDOF system
with a natural period of 0.5 second and critical damping of 2% representing a medium-rise steel
building is adopted to obtain the displacement response history.
Ground motions are needed in time history analysis. Krawinkler et al., Baker and Cornell,
Haselton et al. and among others, have conducted much work on selecting and scaling ground
motions [10-13]. This work does not touch on ground motion selection. The ground motions used
here are directly selected from the ground motion data base of PEER Transportation Research
Program (TSPR). One advantage of the TSPR motions is that their ground motions are not
site-specific/structure-specific, suitable to analyze a variety of structures potentially located in
active seismic regions. Ten ground motions are selected from the “broad-band” ground motions
that have the distribution of response spectra associated with moderately large earthquakes at small
distances; the other ten ground motions are selected from the “near-fault” ground motions that
consider the sites experiencing near-fault directivity. The ten ground motions in each set, twenty
ground motions in total, are selected generally based on the duration. The ground motions with
short duration result in short computing time (not a problem for the SDOF system, but time
consuming in analysis of double-tapered links). Details of the TSPR ground motions are available
in [14].
Note that the purpose of selecting two types of ground motions, “broad-band” and “near-fault”,
is to obtain more diverse variable amplitude histories that are similar to earthquake response. The
difference of actual earthquake response under two types of ground motions is not the interest here.

4 - 5
Figure 4.2 shows the displacement responses of the SDOF system subjected to the twenty
ground motions.
0 10 20-1.0
-0.5
0.0
0.5
1.0
No
rma
lize
d a
mp
litu
de
Time (s)
0 10 20 30-1.0
-0.5
0.0
0.5
1.0
Norm
aliz
ed a
mplit
ud
eTime (s)
0 10 20 30-1.0
-0.5
0.0
0.5
1.0
Norm
aliz
ed a
mplit
ud
e
Time
(a) (b) (c)
0 10 20-1.0
-0.5
0.0
0.5
1.0
Norm
aliz
ed a
mplit
ud
e
Time (s)
0 10 20 30-1.0
-0.5
0.0
0.5
1.0
Norm
aliz
ed a
mplit
ud
e
Time (s)
0 10 20 30 40-1.0
-0.5
0.0
0.5
1.0
Norm
aliz
ed a
mplit
ude
Time (s)
(d) (e) (f)
0 10 20 30-1.0
-0.5
0.0
0.5
1.0
Norm
aliz
ed a
mplit
ud
e
Time (s)
0 10 20-1.0
-0.5
0.0
0.5
1.0
Norm
aliz
ed a
mplit
ud
e
Time (s)
0 10 20 30-1.0
-0.5
0.0
0.5
1.0
Norm
aliz
ed a
mplit
ud
e
Time (s)
(g) (h) (i)
0 10 20 30 40-1.0
-0.5
0.0
0.5
1.0
Norm
aliz
ed a
mplit
ude
Time (s)
0 10 20 30 40-1.0
-0.5
0.0
0.5
1.0
Norm
aliz
ed a
mplit
ude
Time (s)
0 10 20 30-1.0
-0.5
0.0
0.5
1.0
Norm
aliz
ed a
mplit
ud
e
Time (s)
(j) (k) (l)

4 - 6
0 10 20 30-1.0
-0.5
0.0
0.5
1.0
Norm
aliz
ed a
mplit
ud
e
Time (s)
0 10 20 30 40 50-1.0
-0.5
0.0
0.5
1.0
Norm
aliz
ed a
mplit
ud
e
Time (s)
0 10 20-1.0
-0.5
0.0
0.5
1.0
Norm
aliz
ed a
mplit
ud
e
Time (s)
(m) (n) (o)
0 10 20-1.0
-0.5
0.0
0.5
1.0
Norm
aliz
ed a
mplit
ud
e
Time (s)
0 10 20 30 40-1.0
-0.5
0.0
0.5
1.0N
orm
aliz
ed a
mplit
ude
Time (s)
0 10 20 30 40 50-1.0
-0.5
0.0
0.5
1.0
Norm
aliz
ed a
mplit
ud
e
Time (s)
(p) (q) (r)
0 10 20 30 40-1.0
-0.5
0.0
0.5
1.0
Norm
aliz
ed a
mplit
ude
Time (s)
0 10 20 30-1.0
-0.5
0.0
0.5
1.0
Norm
aliz
ed a
mplit
ud
e
Time (s)
(s) (t)
Figure 4.2 Displacement responses under twenty ground motions.
4.2.2 Behavior under incremental two-cycle loading
Three double-tapered links, the dimensions of which are listed in Table 4.1, are built. To compare
torsional deformation under earthquake loading with that under incremental two-cycle loading, the
three links were first analyzed under the incremental two-cycle loading. Figure 4.3 shows the
progress of torsional deformation. Based on the “off-one-thickness” criterion for notable torsional
deformation (see in detail in Section 3.4.2 in Chapter 3), notable torsional deformation occurred at
drift ratios of 2%, 3% and 4%, respectively. The horizontal dashed horizontal lines indicate the
rotation angle needed when notable torsional deformation occurs, which also applies to the other
figures with horizontal dashed lines in bellow.

4 - 7
Table 4.1 Three links under incremental two-cycle loading
Link dimension Occurrence of notable torsional deformation
Link 1: a/t/h=30/4.3/360 2%
Link 2: a/t/h=22/4.3/360 3%
Link 3: a/t/h=18/4.3/360 4%
-5.0
-2.5
0.0
2.5
5.0
Drift
ra
tio
(%
)
Loading steps
0 1 2 3 4 5
0
10
20
30
40
R (
degre
es)
Drift ratio (%)
Link 1
Link 2
Link 3
(a) (b)
Figure 4.3 Under incremental two-cycle loading: (a) incremental two-cycle loading; (b) progress
of torsional deformation.
The earthquake loadings in Figures 4.2 were scaled according to the largest peak amplitude.
Taking an earthquake loading in Figure 4.4 as an example, it was scaled to have the largest peak
amplitude equal the drift ratios of 1.5%, 2%, 2.5%, and so forth, until notable torsional deformation
was achieved. The increment was a drift ratio of 0.5%.
0 10 20-1.0
-0.5
0.0
0.5
1.0
No
rma
lize
d a
mp
litu
de
Time (s)
1.5%, 2%, 2.5%...
Figure 4.4 Scaling of earthquake loading.
4.2.3 Behavior under earthquake loading
Under the twenty earthquake loadings, the occurrence of notable torsional deformation was
summarized in Table 4.2. The occurrence of notable torsional deformation under the earthquake
loading was mostly consistent with that under incremental two-cycle loading, for instance, the
widest Link 1; there were more variations for thick links (e.g. Link 3) than thin links (e.g. Link 1).
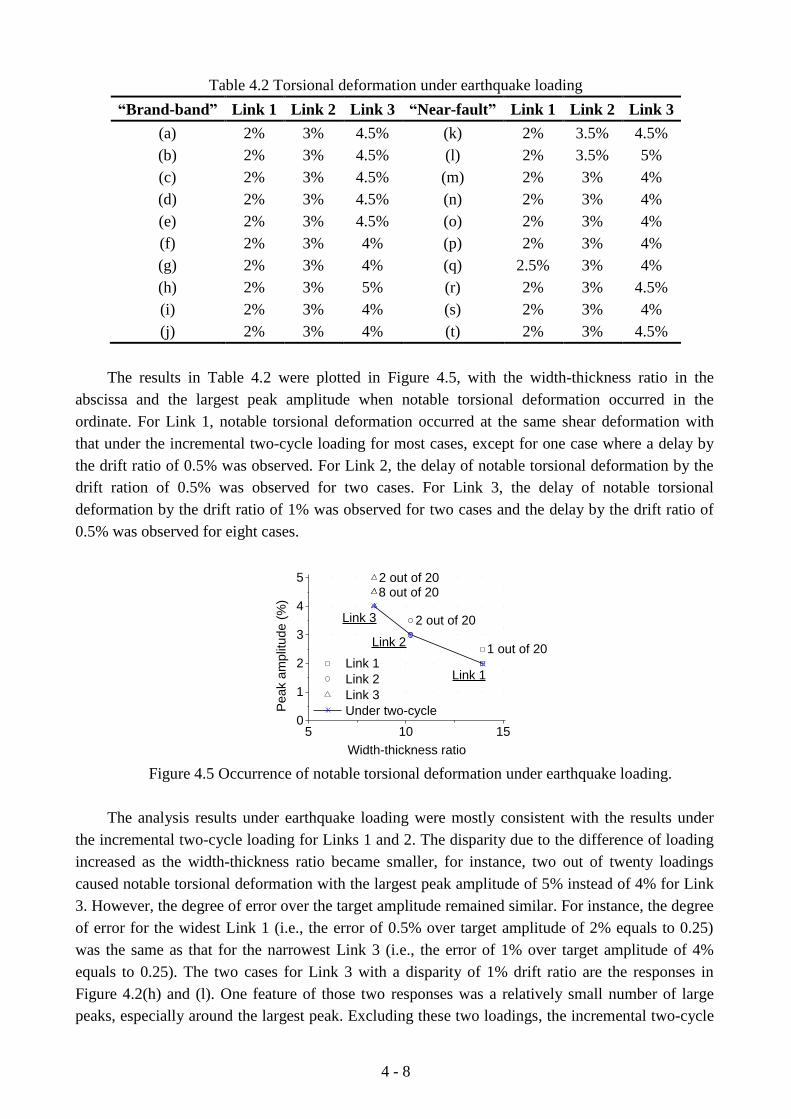
4 - 8
Table 4.2 Torsional deformation under earthquake loading
“Brand-band” Link 1 Link 2 Link 3 “Near-fault” Link 1 Link 2 Link 3
(a) 2% 3% 4.5% (k) 2% 3.5% 4.5%
(b) 2% 3% 4.5% (l) 2% 3.5% 5%
(c) 2% 3% 4.5% (m) 2% 3% 4%
(d) 2% 3% 4.5% (n) 2% 3% 4%
(e) 2% 3% 4.5% (o) 2% 3% 4%
(f) 2% 3% 4% (p) 2% 3% 4%
(g) 2% 3% 4% (q) 2.5% 3% 4%
(h) 2% 3% 5% (r) 2% 3% 4.5%
(i) 2% 3% 4% (s) 2% 3% 4%
(j) 2% 3% 4% (t) 2% 3% 4.5%
The results in Table 4.2 were plotted in Figure 4.5, with the width-thickness ratio in the
abscissa and the largest peak amplitude when notable torsional deformation occurred in the
ordinate. For Link 1, notable torsional deformation occurred at the same shear deformation with
that under the incremental two-cycle loading for most cases, except for one case where a delay by
the drift ratio of 0.5% was observed. For Link 2, the delay of notable torsional deformation by the
drift ration of 0.5% was observed for two cases. For Link 3, the delay of notable torsional
deformation by the drift ratio of 1% was observed for two cases and the delay by the drift ratio of
0.5% was observed for eight cases.
5 10 150
1
2
3
4
5
Link 3
Link 2
Link 1
8 out of 20
2 out of 20
Peak a
mplit
ude (
%)
Width-thickness ratio
Link 1
Link 2
Link 3
Under two-cycle
2 out of 20
1 out of 20
Figure 4.5 Occurrence of notable torsional deformation under earthquake loading.
The analysis results under earthquake loading were mostly consistent with the results under
the incremental two-cycle loading for Links 1 and 2. The disparity due to the difference of loading
increased as the width-thickness ratio became smaller, for instance, two out of twenty loadings
caused notable torsional deformation with the largest peak amplitude of 5% instead of 4% for Link
3. However, the degree of error over the target amplitude remained similar. For instance, the degree
of error for the widest Link 1 (i.e., the error of 0.5% over target amplitude of 2% equals to 0.25)
was the same as that for the narrowest Link 3 (i.e., the error of 1% over target amplitude of 4%
equals to 0.25). The two cases for Link 3 with a disparity of 1% drift ratio are the responses in
Figure 4.2(h) and (l). One feature of those two responses was a relatively small number of large
peaks, especially around the largest peak. Excluding these two loadings, the incremental two-cycle

4 - 9
loading is sufficient in the design of double-tapered links, given the small variations in different
earthquake loadings.
In practical application, the shear wall with double-tapered links will be installed between
beams, as shown in Figure 3.2(a) in Chapter 3. Rigid elements will be installed between
double-tapered links and beams, to amplify the story drift into double-tapered links such that large
torsional deformation of double-tapered links can be obtained for visual inspection. Supposing the
rigid elements have the same height as the double-tapered link, the story drift will be amplified by
two times. Then, the disparity of 0.5% drift ratio will result in a difference of 0.25% drift ratio in the
story drift. Considering that condition assessment in this study resorts to inspection with the naked
eye, the level of accuracy expected is not so high. The disparity of 0.5% drift ratio is considered small
enough and within the acceptable error range.
4.2.4 Two representative earthquake loadings
To verify the numerical findings, specific earthquake loadings are needed. Two earthquake
loadings among twenty (Figure 4.2) were selected, as shown in Figure 4.6. The largest peak
amplitude in Figure 4.6(a) is located at the middle of history with many pre-peak and post-peak
cycles of small amplitudes. This loading is designated as the “middle-peak” earthquake loading. In
Figure 4.6(b), the largest peak amplitude is early in the history and is followed by decaying
amplitudes; this loading is termed the “early-peak” earthquake loading. Together with the
incremental two-cycle loading whose largest peak amplitudes are steadily increasing, these three
loadings are distinct from each other in terms of the sequence toward the largest peak amplitude.
0 10 20 30 40-1.0
-0.5
0.0
0.5
1.0
Norm
aliz
ed a
mplit
ude
Time (s)
0 10 20 30-1.0
-0.5
0.0
0.5
1.0
Norm
aliz
ed a
mplit
ud
e
Time (s)
(a) (b)
Figure 4.6 Two representative earthquake loadings: (a) “middle-peak”; (b) “early-peak”.
4.3 Test Preparation
4.3.1 Test specimens
Three double-tapered links were same as in simulation, with the mid-section widths of 30 mm (Link
1), 22 mm (Link 2) and 18 mm (Link 3), plate thickness of 4.5 mm (actual thickness of 4.3 mm)
and link height of 360 mm. The steel plate was from the same batch as in tests presented in Chapter
3, conventional mild steel SS400 with a yield stress of 374 MPa and approximated strain hardening
of 0.5%.
In Section 3.6 of Chapter 3, two types of in-plane reference, the “wing” type and “whole-height”
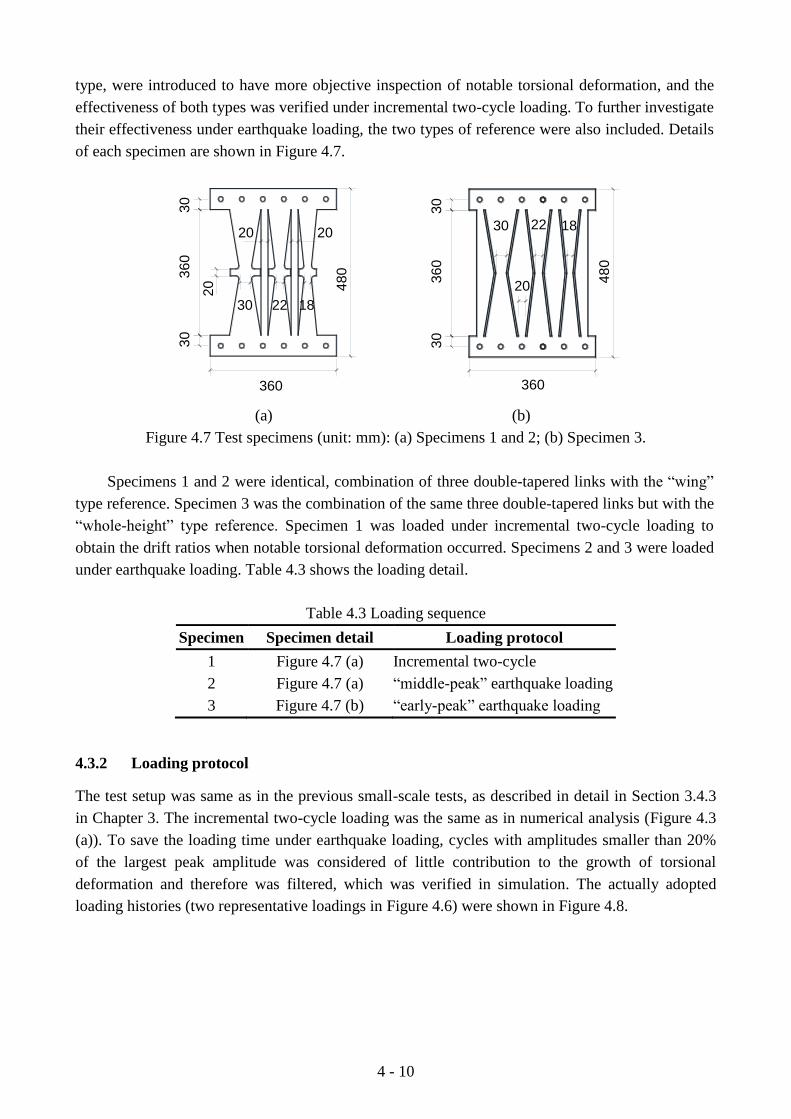
4 - 10
type, were introduced to have more objective inspection of notable torsional deformation, and the
effectiveness of both types was verified under incremental two-cycle loading. To further investigate
their effectiveness under earthquake loading, the two types of reference were also included. Details
of each specimen are shown in Figure 4.7.
20
30 22 18
48
0
20 20
360
30
360 3
0
48
0
20
360
30 22 18
30
360
30
(a) (b)
Figure 4.7 Test specimens (unit: mm): (a) Specimens 1 and 2; (b) Specimen 3.
Specimens 1 and 2 were identical, combination of three double-tapered links with the “wing”
type reference. Specimen 3 was the combination of the same three double-tapered links but with the
“whole-height” type reference. Specimen 1 was loaded under incremental two-cycle loading to
obtain the drift ratios when notable torsional deformation occurred. Specimens 2 and 3 were loaded
under earthquake loading. Table 4.3 shows the loading detail.
Table 4.3 Loading sequence
Specimen Specimen detail Loading protocol
1 Figure 4.7 (a) Incremental two-cycle
2 Figure 4.7 (a) “middle-peak” earthquake loading
3 Figure 4.7 (b) “early-peak” earthquake loading
4.3.2 Loading protocol
The test setup was same as in the previous small-scale tests, as described in detail in Section 3.4.3
in Chapter 3. The incremental two-cycle loading was the same as in numerical analysis (Figure 4.3
(a)). To save the loading time under earthquake loading, cycles with amplitudes smaller than 20%
of the largest peak amplitude was considered of little contribution to the growth of torsional
deformation and therefore was filtered, which was verified in simulation. The actually adopted
loading histories (two representative loadings in Figure 4.6) were shown in Figure 4.8.

4 - 11
0 20 40 60 80-1.0
-0.5
0.0
0.5
1.0
No
rma
lize
d a
mp
litu
de
Loading steps
0 20 40 60-1.0
-0.5
0.0
0.5
1.0
No
rma
lize
d a
mp
litu
de
Loading steps
(a) (b)
Figure 4.8 Adopted earthquake loading: (a) “middle-peak”; (b) “early-peak”.
4.4 Test results
4.4.1 Under incremental two-cycle loading
Specimen 1 had three double-tapered links with the “wing” type reference as shown in Figure 4.9(a).
At the completion of each drift ratio with two cycles, inspection of torsional deformation with naked
eyes was conducted focusing on the mid-section. At a drift ratio of 2.5%, only the widest Link 1
showed notable torsional deformation (marked with a red circle) and the other two links remained
in-plane (Figure 4.9(b)). At a drift ratio of 3.5%, Link 1 deformed further, the middle widest Link 2
showed notable torsional deformation (marked with a red circle) and the narrowest Link 3 remained
unbuckled (Figure 4.9(c)). At a drift ratio of 4.5%, Link 3 started to deform notably in torsion
(marked with a red circle) and Links 1 and 2 deformed further (Figure 4.9(d)). This distinct torsional
deformation in sequence, from the widest link to the narrowest link, again provided clear evidence
that supported the scenario of condition assessment proposed in this study. From the torsional
deformation as shown in Figure 4.9(e), torsional deformation of double-tapered links (marked with
red circles) was more notable with the addition of the “wing” type reference.
Lin
k 1
Lin
k 2
Lin
k 3
(a) (b) (c)

4 - 12
(d) (e)
Figure 4.9 Torsional deformation in test: (a) before loading; (b)-(d) enlarged view at drift ratios of
2.5%, 3.5% and 4.5%; (e) at a drift ratio of 4.5%.
Figure 4.10 shows the growth of torsional deformation in terms of rotation angle of the
mid-section. In each loading, two identical specimens were loaded simultaneously. The solid curves
are for the left side specimen and dashed curves for the right side specimen. The results of the two
specimens were nearly the same, and this added evidence on the repeatability of torsional
deformation. Based on the “off-one-thickness” criterion, notable torsional deformation occurred at
2.5%, 3.5% and 4.5% drift ratio respectively. For simplicity in describing test data, only the results of
the right side specimen were presented in below.
Compared with simulation (Figure 4.3(b)), the occurrence of notable torsional deformation in
the test was delayed consistently by a drift ratio of 0.5%. The 0.5% drift ratio delay was reasoned as
the decrease in fixity at the boundary conditions. The connection part of the double-tapered links
was sandwiched by two angles on both sides using high-strength bolts, and the angles were bolted to
the loading column. Under large shear deformation, the link ends sustained large tension and
compression stress, which somewhat reduced the thickness of the connection part due to Poisson’s
ratio and accordingly the friction force around the bolt holes. Such reduction of fixity allowed slight
rotation at the link ends, which eventually delayed the torsional deformation. Note that, such delay
was not observed in the previous tests in Chapter 3, in which an end zone was presented between the
connection part and link ends. This end zone most likely buffered the large stresses at link ends to the
connection part, and more reliable fixity was guaranteed.
0 1 2 3 4 5
0
10
20
30
R (
degre
es)
Drift ratio (%)
Left specimen
Link 1
Link 2
Link 3
Right specimen
Link 1
Link 2
Link 3
Figure 4.10 Progress of torsional deformation.
Based on the results under incremental two-cycle loading, the largest peak amplitudes of the two
representative earthquake loadings in Figure 4.8 were scaled to 1.5%, 2.5%, 3.5% and 4.5% drift
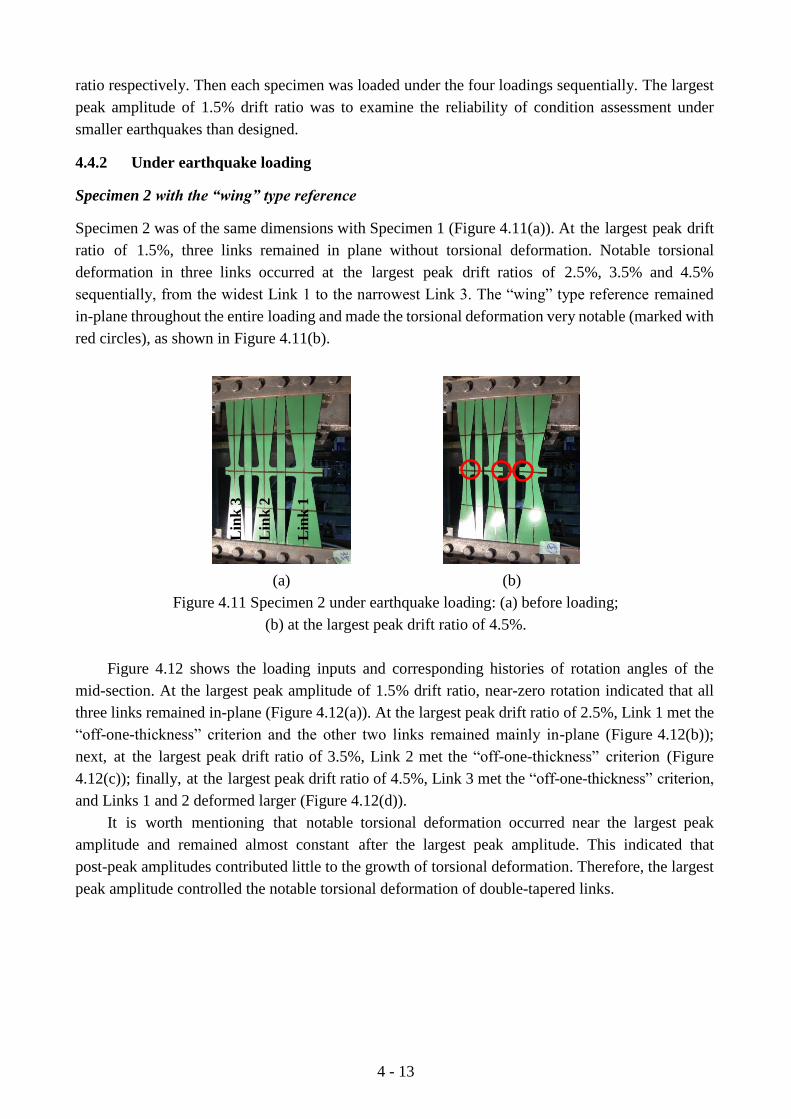
4 - 13
ratio respectively. Then each specimen was loaded under the four loadings sequentially. The largest
peak amplitude of 1.5% drift ratio was to examine the reliability of condition assessment under
smaller earthquakes than designed.
4.4.2 Under earthquake loading
Specimen 2 with the “wing” type reference
Specimen 2 was of the same dimensions with Specimen 1 (Figure 4.11(a)). At the largest peak drift
ratio of 1.5%, three links remained in plane without torsional deformation. Notable torsional
deformation in three links occurred at the largest peak drift ratios of 2.5%, 3.5% and 4.5%
sequentially, from the widest Link 1 to the narrowest Link 3. The “wing” type reference remained
in-plane throughout the entire loading and made the torsional deformation very notable (marked with
red circles), as shown in Figure 4.11(b).
Lin
k 1
Lin
k 2
Lin
k 3
(a) (b)
Figure 4.11 Specimen 2 under earthquake loading: (a) before loading;
(b) at the largest peak drift ratio of 4.5%.
Figure 4.12 shows the loading inputs and corresponding histories of rotation angles of the
mid-section. At the largest peak amplitude of 1.5% drift ratio, near-zero rotation indicated that all
three links remained in-plane (Figure 4.12(a)). At the largest peak drift ratio of 2.5%, Link 1 met the
“off-one-thickness” criterion and the other two links remained mainly in-plane (Figure 4.12(b));
next, at the largest peak drift ratio of 3.5%, Link 2 met the “off-one-thickness” criterion (Figure
4.12(c)); finally, at the largest peak drift ratio of 4.5%, Link 3 met the “off-one-thickness” criterion,
and Links 1 and 2 deformed larger (Figure 4.12(d)).
It is worth mentioning that notable torsional deformation occurred near the largest peak
amplitude and remained almost constant after the largest peak amplitude. This indicated that
post-peak amplitudes contributed little to the growth of torsional deformation. Therefore, the largest
peak amplitude controlled the notable torsional deformation of double-tapered links.

4 - 14
-1.5
0.0
1.5
-10
0
10
20
30
40
Dri
ft r
atio
(%
)
Loading steps
R (
de
gre
es)
Link 1
Link 2
Link 3
-2.5
0.0
2.5
-10
0
10
20
30
40
Dri
ft r
atio
(%
)
Loading steps
R (
de
gre
es)
Link 1
Link 2
Link 3
(a) (b)
-3.5
0.0
3.5
-10
0
10
20
30
40
Drift r
atio (
%)
Loading steps
R (
degre
es)
Link 1
Link 2
Link 3
-4.5
0.0
4.5
-10
0
10
20
30
40D
rift r
atio (
%)
R (
degre
es)
Link 1
Link 2
Link 3
Loading steps
(c) (d)
Figure 4.12 Progress of torsional deformation: (a)-(d) at the largest peak drift ratios of 1.5%, 2.5%,
3.5% and 4.5% respectively, with the top figure being the loading history and the bottom being the
torsional deformation history.
Specimen 3 with the “whole-height” type reference
The three links in Specimen 3 had the “whole-height” type reference (Figure 4.13(a)). At the largest
peak amplitude of 1.5%, out-of-plane deformation at the quart-height sections was very small and
barely recognizable. At the largest peak drift ratios of 2.5%, 3.5% and 4.5%, “off-one-thickness”
criterion was recognized in visual inspection. The “whole-height” type reference remained in-plane
throughout the entire loading and made the torsional deformation very notable (marked with red
circles), as shown in Figure 4.13(b).

4 - 15
Lin
k 1
Lin
k 2
Lin
k 3
(a) (b)
Figure 4.13 Specimen 3 under earthquake loading: (a) before loading;
(b) at the largest peak drift ratio of 4.5%.
Figure 4.14 shows the loading inputs and corresponding histories of out-of-plane deformation at
quarter-height section, which is normalized by the plate thickness. According to the
“off-one-thickness” criterion, the torsional deformation is considered notable and recognizable with
the naked eye when the normalized deformation is larger than unity. At the largest peak drift ratio of
1.5%, Link 1 buckled out-of-plane, but the normalized deformation was smaller than unity. At the
largest peak drift ratio of 2.5%, the normalized deformation of Link 1 exceeded unity, and notable
torsional deformation was confirmed. At the largest peak drift ratios of 3.5% and 4.5%, the
normalized deformation of the other two links met the “off-one-thickness” criterion. Similarly,
notable torsional deformation occurred near the largest peak amplitude and post-peak amplitudes did
not increase the amplitude of out-of-plane deformation.
-1.5
0.0
1.5
0
1
2
3
4
Dri
ft r
atio
(%
)
Loading stepsNo
rma
lize
d d
efo
rma
tio
n
Link 1
Link 2
Link 3
-2.5
0.0
2.5
0
1
2
3
4
Dri
ft r
atio
(%
)
Loading stepsNo
rma
lize
d d
efo
rma
tio
n
Link 1
Link 2
Link 3
(a) (b)

4 - 16
-3.5
0.0
3.5
0
1
2
3
4
Dri
ft r
atio (
%)
Loading stepsNorm
aliz
ed d
efo
rmation
Link 1
Link 2
Link 3
-4.5
0.0
4.5
0
1
2
3
4
Dri
ft r
atio (
%)
Loading stepsNorm
aliz
ed d
efo
rmation
Link 1
Link 2
Link 3
(c) (d)
Figure 4.14 Progress of out-of-plane deformation at quarter-height section: (a)-(d) at the largest peak
drift ratios of 1.5%, 2.5%, 3.5% and 4.5% respectively, with the top figure being the loading history
and the bottom being the out-of-plane deformation at quarter height.
Under both earthquake loadings, notable torsional deformation was recognized at the largest
peak amplitudes that were the same as those experienced by incremental two-cycle loading. Despite
the non-stationary nature of earthquake loading characterized by many peaks with various
amplitudes, incremental two-cycle loading was verified as a good representative in determining the
occurrence of notable torsional deformation. In the design of double-tapered links for condition
assessment, incremental two-cycle loading can be adopted as the base loading protocol.
4.5 Summary
This chapter investigated the condition assessment performance of double-tapered links under
earthquake loading. Major findings from both numerical analysis and associated experiments are
summarized as follows:
(1) Under the incremental two-cycle loading, three double-tapered links with different widths
showed notable torsional deformation at drift ratios of 2.5%, 3.5% and 4.5% respectively, which
further proved the feasibility of condition assessment proposed in this study.
(2) Under earthquake loading, notable torsional deformation occurred when the largest peak
amplitude was scaled to drift ratios of 2.5%, 3.5% and 4.5% respectively, same as the drift ratios
experienced under incremental two-cycle loading. The incremental two-cycle loading gave a good
representative of earthquake loading in determining the occurrence of notable torsional deformation
and thus can be adopted as the base loading protocol in the design of double-tapered links for
condition assessment.
(3) Two types of in-plane reference, the “wing” type and “whole-height” type, both remained
in-plane throughout the entire loading and provided a good reference for the torsional deformation
of double-tapered links. Similar with the incremental two-cycle loading, the inspection of notable
torsional deformation was much more objective with the presence of in-plane reference.

4 - 17
REFERENCES
[1] Krawinkler H. Loading histories for cyclic tests in support of performance assessment of
structural components. Third International Conference on Advances in Experimental
Structural Engineering, 2009.
[2] Porter M.L. Sequential phased displacement (SPD) procedure for TCCMAR testing
proceedings. Third Meeting of the Joint Technical Coordinating Committee on Masonry
Research, US-Japan Coordinated Research Program, 1987.
[3] SEAOSC. Report of a testing program of light-framed walls with wood-sheathed shear panels.
City of Los Angeles Department of Building and Safety, 2001.
[4] ATC-24. Guidelines for cyclic seismic testing of components of steel structures for buildings.
Report No. ATC-24, Applied Technology Council, Redwood City, CA, 1992.
[5] Clark P., Frank K., Krawinkler H. and Shaw R. Protocol for fabrication, inspection, testing,
and documentation of beam-column connection tests and other experimental specimens. SAC
Background Document SAC/BD-97/02, 1997.
[6] AISC/AISC 341-05. Seismic Provisions for Structural Steel Buildings. American Institute of
Steel Construction, Inc., Chicago, 2005.
[7] Krawinkler H., Parisi, F., Ibarra L., Ayoub A. and Medina R. Development of a Testing
Protocol for woodframe Structures. CUREE Publication No. W-02, 2001.
[8] ISO 16670. Timber Structures, Joints made with mechanical fasteners, quasi-static
reversed-cyclic test method. International Organization for Standardization for Standardization,
Geneva, Switzerland, 2003.
[9] FEMA-461. Interim protocols for determining seismic performance characteristics of
structural and nonstructural components through laboratory testing. Federal Emergency
Management Agency, Washington, 2007.
[10] Krawinkler H., Medina R. and Alavi B. Seismic drift and ductility demands and their
dependence on ground motions. Engineering Structures 2003; 25(5): 637-653.
[11] Baker J.W. and Cornell C.A. Spectral shape, epsilon and record selection. Earthquake
Engineering & Structural Dynamics 2006; 35(9): 1077-1095.
[12] Haselton C.B., Baker J.W., Bozorgnia Y. and et al. Evaluation of ground motion selection and
modification methods: predicting median interstory drift response of buildings. PEER Report
2009-01, prepared by the PEER Ground Motion Selection and Modification Working Group,
edited by Curt B., Haselton, for the Pacific Earthquake Engineering Research Center,
University of California, Berkeley.
[13] NIST GCR 11-917-15. Selecting and scaling earthquake ground motions for performing
response-history analyses. NEHRP Consultants Joint Venture.
[14] http://peer.berkeley.edu/transportation/projects/ground-motion-studies-for-transportation-syst
ems/


5 - 1
CHAPTER 5
Enhancement of energy dissipation and design of end plate connection
5.1 Introduction
In Chapters 3 and 4, the feasibility of implementing structural condition assessment through
inspecting notable torsional deformation of double-tapered links was demonstrated. Slit walls with
relatively thick links exhibited good energy dissipation [1]. However, for the purpose of condition
assessment, a relatively thin plate is needed to have early and large torsional deformation. Figure 5.1
shows such a slit wall with double-tapered links, large torsional deformation of which produced
significant pinching in the hysteretic loops. As a passive damper device itself, the pinched
hysteresis is not necessarily desirable. How to eliminate or reduce the pinching to achieve better
energy dissipation capacity, while maintaining the function of condition assessment, is the emphasis
of this chapter.
-6 -4 -2 0 2 4 6-80
-40
0
40
80
Forc
e (
kN
)
Drift ratio (%) (a) (b)
Figure 5.1 Previous test: (a) a wall with double-tapered links; (b) hysteretic curve.
To have large torsional deformation for visual inspection, large shear deformation needs to be
transferred into double-tapered links. With double-tapered links installed between beams, it is natural
to come out using rigid elements between beams and double-tapered links to amplify the story drift
into double-tapered links due to the height difference (much shorter link height than the story height).
However, the usage of rigid elements certainly increases construction costs and makes the assembly
much complicated and esthetically undesirable. A simple way of connection which could
successfully transfer the story drift into double-tapered links is another issue worth discussion.
In this chapter, strength and stiffness of double-tapered links were estimated and verified with
test results first. Second, slit walls with rectangular links made from low yield point steel are
investigated to have sound energy dissipation. Third, a system with spaced double layers is tested to
investigate the performance of condition assessment and energy dissipation in a single specimen.
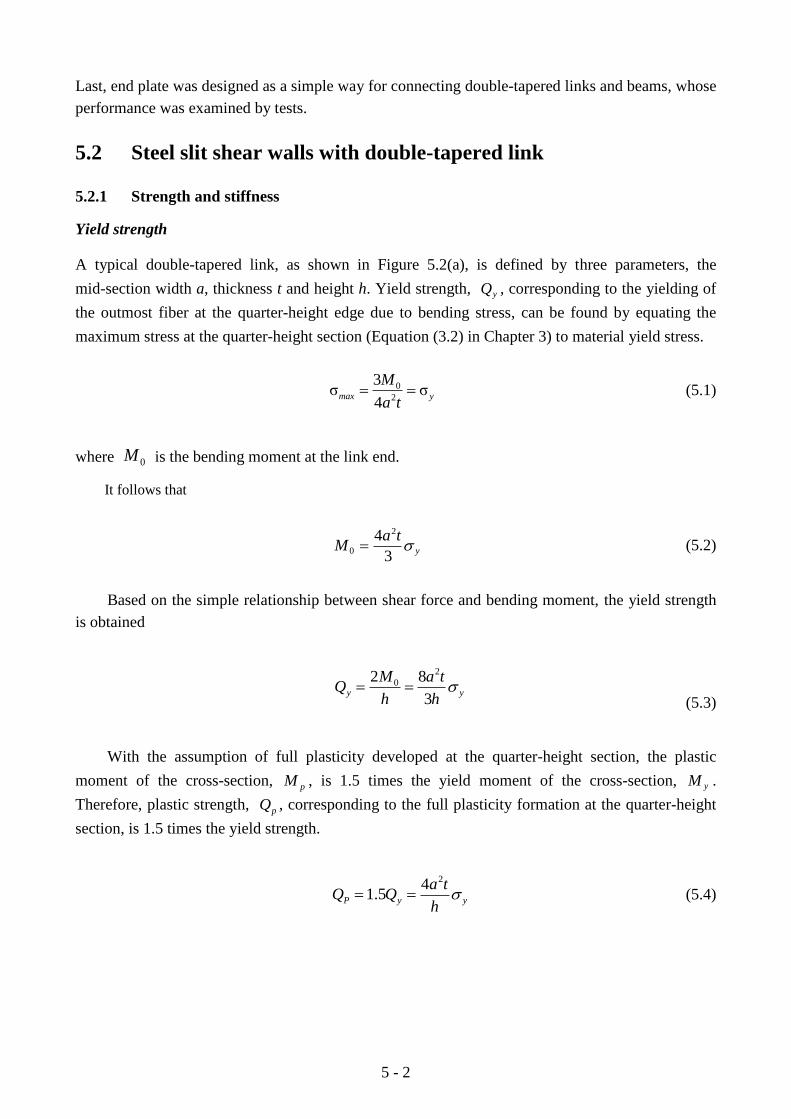
5 - 2
Last, end plate was designed as a simple way for connecting double-tapered links and beams, whose
performance was examined by tests.
5.2 Steel slit shear walls with double-tapered link
5.2.1 Strength and stiffness
Yield strength
A typical double-tapered link, as shown in Figure 5.2(a), is defined by three parameters, the
mid-section width a, thickness t and height h. Yield strength, yQ , corresponding to the yielding of
the outmost fiber at the quarter-height edge due to bending stress, can be found by equating the
maximum stress at the quarter-height section (Equation (3.2) in Chapter 3) to material yield stress.
0
2
3σ σ
4max y
M
a t (5.1)
where 0M is the bending moment at the link end.
It follows that
2
0
4
3y
a tM (5.2)
Based on the simple relationship between shear force and bending moment, the yield strength
is obtained
0
282
3y y
aQ
M t
h h
(5.3)
With the assumption of full plasticity developed at the quarter-height section, the plastic
moment of the cross-section, pM , is 1.5 times the yield moment of the cross-section, yM .
Therefore, plastic strength, pQ , corresponding to the full plasticity formation at the quarter-height
section, is 1.5 times the yield strength.
241.5P y y
a tQ Q
h (5.4)

5 - 3
Buckling strength
In the plate buckling theory, width-thickness ratio plays an import role. The torsional deformation
of double-tapered links is considered in the domain of plate buckling. There is much work on elastic
buckling of rectangular plates. The local buckling stress of a rectangular plate is given by [2]
2
2 212(1 )( / )cr
Ek
b t
(5.5)
where k is the buckling coefficient determined by the plate geometry and boundary conditions; E
is Young’s modulus; is Poisson’s ratio; b is plate width; and t is thickness.
However, it is impractical to derive a closed-form equation for the exact elastic buckling load
of double-tapered links because of the tapered shape. Instead, the double-tapered link was assumed
to be equivalent to a rectangular link with a uniform width of b = 2a (width at the quarter-height
section), as shown in Figure 5.2.
Q
a
ht
b=2a
h/2
Moment
SS
SS:
Simply
supported
SS
Free
Moment
(a) (b) (c)
Figure 5.2 Double-tapered link: (a) a double-tapered link under shear; (b) half of the link; (c)
assumed boundary condition.
For half of the link under shear deformation, one of the unloaded two edges will be in tension
while the other in compression. The tension field provides constraint close to the effect of simply
supported boundary, while the edge in compression is free. The middle section is treated as simply
supported, in considering nearly no vertical movement but relatively free to rotate out-plane along
the axis of the middle section. Therefore, half of the link is equivalent to a rectangular plate, with
three edges simply supported and one edge free. With this boundary condition, the buckling
coefficient k when subjected to pure bending is 0.85 [3].
The resultant buckling strength Qcr under this critical stress is estimated as follows:
24 8
3cr
crcrcr
M a
hh
tQ (5.6)

5 - 4
where crM is the critical buckling moment at quarter-height section; h is the link height; a is the
width of mid-section and t is the thickness.
To verify the above assumption, double-tapered links with different width-thickness ratios
were simulated in ABAQUS [4]. Figure 5.3(a) shows the numerical model, in which the two link
ends are simply supported. Elastic material was used in simulation to compare the numerical results
with the calculation based on Equation (5.6). Buckling strength in simulation was the shear force
when notable torsional deformation was observed. Figure 5.3(b) shows the comparison of
calculation and simulation. The closeness between the calculation and simulation indicated the
correctness of equalizing double-tapered links to rectangular links in estimating the elastic buckling
strength.
0 10 20 30 40 50 60
0
2
4
6
8F
orc
e /
Qy
Width-thickness ratio
Elastic buckling
Numerical analysis
(a) (b)
Figure 5.3 Buckling strength: (a) numerical model; (b) comparison of calculation
and simulation.
Thin links (large in width-thickness ratio) buckle early prior to material yielding; thick links
buckle late after material yielding. By equaling the buckling stress in Equation (5.5) with yield
stress, the threshold of width-thickness ratio for elastic buckling is obtained. Taking 0.3 and
205E GPa, the critical width-thickness ratio at which elastic buckling controls is
2
2( / ) 430.4
12(1 )critical
y y
k E kb t
, (5.7)
where y is the yield stress.
Taking a yield stress of 374 MPa as an example, a width-thickness ratio of / 20.5b t is
obtained according to Equation (5.7). When the width-thickness ratio is larger than 20.5, elastic
buckling occurs ahead of material yielding; when the width-thickness ratio is smaller than 20.5,
material yielding occurs first and inelastic buckling follows. The yield strength based on material
yielding (Equation (5.3)) was used to estimate the inelastic buckling strength, which would be
verified by the test presented at a later section.

5 - 5
Elastic stiffness
The unit load method is used to derive the bending stiffness of double-tapered links. According to
the principle of virtual work, the displacement is attained as
2 2 22 2 2 2
3
0 0
2 2
12 12(
4A 4
h h h h
x
h h
M Q xdx dx dx dx
axEI x G Et ax G a tahh
31 0.55
12.7
h h
Et a Gat
, (5.8)
where h is link height; a is width of mid-section; t is thickness; E is Young’s modulus; and G is shear
modulus.
The first part of Equation (5.8) is the flexural deformation and the second part is the shear
deformation. Then the stiffness K is derived as
3
1 1
1 0.55
12.7
Kh h
Et a Gat
(5.9)
5.2.2 Experimental validation
Test specimens
In Chapter 3, ten pairs of specimens were tested in the preliminary study of double-tapered links for
condition assessment. Details of each specimen can be found in Section 3.4.1 in Chapter 3. Among
the ten pairs, seven pairs were with identical double-tapered links and one pair was a combination
of different double-tapered links. To evaluate the strength, stiffness and hysteretic behavior, seven
pairs with identical double-tapered links, Pairs 1-3 in Level 1, Pairs 5-7 in Level 2 and Pair 9 in
Level 3, were investigated here. Since two specimens in each pair were identical in bearing strength,
a single specimen in each pair was presented below.
Design strength
To quantify the lateral resistance slit walls with double-tapered links, a design strength has to be
identified. As shown in Figure 3.19 in Chapter 3, strain gauges were glued at the edge of
quarter-height section. The experimental yield strength .. was determined as the shear force applied
to the specimen when one of the strain gauges exceeded the yield strain obtained from the coupon
test. Table 5.1 lists the analytical yield strength ( yQ , according to Equation (5.3)) and experimental
yield strength.
As discussed in Section 3.3.5 in Chapter 3, lateral torsional buckling is also a likely failure
model for links [5]. The lateral torsional buckling strength Qlt estimated using Equation (3.5) in

5 - 6
Chapter 3 is also listed in Table 5.1.
Table 5.1 Summary of test results
Pair ytQ (kN) yQ (kN) /yt yQ Q / ycrQ Q / yltQ Q max tQ (kN) max /t yQ Q
1 11.8 13.7 0.86 0.82 0.84 16.0 1.17
2 15.7 20.6 0.76 0.82 1.41 21.1 1.03
3 85.1 107.2 0.79 0.78 1.98 104.2 0.97
5 15.7 16.5 0.96 2.26 1.28 23.1 1.41
6 26.0 24.7 1.05 2.26 2.06 36.0 1.46
7 62.5 64.3 0.97 2.16 2.81 79.2 1.23
9 40.6 40.0 1.01 4.87 3.84 55.5 1.39
The experimental and analytical strengths are very similar (with errors not greater than 5%) for
Pairs 5-7 and 9 (Levels 2 and 3), while the experimental strength is smaller by 14 to 24% than the
analytical strength for Pairs 1-3 (Level 1). The links in Level 1 were thinner than those in Levels 2
and 3; hence they were more susceptible to local buckling before significant yielding, which was
reasoned as a major cause of discrepancy.
For Pairs 1-3, the local buckling strength crQ (estimated using Equation (5.6)) was smaller
than the corresponding lateral torsional buckling strength ltQ (estimated using Equation (3.5) in
Chapter 3). Thus, local buckling was the failure mode for these specimens. For Pairs 5-9, the
predicted values for two buckling strengths were significantly greater than unity, thus the specimens
were subject to significant yielding prior to the onset of buckling. While it was difficult to estimate
the exact buckling strength in the inelastic range, the failure mechanism in terms of buckling is
explained as follows. The most critical section was the difference between local buckling and lateral
torsional buckling, that is, the former at the quarter height and the latter at the link end. Although
the end section remained elastic, the quarter-height section was subjected to significant yielding
with double-tapered links. In Table 5.1, while the critical strengths for lateral torsional buckling
were similar or slightly smaller than those for local buckling in Pairs 5 to 9, the local buckling
strength significantly decreased with the growth in yielding at the quarter-height section and thus
the governing failure mode remained as local buckling. This reasoning was further confirmed
because the experimental buckling shape was the same as for local buckling in all specimens. The
estimated buckling strength /cr yQ Q was close to the experimental yield strength /yt yQ Q for
specimens in Level 1, with a difference within 6%.
Based on the above discussion, design strength of the double-tapered link can be estimated
reasonably by the smaller of the strengths calculated from Equations (5.3) and (5.6), as shown in
Figure 5.4.
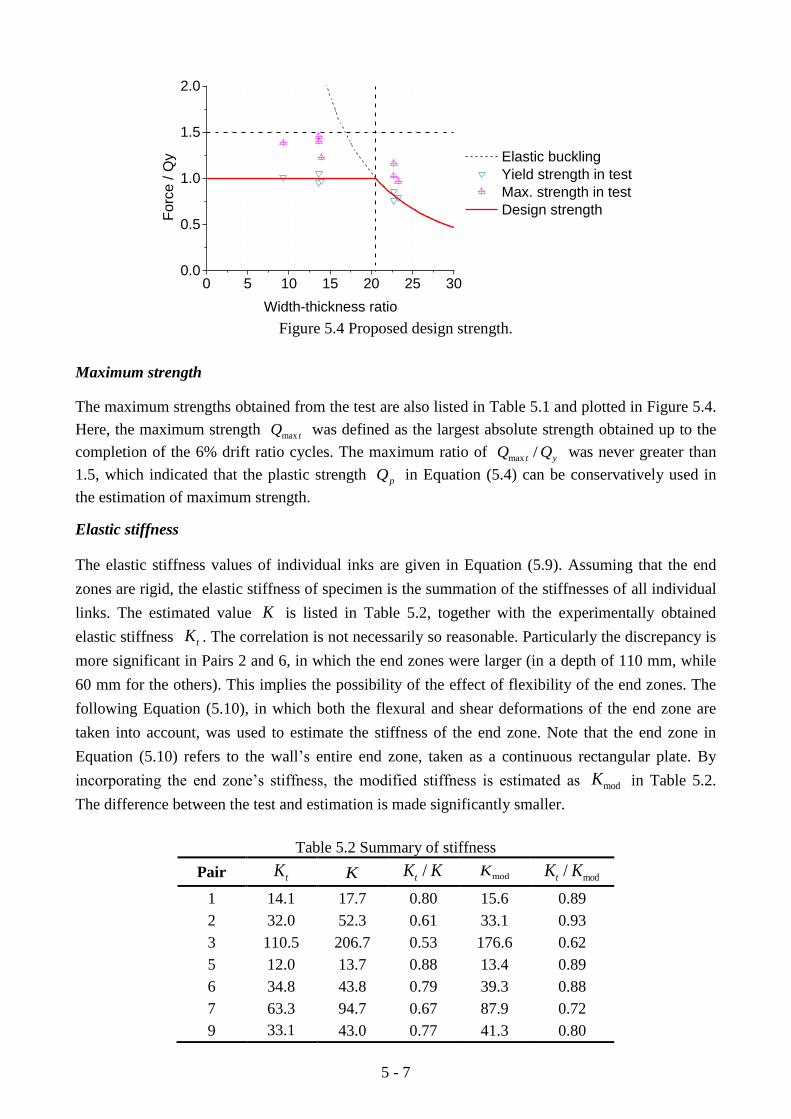
5 - 7
0 5 10 15 20 25 300.0
0.5
1.0
1.5
2.0
Fo
rce
/ Q
y
Width-thickness ratio
Elastic buckling
Yield strength in test
Max. strength in test
Design strength
Figure 5.4 Proposed design strength.
Maximum strength
The maximum strengths obtained from the test are also listed in Table 5.1 and plotted in Figure 5.4.
Here, the maximum strength max tQ was defined as the largest absolute strength obtained up to the
completion of the 6% drift ratio cycles. The maximum ratio of max /t yQ Q was never greater than
1.5, which indicated that the plastic strength pQ in Equation (5.4) can be conservatively used in
the estimation of maximum strength.
Elastic stiffness
The elastic stiffness values of individual inks are given in Equation (5.9). Assuming that the end
zones are rigid, the elastic stiffness of specimen is the summation of the stiffnesses of all individual
links. The estimated value K is listed in Table 5.2, together with the experimentally obtained
elastic stiffness tK . The correlation is not necessarily so reasonable. Particularly the discrepancy is
more significant in Pairs 2 and 6, in which the end zones were larger (in a depth of 110 mm, while
60 mm for the others). This implies the possibility of the effect of flexibility of the end zones. The
following Equation (5.10), in which both the flexural and shear deformations of the end zone are
taken into account, was used to estimate the stiffness of the end zone. Note that the end zone in
Equation (5.10) refers to the wall’s entire end zone, taken as a continuous rectangular plate. By
incorporating the end zone’s stiffness, the modified stiffness is estimated as modK in Table 5.2.
The difference between the test and estimation is made significantly smaller.
Table 5.2 Summary of stiffness
Pair tK K /tK K modK mod/tK K
1 14.1 17.7 0.80 15.6 0.89
2 32.0 52.3 0.61 33.1 0.93
3 110.5 206.7 0.53 176.6 0.62
5 12.0 13.7 0.88 13.4 0.89
6 34.8 43.8 0.79 39.3 0.88
7 63.3 94.7 0.67 87.9 0.72
9 33.1 43.0 0.77 41.3 0.80
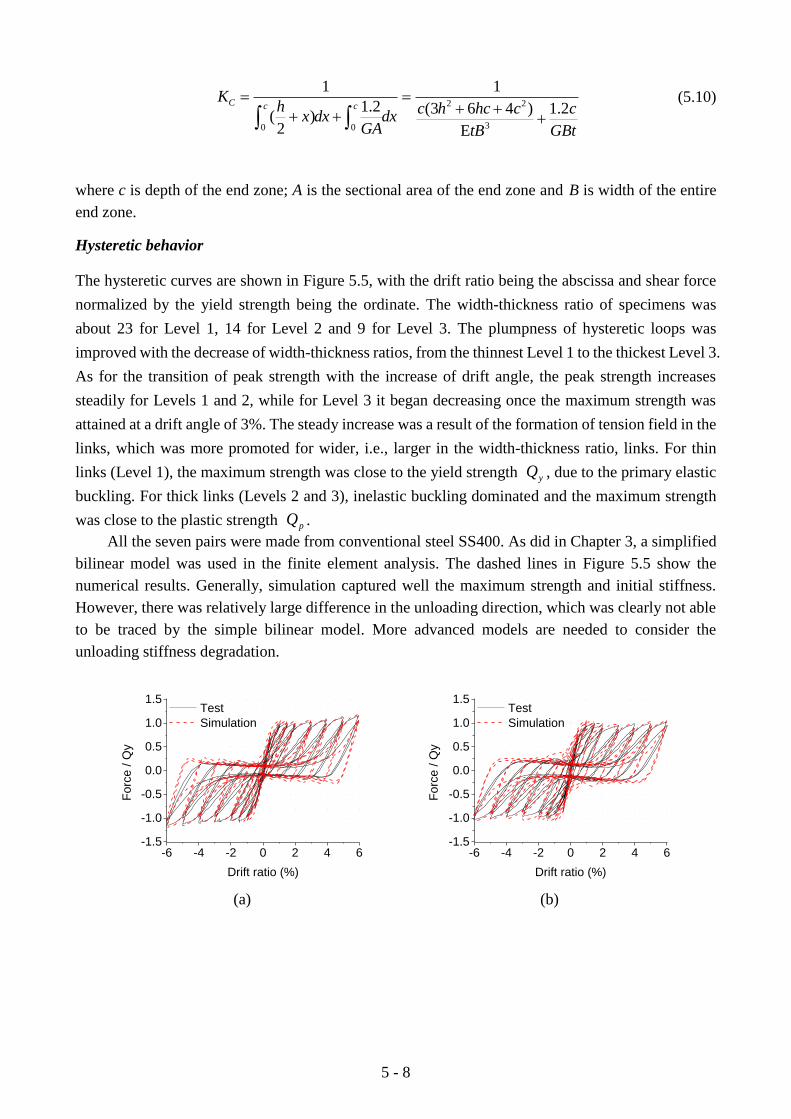
5 - 8
0
2
30
2
1 1
(31.2 6 4 ) 1.2
E( )2
c cCc h hc
Kh
x dc c
tB Gdx
Bx
GA t
(5.10)
where c is depth of the end zone; A is the sectional area of the end zone and B is width of the entire
end zone.
Hysteretic behavior
The hysteretic curves are shown in Figure 5.5, with the drift ratio being the abscissa and shear force
normalized by the yield strength being the ordinate. The width-thickness ratio of specimens was
about 23 for Level 1, 14 for Level 2 and 9 for Level 3. The plumpness of hysteretic loops was
improved with the decrease of width-thickness ratios, from the thinnest Level 1 to the thickest Level 3.
As for the transition of peak strength with the increase of drift angle, the peak strength increases
steadily for Levels 1 and 2, while for Level 3 it began decreasing once the maximum strength was
attained at a drift angle of 3%. The steady increase was a result of the formation of tension field in the
links, which was more promoted for wider, i.e., larger in the width-thickness ratio, links. For thin
links (Level 1), the maximum strength was close to the yield strength yQ , due to the primary elastic
buckling. For thick links (Levels 2 and 3), inelastic buckling dominated and the maximum strength
was close to the plastic strength pQ .
All the seven pairs were made from conventional steel SS400. As did in Chapter 3, a simplified
bilinear model was used in the finite element analysis. The dashed lines in Figure 5.5 show the
numerical results. Generally, simulation captured well the maximum strength and initial stiffness.
However, there was relatively large difference in the unloading direction, which was clearly not able
to be traced by the simple bilinear model. More advanced models are needed to consider the
unloading stiffness degradation.
-6 -4 -2 0 2 4 6-1.5
-1.0
-0.5
0.0
0.5
1.0
1.5
Forc
e / Q
y
Drift ratio (%)
Test
Simulation
-6 -4 -2 0 2 4 6-1.5
-1.0
-0.5
0.0
0.5
1.0
1.5
Forc
e / Q
y
Drift ratio (%)
Test
Simulation
(a) (b)

5 - 9
-6 -4 -2 0 2 4 6-1.5
-1.0
-0.5
0.0
0.5
1.0
1.5
Fo
rce
/ Q
y
Drift ratio (%)
Test
Simulation
-6 -4 -2 0 2 4 6-1.5
-1.0
-0.5
0.0
0.5
1.0
1.5
Fo
rce
/ Q
y
Drift ratio (%)
Test
Simulation
(c) (d)
-6 -4 -2 0 2 4 6-1.5
-1.0
-0.5
0.0
0.5
1.0
1.5
Forc
e / Q
y
Drift ratio (%)
Test
Simulation
-6 -4 -2 0 2 4 6-1.5
-1.0
-0.5
0.0
0.5
1.0
1.5
Forc
e / Q
y
Drift ratio (%)
Test
Simulation
(e) (f)
-6 -4 -2 0 2 4 6-1.5
-1.0
-0.5
0.0
0.5
1.0
1.5
Fo
rce
/ Q
y
Drift ratio (%)
Test
Simulation
(g)
Figure 5.5 Hysteretic curves: (a)-(g) hysteretic curves of Pairs 1, 2, 3, 5, 6, 7 and 9, respectively.
The equivalent damping ratios estimated using the standard procedure [6] for Pairs 1 (Level 1),
5 (Level 2) and 9 (Level 3) are plotted for each drift ratio in Figure 5.6, in which one loop in the
second cycle was used for the calculation. As elastic local buckling occurred in Level 1 (Pair 1), the
hysteresis naturally involved significant pinching; hence the damping ratio remained small. In Level
2 (Pair 5), serious torsional deformation after local buckling did not occur until 2%; hence the loops
below the drift ratio were rather plump, with the damping ratio in a range of over 0.1. In Pair 9 (Level
3), stable hysteresis was obtained up to a drift ratio of 3%. Pinching and corresponding reduction in
the damping ratio occurred for cycles with drift ratios of 3.5% or greater.

5 - 10
0 1 2 3 4 5 60.0
0.1
0.2
0.3
Equiv
ale
nt dam
pin
g r
atio h
eq
Drift ratio (%)
Pair 1
Pair 5
Pair 9
Figure 5.6 Equivalent damping ratios.
From both Figures 5.5 and 5.6, it can be found that thick double-tapered links performed better
in energy dissipation. Thick links buckle later thus behave more in plane under shear deformation,
which results in dissipating more energy. Therefore, if only double-tapered links are used for both
condition assessment and energy dissipation, more thick links (small in width-thickness ratio) are
preferred. Supposing a slit wall with limited thin links but a large number of thick links, reasonable
energy dissipation can be expected.
Figure 5.7 shows the deformed shape at the completion of loading. No fracture was observed for
all specimens throughout the entire loading, which was ascribed to the inherent characteristic of
double-tapered links. The tapered shape for the links allows the plasticity to occur at quarter-height
sections, away from both the middle and end sections where curvature changes making them more
vulnerable to fracture. In contrary, the occurrence of fracture in rectangular links is more likely
because that both high stress and curvature changes concentrate on the link ends.
(a) (b)
(c) (d)

5 - 11
(e) (f)
(g)
Figure 5.7 Deformation in test: (a)-(g) Pairs 1, 2, 3, 5, 6, 7 and 9, respectively.
5.3 Enhancement of energy dissipation
In view of the significant pinching observed in hysteretic curves of slit walls with double-tapered
links, it is hard to claim they performed well in dissipating energy. How to have good hysteretic loops
is the focus in this section. Strength, stiffness and energy dissipation property of rectangular links
were summarized first, followed by the comparison with double-tapered links. Last, low yield point
steel was introduced and tested to demonstrate its superiority in obtaining plump hysteretic loops.
5.3.1 Steel slit shear walls with rectangular links
Many studies on steel slit shear walls with rectangular links (divided by vertical slits) have been
reported [7-9]. If early out-of-plane buckling in links occurs, pinching in hysteretic curve reduces the
energy dissipation capacity. When the links are carefully designed to avoid early buckling, reasonable
hysteretic behavior can be obtained.
Plastic strength
Based on the assumption of full plasticity developed at ends of an individual rectangular link, the
plastic strength PQ is
22
2
PP y
M tQ
l
b
l (5.11)

5 - 12
where 2
4P y
bM
t is the plastic moment of the cross-section; b is link width; l is link length; t is
plate thickness; and y is yield stress.
The total plastic strength of a slit wall with multiple links is estimated by the summation of all
individual links.
2 2
1 2 2
n
y yiwall
tb ntb
lQ
l
(5.12)
where l is link length; b is link width; t is plate thickness; y is yield strength; and n is the number of
links in one row.
Elastic stiffness
A rectangular link provides lateral stiffness through both the shear and flexural deformations, as
estimated in Equation (5.13) [7].
3
3 1
1
.2K
lk
Etb bt
l
G
(5.13)
where l is link length; b is link width; t is plate thickness; E is Young’s modulus; G is shear modulus;
1.2 is the shear deformation shape factor for rectangular section; and 3(1 / )k b l is a multiplier
that reflects the flexibility at the ends of the flexural links, with 1k denoting a perfectly rigid
boundary and otherwise 1k .
For a slit wall with multiple links, the stiffness can be calculated in a similar way by summing
up all individual links. With the contribution of the unslitted section through shear deformations
considered, the total stiffness of the slit wall can be calculated as
3
31.2( ) 1 2
1
.wallK
kGBt
H ml l m l m
nb t nEt Gb
(5.14)
where m is the number of rows; n is the number of links in one row; B is the total width of the unslitted
section; and H is the height of wall.
Energy dissipation estimation
The energy dissipation of rectangular links through plastic flexural behavior under lateral loading is
estimated by the rotation of plastic hinges formed at link ends [10].
2
( )2 3
y y
p p p
b t lE M
l Eb
(5.15)

5 - 13
where pE is the plastic energy dissipated;
pM is the plastic bending moment of link; p is the
plastic rotation of a plastic hinge; E is Young’s modulus; y is yield stress; is the total lateral
displacement; and b, l, t are link width, length and thickness, respectively.
Supposing slits are evenly distributed and the wall and links will not buckle out of plane, the
energy dissipation of the wall is calculated by summing up all links.
2
( ) ( ) ( )2 3 2 3 2 3
y y y y y y
p wall
b t mn l Wt m l Wt m ln bE
l Eb l E E
(5.16)
where n is number of links in one row; m is the number of rows; is the lateral displacement of the
wall; /l b is the aspect ratio of the link; and W = nb is wall width.
Equation (5.16) indicates that energy dissipation is largely dependent on the aspect ratio of the
link, given the same experienced lateral drift, the width of the wall and plate thickness. Therefore, the
links should be designed as short for dissipating more energy.
5.3.2 Rectangular link versus double-tapered link
As shown in Section 3.3.6 in Chapter 3, under shear deformation, high stress concentrates at the link
ends for the rectangular link, while at the quarter height sections for the double-tapered link.
Curvature changes at the ends of rectangular links make it more vulnerable to fracture. For
double-tapered links, large plasticity at the middle of a straight edge makes fracture less likely to
occur.
The plastic strength ratio of double-tapered links to rectangular links is
2 2 2 2
2 2/
4/
4 PD
y y
PR
Q a t t a
l h
b b
Q h l (5.17)
Given the same width of end section and link length, 3b a and l h , Equation (5.17)
becomes
8
9PD
PR
Q
Q (5.18)
Equation (5.18) indicates that the maximum shear force bearing capacity of rectangular links is
larger than that of double-tapered links, given the same width of end section. However, full plasticity
assumption does not consider the influence of fracture at large plastic deformation. Once fracture
occurs, shear strength decreases rapidly. As previously discussed, double-tapered links have the
advantage in eliminating fracture compared with rectangular links. Therefore, it is hard to conclude
that rectangular links work better in dissipating energy only on the higher plastic strength, unless
elimination of fracture is guaranteed.
Equation (5.16) is based on the assumption of full plasticity formation, which is also applicable

5 - 14
to double-tapered links. Therefore, Equation (5.16) is also representative in estimating energy
dissipation for double-tapered links conceptually. For dissipating more energy, double-tapered links
should also be designed to be short.
5.3.3 Low yield point steel
For slit wall dampers with rectangular links, there are two concerns: 1) early out-of-plane buckling of
links, and 2) occurrence of fracture at link ends. The early out-of-plane buckling can be avoided
through careful design of links, for instance, having narrow links, while the fracture is more related to
material property. Because of the limited strain hardening associated with conventional steel, fracture
occurs immediately after material yields. The abrupt strength decrease after fracture occurs may yield
brittle failure. To eliminate or reduce fracture in rectangular links so as to have better energy
dissipation, utilization of a steel with more hardening, low yield point steel (LYP) for instance, is
considered as a possible solution. In addition, when equal lateral loading bearing capacity is expected,
the thickness of slit walls made from LYP steel must be increased by the yield-stress ratio compared
to those made from conventional steel. The increased thickness delays the buckling in both the wall
and links, and thus there is little need for bucking constraint.
Material property
Figure 5.8 shows the stress-strain relationships of SS400 and LYP100, one type of low yield point
steel with a nominal yield stress of 100 MPa. As compared to SS400, LYP100 has low initial yield
stress and large strain hardening. Low yield stress makes the plastic stage enter more rapidly than its
surrounding frame; larger strain hardening enables plasticity to expand over large regions around the
link ends, which reduces the concentrated strain values and enhances energy dissipation.
0.00 0.05 0.10 0.15 0.200
200
400
600
Str
ess (
MP
a)
Strain
SS400
LYP100
Figure 5.8 Stress-strain relationship.
Steel plates made from low yield point steel exhibited sound energy dissipation [11-14]. While,
there is no work on slit shear walls made from low yield point steel. By cutting slits into a steel plate,
stable hysteretic behavior is expected through the flexural deformation of individual links.
Meanwhile, there is less strength demand on the main frame structure by only connecting the slit wall
to beams, compared with the wall without slits connected to both beams and columns.
Simulation of LYP100
To simulate the large strain hardening of LYP100, combined kinematic and isotropic hardening
model in ABAQUS was implemented [4]. The combined hardening model has two features to
simulate plastic hardening in cyclic loading conditions: the center of the yield surface moves in stress

5 - 15
space (kinematic hardening) through the back stress , and the size of the yield surface 0 evolves
with inelastic deformation (isotropic hardening). These features allow modeling of inelastic
deformation in metals subjected to cycles of load.
The kinematic hardening component is defined to be an additive combination of a purely
kinematic term (the linear Ziegler hardening law) and a relaxation term (the recall term), which
introduces the nonlinearity. When temperature and field variable dependencies are omitted, the
hardening law is given in Equation (5.19).
. ..
0
1( ) p pc
(5.19)
where 0 is the equivalent stress defining the size of the yield surface at zero plastic strain; .p is
the equivalent plastic strain rate; and c and are material parameters that must be calibrated from
cyclic test data. c is the kinematic hardening modulus and determines the rate at which the
kinematic hardening modulus decreases with increasing plastic deformation. When c and are
zero, the model reduces to an isotropic hardening model. When is zero, the linear Ziegler
hardening law is recovered.
The isotropic hardening behavior of the model defines the evolution of the yield surface size, 0 , as a function of the equivalent plastic strain p . This evolution can be introduced by specifying 0 as a function of p by using the simple exponential law in Equation (5.20).
0
0(1 )
pbQ e
(5.20)
where 0
is the yield stress at zero plastic strain and Q and b are material parameters. Q is the
maximum change in the size of the yield surface, and b defines the rate at which the size of the yield
surface changes as plastic straining develops. When the equivalent stress defining the size of the yield
surface remains constant ( 0 =0
), the model reduces to a nonlinear kinematic hardening model.
These parameters needed in simulation will be calibrated with respect to the test data and given
in a later section.
5.3.4 Experimental validation
Test specimens
Figure 5.9 shows the three specimens tested. Specimens 1 and 2 were made from conventional steel
SS400 with a thickness of 4.3 mm while Specimen 3 was made from LYP100 with a thickness of 9
mm. Specimen 1 had five identical double-tapered links while Specimen 2 and Specimen 3 were with
identical rectangular links. The two rectangular strips at the edge with the width of 20 mm in
Specimen 1 were designed to make up the same width as that of Specimen 2. In each specimen, the
top and bottom portion with circular openings were for the connection with the loading setup. The
test setup was same as in the previous small-scale tests, as described in detail in Section 3.4.3 in
Chapter 3. And the loading protocol was also the incremental two-cycle loading, with a constant
increment of 0.5% drift ratio and the same drift ratio repeated twice.

5 - 16
30
3
60
3
0
540
20 30
480
30
3
60
3
0
540
480
50
(a) (b)
480
90
420
30 360 3
0
(c)
Figure 5.9 Details of specimens (unit: mm): (a)-(c) Specimens 1-3.
Test results
Strength and stiffness is summarized in Table 5.3. For Specimen 1 with double-tapered links, the
early onset of buckling gave the maximum strength in test (Qmaxt) 9% smaller than the plastic strength
(Qp); for Specimen 2 with rectangular links, the maximum strength was 10% larger than the plastic
strength, which was induced by the formation of tension field at large drifts. Specimen 3 with
rectangular links was made from low yield point steel. The yield stress from tensile coupon test was
60 MPa. Considering its large strain hardening, it is not reasonable to use this low yield stress to
present its strength capacity in calculation. Therefore, a nominal yield stress of 100 MPa was used in
the calculation of plastic strength. The maximum strength in test was about twice the calculated
plastic strength. The prediction of stiffness (K) for specimens with rectangular links was very close
with the stiffness obtained in test (tK ). For Specimen 1 with double-tapered links, stiffness in test was
about 20% smaller than prediction.
Table 5.3 Strength and stiffness
Specimen Qp (kN) Qmaxt (kN) Qmaxt / Qp K (kN/mm) tK (kN/mm) /tK K
1 81.1 73.6 0.91 27.4 22.2 0.81
2 55.8 61.6 1.10 15.3 15.7 1.03
3 40.5 83.1 2.05 52.9 51.8 0.98
The width-thickness ratios of three specimens were 2a/t=14, b/t=11.6 and b/t=10 respectively.

5 - 17
In the plate buckling theory, thin plate buckles earlier than thick plate. Therefore, Specimen 1 buckled earliest, which was consistent with the observation in test. The hysteretic loops are shown in Figure 5.10. Specimen 1 exhibited quite severe pinching compared with the other two specimens. With the same total width, Specimen 2 presented better energy dissipation capacity than Specimen 1 from the perspective of plumper hysteretic loops. Among the three specimens, Specimen 3 showed the plumpest hysteretic loops and accordingly best energy dissipation capacity. The large strain hardening of LYP100 enabled stress re-distribution and accordingly sustained large yield region through plasticity expansion, resulting in gradual strength increase and nearly no stiffness degradation even after yielding.
-6 -4 -2 0 2 4 6-1.5
-1.0
-0.5
0.0
0.5
1.0
1.5
Fo
rce
/ Qp
Drift ratio (%)
TEST Simulation
-6 -4 -2 0 2 4 6-1.5
-1.0
-0.5
0.0
0.5
1.0
1.5
Fo
rce
/ Qp
Drift ratio (%)
Test Simulation
(a) (b)
-6 -4 -2 0 2 4 6-3
-2
-1
0
1
2
3
For
ce /
Qp
Drift ratio (%)
Test Simulation
-6 -4 -2 0 2 4 6-100
-50
0
50
100
For
ce (
kN)
Drift ratio (%)
Specimen 1 Specimen 2 Specimen 3
(c) (d)
Figure 5.10 Hysteretic curves: (a)-(c) Specimens 1-3; (d) comparison.
The dashed lines in Figure 5.10 show the numerical results. For Specimen 1 and Specimen 2
made from conventional steel, a simplified bilinear model was used, which was same as that used in
Chapter 3. Simulation captured the maximum strength and pinching quite well. For Specimen 3 made
from LYP100, the combined hardening model previously discussed was used. The material input
parameters were the initial stress 0 of 60 MPa at zero plastic strain and calibrated combined
hardening plasticity modelling parameters: kinematic hardening parameters c of 3800, of 15,
Q of 100 and b of 5. The calibrated combined hardening plasticity modeling parameters were
obtained through a phenomenological curve fitting process, in which these parameters were adjusted
until a reasonable match over most of the loading history was obtained. Simulation predicted the
maximum strength and hysteretic behavior quite well. Note that these parameter values for low yield
point steel cannot be used in other situations unless the level of plasticity is in the similar range.

5 - 18
Figure 5.11 shows the deformation of specimens at a drift ratio of 4.5%. In Specimen 2 made
from conventional steel, plastic deformation concentrated at the link ends and finally fracture
initiated, which caused the strength degradation and serious pinching in the hysteretic curve. No
fracture was observed in Specimen 3 till the completion of loading, resulted from the large strain
hardening of LYP100. In view of eliminating fracture to avoid the abrupt drop of bearing capacity,
the use of low yield point steel was confirmed as a reliable solution.
Fracture
at link end
(a) (b)
Figure 5.11 Deformation in test: (a) Specimen 2; (b) Specimen 3.
The equivalent damping ratios are plotted for each drift ratio in Figure 5.12. The equivalent
damping ratio of Specimen 2 was larger than that of Specimen 1 and Specimen 3 was the best.
Starting from 1%, the equivalent damping ratio of Specimen 3 was larger than 0.4 and maintained
nearly no decrease until the completion of loading.
0 1 2 3 4 50.0
0.1
0.2
0.3
0.4
0.5
Eq
uiv
ale
nt
da
mp
ing
ra
tio
heq
Drift ratio (%)
Specimen 1
Specimen 2
Specimen 3
Figure 5.12 Equivalent damping ratios.
This series of tests demonstrated that plump hysteric loops can be obtained by adopting low
yield point steel. Together with the use of double-tapered links for condition assessment, the addition
of rectangular links made from low yield point steel makes it possible to have excellent energy
dissipation as well.
5.4 A double-layer dual-function system
Chapters 3 and 4 demonstrated the feasibility of implementing structural condition assessment
through visually inspecting torsional deformation of double-tapered links. In the last section, the
superiority of low yield point steel in dissipating energy was presented. This section integrates these
two parts, to realize functions of both condition assessment and good energy dissipation
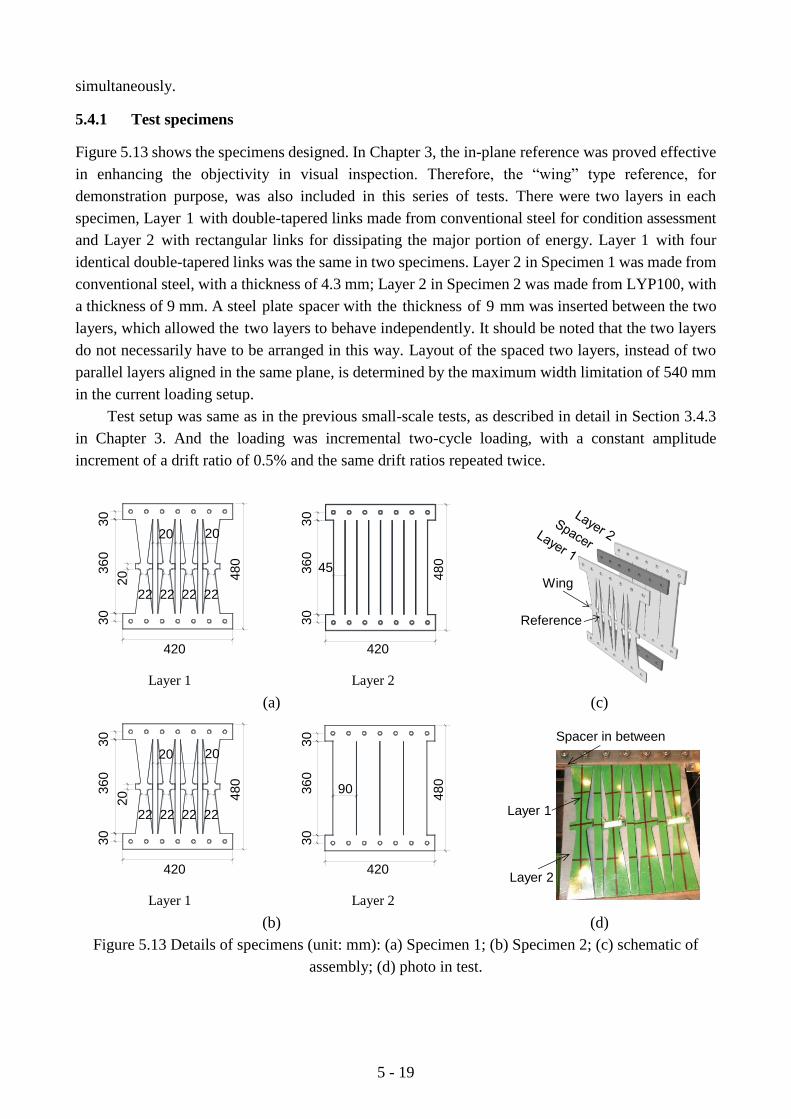
5 - 19
simultaneously.
5.4.1 Test specimens
Figure 5.13 shows the specimens designed. In Chapter 3, the in-plane reference was proved effective
in enhancing the objectivity in visual inspection. Therefore, the “wing” type reference, for
demonstration purpose, was also included in this series of tests. There were two layers in each
specimen, Layer 1 with double-tapered links made from conventional steel for condition assessment
and Layer 2 with rectangular links for dissipating the major portion of energy. Layer 1 with four
identical double-tapered links was the same in two specimens. Layer 2 in Specimen 1 was made from
conventional steel, with a thickness of 4.3 mm; Layer 2 in Specimen 2 was made from LYP100, with
a thickness of 9 mm. A steel plate spacer with the thickness of 9 mm was inserted between the two
layers, which allowed the two layers to behave independently. It should be noted that the two layers
do not necessarily have to be arranged in this way. Layout of the spaced two layers, instead of two
parallel layers aligned in the same plane, is determined by the maximum width limitation of 540 mm
in the current loading setup.
Test setup was same as in the previous small-scale tests, as described in detail in Section 3.4.3
in Chapter 3. And the loading was incremental two-cycle loading, with a constant amplitude
increment of a drift ratio of 0.5% and the same drift ratios repeated twice.
20
22 22 22 22
480
20 20
420
30 360 3
0
Layer 1
48045
420
30
3
60
3
0
Layer 2
Wing
Reference
(a) (c)
20
22 22 22 22
480
20 20
420
30 360 3
0
Layer 1
480
90
420
30 360 3
0
Layer 2
Spacer in between
Layer 2
Layer 1
(b) (d)
Figure 5.13 Details of specimens (unit: mm): (a) Specimen 1; (b) Specimen 2; (c) schematic of
assembly; (d) photo in test.

5 - 20
5.4.2 Test results
Performance of condition assessment
Figure 5.14 shows the progress of torsional deformation. With the same double-tapered links in both
specimens, nearly the same torsional deformation was obtained, which again proved the repeatability
of torsional deformation. Notable torsional deformation occurred at a drift ratio of 3.5% based on the
preset “off-one-thickness” criterion for notable torsional deformation. As shown in Figure 5.13(d),
with the presence of “wing” type reference, the recognition of notable torsional deformation was
easier and more objective.
0 1 2 3 4 5
0
10
20
30R
(degre
es)
Drift ratio (%)
Specimen 1
Specimen 2
Figure 5.14 Progress of torsional deformation.
Hysteretic behavior
In both specimens, two layers were assembled in parallel. The total strength and stiffness were the
summation of two layers, as shown in Table 5.4. For Specimen 1 with both layers made from
conventional steel SS400, prediction of both strength (Qp) and stiffness ( K ) matched with test results
(Qmaxt and tK ). For Specimen 2 with Layer 1 made from conventional steel SS400 and Layer 2 made
from LYP100, total stiffness in test was about 90% of the prediction. The serious torsional
deformation of double-tapered links in Layer 1 gave the strength smaller than its plastic strength,
which produced that the resultant maximum strength did not reach twice the plastic strength as the
single layer specimen made from LYP100 (Table 3.3).
Table 5.4 Strength and stiffness
Specimen Qp (kN) Qmaxt (kN) Qmaxt / Qp K (kN/mm) tK (kN/mm) /tK K
1 70.8 71.8 1.01 18.7 18.2 0.97
2 75.1 119.8 1.60 62.3 55.7 0.89
The hysteretic curves are shown in Figure 5.15. The hysteretic curve of Specimen 2 was plumper
than that of Specimen 1, ascribed to the large strain hardening of LYP100. Both specimens presented
small strength decrease, compared with the specimen with double-tapered links (Figure 5.10(a)).
Pinching in hysteretic curves of both specimens occurred after 3.5% drift ratio, caused by the large
torsional deformation of double-tapered links. Specimen 2 exhibited much lighter pinching than
Specimen 1.

5 - 21
-5 -4 -3 -2 -1 0 1 2 3 4 5-1.0
-0.5
0.0
0.5
1.0Specimen 1
Forc
e / Q
p
Drift ratio (%)
-5 -4 -3 -2 -1 0 1 2 3 4 5-2
-1
0
1
2
Forc
e / Q
p
Drift ratio (%)
Specimen 2
(a) (b)
Figure 5.15 Hysteretic curves: (a) Specimen 1; (b) Specimen 2.
Figure 5.16 shows the equivalent damping ratios. Within the range of 3% to 4% drift ratio, the
equivalent damping ratio of Specimen 1 was about 0.3, while 0.4 for Specimen 2. The large value of
equivalent damping ratio of Specimen 2 starting from small drift made it a fairly good damper.
0 1 2 3 4 50.0
0.1
0.2
0.3
0.4
0.5
Eq
uiv
ale
nt
da
mp
ing
ra
tio
heq
Drift ratio (%)
Specimen 1
Specimen 2
Figure 5.16 Equivalent damping ratios.
Specimen 2 demonstrated the feasibility of achieving dual functions of condition assessment
and sound energy dissipation simultaneously, by combing double-tapered links made from
conventional steel and rectangular links made from low yield point steel.
5.5 Design of end plate connection
To make the boundary connection between double-tapered links and beams simple while
successfully transferring the maximum level of story drift into double-tapered links, the
configuration of a monolithic plate including double-tapered links in the middle and two end plates
was proposed. If the end plate could provide a reliable boundary for double-tapered links, the
manufacturing of the shear wall would be much easy by only cutting a steel plate. In this section,
configuration of end plate, for instance the ratio between width and depth, was first examined based
on the calculation of deflection under shear force, which was verified experimentally through tests.
5.5.1 Deflection of end plate
Figure 5.17 shows the schematic of a steel slit shear wall with double-tapered links in the middle.
Under shear deformation, the end plate beyond double-tapered links is discretized as a cantilever
rectangular plate subjected to a uniformly distributed shear force on its free end, as shown in Figure
5.17(b).

5 - 22
End plate
End plate
Double-tapered links
End plate
Shear force
a
b
(a) (b)
Figure 5.17 Schematic of end plate: (a) a slit wall using end plates for boundary connection;
(b) end plate under shear force.
Supposing the end plate remains elastic and perfectly in plane, the deflection of the free end is
preferred to be very small so that the maximum level of lateral drift can be transferred into
double-tapered links. Because of the plate geometry, where the width and depth are with the same
order of magnitude while the thickness is much smaller, it is not possible to calculate the deflection by
conventional methods used for the beam theory. In the work by Wu Z.S. and Huang T. [15], an
analytical solution for the deflection of a late subjected to in-plane end shear was presented. With
uniform shear stress along the edge, the elastic defection is
2
42
( ) 0.1(2 )1 384
[ ( )]
1 0.12( )
b
abaG E
b
(5.21)
where is the uniform shear stress along the free end; a is width of end plate; b is depth of end plate;
E is Young’s modulus; G is shear modulus and v is Poisson ratio.
Under unity shear stress, given the same plate depth, deflection decreases with the increase of
width. The wide plate deflects less than the narrow plate. Figure 5.18 shows the deflection curve
calculated according to Equation (5.21). The width-depth ratio a/b of 1.5 gives the inflection point.
When the width-depth ratio is larger than 1.5, the decrease of deflection slows down. There is little
improvement in decreasing the deflection by further widening the end plate. To have the maximum
level of shear deformation transferred from story drift into double-tapered links, the deflection is
required to be as small as possible. In this sense, wide plates are preferred. While considering
practical application, too wide end plates are not preferred for taking up much space. The threshold
value of 1.5 is suggested as the minimum width-depth ratio to have a wide end plate so that its
deflection would be small, and accordingly the net shear deformation transferred into double-tapered
links can be a majority of the wall’s drift.

5 - 23
0 2 4 6 8 100
20
40
60
80
100
Deflection (
*b/1
0^6
)
Width-depth ratio (a/b)
1.5
Figure 5.18 Deflection for different width-depth ratios.
5.5.2 Test preparation
Test specimens
To examine the performance of end plates with the proposed width-depth ratio of 1.5, four
specimens with end plates were designed using a 4.3 mm thick steel plate. Four specimens shared
the same double-tapered links in the middle of the plate. Figure 5.19 shows the four specimens
designed. Specimens 1 and 2 had narrow end plates with a width-depth ratio of 0.8, and Specimens
3 and 4 had wide end plates with a width-depth ratio of 1.5. Specimen 2 differed from Specimen 1
in the addition of out-of-plane constrainers, which sandwiched the end plate from two sides.
Circular openings with a diameter of 10 mm were made on the end plates to bolt the two channels
together using high strength bolts of M8. Similarly, Specimen 4 had out-of-plane constrainers at end
plates while Specimen 3 did not have. With the out-of-plane constrainers on two sides, the end
plates would be rigid enough against torsional deformation and behave in plane. Narrow rectangular
strips with the width of 20 mm, which behaved mainly in plane due to the small width-thickness
ratio, made up the width of middle part equal the width of end plate.
180
12
0 1
80
1
20
42
0
30
3
60
3
0
20
20 54
180
12
0 1
80
1
20
420
30
3
60
3
0
20
75
7
40
5
75
180
(a) (b) (c)

5 - 24
240
12
0 1
80
1
20
420
30
3
60
3
0
20
20 54
240
12
0 1
80
1
20
420
30
3
60
3
0
20
75
7
40
5
75
260
(d) (e) (f)
Figure 5.19 Details of specimens (unit: mm): (a) Specimen 1; (b) Specimen 2; (c) constrainer in
Specimen 2; (d) Specimen 3; (e) Specimen 4; (f) constrainer in Specimen 4.
Test setup, loading protocol and instrumentation
Test setup was same as in the previous small-scale tests, as described in detail in Section 3.4.3 in
Chapter 3. The four specimens were loaded simultaneously, as shown in Figure 5.20. Neglecting the
influence of out-of-plane constraint on end plates to the shear strength, the specimens on two sides
were considered to have the same strength and thus experience the same amount of shear
deformation.
The loading history was the same incremental two-cycle loading, with amplitude increment of
a drift ratio of 0.5%. The net shear deformation into double-tapered links was measured by
attaching two wires at the two ends of the link, with the other ends of the wires connected to two
displacement transducers.
Sp. 1Sp. 2
Sp. 3 Sp. 4
Loading
Base Roller
Loading
frame
Figure 5.20 Specimen layout.

5 - 25
5.5.3 Test results
Shear deformation into double-tapered links
Figure 5.21 shows the measured net shear deformation into double-tapered links, with the ordinate
being the ratio of net shear deformation into double-tapered links to the wall’s drift. Among the four
specimens, the net shear deformation into double-tapered links was the smallest for Specimen 1,
while the other three basically the same. For Specimen 1, 70% of the total shear deformation went
into double-tapered links at the wall’s drift ratio of 1%, 60% at the wall’s drift ratio of 2%. For the
other three, over 85% of the total shear deformation was successfully transferred into double-tapered
links from the wall’s drift ratio of 1%. It is clear that smaller amount of shear deformation was
transferred into double-tapered links for Specimen 1 having end plates with a width-depth ratio of 0.8.
With the rigid out-of-plane constrainers, the net shear deformation into double-tapered links in
Specimen 2 was larger than that in Specimen 1. For Specimens 3 and 4 having end plates with a
width-depth ratio of 1.5, there was little difference with or without out-of-plane constrainers.
1 2 30.0
0.2
0.4
0.6
0.8
1.0
Into
lin
ks
Drift ratio (%)
Sp. 1
Sp. 2
Sp. 3
Sp. 4
Figure 5.21 Net shear deformation into double-tapered links.
Out-of-plane deformation of end plate
Another benefit of having a relatively wide end plate is that it will maintain more in plane under
in-plane shear loading. As shear deformation increased, out-of-plane formation was observed at the
end plats. Figure 5.22 shows the deformation observed in test. Till a drift ratio of 3%, no notable
out-of-plane deformation was observed at end plates, except for Specimen 1. At large shear
deformation, the edge in compression was susceptible to buckle out of plane, which would twist the
end plate. Simply considering the end plate as a beam with a rectangular section, the torsion
constant J is [16]:
43
4
1( 0.21 (1 ))3 12
t tJ at
a a (5.22)
where a is width of end plate; and t is the plate thickness.
Equation (5.22) indicates that resistance against torsion of the end plate is approximately
proportional to the width, given the same length and thickness. Therefore, the smaller resistance
against torsion of the narrow end plate in Specimen 1 made it deformed out of plane more seriously

5 - 26
than the other three specimens.
(a)
(b)
(c)

5 - 27
(d)
(e)
Figure 5.22 Deformation in test: (a) before loading; (b) at the maximum amplitude of 2%; (c) residual
after 2%; (d) at the maximum amplitude of 3%; (e) residual after 3%.
5.6 Summary
This chapter focused on four aspects: basic mechanical properties of double-tapered links including
strength, stiffness and hysteretic behaviour, enhancement of energy dissipation, the feasibility of
having dual functions in a single damper and design of the end plate connection for double-tapered
links. The major findings are as follows:
(1) The design strength and elastic stiffness were estimated for slit walls with double-tapered
links, which agreed well with test results. No fracture was observed in double-tapered links
throughout the entire loading.
(2) Slit shear walls with rectangular links made from low yield point steel showed excellent
ductility and hysteretic loops. Compared with the specimen made from conventional steel, the
hysteretic curve was plumper with nearly no strength degradation. Fracture was eliminated thanks
to the large strain hardening of low yield point steel.
(3) A double-layer slit wall, one layer with double-tapered links made from conventional steel
and the other with rectangular links made from low yield point steel, performed excellently in both
condition assessment and energy dissipation. With the addition of the layer using low yield point

5 - 28
steel, the resultant hysteretic curve was plump with nearly no pinching and decrease in strength
until a large drift angle.
(4) The end plate was proposed as the connection between double-tapered links and beams,
considering its simplicity in both design and manufacturing. To minimize the deflection in end
plates so as to transfer the maximum level of shear deformation into double-tapered links, a
threshold width-depth ratio of 1.5 was suggested for having a relative wide end plate. Test results
showed that, with a width-depth ratio of 1.5, at least 85% of the shear deformation was successfully
transferred into double-tapered links and end plates behaved mainly in plane.
REFERENCES
[1] Ma X., Borchers E., Peña A., Krawinkler H., Billington S. and Deierlein G. Design and
behavior of steel shear plates with openings as energy-dissipating fuses. John A. Blume
Earthquake Engineering Center Technical Report 173, Stanford Digital Repository, 2010.
(Available from http://purl.stanford.edu/hq943jb9995)
[2] Timoshenko S.P. and Gere J.M. Theory of elastic stability (2nd edition). McGraw-Hill: New
York, 1961.
[3] Johnston B.G. Guide to stability design criteria for metal structures (6th edition). John Wiley
& Sons, Inc: New York, 2010.
[4] Abaqus Inc., ABAQUS Version 6.10 User’s Manual. http://www.abaqus.com
[5] Trahair N.S. Flexural-Torsional Buckling of Structures. CRC press: Boca Raton, 1993.
[6] Chopra., A. K. Dynamics of Structures: Theory and Applications to Earthquake Engineering
(2nd Edition). Prentice Hall: New Jersey, USA, 2000.
[7] Hitaka T. and Matsui C. Experimental study on steel shear wall with slits. Journal of Structural
Engineering 2003; 129(5): 586-595.
[8] Chan R.W. and Albermani F. Experimental study of steel slit damper for passive energy
dissipation. Engineering Structures 2008; 30(4):1058-1066.
[9] Cortes G. and Liu J. Experimental evaluation of steel slit panel frames for seismic resistance.
Journal of constructional steel research 2011; 67: 181-191.
[10] Ke K. and Chen Y.Y. Design method of steel plate shear wall with slits considering energy
dissipation. Proc., 15th World Conf. on Earthquake Engineering 2012; Lisboa, Portugal.
[11] Nakashima M., Iwai S. and Iwata M., etc. Energy dissipation behaviour of shear panels made
of low yield steel. Earthquake Engineering & Structural Dynamics 1994; 23(12): 1299-1313.
[12] Matteis G., Landolfo R. and Mazzolani F. Seismic response of MR steel frames with low-yield
steel shear panels. Engineering Structures 2003; 25(2): 155-168.
[13] Chen S. and Jhang C. Cyclic behavior of low yield point steel shear walls. Thin-Walled
Structures 2006; 44(7): 730-738.
[14] Zhang C., Zhang Z. and Shi J. Development of high deformation capacity low yield strength
steel shear panel damper. Journal of Constructional Steel Research 2012; 75: 116-130.
[15] Wu Z.S. and Huang T. An elastic analysis of a cantilever slab panel subjected to an in-plane
end shear. Fritz Laboratory Reports, 1983, Paper 2275.
[16] Richard G. Budynas and Warren C. Young. Roark's Formulas for stress and Strain (6th
edition), 1989.

6 - 1
CHAPTER 6
System validation through large-scale tests
6.1 Introduction
All the discussions in previous chapters were based on small-scale tests, which demonstrated the
feasibility of having both condition assessment and energy dissipation simultaneously by the
combined use of double-tapered links made from conventional steel and rectangular links made
from low yield point steel (LYP). However, when it comes to practical application, there are further
details to consider, such as boundary connections for double-tapered links, arrangement of both
double-tapered and rectangular links in a large size plate, potential large imperfection, and among
others.
In practical application, steel slit shear walls will be installed between beams, as illustrated in
Figure 3.2 in Chapter 3. The connection between the double-tapered links and beams needs to be
well designed such that the story drift can be successfully amplified and transferred into the
double-tapered links. As previously discussed, the double-tapered links should be neither too long
nor too short, to avoid lateral-torsional buckling and early shear damage at mid-section (Section
3.3.5 in Chapter 3). In the direction of the wall’s height, it is difficult to have short links unless a
deep boundary connection exists between the double-tapered links and beams. Considering the cost
and simplicity in both design and assembling, the deep boundary is not preferred to be heavily
stiffened. The boundary connection is desired to be without stiffening at all. The manufacture of slit
shear walls by cutting slits into plates makes it best to have an end plate connection using the same
plate as the double-tapered links. To have the end plate behave mainly in plane and transfer the
majority of story drift into the double-tapered links, its configuration such as the width-depth ratio
needs to be designed carefully. In Section 5.5 in Chapter 5, the width-depth ratio of 1.5 was
suggested, the performance of which in large-scale tests needs further investigation.
As demonstrated in the small-scale tests in Chapter 5, slit walls made from LYP100
demonstrated great energy dissipation capacity. In literature, there was much work on plate shear
walls made from LYP [1-7] and some were on large-scale tests [8-9]. However, steel plate shear
walls without slits, which were connected along all confining frame members and often with
stiffeners, were different from the work here. In this work, slit shear walls made from LYP were
used for dissipating energy through inelastic flexural deformation of rectangular links. In literature,
there is no work on slit shear walls made from LYP, not to mention large-scale tests.
Different from other structural elements, such as beams or columns, the thickness of a steel
plate is much smaller than the other two dimensions of length and width. Therefore, the dimensions
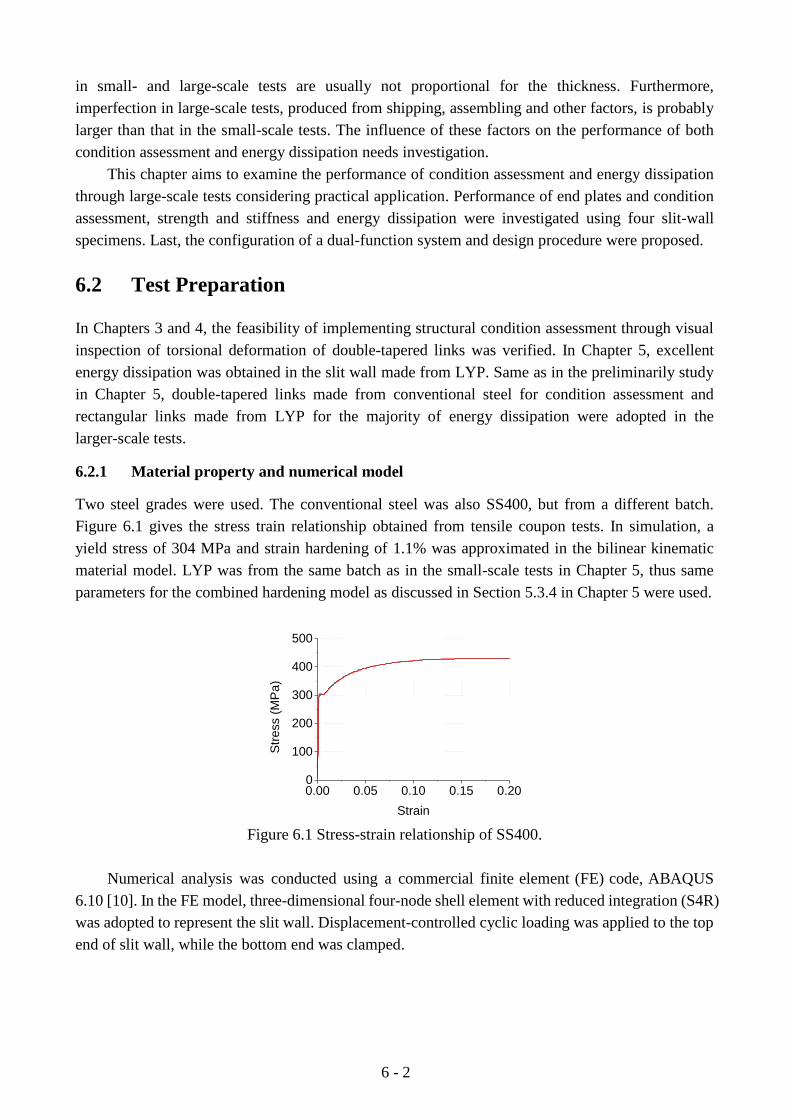
6 - 2
in small- and large-scale tests are usually not proportional for the thickness. Furthermore,
imperfection in large-scale tests, produced from shipping, assembling and other factors, is probably
larger than that in the small-scale tests. The influence of these factors on the performance of both
condition assessment and energy dissipation needs investigation.
This chapter aims to examine the performance of condition assessment and energy dissipation
through large-scale tests considering practical application. Performance of end plates and condition
assessment, strength and stiffness and energy dissipation were investigated using four slit-wall
specimens. Last, the configuration of a dual-function system and design procedure were proposed.
6.2 Test Preparation
In Chapters 3 and 4, the feasibility of implementing structural condition assessment through visual
inspection of torsional deformation of double-tapered links was verified. In Chapter 5, excellent
energy dissipation was obtained in the slit wall made from LYP. Same as in the preliminarily study
in Chapter 5, double-tapered links made from conventional steel for condition assessment and
rectangular links made from LYP for the majority of energy dissipation were adopted in the
larger-scale tests.
6.2.1 Material property and numerical model
Two steel grades were used. The conventional steel was also SS400, but from a different batch.
Figure 6.1 gives the stress train relationship obtained from tensile coupon tests. In simulation, a
yield stress of 304 MPa and strain hardening of 1.1% was approximated in the bilinear kinematic
material model. LYP was from the same batch as in the small-scale tests in Chapter 5, thus same
parameters for the combined hardening model as discussed in Section 5.3.4 in Chapter 5 were used.
0.00 0.05 0.10 0.15 0.200
100
200
300
400
500
Str
ess (
MP
a)
Strain
Figure 6.1 Stress-strain relationship of SS400.
Numerical analysis was conducted using a commercial finite element (FE) code, ABAQUS
6.10 [10]. In the FE model, three-dimensional four-node shell element with reduced integration (S4R)
was adopted to represent the slit wall. Displacement-controlled cyclic loading was applied to the top
end of slit wall, while the bottom end was clamped.
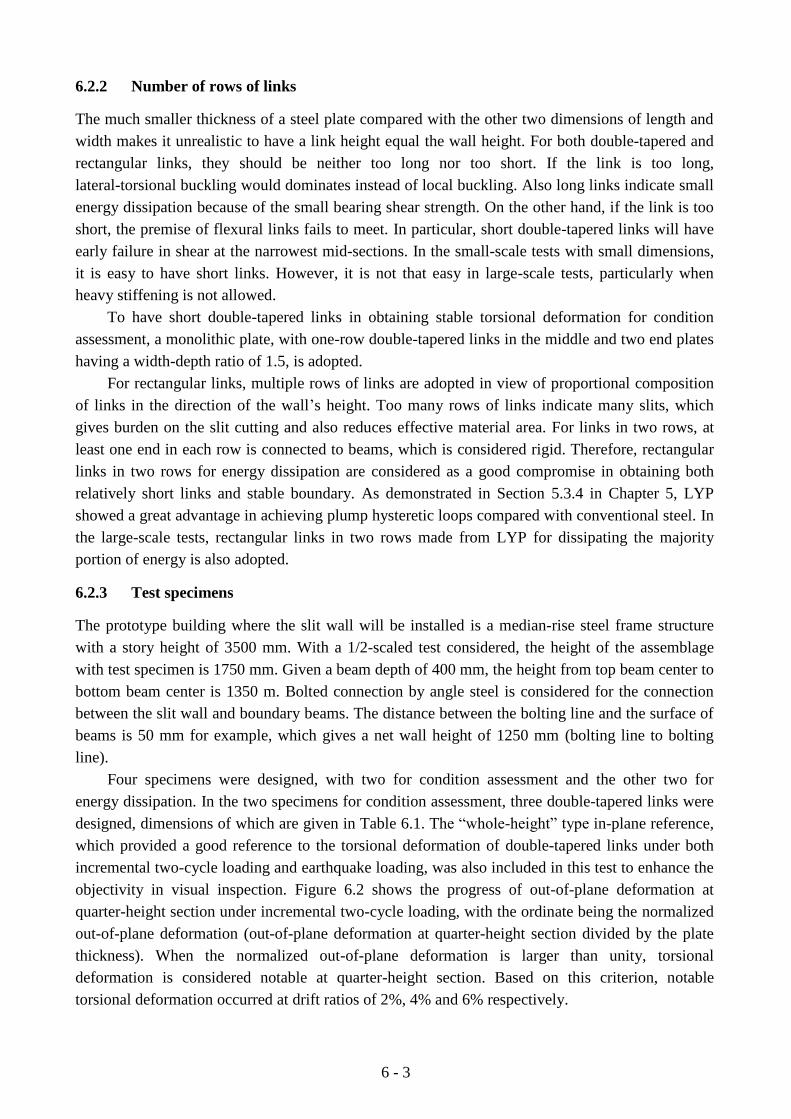
6 - 3
6.2.2 Number of rows of links
The much smaller thickness of a steel plate compared with the other two dimensions of length and
width makes it unrealistic to have a link height equal the wall height. For both double-tapered and
rectangular links, they should be neither too long nor too short. If the link is too long,
lateral-torsional buckling would dominates instead of local buckling. Also long links indicate small
energy dissipation because of the small bearing shear strength. On the other hand, if the link is too
short, the premise of flexural links fails to meet. In particular, short double-tapered links will have
early failure in shear at the narrowest mid-sections. In the small-scale tests with small dimensions,
it is easy to have short links. However, it is not that easy in large-scale tests, particularly when
heavy stiffening is not allowed.
To have short double-tapered links in obtaining stable torsional deformation for condition
assessment, a monolithic plate, with one-row double-tapered links in the middle and two end plates
having a width-depth ratio of 1.5, is adopted.
For rectangular links, multiple rows of links are adopted in view of proportional composition
of links in the direction of the wall’s height. Too many rows of links indicate many slits, which
gives burden on the slit cutting and also reduces effective material area. For links in two rows, at
least one end in each row is connected to beams, which is considered rigid. Therefore, rectangular
links in two rows for energy dissipation are considered as a good compromise in obtaining both
relatively short links and stable boundary. As demonstrated in Section 5.3.4 in Chapter 5, LYP
showed a great advantage in achieving plump hysteretic loops compared with conventional steel. In
the large-scale tests, rectangular links in two rows made from LYP for dissipating the majority
portion of energy is also adopted.
6.2.3 Test specimens
The prototype building where the slit wall will be installed is a median-rise steel frame structure
with a story height of 3500 mm. With a 1/2-scaled test considered, the height of the assemblage
with test specimen is 1750 mm. Given a beam depth of 400 mm, the height from top beam center to
bottom beam center is 1350 m. Bolted connection by angle steel is considered for the connection
between the slit wall and boundary beams. The distance between the bolting line and the surface of
beams is 50 mm for example, which gives a net wall height of 1250 mm (bolting line to bolting
line).
Four specimens were designed, with two for condition assessment and the other two for
energy dissipation. In the two specimens for condition assessment, three double-tapered links were
designed, dimensions of which are given in Table 6.1. The “whole-height” type in-plane reference,
which provided a good reference to the torsional deformation of double-tapered links under both
incremental two-cycle loading and earthquake loading, was also included in this test to enhance the
objectivity in visual inspection. Figure 6.2 shows the progress of out-of-plane deformation at
quarter-height section under incremental two-cycle loading, with the ordinate being the normalized
out-of-plane deformation (out-of-plane deformation at quarter-height section divided by the plate
thickness). When the normalized out-of-plane deformation is larger than unity, torsional
deformation is considered notable at quarter-height section. Based on this criterion, notable
torsional deformation occurred at drift ratios of 2%, 4% and 6% respectively.

6 - 4
Table 6.1 Three double-tapered links
Link Dimension
(mm)
Width-thickness ratio
(λ)
Aspect ratio
(β)
Occurrence of notable
torsional deformation
1 a/t/h=30/4.2/310 14.3 5.2 2%
2 a/t/h=18/4.2/310 8.6 8.6 4%
3 a/t/h=14/4.2/310 6.7 11.1 6%
-8
-6
-4
-2
0
2
4
6
8
Dri
ft r
atio
(%
)
Loading steps
0 2 4 6 80
1
2
3
No
rma
lize
d d
efo
rma
tio
n
Drift ratio (%)
Link 1
Link 2
Link 3
(a) (b)
Figure 6.2 Simulation: (a) incremental two-cycle loading; (b) progress of out-of-plane deformation.
As presented in Section 5.5 in Chapter 5, the end plate with a width-depth ratio of 1.5 behaved
mainly in plane and successfully transferred the majority of lateral drift into double-tapered links.
Following the same width-depth ratio of 1.5, the end plate from a monolithic plate was also
expected to provide a stable and relatively rigid boundary. The height of links in Table 6.1 was
designed to be one quarter of the story height. Given a rigid end plate, the story drift would be
amplified by four times into the double-tapered links. Therefore, the target story drifts when
notable torsional deformation occurs are 0.5%, 1% and 1.5%.
The two specimens for energy dissipation were designed to occupy the whole span. Besides
the large shear force bearing capacity, having the wall covering the whole span reduces the
possibility of lateral torsional buckling of beams. For a typical frame of weak-beam, strong-column
type, a story drift of 0.5% is assumed as the elastic limit. The scaled-down specimens are designed
to enter plasticity earlier than the frame. Specimen 3, made from SS400 with a plate thickness of
4.2 mm, was designed to yield at 1/2 of the elastic limit of the frame, with yield strength yQ of
103 kN and elastic stiffness K of 36 kN/mm ( yQ /K = 0.25%). Specimen 4, made from LYP100 with
a plate thickness of 9 mm, was designed to yield earlier at 1/4 of the elastic limit of the frame, with
yield strength yQ of 94 kN (nominal yield stress of 100 MPa used) and elastic stiffness K of 69.6
kN/mm ( yQ /K = 0.11%). Note that the slightly smaller yQ of Specimen 4 than that of Specimen 3
was based on the consideration of the larger strain hardening of LYP100. They were designed of
the same shear strength at a drift ratio of 1%, which will be presented in the discussion of test
results.
Figure 6.3 shows the four specimens in detail. Made from conventional steel SS400,
Specimens 1 and 2 had the same middle part with both double-tapered links and narrow rectangular
strips beside double-tapered links. They differed from each other only in the end plates. Specimen 1

6 - 5
was made from a monolithic plate with the thickness of 4.2 mm; Specimen 2 used a thicker end
plate with the thickness of 9 mm and was assembled with the middle part using high strength
bolting. The narrow rectangular strips, which would behave in plane due to the small
width-thickness ratio, made up the required width of end plates together with double-tapered links.
Specimens 3 and 4 were with rectangular links arranged in two rows. Owning to the large strain
hardening of LYP100, Specimen 4 was expected to present better energy dissipation than Specimen
3 made from SS400.
The slits were made by digital controlled laser cutting machine, which was very efficient and
accurate. For each specimen in Figure 6.3, the top and bottom portion with circular openings is the
bolting area for connecting to the loading frame using high strength bolting.
840
1250
470 3
10 470
20
42 90 54
840
12
50
470 3
10 470
20
42 90 54
(a) (b)
1960
12
50
32.4
216 2
43 332 2
43 216
1960
12
50
132 410 1
65 4
10 132
70.3
(c) (d)
Figure 6.3 Details of specimens (unit: mm): (a)-(d) Specimens 1-4.
6.2.4 Test setup, instrumentation and loading protocol
The test setup was a portal frame with four pins at each corner and has a story height of 1748 mm
and a column centerline spacing of 3000 mm, as shown in Figure 6.4. The lateral deformation of
the test setup was controlled in a fully automated manner using the loading system which consists
of a horizontal hydraulic jack, a hydraulic pump system and a control PC. The main components of
the test bed were: (a) top and bottom H-400x400x13x21 beams; (b) two H-250x250x9x16 columns;
(c) four pin subassemblies with load bearing capacity of 900 kN each; and (d) a fixed support for
the actuator loading. The assembly was capable of applying a horizontal force more than 750 kN,
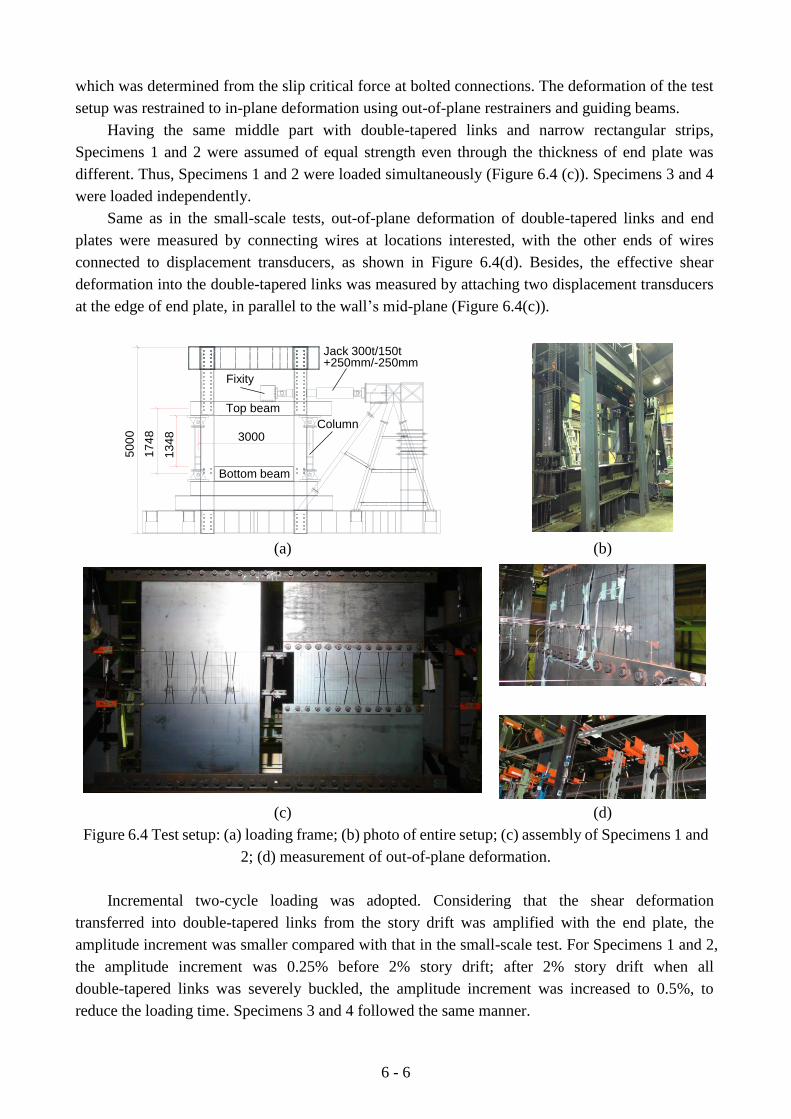
6 - 6
which was determined from the slip critical force at bolted connections. The deformation of the test
setup was restrained to in-plane deformation using out-of-plane restrainers and guiding beams.
Having the same middle part with double-tapered links and narrow rectangular strips,
Specimens 1 and 2 were assumed of equal strength even through the thickness of end plate was
different. Thus, Specimens 1 and 2 were loaded simultaneously (Figure 6.4 (c)). Specimens 3 and 4
were loaded independently.
Same as in the small-scale tests, out-of-plane deformation of double-tapered links and end
plates were measured by connecting wires at locations interested, with the other ends of wires
connected to displacement transducers, as shown in Figure 6.4(d). Besides, the effective shear
deformation into the double-tapered links was measured by attaching two displacement transducers
at the edge of end plate, in parallel to the wall’s mid-plane (Figure 6.4(c)).
Jack 300t/150t+250mm/-250mm
Fixity
3000
50
00
17
48
13
48
Top beam
Bottom beam
Column
(a) (b)
(c) (d)
Figure 6.4 Test setup: (a) loading frame; (b) photo of entire setup; (c) assembly of Specimens 1 and
2; (d) measurement of out-of-plane deformation.
Incremental two-cycle loading was adopted. Considering that the shear deformation
transferred into double-tapered links from the story drift was amplified with the end plate, the
amplitude increment was smaller compared with that in the small-scale test. For Specimens 1 and 2,
the amplitude increment was 0.25% before 2% story drift; after 2% story drift when all
double-tapered links was severely buckled, the amplitude increment was increased to 0.5%, to
reduce the loading time. Specimens 3 and 4 followed the same manner.

6 - 7
6.3 Test results
6.3.1 Performance of end plate
Specimens 1 and 2 used relatively deep end plate as the boundary connection with beams. The
out-of-plane deformation at the locations marked in Figure 6.5(a) was measured to identify when the
end plate deformed out of plane. In Specimen 1 using a monolithic plate, torsional deformation was
observed initiated from the plate edge. Figure 6.5(b) shows the residual deformation of a vertical
edge. When the drift was small than 2% drift, the amount of out-of-plane deformation was smaller
than one plate thickness. Figure 6.5(c) and Figure 6.5(d) show the residual deformation at the four
corners of end plate, with the ordinate being the out-of-plane deformation normalized by the plate
thickness. The thicker end plate in Specimen 2 gave smaller out-of-plane deformation than that in
Specimen 1. Within 2% drift ratio, the amplitude of out-of-plane deformation in Specimen 2 was
smaller than one plate thickness; within 1.75% drift ratio, the amplitude of out-of-plane deformation
in Specimen 1 was smaller than one plate thickness. As observed in test, the out-of-plane deformation
in the end plates of both specimens was barely notable before 2% story drift. Thus, the end plates in
both specimens were considered behaved mainly in plane.
1
2
4
6
3
5
7
9
8
10
Specimen 1 Specimen 2
-1 0 1 2
0.5%
1%
1.5%
2%
1
2
4
6
Normalized deformation
(a) (b)
0.0 0.5 1.0 1.5 2.0-2
-1
0
1
2
No
rma
lize
d d
efo
rma
tio
n
Drift ratio (%)
2
3
4
5
0.0 0.5 1.0 1.5 2.0-2
-1
0
1
2
No
rma
lize
d d
efo
rma
tio
n
Drift ratio (%)
7
8
9
10
(c) (d)
Figure 6.5 Out-of-plane deformation at end plates: (a) measured positions; (b) deformation in
the vertical edge; (c) and (d) deformation of horizontal edges in Specimens 1 and 2.
The net shear deformation into double-tapered links was measured in both specimens, as
diagramed in Figure 6.4(c). The net shear deformation transferred into double-tapered links was
given in Figure 6.6. Elastic deformation of end plates gave a little smaller net shear deformation

6 - 8
into the double-tapered links than the input lateral drift, with a difference within 1 mm. Because of
the thicker end plate in Specimen 2, the shear deformation into double-tapered links in Specimen 2
was about 5% larger than that in Specimen 1. Staring from 0.5% drift, over 85% of the story drift was
transferred into double-tapered links in both specimens.
From Figures 6.5 and 6.6, the thicker end plate in Specimen 2 maintained more in plane and
transferred a little larger net shear deformation into the double-tapered links. However, the relatively
thin end plate of Specimen 1 using a monolithic plate was more preferred considering the simplicity
in both manufacturing and assembling.
0.0 0.5 1.0 1.50
5
10
15
20
Sh
ea
r d
efo
rma
tio
n (
mm
)
Drift ratio (%)
Into links of Specimen 1
Into links of Specimen 2
Total
0.0 0.5 1.0 1.50.0
0.2
0.4
0.6
0.8
1.0
Into
lin
ks
Drift ratio (%)
Specimen 1
Specimen 2
(a) (b)
Figure 6.6 Shear deformation into double-tapered links: (a) absolute magnitude;
(b) normalized composition.
6.3.2 Performance of condition assessment
Figure 6.7 shows the progresses out-of-plane deformation normalized by plate thickness at the
quarter-height section. When the normalized out-of-plane deformation was larger than unity, the
deformation was considered notable. With thicker end plates in Specimen 2, the out-of-plane
deformation was larger than that of Specimen 1. In Specimen 1, the normalized out-of-plane
deformation was 0.88, 0.86 and 1.03 for three links at drift ratios of 0.5%, 1.0% and 1.5%
respectively; in Specimen 2, the normalized out-of-plane deformation was 0.89, 1.27 and 1.45 for
three links at drift ratios of 0.5%, 1.0% and 1.5% respectively. For Links 1 and 2 in Specimen 1 and
Link 1 in Specimen 2, the normalized out-of-plane deformation was smaller than but close to unity
(larger than 0.86). Considering that condition assessment in this study was resorted to visual
inspection without the need of measurement, notable torsional deformation was considered to have
occurred according to these close-to-unity out-of-plane deformations. In both specimens, notable
torsional deformation occurred at story drifts of 0.5%, 1.0% and 1.5% respectively.

6 - 9
0.0 0.5 1.0 1.5 2.00
1
2
3
No
rma
lize
d d
efo
rma
tio
n
Drift ratio (%)
Link 1
Link 2
Link 3
0.0 0.5 1.0 1.5 2.00
1
2
3
No
rma
lize
d d
efo
rma
tio
n
Drift ratio (%)
Link 1
Link 2
Link 3
(a) (b)
Figure 6.7 Progress of out-of-plane deformation: (a) Specimen 1; (b) Specimen 2.
Figures 6.8 and 6.9 show torsional deformation in test. In view of notability of torsional
deformation, there was no clear difference between the two specimens. Specimen 1 using a
monolithic plate worked similarly as Specimen 2 using much stiffer end plates.
(a) (b) (c) (d)
Figure 6.8 Torsional deformation of Specimen 1: (a)-(c) Links 1-3 at drift ratios of 0.5%, 1% and
1.5% respectively; (d) at a drift ratio of 1.5%.
(a) (b) (c) (d)
Figure 6.9 Torsional deformation of Specimen 2: (a)-(c) Links 1-3 at drift ratios of 0.5%, 1% and
1.5% respectively; (d) at a drift ratio of 1.5%.

6 - 10
Figure 6.6 showed that over 85% of the story drift was transferred into the double-tapered links,
thus there was still small amount of story drift absorbed by the end plate through elastic deformation.
On the other hand, some out-of-plane deformation occurred in the end plates of both specimens. The
out-of-plane deformation of end plate accelerated the torsional deformation of double-tapered links.
In consequence, though the net shear deformation into double-tapered links was smaller than design,
occurrence of notable torsional deformation was the same as prediction when the rigid end plate was
assumed. In the practical design of double-tapered links, double-tapered links together with end
plates should be analyzed.
6.3.3 Strength and stiffness
Equations to estimate the plastic strength and stiffness were the same as in Chapter 5. Table 6.2
shows the prediction and test results. The predicted elastic stiffness K agreed quite well with tested
value tK . Within a drift ratio of 4%, the maximum strength Qmaxt was about 16% to 25% larger than
the plastic strength Qp for specimens made from SS400; with LYP100, the maximum strength was
about two times the plastic strength. This overstrength relative to plastic strength, especially for
specimens made from low yield point steel, should be cautiously considered in designing the
surrounding frame.
Table 6.2 Strength and stiffness
Specimen Qy (kN) Qp (kN) Qmaxt (kN) Qmaxt / Qp K
(kN/mm)
tK
(kN/mm)
/tK K
1 & 2 56.3 84.4 97.8 1.16 27.8 26.2 0.94
3 103.0 154.4 192.8 1.25 36.0 35.8 0.99
4 94.0 141.0 283.2 2.01 69.6 68.5 0.98
As described in a previous section, Specimens 3 and 4 were designed to have the same shear
strength at a drift ratio of 1%. At a drift ratio of 1%, the shear strengths of two specimens were very
similar, 180.6 kN for Specimen 3 and 181.2 kN for Specimen 4.
6.3.4 Energy dissipation
Figure 6.10 shows the hysteretic curves. The curves in dashed lines were the numerical results. The
bilinear kinematic model was used for conventional steel SS400 and combined kinematic and
isotropic model was used for LYP100. Both models captured the hysteretic behavior quite well.
Figure 6.10(a) gives the total force versus drift ratio relationship for Specimens 1 and 2. Plastic
strength estimated well the maximum strength. For Specimen 3, the simulation detached from test
after 2% because of the serious fracture occurred at the narrow strips (without fracture in
double-tapered links) (Figure 6.12). For specimen 4 made from LYP100, energy dissipation started
as early as at a drift ratio of 0.25% and no fracture was observed till the completion of loading (Figure
6.14). Thanks to the large ductility and strain hardening of LYP100, plump hysteretic loops were
obtained without the need of out-of-plane constraint.
The equivalent damping ratios estimated using the standard procedure [11] are plotted for each
drift ratio in Figure 6.10(d), in which one loop in the second cycle was used for the calculation.
Although pinching in the hysteretic curve of Specimens 1 and 2 occurred starting from 0.5% drift by

6 - 11
the severe torsional deformation of double-tapered links, the equivalent damping ratio was about 0.3
within the range of 1% to 2% drift ratio. Before 1.75%, the equivalent damping ratio of Specimens 1
and 2 was larger than that of Specimen 3; after 1.75%, when all the double-tapered links in
Specimens 1 and 2 were severely deformed out of plane, Specimen 3 showed larger equivalent
damping ratio. For Specimen 4 made from LYP100, the energy dissipation capacity was the best,
with almost constant equivalent damping ratio of 0.4 after 1.75%.
-3 -2 -1 0 1 2 3-1.5
-1.0
-0.5
0.0
0.5
1.0
1.5
Fo
rce
/ Q
p
Drift ratio (%)
Test
Simulation
-3 -2 -1 0 1 2 3-1.5
-1.0
-0.5
0.0
0.5
1.0
1.5
Fo
rce
/ Q
p
Drift ratio (%)
Test
Simulation
(a) (b)
-4.5 -3.0 -1.5 0.0 1.5 3.0 4.5-2
-1
0
1
2
Fo
rce
/ Q
p
Drift ratio (%)
Test
Simulation
0 1 2 3 40.0
0.1
0.2
0.3
0.4
0.5
Specimens 1 & 2
Specimen 3
Specimen 4
Eq
uiv
ale
nt
da
mp
ing
ra
tio
heq
Drift ratio (%)
(c) (d)
Figure 6.10 Hysteresis and equivalent damping ratio: (a)-(c) hysteretic curves of Specimens 1
& 2, 3 and 4, respectively; (d) equivalent damping ratios.
6.3.5 Shear deformation distribution among rows
The net shear deformation transferred into the links in two rows in Specimens 3 and 4 were measured,
similarly by attaching two displacement transducers at the link ends of each row. Figure 6.11 shows
the shear deformation distribution among two rows in Specimen 3. At the maximum amplitude
towards the left (actuator pushed the loading beam to the left), the shear deformation was almost
evenly distributed among two rows at small drift of 0.23%; after that larger portion was distributed in
the upper row. At the maximum amplitude towards the right, shear deformation into the lower row
was larger than that into the upper row; at 0.75%, shear deformation was evenly distributed among
two rows; after 0.75%, the upper row started to bear larger portion. Non-evenly distributed shear
deformation was presented because of the limited strain hardening of SS400. Under in-plane shear
deformation, the initial imperfection in the plate, including the geometrical imperfection like
non-uniform thickness or material defects like cracks and vacancies etc., triggered slightly different
allocation of shear deformation among rows. Because of the limited strain hardening of SS400, the

6 - 12
increase of stress at the row experienced larger deformation was not sufficient to transform it into a
stronger row and thus the uneven deformation maintained.
0.2 0.4 0.6 0.8 1.00.0
0.2
0.4
0.6
Com
positio
n in r
ow
s
Drift ratio (%)
Upper row
Lower row
-1.0 -0.8 -0.6 -0.4 -0.20.0
0.2
0.4
0.6
Com
po
sitio
n in r
ow
s
Drift ratio (%)
Upper row
Lower row
(a) (b)
Figure 6.11 Distribution of shear deformation among two rows: (a) loading towards the left; (b)
loading towards the right.
Figure 6.12 shows the deformed shape of Specimen 3 in test. In-plane deformation concentrated
on the link ends, which caused plasticity at link ends and resulting energy dissipation. Local buckling
of links and subsequent fracture at link ends initiated in the lower row at a drift ratio of 1.8%. After
local buckling of links occurred, fracture followed because of the very limited ductility of
conventional steel SS400. After the completion of the first cycle of 3%, fracture at link ends almost
penetrated the entire lower row.
Upper row
Lower row
(a) (b)
Figure 6.12 Deformation of Specimen 3: (a) at a story drift of 1.8%; (b) at a story drift of 3%.
Figure 6.13 shows the shear deformation distribution among two rows in Specimen 4. In both
directions, shear deformation was more or less evenly distributed among two rows. Even shear
deformation indicated even distribution of plasticity among two rows. The large strain hardening of
LYP100 allowed the stress to increase with the development of plasticity, which adaptively balanced
the strength of each row avoiding concentrated deformation on a single row. By using LYP100, the
even shear deformation among all rows allowed the even and sufficient development of plasticity at
the ends of all links, which enhanced the energy dissipation.
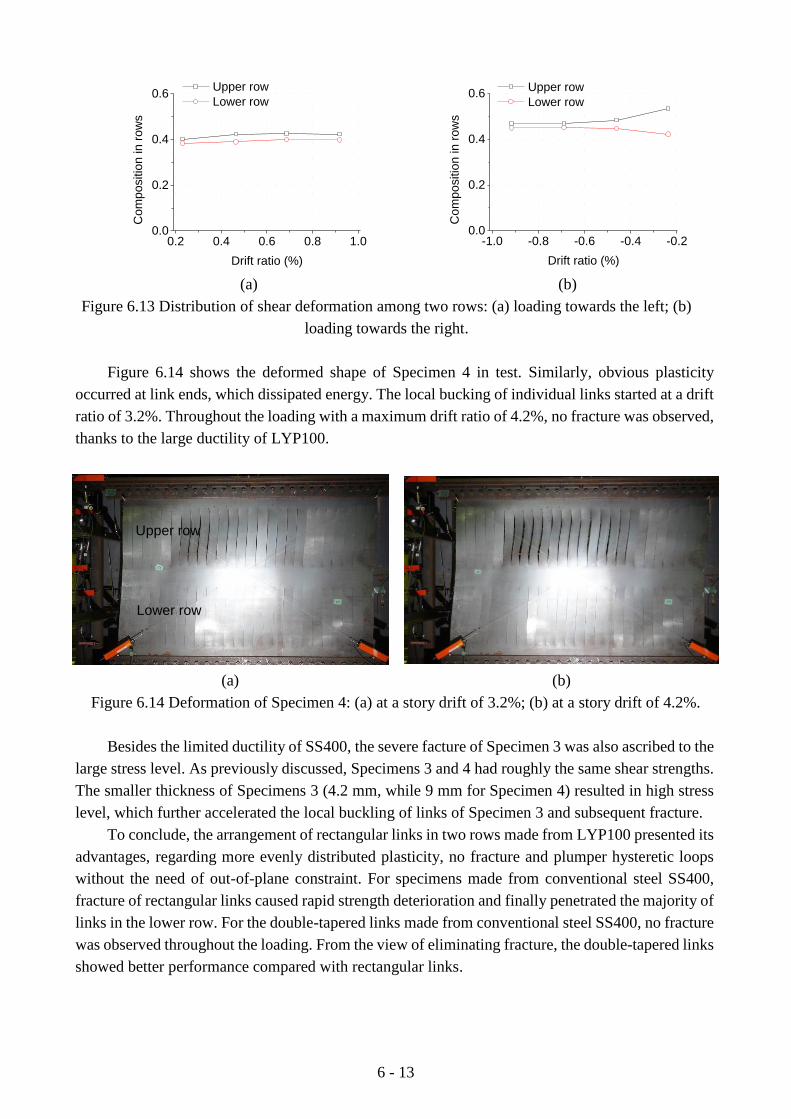
6 - 13
0.2 0.4 0.6 0.8 1.00.0
0.2
0.4
0.6
Com
positio
n in r
ow
s
Drift ratio (%)
Upper row
Lower row
-1.0 -0.8 -0.6 -0.4 -0.20.0
0.2
0.4
0.6
Com
po
sitio
n in r
ow
s
Drift ratio (%)
Upper row
Lower row
(a) (b)
Figure 6.13 Distribution of shear deformation among two rows: (a) loading towards the left; (b)
loading towards the right.
Figure 6.14 shows the deformed shape of Specimen 4 in test. Similarly, obvious plasticity
occurred at link ends, which dissipated energy. The local bucking of individual links started at a drift
ratio of 3.2%. Throughout the loading with a maximum drift ratio of 4.2%, no fracture was observed,
thanks to the large ductility of LYP100.
Upper row
Lower row
(a) (b)
Figure 6.14 Deformation of Specimen 4: (a) at a story drift of 3.2%; (b) at a story drift of 4.2%.
Besides the limited ductility of SS400, the severe facture of Specimen 3 was also ascribed to the
large stress level. As previously discussed, Specimens 3 and 4 had roughly the same shear strengths.
The smaller thickness of Specimens 3 (4.2 mm, while 9 mm for Specimen 4) resulted in high stress
level, which further accelerated the local buckling of links of Specimen 3 and subsequent fracture.
To conclude, the arrangement of rectangular links in two rows made from LYP100 presented its
advantages, regarding more evenly distributed plasticity, no fracture and plumper hysteretic loops
without the need of out-of-plane constraint. For specimens made from conventional steel SS400,
fracture of rectangular links caused rapid strength deterioration and finally penetrated the majority of
links in the lower row. For the double-tapered links made from conventional steel SS400, no fracture
was observed throughout the loading. From the view of eliminating fracture, the double-tapered links
showed better performance compared with rectangular links.

6 - 14
6.4 Proposal for practical application
The large-scale tests further demonstrated the feasibility of realizing dual functions simultaneously.
For the purpose of condition assessment, a monolithic plate with one row of double-tapered links in
the middle and two end plates as the connection part was adopted. Considering the pinched hysteresis
of the specimen with double-tapered links for condition assessment, further improvement in
achieving plumper hysteretic loops was possible by adding another slit wall made from low yield
point steel.
As described in Section 5.5 in Chapter 5, the end plates should be relatively wide to transfer the
majority of story drift into double-tapered links. To dissipate large amount of energy, the slit wall
made from low yield point steel should also be wide. Therefore, the practical dual-function system is
proposed to occupy the whole beam span, to satisfy both the stable boundary demand for
double-tapered links and large amount of energy dissipated in total. Another benefit of covering the
whole beam span is that there is less possibility of out-of-plane buckling in beams. If the wall were
too narrow, the concentrated reaction on the beam may cause the early lateral torsional buckling in
the beam, which in consequence will compromise both functions.
As adopted in test, the plate with double-tapered links for condition assessment and that made
from low yield point steel for energy dissipation should be separately installed to eliminate
interaction. The separation also gives freedom in design that the owner can separately determine
which drifts to monitor and how much energy to dissipate. It is recommended that double-tapered
links for condition assessment occupies about one third of the beam span while rectangular links
made from LYP occupies two thirds of the span for the majority of energy dissipation. In the design,
the clearance between the wall and columns should be considered. Figure 6.15 shows the schematic
diagram for practical application.
Conventional
steel
Low yield point steel
Figure 6.15 Configuration for practical application.
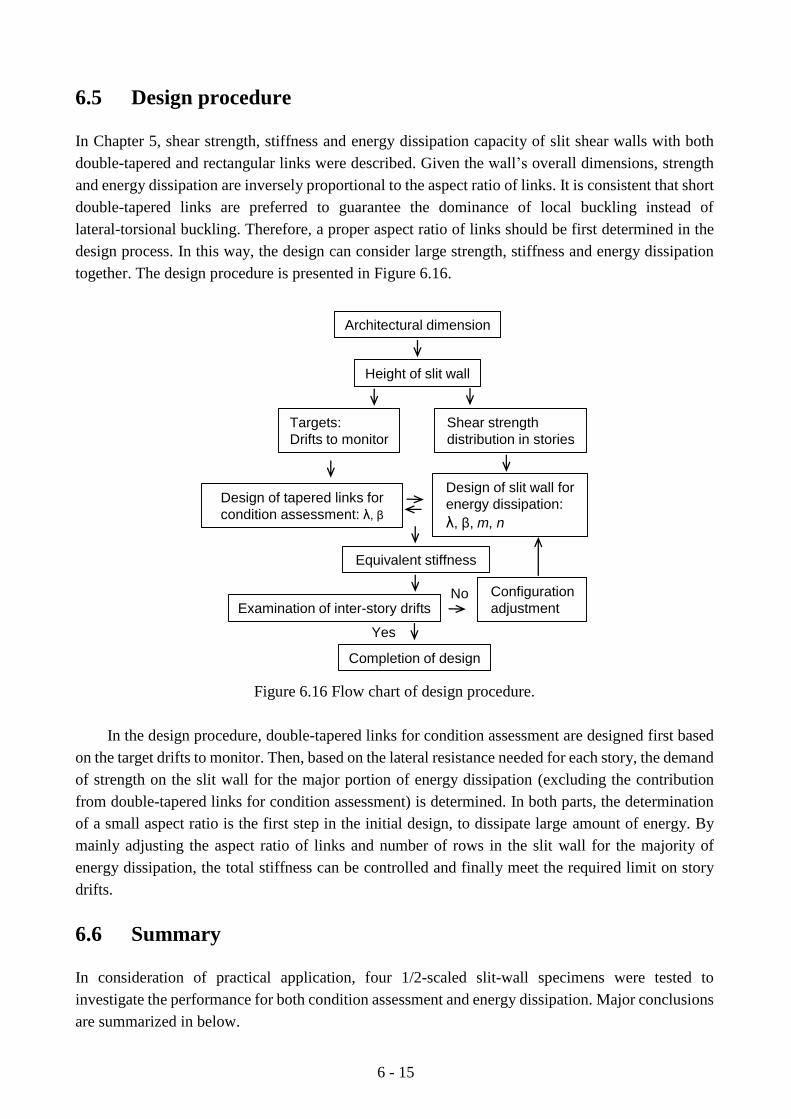
6 - 15
6.5 Design procedure
In Chapter 5, shear strength, stiffness and energy dissipation capacity of slit shear walls with both
double-tapered and rectangular links were described. Given the wall’s overall dimensions, strength
and energy dissipation are inversely proportional to the aspect ratio of links. It is consistent that short
double-tapered links are preferred to guarantee the dominance of local buckling instead of
lateral-torsional buckling. Therefore, a proper aspect ratio of links should be first determined in the
design process. In this way, the design can consider large strength, stiffness and energy dissipation
together. The design procedure is presented in Figure 6.16.
Architectural dimension
Height of slit wall
Design of tapered links for
condition assessment: λ, β
Examination of inter-story drifts
Shear strength
distribution in stories
Design of slit wall for
energy dissipation:
λ, β, m, n
Equivalent stiffness
Targets:
Drifts to monitor
Completion of design
No Configuration
adjustment
Yes
Figure 6.16 Flow chart of design procedure.
In the design procedure, double-tapered links for condition assessment are designed first based
on the target drifts to monitor. Then, based on the lateral resistance needed for each story, the demand
of strength on the slit wall for the major portion of energy dissipation (excluding the contribution
from double-tapered links for condition assessment) is determined. In both parts, the determination
of a small aspect ratio is the first step in the initial design, to dissipate large amount of energy. By
mainly adjusting the aspect ratio of links and number of rows in the slit wall for the majority of
energy dissipation, the total stiffness can be controlled and finally meet the required limit on story
drifts.
6.6 Summary
In consideration of practical application, four 1/2-scaled slit-wall specimens were tested to
investigate the performance for both condition assessment and energy dissipation. Major conclusions
are summarized in below.
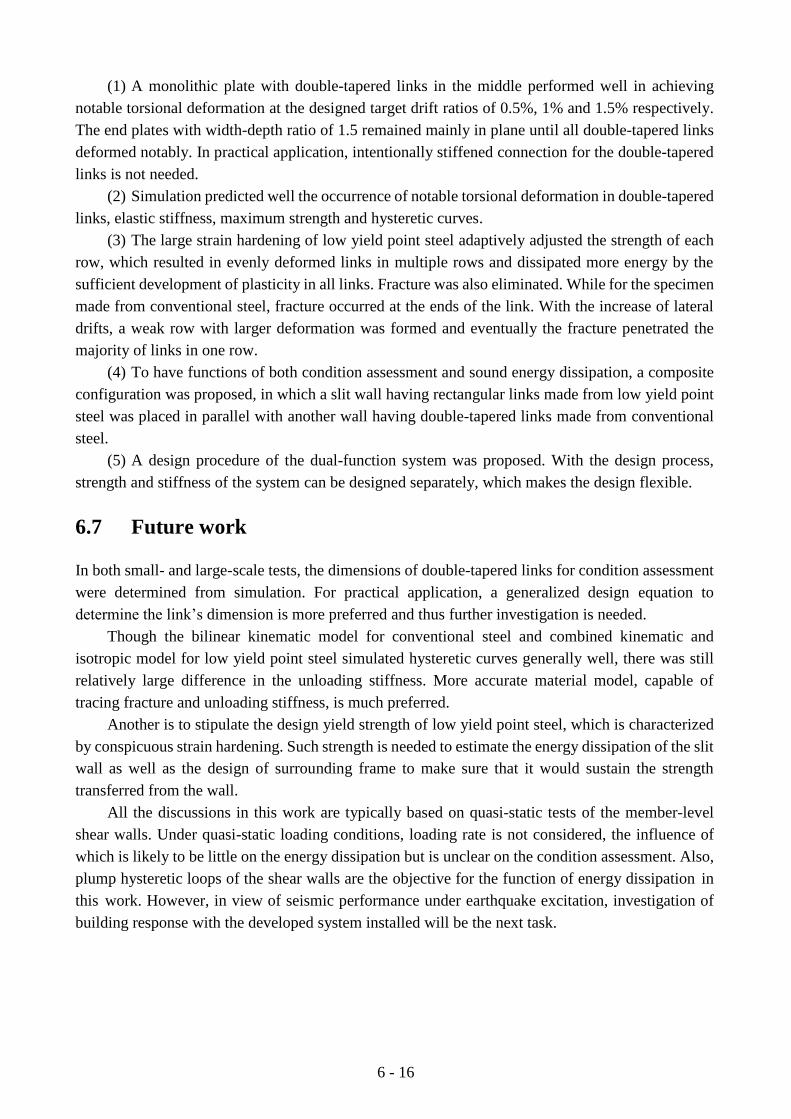
6 - 16
(1) A monolithic plate with double-tapered links in the middle performed well in achieving
notable torsional deformation at the designed target drift ratios of 0.5%, 1% and 1.5% respectively.
The end plates with width-depth ratio of 1.5 remained mainly in plane until all double-tapered links
deformed notably. In practical application, intentionally stiffened connection for the double-tapered
links is not needed.
(2) Simulation predicted well the occurrence of notable torsional deformation in double-tapered
links, elastic stiffness, maximum strength and hysteretic curves.
(3) The large strain hardening of low yield point steel adaptively adjusted the strength of each
row, which resulted in evenly deformed links in multiple rows and dissipated more energy by the
sufficient development of plasticity in all links. Fracture was also eliminated. While for the specimen
made from conventional steel, fracture occurred at the ends of the link. With the increase of lateral
drifts, a weak row with larger deformation was formed and eventually the fracture penetrated the
majority of links in one row.
(4) To have functions of both condition assessment and sound energy dissipation, a composite
configuration was proposed, in which a slit wall having rectangular links made from low yield point
steel was placed in parallel with another wall having double-tapered links made from conventional
steel.
(5) A design procedure of the dual-function system was proposed. With the design process,
strength and stiffness of the system can be designed separately, which makes the design flexible.
6.7 Future work
In both small- and large-scale tests, the dimensions of double-tapered links for condition assessment
were determined from simulation. For practical application, a generalized design equation to
determine the link’s dimension is more preferred and thus further investigation is needed.
Though the bilinear kinematic model for conventional steel and combined kinematic and
isotropic model for low yield point steel simulated hysteretic curves generally well, there was still
relatively large difference in the unloading stiffness. More accurate material model, capable of
tracing fracture and unloading stiffness, is much preferred.
Another is to stipulate the design yield strength of low yield point steel, which is characterized
by conspicuous strain hardening. Such strength is needed to estimate the energy dissipation of the slit
wall as well as the design of surrounding frame to make sure that it would sustain the strength
transferred from the wall.
All the discussions in this work are typically based on quasi-static tests of the member-level
shear walls. Under quasi-static loading conditions, loading rate is not considered, the influence of
which is likely to be little on the energy dissipation but is unclear on the condition assessment. Also,
plump hysteretic loops of the shear walls are the objective for the function of energy dissipation in
this work. However, in view of seismic performance under earthquake excitation, investigation of
building response with the developed system installed will be the next task.

6 - 17
REFERENCES
[1] Torii S., Teramoto T., Kihara H. and Kitamura H. The response control design of high-rise
buildings with low yield strength steel wall. Proc., Structural Engineering World Wide 1998,
Elsevier, CD-ROM, Paper T-190-6.
[2] Tanaka K. and Sasaki Y. Hysteretic performance of shear panel dampers of
ultra-low-yield-strength steel for seismic response control of buildings. Proc., 12th WCEE
2000, New Zeland, CD-ROM, Paper No. 1248.
[3] Nakashima M. Strain-hardening behavior of shear panels made of low-yield steel. I: test.
Journal of structural engineering 1995; 121 (12):1742-1749.
[4] Nakashima M., Akazawa T. and Tsuji B. Strain-hardening behaviour of shear panels made of
low yield steel, II: Model. Journal of structural engineering 1995; 121 (12):1750-1757.
[5] Nakashima M., Iwai S. and Iwata M., etc. Energy dissipation behaviour of shear panels made
of low yield steel. Earthquake Engineering & Structural Dynamics 1994; 23(12): 1299-1313.
[6] Matteis G., Landolfo R. and Mazzolani F. Seismic response of MR steel frames with low-yield
steel shear panels. Engineering Structures 2003; 25(2): 155-168.
[7] Zhang C., Zhang Z. and Shi J. Development of high deformation capacity low yield strength
steel shear panel damper. Journal of Constructional Steel Research 2012; 75: 116-130.
[8] Chen S. and Jhang C. Cyclic behavior of low-yield point steel shear walls. Thin-Walled
Structures 2006; 44(7): 730-738.
[9] Chen S. and Jhang C. Experimental study of low-yield-point steel plate shear wall under
in-plane load. Journal of Constructional Steel Research 2011; 67(6): 977-985.
[10] Abaqus Inc., ABAQUS Version 6.10 User’s Manual. http://www.abaqus.com
[11] Chopra A. K. Dynamics of Structures: Theory and Applications to Earthquake Engineering
(2nd Edition). Prentice Hall: New Jersey, USA, 2000.


7 - 1
CHAPTER 7
Summary and conclusions
Recent advancements in earthquake engineering have significantly reduced seismic vulnerability of
buildings, yet earthquake ground motions beyond those considered in design may occur as recently
witnessed in 2011 Tohoku earthquake in Japan. While quick inspection and evaluation of building
damage after major earthquake events is necessary to make a decision whether to evacuate or
continue normal operations, the condition assessment of structural components is not an easy task.
A new way of implementing condition assessment through the inspection of notable torsional
deformation of double-tapered links, relying on naked eyes without the need of any physical
measurement, is proposed. Under shear deformation, double-tapered links buckle and deform
torsionally, which gives a permanent trace of damage experienced by the story where it is installed.
The tapered shape largely enhances the torsional deformation as opposed to rectangular links. By
controlling the width of double-tapered links, notable torsional deformation occurs at a certain lateral
drift. The feasibility of using the occurrence of notable torsional deformation to detect different levels
of lateral drifts was investigated numerically and experimentally under various types of loading.
For condition assessment, thin double-tapered links are needed to obtain large torsional
deformation that can be recognizable in visual inspection, which unfortunately produces pinched
hysteresis and hence lessens the energy dissipation. Past research on steel slit shear walls with
rectangular links showed the advantages of using this system, that is, lightness, large stiffness and
ductility. However, pinching in hysteresis and fracture at link ends still need to be improved. To this
end, the steel slit shear wall made from low yield point steel (LYP) was proposed for energy
dissipation, which exhibited plump hysteretic loops with nearly no strength degradation and excellent
ductility.
The combined use of double-tapered links for condition assessment and rectangular links made
from LYP for dissipating the majority of energy form a dual-function system. For condition
assessment, a parametric study was first conducted to investigate the controlling factor for torsional
deformation of double-tapered links, followed by experimental validation. Considering practical
application, condition assessment performance of double-tapered links under various loadings was
investigated, and boundary connection for double-tapered links was designed. For energy dissipation,
steel slit shear walls made from LYP were investigated and the superiority was demonstrated by
comparison with those made from conventional steel. Last, sound performance of both condition
assessment and energy dissipation was verified through a series of large-scale slit-wall specimens.
This dissertation consists of seven chapters. Chapter 1 is the background and objective of this
study, Chapter 2 summarizes previous research on steel slit shear walls and Chapter 7 is the summary

7 - 2
and conclusions. Chapters 3 to 6 constitute the main part of the dissertation. The respective focuses of
those chapters are: (1) design of double-tapered links for structural condition assessment, (2)
condition assessment performance of double-tapered links under earthquake loadings, (3)
enhancement of energy dissipation and design of end plate connection, and (4) system validation
through large-scale tests. The contents of the four chapters are summarized as follows.
Design of double-tapered links for structural condition assessment
In Chapter 3, the feasibility of conducting condition assessment by visual inspection of notable
torsional deformation of double-tapered links was investigated. The tapered shape was chosen to
achieve large torsional deformation instead of rectangular links, which made the condition
assessment possible through visual inspection. Another merit of having the tapered shape for the link
is the elimination of fracture at link ends due to the tapered shape. The key parameters controlling the
torsional deformation of double-tapered links were investigated numerically. In experimental
validation, ten pairs of shear-wall specimens with double-tapered links and rectangular links were
tested to identify three levels of drift ratios. The main findings from both numerical analysis and
experiments are summarized as follows.
(1) Occurrence of notable torsional deformation of double-tapered links was primarily
controlled by the width-thickness ratio, while little affected by the aspect ratio, as long as
the links were neither too long nor too short. Local buckling was the dominant model for the
torsional deformation of double-tapered links rather than the lateral-torsional buckling.
(2) Torsional deformation of double-tapered links occurred earlier and larger than that of the
corresponding rectangular links for the same width-thickness ratio, which made the
torsional deformation more notable to the naked eye.
(3) Double-tapered links in three levels deformed notably at drift ratios of 1.5%, 2.5% and 3.5%
respectively. The progress of notable torsional deformation in the assembled double-tapered
links and individual links were nearly the same, which indicated the stable occurrence of
notable torsional deformation and little influence of the neighboring links.
(4) Notable torsional deformation occurred in sequence in the shear wall combined with
different double-tapered links, which provided clear evidence for supporting the scenario of
condition assessment proposed in this study.
(5) The addition of in-plane reference significantly enhanced the objectivity in inspection of
notable torsional deformation. Both types, the “wing” and “whole-height” type reference,
behaved mainly in-plane throughout the entire loading as designed, which provided a good
reference after double-tapered links buckled out of plane.
Condition assessment performance of double-tapered links under earthquake loading
In Chapter 4, the performance of condition assessment of double-tapered links was further
investigated under earthquake loading besides incremental two-cycle loading. In addition, the
performance and effectiveness of in-plane reference under earthquake loading was also investigated.
The main findings from both numerical analysis and experiment are summarized as follows.
(1) Under earthquake loading, notable torsional deformation of three double-tapered links
occurred at largest peak amplitudes of 2.5%, 3.5% and 4.5% drift ratios respectively, which
were the same as those experienced by incremental two-cycle loading. The incremental

7 - 3
two-cycle loading gave a good representative in determining the occurrence of notable
torsional deformation and thus can be adopted as the base loading in the design of
double-tapered links for condition assessment.
(2) Both the “wing” and “whole-height” type in-plane reference remained in-plane throughout
the entire loading and provided a good reference for the torsional deformation of
double-tapered links. Similar with the incremental two-cycle loading, the inspection of
notable torsional deformation was much more objective with the presence of in-plane
reference.
Enhancement of energy dissipation and design of end plate connection
In Chapter 5, mechanical properties of shear walls with both double-tapered links and rectangular
links, such as strength, stiffness and hysteretic behavior, were investigated. For condition assessment,
thin double-tapered links are needed to have large torsional deformation used in visual inspection,
which in return reduces the energy dissipation. To have better energy dissipation in the perspective of
plump hysteretic loops, the steel slit shear walls with rectangular links made from LYP was proposed.
In addition, the connection between double-tapered links and beams through end plates was proposed,
the configuration of which was determined theoretically and validated experimentally. The main
conclusions are summarized as follows.
(1) Buckling strength equation derived by plate local buckling was proposed for double-tapered
links, which agreed well with test results. In regarding the initial stiffness, when the
contribution of end zone between the ends of double-tapered links and boundary connection
was taken into account, the prediction was closer to the test result than that without
considering the end zone. Therefore, the end zone should be considered in estimating the
initial stiffness.
(2) The large strain hardening of LYP eliminated fracture at link ends and enabled sufficient
plasticity to expand over a large region around link ends. Test results demonstrated that
early energy dissipation, plump hysteretic loops, and elimination of fracture were obtained
by using LYP.
(3) In the double-layer system, one layer of double-tapered links made from conventional steel
and the other of rectangular links made from LYP, both condition assessment and sound
energy dissipation was achieved, which demonstrated a promising dual-function system.
(4) To have a simple connection between double-tapered links and beams, a monolithic plate
including double-tapered links in the middle and two end plates was proposed. The end
plate with a width-depth ratio of 1.5 successfully transferred the majority of the story drift to
the double-tapered links and behaved mainly in plane. Considering a simple connection,
end plates with a minimum width-depth ratio of 1.5 is suggested.
System validation through large-scale tests
In Chapter 6, the performance of condition assessment and energy dissipation was investigated using
four 1/2-scaled shear-wall specimens, two with double-tapered links arranged in one row for
condition assessment and the other two with rectangular links arranged in two rows for energy
dissipation. The major conclusions were summarized as follows.
(1) A monolithic plate with double-tapered links in the middle performed well in achieving

7 - 4
notable torsional deformation at the designed target drift ratios of 0.5%, 1% and 1.5%
respectively, which was the same as that in the specimen having two thicker end plates at
top and bottom. In the monolithic specimen, the end plate with a width-depth ratio of 1.5
behaved mainly in plane and successfully transferred over 85% of the story drift into the
middle double-tapered links, which gave a relatively in-plane rigid connection for
double-tapered links. To have a simple and economical connection for double-tapered links,
a monolithic plate with two end plates having a width-depth ratio no less than 1.5 is
recommended in practical application.
(2) Plump hysteretic loops with nearly no pinching in the slit shear wall made from LYP
demonstrated the sound energy dissipation. Energy dissipation started as early as a drift
ratio of 0.23% and no fracture was observed until the completion of loading with a drift ratio
of 4.2%. In the slit shear wall made from conventional steel, fracture initiated at link ends at
a drift ratio of 1.8% and shear deformation concentrated in one row eventually made
fracture penetrated almost all the links in the lower row at a drift ratio of 3%.
(3) A configuration for a dual-function system was proposed. To have functions of both
condition assessment and energy dissipation, a slit shear wall with rectangular links made
from LYP can be placed in parallel with another shear wall with double-tapered links made
from conventional steel.
(4) A design procedure was proposed for the dual-function system, in which independent
design of the strength and stiffness made the design flexible and rational.

ACKNOWLEDGMENTS
I would like to first express my sincere gratitude to my advisor Professor Masayoshi Nakashima.
His enthusiastic working attitude and determination inspired me to go through my PhD research.
The valuable things I have learned are not only the professional knowledge, but also the way to do a
research through creative thinking, hardworking and rigorous attitude. It is a great honor to work
with him and I would keep those things I have learned in mind and take them as my guideline for
my future.
Special thanks go to Professor Masahiro Kurata. From the early stage of this study, his
comments and patience led me to explore this research. I appreciate a lot of useful help in solving
the met difficulties, both in my research and life in Japan.
Great thanks go to Professor Keiichiro Suita and Professor Yoshio Kaneko for their kindness
in accepting serving on my dissertation committee, thorough views and constructive comments
offered.
Very special thanks go to Professor Huanjun Jiang of Tongji University (China), my former
supervisor, for his encouragement and kindness over these years.
Sincere thanks go to Dr. Kazuhiro Hayashi, Mr. Takuma Togo, Mr. Kei Fukihara and Mr.
Yudai Taniguchi. Without their great efforts, the laboratory tests in this work are not possible to be
conducted smoothly.
I would like to thank Prof. Oren Lavan, Prof. Gang Shi and Prof. Julio Florez Lopez, Dr.
Ryuuta Enokida, Dr. Po-Chien Hsiao, Dr. Xuchuan Lin, Dr. Yundong Shi, Dr. Yunbiao Luo, Dr.
Youngtao Bai, Dr. Hongsong Hu, Mr. Ryusuke Enomoto, Miss Mayako Yamaguchi, Mr. Xiaohua
Li, Mr. Lei Zhang, Mr. Ryosuke Nishi, Miss Kaede Minegishi, Miss Miho Sato, Mr. Hiroyuki
Inamasu, Miss Akiko Suzuki, Miss Ikumi Hamashima, Mr. Hiromichi Nishino, Mr. Shota Shinmoto
and other dear friends outside Nakashima Laboratory for their kindness to help me with any
difficulty I have met in the research and daily life. Gratitude goes to Mrs. Chisato Gamou and Miss
Mami Fukuda for their kind support regarding office matters.
Grateful acknowledgement is given to the Ministry of Education, Science, and Culture,
Government of Japan (Monbusho) for granting me the scholarship which made this study possible.
Finally, I would like to thank my family, especially my parents, for their love and selfless
support and encouragement all these years.
February, 2015
Liusheng HE


![SHEAR WALLS FOR HIGH RISE BUILDINGS [].ppt](https://static.fdocuments.in/doc/165x107/55cf8531550346484b8bb1be/shear-walls-for-high-rise-buildings-wwwebmfilescomppt.jpg)