Development of Steam Hydrogasification Process ... · PDF fileDEVELOPMENT OF STEAM...
49
Energy Research and Development Division FINAL PROJECT REPORT DEVELOPMENT OF STEAM HYDROGASIFICATION PROCESS DEMONSTRATION UNIT‐5 LB/HR PDU DESIGN REPORT SEPTEMBER 2011 CEC ‐ 500 ‐ 2013 ‐ 092 Prepared for: California Energy Commission Prepared by: University of California
Transcript of Development of Steam Hydrogasification Process ... · PDF fileDEVELOPMENT OF STEAM...

Energy Research and Development Div is ion FINAL PROJECT REPORT
DEVELOPMENT OF STEAM HYDROGASIFICATION PROCESS DEMONSTRATION UNIT‐5 LB/HR PDU DESIGN REPORT
SEPTEMBER 2011CEC ‐500 ‐2013 ‐092
Prepared for: California Energy Commission Prepared by: University of California

PREPARED BY: Primary Author(s): Chan Seung Park Joseph M. Norbeck University of California CE-CERT Riverside, CA 92521 951-781-5791 951-781-5790 (fax) Contract Number: 500-09-008 Prepared for: California Energy Commission David Effross Contract Manager Linda Spiegel Office Manager Energy Generation Research Office Laurie ten Hope Deputy Director ENERGY RESEARCH AND DEVELOPMENT DIVISION Robert P. Oglesby Executive Director
DISCLAIMER This report was prepared as the result of work sponsored by the California Energy Commission. It does not necessarily represent the views of the Energy Commission, its employees or the State of California. The Energy Commission, the State of California, its employees, contractors and subcontractors make no warranty, express or implied, and assume no legal liability for the information in this report; nor does any party represent that the uses of this information will not infringe upon privately owned rights. This report has not been approved or disapproved by the California Energy Commission nor has the California Energy Commission passed upon the accuracy or adequacy of the information in this report.

i
ACKNOWLEDGEMENTS
We acknowledge funding from the California Energy Commission (CEC) under Contract Number: 500‐09‐008.

ii
PREFACE
The California Energy Commission Energy Research and Development Division supports public interest energy research and development that will help improve the quality of life in California by bringing environmentally safe, affordable, and reliable energy services and products to the marketplace.
The Energy Research and Development Division conducts public interest research, development, and demonstration (RD&D) projects to benefit California.
The Energy Research and Development Division strives to conduct the most promising public interest energy research by partnering with RD&D entities, including individuals, businesses, utilities, and public or private research institutions.
Energy Research and Development Division funding efforts are focused on the following RD&D program areas:
• Buildings End‐Use Energy Efficiency
• Energy Innovations Small Grants
• Energy‐Related Environmental Research
• Energy Systems Integration
• Environmentally Preferred Advanced Generation
• Industrial/Agricultural/Water End‐Use Energy Efficiency
• Renewable Energy Technologies
• Transportation
Development of Steam Hydrogasification Process Demonstration Unit‐5 lb/hr PDU Design Report is the final report for the Hydrogasification Process project contract number 500‐09‐008 conducted by the University of California. The information from this project contributes to Energy Research and Development Energy‐Related Environmental Research Program.
For more information about the Energy Research and Development Division, please visit the Energy Commission’s website at www.energy.ca.gov/research/ or contact the Energy Commission at 916‐327‐1551.

iii
ABSTRACT
The increasing cost of transportation fuel along with increasing concerns about greenhouse gas emissions globally, including California, underlies a critical need to develop sustainable alternative transportation fuels. California needs to produce nearly 2.4 billion gasoline gallon equivalents per year of alternative transportation fuels in order to meet the State Alternative Fuels Plan 2017 petroleum reduction objectives. Currently, California imports more than 95 percent of the biofuels it uses. Ramping up in‐state biofuel production without competing with existing cropland will be difficult unless other, non‐crop biomass resources can be used. Thermochemical production of alternative transportation fuels such as substituted natural gas, synthetic diesel or synthetic gasoline derived from renewable sources offers a viable solution for addressing these concerns. This project successfully demonstrated steam hydrogasification reaction technology using co‐mingled biosolids and biomass as the feedstock in a laboratory scale process demonstration unit. The steam hydrogasification technology was able to produce various forms of energy products from carbonaceous resources. The researchers also completed a preliminary modeling evaluation and design for a pilot plant with a capacity of five tons per day using the process demonstration unit technology. The plant design included a block flow diagram with process mass, energy balance and process and utility flow diagrams. In addition, the researchers conducted preliminary economic analyses for a 3,500 bone dry tone per day substituted natural gas plant using biosolid and green waste as feedstock. The authors concluded that the results of this project warranted moving forward with plans for a demonstration pilot plant at a waste treatment facility.
iv
TABLE OF CONTENTS
Acknowledgements ................................................................................................................................... i
PREFACE ................................................................................................................................................... ii
ABSTRACT .............................................................................................................................................. iii
TABLE OF CONTENTS ......................................................................................................................... iv
LIST OF FIGURES .................................................................................................................................... v
LIST OF TABLES .................................................................................................................................... vi
EXECUTIVE SUMMARY ........................................................................................................................ 1
Introduction ........................................................................................................................................ 1
Project Purpose ................................................................................................................................... 1
Project Results ..................................................................................................................................... 1
Project Benefits ................................................................................................................................... 2
Chapter 1: Introduction ........................................................................................................................... 3
Chapter 2: Project Deliverables ............................................................................................................. 4
2.1 Goals of agreement .................................................................................................................... 4
2.2 Technical Performance Objectives ........................................................................................... 4
2.3 Deliverables of Technical Tasks ............................................................................................... 5
Chapter 3: PDU design ............................................................................................................................ 7
3.1 Feedstock Pretreatment Unit .................................................................................................... 7
3.2 Feed PumpDesign ...................................................................................................................... 8
3.3 H2 supply source ...................................................................................................................... 11
3.4 Fluidized Bed Reactor Design ................................................................................................ 14
3.5 Computer Simulation of SHR Process .................................................................................. 17
3.6 Mass Flow Measurement Design for PDU ........................................................................... 21
3.7 Gas Cleanup System and Steam Methane Reformer .......................................................... 22
Chapter 4: PDU Engineering ................................................................................................................ 26
4.1 Lab Scale Batch Reactor Test for the Basic Design Parameter ........................................... 26
4.2 Mock up test ............................................................................................................................. 28

v
4.3 PDU Detailed Engineering ..................................................................................................... 29
Chapter 5: PDU Operation Result ....................................................................................................... 30
5.1 PDU test .................................................................................................................................... 30
Chapter 6: Pilot Plant Design ............................................................................................................... 35
6.1 Pilot plant modeling ................................................................................................................ 35
Chapter 7: Summary of Results ........................................................................................................... 39
GLOSSARY .............................................................................................................................................. 40
LIST OF FIGURES
Figure 3‐1: Hydrothermal Reactor Design ............................................................................................. 8
Figure 3‐2: Flow sheet of CE‐CERT Hydrothermal Pretreatment (HTP) ........................................... 8
Figure 3‐3: Type of pumps branch structure .......................................................................................... 9
Figure 3‐4: The schematic diagram of the switchover system ........................................................... 12
Figure 3‐5: Bulk Hydrogen Tank ........................................................................................................... 13
Figure 3‐6: Molar fraction of CH4, CO and CO2 at different gasification temperature ................. 20
Figure 3‐7: Block Flow Diagram of Mass Flow Instrumentation for SHR process ......................... 21
Figure 3‐8: Schematic Diagram of Sulfur and Particle Removal System ......................................... 24
Figure 4‐1: Schematic diagram of the inverted batch reactor ............................................................ 27
Figure 4‐2: A comparison of carbon conversion in the steam hydrogasification of biomass feedstock and co‐mingled feedstock ..................................................................................................... 28
Figure 5‐1: Steam pump (Hz) vs volume flow rate (ml/min) ............................................................ 30
Figure 5‐2: Reactor Temperature vs volume flow rate (ml/min) ....................................................... 31
Figure 5‐3: Temperature profile. Total recorded time was 5 hr. (2 hr per tick mark) .................... 31
Figure 5‐4: Temperature profile as a function of reactor height (Distance from Top) ................... 32
Figure 5‐6: Typical process operation curve o PDU system .............................................................. 33
Figure 6‐1: Schematic of SHR with WGS .............................................................................................. 35
Figure 6‐2: H2availability with gasification temperature at 650oC, 750oC and 850oC ................. 36
Figure 6‐3: Mass and heat balance of pilot plant with gasification temperature at 650oC ............ 37
Figure 6‐4: Mass and heat balance of pilot plant with gasification temperature at 750oC ............ 37

vi
Figure 6‐5: Mass and heat balance of pilot plant with gasification temperature at 850oC ............. 38
LIST OF TABLES
Table 2‐1: Project deliverables and related section in the report ......................................................... 5
Table 3‐1: Properties and flow rate of fluid .......................................................................................... 10
Table 3‐2: Assumptions of PDU hydrogen supply ............................................................................. 11
Table 3‐3: Parameters of two H2 supply options (Hydrogen K 6PK and Hydrogen T 12PK) ....... 12
Table 3‐4: Cost evaluation of hydrogen gas cylinder systems ........................................................... 12
Table 3‐5: Parameters of hydrogen skid system .................................................................................. 13
Table 3‐6: Cost evaluation of hydrogen generator and on‐site plant ............................................... 13
Table 3‐7: Cost evaluation of H2 supply systems................................................................................. 14
Table 3‐8: Physical properties of silica sand in fluidized reactor ...................................................... 15
Table 3‐9: Physical properties of hydrogen gas flow in fluidized reactor ....................................... 15
Table 3‐10: Fluidized bed reactor design summery ............................................................................ 17
Table 3‐11: Feedstock composition in PDU test ................................................................................... 19
Table 3‐12: PDU mass and energy balance from simulation ............................................................. 19
Table 3‐13: Characteristics of Sulfur Sorbent and Design Criteria .................................................... 22
Table 3‐14: Catalyst Properties ............................................................................................................... 24
Table 4‐1: Experiment conditions for SHR of co‐mingled feedstock and biomass feedstock ....... 26
Table 4‐2: A comparison of the rate of CH4, CO and CO2 formation in the steam hydrogasification of biomass feedstock only and co‐mingled feedstock ........................................ 28
Table 4‐3: Fluidized bed mock up test operation condition............................................................... 29
Table 5‐1: Summarizes measured performance of PDU in final state .............................................. 34
Table 6‐1: Maximum H2/C molar at different gasification temperature .......................................... 36
1
EXECUTIVE SUMMARY
Introduction The increasing cost of transportation fuel along with increasing concerns about greenhouse gas emissions globally, including California, underlies a critical need to develop sustainable alternative transportation fuels. California needs to produce nearly 2.4 billion gasoline gallon equivalents per year of alternative transportation fuels in order to meet the State Alternative Fuels Plan 2017 petroleum reduction objectives. Currently, California imports more than 95 percent of the biofuels it uses. Ramping up in‐state biofuel production without competing with existing cropland will be difficult unless other, non‐crop biomass resources can be used. Thermochemical production of alternative transportation fuels such as substituted natural gas (SNG), synthetic diesel or synthetic gasoline derived from renewable sources offers a viable solution for addressing these concerns.
Project Purpose The goals of this project were to demonstrate steam hydrogasification reaction (SHR) technology using co‐mingled biosolids and biomass as the feedstock in a laboratory scale process demonstration unit (PDU) and to provide a preliminary modeling evaluation and design pilot scale facility with a capacity of five tons per day.
Project Results An SHR reactor was developed at the University of California, Riverside (UCR) that could produce various forms of energy products from carbonaceous resources. The reactor could handle wet feedstock without drying, did not require expensive oxygen plants and operated at lower temperature than any other conventional gasification process. Each of these properties offered an advantage compared to other thermochemical gasification processes. The demonstration of the SHR technology showed it was the most efficient and economic thermochemical gasification process when compared with other existing technologies.
The PDU was designed, fabricated and operated in the UCR gasification laboratory. A steam methane reforming (SMR) reactor was integrated with the PDU to maximize synthesis gas production. The efficient production of synthesis gas at a temperature range of 650‐750 degrees centigrade (°C), an ethylene (H2/C) mole ratio of 1.0, and water/feedstock mass ratio of two was demonstrated. These initial conditions were determined based on batch scale tests and the ASPEN simulation results. ASPEN is a FORTRAN‐based deterministic steady‐state chemical process simulator developed by the Massachusetts Institute of Technology (MIT) for the Department of Energy (DOE) to evaluate synthetic fuel technologies. It was found that under these conditions SNG can be produced at the rate of 1.2 gigajoules (GJ) per day from a feedstock flow rate of 0.1 tons per day.
A preliminary design of a pilot plant with a capacity of five tons per day was completed. A block flow diagram with process mass and energy balance and process and utility flow diagrams was developed.

2
In addition, preliminary process economic analyses were completed for a 3,500 bone dry tonne (BDT) per day substituted natural gas (SNG) plant using biosolid and green waste as feedstock. It was estimated that the SNG production cost is 4.39 per million British thermal units (BTUs) with an internal rate of return (IRR) of 16.68 percent. Feedstock cost and feedstock delivery cost were not taken into consideration and the economic results should be considered highly uncertain. Nevertheless, this initial economic analysis provided considerable confidence for moving forward with the pilot plant design and evaluation.
The authors concluded that the results of this project warranted moving forward with plans for a demonstration pilot plant at a waste treatment facility.
Project Benefits This project demonstrated that steam hydrogasification technology could produce various forms of energy from renewable resources that could be used as alternative transportation fuels. If this technology is successfully demonstrated at a pilot plant, it could contribute toward meeting California’s State Alternative Fuels Plan 2017 objectives. Increased use of alternative transportation fuels will help reduce greenhouse gas emissions that contribute to climate change.
.

3
Chapter 1: Introduction California needs to produce nearly 2.4 billion gasoline gallon equivalents per year of alternative transportation fuels in order to meet the State Alternative Fuels Plan 2017 petroleum reduction objectives. Currently, California imports more than 95 percent of the biofuels used in‐state. Ramping up in‐state biofuel production without competing with existing cropland will be difficult unless other, non‐crop biomass resources can be used.
A recent California biomass availability assessment found that California generates approximately 83 million dry tons of biomass wastes per year creating various unresolved waste disposal issues for agricultural and forestry biomass residue streams. In addition, there are large volumes of biosolids resulting from statewide wastewater treatment facilities. There is approximately 32.1 million dry tons of biomass available every year for fuel production when sustainability and harvesting efficiency factors are considered. Further research and development is required to establish commercially‐viable waste‐to‐energy conversion technologies that can simultaneously contribute supplies of renewable transportation fuels and reduce statewide levels of waste going to landfills. Biosolids, municipal wastes and other carbonaceous wastes are important sources of renewable carbon that are very under‐ utilized. Using such feedstock will yield transportation fuels with low net fuel cycle emissions while helping mitigate the disposal problems associated with these materials. Typically, these feedstocksdo not lend themselves to large capacity commercial facilities because the feedstock amounts needed are seldom available within a reasonable transportation distance. In addition, these feeds typically contain a significant amount of moisture that must be dried or processed along with the feed. Hence, technologies used to process these feeds must be commercially viable in smaller scales and also be able to accommodate diverse, local feedstocks including wet carbonaceous matter.
This project is to developa promising new waste‐to‐energy technology based on the Steam Hydrogasification Reaction (SHR), which has undergone several years of laboratory‐scale research and development by the University of California (UC) Riverside, College of Engineering, Center for Environmental Research and Technology (CE‐CERT). A Process Demonstration Unit (PDU) of the SHR processhas beendesigned, built and operated at the CE‐CERT facilities under this project. A gas cleanup system was also demonstrated to remove contaminants from the product of the SHR to supply a clean output gas to a Steam Methane Reformer (SMR). The primary feedstock for this demonstration was biosolids from the City of Riverside wastewater treatment system co‐mingled with biomass (green woody waste) diverted from a local landfill.The primary product was a mixture of hydrogen and carbon monoxide (aka syngas), which can be converted into sustainable liquid transportation fuels with downstream fuel processing technology (diesel, gasoline, and jet fuel). An important partner in this project wasthe City of Riverside who provided the green waste and biosolids.

4
Chapter 2: Project Deliverables 2.1 Goals of agreement The goals of this agreement are to:
• Demonstrate and validate a feedstock pretreatment system to produce a pumpable slurryfrom the comingled biomass/ biosolids feedstock that will be used in the SHR process, achieving a feedstock supply rate of 0.1 ton per day (10 pounds per hour) for 24 hours of continuous operation.
• Demonstrate and validate the SHR process for the efficient conversion of the biomass and biosolids slurry produced by the pretreatment system into a producer gas, in an SHR reactor processing 0.1 ton per day (10 pounds per hour) of feedstock.
• Demonstrate and validate the syngas cleanup system and SMR that remove the contaminants from the producer gas and convert it into syngas of adequate quality to support SMR operation (as specified further in the Technical Performance Objectives).
• Complete the basic engineering design for a 5 tons/day scale pilot plant using key information obtained through the PDU demonstration.
2.2 Technical Performance Objectives The objectives of this agreement are to:
1. (Task #2) Validate the performance and product quality of the feed pretreatment process of the PDU under the optimum conditions.The target specifications for the product composition are:
a) Rheological Properties Solid loading of the slurry >30% Viscosity < 1 centi P
b) Material Loss CO2: < 10 Vol% C1–C6: < 500 ppmv
2. (Task #3) Validate the production and quality of producer gas from the SHR process of PDU under the optimum operating conditions. The target specifications for the producer gas composition are:
a) Producer Gas Yield and Energy Content Yield (dry basis) >1200 kg / ton of feed Energy content of the producergas (HHV) >15GJ/ ton of feed
b) Producer Gas Composition – dry basis (pre clean‐up) H2: 55‐70 Vol% CO: 5‐20Vol% CH4: 5‐20Vol% CO2: < 25 Vol% Tars: <3 mg/m3

5
Sulfur: <150 ppmv NH3: < 0.05 Vol%
3. (Task #4) Validate the production and quality of syngas from the combined SHR, gas cleanup and SMR units of the PDU under the optimum operating conditions. The target specifications for the producer gas composition are:
a) Syngas Production and Energy Content Syngas yield (dry basis) >1200 kg/ ton of feed Energy content atambient conditions (HHV) >12 GJ/ ton of feed
b) Syngas Composition – dry basis (post clean‐up) H2: 50‐80Vol% CO: 15‐30 Vol% CH4: < 5Vol% CO2: 5‐20Vol% Tars/Waxes: < 0.05 mg/m3
Sulfur: < 0.01 ppm 4. (Task #5) Develop the basic engineering design of the 5 tons per day pilot plant to be sited
at the wastewater treatment facility in Riverside, CA or at another city site. This basic engineering design of the pilot plant will allow both technical and economic feasibility analysis of a commercial scale process. The design of the pilot plant shall contain the following deliverables. ‐Block Flow Diagram ‐Process & Utility Flow Diagrams ‐Heat& Mass Balances ‐Plant Layouts & Equipment Arrangement Plan ‐Equipment, Vessel Specification / List ‐Long Lead Item List ‐Estimated Project Cost
2.3 Deliverables of Technical Tasks Table 2‐1 in below summarizes the outcome of the project performance to show whether project deliverables of the technical tasks, which originally set by the contract, were attained together with the section to which outcome is describedin details.
Table 2-1: Project deliverables and related section in the report
Task # Deliverables Section in this Report 2 • Pretreatment Process Test Plan
• Batch Unit Process Design Flowsheet • Optimum Process Conditions Report • Continuous Unit Process Design Flowsheet • Final Pretreatment Process Test Report
Section 3.1 Appendix A-B
3 • Steam Hydrogasification Process Demonstration Test Plan Report
• SHR Detailed Design Flowsheet
Section 3.2-3.6 Section 5.1 Appendix C, D, E

6
Task # Deliverables Section in this Report • Process Mass and Energy Balance Report • Process Performance Results Report
4 • SHR with Gas Cleanup and SMR Demonstration Plan Report
• Gas Cleanup Process Detail Design Flowsheet • SMR Process Detail Design Flowsheet • SHR, Gas Cleanup and SMR Integrated
Operation Results Report
Section 3.7 Section 5.1 Table 5.1
5 • Block Flow Diagram with Process Mass and Energy Balance of Pilot Plant
• Process & Utility Flow Diagrams for Pilot Plant • Plant Layouts & Equipment Arrangement Plan
Diagram for Pilot Plant • Equipment, Vessel Specification, List-Long
Lead Item List for Pilot Plant and Bill • of Material • Final Project Report
Section 6 Appendix F, G

7
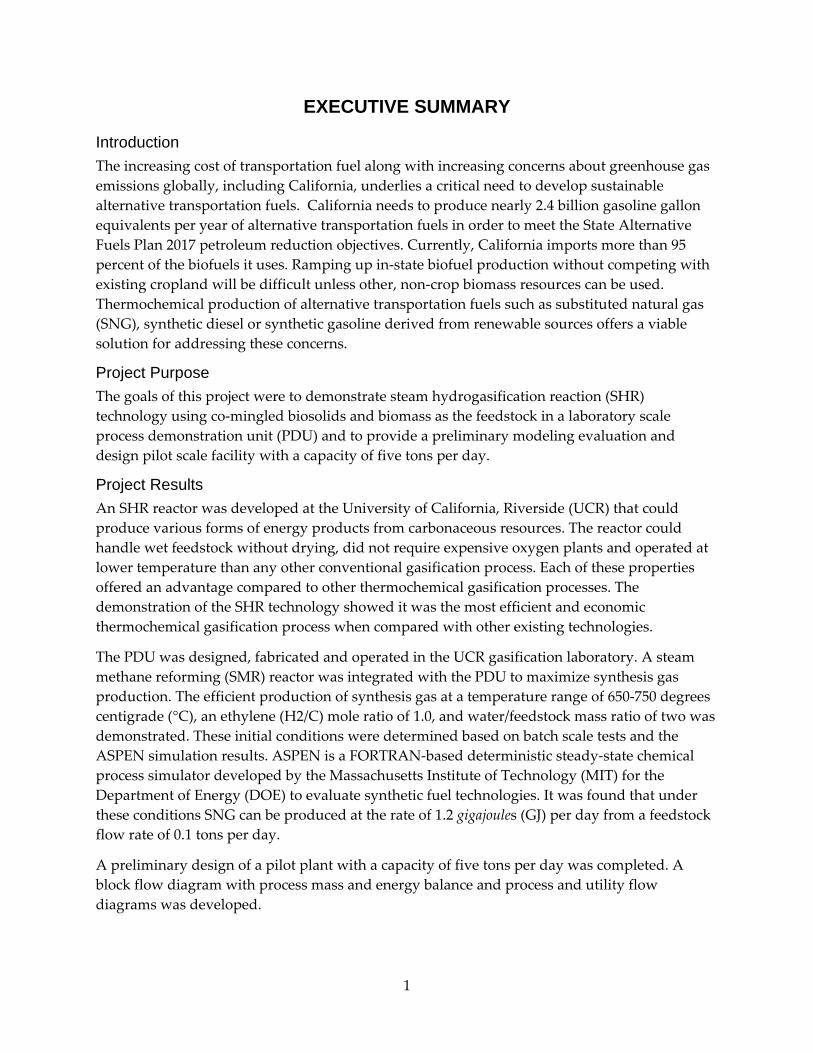
Chapter 3: PDU design 3.1 Feedstock Pretreatment Unit Previous research reveals that the feeding of biomass feedstock, such as wood wastes and biosolids, into a pressurized reactor poses technical challenges. Conventional methods of feeding materials into a pressurized gasifier, such as screw feed and locker hoper, are unreliable and operationally expensive. To handle and transport biomass feedstocks in a cost and energy efficient manner, a pumpable slurry of biomass feedstocks with high energy and carbon content is much more favorable. Additionally, the high moisture content in biomass also favors a wet feeding method. Biomass slurries are not formed by simply mixing the wood wastes and biosolids. There are two reasons for this: 1) the low energy and carbon content in wood wastes and biosolids, 2) hygroscopic and hydrophilic nature of wood wastes. In order to prepare pumpable wood wastes and biosolids slurries with high energy and carbon content, a pre‐processing step has to be implemented. This has been achieved by using a Hydrothermal Pretreatment (HTP) process developed by our research group. The HTP system assembly, shown in Figure 3‐1(a) will be operated in the stirred batch configuration. The hydrothermal reactor with temperature and pressure transducer, controller, 3 zone electric heater, serpentine cooling coil and coolant recycling system were designed by our research team and fabricated by Parr Instrument Company. The system controller box, magnetic stirrer with electric motor and the pneumatic lift support frame were designed and fabricated by Parr Instrument Company.
The hydrothermal reactor is made of 316‐stainless steel. chosen because of its high nickel and molybdenum concentration and the resultant corrosive resistance to sulfuric, phosphoric, and acetic acids. Preliminary test results from a mini batch HTP reactor showed slight acidity of the slurry products (pH of 3 to 4), which is mainly due to acetic acid produced from the wood wastes and biosolids. The hydrothermal reactor has a volumetric capacity of 5 gallons. A magnetic stirrer which is powered by an electric motor is implemented to rotate the agitator inside. The reactor is heated by a 3 zone electric heater jacket, as shown in Figure 3‐1. A serpentine cooling coil with a coolant circulating system is implemented to transfer heat out of the hydrothermal reactor, as shown in Figure 3‐2. The hydrothermal reactor assembly was installed in the CE‐CERT gasification laboratory with calibration gas, coolant supply and power cord installation. A computer assisted control system with remote control software, provided by Parr Instruments, was connected to the hydrothermal slave box controller. The further details of the HTP system description can be found in the APPEDIX section of the report.
8
Figure 3‐1: Hydrothermal Reactor Design
Figure 3-2: Flow sheet of CE-CERT Hydrothermal Pretreatment (HTP)
3.2 Feed PumpDesign High pressure pumps are used in a wide range of industrial and residential applications. They can be used for domestic, commercial, industrial and agricultural servicesand municipal water

9
and wastewater services.Pumps are divided into two fundamental types based on the manner in whichthey transmit energy to the pumped media: dynamic or positive displacement. The type of pump is shown in Figure 3‐3. Fluid properties,end use requirements, and environmental conditions should be considered while choosing pump [2].
Figure 3-3: Type of pumps branch structure
Fluid Properties
The properties of the fluids being pumped can significantly affect the choice of pump. Key considerations include:
• Acidity/alkalinity (pH) and chemical composition. Corrosive and acidic fluids can degrade pumps, and should be considered when selecting pump materials.
• Operating temperature. Pump materials and expansion, mechanical seal components, and packing materials need to be considered with pumped fluids that are hotter than 200°F.
• Solids concentrations/particle sizes. When pumping abrasive liquids such as industrial slurries, selecting a pump that will not clog or fail prematurely depends on particle size, hardness, and the volumetric percentage of solids.

10
• Specific gravity. The fluid specific gravity is the ratio of the fluid density to that of water under specified conditions. Specific gravity affects the energy required to lift and move the fluid, and must be considered when determining pump power requirements.
• Vapor pressure. A fluid’s vapor pressure is the force per unit area that a fluid exerts in an effort to change phase from a liquid to a vapor, and depends on the fluid’s chemical and physical properties. Proper consideration of the fluid’s vapor pressure will help to minimize the risk of cavitation.
• Viscosity. The viscosity of a fluid is a measure of its resistance to motion. Since kinematics viscosity normally varies directly with temperature, the pumping system designer must know the viscosity of the fluid at the lowest anticipated pumping temperature. High viscosity fluids result in reduced centrifugal pump performance and increased power requirements. It is particularly important to consider pump suction‐side line losses when pumping viscous fluids.
End Use Requirements—System Flow Rate and Head
From the product of the HTP system, typical fluid characteristics was investigated and summarized in Table 3‐1.
Table 3-1: Properties and flow rate of fluid
Product Content nominal Composition of fluid Biosoild (DAFT)
with Biomass 40% soild
Product temperature oC 25 Specific gravity Approx. 1.2
Particle size μm <150 PH value Approx. 5-7
Solid content (w/w) Approx. %TS 40 Dynamic viscosity Approx. CPS 1000
Vapor pressure PSI N/A Flow rate L/hour 15-20
Based on the properties of fluid and flow rate, progressive cavity pump, belonging to positive displacement pumps, was recommended. A progressive cavity type pump was chosen since it has no pulsating and delivers a more even flow. Progressive cavity pumphave many applicationsin industrial processes, construction, wastewatertreatment, oil field service, pulp and paper processes, and food processing.
Advantages of progressive cavity pump:
• Wide range of flows and pressures.
• Wide range of liquids and viscosities
• •Low internal velocities.

11
• Self‐priming, with good suction characteristics.
• High tolerance for entrained air and gases.
• Minimum churning or foaming.
• Pulsation‐free flow and quiet operation.
• Rugged design — easy to install and maintain.
• High tolerance to contamination and abrasion
For the selection of specific type of the progressive cavity pump, MEMO pump (N‐ELOR NM015BO02S12B) provided by METZSCH Pumps North America Company was designed to be used for PDU pump design. In order to solve the problem of settling of slurry produced by pretreatment process, the slurry will be mixed in the tank before going into pump. The further detailed technical parameters of pump used in the PDU are given in APPENDIX C.
3.3 H2 supply source Evaluation of hydrogen supply system for steam hydrogasification is part of development of PDU process. This section describes the design of hydrogen supply method.Amount of hydrogenrequired in the SHR process are given in Table 3‐2. These values were obtainedfrom the “SHR Detailed Design Flow‐sheet” and “Process Mass and Energy Balance Report” which were the deliverable of the Task#3 of the program.Consumption of H2was estimated to 178.6ft3/hour, 5715ft3/week or 22860ft3/month.
There are three options;1) industrial grade H2supply system including gas cylinders (6 pack or 12pack);2) bulk hydrogen tank (trailer or skid) and 3) hydrogen generator. These options are compared in term of capital cost, operating cost, safety, space requirement and other factors.
Table 3-2: Assumptions of PDU hydrogen supply
Mass flow rate of H2 0.205 kmole/hr Volume of H2 consume 176.6 ft3/hr at 1 atm PDU maximum working time 8hr/day, 32hr/week, 4 week/month Purity of H2 Industrial grade 99.95%
Hydrogen Gas Cylinder
This option provides H2from hydrogen gas cylinders. It is convenient for direct delivery from Praxair Inc or other gas company. There are two cylinder sizes available for the industrial grade H2. K size and T size cylinder contain the hydrogen volume of 196 ft3 and 261 ft3 which can support 1 hour and 1.4 hours supply time for PDU operation, respectivelybased on the use of 95 percent volume. Hence, 6 or 12 cylinders in package of gas cluster are needed for large volume H2requirement. Hydrogen K 6PKand Hydrogen T 12PK are chosen as two options for PDU H2

12
supply. Table 3‐3 lists some parameters of Hydrogen K 6PK and Hydrogen T 12PK. Cost evaluation is presented in Table 3‐4.
Table 3-3: Parameters of two H2 supply options (Hydrogen K 6PK and Hydrogen T 12PK)
Package mode Volume Supply time Refill per month
Hydrogen K 6PK 1176 ft3 6 hr 22 Clusters Hydrogen T 12PK 3132ft3 16.8 hr 8 Clusters
Table 3-4: Cost evaluation of hydrogen gas cylinder systems
Package mode Quotation Delivery fee Rental fee Cost per month Cost per year
Hydrogen K 6PK $90 $20 $50/month $2,470 $29,640 Hydrogen T 12PK $254 $34 $96/month $2,400 $28,800
H2 supply system is expected to provide H2to the SHR process continuously. However, the refilling of gas clusters will cause the shutting down of H2 supply system. Therefore, automatic switchover system is necessary to provide the continuous H2 delivery. Fig 3‐4 shows the schematic diagram of the Switchover system. It can provide automated switchover control and gas delivery up to ‘10’ cylinders.
Figure 3-4: The schematic diagram of the switchover system
Gas company also provides small size H2 tank for costumes that need large hydrogen volume. It is called hydrogen on skid (seen in the picture above). Table 3‐5 shows the parameters of

13
hydrogen skid system provided by Praxair Inc. Compared with hydrogen gas cylinder,this system has large hydrogen volume for one‐month continuous H2 supply.
Figure 3-5: Bulk Hydrogen Tank
Table 3-5: Parameters of hydrogen skid system
System skid size H2 volume supply time refill per month
Hydrogen skid 14.5×5.5×5.5 ft 24,000 ft3 136 hr 1 skid
The advantages of hydrogen skid include: high utilization rate, little maintenance requirement, a one‐month continuous supply and lower cost for long‐time running. However, the skid system requires an installation of fix to ground. And also it requires site survey approval and a 12moth product supply agreement. The setup procedure is not easy and convenient compared with direct delivery of hydrogen gas cluster.
Hydrogen Generator or on‐site plant
Hydrogen generators can produce pure hydrogen through the electrolysis of pure water. HGH series hydrogen generators series from Angstrom Advanced Incare light, highly effective, energy‐saving and environmentally friendly. Table 3‐6 lists the total cost of hydrogen generator and on‐site plant. The quotation is from Angstrom Advanced Inc.
Table 3-6: Cost evaluation of hydrogen generator and on-site plant
System Output Volume Quotation Operation fee Cost per year
Hydrogen Generator 176.6 ft3/hr $135,000 $104/month $136,248 Hydrogen on-site plant 423.8 ft3/hr $165,000 $1040/month $177,480
14
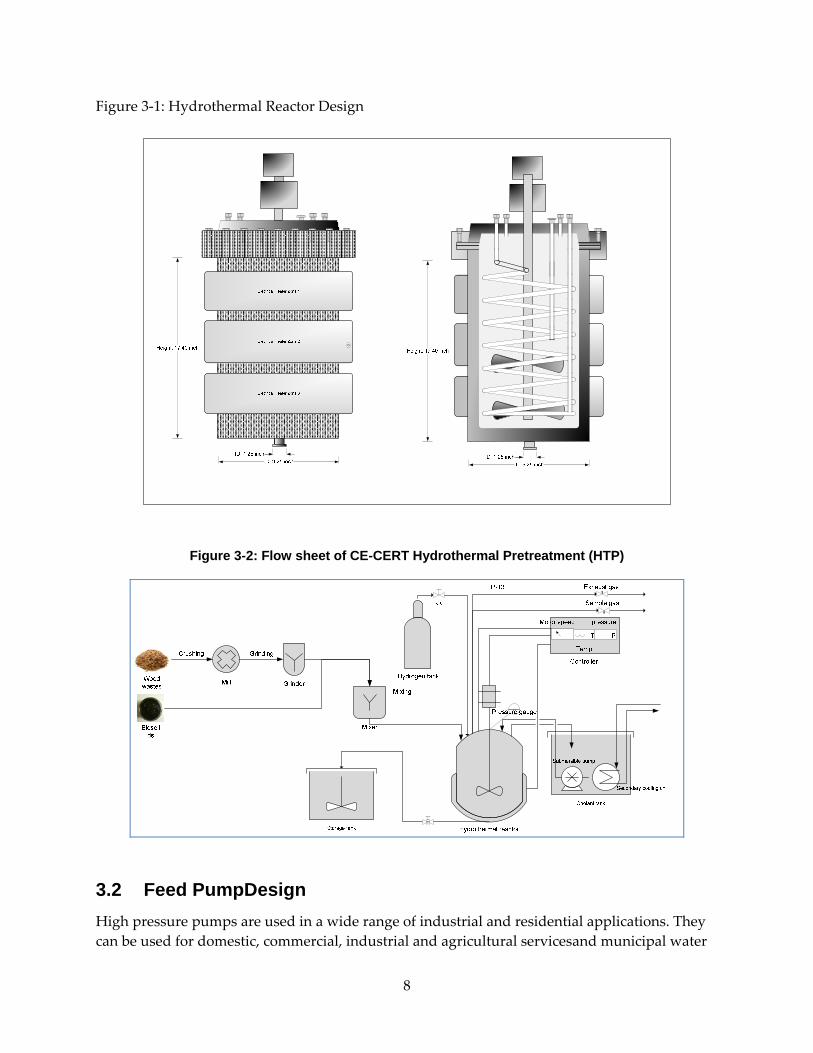
Generator or small on‐site plant is good option for long‐term program more than several years. This option can supply analysis grade H2 with purity 99.99 percent. Comparison of H2 supply systems Table 3‐7 lists the cost evaluation of H2 supply systems. The operating and investing costs were both included in this analysis. Investment cost was the major factor to determine the H2 supply system for PDU process. PurchasingH2 from gas delivery Inc. was chosen for the SHR PDU project. It was seen that the hydrogen on skid system has the lowest cost. However, site survey shows that it is unavailable to install the skid outside of CE‐CERT lab building. Therefore, the hydrogen K cylinder in 6 packages with switchover system was used for of H2 supply system in PDU process.
Table 3-7: Cost evaluation of H2 supply systems
Options Total cost Continuous supply Switchover Hydrogen K 6PK $29,640 Yes
Hydrogen T 12PK $28,800 No Hydrogen on skid $26,040 Yes
Hydrogen generator $136,248 Yes Hydrogen plant $177,480 Yes
3.4 Fluidized Bed Reactor Design The project team chose the fluidized bed reactor in a bubbling‐slugging fluidizing regime as the reactor for SHR process. In addition to their long history of being used as chemical process reactors and high heat transport rates, bubbling beds are also well‐known for their reliability when used with biomass gasification. Residence time of the reactor is expected to be over 10 seconds. Longer residence time is favored because of slower gasification rate compared to partial oxidation reaction. There are four parts in the reactor system: a fluidized bed reactor where the main chemical reaction occurs, a distributor that controls the gas inlet, a cyclone to collect sands that are taken out of the reactor by gas flow and a gas chamber. Nominal reactor temperature of750°C and pressure of 400 Pisa in the atmosphere of hydrogen and steam were chosen for the design basis. Silica sand provided by U.S Silica Company was used as inertia material in the fluidized bed. Other important physical properties are listed in Table 3‐8 and Table 3‐9. Sand is assumed to be uniformly spherical.

15
Table 3-8: Physical properties of silica sand in fluidized reactor
Diameter (µm) Density (g/cm3) 150 2.65
Table 3-9: Physical properties of hydrogen gas flow in fluidized reactor
Temperature (°C) Pressure (atm) Density (g/cm3) Viscosity (N-s/m3) 750 10.2 2.43E-4 1.90E-5
Symbols used in fluidized bed calculation is summarized below
Umf minimum fluidization velocity Ums minimum slugging velocity Ut terminal fluidization velocity U fluidization velocity Re Reynold number Ar Archemedes number dp solid particle diameter D reactor inner diameter DB fluidization bubble diameter ρg gas density ρs solid density µ gas viscosity HL cticial slugging bed height Hmf minimum fluidization bed height H0 minimum bed height Hmax maximum bed height under fluidization velocity U TDH Transport disengagement height Rs ideal bed height
Reactor Dimension
The reactor is 14 feet in height with an outer diameter of 10.0cm and an inner diameter of 9.40cm. Calculation of fluidized bed height and gas velocity as well as some other important parameters is listed as follows:
Minimum fluidization velocity (Umf)

16
Umf is the minimum gas velocity that can support the particles in the reactor. Reynold number and Archimedes number are involved in the calculation of Umf (Wen and Yu).
Remf (3-1)
(3-2)
Remf (3-3)
Thus we can obtain the value of Umf through Eq. (3‐3). Here Umf= 0.019m/s.
Minimum slugging velocity (Ums)
Ums is the minimum superficial gas velocity for a slugging bed. As the size of bubbles grows, the wall of the reactor is playing greater roles on fluidization. Transition from a bubbling bed to a slugging bed begins when the bubble diameter reaches the reactor diameter. We use Ums as the upper limit for fluidization velocity in our design. According to Baeyens and Geldart, if the bed height is lower than the critical bed height HL=1.3D0.175 (3‐4) where bubble coalescence is complete,
(3-5)
If the bed height exceeds HL then
(3-6)
Ums is the gas velocity at the transition to a slugging bed, which is the desired fluidization gas flow rate. Since longer residence time is preferred, we use Eq. (3‐6) of the deeper bed model. Thus Ums=0.086m/s.
Terminal velocity (Ut)
Terminal velocity is the maximum superficial gas velocity and it is also based on physical properties of sand and gas in the reactor (Souza ‐ Santos). Ut is an important reference in fluidized bed design.
Ut (3-7)
Ut=2.06m/s.
Transport disengagement height (TDH)
TDH is the vessel height required for disengaging larger particles from further upward movement.
TDH=9.55Ar‐0.56Re0.75 (unit: m) (3‐8)

17
Ideal height= Rs (bed height+TDH)×1.2 2 (3‐9)
TDH=0.08m. If ideal height is assumed to be 4.27m (total height of the reactor), H 3.48m.
Maximum slugging bed height
According to Davidson and Harrison,
(3-10)
This could be rearranged into
(3-11)
which is the ratio of maximum slugging bed height and origin bed height. Assuming that Hmax=4.27m at U=Ums, Hmax/H0=1.20, H0 = 3.56m. But according to Eq. (3‐9), bed height should be less than 3.48m. So we choose 3.48m as the final bed height design.
Summary
Table 3-10: Fluidized bed reactor design summery
Reactor inner diameter (cm)
Reactor total height (m)
Sand size (micron)
Bed height
(m)
Bed pressure
(atm)
Temperature (°C)
Gas velocity
(m/s)
9.40 4.27 150 3.48 10.2 750 0.019-0.086
3.5 Computer Simulation of SHR Process Overview of Aspen plus ASPEN is a FORTRAN‐based deterministic steady‐state chemical process simulator developedby the Massachusetts Institute of Technology (MIT) for the Department of Energy (DOE) to evaluate synthetic fuel technologies. The ASPEN framework includes a number of generalized unit operation “blocks”, which are models of specific process operations or equipment (e.g., chemical reactions, pumps). By specifying configurations of unit operations and the flow of material, heat, and work streams, it is possible to represent a process plant in ASPEN. In addition to a varied set of unit operations blocks, ASPEN contains an extensive physical property database and convergence algorithms for calculating results in closed loop systems, all of which make ASPEN a powerful tool for process simulation. ASPEN uses a sequential modular approach to flowsheet convergence. In this approach, mass and energy balances for individual unit operation blocks are computed sequentially, often in

18
the same order as the sequencing of mass flows through the system being modeled. However, when there are recycle loops in an ASPEN flowsheet, stream and block variables have to be manipulated iteratively in order to converge upon the mass and energy balance. ASPEN has a capability for converging recycle loops using a feature known as “tear streams”. In addition to calculations involving unit operations, there are other types of blocks used in ASPEN to allow for iterative calculations or incorporation of user‐created code. These include design specifications and FORTRAN blocks. A design specification is used for feedback control. Any flowsheet variable or function of flowsheet variables can be set to a particular design value by the user. A feed stream variable or block input variable is designated to be manipulated in order to achieve the design value. FORTRAN statements can be used within the design specification block to compute design specification function values. SHR simulation All of the gaseous and liquid components used in the SHR simulation were described as distinct molecular species using Aspen’s own component properties database. Thermodynamics for the gasification and downstream unit operations are estimated by Peng–Robinson equation (PR) for high temperature, high pressure phase hydrocarbon behavior. The biosolid, biomass and ash components were modeled as non‐conventional components using proximate and ultimate date to calculate the chemical and physical property.
The enthalpy model for the nonconventional components is HCOALGEN and the density model is DCOALIGT. The HCOALGEN model includes a number of empirical correlations for heat of combustion, heat of formation and heat capacity. All other values used were retrieved from the Aspen plus database. The whole simulation is controlled using FORTRAN routines (calculator blocks) and design specifications. Material, energy and carbon balances were given for each process unit and no detailed chemical kinetic models were considered in the simulation.
The SHRis simulated using decomposition and gasification units. These units are based on built‐in Aspen reactor blocks and calculate the equilibrium composition in the reactor under the given conditions by means of Gibbs free energy minimization. The decomposition block converts the non‐conventional feedstock into its basic elements, such as C (solid), H2, O2 and N2, on the basis of yield information using the RYIELD block and the gasification block calculates the equilibrium product gas composition using the RGIBBS block.

19
Table 3-11: Feedstock composition in PDU test
Proximate
Compound Biosolid Pine wood Volatile Matter 60.25 82.54 Fixed Carbon 10.00 17.17 Ash 29.75 0.29
Ultimate
C 29.57 49.25 H 5.39 5.99 O 20.83 44.36 N 5.79 0.06 S 1.56 0.05
The fraction of leftover char is assumed as a function of gasification temperature only in thereport. The char ratio is defined as the fraction of leftover char among the overall carbon in thefeedstock. Based on the previous lab scale gasification test, the char ratio is set to be 35.2 percent, 17.9 percentand 9.2 percentwith gasification temperature at 650oC, 750oC and 850oC, respectively.
The initial solid load in the slurry is 40 percent based on previous HTP test results. The total amount of H2 injected in the system is defined as a function of totalamount of carbon in the feedstock and the H2/C molar ratio is set to be 1.0 all through the test. The carbon conversion efficiency is defined as fraction of the carbon in fuel gas (CO, CH4 and C2+)with expression given below.
Chemical Conversion Efficiency= (Cfeedstock‐Cco2‐ Cchar)/Cfeedstock
The mass and heat balance of the PDU operated under different temperature is given in Table 3‐12 based on the simulation results.
Table 3-12: PDU mass and energy balance from simulation
PDU performance Operation temperature (oC) 650 750 850 Operation pressure (psi) 150 150 150 Slurry feed rate (lb/hr) 5.0 5.0 5.0 Slurry solid load 40% 40% 40% H2/C molar ratio 1.0 1.0 1.0 Char ratio (%) 35.2 17.9 9.2 Outlet gas lb/hr Vol% lb/hr Vol% lb/hr Vol% H2 0.14 22.8% 0.22 34.3% 0.31 44.0% CO 0.07 0.8% 0.34 3.8% 0.87 8.8% CO2 0.86 6.6% 1.31 9.2% 1.33 8.6% CH4 0.47 9.8% 0.36 7.0% 0.16 2.8%

20
H2O 3.17 59.4% 2.62 45.2% 2.26 35.4% NH3 0.02 0.5% 0.02 0.5% 0.02 0.4% H2S (PPM) 637 584 531 Chemical conversion efficiency (%) 40.0 44.3 52.2 Minimum heat requirement (kw) 2.0 2.5 3.1
SHR operation temperature and H2/C ratio impact
H2/C molar ratio ranges from 0.5‐3.0 with 0.5 interval is used to investigate the H2 impact on gas composition at differentgasification temperature. The analysis is performed under theassumption that all the carbon in the product gases was present in the form of CO, CO2 orCH4. The mole percentages presented here are calculated using these three species only.Other components present in the product gas such as H2O and H2 arenot included in the product mole percentage calculations. Hence, the mole percentagespresented have been normalized to 100 percent based on the three carbon containing species,CO, CO2 and CH4, shown in Figure 3‐6.
Figure 3-6: Molar fraction of CH4, CO and CO2 at different gasification temperature
It can be observed that the concentration of CH4 decreases with increasing gasification temperature whereas the concentration of CO and CO2 increases. This can be expected since the hydrogenation of carbon which is the primary CH4 generation reaction is mildly exothermic. The steam carbon reaction (2C+3H2O→3H2+CO+CO2) is endothermic.On the other hand, with H2/C increasing, the concentration of CH4 increases while the concentration of CO and CO2 decreases. This trend can be simply explained as the high concentration of H2 shifts the chemical equilibrium to its favorable side within the system that promotes the hydrogenation of carbon and restrains the formation of CO and CO2.

21
According to the simulation results, either increasing theH2/C molar ratio or decreasing the gasification temperature can promote the CH4 production in the SHRtheoretically. In terms of H2/C molar ratio, it must be ensure that the H2 can sustain internal system cycle which also means no outside H2 source is needed. Detail H2sustainability will be discussed in the pilot plant simulation section. For the gasification temperature effect, it is far more complicated in the really world than the simulation. Low temperature leads more leftover char and significant amount of tar will be generated that could block the pipeline and make the gas cleanup system more complex. Meanwhile, the low temperature also requires long residence time and adds the equipment cost, especially in large scale plant. After all, more research regarding optimum gasification temperature from biosolid and biomass comingle feedstock will be further investigated based on PDU test results.
3.6 Mass Flow Measurement Design for PDU
Figure 3-7: Block Flow Diagram of Mass Flow Instrumentation for SHR process
SHR PDU process needstwoMass Flow Controllers(MFC) in the process gas inlet and aMass Flow Meter (MFM) in the product gas outlet of the reactor as shown in Figure 3‐7.
Specification of Two inlet mass flow controllers (one for H2, the other for N2):
Operating pressure should between 150 psi to 400 psi @ room temperature. The nominal flow rate is 205 mol/h, or .

22
Specification of Mass flow meter:
Operating pressure:Atmospheric.The nominal flow rate and gas composition are provided in the Figure 3‐5 from heat and mass balance result.Coriolistype MFM can directly measure mass flow independent of gas types. Since the process uses a gas analyzer to measure the gas composition, signal from MFM can be correlatedwith the gas convection factor to get the real flow rate with following equations
Actual Gas Flow Rate = Output Reading *
And the conversion factor of the gas mixture =
P1 = percentage of gas 1 (by volume) ……
3.7 Gas Cleanup System and Steam Methane Reformer Gas Cleanup System
The gasified product of any sulfur impurities in the feedstock will be hydrogen sulfide (H2S), originally present in the feedstock in the form of elemental sulfur and organic sulfur. There will also be fine particulate matter, or fly ash, that is not removed by the lock hopper system in the product gas of the SHR.
A sulfur & particle trap (with a sorbent and a stainless steel frit filter) was installed in the product gas line, downstream of the SHR unit.
The sorbent used in the sulfur removal system is a zinc oxide pellet (G‐72D) from Sud‐Chemie, Inc. Zinc oxide (ZnO) reacts with hydrogen sulfide (H2S) to produce zinc sulfide (ZnS) and water. The chemical reaction in between the zinc oxide and hydrogen sulfide can be summarized as below.
ZnO + H2S ZnS + H2O
The physical properties of the sorbent and important design parameters are listed in Table 3‐13.
Table 3-13: Characteristics of Sulfur Sorbent and Design Criteria
Zinc Oxide (ZnO) content (%) < 90
Bulk density (g/cm3) 1.35
Surface area (m2/g) 50
Size (mm) 4.76

23
Void fraction (ε) 0.5
Total loaded mass (g) 1500
Maximum Operating Temperature (K) 673
Nominal Operating Pressure (atm) 30
Life cycle @ 0.5% sulfur in feed stock
3 month (24hr/365day
operation) Outlet sulfur concentration < 2ppmv
Maximum Space Velocity 1990 Hr-1
The schematic diagram of the trap is shown in Figure 3‐8. The entire trap was made of stainless steel tube (SUS 316) 50.8 mm (2.0”) OD and 1321 mm (52.0”) long enclosed by an electric heater (1.9 Kw). Additional thermal insulation was added with ceramic wool (Kaowool). The temperature of the trap was controlled by a PWM module. The sorbent was loaded inside the tube until the total stack height of sorbent was 23 inches. A fine particulate filter made of stainless steel frit, 27 inches long, was attached above (upstream of) the sorbent bed.
Steam Methane Reformer (SMR)
The catalyst for the SMR is nickel on an alumina supporting material (G90B, from Sud‐Chemie, Inc.). It is in the form of cylindrical pellets with one center hole. The selection criteria for the steam reforming catalyst for the SHR process are as below:
• The catalyst is designed for the reforming of light hydrocarbons (less than C3) • The performance has been optimized for a low steam to hydrocarbon ratio (around
2.0 to 2.5) • It has negligible pressure drop due to the physical shape of the catalyst
The detailed physical properties of the catalyst selected are listed in table 3‐14.

24
Figure 3-8: Schematic Diagram of Sulfur and Particle Removal System
Electric heater
Gas sampling port
LEGENDS
27"
2" (O.D)
52"
Sorbent(Sud-Chemie G-72D)
Particle filter(size : 1 um)
Sulfur & Dust Removal System
23"
Flue gasInlet
Flue gasOutlet
Table 3-14: Catalyst Properties
NiO content (%) 15 ~ 20
Bulk density (g/cm3) 0.929
Surface area (min) (m2/g) 3
Surface area (max) (m2/g) 15
Size (mm) 8 x 8 x 3
Void fraction (ε) 0.5
Catalyst loaded (g) 240
The SMR is made of a seamless stainless steel tube (SUS 316), 1.0” OD, 0.75” ID and 65” long. Heat is provided by four sets of cylindrical electric heaters. Each heater is rated at 440W @ 120V and made of Inconel coil in an insulating gypsum block.

25
The catalyst was loaded inside of the tube to make a catalyst bed of 45.0” in length. The catalyst is supported by meshed stainless steel wool. The height of the meshed wool is 14.0”.The product gas from the SMR is cooled down to the room temperature via a heat exchanger, followed by steam trap for the continuous removal of condensate. The pressure of SMR, linked with the HGR, is controlled by a single backpressure regulator located downstream of the steam trap. Further details of SMR system including schematic diagram of the process is presented in the APPENDIX D part of this report.

26
Chapter 4: PDU Engineering 4.1 Lab Scale Batch Reactor Test for the Basic Design Parameter Co‐mingled feedstock of biomass and biosolids are used in SHR and experiments are carried out in inverted batch reactor to estimate the carbon conversion in the nominal temperature and pressure. Dimension of PDU was decided by the carbon conversion result obtained in this test.
Experiment conditions
Biomass is mixed with biosolids at defined water/carbon ratio (g/g). All of water source comes from moisture content in biosolids and total carbonaceous matter in feedstock is the sum of carbon in biomass plus carbon in biosolids. Experiment conditions are presented in the Table 4‐1. And figure 4‐1 shows the schematic diagram of the inverted batch reactor.
Table 4-1: Experiment conditions for SHR of co-mingled feedstock and biomass feedstock
Biomass feedstock pinewood + water
Co‐mingled feedstock pinewood + biosolids
H2O to carbon ratio 1:0.45 (g/g)
Temperature 700oC
Lab‐scale reactor Inverted batch reactor
Lab‐scale batch reactor

27
Figure 4-1: Schematic diagram of the inverted batch reactor
1. Gas cylinder 2. Feeder tube 3. Ball valve 4. Thermocouple 5. Heater 6. Reactor vessel
7. Quartz tube 8. Impeller 9. Coalescing filter 10. Magnetic drive
Batch Reactor Test Results
Results from Proton Induced X‐ray Emission analysis show that the biosolids contain main metal species including Fe, Ca, Al, Mg, K, Na, Cu as well as some other trace metals. The proposed hypothesis provides motivation to integrate metals in biosolids to catalyze the steam hydrogasification for a higher reaction rate instead of adding expensive commercial catalysts. The performances of steam hydrogasification reactions are evaluated to include kinetic parameters, carbon conversion. A first‐order kinetic model based on the rate of gas generation is applied to determine the reaction rate of the individual gaseous product.
Fig 4‐2 shows the carbon conversion of co‐mingled feedstock and biomass feedstock only in the steam hydrogasification. There was 5 percent increase in the carbon conversion to gaseous products using co‐mingled feedstock of pinewood and biosolids compared with using pinewood as the feedstock only. Table 4‐2 presents the rate of product gas formation in steam hydrogasification using co‐mingled feedstock and biomass feedstock only. The reaction rate of CH4 and CO formation was enhanced using co‐mingled feedstock of pinewood and biosolids compared with using biomass feedstock only.

28
Figure 4-2: A comparison of carbon conversion in the steam hydrogasification of biomass feedstock and co-mingled feedstock
Table 4-2: A comparison of the rate of CH4, CO and CO2 formation in the steam hydrogasification of biomass feedstock only and co-mingled feedstock
Feedstock Rate constants (10‐3sec‐1)
k CH4 k CO k CO2
Pinewood+water 1.7 3.2 4.8Pinewood+biosolids 2.1 3.5 4.9
4.2 Mock up test Mock up test set up
The mock up test is to examine the fluidization performance and the viability of the PDU design. A 12‐feet‐high transparent plastic cylinder with the same inner and outer diameters as the real PDU is used as reactor. The test is controlled under atmospheric pressure and room temperature, using the same 150 micron silica sand as fluidization solids and air as flow gas. A U tube manometer with water is connected to the top of the reactor to measure the pressure drop during the fluidization.
Using the same formula (Eq. (1)‐(6)), another series of gas flow rate based on the operation condition is obtained and tested. Bed height in the test is set to 1.83m (6 feet, half of the total height), which is higher than the critical height HL (0.860m). Summary of the test set up is listed in table 4‐3.

29
Table 4-3: Fluidized bed mock up test operation condition
Reactor inner diameter (cm)
Reactor total height (m)
Sand size (micron)
Bed height
(m)
Bed pressure
(atm)
Temperature (°C)
Gas velocity
(m/s) 9.40 3.35 150 0.860 1 25 0.0863
Mock up test result
The sand begins to bubble very quickly. This is in accordance to the small Umf value which can be deducted from Eq. (3‐1)‐(3‐3) in Section 3.4 of this report. At the gas flow rate reaches 0.086m/s, the diameter of sand bubble approaches the cylinder diameter and the bubbles begin to burst. A bubbling‐slugging bed is formed. Since the bed height reached the critical height, sand slugging is always in a stable axial plug flow state. The maximum bed height also fits the Hmax/H0 ratio obtained from Eq. (3‐11), which is 1.20. A pressure drop of 127.4 Pa is observed during the fluidization. Actual photo taken from the mock‐up test can be found in the APPENDIX D section of the report.
The result of the mock test shows that the bed performance predicted at the bubbling‐slugging transition gas velocity based on previous calculation is reliable. As Umf and Ums is mostly related to physical properties of sand and reactor size only, the test result can prove that the design of a fluidized bed reactor with the same size under high temperature and pressure is also viable.
4.3 PDU Detailed Engineering From the basic engineering data collected from section 4.1 & 4.2, research team started the detailed engineering with outside engineering firm. Technip USA Inc. (Claremont, CA) was chosen for the detailed engineering work. Technip USA is worldwide renowned engineering firm with the specialty in steam methane reforming and catalytic fluid cracking process, which has essential experience for the PDU design. Final outcome of the detailed design was presented in the APPENDIX D section of the report. Detailed fabrication drawings together with the design basis are presented.

30
Chapter 5: PDU Operation Result 5.1 PDU test SHR test results
Figure 5‐1 shows performance of progressive cavity pump used in the PDU. Nominal designed flow rate of 5 lb/hr (40 ml/ min) was obtained at 20Hz of pump speed. Maximum flow rate of the feed pump was 80 ml/ min @40 Hz, which is 200 percent of designed flow rate. In Figure 5‐2, it also shows that the reactor can reach the desired temperature (650C) at 200 percent designed flow rate
Figure 5-1: Steam pump (Hz) vs volume flow rate (ml/min)
y = 1.7338x + 1.3362
01020304050607080
0 20 40 60
Flow
rate
(ml/m
in)
Hz
Flow Rate (ml/min) vs Steam Pump (Hz) 1/27

31
Figure 5-2: Reactor Temperature vs volume flow rate (ml/min)
0
10
20
30
40
50
60
586
588
590
592
594
596
598
600
602
12:43:1212:50:2412:57:3613:04:4813:12:0013:19:12
Flow
Rat
e m
l/min
Tem
p C
Time
Temp
Flow Rate
Figure 5-3: Temperature profile. Total recorded time was 5 hr. (2 hr per tick mark)
Figure 5‐3 shown in above is the startup curve of PDU at nominal condition (20HZ). It took 4 hr to reach the desired temperature (650) of the reactor. Temperature profile at the steady state is shown in Figure 5‐3. Upper 2 feet length section of the reactor reaches the desired temperature, while lower section of the reactor shows low temperature due to evaporation of the feedstock.

32
Figure 5-4: Temperature profile as a function of reactor height (Distance from Top)
Figure 5-4 shows the reactor can hold the desired temperature upto 200 percent of nominal flow rate.
Gas Cleanup System test results
Figure 5‐5: Gas Cleanup System Test Run
0123456789
1011121314151617181920
0 10 20 30 40 50 60 70 80 90 100 110 120 130 140 150 160 170 180 190 200
Time (min)
Exit
H 2S
conc
entr
atio
n (p
pm)
Run 3 (no steam) Run 8 (30 vol % steam)
Breakthrough conc. for protecting FT catalyst
Temperature : 600 oFSV (hr-1) : 33000PS(um) : 150 <dp< 250H2S concentration [inlet] (ppm) : 2000
Breakthrough conc. for protecting SMR catalyst @ 750 oC

33
Figure 5‐5 shows the operation result of gas cleanup system. The result shows the effective cleanup of sulfur species (H2S) at the elevated temperature (600oF) to less than 1 ppm. The result also shows the presence of the steam in the SHR producer gas does not affect the performance of cleanup sorbent. Presence of the steam only affect the break‐through time of the sorbent. With the steam, which is the typical condition of SHR producer gas, 15 percent Reduction of sorbent life time is expected.
PDU Operation Result (SHR + Gas Cleanup + SMR)
Figure 5-6: Typical process operation curve o PDU system
In Figure 5‐6 shows operation of PDU at the nominal designed rate with combination of gas cleanup system and SMR for the pretreated feedstock with HTR process. For the 1st 1 hour of PDU operation, only SHR part of was operating. After SHR reach the steady state (Time mark around 15:29), SMR section of the PDU was started. It shows PDU system is producing 3:1 ration of H2 and CO when it reaches the steady state (Time mark after 16:48).
34
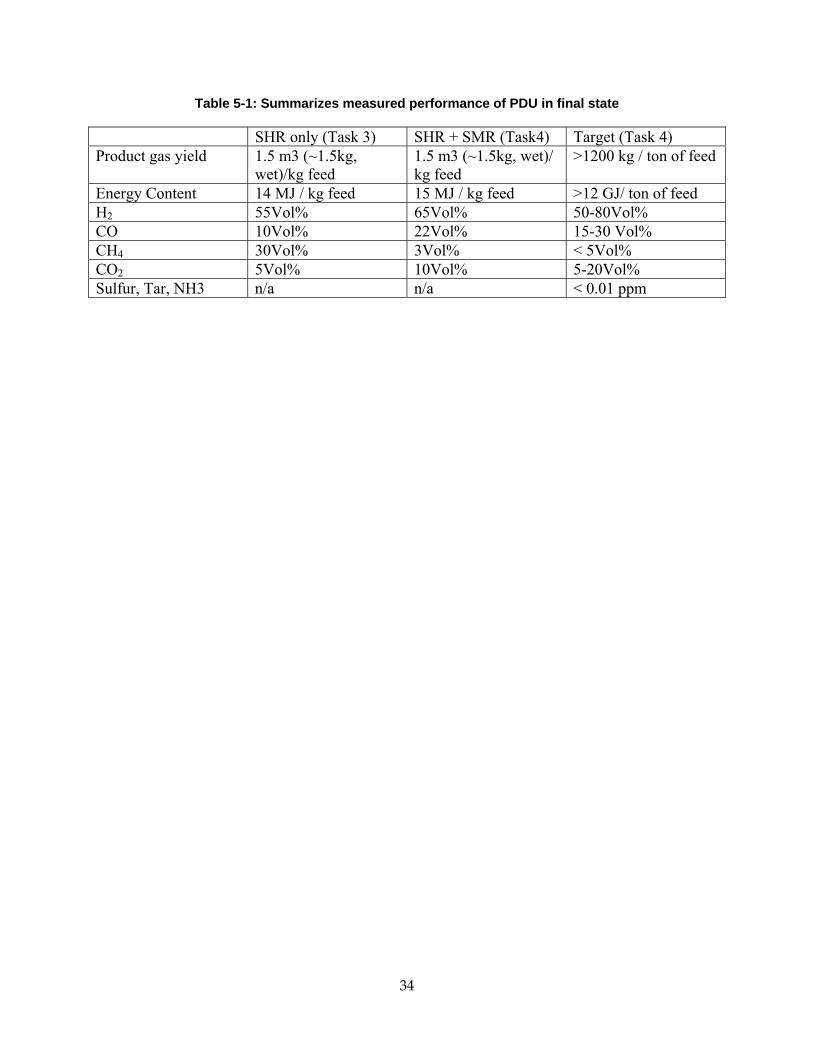
Table 5-1: Summarizes measured performance of PDU in final state
SHR only (Task 3) SHR + SMR (Task4) Target (Task 4) Product gas yield 1.5 m3 (~1.5kg,
wet)/kg feed 1.5 m3 (~1.5kg, wet)/ kg feed
>1200 kg / ton of feed
Energy Content 14 MJ / kg feed 15 MJ / kg feed >12 GJ/ ton of feed H2 55Vol% 65Vol% 50-80Vol% CO 10Vol% 22Vol% 15-30 Vol% CH4 30Vol% 3Vol% < 5Vol% CO2 5Vol% 10Vol% 5-20Vol% Sulfur, Tar, NH3 n/a n/a < 0.01 ppm
35
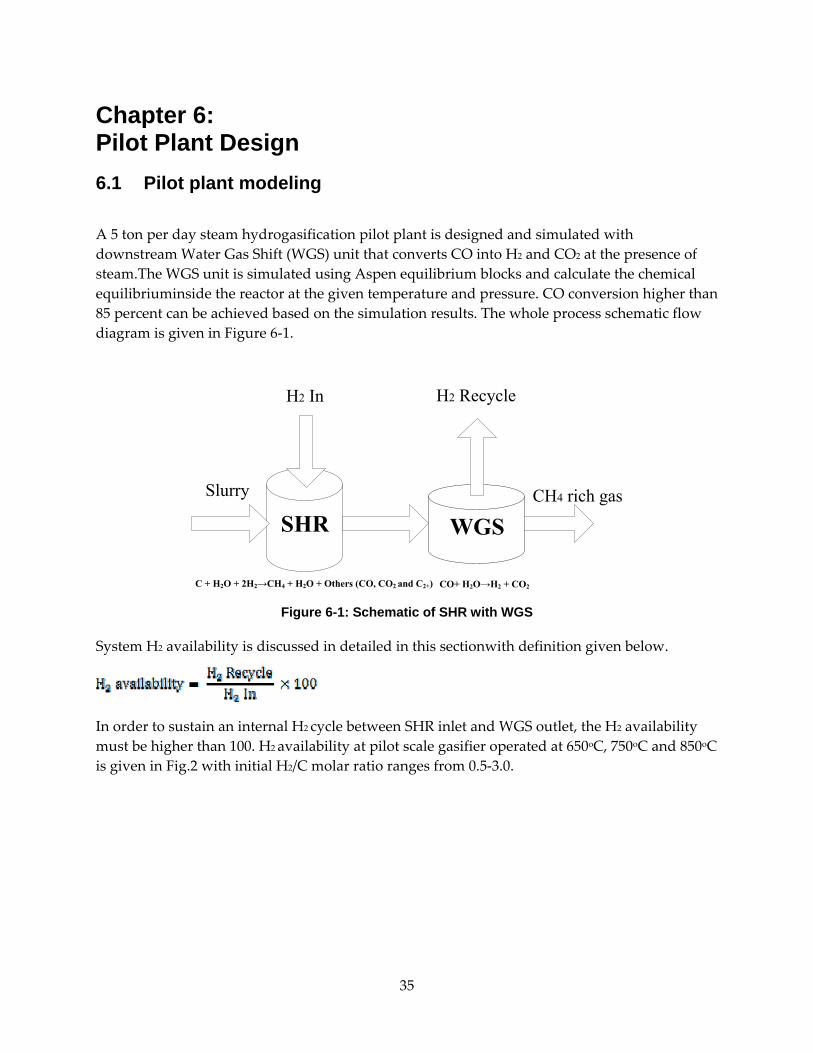
Chapter 6: Pilot Plant Design 6.1 Pilot plant modeling A 5 ton per day steam hydrogasification pilot plant is designed and simulated with downstream Water Gas Shift (WGS) unit that converts CO into H2 and CO2 at the presence of steam.The WGS unit is simulated using Aspen equilibrium blocks and calculate the chemical equilibriuminside the reactor at the given temperature and pressure. CO conversion higher than 85 percent can be achieved based on the simulation results. The whole process schematic flow diagram is given in Figure 6‐1.
SHR WGS
H2 In
Slurry
H2 Recycle
C + H2O + 2H2→CH4 + H2O + Others (CO, CO2 and C2+) CO+ H2O→H2 + CO2
CH4 rich gas
Figure 6-1: Schematic of SHR with WGS
System H2 availability is discussed in detailed in this sectionwith definition given below.
In order to sustain an internal H2 cycle between SHR inlet and WGS outlet, the H2 availability must be higher than 100. H2 availability at pilot scale gasifier operated at 650oC, 750oC and 850oC is given in Fig.2 with initial H2/C molar ratio ranges from 0.5‐3.0.

36
Figure 6-2: H2availability with gasification temperature at 650oC, 750oC and 850oC
Based on the simulation results, any point below the dash line is considered as unfavorable and cannot make the system self sustainable. The maximum H2/C molar ratio that meets the system H2 internal cycle at different gasification temperature is given in Table 6‐1.
Table 6-1: Maximum H2/C molar at different gasification temperature
Temperature (oC) 650 750 850 Max H2/C molar ratio 0.8 2.0 5.0
Mass and energy balance of pilot plant with maximum H2/C molar ratio at 650oC, 750oC and 850oC is given in Figure 6‐3, Figure 6‐4 and Figure 6‐5, respectively. The heat requirement in gasifier, gas cooling system, WGS unit and steam condensing is calculated in the unit of kw. It should be noticed that thenumber in minus represents heat is imported into the system while vice verse.
Other deliverables in Task#5 such as Block Flow Diagram, Process & Utility Flow Diagrams, Plant Layouts & Equipment together with the Estimated Project Cost can be founded in the APPENDIX F section of the report. Process economic analysis was established for a 3500 BDT/day SNG plant using biosolid and green waste as feedstock. Based on the analysis result, the SNG production cost is 4.39 $/MMBTU with an IRR of 16.68 percent while feedstock cost and feedstock delivery cost are not taken into consideration. The detail of the analysis is also provided in the APPENDIX G.

37
Figure 6-3: Mass and heat balance of pilot plant with gasification temperature at 650oC
Figure 6-4: Mass and heat balance of pilot plant with gasification temperature at 750oC

38
Figure 6-5: Mass and heat balance of pilot plant with gasification temperature at 850oC

39
Chapter 7: Summary of Results All of the major technical objectives of this project were met. This section will summarize the results.
A PDU scale HTP was designed, built and demonstrated. The HTP produced a pump‐able feedstock of comingled biomass and biosolidand met all of the target specification described in the performance objective. The most important result is that afeedstock of up to 40 percent solid loading can be converted into the pump‐able form with this technology.
A PDU scale SHR process was also designed, built and successfully operated. A Gas Cleanup system and SMR were developed separately and integrated with the SHR reactor. The production of syngas with all the target specifications was successfully demonstrated. The Syngas production rate is 1.5 cubic meters per kilogram input of feed. The energy content of the producer gas was 15MJ per kilogram input of feedstock. The production of synthesis gas at the temperature range of 650‐750ºC, a H2/C mole ratio of 1.0 and H2O/feedstock mass ratio of 2 was successfully demonstrated.
A preliminary design of a pilot plant at 5 tons per day capacity using the PDU technology was completed. A block flow diagram with process mass and energy balance and process and utility flow diagrams was developed as a major deliverables of the project.
Preliminary process economic analyses were completed for a 3500 BDT/day SNG plant using biosolids and biomass as feedstock. It was estimated that the SNG production cost is 4.39 $/MMBTU with an IRR of 16.68 percent. This result together with the preliminary design basis for the pilot plant provides the confidence for moving forward to the pilot plant demonstration of this technology at the site of waste treatment plant.

40
GLOSSARY
BDT ........................................................ Bone Dry Tonne
CEC ........................................................ California Energy Commission
CE‐CERT ............................................... College of Engineering‐Center for Environmental Research and Technology
CH4 ......................................................... Methane
CO Carbon Monoxide
CO2 ......................................................... Carbon Dioxide
DAFT ...................................................... Dissolved Air Floatation Thickener
DOE ........................................................ Department of Energy
FT Fischer‐Tropsch
GC Gas Chromatography
GC‐FID ................................................... Gas Chromatography with Flame Ionization Detector
GC‐TCD ................................................. Gas Chromatography with Thermal Conductivity Detector
H2 Hydrogen
HTP ........................................................ Hydrothermal Pretreatment
HTR ........................................................ Hydrothermal Reactor
H2C ......................................................... Ethylene
H2S .......................................................... Hydrogen Sulfide
Hz Hertz
MAWP ................................................... Maximum Allowable Water Pressure
MAWT ................................................... Maximum Allowable Water Temperature
MAWL ................................................... Maximum Allowable Water Loading
MFC ........................................................ Mass Flow Controller
MFM ....................................................... Mass Flow Meter
MIT ......................................................... Massachusetts Institute of Technology
mm ......................................................... Millimeter
NiO ......................................................... Nicole Oxide

41
NH3 ......................................................... Ammonia
PDM ....................................................... Pressure Display Module
PDU ........................................................ Process Demonstration Unit
PPM ........................................................ Parts Per Million
PR Peng‐Robinson
RPM ........................................................ Round Per Minute
PWM ...................................................... Pulse Width Modulation
SHR ........................................................ Steam Hydrogasification Reaction
SLPM ...................................................... Standard Liter Per Minute
SNG ........................................................ Substituted Natural Gas
SMR ........................................................ Steam Methane Reforming
SOP ......................................................... Standard Operation Procedure
SVM ........................................................ Solenoid Valve Module
TPD ........................................................ Tone Per Day
TDH ........................................................ Transport Disengagement Height
UC University of California
USA ........................................................ United State of America
WGS ....................................................... Water Gas Shift
ZnO ........................................................ Zinc Oxide
ZnS ......................................................... Zinc Sulfide