Development of separation methods and measurement ...
288
DEPARTMENT OF ANALYTICAL CHEMISTRY Development of separation methods and measurement protocols for Sr and Pb isotopic analysis of archaeological artefacts by means of single-collector and multi-collector ICP-mass spectrometry Thesis submitted in fulfillment of the requirements for the degree of Doctor (Ph.D.) in Sciences : Chemistry by David De Muynck PROMOTER : PROF. DR. F. VANHAECKE June 2008
Transcript of Development of separation methods and measurement ...

DEPARTMENT OF ANALYTICAL CHEMISTRY
Development of separation methods and
measurement protocols for Sr and Pb
isotopic analysis of archaeological artefacts
by means of single-collector and
multi-collector ICP-mass spectrometry
Thesis submitted in fulfillment of the requirements for the degree of
Doctor (Ph.D.) in Sciences : Chemistry
by
David De Muynck
PROMOTER : PROF. DR. F. VANHAECKE
June 2008


Acknowledgements


ACKNOWLEDGEMENTS
v
After the first lessons in chemistry I had in secondary school, I was interested in this
science. A few years later, I started studying Chemistry at Ghent University. During these
studies, I became convinced that chemistry is everywhere, and especially analytical
chemistry drew my attention. After finishing my Master thesis in analytical chemistry, I
had the chance to start a Ph.D. research in the same field. It started with a description of
a not so well defined project: ‘method development for isotope ratio analysis using
(MC-)ICP-MS’. A new interesting challenge for me. Soon, I was working on three different
projects requiring a lot of analytical chemistry followed by an attempt to answer a specific
archaeological question. The results of four years Ph.D. research are summarized in this
thesis. Of course, this thesis could not have evolved into what it is now without the input
and the help of a number of people.
First of all, I want to express my gratitude towards my promoter, Prof. dr. Frank
Vanhaecke, for offering me the possibility to carry out this research in his lab. I had the
feeling to be really appreciated and trusted and received many possibilities to present my
work on international meetings, which was always a wonderful experience.
My gratitude also goes to Prof. dr. Karel Strijckmans, the chairman of the Department of
Analytical Chemistry, for making available the labs and the equipment.
This Ph.D. research consisted of multidisciplinary studies. I want to thank dr. Liesbeth
Smits for providing the archaeological samples investigated in the framework of the
Roman Bone and the Servatius projects. Em. Prof. dr. Freek de Wolff is thanked for
sharing important considerations on the toxicology of lead and his enthusiasm concerning
the lead study. Dr. Parsival Delrue is thanked for providing a (huge!) collection of metallic
artefacts for the ed-Dur project. Further, I want to thank Liesbeth, Freek and Parsival for
many email and/or personal communications that were most valuable for bringing all the
analyses to a good end and for a proper interpretation of the isotope ratio data.
During my Ph.D. research, I had the opportunity to meet and work together with dr.
Christophe Cloquet. Christophe, although your stay in Ghent was unfortunately quite
short, I have learnt a lot from you and would like to express my sincere gratitude for
sharing your considerable knowledge on isotopes and so much more. Further, I enjoyed
the coffee breaks and it was great to have someone in the lab that also likes metal music.
And the Goldschmidt 2007 conference in Cologne was my best conference so far!
Besides learning many things myself, I also tried to transfer some of my knowledge to
last-year master students. I would like to acknowledge Karen, Pieter, Gonzalo and Sylvia
for the nice and mostly smooth cooperations. Gonzalo, I really enjoyed working with you
and going for a beer on Friday, followed by another metal gig in the weekend. You will

ACKNOWLEDGEMENTS
vi
probably remember the E-17 between Ghent and Antwerp forever! Further, Karolina
Danielewska is thanked for her big smile and for being a nice colleague and also great
company for going out!
I also want to mention Roger Van Tittelboom in this acknowledgement. Without his quick
interventions, patience and large knowledge about the electronics and delicate parts of an
ICP – mass spectrometer, the instruments would have been out of operation much more
often. Roger, your enthusiasm and optimism were always a pleasure to enjoy. Thank you
for the many conversations about all kind of things! Also Bart is thanked for his quick help
on all kind of computer-related problems.
Further, I want to acknowledge all the colleagues that left or joined the Department of
Analytical Chemistry, and in particular the Atomic and Mass Spectrometry unit, during the
period I was there.
Last, but not least, I want to thank my parents for the infinite trust and faith they have
always had in me, and for always supporting me in whatever I do. Thank you!
David

Table of contents


TABLE OF CONTENTS
ix
Acknowledgements ........................................................ iii
Table of contents .......................................................... vii
CHAPTER I – Introduction and objectives ............................ 1
I.1 – Theoretical aspects ...................................................................3
I.2 – Method development ................................................................4
I.3 – Archaeological applications ......................................................5
CHAPTER II – Inductively coupled plasma – mass spectrometry (ICP-MS) ........................................................................ 7
II.1 – Operating principle ..................................................................9
II.2 – Sample introduction system ................................................. 10
II.2.1 – Pneumatic nebulization systems ......................................................... 12
II.2.1.1 – Nebulizers ........................................................................................... 12
II.2.1.1.1 – Concentric nebulizer ..................................................................................... 12
II.2.1.1.2 – Crossflow nebulizer ...................................................................................... 13
II.2.1.1.3 – Microconcentric nebulizer ............................................................................. 13
II.2.1.2 – Spray chambers ................................................................................... 13
II.2.1.2.1 – Cyclonic spray chamber ................................................................................ 14
II.2.1.2.2 – Double-pass Scott-type spray chamber ......................................................... 14
II.2.1.3 – Performance ........................................................................................ 14
II.2.2 – Aridus aerosol desolvating device ....................................................... 15
II.2.3 – Alternative sample introduction systems.............................................. 16
II.2.3.1 – Electrothermal vaporization (ETV) .......................................................... 16
II.2.3.2 – Laser ablation (LA) ............................................................................... 16
II.3 – Inductively coupled plasma (ICP) ........................................ 16
II.4 – Interface region ................................................................... 18
II.5 – Mass spectrometers ............................................................. 18
II.5.1 – Quadrupole filter ............................................................................... 20
II.5.1.1 – Description .......................................................................................... 20
II.5.1.2 – Operating principle ............................................................................... 21
II.5.1.3 – Performance ........................................................................................ 24

TABLE OF CONTENTS
x
II.5.2 – Sector field mass spectrometer .......................................................... 24
II.5.2.1 – Description .......................................................................................... 24
II.5.2.2 – Magnetic sector ................................................................................... 24
II.5.2.3 – Electrostatic sector ............................................................................... 25
II.5.2.4 – Double focusing setup .......................................................................... 26
II.5.2.5 – Performance ........................................................................................ 28
II.6 – Collision/reaction cell technology ......................................... 28
II.6.1 – History of collision/reaction cells ........................................................ 29
II.6.2 – Dynamic reaction cell (DRC) .............................................................. 30
II.6.2.1 – Description .......................................................................................... 31
II.6.2.2 – Ion-molecule interactions ..................................................................... 32
II.6.2.2.1 – Collisional processes ..................................................................................... 32
II.6.2.2.2 – Ion-molecule reactions ................................................................................. 33
II.6.2.2.3 – Ion-molecule reaction types .......................................................................... 34
II.6.2.2.4 – Non-reactive collisions .................................................................................. 35
II.6.2.2.5 – Control of sequential chemistry ..................................................................... 36
II.7 – Detection system .................................................................. 38
II.7.1 – Ion counting systems ........................................................................ 39
II.7.2 – Analogue collection ........................................................................... 39
II.7.3 – Dual detection systems ..................................................................... 40
II.7.4 – Performance ..................................................................................... 40
II.8 – ICP-MS instruments used in this work .................................. 41
II.9 – ICP-MS for trace element determination .............................. 42
II.9.1 – Semi-quantitative elemental analysis .................................................. 43
II.9.2 – Quantitative elemental analysis .......................................................... 44
II.9.2.1 – External standardization ....................................................................... 44
II.9.2.2 – Standard addition ................................................................................ 44
II.9.2.3 – Isotope dilution (ID) ............................................................................ 45
II.9.3 – Internal standardization .................................................................... 45
CHAPTER III – Isotope ratio analysis via ICP-MS ................ 47
III.1 – General concepts of isotopic analysis .................................. 49
III.2 – Stable isotope fractionation ................................................ 52
III.2.1 – History ............................................................................................ 53
III.2.2 – Equilibrium isotopic fractionation ...................................................... 54
III.2.3 – Kinetic isotopic fractionation ............................................................. 54
TABLE OF CONTENTS
xi
III.3 – ICP-MS for isotope ratio applications ................................. 55
III.3.1 – Single-collector ICP-MS ..................................................................... 55
III.3.2 – Multi-collector ICP-MS ....................................................................... 56
III.4 – Uncertainty factors in isotope ratio determination via ICP-MS
....................................................................................................... 59
III.4.1 – Sources of noise ............................................................................... 59
III.4.2 – Mass discrimination .......................................................................... 60
III.4.2.1 – Origin of mass discrimination ............................................................... 61
III.4.2.2 – Correction for mass discrimination ........................................................ 62
III.4.2.2.1 – Internal and external normalization ............................................................. 62
III.4.2.2.2 – External standardization .............................................................................. 64
III.4.3 – Mass scale shift ................................................................................ 65
III.4.4 – Background and contamination ......................................................... 65
III.4.5 – Detector dead time ........................................................................... 67
III.4.5.1 – Definition ........................................................................................... 67
III.4.5.2 – Experimental determination of the detector dead time ........................... 67
CHAPTER IV – Target elements and sample types investigated in this work .................................................................. 73
IV.1 – Rubidium/strontium isotope system ................................... 75
IV.1.1 – Occurrence and properties of Rb and Sr ............................................. 75
IV.1.2 – Rb-Sr dating ..................................................................................... 77
IV.2 – Uranium/thorium/lead isotope system ............................... 79
IV.2.1 – Occurrence and properties of U and Th .............................................. 79
IV.2.2 – U-Th-Pb dating ................................................................................. 81
IV.2.3 – Occurrence and properties of lead ..................................................... 82
IV.3 – Sr and Pb isotopes in archaeological studies ....................... 83
IV.3.1 – Sr isotope studies ............................................................................. 84
IV.3.2 – Pb isotope studies ............................................................................. 85
IV.4 – Sample types investigated in this work ............................... 87
IV.4.1 – Soils ................................................................................................. 87
IV.4.2 – Bone and dental tissues .................................................................... 89
IV.4.3 – Ceramics .......................................................................................... 91
IV.4.4 – Metallic artefacts............................................................................... 91

TABLE OF CONTENTS
xii
CHAPTER V – Sample pretreatment and digestion procedures ................................................................................... 93
V.1 – Sample pretreatment procedures .......................................... 95
V.1.1 – Sample cleaning and cutting .............................................................. 95
V.1.2 – Sample homogenization: microdismembrator ...................................... 96
V.1.3 – Sampling of metallic artefacts: miniature-drill setup ............................. 97
V.2 – Sample digestion approaches ................................................ 98
V.2.1 – Hotplate digestion ............................................................................. 98
V.2.2 – Microwave-assisted acid digestion ...................................................... 99
V.2.2.1 – Absorption of microwave energy and heating .......................................... 99
V.2.2.2 – Operating principle ............................................................................... 99
V.2.2.3 – Performance ...................................................................................... 101
V.3 – Acid chemistry ..................................................................... 101
V.3.1 – Nitric acid ....................................................................................... 102
V.3.2 – Hydrochloric acid ............................................................................. 102
V.3.3 – Hydrofluoric acid ............................................................................. 103
V.3.4 – Sulfuric acid .................................................................................... 103
V.3.5 – Hydrogen peroxide .......................................................................... 104
V.3.6 – Perchloric acid ................................................................................. 104
V.4 – Development and validation of digestion procedures .......... 105
V.4.1 – Soil digestion procedure ................................................................... 106
V.4.2 – Bone digestion procedure ................................................................ 107
V.4.3 – Enamel and dentine digestion procedure .......................................... 107
V.4.4 – Ceramics digestion procedure .......................................................... 108
V.4.5 – Metallic artefacts digestion procedure ............................................... 110
V.5 – Certification of Pb in bone candidate reference materials ... 111
V.6 – Conclusions .......................................................................... 113
CHAPTER VI – Isolation procedures for strontium and lead ................................................................................. 115
VI.1 – Pitfalls in obtaining accurate and precise isotope ratio results
...................................................................................................... 117
VI.1.1 – Spectral interferences ..................................................................... 117
VI.1.2 – Matrix effects ................................................................................. 119

TABLE OF CONTENTS
xiii
VI.1.3 – Other factors .................................................................................. 119
VI.2 – Analyte separation prior to isotopic analysis ..................... 120
VI.2.1 – Interferences on strontium and lead ................................................ 120
VI.2.2 – Requirements for analyte isolation ................................................... 121
VI.2.3 – Existing isolation techniques for strontium ........................................ 122
VI.2.4 – Existing isolation techniques for lead ................................................ 123
VI.2.5 – Strontium and lead isolation techniques used in this work ................. 123
VI.3 – Extraction chromatography using Sr specTM ...................... 124
VI.3.1 – Description of the resin ................................................................... 124
VI.3.2 – Evaluation and optimization of the use of Sr specTM resin .................. 125
VI.3.2.1 – Isolation of Sr from its concomitant matrix .......................................... 125
VI.3.2.2 – Separation of rubidium and strontium ................................................. 128
VI.4 – Extraction chromatography using Pb specTM ..................... 130
VI.4.1 – Description of the resin ................................................................... 130
VI.4.2 – Evaluation and optimization of the use of Pb specTM resin .................. 130
VI.5 – Isotopic fractionation on the Sr and Pb resins .................. 134
VI.6 – Multiple use of extraction chromatographic resins ........... 136
VI.7 – Conclusions ........................................................................ 140
CHAPTER VII – Single-collector – and multi-collector ICP-MS measurement protocols ............................................... 141
VII.1 – Quadrupole-based ICP-MS – elemental assay ................. 143
VII.2 – ICP-DRC-MS – P, Ca and Sr determination ...................... 143
VII.2.1 – Selection of the target isotopes of P, Ca and Sr ............................... 144
VII.2.2 – Optimization of ICP-DRC-MS for P, Ca and Sr determination ............. 147
VII.2.2.1 – Optimization of the NH3 gas flow rate ................................................ 148
VII.2.2.2 – Optimization of the rejection parameter q (RPq) ................................. 152
VII.2.2.3 – Determination of phosphorus ............................................................ 153
VII.2.3 – Validation of the ICP-DRC-MS measurement protocol ....................... 154
VII.2.4 – Conclusions .................................................................................. 155
VII.3 – MC-ICP-MS – Sr isotopic composition .............................. 156
VII.4 – MC-ICP-MS – Pb isotopic composition ............................. 158
VII.5 – SC-ICP-DRC-MS – Pb isotopic composition ...................... 160
VII.5.1 – Selection of a collision gas and optimization of the flow rate ............ 161
VII.5.2 – Measurement protocol ................................................................... 163
TABLE OF CONTENTS
xiv
VII.5.3 – Validation of the SC-ICP-DRC-MS measurement protocol ................. 165
VII.5.3.1 – Duplicate analyses ........................................................................... 166
VII.5.3.2 – Comparison of single-collector – and multi-collector ICP-MS results ...... 166
VII.5.3.3 – Pb isotope ratio determination in certified reference materials ............. 169
VII.5.4 – Conclusions .................................................................................. 171
CHAPTER VIII – Provenancing pre-Islamic metallic artefacts excavated at ed-Dur and Khor Rori .............................. 173
VIII.1 – Geography, history and archaeology ............................... 175
VIII.1.1 – The archaeological site of ed-Dur ................................................. 175
VIII.1.2 – The archaeological site of Khor Rori .............................................. 177
VIII.1.3 – Historical written sources on trade ................................................ 177
VIII.2 – Samples investigated in this work .................................. 178
VIII.3 – Analytical methodology ................................................... 179
VIII.4 – Pb isotope ratio results ................................................... 184
VIII.5 – Provenance determination of artefacts ........................... 184
VIII.5.1 – Fragments BS 1466 and Z 019 (lead) and KR 009 (bronze) ............ 187
VIII.5.2 – Copper-based artefacts ................................................................ 189
VIII.5.3 – Silver and lead artefacts ............................................................... 191
VIII.6 – Conclusions and implications on trade ............................ 195
CHAPTER IX – Investigation of infant exposure to lead during the Roman Era ........................................................... 199
IX.1 – Toxicological and historical background ............................ 201
IX.1.1 – Toxicology of lead .......................................................................... 201
IX.1.2 – The use of lead in the Roman Era ................................................... 202
IX.2 – Sampling site and history of research ................................ 203
IX.3 – Samples investigated in this work ...................................... 204
IX.4 – Analytical methodology ...................................................... 205
IX.5 – Pb concentration and Pb isotope ratio results .................... 205
IX.5.1 – Pb concentration results ................................................................. 205
IX.5.2 – Pb isotope ratio results ................................................................... 210
IX.6 – Conclusions ........................................................................ 218
TABLE OF CONTENTS
xv
CHAPTER X – Investigation of the grave field population around the Servatius complex ................................................. 219
X.1 – History of Servatius ............................................................. 221
X.2 – Samples investigated in this work ...................................... 223
X.3 – Analytical methodology ....................................................... 224
X.4 – Evaluation of diagenetic alteration ..................................... 224
X.5 – Sr concentration and Sr isotope ratio results ...................... 227
X.6 – Conclusions and future ........................................................ 231
CHAPTER XI – Summary and conclusions ........................ 235
XI.1 – Analytical methodologies developed ................................. 237
XI.2 – Archaeological projects ..................................................... 240
HOOFDSTUK XII – Samenvatting en besluit ...................... 243
XII.1 – Ontwikkelde analytische strategie ................................... 245
XII.2 – Archeologische projecten ................................................. 248
References ................................................................. 253


CHAPTER I
Introduction and objectives


CHAPTER I – Introduction and objectives
3
The aim of this work is to answer specific archaeological questions by means of isotope
ratio analysis of strontium and lead. A first phase of this work consisted of the
development of an appropriate analytical methodology, while in a second phase, the
methodologies developed were applied to the archaeological applications.
I.1 – Theoretical aspects Inductively coupled plasma – mass spectrometry (ICP-MS) is a powerful technique for
(ultra)trace element determination. One of the advantages of ICP-MS is that this
technique can provide information on the isotopic composition of the target element(s).
For applications of isotope ratio analysis that require a high isotope ratio precision, single-
collector ICP-MS (SC-ICP-MS) cannot compete with thermal ionization – mass
spectrometry (TI-MS), a technique that has long been regarded as the reference
technique for isotope ratio determinations of the “heavier” elements. However, ICP-MS
has gained growing importance in the field of isotope ratio analysis after the introduction
of multi-collector ICP-MS (MC-ICP-MS), a combination of the ICP as an ion source and a
detector array consisting of multiple Faraday cups and electron multipliers for ion
detection. Since the ICP is a more powerful ion source than a thermal ion source,
elements that are difficult to ionize via thermal ionization became accessible to isotopic
studies, with an isotope ratio precision similar to that offered by TI-MS. Additional
important benefits of (MC-)ICP-MS over TI-MS are the continuous nebulization of sample
solution into the ion source at atmospheric pressure and a higher sample throughput.
Hence, MC-ICP-MS has evolved into a dedicated tool for isotopic analysis. In this work,
both single-collector ICP-MS and multi-collector ICP-MS have been used for isotope ratio
determination. In chapter II, the various components of present-day ICP – mass
spectrometers are discussed. Chapter III provides general concepts and theory regarding
isotope ratio analysis and isotopic fractionation, and further considers the use of ICP-MS
for isotope ratio analysis.
The target elements in this work are strontium and lead. The isotopic composition of both
of these elements is prone to small variations, since at least one isotope of each of these
elements is an end-product of the radioactive decay of naturally occurring and long-lived
radionuclides. One of the strontium isotopes, 87Sr, is formed by the beta-decay of 87Rb.
The lead isotopes 206Pb, 207Pb and 208Pb are the end-product of the decay series of 238U,
235U and 232Th, respectively. These isotope systems are discussed in more detail in
chapter IV. The variations in the isotopic composition of strontium and lead can be used

CHAPTER I – Introduction and objectives
4
for a number of archaeological applications, some of which were carried out in this work.
Strontium isotopic variations in dental tissues can be used to trace population migration
between distinct geological areas. The isotopic composition of lead can be used for the
provenance determination of archaeological artefacts and the investigation of lead
exposure in the past. In chapter IV, these applications are highlighted. Most of the
samples of archaeological origin investigated in this work are characterized by a complex
matrix composition (e.g., soil, bone and dental tissues). Chapter IV summarizes the
characteristics and typical elemental composition of the various sample types studied in
this work: soil, bone and dental tissues, ceramics and metallic objects with high copper,
silver and/or lead contents.
I.2 – Method development In its standard configuration, ICP-MS is suited for the analysis of solutions. This implies
that solid samples need to be digested prior to analysis. Further, in order to improve the
speed and performance of the digestion process, the conversion of the solid particles or
fragments into a homogeneous and finely dispersed powder is beneficial. The first part of
chapter V focuses on the pretreatment of the solid samples supplied: cleaning, rinsing,
homogenization and sampling of metallic fragments and coins. The second part of
chapter V is dedicated to the digestion procedures that were developed to dissolve the
various sample types. Hereto, a suitable combination of acids was added to the powdered
samples, followed by a hotplate digestion or a microwave-assisted acid digestion. The
digestion procedures aimed at a complete dissolution of the samples to assure that no
strontium or lead isotopic fractionation is introduced by the digestion process. Certified
reference materials were used for validation of the digestion protocols developed.
Most of the sample types under study (soil, bone and dental tissues, ceramics and
metallic objects) are characterized by a complex matrix composition. Especially in the case
where MC-ICP-MS is used for isotope ratio analysis, it is required to isolate the target
element from its concomitant matrix prior to isotopic analysis, in order to obtain accurate
and precise isotope ratio results. In this work, the target elements Sr and Pb were
isolated by means of an extraction chromatographic separation, based on a crown ether.
It was the intention to obtain the pure Sr or Pb fraction of the sample and to establish a
quantitative recovery so that no isotopic fractionation of Sr or Pb is introduced by the
separation process. The separation procedures developed are described in chapter VI.
CHAPTER I – Introduction and objectives
5
Multi-collector ICP-MS was used in this work for Sr and Pb isotopic analysis. However, in
the cases where the very high precision as offered by MC-ICP-MS is not required, also
single-collector ICP-MS can provide valuable results. The use of a collision gas in the
dynamic reaction cell (DRC) of a quadrupole-based ICP – mass spectrometer allows
isotope ratio precisions to be obtained that are better than those attainable with standard
quadrupole-based ICP-MS. A single-collector ICP-DRC-MS measurement protocol, using a
quadrupole-based ICP-MS instrument equipped with a dynamic reaction cell, was hence
developed for Pb isotope ratio analysis. Validation of the measurement protocol was
performed by comparison of the experimental results with the corresponding results
obtained by multi-collector ICP-MS and the analysis of samples with a known isotopic
composition, as is described in chapter VII.
The use of a gas in the dynamic reaction cell of a quadrupole-based ICP – mass
spectrometer is not only useful in the case of isotopic analysis, but also allows the
selective removal of spectral interferences when an appropriate reaction gas is chosen. A
measurement protocol was developed for the simultaneous determination of P, Ca and Sr
in dental tissues in order to evaluate the biogenic integrity of these tissues. The
development and validation of this measurement protocol is also discussed in chapter VII.
I.3 – Archaeological applications The digestion procedures, separation methods and measurement protocols developed
were applied to Sr or Pb isotope ratio analysis in the context of three archaeological
projects, each having its own specific question.
A first project aimed at obtaining insight into the trade relations between the Roman
Empire and the Indian subcontinent in the period 1st century BC – 1st half 2nd century AD,
and the position of the coastal site of ed-Dur in the international metal trading network of
this period. The samples investigated originate from the archaeological site of ed-Dur,
located in the Emirate of Umm al-Qaiwain (United Arab Emirates). Excavations conducted
on this site have revealed the presence of an enormous amount of imported goods, such
as metallic objects, pottery and glasswork, witnessing an international orientation. A large
collection of metallic objects and fragments (unalloyed copper, brass, bronze, silver, lead,
litharge) excavated at the site of ed-Dur was available for investigation and submitted to
Pb isotope ratio analysis. For comparison purposes, also the Pb isotopic composition of a
few metallic samples excavated at the archaeological site of Khor Rori (Oman) was
studied. Single-collector ICP – dynamic reaction cell – MS was used for Pb isotope ratio

CHAPTER I – Introduction and objectives
6
analysis of the metallic artefacts, and an attempt was made to determine the provenance
of the metallic objects studied on the basis of their Pb isotopic composition. This project
was carried out in collaboration with the research unit Near Eastern Archaeology of the
Department of Languages and Cultures of the Near East and North-Africa (Ghent
University), and the results of this study are presented in chapter VIII.
In a second study, the origin of high lead concentrations, retrieved in infant bone tissue
dating from the Roman Era, is investigated. Archaeological artefacts, excavated at the
remains of a cemetery of a Roman settlement dating from the 1st – 3rd century AD in the
village of Valkenburg (The Netherlands), are in the centre of attention. The sample set
under investigation consists of infant bone tissue, along with samples from the
surrounding soil and additional potential sources of bone lead, such as fish bones, lead
fragments and ceramics. The aim of the project is to elucidate whether the high bone
lead concentrations arise from the process of diagenesis by post-mortem lead exchange
between the bone tissue and the surrounding soil, or if in vivo lead exposure can be
identified as the cause of the high Pb content in the bone tissue of the infants. To this
purpose, the artefacts were investigated for their Pb isotopic composition using multi-
collector ICP-MS. This research was carried out in collaboration with the Amsterdam
Archaeological Center (University of Amsterdam) and the Toxicology Laboratory of the
Leiden University Medical Center, and the results obtained are summarized in chapter IX.
The third archaeological question deals with the grave field population excavated around
the basilica dedicated to Saint Servatius in Maastricht (The Netherlands). The Servatius
complex witnesses of 1 600 years of religion and is one of the most important monuments
of the Low Countries. An explorative study was carried out to obtain insight into the
heterogeneity of the populations from two grave fields, Pandhof and Vrijthof. Hereto, the
strontium isotopic composition of the dental tissues (enamel and dentine) of a number of
individuals from the buried populations were determined via multi-collector ICP-MS. The
strontium isotopic composition of enamel is a reflection of the geological area of residence
during childhood, while that of dentine reflects the geological area where the individual
under study resided during the last years of his/her life. Hence, when enamel and dentine
display a different strontium isotopic composition, this indicates that the individual has
relocated during his/her life. The results of this explorative study, carried out in
collaboration with the Amsterdam Archaeological Center (University of Amsterdam) are
presented in chapter X.
CHAPTER II
Inductively coupled plasma –
mass spectrometry
(ICP-MS)

CHAPTER II – Inductively coupled plasma – mass spectrometry (ICP-MS)
9
Since its commercial introduction in 1983, inductively coupled plasma – mass
spectrometry (ICP-MS) has continuously gained importance as an elemental detection
technique. This is owing to its (i) extremely low detection limits (ng L-1 and even sub-
ng L-1 range), (ii) multi-element character, (iii) high sample-throughput, (iv) wide linear
dynamic range and (v) relatively simple spectra [Houk et al., 1980; Gray, 1986; Gray, 1989].
These excellent figures of merit make ICP-MS one of the most powerful techniques for
trace element (< 10-4 g g-1) and ultratrace element (< 10-8 g g-1) determination.
Furthermore, ICP-MS offers the possibility to obtain information on the isotopic
composition of the target element(s). Especially with the introduction of multi-collector
ICP – mass spectrometers, combining an excellent isotope ratio precision with the
possibility of continuous nebulization of sample solution into an ion source at atmospheric
pressure and the high ionization efficiency of the ICP [Walder and Freedman, 1992; Walder and
Furuta, 1993], ICP-MS also gained growing importance in isotope ratio analysis. Next to the
standard introduction system, consisting of a pneumatic nebulizer and a spray chamber
for analysis of sample solutions (digests), the use of alternative sample introduction
systems such as electrothermal vaporization (ETV) and laser ablation (LA) allow direct
analysis of solid samples [Darke and Tyson, 1994]. Furthermore, hyphenation with separation
techniques such as capillary electrophoresis (CE), gas chromatography (GC) and high
performance liquid chromatography (HPLC) allows the use of ICP-MS in elemental
speciation studies [Zoorob et al., 1998]. Obviously, the application range of ICP-MS is
immense and this technique has become a valuable partner throughout the analytical
world, for both academic and industrial purposes.
II.1 – Operating principle In ICP – mass spectrometry, an argon inductively coupled plasma (ICP) is deployed as an
ion source. The sample under investigation, in many cases an aqueous solution, is
converted into an aerosol by means of a suited sample introduction system, and led into
the plasma. Energy transfer from plasma to sample aerosol results in desolvation of the
aerosol, atomization of the molecules and ionization of the atoms. Since the ICP is
working at atmospheric pressure, while the mass spectrometer (MS) operates under high
vacuum conditions, an interface, offering a stepwise decrease in pressure, is needed. The
interface allows only a part of the plasma gas – consisting of ions, electrons and
neutrals – to pass. After the interface, a lens (or lens system) extracts the positive ions
from the bundle and also deflects the anions and electrons. Both the neutrals and the
CHAPTER II – Inductively coupled plasma – mass spectrometry (ICP-MS)
10
negatively charged species extracted by the interface are pumped away by vacuum
pumps. The positive ion beam is then focused towards the mass spectrometer, in which
the ions are separated according to their mass-to-charge (m/z) ratio, or simplified, by
mass, when only singly positively charged ions (M+) are considered. Finally, the ions that
had a stable trajectory through the mass spectrometer are detected, resulting in a signal
intensity that is proportional to the amount of ions registered, and thus the concentration
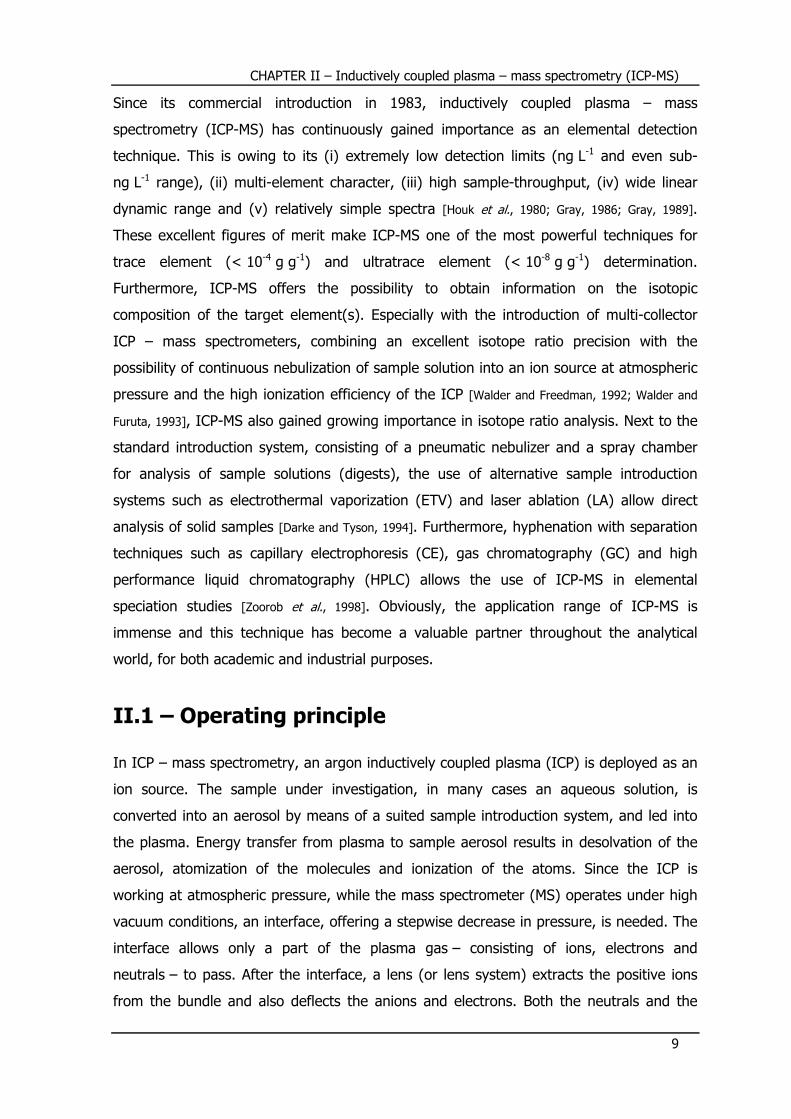
of the target element in the sample investigated [Evans et al., 1995]. A schematic
representation of a conventional quadrupole-based ICP – mass spectrometer is given in
figure II.1. What follows, is a detailed description of the principal components found in
present-day ICP-MS instrumentation.
Figure II.1 – Schematic representation of a conventional
quadrupole-based ICP – mass spectrometer
II.2 – Sample introduction system The sample introduction system serves two purposes: (i) the conversion of the sample
into an aerosol, and (ii) guiding a representative part of the sample into the plasma. In its
standard configuration, an ICP – mass spectrometer is equipped with a pneumatic
nebulizer mounted onto a spray chamber, and is suited for analysis of liquid samples, or
solid samples that have been dissolved prior to analysis. The liquid sample is converted
into an aerosol, and only the smallest droplets are transported to the plasma. Since in this
way, both the analyte (M+) and the matrix and solvent enter the plasma, the occurrence
of spectral and non-spectral interferences is triggered.
Spectral interferences occur when ions having the same nominal mass as the analyte are
formed [Horlick and Montaser, 1998]. This type of interferences is also called ‘additive
turbomolecular pumpsrotary
pump
signal handling &
data processing
detector quadrupole filter lens system skimmer
sampling cone
ICP torch
RF power
RF induction coil
sample
introduction
system
(PN, ETV, LA)

CHAPTER II – Inductively coupled plasma – mass spectrometry (ICP-MS)
11
interferences’, since they alter the intercept of the calibration curve with the Y-axis. A
sample matrix can induce two types of spectral interference: (i) plasma- and/or matrix-
induced molecular species, such as oxide-, nitride-, argide- and dimer ions (e.g., N2+,
NO+, NOH+, O2+, ArN+, ArO+, ArOH+, Ar2
+, ArM+) and (ii) singly charged ions from the
matrix elements themselves (e.g., M+ and M’+) and/or their oxides and hydroxides (e.g.,
MO+, MOH+) [Evans and Giglio, 1993]. In order to prevent spectral interferences from
occurring, various approaches can be followed [Dams et al., 1995]. The most drastic one is to
separate the analyte from the species at the origin of the interfering ion by a chemical
separation method. However, this approach is not suitable for interferences originating
from, e.g., argon. In this case, the formation of the interference in the plasma itself can
be prevented by operating the plasma under so-called ‘cold plasma’ or ‘cool plasma’
conditions, which means that the plasma is operated at low power and high injector flow
rate. As a result, the distribution of the ionic species after the plasma is totally changed,
suppressing in particular the interfering species originating from argon (e.g., Ar+ and Ar-
containing molecular ions) [Douglas and Tanner, 1998]. Alternatively, a plasma relying on
another gas than argon, e.g., helium, can be used [Sheppard et al., 1990]. Further in the
instrument, the mass analyzer itself can be of such a design that the mass resolving
power (mass resolution) is high enough to distinguish the interfering ion from the analyte.
In low-resolution (quadrupole-based) mass spectrometers, a collision/reaction cell can be
installed in-between the plasma and the mass analyzer, providing a reactor in which the
interference is chemically suppressed.
Non-spectral interferences, or matrix effects, refer to matrix-induced changes in signal
intensity that are unrelated to the presence of a spectral component [Horlick and Montaser,
1998]. A high concentration of concomitant may suppress or enhance the signal in a
complex fashion, depending on the concomitant’s concentration. In general, the presence
of a high concentration of a concomitant suppresses the analyte signal, although under
certain conditions, enhancement has been established as well. The suppression is usually
more serious with heavier matrix elements, and light analytes are more severely
influenced. This type of interferences is also called ‘multiplicative interferences’, since they
alter the slope of the calibration curve. They play a role in, e.g., the ionization equilibrium
and charge distribution in the plasma. Intensive research has been carried out with the
aim of avoiding or correcting for these effects. Replacing the standard sample introduction
system by, e.g., a desolvating system or electrothermal vaporization (ETV) were shown as
valuable alternatives. In view of the analytical problem to deal with, the best suited
sample introduction system can be selected, based on aggregation state of the sample,

CHAPTER II – Inductively coupled plasma – mass spectrometry (ICP-MS)
12
matrix composition, amount of sample available, desired analysis speed and analyte
concentration.
II.2.1 – Pneumatic nebulization systems
Liquid sample introduction is the most common way to bring a sample into the plasma
[Montaser et al., 1998-a]. Generally, liquids are dispersed into fine aerosols before being
introduced into the ICP. Typically, the quality of the aerosol is improved by removing the
large droplets from the aerosol stream by means of a spray chamber.
II.2.1.1 – Nebulizers
The most widespread sample introduction device in ICP – (optical and mass) spectrometry
is the pneumatic nebulizer (PN). Below, three types of nebulizers are discussed: (i) the
concentric nebulizer, (ii) the crossflow nebulizer and (iii) the microconcentric nebulizer.
More information on other nebulizer devices available, such as the ultrasonic nebulizer,
the thermospray nebulizer and the direct injection nebulizer, can be found in dedicated
sources, e.g., [Montaser et al., 1998-a].
II.2.1.1.1 – Concentric nebulizer
One of the most frequently used nebulizers is the concentric nebulizer of the Meinhard
type (figure II.2.a) [Meinhard et al., 1992]. This nebulizer consists of 2 glass or quartz
capillaries that are mounted in a concentric setup. The liquid sample solution flows in the
inner capillary, and an Ar gas stream flows in the outer capillary. At the tip of the
nebulizer, where both capillaries join, the outer (gas) capillary narrows, causing an
acceleration of the Ar flow and thus a decreased pressure in the inner (liquid) capillary.
This effect is known as the Venturi effect. The interaction between the accelerated gas
flow and the liquid flow at the nebulizer tip breaks up the liquid into an aerosol. The
sample solution is spontaneously aspirated into the liquid capillary owing to the Venturi
effect (self-aspiration or auto-aspiration). Despite this phenomenon, in most cases a
peristaltic pump is used because in this way, the sample uptake rate is independent of the
viscosity of the sample solution, and hence, the sample flow can be controlled. This
results in a better long-term stability.

CHAPTER II – Inductively coupled plasma – mass spectrometry (ICP-MS)
13
II.2.1.1.2 – Crossflow nebulizer
In a crossflow nebulizer [Kniseley et al., 1974], two adjustable capillary tubes (GemTips) are
mounted at right angles with respect to each other in a polytetrafluoroethylene (PTFE)
body. The vertical capillary guides the liquid sample, while the horizontal capillary guides
an argon gas stream. The relative positions of the capillaries can be adjusted to achieve
optimal performance, what, in its turn, negatively affects the long-term stability of the
nebulizer if the capillaries move. The interaction between the liquid flow and the
perpendicular gas flow causes the liquid sample to be broken up into an aerosol.
Regarding the absence of the Venturi effect, this type of nebulizer is always used in
combination with a peristaltic pump for sample delivery.
II.2.1.1.3 – Microconcentric nebulizer
The microconcentric nebulizer (MCN) is a highly efficient nebulizer for operation at low
sample uptake rates (< 1 mL min-1). Different types are available, manufactured from
quartz or a HF-resistant material. It was shown for a MCN-100 microconcentric nebulizer
(figure II.2.b) that when operated at a solution uptake rate of 30 µL min-1, the MCN can
provide detection limits similar to those of a PN consuming sample solution at a rate of
1000 µL min-1 [Vanhaecke et al., 1996-a].
Figure II.2 – Nebulizers – (a) concentric nebulizer of the Meinhard type; (b) MCN-100 microconcentric nebulizer
II.2.1.2 – Spray chambers
Nebulizers produce aerosols that are very dispersed in diameter, up to 100 µm, while only
droplets with a diameter less than 10 µm lead to an efficient desolvation, atomization and
ionization in the plasma [Montaser et al., 1998-a]. Hence, a spray chamber is needed to
remove the large droplets from the aerosol that will be transported to the plasma. In this
inner capillary
nozzleliquid
sample
Ar flow
inner capillary
nozzle
HF-resistant body
liquid
sample
Ar flow(a) (b)

CHAPTER II – Inductively coupled plasma – mass spectrometry (ICP-MS)
14
way, a stable and efficient plasma operation is guaranteed. Below, the cyclonic and the
double-pass Scott-type spray chambers are described.
II.2.1.2.1 – Cyclonic spray chamber
A cyclonic spray chamber (figure II.3.a) [Vieira et al., 1986] has a conical shape, and the
aerosol enters through a tangential inlet on the periphery of the spray chamber body and
flows in a downward spiral motion. This motion leads to a centrifugal force acting on the
droplets. The larger (heavier) droplets impact against the side of the spray chamber and
are evacuated. In the lower region of the spray chamber, the aerosol changes direction
and moves upward in an even tighter spiral, concentric with the original path. Finally, the
finest droplets pass through the outlet tube towards the plasma.
II.2.1.2.2 – Double-pass Scott-type spray chamber
The double-pass spray chamber of the Scott-type [Scott et al., 1974] is shown in
figure II.3.b. In this type of spray chamber, the larger droplets are removed by turbulent
deposition on the inner walls of the spray chamber, and by gravity. The inner concentric
tube reduces random fluctuations in signal intensity, much of which originate from aerosol
density changes in the spray chamber.
Figure II.3 – Spray chambers – (a) cyclonic spray chamber; (b) double-pass Scott-type spray chamber
II.2.1.3 – Performance
The combination of a pneumatic nebulizer and a spray chamber is characterized by its (i)
relatively low cost, (ii) instrumental simplicity, (iii) high sample-throughput and (iv) good
nebulizer
aerosol
to drain
to ICP(a)
nebulizer
aerosol
to drain
to ICP(b)

CHAPTER II – Inductively coupled plasma – mass spectrometry (ICP-MS)
15
stability. Despite these advantages, (i) the transport efficiency of this introduction system
is limited to 1-2 % [Olesik and Bates, 1995], (ii) the simultaneous introduction of analyte(s)
and matrix can give rise to spectral interferences and matrix effects and (iii) the
application range of this setup is limited to sample solutions.
II.2.2 – Aridus aerosol desolvating device
One of the drawbacks of using pneumatic nebulization is that they transport so much
solvent into the plasma that it may extinguish the plasma or alter the plasma’s properties
significantly. Reducing the water content results in improved detection limits, higher
ionization temperatures and affects the electron number density [Walters and Barnardt, 1988],
illustrating the importance of controlling the solvent load in ICP – (optical and mass)
spectrometry. Desolvation is achieved by heating the aerosol so that the solvent
evaporates from the aerosol. Heating is accomplished either in a heated spray chamber
[Veillon and Margoshe, 1968] or in a separately heated tube [Peters and Beauchemin, 1993]. An
Aridus aerosol desolvating system [Botto and Zhu, 1994] is schematically presented in
figure II.4 and consists of a microconcentric nebulizer and a heated spray chamber, both
manufactured from polytetrafluoroethylene (PTFE). By heating the spray chamber
(± 70 °C), initially larger droplets can be transported to the plasma, so that the analyte
transport efficiency – and along with it, the sensitivity – increases. This also implies that
larger amounts of solvent can be introduced into the ICP, leading to plasma instability and
decreasing analyte ionization efficiency. In order to avoid this effect, the aerosol is passed
from the spray chamber through a heated (± 160 °C) microporous membrane. The
Figure II.4 – Schematic representation of an Aridus desolvating device
liquid sample
microconcentric
nebulizer
heated spray
chamber
Ar flow out
Ar flow in
heated porous
membrane
N2 addition
to ICP

CHAPTER II – Inductively coupled plasma – mass spectrometry (ICP-MS)
16
solvent vapors penetrate through the membrane and are evacuated by means of a heated
argon gas stream. In this way, the occurrence of solvent-based interferences (e.g., oxide
and hydroxide ions) is strongly reduced. Drawbacks of this sample introduction system
are (i) loss of volatile elements in the desolvating system, (ii) increasing risk on memory
effects and (iii) clogging of the nebulizer or the membrane pores owing to solid particles
present in the sample solution.
II.2.3 – Alternative sample introduction systems
II.2.3.1 – Electrothermal vaporization (ETV)
In electrothermal vaporization (ETV) [Carey and Caruso, 1992], the sample is deposited into a
graphite tube which acts as an oven. The oven temperature can be raised stepwise, up to
3000 °C. Depending on its evaporation temperature, the analyte will evaporate before or
after the matrix. When the aerosol that contains the analyte is formed, this aerosol is
transmitted to the ICP by means of an argon gas stream. Benefits of this technique are (i)
the possibility of direct analysis of solid samples, (ii) matrix-free introduction of the
analytes into the plasma, avoiding spectral interferences and matrix effects from occuring
and (iii) a high transport efficiency (gas) and consequently, a high sensitivity. Drawbacks
are (i) the loss of multi-element character due to the transient signals generated and (ii)
the limited precision in solid sample analysis of 5-20 % RSD compared to 1-2 % RSD with
sample introduction via pneumatic nebulization.
II.2.3.2 – Laser ablation (LA)
Next to ETV, also laser ablation (LA), introduced by Gray [Gray, 1985], can be applied for
direct analysis of solid samples. Here, a highly energetic laser beam is focused onto the
sample surface, causing the ablation of a limited amount of the solid sample. The sample
aerosol, formed by impact of the laser beam, is guided to the plasma by means of an
argon or helium gas flow. More detailed information on laser ablation can be found in
dedicated sources, e.g., [Günther et al., 1999].
II.3 – Inductively coupled plasma (ICP) The ion source in ICP – mass spectrometry is an inductively coupled plasma (ICP), which
is a gaseous mixture of molecules, atoms, ions and electrons at a high temperature

CHAPTER II – Inductively coupled plasma – mass spectrometry (ICP-MS)
17
(6 000-8 000 K) [Montaser et al., 1998-b]. The ICP is generated at the end of a plasma torch,
usually manufactured from quartz and consisting of three concentric tubes. A schematical
representation is given in figure II.5. Argon gas is passed through each tube, but in every
tube at a different flow rate. The plasma gas or cool gas (flow rate 10-20 L min-1) passes
between the outer and middle tube, maintains the plasma and acts as a thermal barrier
between the plasma and the torch, preventing the torch from melting. The auxiliary gas
(flow rate 1-1.5 L min-1) passes between the middle and inner tube and is used to change
the position of the base of the plasma relative to the torch. In the inner tube, or injector
tube, the nebulizer gas (flow rate 0.8-1.2 L min-1) carries the sample aerosol generated by
the sample introduction system. This nebulizer gas flow punctures the plasma, causing a
toroidal plasma shape. When argon gas is flowing through the torch, the plasma can be
ignited by a high-voltage spark, or Tesla discharge, which causes some electrons to be
stripped from argon atoms. Owing to the presence of charged particles, the plasma can
be supplied with energy from a radiofrequent (RF) alternating current passing through the
induction coil around the torch.
Figure II.5 – Schematic representation of plasma torch and interface region
Energy transfer from plasma to sample aerosol results in desolvation of the aerosol,
atomization of the molecules and ionization/excitation of the atoms [Gray, 1975]. The latter
process can occur via different mechanisms; the most important mechanisms are:
• Thermal ionization/excitation; collisions between atoms, ions and electrons:
M e M 2e ; M A M A e
plasma gas
auxiliary gas
nebulizer gas
torch
RF induction coil
sampling cone skimmer
expansion zone
lens
photon stop

CHAPTER II – Inductively coupled plasma – mass spectrometry (ICP-MS)
18
• Penning ionization/excitation; collisions between atoms in ground state and
metastable argon species:
Ar M Ar M e ; Ar M Ar M e
• Ionisation/excitation by charge transfer; charge transfer between atoms and ions:
Ar M Ar M ; Ar M 2Ar M II.4 – Interface region The role of the interface is to transport the ions efficiently, consistently and with electrical
integrity from the plasma, operating at atmospheric pressure, to the mass spectrometer
region, operating at high vacuum [Houk et al., 1980]. The interface consists of a sampling
cone and a skimmer, two metallic, water-cooled cones with a small central orifice that are
coaxially mounted (figure II.5). When the plasma gas enters the space between sampling
cone and skimmer (expansion zone), the bundle consisting of ions, electrons and neutral
species is expanded due to the higher vacuum (lower pressure) in the expansion zone.
The central part of the beam leaves the expansion zone through the skimmer orifice,
entering a subsequent higher vacuum stage. At every vacuum stage, a vacuum pump
pumps away residual components. After passing the interface cones, an electrostatic lens
(or lens system) deflects anions and electrons while positively charged ions are focused
and directed towards the mass spectrometer.
II.5 – Mass spectrometers In ICP – mass spectrometry, the ions that are formed in the plasma and extracted by the
interface are separated according to their mass-to-charge (m/z) ratio. Since only singly
positively charged ions are considered (z = 1), this implies a separation according to
mass. Different types of mass spectrometers have been developed [Turner et al., 1998], so
that ICP-MS instruments can be distinguished according to their mass separating device:
(i) a quadrupole filter (± 90 %), (ii) a sector field (SF) mass spectrometer (≤ 10 %) or
(iii) a time-of-flight (TOF) analyzer (a few instruments). The quadrupole filter and the
sector field mass spectrometer are discussed below, while information on time-of-flight
analyzers can be found in dedicated sources, e.g., [Myers et al., 1994; Myers et al., 1995-a; Myers
et al., 1995-b].

CHAPTER II – Inductively coupled plasma – mass spectrometry (ICP-MS)
19
Probably the most important characteristics of a mass spectrometer are (i) its scanning
speed, (ii) its mass resolution, or its capability to distinguish adjacent peaks of
neighboring masses, and (iii) its abundance sensitivity. In general, resolution R can be defined as (figure II.6.a):
R (equation II.1)
with m the analyte mass and Δm the peak width at 5% of the peak height.
Two adjacent peaks of the same height at masses m and m are considered to be separated (resolved) when the valley between them is less than 10 % of the peak height.
This leads to the alternative definition for mass resolution, the so-called ’10 % valley’
definition (figure II.6.b), according to which the mass resolution is expressed as:
(equation II.2)
Figure II.6 – Mass resolution – (a) traditional definition; (b) ‘10% valley’ definition
Typical resolutions are 300 for quadrupole mass spectrometers, and 300 (low resolution),
4 000 (medium resolution) and up to 10 000 (high resolution) for sector field mass
spectrometers.
When a small peak is measured adjacent to a larger peak, not only must that peak be
resolved, but any tailing from the larger peak affecting the smaller peak should be
minimal. The abundance sensitivity of a mass spectrometer is a measure for the extent of
this tailing, and can be expressed in terms of peak heights and peak areas. The height h and area a of a peak at mass m, m 1 and m 1 is h and a, h and a, and h and a, respectively. The low-mass abundance sensitivity, expressed in terms of
peak height or peak area, is given by the respective ratios:
100% 100%
5% 10%
m-1 m m+1 m1 m2m1 + m2
2
∆m
(a) (b)
CHAPTER II – Inductively coupled plasma – mass spectrometry (ICP-MS)
20
!" ! (peak height) and
#!"#! (peak area) (equation II.3)
while the high-mass abundance sensitivity, expressed in terms of peak height or peak
area, is given by the respective ratios:
! ! (peak height) and
#!#! (peak area) (equation II.4)
II.5.1 – Quadrupole filter
II.5.1.1 – Description
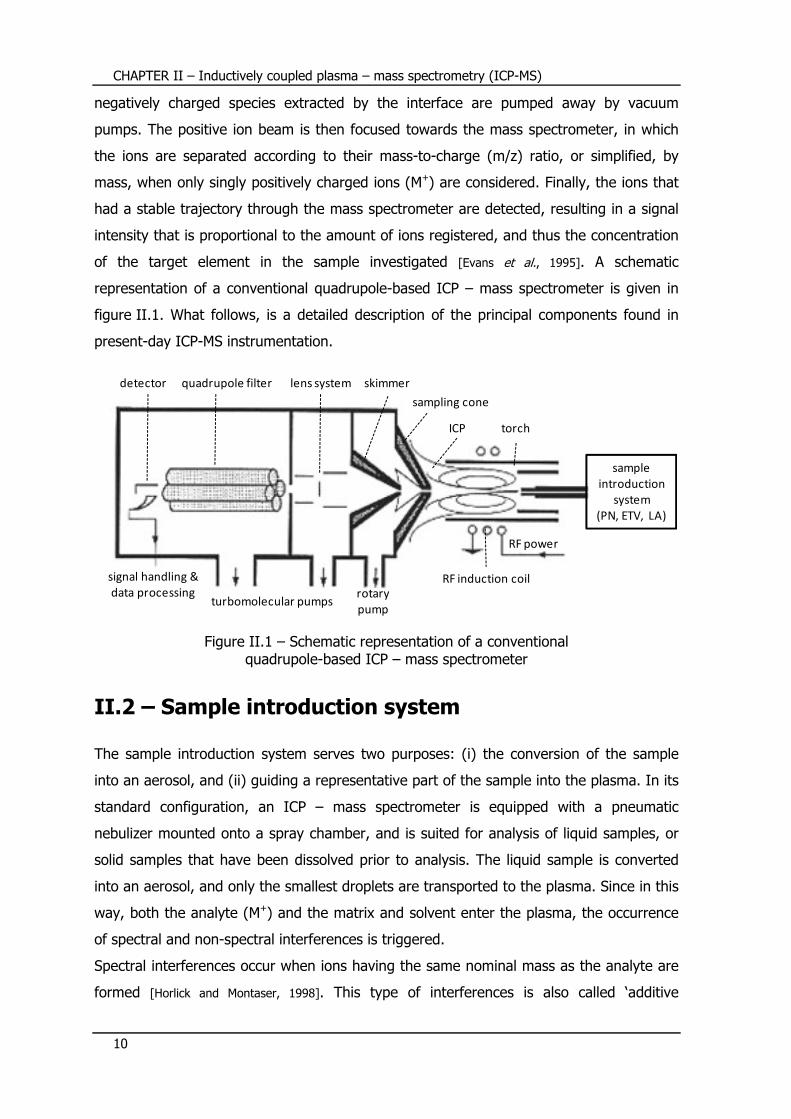
A quadrupole filter (figure II.7) consists of four cylindrical rods, positioned at the corners
of a square [Turner et al., 1998]. The diagonally opposed rods are electrically connected, so
that two electrode pairs are formed. Each electrode pair is supplied with a combination of
a direct current (DC) and a radiofrequent (RF) voltage. The magnitude of the voltage on
both electrode pairs is the same while the sign is opposite. The quadrupole acts as a mass
filter. Ions entering the quadrupole can either traverse according to a stable trajectory
and finally reach the detector, or they can follow an unstable trajectory and be removed
from the quadrupole prior to arrival at the detector. In this way, a quadrupole only allows
the passage of ions within a narrow bandpass, typically 1 atomic mass unit (u) in width.
Figure II.7 – Quadrupole filter
RF/DC voltage
unstable ion trajectory
stable ion trajectory
CHAPTER II – Inductively coupled plasma – mass spectrometry (ICP-MS)
21
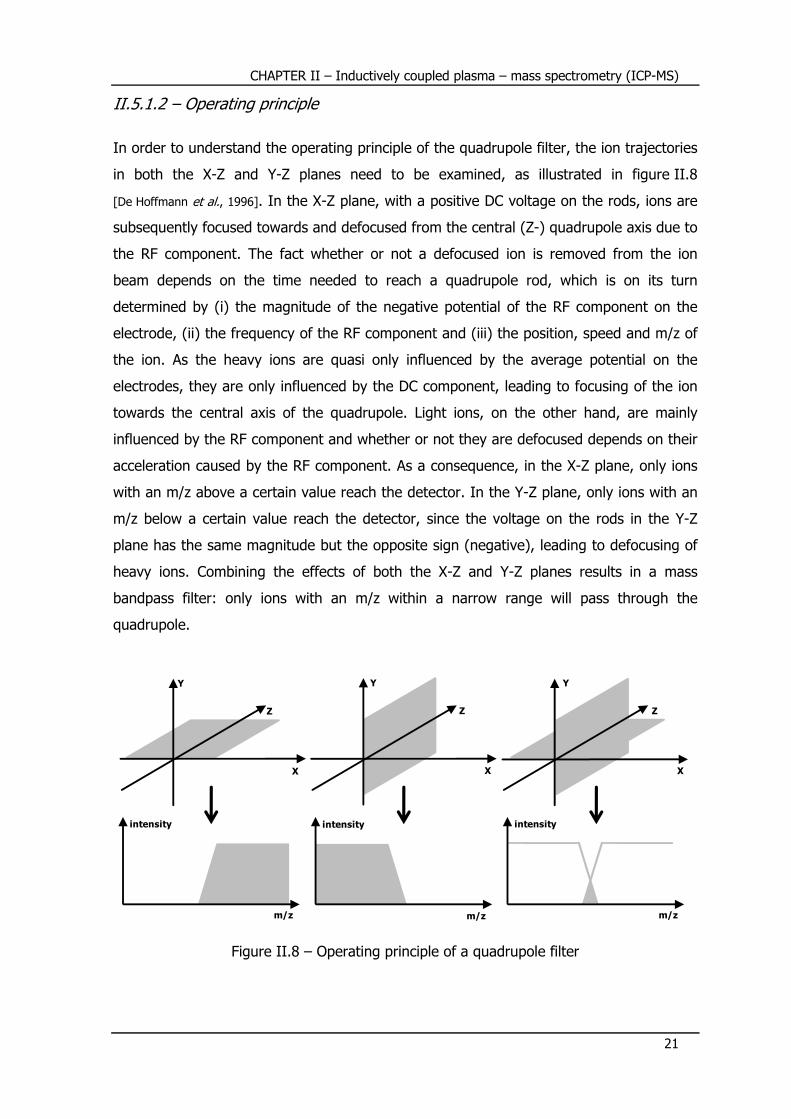
II.5.1.2 – Operating principle
In order to understand the operating principle of the quadrupole filter, the ion trajectories
in both the X-Z and Y-Z planes need to be examined, as illustrated in figure II.8
[De Hoffmann et al., 1996]. In the X-Z plane, with a positive DC voltage on the rods, ions are
subsequently focused towards and defocused from the central (Z-) quadrupole axis due to
the RF component. The fact whether or not a defocused ion is removed from the ion
beam depends on the time needed to reach a quadrupole rod, which is on its turn
determined by (i) the magnitude of the negative potential of the RF component on the
electrode, (ii) the frequency of the RF component and (iii) the position, speed and m/z of
the ion. As the heavy ions are quasi only influenced by the average potential on the
electrodes, they are only influenced by the DC component, leading to focusing of the ion
towards the central axis of the quadrupole. Light ions, on the other hand, are mainly
influenced by the RF component and whether or not they are defocused depends on their
acceleration caused by the RF component. As a consequence, in the X-Z plane, only ions
with an m/z above a certain value reach the detector. In the Y-Z plane, only ions with an
m/z below a certain value reach the detector, since the voltage on the rods in the Y-Z
plane has the same magnitude but the opposite sign (negative), leading to defocusing of
heavy ions. Combining the effects of both the X-Z and Y-Z planes results in a mass
bandpass filter: only ions with an m/z within a narrow range will pass through the
quadrupole.
Figure II.8 – Operating principle of a quadrupole filter
X
Z
Y
X
Z
Y
X
Z
Y
intensity
m/z
intensity
m/z
intensity
m/z

CHAPTER II – Inductively coupled plasma – mass spectrometry (ICP-MS)
22
During operation of the mass filter, the potential field in the quadrupole Φ is given by
[Turner et al., 1998]:
Φ $ % & '() * V cosωt U 2 (equation II.5)
with x and y the distance to the X- and Y-axis respectively, r5 the distance from the rods to the central (Z-)axis, V the amplitude of the RF voltage, ω the RF frequency, t the time and U the DC voltage offset.
The full equations of motion along the X-, Y- and Z-axis of the quadrupole are given by:
6%67 8() * U V cosωt 2 x 0 (equation II.6)
6&67 8() * U V cosωt 2 y 0 (equation II.7)
6:67 0 (equation II.8)
with e and m the charge and mass of the ion, respectively.
These equations result in a sinusoidal trajectory along the X- and Y-axis. By the
substitution:
ωt 2ξ (equation II.9)
and the introduction of the Mathieu parameters a and q where
a < a% a& =8Uω() (equation II.10)
q < q% q& ?8Vω() (equation II.11)
the Mathieu equation becomes:
6A6ξ – * a 2q cos2ξ 2 u 0 (equation II.12)
where u x or y.
The solutions of the Mathieu equation fall apart into two categories:
• The ‘stable’ ion trajectories describe the paths of ions passing along the full length
of the quadrupole filter without hitting the rods.
• The ‘unstable’ ion trajectories represent the paths of ions that hit the quadrupole
rods and are therefore lost from the system.
The magnitude of the DC and RF components is critical for proper operation of the
bandpass filter. The ratio U/V determines the width of the bandpass filter, while the

CHAPTER II – Inductively coupled plasma – mass spectrometry (ICP-MS)
23
absolute values of U and V determine its position. A stability diagram can be constructed,
showing the values for the Mathieu parameters a and q that lead to a stable ion trajectory (figure II.9.a). Several stable regions can be distinguished, but in commercially available
ICP-MS instruments, the quadrupole is operated in the first stability region only. A line,
representing the ratio a/q 2U/V can be drawn on the stability diagram (figure II.9.a).
This line represents the situation where the ratio of the amplitudes of the RF and DC
components is held constant, while their absolute values are increased. Such a line is
known as a mass scan line, and consists of all the values of a and q occurring in the scan.
When the parameters e, ω, r5, U and V are kept constant, the mass scan line can be
considered as a line of points, each representing a certain mass. Since m is inversely
proportional to a and q, the low masses are to be found in the right upper corner and the
high masses in the lower left corner. The slope of the mass scan line can be adjusted by
appropriate parameter settings so that only a small segment of the mass scan line
intersects the stable region. As a consequence, only ions with an m/z corresponding to
the masses in the stable segment of the mass scan line will travel a stable trajectory
through the quadrupole. A mass scan can be performed by a linear increase of the DC –
and RF components while their ratio is kept constant. When one point of the mass scan
line, inside the stable region, is considered when U and V are increased, this point
corresponds to an increasing m/z, so that the position of the bandpass window is moved
across the mass range. The a versus q stability diagram can be replaced by a U versus V diagram (figure II.9.b) since ω and r5 are constant and only singly charged positive ions are considered. This diagram is only valid for one particular mass. In figure II.9.b, the
stability diagrams for 4 masses are displayed, and when scanning according to the
scanline, a mass spectrum is obtained.
Figure II.9 – First stability region of a quadrupole mass filter and mass scan line – (a) a versus q stability diagram; (b) U versus V diagram
a
q
0.00
0.24
0.0 1.0
first
stability
region
(a)
m1
m2
m3
m4
m1 < m2 < m3 < m4
U
V
(b)

CHAPTER II – Inductively coupled plasma – mass spectrometry (ICP-MS)
24
When the voltages applied on the quadrupole rods are continuously varied, a selected
mass range is scanned (mass scan). In case of a discrete variation of the applied
voltages, only selected masses are registered (peak hopping).
II.5.1.3 – Performance
Advantages of a quadrupole filter are its (i) robustness, (ii) limited dimension, (iii) high
scanning speed, (iv) maintenance of resolution in the case where the introduced ions
have an energy distribution and (v) relatively low price. As drawbacks, its limited mass
resolution (± 300) and the triangular peak shapes can be noted.
II.5.2 – Sector field mass spectrometer
II.5.2.1 – Description
The full potential of ICP-MS cannot be exploited to the fullest extent by conventional
quadrupole-based instrumentation because of spectral overlap. To overcome this
problem, different techniques have been developed and applied with varying levels of
success. A very effective approach for the improvement of ICP-MS analysis, is the
combination of an inductively coupled plasma with a sector field – or high resolution mass
spectrometer [Jakubowski et al., 1998; Moens and Jakubowski, 1998; Turner et al., 1998]. This type of
mass separating device is essentially a combination of a magnetic sector and an
electrostatic sector in such a way that so-called ‘double focusing’ is achieved.
II.5.2.2 – Magnetic sector
A magnetic sector analyzer [Turner et al., 1998] consists of a curved flight tube located in the
gap between the poles of an electromagnet. The ions produced in an ion source are
accelerated into the magnetic field BFFG through the entrance slit (source slit). The magnetic
field is perpendicular to the flight direction of the ions and has a mass-dispersing and
direction-focusing effect on ions. Due to the acceleration by the lens system, the ions
obtain an amount of kinetic energy, EI, given by:
EI J qV (equation II.13)
with m the mass of the ion, v its velocity, q its charge and V the potential difference leading to acceleration.

CHAPTER II – Inductively coupled plasma – mass spectrometry (ICP-MS)
25
These ions will undergo the Lorentz force, FFGL, given by:
FFGL q $ vFG N BFFG ' (equation II.14)
which is perpendicular to the direction of motion and the magnetic field. Its magnitude is
given by:
FL qvB (equation II.15)
Under the influence of this force, an ion is deflected into a circular path with radius r, resulting into the relation:
F J( qvB (equation II.16)
It follows that the radius r of the circular path described by the ion is given by:
r JOB (equation II.17)
and that this radius increases with increasing ion mass and increasing speed at the time
the ion enters the magnetic sector. The radius decreases with increasing ion charge and
increasing magnitude of the magnetic field. After elimination of the unknown parameter v by means of equation II.13, the radius can be expressed in terms of known parameters as
follows:
r Q VO B (equation II.18)
From this expression, it is clear that ions with a different mass-to-charge ratio (m/q in this case) are following a different circular trajectory, and hence are separated in space. When
detection is performed by means of a photo plate, the impact of the ions in different
points will generate a mass spectrum. In the case where detection is done with a fixed
detector, ions with the desired m/z can be selected by adjusting the magnitude of the
accelerating potential V or the magnetic field B. At a given magnetic field B, only ions with a particular m/z ratio will travel along a stable trajectory through the magnetic sector and
leave the sector via the exit slit (collector slit).
II.5.2.3 – Electrostatic sector
The energy spread of an ion beam limits the resolving power of a magnetic sector
analyzer. Only when all the ions have the same kinetic energy at the moment they enter
CHAPTER II – Inductively coupled plasma – mass spectrometry (ICP-MS)
26
the magnetic sector, ions with the same m/z will be focused into the same point. In
practice, there is always a distribution in kinetic energy among the ions, which may result
in focusing of ions with the same kinetic energy but different m/z in the same point. To
overcome the problem of ion kinetic energy spread in high resolution mass spectrometry,
energy focusing by means of an electrostatic sector is necessary [Turner et al., 1998]. This
sector consists of two curved plates with an electric field EFFG applied between them.
Generally, the outer plate is positive, the inner plate is negative and the centerline is at
ground. Ions passing between these plates are subject to an electric force FFGE, given by:
FFGE qEFFG (equation II.19)
with magnitude:
FE qE (equation II.20)
and are forced to move according to a circular trajectory. Thus:
F J( qE (equation II.21)
Taking into account the expression for the kinetic energy (equation II.13), it follows that:
r JOE ESOE (equation II.22)
The higher the kinetic energy of an ion, the higher the radius of its circular path in the
electrostatic sector. As a consequence, ions with the same m/z but a different kinetic
energy will be focused in different points according to their kinetic energy, while ions with
a different m/z but the same kinetic energy are focused in the same point. When a plate
with a narrow slit is placed after the electrostatic sector, this setup can be used as an
energy filter: only ions with a kinetic energy in a narrow range will leave the electrostatic
sector, and the spread in kinetic energy is governed by the slit width. Placing such an
energy filter before or after the magnetic sector considerably enhances the attainable
mass resolution.
II.5.2.4 – Double focusing setup
The combination of a magnetic and electrostatic sector results in high resolution, but
since a large fraction of the ion beam is eliminated, the transmission efficiency is low.
Therefore, the sectors are designed and are positioned relative to each other in such a
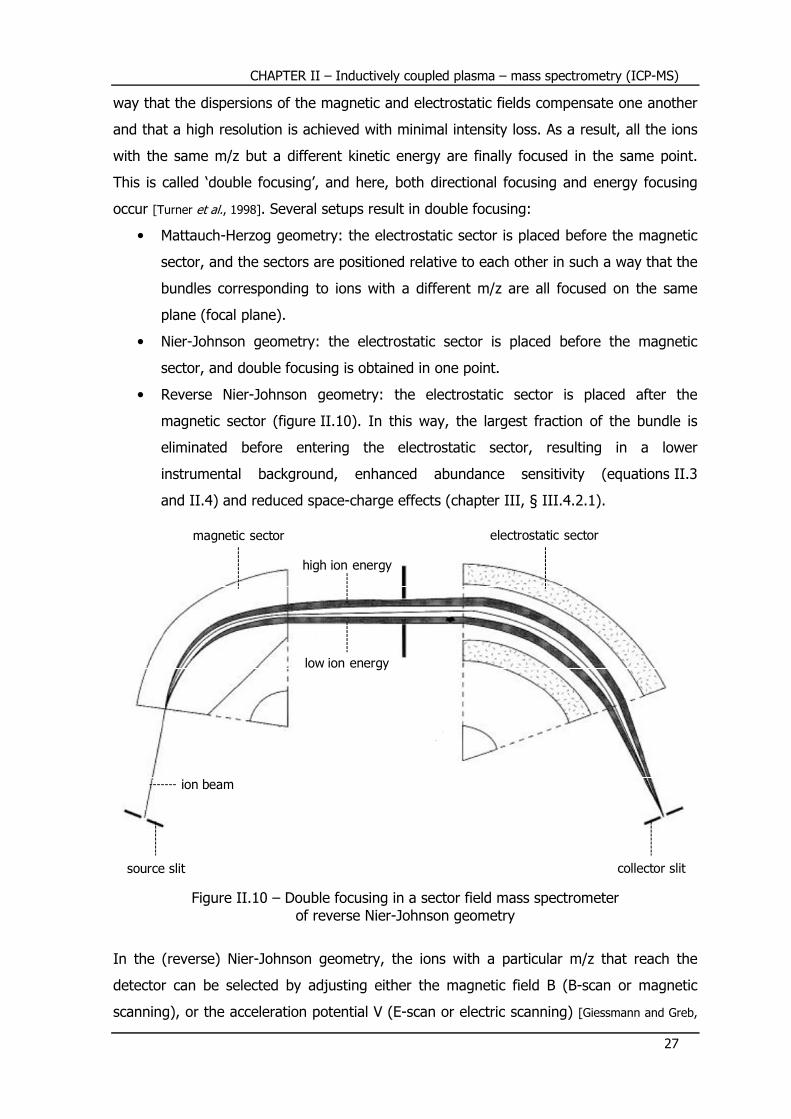
CHAPTER II – Inductively coupled plasma – mass spectrometry (ICP-MS)
27
way that the dispersions of the magnetic and electrostatic fields compensate one another
and that a high resolution is achieved with minimal intensity loss. As a result, all the ions
with the same m/z but a different kinetic energy are finally focused in the same point.
This is called ‘double focusing’, and here, both directional focusing and energy focusing
occur [Turner et al., 1998]. Several setups result in double focusing:
• Mattauch-Herzog geometry: the electrostatic sector is placed before the magnetic
sector, and the sectors are positioned relative to each other in such a way that the
bundles corresponding to ions with a different m/z are all focused on the same
plane (focal plane).
• Nier-Johnson geometry: the electrostatic sector is placed before the magnetic
sector, and double focusing is obtained in one point.
• Reverse Nier-Johnson geometry: the electrostatic sector is placed after the
magnetic sector (figure II.10). In this way, the largest fraction of the bundle is
eliminated before entering the electrostatic sector, resulting in a lower
instrumental background, enhanced abundance sensitivity (equations II.3
and II.4) and reduced space-charge effects (chapter III, § III.4.2.1).
Figure II.10 – Double focusing in a sector field mass spectrometer
of reverse Nier-Johnson geometry
In the (reverse) Nier-Johnson geometry, the ions with a particular m/z that reach the
detector can be selected by adjusting either the magnetic field B (B-scan or magnetic
scanning), or the acceleration potential V (E-scan or electric scanning) [Giessmann and Greb,
source slit collector slit
electrostatic sectormagnetic sector
ion beam
high ion energy
low ion energy
CHAPTER II – Inductively coupled plasma – mass spectrometry (ICP-MS)
28
1994]. A disadvantage of magnetic scanning is that, due to magnet hysteresis, a ‘settling
time’ is needed when jumping from one m/z to another. This settling time scales linear to
the mass difference in the jump. In electric scanning, hysteresis is avoided, allowing the
fast scanning of a mass range, however within a range of 30 % around the selected m/z
only.
II.5.2.5 – Performance
The most important advantage of high resolution mass spectrometers is their excellent
mass resolution compared to quadrupole devices, and the possibility to work at increased
mass resolution depending on the analytical problem. However, the resolution attainable
depends on the width of the source and collector slits. The higher the resolution, the
smaller the width of the slits, and thus the lower the transmission efficiency. The
sensitivity is decreased by a factor of 10 when changing from low (300) to medium
(4 000) resolution [Moens et al., 1995]. Another disadvantage of this type of mass
spectrometers is the high cost and the fact that even the maximal resolution attainable is
not sufficient to remove all spectral interferences (e.g., isobaric nuclides). An important
advantage of sector field mass spectrometers over quadrupole devices for isotopic
analysis is the fact that the former provides flat-topped peak shapes when operated in
low resolution mode [Vanhaecke et al., 1996-b], while the peak shape for the latter is
triangular. When the resolution is increased, however, the peak shape changes from flat-
topped (trapezoidal) to triangular.
II.6 – Collision/reaction cell technology As already stated in § II.2, the major drawback of ICP-MS is the occurrence of spectral
interferences and matrix effects. Although sector field ICP-MS offers an elegant solution
to cope with most spectral interferences, it is not able to resolve the signals of isobaric
nuclides. For example, the resolution required to separate the signals of the isobaric
nuclides 87Rb+ and 87Sr+ is ~ 300 000, while the maximum attainable resolution with
modern sector field instrumentation is ~ 10 000. As opposed to physical resolution with a
sector field mass spectrometer, quadrupole-based ICP-MS with chemical resolution in a
dynamic reaction cell offers a valuable solution, as was illustrated for the 87Rb+/87Sr+ case
[Moens et al., 2001].

CHAPTER II – Inductively coupled plasma – mass spectrometry (ICP-MS)
29
The principle of this technology is the presence of a gas-filled cell that is placed in-
between the interface and the quadrupole mass analyzer. The reduction of spectral
interferences by means of this cell is based on a different reaction behavior between the
gas in the cell on one hand, and the analyte ion and interfering ion, on the other hand.
This phenomenon is addressed as ‘chemical resolution’.
II.6.1 – History of collision/reaction cells
Multipole collision cells [Turner et al., 1997] in quadrupole-based instrumentation offer a
quite general approach to cope with the problem of spectral interferences. These
multipole collision cells replace the traditional ion lens system and consist of n rods
(where n = 4 for a quadrupole, n = 6 for a hexapole and n = 8 for an octopole) to which
an RF voltage is applied. If an appropriate gas is used (e.g., H2 for the reduction of Ar+
and ArX+ and Xe for the reduction of MO+), the signal of interfering ions can be reduced
by means of charge transfer reactions and/or collision-induced dissociation (CID).
The application of collision cells has a long history in organic mass spectrometry, where
they have been used in tandem mass spectrometry arrangements to study the
fragmentation of complex organic molecules due to collision-induced dissociation (CID)
[Busch et al., 1988]. The application of such triple quadrupole setups in analytical plasma
spectrometry was first performed in glow discharge – mass spectrometry (GD-MS), where
an intermediate collision cell was used to dissociate ArFe+ and Fe2+ [King et al., 1988]. This
approach was later extended to the dissociation of TaO+, an extremely refractory oxide
ion [King and Harrison, 1989]. Significant reduction of molecular interferences could be
achieved by collision-induced dissociation when the collisional energy was sufficiently high
to break the molecule bond. Douglas first described the use of CID in ICP-MS, and
showed that strong losses of both the analyte and interfering ions can be expected
because of charge transfer between the ions and scattering effects [Douglas, 1989]. This
result was only partly corroborated in another contemporary study. The use of an
arrangement with two quadrupoles where the first quadrupole acts as collision cell and
the second quadrupole acts as mass analyzer, showed that low-energy gas phase
collisions with a reaction gas such as Xe or CH4 can be successfully applied for reduction
of polyatomic interfering ions, while retaining a signal intensity of 60-70 % of the signal
intensity without a reaction gas [Rowan and Houk, 1989]. Rowan and Houk recognized that
useful ion-molecule reactions were occurring and the removal of interfering ions was
partly attributed to such reactions. They also deduced that the energy of the reaction

CHAPTER II – Inductively coupled plasma – mass spectrometry (ICP-MS)
30
product ions would be lower than that of ions from the extracted plasma beam and
showed that these ions could be discriminated against by biasing the mass filter positive
relative to the collision cell. They thus established the basis for what is at present known
as ‘kinetic energy discrimination’ techniques. However, the practical use of these ion-
molecule reactions remained questionable as a result of the loss of ions from the first
quadrupole due to scattering events. Moreover, the introduction of high resolution mass
spectrometers captured much attention in the following years. After a period of relative
silence concerning this topic, it was shown that H2 could be successfully used in the
reduction of the Ar+ signal [Eiden et al., 1996]. From this moment on, the ion-molecule
reaction approach was adopted by other research groups and commercialized by several
manufacturers of ICP-MS instruments. Additional information on the collision/reaction cell
technology can be found in dedicated sources, e.g., [Feldmann et al., 1999-a; Feldmann et al.,
1999-b; Koppenaal et al., 2004].
II.6.2 – Dynamic reaction cell (DRC)
Also by means of a dynamic reaction cell (DRC) [Tanner and Baranov, 1999; Tanner et al., 2002],
spectral interferences can be chemically resolved. In this case, an RF/DC quadrupole
assembly is used. Baranov and Tanner first described the use of a quadrupole cell, in
which reactions take place between the ions extracted from the plasma and a reactive gas
at elevated pressure [Baranov and Tanner, 1999]. In contradiction to traditional collision cells,
the incidence of collisions is very high due to the elevated pressure inside the cell. As a
consequence, ions that enter the cell lose their energy so that all the ions present inside
the DRC, both the ones extracted from the plasma, and these newly formed inside the
cell, have the same energy (so-called ‘thermal’ conditions). Since the reaction efficiency
increases exponentially with the number of collisions, a reaction cell is characterized by a
very high reaction efficiency, which is beneficial for the removal of spectral interferences.
However, also the formation rate of new ions inside the reaction cell (sequential or
secondary chemistry) is increased. Working in thermal conditions does not allow to
distinguish the ions formed inside the cell from the ions that are extracted from the
plasma by means of their kinetic energy, as is the case in collision cells (so-called ‘non-
thermal’ conditions). In a dynamic reaction cell however, the sequential chemistry can be
controlled by dynamic bandpass tuning (DBT) [Latino et al., 2001].
Despite the fact that the terms ‘collision cell’ and ‘reaction cell’ are often mixed, both cell
types can be distinguished according to the operating conditions. A collision cell aims at

CHAPTER II – Inductively coupled plasma – mass spectrometry (ICP-MS)
31
endothermic fragmentation with the cell being operated at high ion energy and low
pressure. A dynamic reaction cell is operated at elevated pressure and a low ion energy,
aiming at exothermic ion-molecule reactions. In view of the different reaction conditions,
the cells can also be considered according to the energy distribution of the ions inside.
After passing through a collision cell, analyte ions and newly formed ions in the cell can
be distinguished, based on their energy distribution. When no distinction in kinetic energy
is possible between analyte and newly formed ions, the cell is a reaction cell.
II.6.2.1 – Description
A dynamic reaction cell (DRC) consists of a closed quadrupole-unit that is placed in-
between the extraction lens and the quadrupole mass analyzer. A schematic
representation of an ICP – mass spectrometer equipped with a dynamic reaction cell is
given in figure II.11. High purity reaction gases (e.g., CH4, NH3, CO, O2, CH3F) can be
introduced into the DRC via two entrance gates at a carefully controlled gas flow rate,
regulated by two mass flow controllers. These mass flow controllers are calibrated for use
with argon gas, and the gas flow rate as set in the instrument is expressed in argon-
equivalent units. A correction factor, calculated as the ratio of the molar specific heat for
argon gas to that of the reaction gas used, is needed to obtain the true gas flow rate of
the reaction gas used.
Figure II.11 – Schematic representation of an ICP – mass spectrometer
equipped with a dynamic reaction cell (DRC)
The ion beam that is extracted from the plasma by the interface is focused towards the
dynamic reaction cell by the extraction lens. The ion beam consequently passes through
detector analyzer
quadrupole
dynamic
reaction cell
extraction
lens
expansion
zone
ICP
reaction gas in interfering molecular ionanalyte ion
CHAPTER II – Inductively coupled plasma – mass spectrometry (ICP-MS)
32
and leaves the DRC towards the analyzer quadrupole. The reaction gas can leave the DRC
via both apertures.
When no gas is led into the dynamic reaction cell, the cell just guides the ions extracted
from the plasma towards the quadrupole analyzer. In this operation mode, called
‘standard mode’ or ‘vented mode’, the ICP – mass spectrometer behaves as a convential
quadrupole-based instrument.
II.6.2.2 – Ion-molecule interactions
The dynamic reaction cell relies on the principle of chemical resolution. Owing to the
difference in reactivity of the analyte ions and the interfering ions with respect to the
reaction gas, spectral interferences can be prevented from occurring. To assure the
selectivity and specificity of ion-molecule reactions, a carefully controlled and nearly-
thermal environment is necessary, which can be obtained by working at low ion energies
and a relatively high reaction gas pressure (1.3-2.7 Pa).
II.6.2.2.1 – Collisional processes
All interactions of ions with molecules are collisional processes, where energy transfer, as
discussed below, and collisional fragmentation can be considered as reaction processes
[Tanner et al., 2002]. In an elastic, non-reactive collision of an ion of mass m and kinetic energy E with a stagnant neutral of mass m and kinetic energy E E 0, the respective energies after collision, E′ and E ′ , are given by:
E′ E (equation II.23)
E ′ E E′ (equation II.24)
Multiple collisions of the ion result in sequential losses of kinetic energy and in a reduction
in the width and magnitude of the kinetic energy distribution (energy damping). The
extent of ion energy damping depends on (i) the ion/neutral mass ratio, (ii) the ion
energy at the moment of entrance into the cell and (iii) the number of collisions. A lower
ion/neutral mass ratio increases the rate of energy damping of the ion. Complete damping
to the thermal condition means that the ion executes a ‘random walk’ through the cell. A
high ion energy at the moment of entrance into the cell requires more collisions for
energy damping. For a given cell pressure, a higher initial energy also results in a
reduction in efficiency because the ion progresses further into the cell before the energy

CHAPTER II – Inductively coupled plasma – mass spectrometry (ICP-MS)
33
is damped, and hence the number of reactive collisions is reduced. Further, higher energy
lowers the probability of reaction during collision, compromises the specificity of the
thermal chemistry and increases the potential for sputtering cell materials. Information on
collisional fragmentation processes is given in dedicated sources, e.g., [Tanner et al., 2002].
II.6.2.2.2 – Ion-molecule reactions
As for any chemical reaction, it can be assumed that, under thermal conditions, ion-
molecule reactions only take place when (i) they are thermodynamically allowed and (ii)
the reaction kinetics are favorable [Tanner et al., 2002].
Since the system is dynamic, it cannot reach equilibrium because of the constant flow
originating from the plasma through the reaction cell. Nevertheless, the only practical
approach possible is to determine whether the Gibbs energy of reaction, given by:
∆G ∆H T∆S (equation II.25)
is negative after the equilibrium is reached, or in other words, if the reaction is
spontaneous. In most cases, the reactions that occur are bimolecular reactions with small-
particle or charge transfer, so that the entropy term ∆S is negligible. Consequently, the thermochemistry of the reactions is correctly described by ∆H. Of course, this
approximation is not valid for condensation reactions and reactions where the number of
reaction products is higher than the number of reactants. The change of enthalpy, ∆H, in a reaction A B C D can be calculated using the heats of formation, ∆HZ, of the reactants and reaction products as follows:
∆H ∆HZC ∆HZD ∆HZA ∆HZB (equation II.26)
If the enthalpy of reaction is negative, the reaction is exothermic and might proceed
under thermal conditions. If the enthalpy of reaction is positive, the reaction is
endothermic and will not take place unless additional energy is contributed to the process,
e.g., by an excess of axial kinetic energy before relaxation in a collision/reaction cell, or
by the RF voltage that is applied on the quadrupole in the cell. The contribution of this RF
energy to the reaction energy favors endothermic reactions. It was shown that this RF
energy contribution is minimized by operating at a low RF amplitude (V), a high RF frequency (ω) and a large number of collisions per RF cycle [Baranov and Tanner, 1999].
Positioning the mass window of the DRC quadrupole is hence performed by varying the
CHAPTER II – Inductively coupled plasma – mass spectrometry (ICP-MS)
34
RF frequency at a constant amplitude, in contradiction to the analyzer quadrupole, where
the RF frequency is kept constant and the RF amplitude is varied for mass selection.
Although there is no correlation between the enthalpy of reaction and the reaction rate, it
can be stated that when an exothermic small-particle transfer reaction takes place under
thermal conditions, this reaction takes place at a high reaction rate, mainly due to the low
energy of activation for this type of reactions. Ions are charged, and can interact with a
polar molecule, or induce a dipole in an apolar molecule. These ion-dipole interactions
are, in most cases, strong enough to overcome the activation energy of exothermic
reactions. As a consequence, the exothermicity usually determines whether a simple ion-
molecule reaction in which small particles are exchanged, will take place, or not [Tanner et
al., 2002].
II.6.2.2.3 – Ion-molecule reaction types
The generic ion-molecule reaction of the form A B C D includes several types of processes [Tanner et al., 2002]. In the context of ICP-MS, the most important reactions
are charge transfer reactions of the type:
A B A B, e.g., Ar NH\ Ar NH\ Indeed, the first applications were the resolution of argon-based interferences (Ar+ and
ArX+, with X = N, O, Ar). The corresponding neutral argides have high ionization energies
and their charge transfer reactions often proceed with high efficiency near the collision
rate. However, with further development of the reaction cell technology, it has become
apparent that the scope of application is considerably broader than simple charge transfer
reactions. A second important class of reactions involves hydrogen-containing species:
• proton transfer:
AH B A BH, e.g., ArH H H\ Ar
• hydrogen atom transfer:
A BH AH B, e.g., Ar H ArH H
• hydride ion transfer:
A BH B AH
CHAPTER II – Inductively coupled plasma – mass spectrometry (ICP-MS)
35
So-called condensation reactions involve transfer of atoms other than hydrogen, and
sometimes result in rearrangement to a thermodynamically stable form. Oxidation
reactions are promising due to their apparent selectivity and speed:
A BO AO B, e.g., Ce N O CeO N This type of ion-molecule reaction is very sensitive to the thermodynamic stabilities of the
product oxide ions and of the neutral molecule. For example, N2O is attractive as an
oxidizing agent because the corresponding reactions include N2 as a product molecule.
CO2 is also a promising reactant due to the thermodynamic stability of CO as a leaving
group. In contrast, it was also shown that ArO+ molecular ions can be removed by the use
of CO as a reaction gas, according to the reaction:
ArO CO Ar CO O2 has a different application because a very strong A
+–O bond is required for this
reaction to proceed. As a result, some reactions with oxygen have a very high specificity.
Finally, clustering is a common reaction between many electron donor molecules and ions
(ligand-ion mutual electron donation). Association or clustering reactions of the type:
A B AB generally play a negative role in reaction cell ion chemistry when applied to ICP-MS.
Ammonia is a good clustering ligand, meaning that it forms adducts readily and hence can
be an analytical complication, unless steps are taken to control the appearance of cluster
ions (dynamic bandpass tuning, § II.6.2.2.5). This type of reaction is often observed with
water molecules, which are present in many reaction gases in trace quantities. Water also
facilitates oxidation, hydroxylation and hydrogen and proton transfer reactions.
II.6.2.2.4 – Non-reactive collisions
Self-evidently, the essential reason of using a dynamic reaction cell in quadrupole-based
ICP – mass spectrometry is to suppress spectral interferences by means of selective ion-
molecule reactions. Next to the collisions that lead to reactions, many collisions occur
between ions and gas molecules that do not result in reaction. These ‘non-reactive’
collisions are at the basis of side effects such as thermalization, collisional focusing and
scattering that occur in the dynamic reaction cell [Tanner et al., 2002] and deliver important
benefits for isotope ratio determinations (chapter III, § III.3.1).

CHAPTER II – Inductively coupled plasma – mass spectrometry (ICP-MS)
36
Under usual operating conditions, ions must be accelerated through a counter flow of gas
in order to enter the cell. In this instance, the ions enter the cell with a relatively large
axial kinetic energy. In most collisions, the ion transfers a fraction of its kinetic energy to
the neutral, and the ion energy is damped. In the case of ICP-MS, the axial kinetic energy
of the ion is significantly greater than the radial energy, and the first step in the collisional
damping of the ion’s axial energy is the conversion of axial to radial energy, so that the
ion tends to move away from the central axis. In this regard, an advantage of an RF-
driven reaction cell is that the restoring force provided by the RF voltage drives the
radially excited ions back towards the cell axis. Transfer of energy from axial to radial
excitation continues until the two modes approach equilibrium, and then both
translational degrees of freedom relax together. Eventually, the axial energy should be
completely relaxed to nearly-thermal, while the radial energy does not completely relax,
as it continues to be excited by the RF field. At pseudo-equilibrium, the ion energy is a
function of the Mathieu parameters a and q, and of the number of collisions per RF cycle
(and is thus dependent on the pressure and RF frequency) [Baranov and Tanner, 1999; Tanner
et al., 2002]. The over-all consequence of energy damping and thermalization is that the
ions are focused towards the central axis and that the transmission efficiency is increased.
This phenomenon is known as collisional focusing and can be used in order to increase
the analyte ion intensity by a factor of 2 to 5. However, several aspects should be
considered if the benefits of collisional focusing are to be employed. To improve
sensitivity, non-reactive gases ought to be selected carefully: (i) the mass of the collision
gas used should be below that of the analyte ion in order to minimize scattering, (ii) the
gas should be thoroughly dried to avoid any reactions with concomitant water vapors and
(iii) the gas flow control manifold should be sufficiently stable with respect to flow and
composition of the gas in the cell.
II.6.2.2.5 – Control of sequential chemistry
The gas that fills the cell is usually reactive with at least some of the ions. Even if an
intentionally non-reactive gas is used, reactive contaminants are commonly present either
as an impurity or from entrainment of plasma gas into the cell. As long as ions and
reactive gas components are in the cell, reactions may take place resulting in the
formation of new ions that may be isobaric with an analyte of interest. If multiple
collisions are provided, as required for efficient suppression of plasma-based interfering

CHAPTER II – Inductively coupled plasma – mass spectrometry (ICP-MS)
37
ions, secondary reactions that may produce an ubiquitous chemical background are
promoted [Tanner et al., 2002].
An average ion experiences some 20 collisons when passing through a dynamic reaction
cell of 12.5 cm in length and operated at a pressure of approximately 1.3 Pa. If the ion
reacts on its first collision, the product ion on average may suffer a further 19 collisions.
In this instance, there are some 20 levels of sequential chemistry. As an example, the
reactions that can occur when methane is used as a reaction gas can be considered. It is
known that methane can react with Ar+ via dissociative charge transfer [Anicich, 1993]:
Ar CH? Ar CH? Ar CH\ H Ar CH H The products of this reaction, if retained by the reaction cell, react further, e.g.:
CH\ CH? C H H or in general:
C_H% CH? CH& neutrals
with m 1,2, … , n 1 and y 0,1, … , x 4 A reaction cell can be operated in such a manner that plasma-based interfering ions are
efficiently removed by ion-molecule reactions. This raises the issue of the three forms of
efficiency that are required of the reaction cell: (i) efficient removal of plasma-based
interfering ions, (ii) efficient transmission of analyte ions of interest and (iii) efficient
suppression of the appearance of new interference ions produced in sequential
(secondary) chemistry in the reaction cell.
Two means to control the appearance of secondary reaction product ions in the mass
spectrum are used in present-day instruments [Tanner et al., 2002]. First, the well-defined
stability boundaries of a quadrupole mass filter remain reasonably well-defined when the
quadrupole is pressurized as is the case in the dynamic reaction cell. Hence, a dynamic
reaction cell can be operated in a bandpass mode in which the low-mass and high-mass
cutoff boundaries are determined principally by the Mathieu parameters a and q of its
quadrupole (equations II.10 and II.11). The position of the stability boundary relative to
the analyte ion is conveniently selected by adjustment of either the RF voltage (V), as is
typical for the mass filter, or the frequency of operation (ω). Because the RF contribution
to the reaction energy, which is important in the establishment of thermal conditions, is a
strong function of the RF amplitude, it is convenient to use the frequency for this purpose
in the reaction cell. The dynamic aspect of the dynamic reaction cell is comprised in the
CHAPTER II – Inductively coupled plasma – mass spectrometry (ICP-MS)
38
tunable mass bandpass window of its quadrupole. The use of the DRC quadrupole as a
dynamic bandpass is defined as ‘dynamic bandpass tuning’ (DBT) [Latino et al., 2001; Tanner
et al., 2002].
Alternatively, kinetic energy discrimination after the cell allows operation of the cell as a
passive device (meaning that the chemistry is allowed to proceed). Resolution of the
plasma ions from cell-produced ions is based on the kinetic energy difference between
these. A potential barrier is established downstream of the cell and provides a degree of
resolution of plasma polyatomic ions from atomic ions [Tanner et al., 2002].
In some instances, it is more convenient to convert the analyte ion, generally by atom
transfer, into another ionic species than to reactively remove the interfering ion. Most
often, this situation will arise when the thermochemistry is unfavorable for charge
transfer. Such an instance arises when it is desired to chemically resolve certain isobaric
atomic ions, e.g., 87Rb+ and 87Sr+. If heavy-atom transfer is an option, the m/z of the
product ion should be relatively free of interference, or the interference should also react
at a sufficient rate so that it no longer interferes with the determination of the analyte as
the MX+ ion. Of course, it is necessary to allow the secondary chemistry by including both
the reacting (atomic) analyte ion and the (molecular) product ion in the bandpass. This
approach was successfully applied by Moens et al. to Rb/Sr geochronology, using methyl
fluoride (CH3F) in a neon buffer. It was demonstrated that Sr+ reacts with CH3F by F-atom
transfer, forming SrF+, while Rb+ is unreactive. The neon buffer was used to homogenize
the ion temporal distribution and yielded isotope ratios the precision of which
approximated the counting statistics limit [Moens et al., 2001].
II.7 – Detection system After passage through the quadrupole or sector field mass spectrometer, the ion beam
must be detected and measured by an appropriate system. The magnitude of the signal
to be detected is in the range of a few ions per second for ultratrace components up to
1010 ions per second for major components. Because the charge of an electron is
1.6 10-19 C, this ion density corresponds to a current in the range of 10-20 to 10-9 A. To
cover this dynamic range, a variety of detectors are used. For low signal ranges
(< 106 ions/s), an ion counting system (electron multiplier) is usually employed, while for
the higher count rates, an analogue measurement is used [Turner et al., 1998].

CHAPTER II – Inductively coupled plasma – mass spectrometry (ICP-MS)
39
II.7.1 – Ion counting systems
When ions leaving the mass spectrometer are directed towards a suitable surface at a
highly negative voltage, electrons will be released by the resulting impact. These primary
electrons may be directed, by a suitably applied voltage, onto a further surface from
which secondary electrons are released. The energy, supplied by an electric potential of a
few thousand volts that is applied across the ends of the multiplying surface (dynode), is
sufficiently high to release in average three electrons per impact. After many repetitions
of this impact process, a huge number of electrons will have been generated. A device
operating in this way is called a secondary electron multiplier (SEM), and the
multiplication factor will typically be on the order of 108 [Turner et al., 1998] At the end of
this device, the electrons are directed onto a collector electrode, and the resulting pulse is
electronically processed by the data system. Electron multipliers exist with either a
continuous dynode (figure II.12.a), or several discrete dynodes (figure II.12.b).
Figure II.12 – Secondary electron multiplier (SEM) with (a) a continuous dynode and (b) several discrete dynodes
If the rate of ion arrival at the collector is very high, the period between detected ions will
become comparable to the pulse length of the output. During this output period, some
ions will arrive and will not be detected by the counting system. This period, which is the
multiplier dead time e limits the maximum ion count rate where the detection stays in a
linear mode. Especially for isotope ratio measurements, a correction for this dead time is
mandatory [Ingle and Crouch, 1972].
II.7.2 – Analogue collection
Large signals require an analogue device, because ion counters cannot be used for ion
rates above 106 ions/s [Turner et al., 1998]. This can be accomplished in two ways. First, the
ion
first dynode
signal
electron multiplication
ion
signal
electron
multiplication
(a) (b)

CHAPTER II – Inductively coupled plasma – mass spectrometry (ICP-MS)
40
voltage applied to the secondary electron multiplier used in the ion counting systems can
be reduced so that the average gain is reduced to about 103 instead of 108. The
collector’s output current can be used as a direct measure of the input current.
Alternatively, the ion beam may be directed into a Faraday collector (Faraday cup), which
is a metal beaker (cup) grounded with a high resistance (e.g., 1011 Ω). When a positive
ion beam impacts on the cup, the ions are neutralized with electrons coming from the
ground, inducing a potential difference over the resistance according to Ohm’s law
U IR. This device can be used for direct measurement of currents down to 104 ions/s
(10-15 A), so there is overlap with the upper range for ion counting systems [Turner et al.,
1998].
II.7.3 – Dual detection systems
In order to deal with the large range of signals arriving at the detection system – ranging
from a background < 1 count/s for sector field mass spectrometers to high count rates for
major elements – the analogue mode of a secondary electron multiplier can be utilized
instead of a Faraday cup. For low signals, the normal pulse counting output is recorded at
the end of the multiplier chain. In the case of high signals, an analogue output signal can
be obtained partway down the multiplier chain. An automatic monitoring system can be
used to select the appropriate registration mode.
II.7.4 – Performance
The dead time τ of a secondary electron multiplier (SEM) requires correction of the
count rates obtained and limits the use of ion counting. The damage rate of the multiplier
is considerable because ion counting systems operate at high gain. On the other hand, a
secondary electron multiplier is characterized by a high sensitivity, and a dual detection
system allows a rapid changeover between pulse counting and analogue mode within a
single scan. This rapid changeover is not possible on a Faraday collector. However, the
multiplier analogue mode is somewhat less stable than the Faraday system and suffers
from mass bias. The Faraday cup is extremely robust, does not suffer from damage to the
multiplier system at high count rates and has no dead time. The linearity is excellent, so
that isotope ratio measurements can be conducted with improved accuracy, and without
instrumental mass bias. On the other hand, a Faraday collector has a slow time constant
precluding fast scanning, and is characterized by a lower sensitivity.

CHAPTER II – Inductively coupled plasma – mass spectrometry (ICP-MS)
41
II.8 – ICP-MS instruments used in this work In previous paragraphs, the principal components of an ICP – mass spectrometer were
described. Below, the design of the ICP – mass spectrometers used in this work, will be
discussed. Instruments can be distinguished according to (i) the device used for mass
separation, resulting in quadrupole-based ICP-MS (ICP-Q-MS) either with or without
dynamic reaction cell (ICP-DRC-MS), and sector field ICP-MS or high resolution ICP-MS
(ICP-SF-MS or HR-ICP-MS), and (ii) the detection system, resulting in single-collector ICP-
MS (SC-ICP-MS) and multiple collector or multi-collector ICP-MS (MC-ICP-MS). In the field
of isotopic analysis, the most relevant distinction between instruments is on the basis of
the detection system, or single-collector – versus multi-collector ICP-MS instruments.
Single collector ICP – mass spectrometers are equipped with one electron multiplier for
ion detection. In this work, two single-collector quadrupole-based ICP – mass
spectrometers were used. A PerkinElmer SCIEX Elan 5000 was used for elemental assay.
The sample introduction system consisted of a multichannel peristaltic pump (Minipuls-3),
a GemTip cross flow nebulizer, a PerkinElmer type II double pass spray chamber of the
Scott-type made of Ryton, and a corrosion resistant torch with alumina injector. An
electrostatic lens system, consisting of six individual lenses focuses the ion beam towards
the quadrupole analyzer. Detection of ions is performed by a channeltron continuous
dynode electron multiplier. Single-collector isotope ratio determinations and elemental
assay were carried out using a PerkinElmer SCIEX Elan DRCplus. The sample introduction
system consisted of a multichannel peristaltic pump, a Meinhard concentric nebulizer
mounted onto a cyclonic spray chamber, both made from quartz, and a PerkinElmer
quartz torch with quartz injector. In one experiment, a GeoLas 200M 193 nm excimer
laser ablation unit was used. A single extraction lens focuses ions towards the dynamic
reaction cell that is placed in-between the interface and the mass analyzing quadrupole. A
secondary electron multiplier with discrete dynodes is used for registration of the ion
signals.
The technique multiple collector – or multi-collector ICP-MS (MC-ICP-MS) was developed
specifically for isotopic analysis [Rehkämper et al., 2001]. Two multi-collector ICP – mass
spectrometers have been used in this work: Nu Instruments’ Nu Plasma 500 and Thermo
Electron’s Neptune, which are represented schematically in figure II.13. The Nu Plasma
500 is a double focusing Nier-Johnson arrangement with a fast-scanning magnet and
allows operation at a mass resolution of 450. The detector array consists of 12 fixed
Faraday collectors and 3 fixed ion counters. The mass dispersion of the ion beam is varied

CHAPTER II – Inductively coupled plasma – mass spectrometry (ICP-MS)
42
using a zoom lens system situated between the magnet and collector array. The sample
introduction system consisted of an Aridus desolvating system to which sample delivery
was accomplished via an auto-aspirating microconcentric nebulizer. The Thermo Electron
Neptune used provides double focusing with a Nier-Johnson geometry and allows
operation at a resolving power up to 8 000 in pseudo-high resolution mode. A retardation
lens provides an excellent abundance sensitivity. The multicollection arrangement consists
of a fixed center Faraday cup along with 8 movable Faraday cups and 3 secondary
electron multipliers. Sample delivery was accomplished via an auto-aspirating low-flow
PFA nebulizer at a flow rate of 50 µL min-1, mounted onto a spray chamber that is a
combination of a cyclonic spray chamber and a double-pass spray chamber.
Figure II.13 – multi-collector ICP – mass spectrometers used in this work –
(a) Nu Instruments’ Nu Plasma 500 (b) Thermo Electron’s Neptune
II.9 – ICP-MS for trace element determination The use of the inductively coupled plasma as an ion source for analytical mass
spectrometry was first described by Houk and coworkers [Houk et al., 1980] and Date and
Gray [Date and Gray, 1981; Date and Gray, 1983-a; Date and Gray, 1983-b; Date and Gray, 1983-c; Gray
and Date, 1983; Date and Gray, 1985; Gray, 1985; Gray, 1989]. In an argon ICP, most chemical
elements are converted into singly charged ions, because the ionizing power of an
atmospheric pressure Ar plasma is dominated by the first ionization energy of Ar
(15.8 eV). Most elements have first ionization energies well below 16 eV [Moore, 1970], and
the degree of ionization of most elements in the plasma is 90 % or higher [Houk et al.,
1980]. As a consequence, an abundant population of singly charged ions is produced in the
ICP. Similarly, few elements have second ionization energies below 16 eV (except, e.g.,
electrostatic
sector
magnetic
sector
zoom optics
collector array
electrostatic
sector
magnetic
sector
collector array
(a) (b)

CHAPTER II – Inductively coupled plasma – mass spectrometry (ICP-MS)
43
Ba) [Moore, 1970], which implies that the formation of doubly charged ions is rare in the
plasma. Consequently, a relatively simple mass spectrum results from an argon ICP,
dominated by peaks from the singly positively charged isotopes of the analyte elements.
The simplicity of the mass spectrum obtained is however sometimes compromised by the
occurrence of spectral interferences (§ II.2). With few exceptions however (e.g., In), at
least one isotope of each element is free of isobaric interference [Taylor et al., 1998].
In this work, (semi-)quantitative analysis was regularly performed, using both the Elan
5000 and Elan DRCplus ICP – mass spectrometers. In what follows, calibration methods
for semi-quantitative and quantitative concentration determinations are discussed. The
application of ICP-MS to isotope ratio analysis will be discussed in detail in chapter III.
II.9.1 – Semi-quantitative elemental analysis
Analytical determinations with an accuracy of 30-50 % are known as ‘semi-quantitative’
[Taylor et al., 1998]. A semi-quantitative analysis requires the measurement of a single multi-
element standard solution. After registering the isotope intensities for a calibration
standard containing a few elements so that the full mass range (6 to 238 amu) is
covered, a relative sensitivity factor can be calculated for each element measured as
follows:
RFX IXCl (equation II.27)
with RFX the sensitivity factor for element X, I the isotope intensity and C the concentration of element X.
The sensitivity factors for elements that are not present in the calibration standard can be
graphically derived by fitting a curve through the data points obtained for the calibration
standard in a diagram where the intensity is plotted versus the analyte mass. Hereby, the
isotopic abundance and ionization energy of the isotopes involved also has to be taken
into account. These relative sensitivity factors will vary for each element depending on the
abundance of the specific isotope measured and the operating conditions selected for the
determination. Concentrations of analytes in unknown samples can be estimated by
dividing the measured isotope intensities by the predetermined relative sensitivity factors
for the specific isotope of the element under investigation. Because relative sensitivity
factors are dependent on the specific operating conditions, they should be reestablished
whenever adjustments or modifications are made to instrumental parameters [Taylor et al.,
1998].
CHAPTER II – Inductively coupled plasma – mass spectrometry (ICP-MS)
44
II.9.2 – Quantitative elemental analysis
Analytical determinations with an accuracy better than 10 % are known as quantitative
analyses [Taylor et al., 1998]. Mostly, a quantitative analysis is performed for the accurate
determination of the level of one or a limited number of analytes. Below, three calibration
approaches for quantitative analysis are discussed: (i) external standardization, (ii)
standard addition and (iii) isotope dilution (ID).
II.9.2.1 – External standardization
In quantitative analysis via external standardization, several multiple concentration
standards containing the analyte(s) of interest are involved. Scans of these standards are
performed immediately before, during and after samples are scanned under the same
operating conditions, and a relationship is established between signal intensity and
concentration. By closely matching the bulk chemical composition of the calibration
standards to the known matrix of the samples by the use of, e.g., element standards or
salts (so-called ‘matrix matching’), an improved accuracy is obtained, since the matrix
effects occurring in the samples are similar to that in the calibration standards [Beauchemin
et al., 1988; Taylor et al., 1998].
II.9.2.2 – Standard addition
An improved form of matrix matching is standard addition. In this approach, a sample is
split into two aliquots, and to one aliquot, a known amount of analyte is added. The
amount added should be higher than the amount of analyte already present in the
sample. As in external standardization, a relationship is established between the signal
intensity and the standard concentration, where in this case the standard is added directly
to the sample. Since in this case the standard is a sample spiked with a known amount of
analyte, the standard signal is measured in the sample matrix itself. As a consequence,
the standard undergoes the same signal influence as the analyte in the matrix, so that a
very accurate correction for matrix effects can be performed [Taylor et al., 1998].
In this work, both external standardization and standard addition were applied as a
calibration strategy for quantitative elemental assay. Regarding the heavy sample
matrices dealt with (e.g., bone, soil), the results obtained by standard addition were
considered as the most reliable.

CHAPTER II – Inductively coupled plasma – mass spectrometry (ICP-MS)
45
II.9.2.3 – Isotope dilution (ID)
Isotope dilution – mass spectrometry (ID-MS) is a quantitative technique to determine the
number of atoms, and thus, the concentration, of a trace element in a diverse range of
samples. To accomplish this, an accurately known number of atoms of the same element,
but a different isotope, a so-called ‘spike’, is added to the sample. The mixture is then
isotopically equilibrated and the ratio of the unknown number of atoms to the known
number of spike atoms is measured [Heumann, 1988; Platzner, 1997]. Contrary to the
quantitative analysis approaches described higher, isotope dilution (ID) thus makes full
use of the existence of isotopes. The ability of ICP-MS to independently measure the ion
intensities of different isotopes allows quantification via ID-ICP-MS [Heumann, 1988; Platzner,
1997; Vanhaecke et al., 2006].
The equation applicable for isotope dilution effects does not contain a sensitivity factor, as
is the case in all other calibration strategies. Most analytical instrumentation is susceptible
to temporal and/or matrix-induced changes in sensitivity. This effect is orders of
magnitude smaller for isotope dilution compared to other calibration methods and
therefore it is not measurable in most cases. Since isotope ratios can be determined with
a high precision (chapter III, § III.3), also the concentration result obtained from ID
experiments is characterized by a high precision [Vanhaecke et al., 2006].
II.9.3 – Internal standardization
In order to correct for temporal and/or matrix induced changes in sensitivity and when no
isotope dilution is used, an internal standard is often added in the same concentration to
blanks, standards and samples. The use of one or more internal standards is highly
recommended to achieve maximum precision and accuracy [Vandecasteele et al., 1988;
Vanhaecke et al., 1992] and in this work, one or more internal standards were always used
when determining elemental concentrations. Separate internal standards were selected
for the various mass ranges where analyte elements occur in the mass spectrum. An
element is suited as an internal standard when (i) it is not present in the sample under
investigation, (ii) it is preferably mono-isotopic and (iii) it displays similar characteristics
(e.g., mass, ionization energy) as the analyte(s). By referencing the analyte signal
intensities to the signal intensity for the internal standard, the analyte signals can be
corrected for matrix effects, signal drift and instrument instabilities [Vanhaecke et al., 1992;
Taylor et al., 1998].


CHAPTER III
Isotope ratio analysis
via ICP-MS


CHAPTER III – Isotope ratio analysis via ICP-MS
49
From its introduction in 1983 on, ICP-MS has been used for isotope ratio measurements.
However, its application range was limited to measuring either induced changes in the
isotopic composition of a target element, or pronounced natural variations, as is the case
for Pb. This was because the isotope ratio precision attainable with most ICP-MS
instruments was rather poor compared to that achievable using thermal ionization – mass
spectrometry (TI-MS). The introduction of multi-collector ICP-MS for isotopic analysis
however, has not only bridged this gap in isotope ratio precision, but has also opened
previously inaccessible application ranges. In this chapter, general concepts of isotopic
analysis and the use of (MC-)ICP-MS as a tool for isotopic analysis are described, followed
by a discussion of the sources of noise and bias in isotopic analysis using ICP-MS.
III.1 – General concepts of isotopic analysis Of the eighty-three naturally occurring elements that are not radioactive or have half lives
long enough to be considered as stable (half life > 109 years), nearly three quarters have
two or more isotopes. Variations in the isotopic ratios of a number of these elements,
including H, C, N, O and S, provide the foundation for the field of stable isotope
geochemistry. Investigations of variations in the isotopic compositions of these ‘traditional’
elements have provided important constraints on their sources in rocks, minerals and
fluids. Much less attention, however, has been paid to stable isotope variations of other
elements that are also geochemically important, such as certain metals and halogens
(‘non-traditional’ elements). This can be attributed to the analytical challenges, although
first-order variations for several systems have been established using gas source – and
thermal ionization – mass spectrometry. With the advent of multi-collector ICP – mass
spectrometry, large portions of the periodic table are now accessible to stable isotope
studies [Johnson et al., 2004-a].
Generally speaking, isotopic abundances are constant in nature [De Laeter et al., 2003]. As a
consequence, a variety of problems can be studied by using compounds in which a
particular element shows an isotopic composition sufficiently different from the
corresponding natural one, e.g., in the case of artificially produced radionuclides (99Tc,
129I, 236U). Many isotope applications are based on the assumption that the behavior of
different isotopes is chemically and physically identical. This is a prerequisite for tracer
and isotope dilution (ID) experiments often practiced in ICP-MS. Nevertheless, small
isotopic or mass fractionation effects do occur in both natural and industrial processes
[Roth, 1997]. The origin of such fractionation effects can be either kinetic or thermodynamic

CHAPTER III – Isotope ratio analysis via ICP-MS
50
[Schauble, 2004] (§ III.2), and the isotopic variation they give rise to is especially observed
for the lighter elements such as H, C, N, O and S, occurring due to the relatively large
mass difference between their isotopes [Coplen et al., 2002]. Most of these elements are
typically studied using gas source – mass spectrometry (GS-MS), which is therefore also
often referred to as isotope ratio – mass spectrometry (IR-MS). With the increasing
isotope ratio precision offered by TI-MS, and later also by MC-ICP-MS, however, natural
variations in the isotopic composition are established for an increasing number of ‘heavier’
elements and turned out not to be restricted to light elements only. Additionally,
variations in the isotopic composition of some elements may also occur as a consequence
of the radioactive decay of naturally occurring long-lived radionuclides (as is the case for
Sr and Pb, the target elements in this work (chapter IV, § IV.1 and § IV.2)), nuclear
reactions resulting from the interaction of cosmic rays with matter, producing mainly
short-lived isotopes [Leya et al., 2000] and anthropogenic activities [Cloquet et al., 2006-a]. In
addition, in some meteoritic samples, some elements show deviations from the natural
isotopic composition, unknown in terrestrial samples [Birck, 2004]. Because of these
variations, the representative isotopic composition in normal terrestrial materials cannot
be defined precisely for some elements, such as Li, Sr and Pb, but covers a small range
[De Laeter et al., 2003].
Of all the isotope-specific analytical techniques (mass spectrometry, activation analysis,
spectroscopic methods and nuclear magnetic resonance (NMR-) spectroscopy), mass
spectrometry is by far the most versatile and powerful [Roth, 1997], since it allows the
relative abundances of different isotopes to be measured with a high precision and
accuracy. An isotope ratio R of an element M, which is in fact a ratio of amounts of
isotopes of mass i and j, is experimentally accessible using mass spectrometry, since ion
currents corresponding to the isotopes under consideration are easily measured:
R E E I E
I E (equation III.1)
An isotope ratio is a well-defined and robust property. However, there are some mass-
dependent processes that cause a small, but measurable, bias due to the difference in
mass between the isotopes measured, as a consequence of a different transmission
efficiency through the mass spectrometer for ions of different mass [Vanhaecke et al., 2006].
This can be mathematically expressed as:
R E E I E
I E K (equation III.2)
with K the product of the correction factors for the different sources of bias.

CHAPTER III – Isotope ratio analysis via ICP-MS
51
In general, K is fairly close to unity and is known with a relatively small uncertainty.
Depending on the objective of the measurement and the effort that goes into the
determination of the correction factors, different situations arise: (i) the correction factor
is determined and applied, (ii) small correction factors are ignored, as is the case in tracer
experiments; (iii) correction factors are assumed to stay constant during the
measurement and no effort is performed to quantify them, e.g., in isotope dilution
experiments and (iv) a constant bias is assumed in differential isotopic measurement,
where the aim is to find out how different the isotope ratio measured in the sample is,
compared to the corresponding ratio in a reference sample. Such differences are often
small, and therefore, a high reproducibility is desired. Assuming a constant bias is
convenient, but for critical applications, e.g., the preparation of certified reference
materials, the bias should be checked independently, and the availability of calibrated
isotope ratios is required [De Bièvre et al., 1993].
The vast majority of isotopic data are expressed in ‘delta-notation’ δ, where the isotopic
composition is cast as the deviation of an isotope ratio relative to the same ratio in a
standard:
δ EX RX/ R/R/ 10" (equation III.3)
with i and j the mass of the isotopes used in the ratio R of an element E, X the sample of interest and std the standard reference material or reservoir.
The units for the δ EX value are in parts per thousand, or ‘per mil’, commonly noted
as ‰. In the case of the δ O () value, R = 18O/16O, following the traditional protocol of
expressing R/* as the abundance ratio of the rare isotope to the major isotope, which
corresponds in the case of the traditional isotope systems, to heavy over light isotope,
e.g., δ N (, and δ S ". use the isotope ratios 15N/14N and 34S/32S, respectively. This
convention implies that a positive δ EX value refers to a sample that is relatively enriched
in the heavy isotope [Johnson et al., 2004-a].
The motivation for expressing δ EX values as rare isotope over major isotope lies in the
fact that the mathematics of mixing relations are greatly simplified in cases where the
rare isotope i is very low in abundance, which leads to the simplification that the
abundance of isotope j may be treated as invariant, particularly when the range in
isotopic compositions is relatively restricted. When mixing two components, A and B, that contain an amount of an element E with a different isotopic composition, the isotopic
composition of E in the resulting mixture is given by:
CHAPTER III – Isotope ratio analysis via ICP-MS
52
MAMB 4 5CBCA7 R89: RB:R89: RA: (equation III.4)
with MA and MB the masses of components A and B respectively, CA and CB the concentrations of the element in components A and B respectively, and R: the ratio of the mass of the rare isotope over the total mass of the element E.
In the case of O, where the abundances of 18O and 16O are 0.20 % and 99.76 %
respectively, R: is very nearly equal to the 18O/16O ratio, so that the exact mixing equation
can be directly related to the measured isotopic compositions and simplified using the
delta-notation:
δ E>? δ EA f A δ EB 1 4 f (equation III.5)
with f the fraction of component A in the two-component mixture. It is important to note that equation III.5 is only valid for cases where the abundance of
the isotope in the numerator of R is very low and/or when the difference between δ EA
and δ EB is small [Johnson et al., 2004-a].
When working with non-traditional isotopes, it is not always possible to follow at the same
time the convention of rare isotope over major isotope on one hand and heavy isotope
over light isotope on the other hand. Both conventions are met in the case of, e.g., Mg
(25Mg/24Mg and 26Mg/24Mg) and Ca (44Ca/40Ca), but not in the case of, e.g., Li (6Li/7Li) and
Fe (54Fe/56Fe). If the rare over major isotope definition is maintained, there will be
inconsistencies in the sign of the δ EX value, so that a positive value will sometimes
reflect an enrichment in the heavier isotope, and sometimes a depletion. Given the fact
that some nucleosynthetic processes produce values of R that approach unity with
increasing atomic number, and that the simplifications of mixing and other equations
become less accurate as R approaches unity, it is preferred to define R for the new
isotope systems as heavy isotope over light isotope. This maintains the same convention
as used for traditional isotope systems, where a positive δ EX value indicates a relative
enrichment in the heavy isotope relative to a standard [Johnson et al., 2004-a].
III.2 – Stable isotope fractionation Isotopic fractionation, i.e., minor changes in the isotopic composition of an element,
between species or phases depends on a number of factors, including the relative mass
difference, the nature of the bonding environment and the redox state. Generally, it is
expected that the range in isotopic variations will decrease with increasing atomic number

CHAPTER III – Isotope ratio analysis via ICP-MS
53
Z because the relative mass difference also decreases [Johnson et al., 2004-a]. The relatively
large mass differences for the traditional stable isotopes are in part responsible for the
relatively large ranges in isotopic ratios (10’s-100’s ‰) that have been measured in
natural samples for these elements. Despite relatively small mass differences on the order
of ~ 1 %, significant isotopic variations are seen for heavier elements such as Mo (z=42)
[Anbar, 2004] and even Hg (z=80) [Jackson, 2001] and Tl (z=81) [Rehkämper et al., 2002].
III.2.1 – History
The theory of stable isotope fractionation precedes the development of modern mass
spectrometry, and includes a number of studies in the early-mid 20th century [Lindemann,
1919; Lindemann and Aston, 1919; Urey and Greiff, 1935; Bigeleisen and Mayer, 1947; Urey, 1947]. The
most studied elements were H, C, N, O and S, and theoretical calculations successfully
predicted the directions, magnitudes and temperature sensitivities of isotopic
fractionations. A key point is that all these theoretical treatments result from a simplified
thermodynamic model of the quantum mechanics of molecular vibration and rotation,
making calculations feasible for many substances, while maintaining enough accuracy to
be quantitatively useful [Schauble, 2004].
In stable isotope fractionation processes, a distinction between thermodynamic or
equilibrium isotope fractionation and kinetic isotope fractionation can be made. For most
elements, and typical terrestrial temperature and pressure conditions, equilibrium isotopic
fractionations are caused by the sensitivities of molecular and condensed-phase
vibrational frequencies to isotopic substitution. Some kinetic isotopic fractionations are
controlled by molecular or atomic translational velocities; this class includes many
evaporative and diffusive fractionations [Rodushkin et al., 2004; Richter et al., 2006].
The discovery of oxygen and sulfur fractionations that appear to have an unusual mass
dependence has renewed interest in variations in the mass dependence of different
fractionation mechanisms [Young et al., 2002]. However, recent measurements in non-
traditional stable isotope systems appear to confirm that mass-dependent fractionation is
the norm in geochemical processes and typical chemical reactions. In addition, theoretical
calculations suggest that different mass-dependent fractionation mechanisms will follow
slightly different laws, so that it may be possible to distinguish equilibrium and kinetic
fractionations [Young et al., 2002].

CHAPTER III – Isotope ratio analysis via ICP-MS
54
III.2.2 – Equilibrium isotopic fractionation
From an examination of both observed and theoretically calculated isotope fractionations,
it is clear that there are a number of qualitative chemical rules that can be used to
estimate which substances will tend to be enriched in heavy isotopes in a given
geochemical system. Five characteristics are shared by the elements that show large
variations in isotopic composition in nature: (i) low atomic mass, (ii) large relative mass
difference between stable isotopes, (iii) tendency to form highly covalent bonds, (iv)
multiple oxidation states or other chemical variability and (v) availability of multiple
isotopes with sufficient abundance to make measurements feasible [O’Neil, 1986]. Although
‘non-traditional’ stable isotopes in general fail to meet one or more of these criteria, the
rules are strongly supported by theoretical considerations [Bigeleisen and Mayer, 1947] and
form the basis for a qualitative guide to stable isotopic fractionations in all elements
[Schauble, 2004].
Equilibrium stable isotope fractionation is a quantum-mechanical phenomenon, driven
mainly by differences in the vibrational energies of molecules and crystals containing
atoms of differing masses [Urey, 1947]. In fact, a list of vibrational frequencies for two
isotopic forms of each substance of interest, along with a few fundamental constants, is
sufficient to calculate an equilibrium isotope fractionation with reasonable accuracy, as is
shown for the 35Cl/37Cl swap between the diatomic gas ClO and an isolated Cl atom
[Schauble, 2004]. When dealing with condensed phases, additional assumptions have to be
made in order to deal with the complexities and uncertainties arising in that situation.
Also a handful of non-vibrational mechanisms have been proposed to be responsible for
equilibrium isotopic fractionations, including effects of nuclear spin or shape on electronic
energies [Bigeleisen, 1998]. These non-vibrational phenomena can, in principle, be
distinguished from the conventional fractionations because they are not expected to be
mass-dependent. However, it is not yet clear how important these unconventional
mechanisms are in natural systems [Schauble, 2004].
III.2.3 – Kinetic isotopic fractionation Kinetic isotopic fractionations also show systematic behavior, although they are more
difficult to predict with a list of widely applicable rules. The term kinetic is being used
loosely to describe a host of basically one-directional processes occurring under conditions
of incomplete isotopic exchange. One common feature in many kinetic fractionation
processes is that the lighter isotopes are concentrated in reaction products, since the

CHAPTER III – Isotope ratio analysis via ICP-MS
55
transport of the lighter isotopes is more efficient than that of the heavier isotopes. This
behavior is observed, e.g., in rapid precipitations of Fe3+ oyhydroxide and oxide minerals
from Fe3+ solutions [Skulan et al., 2002], in evaporation of many substances including silicate
melts [Davis et al., 1990], in diffusion processes [Rodushkin et al., 2004; Malinovskiy et al., 2007],
and in numerous biological reactions [Johnson et al., 2004-b]. Kinetic fractionations are
usually sensitive to a host of factors, such as reaction rates, activation energies and the
presence of exchange catalysts, in addition to temperature [Schauble, 2004].
III.3 – ICP-MS for isotope ratio applications As stated in chapter II (§ II.8), the most relevant distinction between ICP-MS instruments
in the field of isotopic analysis is on the basis of their detection system, i.e., single-
collector (SC) – versus multi-collector (MC) – ICP-MS instrumentation.
III.3.1 – Single-collector ICP-MS
Single collector ICP – mass spectrometers are equipped with one electron multiplier for
ion detection. This implies that, for isotope ratio determinations, the isotopes of interest
are sequentially detected so that the isotope ratio precision attainable is inferior to that
attainable with thermal ionization – mass spectrometry (TI-MS), a technique that has long
been regarded as the reference technique for isotope ratio determinations of the heavier
elements [Walczyk, 2004] and offers an isotope ratio precision down to < 0.01 % RSD
[Heumann et al., 1998; Taylor et al., 1998]. However, for isotope ratio applications where an
extremely high precision is not required, ICP-MS offers important benefits over TI-MS,
such as the continuous nebulization of sample solution into the ion source at atmospheric
pressure, the higher sample throughput and the high ionization efficiency of the ICP [Houk
et al., 1980; Gray, 1986].
In traditional single-collector quadrupole-based ICP-MS (SC-ICP-Q-MS), the isotope ratio
precision attainable is limited to 0.1-0.5 % RSD [Heumann et al., 1998], a precision that is not
sufficiently high for many isotope ratio applications. This inferior precision can be
attributed to instabilities in the formation, transmission and detection of the ions and the
sequential detection of the isotopes of interest. The occurrence of spectral interferences is
another drawback, further limiting the application field of conventional quadrupole-based
ICP-MS for isotopic studies. However, by the introduction of collision/reaction cells
[Feldmann et al., 1999-a, Feldmann et al., 1999-b; Koppenaal et al., 2004] including the dynamic

CHAPTER III – Isotope ratio analysis via ICP-MS
56
reaction cell (DRC) [Tanner and Baranov, 1999; Tanner et al., 2002] in quadrupole-based ICP-MS
(SC-ICP-DRC-MS), considerable progress has been made in terms of both the battle
against interferences (chapter II, § II.6) and the isotope ratio precision attainable.
Thermalization of the ions in the dynamic reaction cell does not only result in an improved
transmission efficiency (collisional focusing), but can also improve the isotope ratio
precision attainable. In standard quadrupole-based ICP-MS without DRC or with DRC used
in vented mode, the time it takes an ion to travel from the extraction lens downstream to
the detector is of the order of 100 µs. During the time the intensity for one isotope is
registered (e.g., 1 ms), the other isotopes formed at exactly the same moment and under
the same conditions in the plasma, are not detected. For measuring the signal intensity of
the second isotope, an ion population sampled at a later moment from the plasma is
monitored, and thus the measured isotope ratio is biased by fluctuations in the ion beam.
Bandura and coworkers [Bandura and Tanner, 1999; Bandura et al., 2000] simulated these
fluctuations in a continuous ion beam originating from the plasma by applying a pulsed
voltage to the extraction lens. The individual ion packets, 200 µs long in vented mode,
were broadened up to 4 ms when the cell was pressurized. It was assumed that this
broadening also occurs when working with a continuous ion beam, as was demonstrated
by comparing the RSDs obtained upon isotope ratio measurement under vented and
pressurized conditions, respectively. From the results of the modulated beam
experiments, it can be assumed that ion density fluctuations of the continuous ion beam,
that occur in a timeframe of a few milliseconds or less, are damped in the cell, and
therefore, ions are redistributed in time. This temporal redistribution of the ions should
improve the correlation between populations of isotope ions selected sequentially by the
downstream quadrupole analyzer, leading to an improved isotope ratio precision.
Single-collector sector field ICP-MS or high resolution ICP-MS (SC-ICP-SF-MS or SC-HR-
ICP-MS) [Jakubowski et al., 1998] can be operated at a higher mass resolution, providing an
elegant way to resolve analyte signals from those of molecular ions with nearby mass
[Vanhaecke et al., 1996-b] and provides an isotope ratio precision of 0.05-0.2 % RSD
[Vanhaecke et al., 1997; Heumann et al., 1998]. Isotope ratio precisions of 0.05-0.5 % RSD have
been reported for TOF-ICP-MS [Vanhaecke et al., 1999].
III.3.2 – Multi-collector ICP-MS The technique multiple collector – or multi-collector ICP-MS (MC-ICP-MS) was developed
specifically to overcome the limitations of TI-MS on one hand and single-collector ICP-MS

CHAPTER III – Isotope ratio analysis via ICP-MS
57
on the other hand for isotope ratio analysis [Rehkämper et al., 2001]. To achieve this goal, the
argon ICP ion source was combined with a magnetic sector mass spectrometer
(chapter II, § II.5.2.2) and a Faraday cup array (chapter II, § II.7.2) as these were
already used in TI-MS instrumentation. At the high temperatures attained in an
inductively coupled argon plasma, elements with a first ionization energy < 10 eV are
ionized to an extent of 75 % or more [Jarvis et al., 1992]. Thus, with an ICP as an ion
source, virtually all elements of the periodic table are accessible to isotopic analysis. This
stands in contrast with TI-MS, where thermal ionization to positive ions is achieved for
only a limited number of elements with low first ionization energies.
The mass spectrometers in MC-ICP-MS are similar to the sector field mass spectrometers
used in single-collector ICP-SF-MS, but also aim at obtaining flat-topped peaks necessary
for high-precision isotope ratio measurements. For this reason, most MC-ICP-MS
instruments operate at a low mass resolution (~ 400) and at minimal loss of transmission
by the use of wide source and collector slits. Self-evidently, the possibility to overcome
spectral interferences by operating a sector field mass spectrometer at increased mass
resolution is also desirable for MC-ICP-MS, while at the same time preserving flat-topped
peaks and hence, assuring an isotope ratio precision still competitive with TI-MS. In the
case where there is only one interfering ion, its signal will either be at the high mass or
the low mass side of the analyte peak, and even if there are more molecular ions
interfering with accurate measurement of the analyte peak intensity, very often, all of
these ions are to be found at the same side of the analyte mass. In MC-ICP-MS, this fact
is often taken advantage of by working in so-called ‘pseudo-high resolution’ mode
[Vanhaecke and Moens, 2004]. While reducing the width of the source slit by moving one side
only, the width of the collector slit is not adjusted. In this way, the mass range over which
the analyte intensity is constant (the flat section of the spectral peak) is maximized [Weyer
and Schwieters, 2003]. The isotope ratio precision obtained under these conditions is
significantly better that that obtained at ‘full’ high resolution. Of course, the higher the
mass resolution, the harder it becomes to maintain the trapezoidal peak shape. Therefore,
the maximum resolving power offered by MC-ICP-MS is lower than that offered by single-
collector sector field ICP-MS. It is worth pointing out that the traditional definition of
resolution (chapter II, equation II.1), where Δm represents the peak width at 5 % of the
maximum peak height, is not valid in this case. In pseudo-high resolution conditions, Δm
represents the difference between the masses where the analyte intensity amounts to
95 % and 5 % of the maximal signal intensity, respectively. The mass resolution
calculated using the latter approach exceeds that calculated using the former approach by
CHAPTER III – Isotope ratio analysis via ICP-MS
58
more than a factor of two, so that care has to be taken when comparing mass resolutions
[Vanhaecke and Moens, 2004].
The use of a detector array with multiple Faraday cups permits the simultaneous
collection of the separated isotopes. Despite its lower sensitivity, the Faraday collector is
preferred over the secondary electron multiplier for ion detection in MC-ICP-MS
instrumentation, because in the counting mode, the multiplier suffers from dead time
effects which become increasingly important as the isotope ratio deviates more from unity
[Russ, 1989]. Only if a higher sensitivity is required, one or more Faraday cups can be
replaced by an electron multiplier. The multi-collection approach cancels out the effects of
a ‘noisy’ signal on the isotope ratio measurement. Especially in ICP – mass spectrometry,
this static multiple collection is critical because the ion beam that is produced in the
plasma is significantly more unstable than the ion beam in TI-MS, mainly due to short-
term intensity fluctuations. The collector incidences can be adjusted to permit isotopic
analysis of a wide range of elements having isotopes that display different mass
dispersions [Rehkämper et al., 2001], either by zoom optics that focus the separated ion
beams towards the respective fixed Faraday cups (e.g., Nu Plasma 500), or by adjusting
the positions of the Faraday cups (e.g., Neptune).
The results obtained with the first prototype MC-ICP-MS instrument, built by VG Elemental
in 1990, were impressive because they demonstrated that the isotopic composition of
elements such as Sr and Nd could be determined with a precision similar to TI-MS [Walder
and Freedman, 1992; Walder et al., 1993]. Furthermore, isotope ratio measurements of elements
with high ionization energies, such as Hf and W, were of superior quality and were
obtained at much greater speed and ease [Halliday et al., 1995]. Since its development, MC-
ICP-MS has undergone a rapid evolution and has found application in a continuously
growing number of laboratories world-wide. The immense interest of the geochemical
community in MC-ICP-MS instrumentation is largely based on the high precision and
extreme versatility of this mass spectrometric technique. The principal application of MC-
ICP-MS can be found in the earth sciences, and more specifically, in the highly precise
measurement of the isotopic composition of a wide range of elements. The application
field focuses on (i) elements that are difficult to analyze by TI-MS, such as isotopic
measurements in the context of long-lived (Lu-Hf) or extinct (Hf-W) radiogenic isotope
systems, (ii) precise elemental analysis with isotope dilution of a number of trace
elements, and, more recently, (iii) stable isotope ratio measurements [Halliday et al., 1998;
Rehkämper et al., 2001; Collerson et al., 2002].

CHAPTER III – Isotope ratio analysis via ICP-MS
59
III.4 – Uncertainty factors in isotope ratio determina-tion via ICP-MS The quality requirements and/or expectations of isotope ratio measurements are often
very high. This implies the need of an adequate identification of the different sources of
uncertainty. Although these different factors are often intertwined, a distinction is often
made between factors affecting (i) presicion, or factors that contribute to the noise of the
system [Begley and Sharp, 1994] and (ii) accuracy, or factors that create an offset or bias:
mass discrimination, mass scale shift, background and contamination, and detector dead
time [Begley and Sharp, 1997].
III.4.1 – Sources of noise
Inductively coupled plasmas are known as ‘noisy’ ion sources, compared to thermal
ionization sources. Different parts of the instrument are responsible for producing noise,
e.g., pulsations of the peristaltic pump, variations in the nebulizer efficiency, the
gasdynamic rotation of the plasma, changes in energy transfer from the plasma to the
aerosol and variation in ion extraction efficiencies. Random events also occur in detectors
and their associated electronics. More troublesome is noise picked up from inside the
instrument or from external sources.
Source noise contributions can be minimized by selecting suitable data acquisition
parameters for single-collector instruments [Begley and Sharp, 1994; Appelblad et al., 2001], such
as an increased measurement time, peak hopping instead of scanning, and a suited
choice of the dwell time per acquisition point, number of acquisition points per spectral
peak, number of sweeps and settling time. With single-collector ICP-MS instruments, the
noisy character of the ICP is counteracted by using a high peak-hopping rate (short
settling time) to eliminate low frequency noise from the plasma and the sample
introduction system to the largest possible extent [Furuta, 1991]. In the 1980’s, dwell times
of typically 10-20 ms were advised. With shorter settling times and using a dwell time of a
few milliseconds only, even higher peak-hopping rates can be used, allowing optimum
isotope ratio precisions to be obtained in both quadrupole-based – [Bandura et al., 2000;
Moens et al., 2001] and sector field [Vanhaecke et al., 1996-b] single-collector ICP-MS. The
measurement time can sometimes be used more efficiently by increasing the acquisition
time for the low abundant isotope(s) relative to that of the higher abundant isotope(s)
[Quétel et al., 1997]. The most efficient way to minimize the effect of source noise, however,

CHAPTER III – Isotope ratio analysis via ICP-MS
60
is the use of a multi-collector ICP-MS instrument. The simultaneous monitoring of all the
isotopes involved results in a superior isotope ratio precision, similar to that offered by TI-
MS. Multi-collector ICP – mass spectrometers are operated in static mode, which means
that neither the accelerating field, nor the strength of the magnetic field are changed
during data acquisition.
The effect of all the processes introducing noise is that the arrival of ions at the detector
is not a continuous process, but a random one, and is often assumed to be described
using a Poisson distribution. On the basis of counting statistics, the minimum standard
deviation σN on the number of counts N for ion counting systems is given by:
σN √N (equation III.6) Following error propagation, the standard uncertainty on the isotope ratio R/* I/J, representing the best isotope ratio precision theoretically attainable since it only takes into
account counting statistics, is given by [Vanhaecke et al., 2006]:
IR/R/ K5III 7
M A 5IJJ 7M (equation III.7)
III.4.2 – Mass discrimination
When an instrument produces a different response for ions of different mass, this
systematic error is called ‘mass discrimination’ or ‘mass bias’. Typically, the mass
discrimination that occurs in ICP-MS instrumentation is about 1 % per mass unit (at mass
100), irrespective of the kind of instrumentation. As the ion kinetic energy is dependent
on the mass [Niu and Houk, 1996], any energy-dependent process in the instrumentation
(e.g., sampling of ions from the ICP, transfer of ions, or detection) will result in mass
discrimination. Compared to TI-MS, mass discrimination in ICP-MS is often larger,
especially at lower mass. For example in the case of the 6Li/7Li isotope ratio, a mass
discrimination of 16 % is observed for ICP-MS [Sun et al., 1987] against less than 1 % mass
fractionation for TI-MS [Michiels and De Bièvre, 1983]. For both quadrupole-based – and sector
field instrumentation, the behavior and the magnitude of mass discrimination across the
mass range is fairly similar. Contrary to TI-MS, in which a discrete amount of sample is
brought into the ion source, there is a continuous introduction of new sample into the
ICP. Therefore, systematic time-dependent fractionation as in TI-MS does not occur in
ICP-MS.

CHAPTER III – Isotope ratio analysis via ICP-MS
61
III.4.2.1 – Origin of mass discrimination
Although not all the sources and mechanisms of mass discrimination in ICP-MS have been
unequivocally identified, the sampling of ions from the ICP and the ion transfer lens
system have been identified as the major contributors. A distinction can be made between
space-charge effects and nozzle-separation effects [Heumann et al., 1998], although the
effects cannot be distinguished from each other at the detector side of an ICP – mass
spectrometer since they both cause mass discrimination in the same direction (enrichment
in heavier isotopes). It was also suggested that mass discrimination originates during
ionization in the plasma itself [Maréchal et al., 1999]. Regardless of the origin, the large mass
bias associated with plasma source ionization necessitates that mass discrimination is
carefully monitored during isotope ratio measurements if precise and accurate analytical
results are to be obtained.
The space-charge effect is assumed to have the largest contribution to the mass
discrimination in an ICP – mass spectrometer. Tanner et al. described the influence of the
space-charge effects caused by the large matrix Ar+ ion currents (µA) passing through the
lens system [Tanner et al., 1994]. After the positively charged ion beam leaves the skimmer
cone, the mutual repulsion of ions limits the total number of ions which are transmitted
by the ion optics. If an ion beam consists of light and heavy ions, the light ions are
deflected more extensively than the heavy ions, whereas the heavy ions preferably
remain in the central ion beam. Hence, mass discrimination in isotope ratio measurements
depends on the matrix and therefore also on the total ion current produced by a sample
[Heumann et al., 1998]. The causal relation of these space-charge effects to mass
discrimination was later experimentally confirmed by isotopic analysis of deposits of
various elements on the ion lenses [Andrén et al., 2004].
The nozzle-separation effect has been described as a reason of mass discrimination
during plasma extraction via the sampling cone aperture [Heumann et al., 1998]. The ion
beam extracted from the ICP supersonically expands in the expansion zone between the
sampling and skimmer cones. Independent of space-charge effects, the lighter ions
should preferably be removed from the central beam compared to the heavier ions,
resulting in an enrichment of the central beam in the heavier isotopes. This effect was
later confirmed by carrying out isotopic analysis of B deposited onto the sampling and
skimmer cones [Andrén et al., 2004].
In the case of Cu and Zn isotopic analysis using multi-collector ICP-MS, it was observed
that a varying mass fractionation factor was obtained for Zn depending on the relative
CHAPTER III – Isotope ratio analysis via ICP-MS
62
transmission of Cu and Zn. Herefrom, it was suggested that the competition of different
elements for ionization in the plasma at different temperatures may induce mass
discrimination [Maréchal et al., 1999].
III.4.2.2 – Correction for mass discrimination
The mass bias is corrected for by either one of two methods. External standardization,
wherein the isotope ratio of interest is measured in a standard solution, and the bias used
to correct the same ratio in the sample, allows the mass bias to be measured at the same
masses as the analyte, and at approximately the same abundances. The magnitude of
mass bias, however, may change in the presence of the sample matrix and/or in the time
elapsed between measurement of the sample and the standard [Ingle et al., 2003]. In
internal standardization approaches, the mass bias is determined in the sample solution
either using a known isotope ratio of an element added to the sample for that purpose
(external normalization), or using a pair of isotopes of the analyte element that display an
invariant ratio in nature (internal normalization). The bias is then applied as part of a
mathematical model to correct the analyte ratio. Internal standardization provides nearly
continuous monitoring of the mass bias and can be used to correct matrix effects.
However, inaccuracies may be introduced as the isotopes used to calculate the bias have
masses, ionization characteristics and isotopic abundances that are different to the
analyte isotopes [Ingle et al., 2003].
III.4.2.2.1 – Internal and external normalization
Measurements of radiogenic isotope compositions (e.g., 87Sr/86Sr, 143Nd/144Nd) are
corrected for instrumental mass discrimination by normalization of the measured ratio to
an invariant isotope ratio of the same element. This procedure, so-called ‘internal
normalization’ employs empirically derived formulae, intended for the correction of TI-MS
data for evaporation-induced fractionation. The lack of a causal law that is able to
describe accurately the static mass discrimination effects of ICP – mass spectrometry has
led to the use of the same laws in ICP-MS [Rehkämper et al., 2004].
External normalization can be used for the determination of stable isotope compositions.
Since the mass discrimination in ICP-MS is, to a first order, a relatively simple function of
mass, elements with similar or overlapping mass ranges display a nearly identical mass
bias. Using a solution containing a mixture of two elements with similar masses, the mass
discrimination observed for an element of known isotopic composition can be used to

CHAPTER III – Isotope ratio analysis via ICP-MS
63
determine the mass discrimination affecting the unknown isotopic composition of the
second element (e.g., Tl in the case of Pb isotopic analysis [Rehkämper et al., 2004], Cu in the
case of Zn isotopic analysis [Maréchal et al., 1999].
Several empirical laws are used, in which a factor K is calculated on the basis of the true isotope ratio R from the certificate or the IUPAC table, the observed isotope ratio r and the mass difference Δm for the isotopes considered. From this factor, a mass
discrimination factor ε can be calculated. Three laws are distinguished: the linear law, the
power law and the exponential law, respectively given by:
K RR 1 A εS ∆m (equation III.8)
K RR 1 A εTUV∆> (equation III.9)
K RR eXY9Z ∆> (equation III.10)
In these expressions, ε is defined and determined for a specific isotope pair. Subsequent
incorporation of the calculated ε into one of the models implies two assumptions: (i) ε can be considered as a measure of the bias per mass unit, and is therefore constant over the
mass range, and (ii) ε has additive properties, so that ε measured from isotopes having
two mass units separation is equal to twice that for unit mass separation over the same
interval. It is evident that these models cannot be completely correct, since they predict
that the mass bias is dependent on the mass difference between the isotopes and not on
their absolute mass [Ingle et al., 2003]. This implies that the predicted bias in 6Li/7Li is the
same as in 206Pb/207Pb, contradicting common experience. Nevertheless, in MC-ICP-MS,
internal normalization using the power and exponential laws have been shown to be most
effective for the correction of mass bias in U measurements [Taylor et al., 1995] and Pb
measurements [Rehkämper and Mezger, 2000]. In quadrupole-based ICP-MS, the linear model
appeared to be at least as suited as the two alternatives for the correction of Pt isotope
ratios [Begley and Sharp, 1997]. The external normalization procedure was first suggested by
Longerich et al. to improve the Pb isotope ratio precision with quadrupole-based ICP-MS
using Tl as the reference element [Longerich et al., 1987]. The three correction equations
were found to be almost equally effective in SC-ICP-SF-MS when correcting the
111Cd/112Cd isotope ratio for the isobaric 112Sn interference on m/z 112 via the mass-bias
corrected 112Sn/117Sn ratio [Park et al., 2000]. Also in MC-ICP-MS, the external normalization
approach has been applied in several studies [Hirata, 1996; Belshaw et al., 1998; Rehkämper and
Halliday, 1998].
CHAPTER III – Isotope ratio analysis via ICP-MS
64
A different approach has been favored for the correction of mass bias in TI-MS, using an
equation first described by Russell et al. [Russell et al., 1978]:
K RR 5>[>\7
] (equation III.11)
with m( and mM the masses of the isotopes in the ratios R and r and β the mass discrimination factor.
Here, the mass discrimination factor β is still determined for a specific isotope pair, but
should be a better approximation as it indicates that the correction depends on the
absolute masses of the isotopes in the ratio considered. This equation has been shown to
be applicable to MC-ICP-MS for several isotope systems [Maréchal et al., 1999; White et al.,
2000; Anbar et al., 2001] as well. In these cases, it was found that the mass bias factors for
the analyte and internal standard are not equal, but that the ratio of the two was constant
during an analytical session, and could be used to successfully correct for mass bias.
It was shown that the power law (equation III.9) and the Russell expression
(equation III.11) are particular cases of a generalized power law [Maréchal et al., 1999],
expressed as:
K RR (_>\ >[ (equation III.12)
with g a mass-independent coefficient and n an arbitrary number.
The generalized power law is equivalent to the power law for n 1 and approaches the Russell expression for n c 0. The generalized power law was proven to be a valuable tool
to correct for instrumental mass bias in the case of Nd isotope ratio determinations,
where an optimum value of –0.23 was found for n [Wombacher and Rehkämper, 2003].
III.4.2.2.2 – External standardization
In TI-MS, the measured isotopic composition changes with time due to the progressive
evaporation process, and mass fractionation is thus time-dependent. Since an ICP source
operates at steady-state, mass discrimination in ICP-MS is not primarily a time-dependent
process. This is beneficial for the correction of instrumental mass bias by external
standardization, where the isotopic data obtained for a sample are referenced to the value
obtained for an isotopic standard [Rehkämper et al., 2004].
For heavy elements such as U, where the mass bias is ~ 0.5 % per mass unit, the mass
discrimination generally varies by < 0.2 ‰ per hour. For light elements below mass 40,
CHAPTER III – Isotope ratio analysis via ICP-MS
65
the drift is significantly larger, up to ~ 5 ‰ per hour [Tomascak et al., 1999]. Changes in
mass discrimination with time thus appear to be more severe for the lighter elements,
such that optimized application of external standardization will require different analytical
protocols for different elements. At present, the most precise data have been collected by
alternating sample and standard measurements, so that each sample is referenced only to
the mean of the standards measured immediately before and afterwards. In the case of
Pb isotope ratio measurements and using NIST SRM 981 Common Lead as a standard,
the corrected ratio can be calculated as follows:
RX 2 RNIST RXRNIST,kYlmnY o RNIST,plYn (equation III.13)
with RX and rX the true and measured isotope ratio in the sample, respectively and RNIST and rNIST the true and measured isotope ratio in the standard, respectively.
This technique of sample-standard bracketing is similar to the standardization method
used in GS-MS. For light elements, where the drift in mass bias is particularly severe, the
precision of sample measurements can be improved by performing multiple short
analytical runs that are each bracketed by standard measurements. Switching between
samples and standards can be very rapid if long washout protocols are not required, and
mass spectrometric runs of a few minutes have been used to maximize the precision of,
e.g., Mg isotopic measurements by MC-ICP-MS [Galy et al., 2001]. Longer data acquisition
periods are more applicable for heavier elements, for which the drift in mass bias is less
severe [Rehkämper et al., 2004].
III.4.3 – Mass scale shift
Mass scale shift occurs in both quadrupole-based and sector field ICP-MS instruments. For
quadrupole filters, the constancy of the RF and DC fields is the limiting factor [Begley and
Sharp, 1997] but is improved by the introduction of solid state RF generators. In sector field
equipment, mass scale shift occurs as a consequence of, e.g., temperature fluctuations
[Vanhaecke et al., 2006].
III.4.4 – Background and contamination
Here, ‘background’ is defined as that part of the ion current measured at a certain mass-
to-charge ratio, corresponding to the isotope under investigation, not originating from this
CHAPTER III – Isotope ratio analysis via ICP-MS
66
element. ‘Contamination’ is defined as that part of the ion current measured at a certain
mass-to-charge ratio that does not originate from the same element, but for which the
origin either lies within the instrument or the chemical procedure used. Distinction
between background and contamination can be done by studying the mass spectral
region of interest and measuring and comparing isotope ratios to the expected ones, as
calculated from the IUPAC tables [De Laeter et al., 2003].
Background can be either continuous over the mass spectral region, due to, e.g., photons
from the ICP arriving at the electron multiplier, or discontinuous, due to the presence of
spectrally interfering species. The origin of spectrally interfering species can be either
instrumental, e.g., due to the formation of ArO+ and Ar2+ ions or impurities present in the
plasma gas (e.g., Kr, Xe), or external, originating from concomitants in the sample, e.g.,
ArNa+ on 63Cu+ [Vanhaecke et al., 2006].
Contamination can also be instrumental or external. Instrumental contamination
comprises, e.g., memory effects occurring in the nebulizer tubing, nebulizer, spray
chamber, and/or interface and can be caused by, e.g., the volatility of the compound
(e.g., B, Os, Hg) and specific chemical features (e.g., Pt in solution is easily reduced in
Teflon tubings and refractory elements tend to deposit on the interface). External
contamination can occur in any of the sample preparation steps, e.g., sample
pretreatment, sample digestion and separation procedures. For this reason, the
preparation of a procedural blank is extremely important.
In order to correct for instrumental background and instrumental contamination, a
representative blank needs to be measured, and the blank signal obtained has to be
subtracted from the corresponding signal for all subsequent samples. Obviously, the
magnitude of the correction should be limited. For a discontinuous background originating
from the sample, the same approach can be followed when it is possible to prepare a
matrix-matched blank. Also mathematical corrections can be used to correct the ion
current observed for isotope jM (e.g., 204Pb interfered by 204Hg) by measuring the ion
current for another isotope (e.g., 202Hg) of the interfering element and calculating its
effect at the mass-to-charge ratio of interest assuming natural isotopic composition for
the interfering element. The same approach holds for corrections involving polyatomic
species (e.g., the abundance of ArNa+ reflects that of Ar itself). Procedural contamination
is best corrected for by measuring the isotope intensities (or concentration of M) in a
number of independent blank samples.

CHAPTER III – Isotope ratio analysis via ICP-MS
67
III.4.5 – Detector dead time
III.4.5.1 – Definition
When using an electron multiplier in the pulse counting mode (chapter II, § II.7.1), pulse
pile-up leads to biased isotope ratio results, at least for isotope ratios different from unity.
This is commonly attributed to the detector dead time, which is the time required for the
detection and the electronic handling of an ion pulse. If another ion strikes the detector
surface within the time required for handling the first ion pulse, the second ion will not be
detected and hence, the observed count rate will be lower than the actual count rate.
Typically, the detector dead times reported for ICP-MS instrumentation range from 15 to
100 ns [Vanhaecke et al., 2006]. If the detector dead time can be determined accurately,
these signal losses can be appropriately corrected for by using the following equation:
N Nq( Nq r (equation III.14)
with N the actual count rate, Ns the observed count rate and τ the detector dead time.
The higher the count rate, the larger the bias that is observed. As isotope ratio
measurements are often carried out at quite high count rates to improve the isotope ratio
precision (counting statistics, equation III.6 and equation III.7), an accurate
determination of the detector dead time is of great importance for reliable isotope ratio
results. In addition, the detector dead time should be determined at regular time intervals
since it has been observed to be influenced by the age of the detector [Seah, 1995] and
previous exposure. As opposed to an electron multiplier, a Faraday cup does not suffer
from dead-time effects (chapter II, § II.7.2 and § II.7.4).
III.4.5.2 – Experimental determination of the detector dead time
Several methods for determining the dead time of an electron multiplier are described in
literature [Nelms et al., 2001]. A first method used in this work was described by Russ [Russ,
1989]. For standard solutions of different concentration levels, a given isotope ratio
differing from unity is determined with the dead time set at 0 ns. For each concentration
level, the normalized isotope ratio, which is the measured isotope ratio corrected for the
detector dead time divided by the true value, is plotted against the detector dead time
used for correction. This results in a curve for each concentration level. The higher the
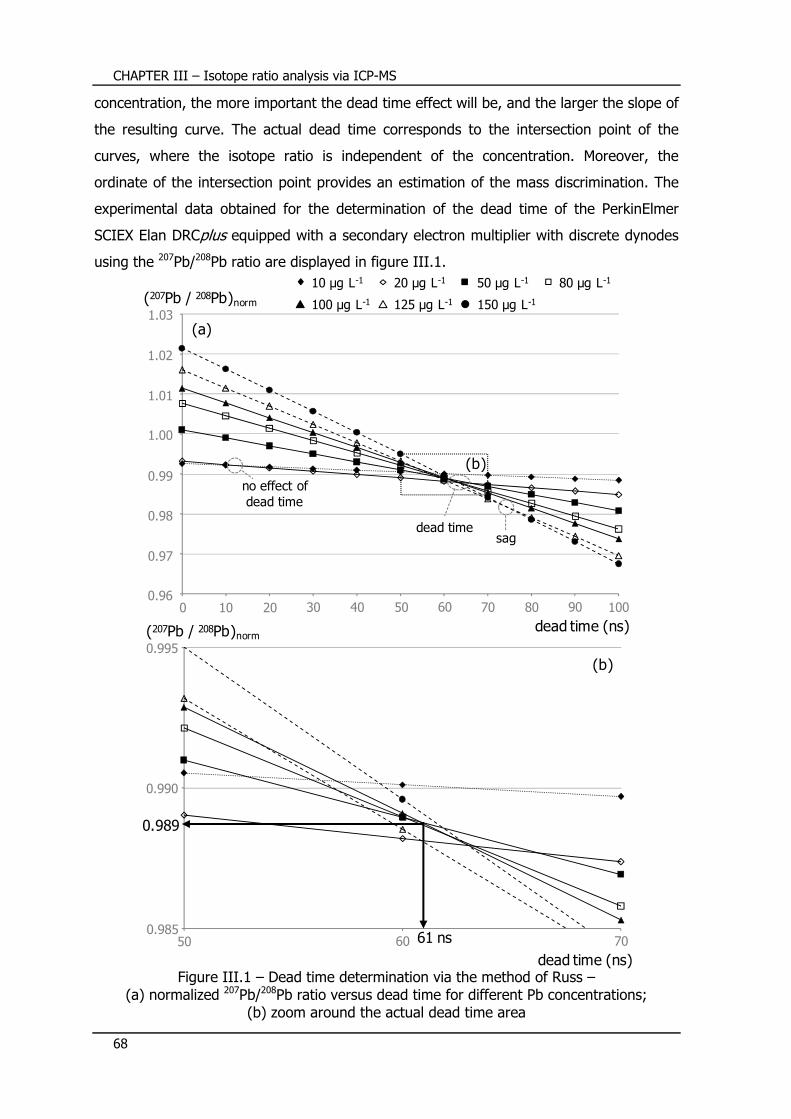
CHAPTER III – Isotope ratio analysis via ICP-MS
68
concentration, the more important the dead time effect will be, and the larger the slope of
the resulting curve. The actual dead time corresponds to the intersection point of the
curves, where the isotope ratio is independent of the concentration. Moreover, the
ordinate of the intersection point provides an estimation of the mass discrimination. The
experimental data obtained for the determination of the dead time of the PerkinElmer
SCIEX Elan DRCplus equipped with a secondary electron multiplier with discrete dynodes
using the 207Pb/208Pb ratio are displayed in figure III.1.
Figure III.1 – Dead time determination via the method of Russ – (a) normalized 207Pb/208Pb ratio versus dead time for different Pb concentrations;
(b) zoom around the actual dead time area
50 60 70
0.995
0.990
0.985
(207Pb / 208Pb)norm
dead time (ns)
61 ns
0.989
(b)
0 10 20 30 40 50 60 70 80 90 100
1.03
1.02
1.01
1.00
0.99
0.98
0.97
0.96
(207Pb / 208Pb)norm
dead time (ns)
20 µg L-1 80 µg L-1
100 µg L-1 125 µg L-1 150 µg L-1
10 µg L-1 50 µg L-1
no effect ofdead time
sagdead time
(a)
(b)

CHAPTER III – Isotope ratio analysis via ICP-MS
69
As can be seen from figure III.1.a, the different curves corresponding to the various Pb
concentrations do not intersect in exactly the same point, so that a definitive dead time
cannot be visually determined. An average dead time can be determined from the dead
times corresponding to each intersection point, and the standard deviation of this set of
values can be used to estimate the uncertainty. In figure III.1, the curves corresponding
to the lowest Pb concentrations (10 and 20 µg L-1) intersect at a very low dead time
(~ 12 ns), what can be explained by the fact that the signal intensity is not high enough
for a considerable dead-time effect to take place. The curves corresponding to the highest
Pb concentrations (125 and 150 µg L-1) intersect at a considerably higher dead time than
the average intersection point. This phenomenon is called ‘sag’ [Vanhaecke et al., 1998]. In an
electron multiplier operated in pulse-counting mode, the amplitude of a pulse has to be
above a certain discriminator level in order to be considered as a signal instead of noise.
It has been reported that, above a critical level, the gain of an electron multiplier
decreases with the number of incident particles per time unit [Kurz, 1979]. As a result, at
increasingly higher count rates, an increasing fraction of the output pulses shows an
amplitude below the discriminator level and hence, these pulses are not detected [Dietz,
1965; Russ and Bazan, 1987], explaining the occurrence of sag. Measurement data that are
influenced by sag should not be taken into account for the determination of the dead
time. The detector dead time for Pb was calculated as the average of the intersection
points of the curves corresponding to Pb concentrations of 50, 80 and 100 µg L-1 and was
established to be 61 ± 2 ns. Following an analogous approach, a dead time of 48 ± 3 ns
was found for Sr on the basis of the 86Sr/88Sr ratio.
At the actual dead time (61 ns for Pb), an estimation of the mass discrimination can be
made, since at this point, the measured isotope ratio is corrected for the detector dead
time. In the case of figure III.1.b, the mass discrimination amounts to 1.1 % per mass
unit, since the normalized 207Pb/208Pb ratio equals 0.989 at the intersection point.
An alternative approach, also applied in this work, relies on the same experimental data
as in the first method described, but a different way of graphical display [Koirtyohann, 1994;
Quétel et al., 2000]. In this case, the measured isotope ratio is plotted versus the Pb
concentration for different dead times (figure III.2.a). The optimum dead time is
determined by plotting linear regression lines through the data for each dead time and
taking the value that yields a line through the data with a slope of zero. When the dead
time is set at zero ns, in the case of the 207Pb/208Pb ratio where the abundance of 208Pb is
nearly twice the abundance of 207Pb, an increasing curve will be obtained with increasing
Pb concentrations, because more 208Pb is lost relative to 207Pb, resulting in a higher

CHAPTER III – Isotope ratio analysis via ICP-MS
70
207Pb/208Pb ratio. With increasing dead time, the slope of the curve will decrease until, at
the optimum dead time, the slope equals zero. In this case, the measured isotope ratio is
independent of the Pb concentration. Further increasing the dead time will result in an
over-correction (and thus, increase) of the 208Pb intensity relative to the 207Pb intensity,
resulting in negative slopes in the 207Pb/208Pb ratio versus Pb concentration diagram.
Figure III.2 – Alternative method for dead time determination – (a) measured 207Pb/208Pb ratio versus concentration for different dead time values;
(b) graphical determination of the uncertainty on the actual dead time
0 10 20 30 40 50 60 70 80 90 100
0.430
0.425
0.420
0.415
0.410
207Pb / 208Pb
dead time (ns)
100 µg L-1 Pb
(b)
2s interval on dead-timecorrected isotope ratio
2s interval onactual dead time
0 50 100 150
207Pb / 208Pb
Pb concentration (µg L-1)
(a)
0.405
0.410
0.415
0.420
0.425
0.430
0.43580 ns 90 ns 100 ns
10 ns 30 ns 40 ns 50 ns
60 ns
0 ns 20 ns
70 ns
(a)

CHAPTER III – Isotope ratio analysis via ICP-MS
71
It can be seen that around 60 ns, a curve with slope zero is obtained. However, regarding
the fact that the optimum dead time is not easily derived on a visual basis, plotting the
slope of the regression lines for different dead times versus the assumed dead time yields
the actual dead time at the point where the curve intersects the dead-time axis. The
equation of the latter curve turned out to be:
slope 10x 41.506 τ A 89.679, from which the detector dead time τ could be calculated as 60 ns. The uncertainty on the experimentally determined dead time can be derived by first calculating the isotope ratio
at the different concentrations with the optimum dead time, their average and the
corresponding standard deviation (2s uncertainty interval). The uncertainty on the actual
dead time can be graphically evaluated by projecting the uncertainty on the average
dead-time corrected isotope ratio onto the dead-time axis, as is shown in figure III.2.b.
The detector dead time for the secondary electron multiplier of the Elan DRCplus was
established to be 60 ± 4 ns for Pb, and 49 ± 5 ns for Sr. The agreement between the
dead time obtained via this method, and the method described by Russ, is excellent. The
dead time was set at 61 ns for Pb isotope ratio measurents, and at 49 ns for Sr isotope
ratio measurements.
The difference in dead time retrieved for Sr (49 ns) and Pb (61 ns) is small compared to
the relative mass difference between these elements. Since the dead time was
determined only for these two elements, no mass-dependent trend of the detector dead
time could be established with certainty in this work for an electron multiplier with
discrete dynodes. For a continuous dynode electron multiplier, it was shown that the
detector dead time is mass-dependent, yielding dead times of ~ 80 ns for Sr and
~ 110 ns for Pb [Vanhaecke et al., 1998].
The correction methods described above are relatively simple and fast, but do not take
into account the occurrence of mass discrimination. A third approach incorporates mass
discrimination correction, and is limited to elements that have a pair of isotopes of relative
abundance 1:1, with a third isotope of relative abundance between 0.01 and 0.05 [Held and
Taylor, 1999; Nelms et al., 2001], ensuring that the target ratio is small enough to be clearly
affected by dead time losses, while at the same time this isotope is sufficiently abundant
to prevent blank subtraction or interference correction inducing a bias in the dead time
calculations. These requirements are met in the Pb certified reference material NIST SRM
982 Equal Atom Lead (204Pb: 1.0912 %; 206Pb: 40.0890 %, 207Pb: 18.7244 %; 208Pb:
40.0954 %). When measuring this reference material, the ratios 204Pb/206Pb and

CHAPTER III – Isotope ratio analysis via ICP-MS
72
204Pb/208Pb are influenced by both mass discrimination and dead time, while the
206Pb/208Pb ratio is quasi only influenced by mass discrimination. After mass discrimination
correction via internal normalization for the standards with different concentrations, the
ratio of the certified 204Pb/206Pb or 204Pb/208Pb isotope ratio and the mass discrimination
corrected 204Pb/206Pb or 204Pb/208Pb ratio is plotted versus the observed count rate of the
major isotope of the isotope pair under study. Such a plot results in a line of negative
slope from which the optimum dead time can be determined from the relationship:
τ SUTR ( (equation III.15)
with R the certified isotope ratio.
Recalculating the normalized isotope ratios using the optimum dead time and plotting the
new ratios in the same way should result in a horizontal curve. The uncertainty on the
slope of the regression line determines the uncertainty on the experimental dead time
[Nelms et al., 2001].
A fourth approach consists of plotting analog data versus the corresponding pulse count
data across a range of increasing signal intensities [Nelms et al., 2001]. This can be easily
done on a quadrupole-based instrument by aspirating a single standard, varying the lens
voltage over a preset range, measuring the intensities both in pulse counting and analog
mode, and recalculating them for different dead times. For every dead time value, the
analog signal is plotted versus the pulse counting signal, and a correlation coefficient is
calculated. The optimum dead time is considered to be the average of those for which the
correlation coefficient remains constant up to the sixth decimal place. The standard
deviation of this range of dead times is an indication for the uncertainty on the
determined dead time.

CHAPTER IV
Target elements
and sample types
investigated in this work


CHAPTER IV – Target elements and sample types investigated in this work
75
This chapter provides a general background on the target elements and on the sample
types studied in this work. The methods developed in this work aim at the Sr or Pb
isotopic analysis of archaeological artefacts, such as bone and dental tissues, soils,
ceramics and metallic objects. The target elements in this work, Sr and Pb, both display
variations in their isotopic composition due to the decay of radioactive parent elements:
Sr evolves from Rb while Pb evolves from U and Th. In this chapter, the Rb-Sr and U-Th-
Pb isotope systems are discussed and the use of Sr and Pb for archaeological studies is
highlighted. Then, general characteristics and properties of the different sample types
studied in this work, are given.
IV.1 – Rubidium/strontium isotope system IV.1.1 – Occurrence and properties of Rb and Sr Rubidium is an alkali metal, belonging to group IA of the periodic table. Its ionic radius
(1.48 Å) is sufficiently similar to that of potassium (1.33 Å) to allow rubidium to substitute
potassium in all K-bearing minerals. As a consequence, Rb is a dispersed element that
occurs in easily detectable amounts in common K-bearing minerals such as micas
(muscovite, biotite, phlogopite and lepidolite), K-feldspar (orthoclase and microcline),
certain clay minerals, and in evaporate minerals such as sylvite and carnallite. Rubidium
does not form any minerals of its own [Faure, 1986-a].
Rubidium has two naturally occurring isotopes: 85Rb and 87Rb. Information on the isotopes
of rubidium is summarized in table IV.1.a. The 87Rb isotope is radioactive and decays to
stable 87Sr by emission of a negative beta particle (electron) as follows:
Rb Sr β ν Q
with β a beta particle (electron), ν an antineutrino and Q the decay energy of 0.275 MeV/atom.
Strontium is a member of the alkaline earths that constitute group IIA of the periodic
table. Its ionic radius (1.13 Å) is slightly larger than that of Ca (0.99 Å), which it can
replace in many minerals. As a consequence, also strontium is a dispersed element and
occurs in Ca-bearing minerals such as plagioclase, apatite, and calcium carbonate,
especially aragonite. The ability of strontium to replace calcium is somewhat restricted by
the fact that strontium ions (Sr2+) favor eight-fold coordinated sites, whereas calcium ions
(Ca2+) can be accommodated in both six- and eight-fold coordinated sites because of their
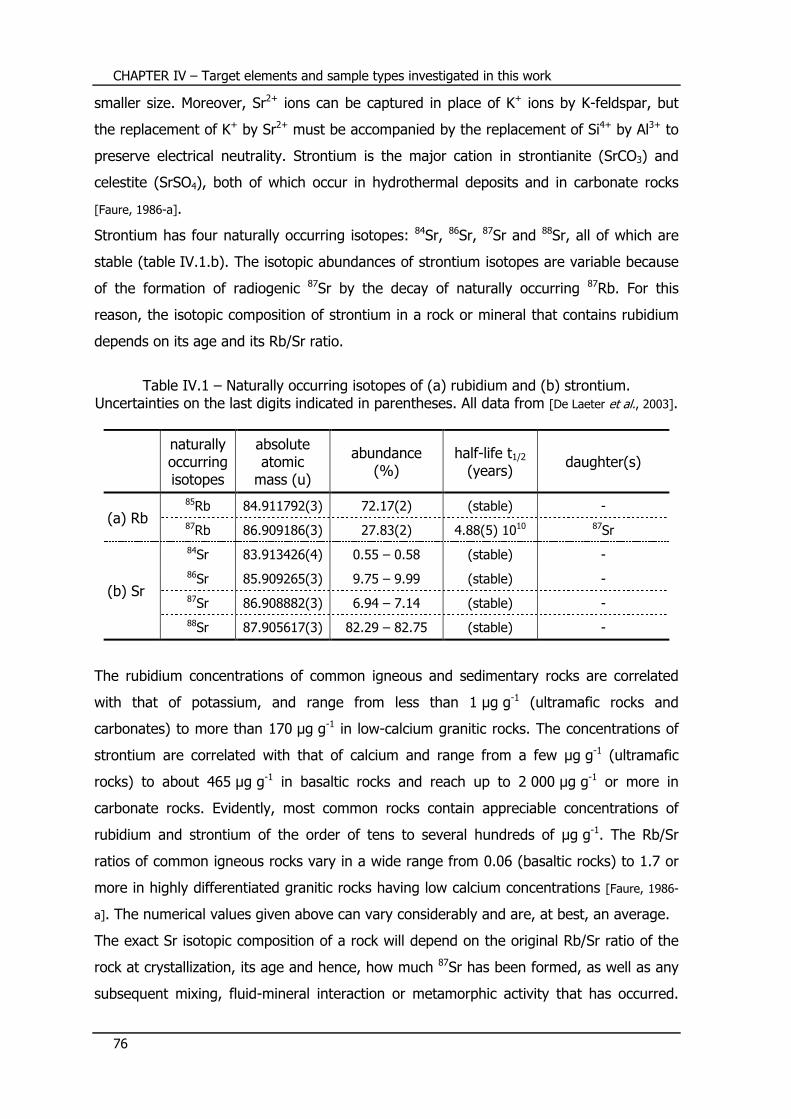
CHAPTER IV – Target elements and sample types investigated in this work
76
smaller size. Moreover, Sr2+ ions can be captured in place of K+ ions by K-feldspar, but
the replacement of K+ by Sr2+ must be accompanied by the replacement of Si4+ by Al3+ to
preserve electrical neutrality. Strontium is the major cation in strontianite (SrCO3) and
celestite (SrSO4), both of which occur in hydrothermal deposits and in carbonate rocks
[Faure, 1986-a].
Strontium has four naturally occurring isotopes: 84Sr, 86Sr, 87Sr and 88Sr, all of which are
stable (table IV.1.b). The isotopic abundances of strontium isotopes are variable because
of the formation of radiogenic 87Sr by the decay of naturally occurring 87Rb. For this
reason, the isotopic composition of strontium in a rock or mineral that contains rubidium
depends on its age and its Rb/Sr ratio.
Table IV.1 – Naturally occurring isotopes of (a) rubidium and (b) strontium.
Uncertainties on the last digits indicated in parentheses. All data from [De Laeter et al., 2003].
naturally occurring isotopes
absolute atomic
mass (u)
abundance (%)
half-life t1/2 (years)
daughter(s)
(a) Rb 85Rb 84.911792(3) 72.17(2) (stable) - 87Rb 86.909186(3) 27.83(2) 4.88(5) 1010 87Sr
(b) Sr
84Sr 83.913426(4) 0.55 – 0.58 (stable) - 86Sr 85.909265(3) 9.75 – 9.99 (stable) - 87Sr 86.908882(3) 6.94 – 7.14 (stable) - 88Sr 87.905617(3) 82.29 – 82.75 (stable) -
The rubidium concentrations of common igneous and sedimentary rocks are correlated
with that of potassium, and range from less than 1 µg g-1 (ultramafic rocks and
carbonates) to more than 170 µg g-1 in low-calcium granitic rocks. The concentrations of
strontium are correlated with that of calcium and range from a few µg g-1 (ultramafic
rocks) to about 465 µg g-1 in basaltic rocks and reach up to 2 000 µg g-1 or more in
carbonate rocks. Evidently, most common rocks contain appreciable concentrations of
rubidium and strontium of the order of tens to several hundreds of µg g-1. The Rb/Sr
ratios of common igneous rocks vary in a wide range from 0.06 (basaltic rocks) to 1.7 or
more in highly differentiated granitic rocks having low calcium concentrations [Faure, 1986-
a]. The numerical values given above can vary considerably and are, at best, an average.
The exact Sr isotopic composition of a rock will depend on the original Rb/Sr ratio of the
rock at crystallization, its age and hence, how much 87Sr has been formed, as well as any
subsequent mixing, fluid-mineral interaction or metamorphic activity that has occurred.

CHAPTER IV – Target elements and sample types investigated in this work
77
Consequently, older Rb-bearing rocks will tend to contain more radiogenic 87Sr than
younger rocks, whereas if no Rb was incorporated into the rock at formation, it will retain
its original, unradiogenic Sr isotope ratio. The estimated 87Sr/86Sr ratio for ‘primordial’ Sr is
0.699 and, as 87Sr has been continually produced since the Earth was formed, that of the
present-day mantle is 0.704 ± 0.002. The Sr isotope ratio in whole rocks can vary from
~ 0.703 for young basaltic rocks to > 0.750 for K-rich (and hence Rb-rich) granites
formed from older, crustal rocks [Graustein, 1989; Bentley, 2006].
Strontium is released from rocks primarily through chemical weathering. Any subsequent
alteration of the Sr isotope ratio (isotopic fractionation; chapter III, § III.2) that occurs
during this and ensuing low-temperature geolocial or biological processes is negligible
[Capo et al., 1998; Blum et al., 2000]. Consequently, the isotope abundances that characterize a
particular rock move unaltered from the source rock into soils, groundwater, plants and
animals. However, this does not imply that the Sr isotope ratio measured in, e.g., tooth
enamel or river water, is exactly the same as that of the underlying whole rock. Two
factors may complicate the process. Firstly, the isotopic composition of Sr released from a
heterogeneous, polymineralic rock may not match that of the whole rock. Some
components may weather more readily than other, resulting in Sr isotope ratios that are
characteristic for, rather than an exact reflection of, the parent rock. Furthermore, since
Rb-bearing (felsic) minerals are generally more resistant to weathering than the Sr-
bearing (mafic) minerals, the 87Sr/86Sr isotope ratio of released Sr tends to be less
radiogenic (lower) than that of the whole rock and thus, over time, the remaining rock
becomes increasingly more enriched in radiogenic 87Sr [Faure, 1986-a]. The second process
that may alter a given 87Sr/86Sr isotope ratio is mixing of two or more sources. Strontium
released from rocks into soil and water may be modified by non-local Sr derived from
other rock types, transported and deposited by wind-blown dust, river water and
precipitation, which has, on its turn, seawater as a source [Capo et al., 1998; Blum et al., 2000].
IV.1.2 – Rb-Sr dating The Rb-Sr decay system has been widely used in geochronology and remains one of the
most useful geochemical tracers, as 87Sr/86Sr is a function of the relative abundances of
rubidium and strontium, and the age of the rocks. Specifically, the 87Sr/86Sr ratio in a rock
mineral depends on: (i) the 87Sr/86Sr ratio at the time the rock crystallized, (ii) the 87Rb/86Sr ratio, which is directly proportional to the Rb/Sr ratio, and (iii) the time elapsed
since formation [Bentley, 2006].
CHAPTER IV – Target elements and sample types investigated in this work
78
The growth of radiogenic 87Sr in a Rb-rich mineral is a phenomenon of radioactivity, and
thus, the total number of 87Sr atoms in a mineral of age t given by: Sr Sr Rb e 1 (equation IV.1)
with Sr the total number of atoms of this isotope in a unit weight of the mineral at the present time, Sr the number of atoms of this isotope that was incorporated into the same unit weight of this mineral at the time of its formation, Rb the number of atoms of this isotope in a unit weight of the mineral at the present time, λ the decay constant (given by ln(2)/t1/2) and t the time elapsed in years since the time of formation of the mineral.
Each term of equation IV.1 can be divided by the number of 86Sr atoms, which is constant
because this isotope is stable and is not produced by the decay of a naturally occurring
isotope of another element, resulting in:
S S ! S
S " R$ S e 1 (equation IV.2)
The term e can be expanded as a power (Taylor) series:
e 1 λt %&'(! %&*! + (equation IV.3)
Since the decay constant λ of 87Rb is very small (table IV.1.a), the terms of higher order
than 1 are negligible, and therefore the following approximation can be made:
e 1 , λt, (equation IV.4) so that equation IV.2 can be rewritten as:
S S , ! S
S " R$ S λt (equation IV.5)
This equation has the form of a straight line in a 87Sr/86Sr versus t diagram, with a slope
given by the product of the 87Rb/86Sr ratio and the decay constant of rubidium, and an
intercept that equals the initial 87Sr/86Sr ratio. Equation IV.5 is the basis for age
determinations via the Rb-Sr method, and is only valid for age determinations where the
number of 87Sr and 87Rb atoms in the mineral have changed as a result of radioactive
decay only. In other words, the mineral must have always behaved as a closed system
with respect to rubidium and strontium [Faure, 1986-a].
The Rb-Sr decay system produces an array of values for the different minerals in a rock.
Given measurements of 87Sr/86Sr and 87Rb/86Sr in a sample, two unknowns remain in
equation IV.5: the age t and the initial 87Sr/86Sr ratio. Neither can be calculated from a

CHAPTER IV – Target elements and sample types investigated in this work
79
single sample. However, if 87Sr/86Sr and 87Rb/86Sr can be measured on a second mineral
for which t and the initial 87Sr/86Sr are the same, two equations result with two unknowns,
and the difference between equation IV.5 for each mineral yields:
Δ S S Δ R$
S λt (equation IV.6)
This relationship shows that a line results if the 87Sr/86Sr is plotted against the product of
λ and the 87Rb/86Sr ratio. Such a line is known as an isochron (figure IV.1), with the age t as slope and the initial 87Sr/86Sr ratio as intercept. The older the system is, the steeper will
be the isochron because the differences in 87Sr/86Sr are built up over time by differences
in 87Rb/86Sr. The slope of the isochron depends only on t, which can be solved for as:
t . /0 S2 S2
0 R4 S2 5 (equation IV.7)
If two minerals with a different Rb/Sr ratio formed within a rock at the same time with the
same initial 87Sr/86Sr ratio, then the mineral with the higher Rb/Sr ratio will have a higher 87Sr/86Sr ratio. In other words, a single rock which partitioned into different minerals when
it crystallized, yields a linear array of 87Sr/86Sr ratios, as described by its isochron.
Figure IV.1 – Rb-Sr isochron
IV.2 – Uranium/thorium/lead isotope system IV.2.1 – Occurrence and properties of U and Th Uranium and thorium are members of the actinide series in the periodic table. Both
elements occur in nature in the tetravalent oxidation state and their ions have similar radii
87Sr / 86Sr
87Rb / 86Sr
initial87Sr / 86Sr
ratio
minerals differentiated at time of formation
evolution by decayof 87Rb into 87Sr
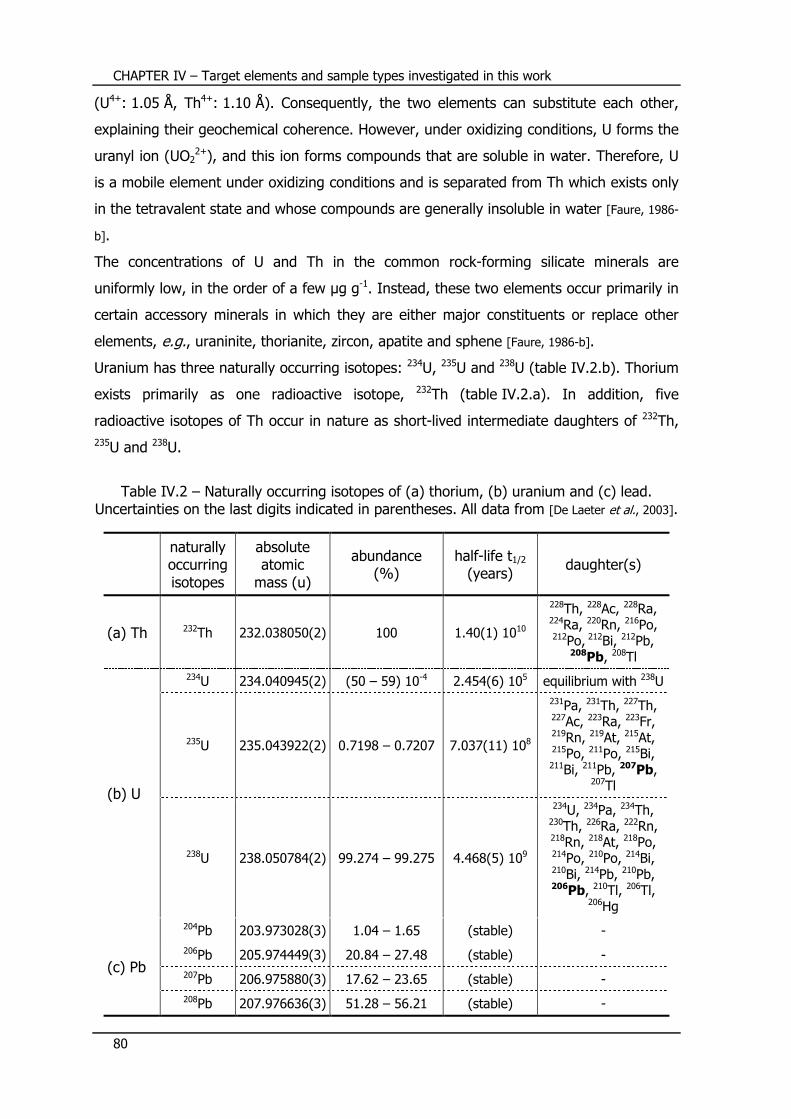
CHAPTER IV – Target elements and sample types investigated in this work
80
(U4+: 1.05 Å, Th4+: 1.10 Å). Consequently, the two elements can substitute each other,
explaining their geochemical coherence. However, under oxidizing conditions, U forms the
uranyl ion (UO22+), and this ion forms compounds that are soluble in water. Therefore, U
is a mobile element under oxidizing conditions and is separated from Th which exists only
in the tetravalent state and whose compounds are generally insoluble in water [Faure, 1986-
b].
The concentrations of U and Th in the common rock-forming silicate minerals are
uniformly low, in the order of a few µg g-1. Instead, these two elements occur primarily in
certain accessory minerals in which they are either major constituents or replace other
elements, e.g., uraninite, thorianite, zircon, apatite and sphene [Faure, 1986-b].
Uranium has three naturally occurring isotopes: 234U, 235U and 238U (table IV.2.b). Thorium
exists primarily as one radioactive isotope, 232Th (table IV.2.a). In addition, five
radioactive isotopes of Th occur in nature as short-lived intermediate daughters of 232Th, 235U and 238U.
Table IV.2 – Naturally occurring isotopes of (a) thorium, (b) uranium and (c) lead.
Uncertainties on the last digits indicated in parentheses. All data from [De Laeter et al., 2003].
naturally occurring isotopes
absolute atomic
mass (u)
abundance (%)
half-life t1/2 (years)
daughter(s)
(a) Th 232Th 232.038050(2) 100 1.40(1) 1010
228Th, 228Ac, 228Ra, 224Ra, 220Rn, 216Po, 212Po, 212Bi, 212Pb,
208Pb, 208Tl
(b) U
234U 234.040945(2) (50 – 59) 10-4 2.454(6) 105 equilibrium with 238U
235U 235.043922(2) 0.7198 – 0.7207 7.037(11) 108
231Pa, 231Th, 227Th, 227Ac, 223Ra, 223Fr, 219Rn, 219At, 215At, 215Po, 211Po, 215Bi, 211Bi, 211Pb, 207Pb,
207Tl
238U 238.050784(2) 99.274 – 99.275 4.468(5) 109
234U, 234Pa, 234Th, 230Th, 226Ra, 222Rn, 218Rn, 218At, 218Po, 214Po, 210Po, 214Bi, 210Bi, 214Pb, 210Pb, 206Pb, 210Tl, 206Tl,
206Hg
(c) Pb
204Pb 203.973028(3) 1.04 – 1.65 (stable) - 206Pb 205.974449(3) 20.84 – 27.48 (stable) - 207Pb 206.975880(3) 17.62 – 23.65 (stable) - 208Pb 207.976636(3) 51.28 – 56.21 (stable) -
CHAPTER IV – Target elements and sample types investigated in this work
81
The decay of 238U gives rise to the uranium series in which several intermediate
daughters, e.g., 234U, undergo branched decay by emission of either an alpha (helium
atom) or beta (electron) particle. The chain therefore splits into separate branches, but
the stable end product of all possible decay paths is 206Pb. The decay of 238U to stable 206Pb can be summarized as:
U7(( Pb((9: 8 He(= 6 β Q
with Q = 47.4 MeV/atom. The decay of 235U gives rise to the actinium series, a series that also shows several decay
paths but always ends with stable 207Pb:
U((? Pb((9 7 He(= 4 β Q
with Q = 45.2 MeV/atom
The decay of 232Th leads to the formation of stable 208Pb:
Th79(( Pb((9 6 He(= 4 β Q
with Q = 39.8 MeV/atom Despite the fact that in the decay series of 232Th, 235U and 238U together, a total of
43 isotopes of 12 elements are formed as intermediate daughters, none of these is a
member of more than one series. In other words, each decay chain always leads to the
formation of a specific isotope: 232Th produces 208Pb, 235U produces 207Pb and 238U
produces 206Pb [Faure, 1986-b].
The half-lives of 232Th, 235U and 238U are all very much longer than those of their
respective daughters. In this case of so-called ‘secular equilibrium’, the production rate of
the stable daughter at the end of a particular decay chain is equal to the rate of decay of
its parent at the head of the chain. As a consequence, the decay of Th and U can be
considered as if it occurred directly to the respective isotopes of Pb [Faure, 1986-b].
IV.2.2 – U-Th-Pb dating Ordinary lead has four naturally occurring isotopes: 204Pb, 206Pb, 207Pb and 208Pb
(table VI.2.c). Only 204Pb is not radiogenic, and is treated as a stable reference isotope.
The isotopic composition of Pb in minerals containing U and Th can be expressed in
equations of the form of equation IV.2 as follows:

CHAPTER IV – Target elements and sample types investigated in this work
82
P$ 'E P$ 'EF ! P$ 'E
P$ 'EF " U '*P$ 'EF eH 1 (equation IV.8)
P$ 'EP$ 'EF ! P$ 'E
P$ 'EF " U '*IP$ 'EF e' 1 (equation IV.9)
P$ 'EP$ 'EF ! P$ 'E
P$ 'EF " TK '*'P$ 'EF e* 1 (equation IV.10)
Solving the three equations results in three independent dates based on the three decay
series. In the case where the three decay series yield the same date, this date represents
the age of the mineral, provided that the following requirements are met: (i) the mineral
remained closed to U, Th, Pb and all the intermediate daughters throughout its history,
(ii) correct values are used for the initial Pb isotope ratios, (iii) the decay constants of 232Th, 235U and 238U are known accurately and (iv) the isotopic composition of U has not
been modified by isotopic fractionation or by the occurrence of a natural chain reaction
based on fission of 235U [Faure, 1986-b]. However, as with Sr, the Pb isotope ratios of a
given rock or ore deposit may not be simply a function of age and the concentrations of
Pb, U and Th incorporated at formation. Rocks that do meet this so-called ‘single stage’
model or formation and have remained closed to subsequent mixing are known as
‘ordinary’ or ‘conformable’ lead, and their isotopes lie on a growth curve. Anomalous Pb,
which does not lie on the growth curve and may even plot in the future, does so because
it has been mixed with radiogenic U and Th-rich crustal lead at some time in its formation
history, and hence, is not compatible with the assumption of a closed system [Faure, 1986-
c]. In order to make the evolution of common lead compatible with U and Th mixing, a
two-stage model [Stacey and Kramers, 1975] or even a multi-stage model can be addressed. A
detailed discussion of these models and additional information on U-Th-Pb dating is
described in detail in dedicated sources, e.g., [Faure, 1986-c].
IV.2.3 – Occurrence and properties of lead Lead is widely distributed throughout the Earth and occurs not only as the radiogenic
daughters 206Pb, 207Pb and 208Pb of U and Th, but exists also as a non radiogenic 204Pb
isotope (table IV.2.c). Lead is found in many types of rocks, both as a major constituent
and as a trace element, not only in association with U and Th-bearing minerals but also
by forming its own minerals, principally galena (PbS), from which U and Th are excluded.
Pb2+ is known to replace K+ in K-feldspar but, unlike Sr, there is no striking geological
correlation with Ca-bearing minerals [Elias et al., 1982]. Lead accumulates with the transition
CHAPTER IV – Target elements and sample types investigated in this work
83
metals zinc, cadmium and trace amounts of silver in ore deposits. The lead isotopic
composition can vary considerably from the common-lead found in low U/Pb and Th/Pb
minerals such as galena (PbS), sulfides of other base metals, K-feldspar and the relatively
uncommon secondary Pb minerals such as cerusite (PbCO3) and anglesite (PbSO4), to the
highly radiogenic Pb in ancient accessory minerals such as zircon and apatite or rocks like
U and Th-bearing granites [Faure, 1986-c; Erel et al., 1994]. As a consequence, the lead
isotopic composition in different kinds of rocks contains a record of the chemical
environments in which the Pb resided (e.g., mantle, crustal rocks, Pb ores). Each of these
environments has different U/Pb and Th/Pb ratios that affect the isotopic evolution of Pb.
The isotopic composition of Pb may be modified both by decay of Th and U and by mixing
with Pb having a different isotopic composition.
Lead isotopic fractionation in low-temperature biogeochemical processes has not been
proven, so that the Pb isotope ratios that characterize a particular rock, ore or locality are
transferred unaltered to soil and groundwaters by natural weathering processes. Isotope
variations, which can originate from small spatial differences within one ore field or
preferential weathering of heterogeneous rock phases are mixed within the soil and
groundwater to create a homogeneous reservoir representative of the underlying local
geology [Erel et al., 1994].
IV.3 – Sr and Pb isotopes in archaeological studies The isotope systems Sr and Pb have been used individually in both archaeological and
modern source-tracing studies. Strontium isotope ratios are employed frequently in
investigation of archaeological bone, often combined with isotope ratio data for light
isotopes (e.g., C, O), and in provenance determination of, e.g., marble and glass [Freestone
et al., 2003; Brilli et al., 2005; Degryse et al., 2006]. Also lead is useful in provenance
determination studies of archaeological artefacts, e.g., ceramics and metallic objects.
Published studies that utilize archaeological skeletal remains tend to fall into two
categories: (i) those that harness Sr or Pb isotope analysis to answer a specific
archaeological question, such as diagenesis or migration, as is also the case in this work,
and (ii) those that utilize archaeological remains as a resource to illustrate an analytical
technique or provide time-depth to an environmental or geochemical investigation. Both
approaches have drawbacks. In conducting such studies, one has to be cautious to (i) not
over- or misinterpret data due to their complex nature or limitations and (ii) carefully
consider the nature and limitations of the archaeological resource being utilized.

CHAPTER IV – Target elements and sample types investigated in this work
84
IV.3.1 – Sr isotope studies The 87Sr/86Sr isotope ratio reflects the average of all strontium that has been contributed
to the sample. In the case of a skeleton of archaeological interest, each Sr atom has its
own history and may, e.g., have been transferred from a partial melt of magma into a
rock mineral, a stream, a soil, a plant leaf, a herbivore’s diet and finally in the meal of a
(pre-)historic person. Within that individual’s skeletal tissue, it joins other strontium atoms
that have journeyed a different route. After centuries or millennia underground, the
strontium is finally released from the skeletal mineral in the modern laboratory and
analyzed by mass spectrometry.
The application of Sr isotope ratios in archaeology is based on the finding that migrant
individuals who moved between geologic regions can be identified by comparing the 87Sr/86Sr ratio in the tooth enamel, composed between four and twelve years of age, and
in the tooth dentine and the bones, which remodel throughout life and are therefore
representative of adulthood [Bentley, 2006]. In theory, if the teeth and bones of a skeleton
have different signatures, the person spent his/her life in a different geochemical
environment than during his/her youth [Ericson, 1985; Sealy et al., 1991]. In cases involving
modern skeletons, or archaeological skeletons that have been extraordinarily well
preserved, bone and tooth 87Sr/86Sr ratios can be successfully compared and used to
establish migration behavior, as was shown for, e.g., modern elephants in Amboseli
National Park, Kenya [Koch et al., 1995] and the Alpine iceman Ötzi [Hoogewerff et al., 2001;
Müller et al., 2003]. A better temporal resolution can even be obtained via measurements of
bone, which undergoes continual replacement of its inorganic phase, so that different
individual bones contain information on the age of a migrant person when he/she moved
[Price et al., 2002]. Dense cortical bone remodels over a period of decades, while trabecular
bone remodels with turnover times as short as a few years.
If assuming that a migrant individual moves only once from one place to another, it is
possible to quantitatively model how the 87Sr/86Sr ratios in the bone and dental tissues
approach the local ratio at different rates [Beard and Johnson, 2000]. How close the bone
value is to the local signature depends on both the turnover rate of the bone and the time
that the migrant individual resided at the specific location [Schweissing and Grupe, 2003].
Several studies have been carried out using Sr isotope ratios to investigate modern animal
mobility and migration away from the place of origin through natural Sr uptake [Koch et al.,
1995; Chamberlain et al., 1997; Hobson, 1999]. Strontium isotope ratio analysis has also been
extensively applied on hominid and animal fossils to identify both migration and different

CHAPTER IV – Target elements and sample types investigated in this work
85
feeding strategies [Koch et al., 1992; Sillen et al., 1995; Sillen et al., 1998; Hoogewerff et al., 2001;
Müller et al., 2003].
Unfortunately, a major issue is the reliability of the measured 87Sr/86Sr ratio at present,
since archaeological bone is often contaminated during burial. The groundwater
strontium, namely, penetrates the bone after burial and can overwhelm, or even replace,
the in vivo strontium in its mineral portion [Price et al., 1992; Hedges, 2002; Nielsen-Marsh and
Hedges, 2000-a]. It has been argued that diagenetic strontium can often be removed from
skeletal samples by proper sample cleaning with weak acid, e.g., 5 % acetic acid [Price et
al., 1992; Sillen and Sealy, 1995; Nielsen-Marsh and Hedges, 2000-b]. This leaching process will
dissolve away the diagenetic strontium present in carbonate and in pore spaces, while
retaining the original dietary strontium that is more strongly bound in the Ca sites of the
bone hydroxyapatite. This technique has proved valuable in some cases [Price et al., 1994;
Ezzo et al., 1997], but when diagenesis has taken more insidious forms than just filling pore
spaces, the weak acid treatment cannot isolate the biogenic Sr, which may even have
been completely replaced during burial [Budd et al., 2000]. Like bone, tooth dentine is also
highly susceptible to contamination, because it contains pores as large as 1 µm, much
larger than its phosphate crystals, which are smaller than 0.1 µm [Kohn et al., 1999]. For a
sample of prehistoric and medieval human teeth from the UK, Budd et al. found that 15 to
100 % of the Sr in dentine was diagenetic, accumulated from the burial environment
[Budd et al., 2000]. Unlike bone and dentine, the story is different for tooth enamel. Because
tooth enamel is denser, harder and more inert than bone or dentine, it is more resistant
to post-burial isotopic contamination than bone or dentine [Kohn et al., 1999; Budd et al., 2000],
the main reason being that the phosphate crystals in enamel are relatively large
(> 1 µm), and the structure is compact, with little pore spaces [Kohn et al., 1999]. Repeated
studies have proven that fossil tooth enamel contains much less diagenetic Sr than bone
or dentine [Kohn et al., 1999; Chiaradia et al., 2003; Lee-Thorp and Sponheimer, 2003; Trickett et al.,
2003]. For the reason that archaeological bone and dentine are often too contaminated to
be of much use for Sr isotopic studies, several current studies focus exclusively on tooth
enamel, which forms during childhood and undergoes relatively little change after it is
mineralized [Knudson et al., 2004; Knudson et al., 2005; Price and Gestsdottir, 2006; Price et al., 2006].
IV.3.2 – Pb isotope studies Source-tracing applications of archaeological material can use and interpret Pb isotope
data in a way analogous to those of Sr. However, Pb exposure is less dependent on

CHAPTER IV – Target elements and sample types investigated in this work
86
geological origin and natural baseline levels, but serves more as an indicator of status, or
what access to Pb and its products was available within a society, geographical location or
just to a specific individual. A complication to archaeological studies occurs when the
accumulating anthropogenic pollution becomes so prominent that it is blurring the link
between the locality and the bio-available Pb isotope signature. Although also the Roman
Era can be clearly identified from the Pb accumulation profile in ice cores and peat bogs
[Shotyk et al., 1998], modern large-scale atmospheric pollution only becomes a major
complicating factor during the Industrial Revolution and prior to this, trade of Pb products
was the dominant mechanism for Pb movement [Hong et al., 1994; Brännvall et al., 1999].
Lead isotopes have been primarily used to track changes in pollution and exposure
through space and time as opposed to the movement of people into different exposure
zones. Accordingly, there are many published studies that characterize and then identify
the contemporary sources of Pb in cases of Pb poisoning, particularly in children [Yaffe et
al., 1983; Rabinowitz, 1987], or assess the relative contributions that different sources, such as
paint or petrol, have made to human Pb burdens [Keinonen, 1992; Delves and Campbell, 1993;
Farmer et al., 1994]. A large body of work has been published on source tracing
contemporary Pb exposure by Gulson and coworkers [Gulson and Wilson, 1994; Gulson et al.,
1995; Gulson, 1996; Gulson and Gillings, 1997]. These workers also exploited the principle of
different Pb sources having characteristic signatures to identify migrants in a forensic
context [Gulson et al., 1997]. Whereas archaeological applications are based on the
consumption of locally-derived diets, the latter study utilized the different industrial Pb
sources that exist in different countries and which residents are thus exposed to
throughout their lives. The principle of different Pb sources was successfully applied in
numerous other studies [Reinhard and Ghazi, 1992; Ghazi, 1994; Ghazi et al., 1994; Carlson, 1996;
Yoshinaga et al., 1998; Bower et al., 2005; Bower et al., 2007]. The extent to which diagenesis
blurred the Pb ratios was evaluated to be minimal. In other studies however, Pb
concentrations higher than biogenic ranges were attributed to diagenesis [Millard, 2006;
Zapata et al., 2006].
Besides lead present in (archaeological) skeletal tissues, also lead present as a trace or
major element in archaeological artefacts, such as ceramics and ancient metals or metallic
objects, comprises valuable information. In this case, lead isotope ratios can provide
insight into the provenance of the raw materials used for the manufacturing of the
ceramics [Habicht-Mauche et al., 2002; Tunstall and Amarasiriwardena, 2002; Resano et al., 2008] or
metallic artefacts [Young et al., 1997; Ponting and Segal, 1998; Klein et al., 2004-a; Baker et al., 2006]
under study.
CHAPTER IV – Target elements and sample types investigated in this work
87
IV.4 – Sample types investigated in this work In what follows, a section is given on the general characteristics and the typical matrix
composition of the various sample types investigated in this work. The various matrices
comprise soils, bone and dental tissues, ceramics and metallic artefacts with lead, copper
and silver as the major elements.
IV.4.1 – Soils The composition of soils is extremely diverse and governed by many different factors.
However, climatic conditions and parent material predominate most commonly [Kabata-
Pendias and Pendias, 1984-a]. Two stages are involved in the formation of soil from parent
material: (i) physical and chemical weathering, and (ii) pedogenesis. Weathering can be
chemically described as the processes of dissolution, hydration, hydrolysis, oxidation,
reduction and carbonation. All of these processes are based on rules of enthalpy and
entropy, and they lead to the formation of mineral and chemical components that are
relatively stable and equilibrated in the particular soil environments. Chemical weathering
leads to the destruction of parent minerals and to the passing of the elements from the
minerals into solutions and suspensions [Kabata-Pendias and Pendias, 1984-a].
Pedogenesis involves specific reactions, in addition to those involved in weathering, and
results in the formation of a soil profile from the weathered rock material, leading to the
development of a mature zonal soil. Although there is a great diversity in pedogenic
processes, they all include similar stages: (i) addition of organic and mineral materials to
the soil, (ii) losses of these materials from the soil, (iii) translocation of these materials
within the soil, both vertically and horizontally, and (iv) transformation of the organic and
mineral matter in the soil. These processes can be either constructive or destructive in soil
formation [Kabata-Pendias and Pendias, 1984-a].
Soil is composed of three phases – solid (mineral and organic), liquid and gaseous – and
exhibits properties resulting from the physical and chemical equilibriums of these phases.
Moreover, not only the chemical composition of the solid components of soil, but also its
mineral structure and the state of dispersion are important factors influencing soil
properties [Kabata-Pendias and Pendias, 1984-a].
Quartz (SiO2) is the most common macroscopically distinguishable mineral in surface soils,
constituting 50 to more than 90 % of the solid soil phase. Even in geochemical conditions
favorable for the leaching of silicates, quartz remains as a basic soil mineral. Feldspars are
CHAPTER IV – Target elements and sample types investigated in this work
88
of low relative resistance to weathering in soil environments and their alteration usually
provides materials for clay mineral formation. These clay minerals are a host to many
trace elements (e.g., Sr and Pb) and are more important than quartz in this respect, the
latter being poor in trace element content. Carbonates (calcite, dolomite) and metal
oxides are usually accessory minerals in soils of humid climatic soils, while in soils of arid
climatic zones, they may be significant soil constituents. Quantitatively, trace elements are
negligible constituents of the solid soil phase, but they play an important role in soil
fertility [Kabata-Pendias and Pendias, 1984-b].
The primary form of Pb in soil is galena (PbS). Lead occurs mainly as Pb2+, although the
occurrence of Pb4+ is also known, and it forms several other minerals which are quite
unsoluble in natural waters. During weathering, Pb sulfides slowly oxidize and have the
ability to form carbonates and also to be incorporated in clay minerals, in iron- and
manganese oxides, and in organic matter. The geochemical characteristics of Pb2+
somewhat resemble the divalent alkaline-earth group of metals, thus Pb has the ability to
replace K, Ba, Sr and even Ca both in minerals and in sorption sites. The natural Pb
content of soil is inherited from parent rocks. However, due to the widespread Pb
pollution, most soils are likely to be enriched in this metal, especially in the top horizon.
The natural Pb occurrence in top horizons of different soils from various countries ranges
from 3 to 189 µg g-1, while mean values for different soil types range from 10 to 67 µg g-1
with an average of 32 µg g-1. An upper limit for the Pb content of a normal soil can be
established at 70 µg g-1, while lead levels above 100 µg g-1 most probably reflect the
impact of pollution [Kabata-Pendias and Pendias, 1984-c]. The Pb concentration in the upper
continental crust equals 20 µg g-1 [Taylor and McLennan, 1995].
In the terrestrial environment, strontium is very often associated with Ca, and to a lesser
extent with Mg, because the geo- and biochemical characteristics of Sr are similar to
those of Ca. Strontium is easily mobilized during weathering, especially in oxidizing acid
environments, and then it is incorporated into clay minerals and strongly fixed by organic
matter, but most Sr is precipitated as biogenic carbonates, largely in the form of
invertebrate shell material. This element is known to occur mainly as Sr2+ ions; however
its chelated forms play an important role in Sr cycling which is closely associated with Ca
cycling. The strontium content of soils is highly controlled by parent rocks and climate,
and is therefore highly variable. Strontium concentrations range from 18 to 3 500 µg g-1
in top horizons [Kabata-Pendias and Pendias, 1984-d], from 10 to 1 000 µg g-1 in soil minerals
[Elias et al., 1982; Bashkin, 2002; Bentley, 2006] and the average Sr content of the upper
continental crust is around 370 µg g-1 [Capo et al., 1998].

CHAPTER IV – Target elements and sample types investigated in this work
89
IV.4.2 – Bone and dental tissues Enamel, dentine and bone are composite tissues of inorganic, organic and water fractions
in varying amounts. The inorganic phase is the crystalline calcium phosphate mineral
dahllite or carbonate hydroxyapatite, with the repeating unit cell formula
[(Ca,X)10(P,C)6(O,OH)26], where X is considered to represent a variety of possible
substitutions for Ca, such as Na, Mg, Sr, Ba and Pb [McConnell, 1973]. It is, although
inaccurate, frequently referred to as ‘hydroxyapatite’ with the unit cell [Ca10(PO4)6(OH)2]
[Bigi et al., 1997; Wopenka and Pasteris, 2005]. As dahllite or carbonate hydroxyapatite is almost
exclusively found in vertebrate tissues, it is also often called ‘biological apatite’ or
‘biogenic apatite’, of which the unit formula has been described as
~ [Ca9(PO4)4.5(CO3)1.5(OH)] [Driessens and Verbeeck, 1990]. The crystals are hexagonal prisms,
formed from the repeating unit cell, and are renowned for their non-stoichiometry,
because the crystal lattice accommodates a wide variety of distortions, substitutions and
vacancies, and hence rarely conform to any simple formula [Wopenka and Pasteris, 2005].
Tooth enamel contains ~ 96 % calcium phosphate, ~ 3 % water and ~ 1 % organic
matter. Tooth dentine is 70-75 % calcium phosphate, 5-10 % water and ~ 20 % organic
matter [Hillson, 1986; Driessens and Verbeeck, 1990; Kohn et al., 1999]. Structurally, enamel is
extremely compact, with little pore space, large phosphate crystals (> 1 µm long), and a
decussate texture. In contrast, dentine is porous with tubules of ~ 1 µm in diameter and
smaller crystals (< 0.1 µm in length) [Hillson, 1986; Kohn et al., 1999].
Enamel phosphate has a composition of ~ [Ca4.5[(PO4)2.7(HPO4)0.2(CO3)0.3](OH)0.5]
[Driessens and Verbeeck, 1990], where CO32- and HPO4
2- substitution for PO43- is charge
balanced by vacancies in the Ca2+ and OH- sites. Other important substitutions include
additional Cl- and CO32- in the OH- sites, and Na+ and Mg2+ in the Ca2+ sites. Dentine
phosphate has, in comparison with enamel, a lower Ca2+ and PO43- content, and a higher
Mg2+ and CO32- content [Driessens and Verbeeck, 1990]. Although enamel and dentine contain
approximately the same mineral phase, there are major differences between their organic
fraction. Enamel is the most highly mineralized of all mammalian skeletal tissues and is
almost entirely composed of inorganic mineral. Its organic phase contains no collagen but
consists of what appears to be remnants of redundant protein that were incompletely
removed during development [Robinson et al., 1995]. The much smaller dentine phosphate
crystals are found within and around collagen fibrils, and also many non-collagenous
proteins are present [Butler et al., 1997]. The larger organic content and the smaller crystal
size of dentine make this tissue more susceptible to alteration than enamel [Kohn et al.,

CHAPTER IV – Target elements and sample types investigated in this work
90
1999]. Dentine is, in contrast to enamel, a living, cellular tissue that can respond to blood-
borne substances. The composition of primary dentine is, like that of enamel, largely
determined at the time of formation. Nevertheless, the cells of dentine, the odontoblasts,
remain active so that the formation of new, secondary dentine continues throughout life
[Veis, 1989].
The structure and elemental composition of bone is more easily compared to that of
dentine than to that of enamel. The mineral content of mature bone amounts from 55 to
75 % [Barone, 1982]. Dentine, however, contains at least three proteins that are not found
in bone [Butler et al., 1997]. Bone, unlike dentine, contains blood vessels and is subject to
the continual remodeling behavior of the bone cells, the osteoclasts and the osteoblasts.
Strontium is incorporated as Sr2+ in the carbonate hydroxyapatite lattice as a substituent
for Ca2+ [Rokita et al., 1993; Vukovic et al., 1998], and is distributed relatively homogeneously in
the skeleton. Concentrations of strontium in the skeletal and dental tissues from a single
individual are very similar, with bone and dentine containing slightly more than enamel
[Underwood, 1977-a; Aufderheide, 1989], probably resulting from the smaller carbonate
hydroxyapatite crystals of bone and dentine, providing larger surface areas available for
cation adsorption. The difference may also originate from post-formation increases due to
bone remodeling or secondary dentine formation, given the fact that bone Sr
concentrations are believed to increase with age [Underwood, 1977-a]. As is the case for Sr
isotope ratios, also in vivo strontium concentrations in bone and teeth appear to vary
geographically [Underwood, 1977-a]. This could be due to regional variations in bedrock
geology, water and food or types of diet. Although specific values are highly variable, a
rough indication of strontium concentrations in mammal bone and dental tissues is the
range of 50 to 1 000 µg g-1 [Elias et al., 1982; Burton et al., 1999; Kohn et al., 1999].
The vast majority of Pb in the body is located in the hard tissues of the skeleton where it
is believed to occupy Ca2+ sites within the carbonate hydroxyapatite lattice as Pb2+ [Wallach
and Chausmer, 1990]. The incorporation of Pb2+ in place of Ca2+ is thermodynamically more
favorable [Patterson et al., 1991]. Lead is not distributed homogeneously throughout the
skeleton and Pb concentrations can vary considerably between different bones [Aufderheide,
1989, Erkkilä et al., 1992] but typical modern adult Pb concentrations are usually at least an
order of magnitude lower than Sr concentrations, ranging from 3 to 60 µg g-1 [Arnay-De-La-
Rosa et al., 1998; Yoshinaga et al., 1998]. The skeletal lead concentration appears to
accumulate, most notably in cortical bone, until ~ 50-60 years of age and also increases
with increasing exposure [Underwood, 1977-b; Erkkila et al., 1992].
CHAPTER IV – Target elements and sample types investigated in this work
91
IV.4.3 – Ceramics The raw materials used for the manufacturing of ceramics, or more specifically in this
work, pottery and amphorae, are derived from mainly the clay minerals of soils. The
strontium and lead content of ceramics was, as expected, shown to be in the same
concentration range as for soils. The (trace-)elemental composition of ceramics is highly
versatile, and hence allows provenance studies of ceramics based on their trace elemental
composition [Mallory-Greenough et al., 1998; Barone et al., 2004; Kennett et al., 2004; Klein et al., 2004-
b; Little et al., 2004; Barone et al., 2005; Marengo et al., 2005; Resano et al., 2005], as well as their Pb
isotope ratios [Tunstall and Amarasiriwardena, 2002; Habicht-Mauche et al., 2002; Marzo et al., 2007].
IV.4.4 – Metallic artefacts The metallic artefacts investigated in this work can be divided in groups according to the
major metal in the alloy: copper (unalloyed copper, brass and bronze), lead (lead and
litharge fragments) and silver. Copper, lead and silver are extracted from the parent ores,
and in the case that no lead is intentionally added to the alloy, the Pb isotopic
composition of the object reflects that of the parent ore since Pb does not undergo
isotopic fractionation in its route from ore to object. Hence, the Pb isotopic composition
was shown as a valuable tool for fingerprinting ancient metallic artefacts, such as objects
and coins [Young et al., 1997; Ponting and Segal, 1998; Klein et al., 2004-a; Baker et al., 2006]. Below, a
word follows on the extraction and treatment of copper, silver and lead from their
respective ores in antiquity, regarding its relevance for this work (chapter VIII). It is,
however, not the intention to give a detailed or a complete overview of the existing
production techniques in antiquity or at present. The interested reader is referred to
dedicated sources for a more detailed overview [Tylecote, 1962; Tylecote, 1976; Craddock, 1995].
Copper occurs in nature in ore deposits. The existence of native copper in copper ore
deposits is well known, and was most probably the source for the very first copper
objects. Further, copper is present in a number of minerals, such as cuprite (Cu2O),
malachite (CuCO3.Cu(OH)2), chalcocite (Cu2S) and chalcopyrite (CuFeS2). Refining copper
from oxide- and carbonate-based ores can be accomplished by heating and reduction with
charcoal or wood, combined with a blast of air and a suited furnace [Moorey, 1994], while
sulfide ores are more difficult to reduce due to the presence of many impurities (e.g., S,
As, Sb). Removal of these impurities prior to refining was performed by roasting, which is
prolonged heating to convert the copper sulphides into their oxide form [Tylecote, 1976].
CHAPTER IV – Target elements and sample types investigated in this work
92
After refining, unalloyed copper is obtained, which contains < 2 % tin and zinc, and
< 4 % lead. However, copper is often alloyed in the presence of heat. An alloy is the
result of the combination of two or more chemical elements, of which at least one is a
metal. In antiquity, copper was often alloyed with tin and/or zinc. Alloying copper with tin
results in bronze (> 5 % Sn), alloying with zinc results in brass (> 10 % Zn and < 5 %
Sn), and alloying with both tin and zinc results in gunmetal (> 5 % Zn and Sn) [Ponting,
2002]. Alloys containing more than 4 % lead are considered as ‘leaded’ in this work. The
addition of lead to an alloy improves its characteristics with respect to further handling,
e.g., it increases the fluidity of the alloy. This is beneficial if the alloy is to be used for
casting complex objects such as statuettes [Rosenfeld et al., 1997; Weeks, 2004]. A
disadvantage however is that lead does not ‘dissolve’ into copper, but forms globules
throughout the metal [Thornton and Ehlers, 2003], thus forming a rather heterogeneous
mixture on the microscopic level and rendering the resulting alloy difficult or even
impossible to be mechanically handled, either cold or hot.
Silver is widely dispersed in minerals in low levels (< 0.5 %) and is almost invariably
found in sulfides, with argentite (Ag2S) being the main silver mineral. However, the
principle silver sources in antiquity were silver-containing lead ores, such as galena (PbS)
that generally contains small amounts of silver (argentiferous galena) [Habashi, 1994],
cerussite (PbCO3) and anglesite (PbSO4). Lead ores are widely dispersed and relatively
easy to refine to the pure metal [Tylecote, 1962]. Herefore, it seems likely that lead may
have been among the first metals to be smelted [Craddock, 1995]. Smelting galena under a
moderately oxidizing atmosphere triggers the conversion of PbS to PbO and PbSO4,
followed by the formation of metallic lead. Cerussite was heated with charcoal and also
resulted in metallic lead. The metal obtained via this relatively simple smelting process
can contain substantial amounts of silver and other impurities (e.g., Cu, As, Sb) but was
probably never refined, except from the extraction of the silver. Lead absorbs silver, but
the two metals do not mix. The absorbed silver can be separated from the lead by the
process of cupellation, which is the removal of lead by selective oxidation to litharge (lead
oxide, PbO). Silver remains unaffected by this process [Tylecote, 1962]. The cupellation
process that is most efficient in separating impurities from silver could be repeated
several times in order to further purify the silver obtained [Tylecote, 1962].
CHAPTER V
Sample pretreatment and
digestion procedures


CHAPTER V – Sample pretreatment and digestion procedures
95
In this work, several archaeological artefacts with a different matrix composition (soil,
bone and dental tissues, ceramics and metallic objects) were the subject of investigation.
The first – and probably most important – step in the analysis is to sample the object
under investigation in such a way that the outcome of the analysis is representative for
the whole sample. Regarding the small amount of sample often retrieved at the
archaeological site and, to some extent, the historical value of some archaeological
artefacts, the sample amounts available were in most cases limited to less than 1 g, and
in many cases even less than 0.5 g. The next step is the sample pretreatment, where the
samples under investigation are prepared for digestion. This step consists of (i) cleaning
of the sample to remove contamination and/or an altered chemical composition on the
sample’s surface due to burial and (ii) obtaining a homogeneous fraction of the solid
sample, preferably as a fine powder in order to facilitate the subsequent digestion,
representative for the total sample available. In this chapter, such sample pretreatment
procedures are described for the various types of samples, along with the digestion
procedures that were developed and validated to result in a complete dissolution of the
respective sample types.
V.1 – Sample pretreatment procedures V.1.1 – Sample cleaning and cutting
All the samples investigated in this work are of archaeological origin. Small amounts of
soil samples, bone tissues, amphora and pottery samples were delivered. Tooth tissues
were delivered as whole teeth, and metallic objects, including lead objects, were provided
as fragments or whole objects.
Bone samples, taken from the femora from deceased and stillborn infants (chapter IX),
were delivered as small pieces, typically 0.1-0.5 g in weight. The bone pieces were
mechanically cleaned, rinsed in ethanol and dried in a drying stove at 105 °C. Also a
sample of fish bones was delivered, this was treated in the same way as the human bone
samples. The dried pieces were subsequently pulverized using a microdismembrator
(§ V.1.2), as were the soil particles.
Whole teeth were mechanically cleaned and subsequently leached in 0.1 M acetic acid in
order to remove surface contamination and soil-derived (diagenetic) strontium
(chapter IV, § IV.3.1). Considering that the aim of the Servatius – project (chapter X) was
to establish whether there is a difference in Sr isotopic composition between the enamel

CHAPTER V – Sample pretreatment and digestion procedures
96
(crown, white outer tissue) and the dentine (root, inner tissue), these tissues were
carefully separated from one another by means of a dental saw (Department of dentistry,
Ghent University). After obtaining the separate enamel and dentine fractions, they were
rinsed with ethanol to remove contamination originating from the cutting process, and
dried in a drying stove at 105 °C.
Powdered amphora samples were delivered (chapter IX). One pottery sample was
delivered as a larger shard. A hammer was used to crush the piece into smaller
fragments, the fragments were rinsed with ethanol to remove contamination originating
from the crushing process, and prior to digestion, the ceramics samples were dried in a
drying stove at 105 °C.
Lead fragments (chapter VIII and IX) were partially cut into curls with a razor blade and
rinsed with ethanol to remove potential surface contamination present due to the cutting
process, and dried in a drying stove at 105 °C. The curls from the outer surface of the
fragments was discarded to assure that a subsample free of corrosion products was
obtained. The metallic objects that did not mainly consist of lead (chapter VIII) were
sampled using a miniature-drill setup developed to this purpose (§ V.1.3).
V.1.2 – Sample homogenization: microdismembrator
In order to convert the archaeological samples that were delivered as larger pieces (e.g.,
soil, bone tissue) into a homogeneous powder, a microdismembrator (Mikro-
Dismembrator II, Braun, Germany) was used. The so-called ‘brittle fracture technique’
[Iyengar, 1976] is mainly used in studies involving biological materials in order to pulverize
frozen tissues [Peters et al., 1986] or plant materials [Verstraete et al., 1998]. To this purpose, an
amount of sample is put in a recipient manufactured from polytetrafluoroethylene (PTFE)
together with a ball, also made from PTFE. Cooling down this assembly to the
temperature of liquid nitrogen (~ –200 °C) and sonicating it for about 1 minute at a high
frequency in the microdismembrator unit results in pulverization of the frozen sample by
the impact of the ball onto the frozen sample. The homogeneous sample powder obtained
in this way was subsequently collected and dried in a drying stove at 105 °C. The PTFE
recipients were cleaned by boiling in aqua regia for 6 hours, followed by boiling in milli-Q
water for another 6 hours and subsequent drying in a drying stove at 105 °C.
The microdismembrator approach was successfully used in this work for the
homogenization of soil samples and bone tissues, but was not capable of pulverizing
dental tissues. Hence, the dentine and enamel were dissolved as such.

CHAPTER V – Sample pretreatment and digestion procedures
97
V.1.3 – Sampling of metallic artefacts: miniature-drill setup
In order to sample metallic artefacts that were not delivered as powders, a miniature drill,
manufactured from tungstencarbide (Drill Service, UK) was used, in analogy with an
approach followed by Ponting and Segal [Ponting and Segal, 1998]. The experimental setup
that was developed, in which both drill and sample can move in all directions relative to
each other, is shown in figure V.1. The metallic object (e.g., a coin) is fixed between two
Teflon holders and the drill is mounted in horizontal position, perpendicular to the object.
By the use of a drill with a narrow diameter (e.g., 0.5 mm), it is possible to sample coins
from the side instead of from the coin’s face, which is important in order not to cause
visible damage to the coin’s face. The drilling process results in a finely dispersed powder,
that is collected by gravity by means of a funnel inserted into a polyethylene (PE) tube.
The powder originating from the surface of the sampled coin or object was discarded, to
assure the subsequent sampling of an area free of contamination and corrosion products.
Several places from the side of the coin or the object were sampled in this way to obtain
a homogeneous subsample that is as representative as possible of the object in its
Figure V.1 – Miniature-drill setup for the sampling of metallic artefacts
Teflon holders
micro drill
metal object
funnel
& tube

CHAPTER V – Sample pretreatment and digestion procedures
98
totality. The powder collected was rinsed with ethanol to remove potential contamination
that occurred during the sampling process and was subsequently dried in a drying stove
at 105 °C. After the sampling of every coin or object, the drill was rinsed with 0.1 M HCl
solution and dried in a drying stove at 105 °C to avoid cross-contamination between
subsequent samples.
V.2 – Sample digestion approaches The standard sample introduction system for an ICP – mass spectrometer is the
combination of a pneumatic nebulizer (PN) and a spray chamber (chapter II, § II.2). This
implies that the elemental analysis of nearly all matrices, including biological, geological,
environmental and metallurgical materials, requires the dissolution of the sample prior to
ICP-MS analysis. Dissolution of a heterogeneous sample provides a homogeneous
solution. By powdering solid samples prior to analysis (§ V.1), homogeneity is already
improved in the solid phase. The most common dissolution technique is the use of an
open beaker with acid(s) heated on a hotplate. Another approach is the use of a
microwave-assisted acid digestion procedure [Kingston and Walter, 1998].
V.2.1 – Hotplate digestion
In hotplate digestion, an amount of sample is weighed into a beaker, a suited
combination of concentrated acids is added and the beaker is placed on a hotplate.
Heating of the mixture results in dissolution of the solid sample. Despite their frequent
use, hotplate dissolution procedures are limited by several factors: (i) long dissolution
times, depending on the sample under investigation, (ii) the potential loss of volatile
elements, (iii) contamination of the sample by excessive amounts of reagents and
(iv) airborne contaminants [Kingston and Walter, 1998]. Depending on the target element and
the matrix and when care is taken during laboratory practice however, a classical hotplate
digestion can successfully be applied and give rise to excellent results.
In this work, sample dissolution was often accomplished by means of a final hotplate
digestion step. The beakers used were manufactured from PTFE. In order to prevent
contamination arising from airborne contaminants during digestion, the beakers were
covered with a watch glass, also manufactured from PTFE. After use, the recipients and
watch glasses were cleaned by boiling in aqua regia for 6 hours, followed by boiling in
milli-Q water for another 6 hours and subsequent drying in a drying stove at 105 °C.

CHAPTER V – Sample pretreatment and digestion procedures
99
V.2.2 – Microwave-assisted acid digestion V.2.2.1 – Absorption of microwave energy and heating
In microwave-assisted acid digestion procedures, microwave energy is applied to mineral
acids, which are directly heated by coupling of the reagents with the electromagnetic
field. Molecules have the ability to convert microwave energy into heat in an amount that
is proportional to their dielectric constant ε, a measure for the molecule’s ability to be
polarized in an electric field. Since the dielectric constant is a function of the microwave
frequency, the ability of a solvent to absorb microwave energy is a function of the
frequency and the temperature. Solvents such as water, mineral acids and some organic
solvents have dipole moments that can interact with an applied electric field. Dielectric
polarization depends on the rapid alignment of polar molecules in solution and their
relaxation and reorientation in a random pattern. This motion causes friction and converts
the electromagnetic microwave energy into heat. The free ions in solutions such as
ionized acids are attracted and repulsed by the electromagnetic field, which oscillates and
reverses approximately 5 billion times per second [Kingston and Walter, 1998].
V.2.2.2 – Operating principle
In this work, a Milestone microwave labstation MLS-1200 mega, equipped with MDRTM
technology (microwave destruction rotor), was used. A schematical representation of the
microwave unit is given in figure V.2. The magnetron produces microwaves that are
radiated from its antenna into the waveguide. The waveguide is a microwave-reflective
metal that directs the waves into the microwave cavity. As the microwaves enter the
cavity, they are reflected by the mode stirrer to assist in homogenizing the microwave
field inside the cavity. Despite the designs of the mode stirrer, a nonuniform standing
pattern is established inside the cavity. To improve the homogeneity of the microwave
field, the samples are rotated through the variable field [Kingston and Walter, 1998].
A representation of the vessel containing the sample, incorporated into a sarcophagus as
it will be mounted onto the rotor inside the microwave unit, is given in figure V.3. From
the onset of the experiment, the microwave energy heats the acid and the vessel in
contact with the acid. The acid is below its atmospheric boiling point, its vapor phase is
minimal, and no appreciable amount of vapor heats the vessel walls. When the
temperature exceeds the atmospheric boiling point of the acid, a large quantity of gas
phase acid is produced in the vessel. The gaseous acid cannot efficiently absorb

CHAPTER V – Sample pretreatment and digestion procedures
100
Figure V.2 – Schematical representation of a microwave unit for sample digestion
microwave energy, and upon contact with the cool vessel walls it condenses, releasing
energy to the vessel walls. Depending on the heat capacity of the vessel, heat is released
to the air inside the microwave cavity. During this stage of the digestion, the liquid acid is
heated and its vapors heat the vessel walls. The final stage of heating, so-called
‘sustained dynamic thermal non-equilibrium’, maintains reaction temperature during the
digestion. At this point, the microwave energy absorbed by the acid(s) is balanced by the
energy released by the vessel. The evaporation and condensation of acid continues, but
because of the heat loss from the vessel, the temperature at the top of the vessel can
never reach that attained by the liquid reagents and sample. Experiments with PFA Teflon
vessels have shown temperatures that are 100 °C lower at the top of the vessel than in
the liquid phase. This tremendous temperature difference prevents the establishment of a
normal thermodynamic equilibrium between the gas phase and the liquid. Owing to this
heat loss, the microwave-assisted acid digestion system usually achieves a pressure much
lower than otherwise attainable while maintaining a relatively high temperature for the
acid solution. This behavior results in an efficient acid dissolution reaction. The energy is
imported to the vessel through the acid reagents, exactly the opposite to traditional
heating by convection or conduction [Kingston and Walter, 1998].
temperature and pressure sensors wave guide magnetron antenna
magnetron
isolated
electronics
room air incavity
exhaust
chemically resistant coating

CHAPTER V – Sample pretreatment and digestion procedures
101
The microwave vessels used are made from tetrafluoromethaxil (TFM), a plastic that is
transparent to microwave energy. These vessels incorporate pressure relief devices that
vent excess pressure in a controllable manner through a resealable cap (figure V.3.a).
When the internal pressure exceeds the applied external force, the resealable cap
temporarily opens to expel the excess pressure and then reseals to retain the sample
components (figure V.3.b). In this way, vessel over-pressurization is handled safely, and
the occurrence of venting can be established by the user after the experiment is finished
since the cap is not as tightly sealed as it was before the occurrence of venting.
Figure V.3 – (a) sealing of the vessel into a resistant sarcophagus; (b) pressure relief in the case of overpressure
V.2.2.3 – Performance
Closed vessel acid digestion has several unique attributes that may be exploited to
improve the sample preparation process: (i) the higher temperature of the acid solution
results in a kinetic advantage that is not duplicated at lower temperatures. Several acids
exhibit improved oxidation potentials at elevated temperatures and therefore become
more capable reagents. Furthermore, (ii) the risk of sample contamination during the
digestion is decreased compared to a digestion on a hotplate since the digestion process
takes place in a closed vessel and (iii) analytes that are transformed into volatile
compounds during the digestion process are not lost, at least when no vessel over-
pressurization has taken place.
V.3 – Acid chemistry Acids are classified according to their major role in the digestion reaction: oxidizing or
non-oxidizing. Examples of non-oxidizing acids are hydrochloric acid (HCl) and
cap
sarcophagus
solid sample
+ acids
vessel
ceramic coating
pressure relief
device
(a) (b)

CHAPTER V – Sample pretreatment and digestion procedures
102
hydrofluoric acid (HF); examples of oxidizing acids are nitric acid (HNO3), concentrated
sulfuric acid (H2SO4) and hydrogen peroxide (H2O2) [Kingston and Walter, 1998].
V.3.1 – Nitric acid
Nitric acid (HNO3) is an oxidizing acid that will dissolve most metals to form the soluble
metal nitrates. It has poor oxidizing strength at concentrations below 2 M, but is a
powerful oxidizing agent in the concentrated form (14 M). Its oxidizing strength can be
enhanced by the addition of, e.g., chloride [Sulcek and Povondra, 1989] or by increasing the
reaction temperature and pressure. Most metals and alloys are oxidized by nitric acid, but
there are two exceptions: (i) gold and platinum are not oxidized, and (ii) some metals
(e.g., Al, Cr, Zr, Hf) form insoluble oxides when attacked by concentrated nitric acid [Marr,
1979]. These metals can be dissolved by the use of a combination of acids or by dilute
nitric acid. Further, nitric acid is the most common acid for the oxidation of organic
matrices. Its oxidation potential is directly proportional to temperature. When used in
combination with a complexing acid, nitric acid is more powerful [Kingston and Walter, 1998].
For this work, pro analysi concentrated nitric acid (14 M) was purchased from Panreac,
Spain and further purified by a subboiling distillation in quartz equipment.
V.3.2 – Hydrochloric acid
Hydrochloric acid (HCl) is a non-oxidizing acid that exhibits weak reducing properties
during dissolution [Kingston and Walter, 1998]. Many metal carbonates, peroxides and alkali
hydroxides are readily dissolved by hydrochloric acid, but dissolution is accelerated by the
addition of another acid.
While hydrochloric acid reacts with most metals, it is frequently combined with a second
acid. Aqua regia, a 3:1 mixture of hydrochloric and nitric acid, reacts to form the more
reactive components nitrosylchloride and chlorine by the following reaction:
3 HCl HNO NOCl Cl 2 HO
The formation of these strong oxidizing agents enables aqua regia to dissolve several
additional metals, including the noble metals not dissolved by hydrochloric acid and nitric
acid individually.
For this work, pro analysi concentrated hydrochloric acid (12 M) was purchased from
Panreac, Spain and further purified by a subboiling distillation in quartz equipment.

CHAPTER V – Sample pretreatment and digestion procedures
103
V.3.3 – Hydrofluoric acid
Hydrofluoric acid (HF) is a non-oxidizing acid, the reactivity of which is based on its strong
complexing nature [Kingston and Walter, 1998]. It is most commonly used in inorganic analysis
because it is one of the few acids that can dissolve silicates. The following reaction takes
place:
SiO 6 HF HSiF 2 HO
Dissolution by hydrofluoric acid produces primarily soluble fluorides, except for the
insoluble or sparingly soluble fluorides of the alkaline earths, lanthanides and actinides. To
improve dissolution, hydrofluoric acid is routinely combined with another acid, such as
nitric acid.
Following dissolution, many analyses require the removal of all hydrofluoric acid, to
prevent damage to the equipment or to resolubilize insoluble fluorides. The fluorosilicic
acid can be dissociated by heating the solution down to fumes in an open system (beaker
on a hotplate) with another acid, e.g., nitric acid:
HSiF SiF 2 HF
Another approach for the removal of hydrofluoric acid after digestion is to complex the
fluoride anion with boric acid (H3BO3) [Sulcek and Povondra, 1989]. The reaction of boric acid
with hydrofluoric acid is a two-step process:
HBO 3HF HBFOH 2HO
HBFOH HF HBF HO
For this work, the concentrated hydrofluoric acid (22 M, instra-analyzed) used, was
purchased from JT Baker Chemicals, The Netherlands.
V.3.4 – Sulfuric acid
Dilute sulfuric acid does not exhibit any oxidizing properties, but the concentrated acid is
capable of oxidizing many substances [Marr, 1979]. Concentrated sulfuric acid (H2SO4) has a
boiling point of 338 °C, which is higher than the working ranges of all the Teflon materials
commonly used in the construction of microwave vessels. Therefore, the reaction
temperature must be monitored carefully to prevent damage to the microwave vessels.
Sulfuric acid is commonly used with other reagents, such as perchloric acid or hydrogen
peroxide. Sulfuric acid will act as a dehydrating agent that will dramatically increase the
CHAPTER V – Sample pretreatment and digestion procedures
104
oxidizing power of the perchloric acid, but this mixture may react violently with organic
matrices in closed vessels or if heated rapidly [Kingston and Walter, 1998].
For this work, pro analysi concentrated sulfuric acid (18 M) was purchased from Panreac,
Spain and further purified by a subboiling distillation in quartz equipment.
V.3.5 – Hydrogen peroxide
Hydrogen peroxide (H2O2) can react explosively with many organics, especially in the
more concentrated form. This acid is usually combined with another acid because its
oxidizing power increases at higher acidity. Further, hydrogen peroxide is often added to
the digestion solution to complete the digestion without the potential safety hazards of
reacting a strong oxidizing reagent with an easily oxidizable material [Kingston and Walter,
1998].
For this work, the pro analysi concentrated hydrogen peroxide (10 M) used, was
purchased from Merck, Germany.
V.3.6 – Perchloric acid
The oxidizing power of perchloric acid (HClO4) is proportional to its concentration and
temperature [Kingston and Walter, 1998]. Dilute aqueous perchloric acid is not an oxidizing
acid, either cold or warm. Concentrated perchloric acid is not an oxidizing acid when cold,
but becomes a powerful oxidizer when it is warm. Warm perchloric acid will readily
decompose organic matter, sometimes violently. Because of its rapid, sometimes
explosive, reaction with organic matrices, perchloric acid is generally mixed with nitric
acid. Perchloric acid decomposes at 245 °C in a closed microwave vessel system,
developing dangerous amounts of gaseous by-products and tremendous excess pressure
[Kingston and Jassie, 1988]. It is recommended that in the case where perchloric acid is used
for digestion, a two-step digestion is followed. In a first step, only acids other than
perchloric acid are used in order to digest the sample as completely as possible. When the
digestion vessels are cooled down, perchloric acid can be added and the vessels are
heated another time. In this way, only the toughest part of the sample to dissolve will
remain for the perchloric acid to decompose.
For this work, the concentrated perchloric acid (10 M, instra-analyzed) used, was
purchased from JT Baker Chemicals, The Netherlands.
In the following text, the concentration of every acid mentioned is always that as given
for the specific acid in the paragraph above, unless stated otherwise.

CHAPTER V – Sample pretreatment and digestion procedures
105
V.4 – Development and validation of digestion procedures The general context of this work is isotopic analysis of Sr and Pb in archaeological
artefacts. Two projects focus on Pb isotope ratio analysis. The ed-Dur – project
(chapter VIII) focuses on metallic artefacts rich in copper, silver and/or lead, while in the
Roman-bone – project (chapter IX), bone tissue, soil samples, ceramics and lead objects
are the subject of investigation. The Servatius – project (chapter X) aims at comparative
Sr isotopic analysis of human dental tissues (enamel and dentine). The procedures
developed in this work for the digestion of the various sample types with a different
matrix composition (chapter IV, § IV.4) aimed at (i) a total dissolution of the solid sample
and (ii) a quantitative target element (Sr and/or Pb) recovery. In this way, isotopic
fractionation during the digestion step can be ruled out.
The digestion procedures for the different matrices under investigation were optimized
and validated by applying the proposed digestion protocol to a certified or standard
reference material (CRM or SRM) with a similar matrix composition. The reference
materials used in this work are available from the Community Bureau of Reference (BCR,
Brussels, Belgium) and the National Bureau of Standards (NBS) which was renamed as
National Institute of Standards and Technology (NIST) in 1988 (Gaithersburg, MD, USA).
The following certified reference materials were used:
• NIST SRM 1400 Bone Ash and NIST SRM 1486 Bone Meal for validating digestion
procedures for both bone and dental tissues
• BCR CRM 141 Calcareous Loam Soil and BCR CRM 142 Light Sandy Soil for
validating digestion procedures for soil samples
• NBS SRM 500 Unalloyed Copper VII, NBS SRM 872 Phosphor Bronze and NBS
SRM 875 Cupro-Nickel 10 % ‘doped’ for validating digestion procedures for
metallic objects with various copper-silver-lead contents.
After digesting an amount of the certified reference materials according to the digestion
protocol developed, lead elemental assay (chapter II, § II.9) was performed using the
PerkinElmer SCIEX Elan 5000 quadrupole-based ICP – mass spectrometer (chapter II,
§ II.8). By comparing the experimentally obtained values to the corresponding certified
values, the average recovery was calculated. Strontium, calcium and phosphorus
recoveries for dental tissue digestions were determined by means of the PerkinElmer
SCIEX Elan DRCplus quadrupole-based ICP – mass spectrometer (chapter II, § II.8 and
§ II.9) using a reaction gas in the dynamic reaction cell (chapter VII, § VII.2).
CHAPTER V – Sample pretreatment and digestion procedures
106
V.4.1 – Soil digestion procedure Several microwave-assisted soil digestion procedures described in literature were tested
for their ability to totally dissolve soil samples. A combination of 3 mL HNO3 + 2 mL HCl in
a 23 min microwave program [Prohaska et al., 1999] and a combination of 2 mL HNO3 +
6 mL HCl in a 14 min microwave program [Bettinelli et al., 2000-a] did not result in a complete
dissolution. Because of the high silicate content of soils (chapter IV, § IV.4.1),
hydrofluoric acid is required for complete dissolution (§ V.3.3). Hence, in a next attempt,
several HF-based procedures were tested. Although it was observed that the addition of
HF resulted in dissolution of a larger soil fraction, 3 mL HNO3 + 2 mL HCl + 1 mL HF in a
36 min microwave program [Prohaska et al., 1999] or a 70 min microwave program [Engström
et al., 2004], 2 mL HNO3 + 6 mL HCl + 2 mL HF in a 25 min microwave program [Bettinelli et
al., 2000-a; Bettinelli et al., 2000-b] and 5 mL HNO3 + 3 mL HF + 1 mL H2O in a 40 min
microwave program [Falciani et al., 2000] resulted in Pb recoveries for BCR CRM 141
Calcareous Loam Soil and BCR CRM 142 Light Sandy Soil between 40 and 85 % only. In
order to increase the power of the digestion process, HClO4 was added. Ettler et al. used
10 mL HF + 0.5 mL HClO4, followed by 5 mL HF + 0.5 mL HClO4 after evaporation to
dryness [Ettler et al., 2004]. However, it was preferred not to add HClO4 in the first step
(§ V.3.6), so that an approach analogous to that described by Riondato et al. [Riondato et
al., 2001] was followed. The digestion procedure is summarized in table V.1.a and
consisted of adding a concentrated acid mixture of 5 mL HNO3 + 2 mL HCl + 2 mL HF to
0.2 g soil and submitting it to a 43 min microwave program. After this first microwave
step, the vessels are cooled down, followed by addition of 1 mL HClO4 and again
submitted to a 43 min microwave program. Since the dissolution was not complete after
the microwave treatment, the digest was transferred to a beaker containing a mixture of
2 mL HNO3 + 2 mL HF + 2 mL HClO4, followed by further digestion and evaporation to
nearly dry on a hotplate. In this step, the remaining HF was removed as well (§ V.3.3).
After this second step, complete dissolution of the soil sample was obtained. In the third
step, the residue was taken up in concentrated HNO3 and diluted to 1 M HNO3 with milli-Q
water.
Application of the described digestion procedure to the soil certified reference materials
resulted in a Pb recovery of 94.9 ± 5.5 % for BCR CRM 141 Calcareous Loam Soil and
98.9 ± 6.3 % for BCR CRM 142 Light Sandy Soil, demonstrating that the digestion
protocol results in a quantitative Pb recovery. A summary of the experimental Pb
concentrations retrieved for the soil certified reference materials is given in table IV.1.b.

CHAPTER V – Sample pretreatment and digestion procedures
107
Table V.1 – Digestion of soil samples – (a) digestion procedure; (b) experimental Pb recoveries for 7 separate digestions. Uncertainties represent 2s uncertainty intervals.
(a) soil digestion procedure (± 0.2 g)
I. microwave-assisted acid digestion
acid combination microwave programme
5 mL HNO3 + 2 mL HCl + 2 mL HF 20 min 250 W, 8 min 600 W, 15 min 250 W
Cool down, + 1 mL HClO4 20 min 250 W, 8 min 400 W, 15 min 250 W
II. transfer of digest to beaker, + 2 mL HNO3 + 2 mL HF + 2 mL HClO4, further digestion and evaporation on hotplate
III. uptake of residue in 1 mL HNO3 under ultrasonic agitation, and subsequent dilution to 1 M HNO3 with milli-Q water
(b) experimental recoveries
[Pb]exp (µg g-1)
[Pb]cert (µg g-1)
recovery (%)
BCR CRM 141 Calcareous Loam Soil 27.9 ± 1.6 29.4 ± 2.6 94.9 ± 5.5
BCR CRM 142 Light Sandy Soil 37.4 ± 2.4 37.8 ± 1.9 98.9 ± 6.3
V.4.2 – Bone digestion procedure
Most bone digestion procedures reported on in literature make use of a hotplate digestion
[Outridge et al., 1996; May et al., 1999] or Teflon bombs [Latkoczy et al., 1998; Latkoczy et al., 2001]. A
microwave-assisted acid digestion procedure was developed in this work, based on that
described for bone digestion by Hinners et al. [Hinners et al., 1998]. A complete dissolution of
bone could be achieved by adding 6 mL HNO3 + 1.5 mL HCl to 0.2 g of pulverized bone
and applying a 15 min microwave step (table V.2.a), followed by transfer to a beaker and
evaporation to nearly dry on a hotplate. The residue was taken up in concentrated nitric
acid and diluted to 1 M HNO3 with milli-Q water. The certified reference materials NIST
SRM 1400 Bone Ash and NIST SRM 1486 Bone Meal were used for validation of the
digestion protocol. The experimental Pb recoveries turned out to be quantitative:
98.4 ± 3.6 % and 99.7 ± 7.2 %, respectively (table V.2.b).
V.4.3 – Enamel and dentine digestion procedure
In view of the similar elemental composition of bone tissue and dental tissues (chapter IV,
§ IV.4.2), it was expected that the digestion procedure for bone could also be used to
digest enamel and dentine. However, this method succeeds in dissolving one of the two

CHAPTER V – Sample pretreatment and digestion procedures
108
Table V.2 – Digestion of bone tissue – (a) digestion procedure; (b) experimental Pb recoveries for 7 separate digestions. Uncertainties represent 2s uncertainty intervals.
(a) bone digestion procedure (± 0.2 g)
I. microwave-assisted acid digestion
acid combination microwave programme
6 mL HNO3 + 1.5 mL HCl 5 min 250 W, 5 min 400 W, 5 min 250 W
II. transfer of digest to beaker, further digestion and evaporation on hotplate
III. uptake of residue in 1 mL HNO3 under ultrasonic agitation, and subsequent dilution to 1 M HNO3 with milli-Q water
(b) experimental recoveries
[Pb]exp (µg g-1)
[Pb]cert (µg g-1)
recovery (%)
NIST SRM 1400 Bone Ash 8.92 ± 0.33 9.07 ± 0.12 98.4 ± 3.6
NIST SRM 1486 Bone Meal 1.330 ± 0.097 1.335 ± 0.014 99.7 ± 7.2
dental tissues only, namely dentine. The enamel, on the other hand, is not completely
dissolved, what could be attributed to its very dense and compact structure, while dentine
and bone have a more porous structure. Moreover, the enamel (and dentine) could not be
pulverized using the microdismembrator (§ V.1.2), so that larger particles needed to be
dissolved than in the case of bone. For this reason, another approach was searched for. It
turned out that a hotplate digestion, summarized in table V.3.a, results in a complete
dissolution. In a first step, 4 mL HNO3 is added to 0.2 g dentine or enamel in a beaker
and heated until nearly dry, followed by the addition of 2.5 mL HCl and again evaporation
to nearly dry in a second step. The residue is finally taken up in concentrated nitric acid
and diluted with milli-Q water. Also this approach was validated using the bone certified
reference materials NIST SRM 1400 Bone Ash and NIST SRM 1486 Bone Meal, and
resulted in a quantitative recovery for the target elements P, Ca, Sr and Pb (table V.3.b).
The Pb recovery was determined by elemental assay using the Elan 5000 ICP – mass
spectrometer; for the determination of P, Ca and Sr, the Elan DRCplus ICP – mass
spectrometer was used.
V.4.4 – Ceramics digestion procedure
Because of the silicate matrix of ceramics (chapter IV, § IV.4.3), hydrofluoric acid is
needed in order to obtain a complete dissolution. Mixtures of HF, HNO3 and HCl have
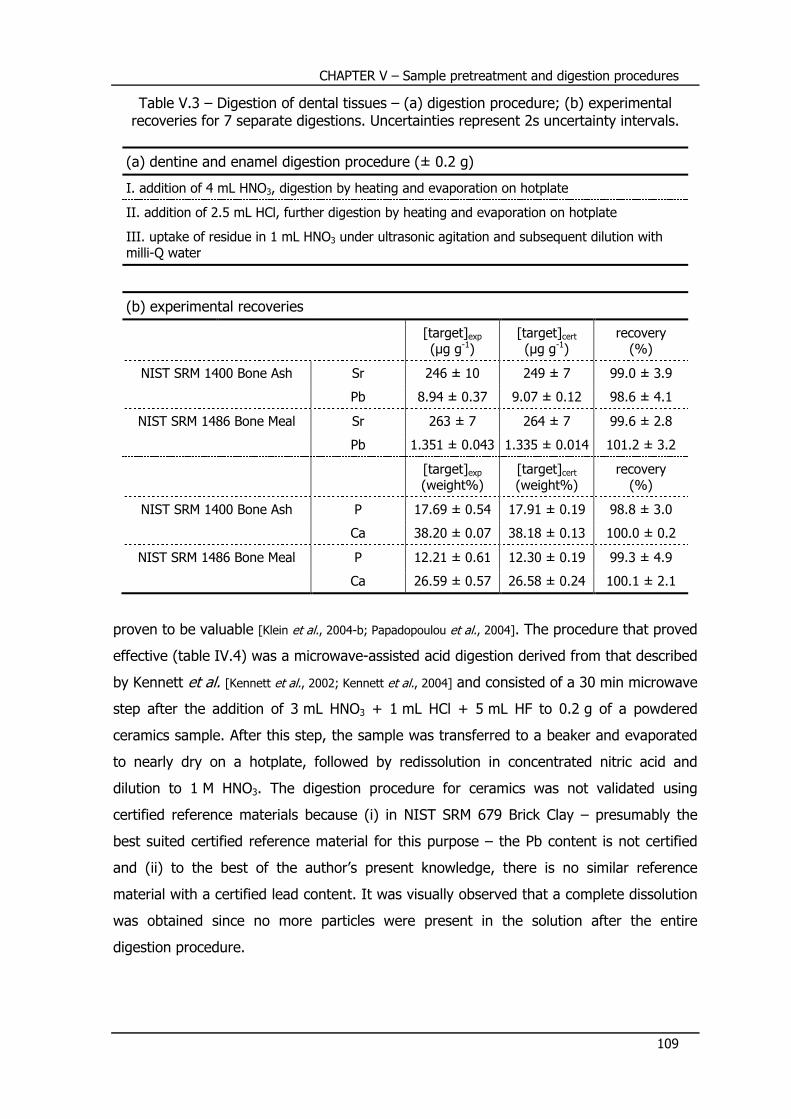
CHAPTER V – Sample pretreatment and digestion procedures
109
Table V.3 – Digestion of dental tissues – (a) digestion procedure; (b) experimental recoveries for 7 separate digestions. Uncertainties represent 2s uncertainty intervals.
(a) dentine and enamel digestion procedure (± 0.2 g)
I. addition of 4 mL HNO3, digestion by heating and evaporation on hotplate
II. addition of 2.5 mL HCl, further digestion by heating and evaporation on hotplate
III. uptake of residue in 1 mL HNO3 under ultrasonic agitation and subsequent dilution with milli-Q water
(b) experimental recoveries
[target]exp (µg g-1)
[target]cert (µg g-1)
recovery (%)
NIST SRM 1400 Bone Ash Sr 246 ± 10 249 ± 7 99.0 ± 3.9
Pb 8.94 ± 0.37 9.07 ± 0.12 98.6 ± 4.1
NIST SRM 1486 Bone Meal Sr 263 ± 7 264 ± 7 99.6 ± 2.8
Pb 1.351 ± 0.043 1.335 ± 0.014 101.2 ± 3.2
[target]exp (weight%)
[target]cert (weight%)
recovery (%)
NIST SRM 1400 Bone Ash P 17.69 ± 0.54 17.91 ± 0.19 98.8 ± 3.0
Ca 38.20 ± 0.07 38.18 ± 0.13 100.0 ± 0.2
NIST SRM 1486 Bone Meal P 12.21 ± 0.61 12.30 ± 0.19 99.3 ± 4.9
Ca 26.59 ± 0.57 26.58 ± 0.24 100.1 ± 2.1
proven to be valuable [Klein et al., 2004-b; Papadopoulou et al., 2004]. The procedure that proved
effective (table IV.4) was a microwave-assisted acid digestion derived from that described
by Kennett et al. [Kennett et al., 2002; Kennett et al., 2004] and consisted of a 30 min microwave
step after the addition of 3 mL HNO3 + 1 mL HCl + 5 mL HF to 0.2 g of a powdered
ceramics sample. After this step, the sample was transferred to a beaker and evaporated
to nearly dry on a hotplate, followed by redissolution in concentrated nitric acid and
dilution to 1 M HNO3. The digestion procedure for ceramics was not validated using
certified reference materials because (i) in NIST SRM 679 Brick Clay – presumably the
best suited certified reference material for this purpose – the Pb content is not certified
and (ii) to the best of the author’s present knowledge, there is no similar reference
material with a certified lead content. It was visually observed that a complete dissolution
was obtained since no more particles were present in the solution after the entire
digestion procedure.
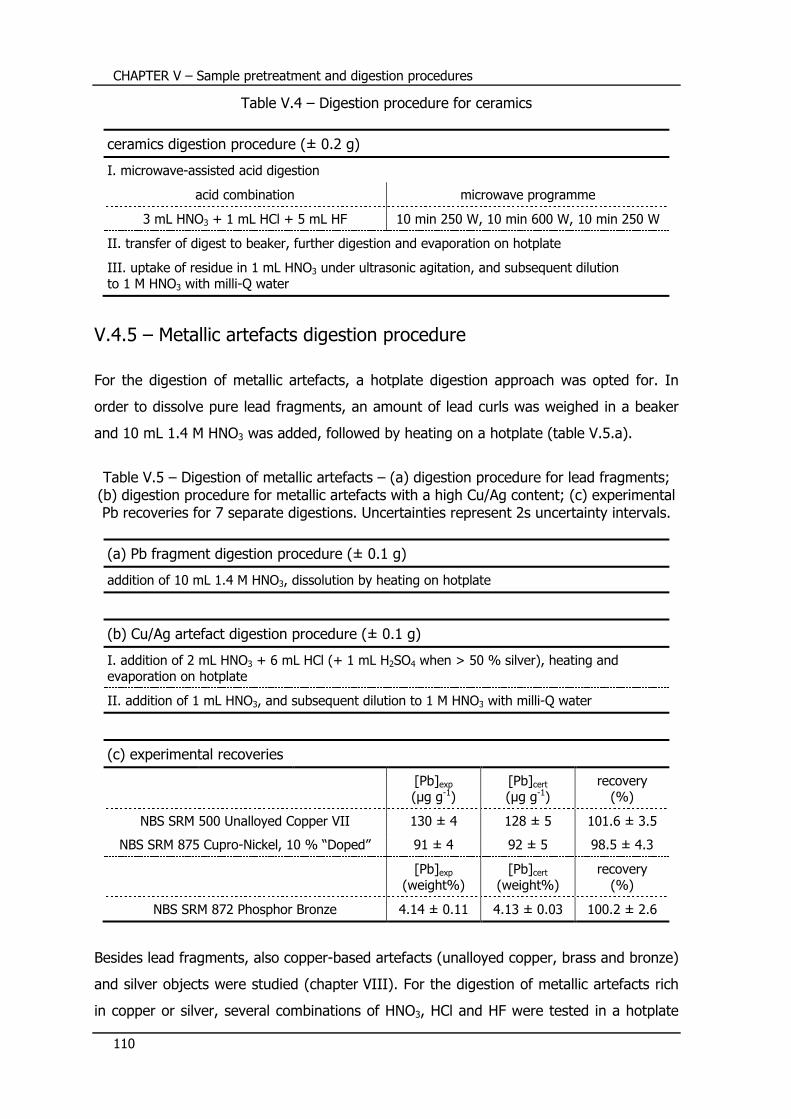
CHAPTER V – Sample pretreatment and digestion procedures
110
Table V.4 – Digestion procedure for ceramics
ceramics digestion procedure (± 0.2 g)
I. microwave-assisted acid digestion
acid combination microwave programme
3 mL HNO3 + 1 mL HCl + 5 mL HF 10 min 250 W, 10 min 600 W, 10 min 250 W
II. transfer of digest to beaker, further digestion and evaporation on hotplate
III. uptake of residue in 1 mL HNO3 under ultrasonic agitation, and subsequent dilution to 1 M HNO3 with milli-Q water
V.4.5 – Metallic artefacts digestion procedure
For the digestion of metallic artefacts, a hotplate digestion approach was opted for. In
order to dissolve pure lead fragments, an amount of lead curls was weighed in a beaker
and 10 mL 1.4 M HNO3 was added, followed by heating on a hotplate (table V.5.a).
Table V.5 – Digestion of metallic artefacts – (a) digestion procedure for lead fragments;
(b) digestion procedure for metallic artefacts with a high Cu/Ag content; (c) experimental Pb recoveries for 7 separate digestions. Uncertainties represent 2s uncertainty intervals.
(a) Pb fragment digestion procedure (± 0.1 g)
addition of 10 mL 1.4 M HNO3, dissolution by heating on hotplate
(b) Cu/Ag artefact digestion procedure (± 0.1 g)
I. addition of 2 mL HNO3 + 6 mL HCl (+ 1 mL H2SO4 when > 50 % silver), heating and evaporation on hotplate
II. addition of 1 mL HNO3, and subsequent dilution to 1 M HNO3 with milli-Q water
(c) experimental recoveries
[Pb]exp (µg g-1)
[Pb]cert (µg g-1)
recovery (%)
NBS SRM 500 Unalloyed Copper VII 130 ± 4 128 ± 5 101.6 ± 3.5
NBS SRM 875 Cupro-Nickel, 10 % “Doped” 91 ± 4 92 ± 5 98.5 ± 4.3
[Pb]exp
(weight%) [Pb]cert
(weight%) recovery
(%)
NBS SRM 872 Phosphor Bronze 4.14 ± 0.11 4.13 ± 0.03 100.2 ± 2.6
Besides lead fragments, also copper-based artefacts (unalloyed copper, brass and bronze)
and silver objects were studied (chapter VIII). For the digestion of metallic artefacts rich
in copper or silver, several combinations of HNO3, HCl and HF were tested in a hotplate

CHAPTER V – Sample pretreatment and digestion procedures
111
digestion approach [Ekstroem and Gustavsson, 1993; Young et al., 1997; Ponting and Segal, 1998; Klein
et al., 2004-b]. The use of 8 mL aqua regia (3:1 HCl/HNO3, § V.3.2) succeeded in dissolving
metals with a high copper content, but the samples with a high silver content (> 50 %)
posed a problem to dissolve. With the addition of 1 mL of sulfuric acid however, complete
dissolution was obtained (table V.5.b). For the certified reference materials NBS SRM 500
Unalloyed Copper VII, NBS SRM 872 Phosphor Bronze and NBS SRM 875 Cupro-Nickel
‘doped’, experimental Pb recoveries of 101.6 ± 3.5 %, 100.2 ± 2.6 % and 98.5 ± 4.3 %
were retrieved, respectively (table V.5.c).
V.5 – Certification of Pb in bone candidate reference materials In 2006, the New York State Department of Health conducted an interlaboratory study for
the characterization of bone candidate reference materials from lead-dosed sources. Four
samples, NYS RMs 01-04, were delivered. Two bone samples were of bovine (cow) origin,
whilst two others were of caprine (goat) origin. In a first step of the characterization, the
lead content was studied, and our laboratory participated in this study.
On two different days, triplicate digestion of the four samples along with triplicate
digestion of NIST SRM 1400 Bone Ash and NIST SRM 1486 Bone Meal for validation
purposes, were carried out. The bone samples were digested following the microwave-
assisted acid digestion protocol described above (§ V.4.2). After digestion, elemental
assay of the two sample batches obtained at the two different days was carried out, also
on two different days. On the one day, the PerkinElmer SCIEX Elan 5000 was used, and
on the other day the PerkinElmer SCIEX Elan DRCplus was used in vented mode.
Standard addition was used as calibration technique (chapter II, § II.9.2.2). The Pb
concentrations obtained for the four candidate reference material samples investigated
are summarized in table V.6. After completion of the interlaboratory study, a consensus
value, based on the Pb concentrations reported by all the participating labs, was
established for every sample. These are summarized in table V.6. In figures V.4.a-d, the
results obtained by all the participating labs are graphically displayed [Bellis et al., 2008].
From figure V.4, it can be seen that the Pb concentrations found by our lab (lab 443)
match within experimental uncertainty with the corresponding consensus value based on
the results obtained by all the labs. However, a value that is systematically higher than
the consensus value was obtained for samples NYS RM 02 to NYS RM 04. Nevertheless,
our results are in perfect agreement with the results obtained by lab 429 that used
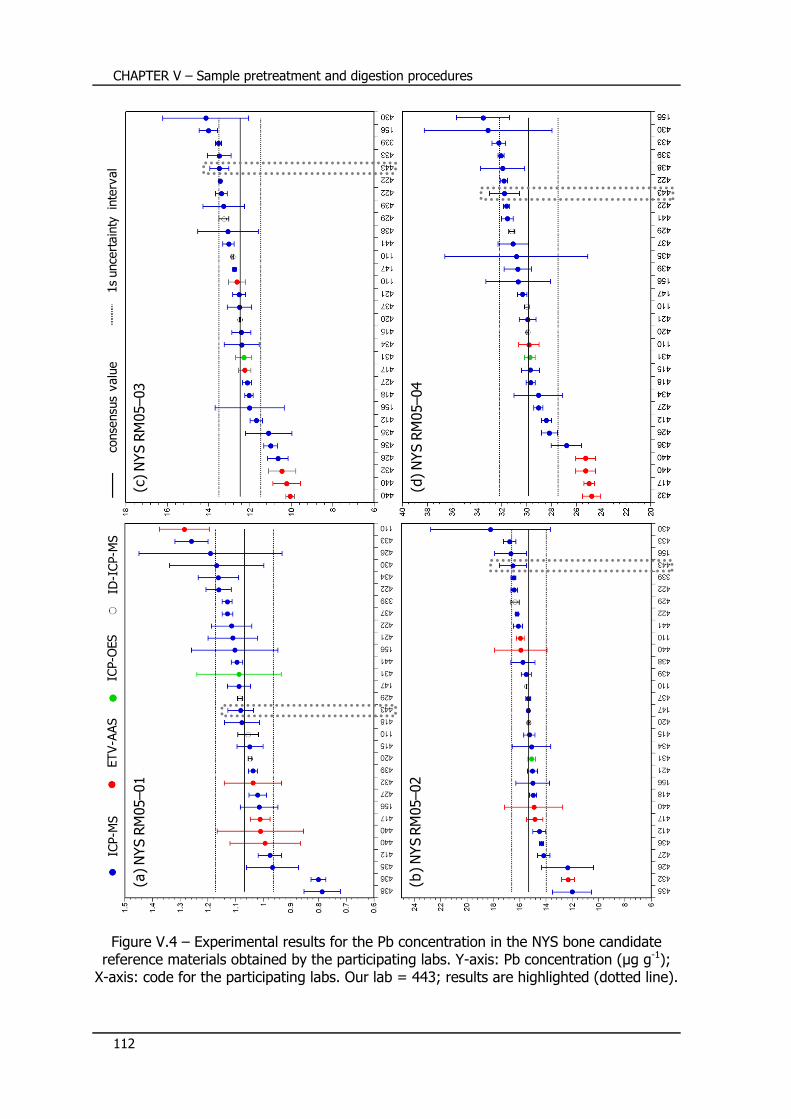
CHAPTER V – Sample pretreatment and digestion procedures
112
Figure V.4 – Experimental results for the Pb concentration in the NYS bone candidate
reference materials obtained by the participating labs. Y-axis: Pb concentration (µg g-1); X-axis: code for the participating labs. Our lab = 443; results are highlighted (dotted line).
ICP-M
SETV-A
AS
ICP-O
ES
ID-ICP-M
S1s unce
rtainty
interval
conse
nsu
s value
(a) NYS RM05–01
(c) NYS RM05–03
(b) NYS RM05–02
(d) NYS RM05–04
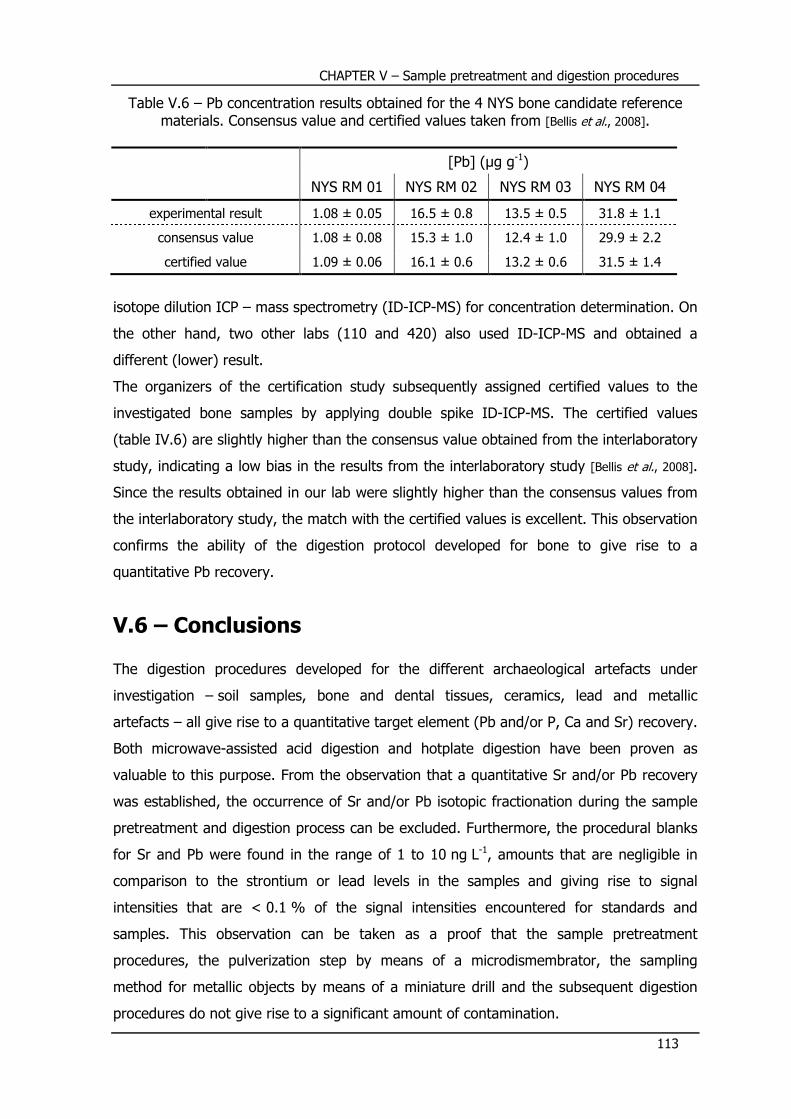
CHAPTER V – Sample pretreatment and digestion procedures
113
Table V.6 – Pb concentration results obtained for the 4 NYS bone candidate reference materials. Consensus value and certified values taken from [Bellis et al., 2008].
[Pb] (µg g-1)
NYS RM 01 NYS RM 02 NYS RM 03 NYS RM 04
experimental result 1.08 ± 0.05 16.5 ± 0.8 13.5 ± 0.5 31.8 ± 1.1
consensus value 1.08 ± 0.08 15.3 ± 1.0 12.4 ± 1.0 29.9 ± 2.2
certified value 1.09 ± 0.06 16.1 ± 0.6 13.2 ± 0.6 31.5 ± 1.4
isotope dilution ICP – mass spectrometry (ID-ICP-MS) for concentration determination. On
the other hand, two other labs (110 and 420) also used ID-ICP-MS and obtained a
different (lower) result.
The organizers of the certification study subsequently assigned certified values to the
investigated bone samples by applying double spike ID-ICP-MS. The certified values
(table IV.6) are slightly higher than the consensus value obtained from the interlaboratory
study, indicating a low bias in the results from the interlaboratory study [Bellis et al., 2008].
Since the results obtained in our lab were slightly higher than the consensus values from
the interlaboratory study, the match with the certified values is excellent. This observation
confirms the ability of the digestion protocol developed for bone to give rise to a
quantitative Pb recovery.
V.6 – Conclusions The digestion procedures developed for the different archaeological artefacts under
investigation – soil samples, bone and dental tissues, ceramics, lead and metallic
artefacts – all give rise to a quantitative target element (Pb and/or P, Ca and Sr) recovery.
Both microwave-assisted acid digestion and hotplate digestion have been proven as
valuable to this purpose. From the observation that a quantitative Sr and/or Pb recovery
was established, the occurrence of Sr and/or Pb isotopic fractionation during the sample
pretreatment and digestion process can be excluded. Furthermore, the procedural blanks
for Sr and Pb were found in the range of 1 to 10 ng L-1, amounts that are negligible in
comparison to the strontium or lead levels in the samples and giving rise to signal
intensities that are < 0.1 % of the signal intensities encountered for standards and
samples. This observation can be taken as a proof that the sample pretreatment
procedures, the pulverization step by means of a microdismembrator, the sampling
method for metallic objects by means of a miniature drill and the subsequent digestion
procedures do not give rise to a significant amount of contamination.


CHAPTER VI
Isolation procedures for
strontium and lead


CHAPTER VI – Isolation procedures for strontium and lead
117
For an accurate and precise determination of the isotopic composition of a target element
in a sample, it is important to avoid, or at least accurately correct for, spectral and non-
spectral interferences, which are factors that might compromise the attainable accuracy
and precision. The best way to cope with such interferences is to separate the target
element from its concomitant matrix in a pure and quantitative way. Via this approach,
the analyte is obtained free from interfering species, and the matrix of the sample can be
carefully matched to that of the standard solutions. In this work, an extraction
chromatographic separation was used, based on a commercially available crown ether-
based resin. Both Sr- and Pb-specific columns were evaluated, and their use was
optimized and validated for their ability to isolate Sr or Pb from the archaeological
samples under investigation, as is described in this chapter.
VI.1 – Pitfalls in obtaining accurate and precise isotope ratio results In what follows, important problems that may be encountered in the acquisition of precise
and accurate isotope ratio data are discussed. These include spectral and non-spectral
interferences or matrix effects (chapter II, § II.2), and the influence of instrumental
settings, memory effects and blank contributions.
VI.1.1 – Spectral interferences
Isotopic measurements aim at resolving very small differences in isotopic composition,
and are therefore particularly vulnerable to spectral interferences. Spectral interferences
are a major concern, particularly below 80 u, both in quadrupole-based single-collector
ICP-MS and multi-collector ICP-MS. The mass resolution of a quadrupole-based ICP –
mass spectrometer is limited to ~ 300, and most MC-ICP-MS instruments are generally
operated at a mass resolution of ~ 400 to produce flat peak sections that are sufficiently
wide for high precision isotope ratio measurements [Rehkämper et al., 2004]. A higher mass
resolution and at the same time preserving flat-topped peak shapes is accomplished when
operating under so-called pseudo-high resolution conditions (chapter III, § III.3.2) [Weyer
and Schwieters, 2003; Vanhaecke and Moens, 2004]. At low-resolution conditions, the mass
spectrometer is unable to resolve interferences between the analyte and other ions with
similar mass-to-charge ratio. Spectral interferences are generated by ions derived from
the plasma, the sample solvent and the sample matrix (chapter II, § II.2). In order to

CHAPTER VI – Isolation procedures for strontium and lead
118
obtain accurate isotope ratio data, the influence of spectrally interfering ions should be
either insignificant, or reduced to tolerable levels so that an accurate correction can be
applied. In most cases, this can be achieved by (i) chemical separation of the analyte
element from the sample matrix and/or (ii) the application of appropriate measurement
protocols.
Isobaric interferences from other elements can be corrected for by monitoring an isotope
of the interfering element and the application of a suitable mathematical interference
correction [Halliday et al., 1995]. Nonetheless, the maximum level of contamination giving
rise to isobaric interferences that can be tolerated for accurate isotope ratio
measurements needs to be evaluated. To avoid the measurement uncertainties that are
associated with such interferences, the majority of the published MC-ICP-MS isotope data
for geological samples have been collected either (i) on ‘clean’ samples that were
processed through a chemical separation step prior to the mass spectrometry, or (ii) by
direct analysis of major elements in a single phase, e.g., Ca in carbonates [Halicz et al.,
1999] and Cu in ore samples [Zhu et al., 2000-a].
Corrections for spectral interferences from polyatomic ions such as hydrides, oxides,
nitrides or argides is less straightforward. In many cases, such interferences can be
avoided by the chemical separation of the analyte prior to the mass spectrometry, e.g., in
the case of metal argides. The production of hydrides and oxides is furthermore greatly
reduced when a desolvating nebulizer (chapter II, § II.2.2) is applied for sample
introduction. The development of methods for the measurement of Fe isotopic
compositions has been particularly difficult by the interferences of different argon-
containing ions (ArN+, ArNH+, ArO+, ArOH+). However, as is demonstrated by published
data [Anbar et al., 2000; Belshaw et al., 2000; Zhu et al., 2000-b], precise data can be nevertheless
obtained for this element when appropriate analytical protocols are followed [Weyer and
Schwieters, 2003].
Interferences from refractory oxides and hydroxides (MO+ and MOH+, where M is a rare
earth element) are often not a severe problem in MC-ICP-MS, since they can be avoided
by chemical separation and because oxide formation can be greatly reduced in many
cases by the use of a desolvating nebulizer.
Collision – and reaction cells [Feldmann et al., 1999-a; Feldmann et al., 1999-b; Tanner et al., 2002;
Koppenaal et al., 2004] (chapter II, § II.6) which are used in quadrupole-based ICP-MS
instruments and in the IsoProbe MC-ICP-MS instrument, have also been proven as
valuable alternatives to reduce polyatomic [Baranov and Tanner, 1999] and isobaric [Moens et
al., 2001] spectral interferences. Furthermore, dynamic bandpass tuning (DBT, chapter II,

CHAPTER VI – Isolation procedures for strontium and lead
119
§ II.6.2.2.5) via the quadrupole assembly in a dynamic reaction cell allows an efficient
control of the sequential chemistry [Latino et al., 2001].
VI.1.2 – Matrix effects
Correction of instrumental mass discrimination by external standardization (chapter III,
§ III.4.2.2.2) requires that the mass discrimination of the analyte element is identical for
both the sample and the standard. Similarly, external normalization (chapter III,
§ III.4.2.2.1) assumes that the relative mass bias encountered by the analyte and the
reference element are indistinguishable for the samples and the isotopic standard
[Rehkämper et al., 2004]. A number of studies conducted with both ICP-Q-(DRC-)MS and MC-
ICP-MS have shown that the instrumental mass discrimination can vary considerably with
the analyte matrix and that the response of two elements of similar mass to a different
matrix may not be sufficiently correlated [Douglas and Tanner, 1998; Horlick and Montaser, 1998;
Galy et al., 2001; Vanhaecke et al., 2003]. This indicates that precise measurements of small
differences in an isotopic composition are particularly prone to the generation of artefacts,
and should preferably be conducted on target elements that have been chemically
isolated from the sample matrix. Unfortunately, no chemical separation is perfect, but a
number of MC-ICP-MS studies demonstrated that remaining matrix constituents do not
have a detrimental effect on data quality, either by influencing the mass bias behavior, or
through the formation of spectral interferences [Halicz et al., 1999; Zhu et al., 2000-a].
The accuracy of stable isotope ratio measurements may furthermore be affected by the
concentration of the analyte or the relative concentrations of the analyte and normalizing
element, as has been demonstrated for Pb with Tl as normalizing element, as well as the
type and strength of the acid matrix of the sample and standard solutions [Rehkämper and
Halliday, 1999; Rehkämper and Mezger, 2000; Kamenov et al., 2004].
VI.1.3 – Other factors
A number of MC-ICP-MS stable isotope studies have noted that instrumental operating
conditions (gas flow rates, focusing lens settings, acceleration lens potentials) must
remain constant during an analytical session because even small changes in these
parameters may result in changes in mass discrimination [Hirata, 1997; Rehkämper and Halliday,
1999]. Memory effects have been reported as a problem for elemental concentration
measurements by ICP-Q-MS, particularly for the analysis of samples with highly variable

CHAPTER VI – Isolation procedures for strontium and lead
120
analyte abundances. In the case of isotope ratio measurements by MC-ICP-MS, memory
problems are often less severe, because most analyses are conducted with ‘clean’
solutions of separated elements, and large variations in the concentrations of the analyte
solutions should be avoided in any case [Rehkämper and Halliday, 1999]. Because samples and
standards typically display only small differences in isotopic composition, the contribution
of the instrumental blank is further decreased. It has been observed that memory effects
are typically more pronounced for desolvating nebulizers compared to other sample
introduction systems. This advantage can be overcome, however, by using appropriate
washout protocols. In the case of severe memory problems (e.g., B, Os), isotopic analysis
requires the use of a designated sample introduction system and/or special cleaning
procedures [Montaser et al., 1998-a].
VI.2 – Analyte separation prior to isotopic analysis VI.2.1 – Interferences on strontium and lead
An overview of the possible mass spectral interferences on Sr and Pb isotopes, potentially
encountered when analyzing these elements by means of ICP – mass spectrometry, is
given in table VI.1.
Since 87Sr is formed by the beta-decay of 87Rb (chapter IV, § IV.1.1), rubidium and
strontium are often co-present, leading to an isobaric interference (87Rb+) on the 87Sr+
signal. The mass resolution of ~ 300 000 that is required to resolve these isobaric ions is
beyond the resolving capacities of all present-day mass spectrometers. Only chemical
resolution in a dynamic reaction cell succeeds in the separation of these isobars
(chapter II, § II.6.2.2.5) [Moens et al., 2001]. This implies that a separation method for Sr
from its guiding matrix should at the same time be successful in separating Rb from Sr.
Next to rubidium, also krypton, that is present as impurities in argon gas, can lead to
isobaric interferences on the 84Sr and 86Sr isotopes. Besides the interferences arising from
Rb and Kr, also the interference from ArCa+ molecular ions (table VI.1.a) should be taken
care of, especially when analyzing bone and dental tissues. The potential interferences on
Sr isotopes that arise from doubly charged ions (table VI.1.a) will be negligible, because
the parent elements are low abundant, and since the operating parameters of an ICP –
mass spectrometer are set in such a way that the occurrence of doubly charged ions in
the mass spectrum is low (< 3 %).
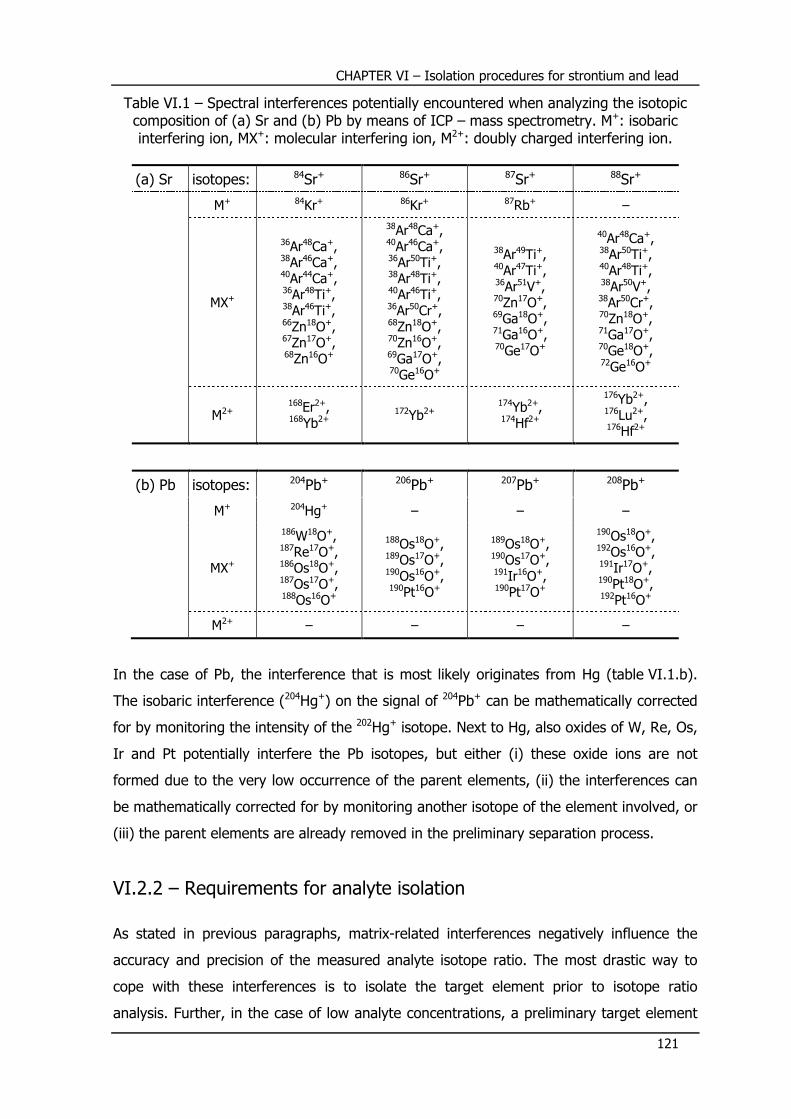
CHAPTER VI – Isolation procedures for strontium and lead
121
Table VI.1 – Spectral interferences potentially encountered when analyzing the isotopic composition of (a) Sr and (b) Pb by means of ICP – mass spectrometry. M+: isobaric interfering ion, MX+: molecular interfering ion, M2+: doubly charged interfering ion.
(a) Sr isotopes: 84Sr+ 86Sr+ 87Sr+ 88Sr+
M+ 84Kr+ 86Kr+ 87Rb+ –
MX+
36Ar48Ca+, 38Ar46Ca+, 40Ar44Ca+, 36Ar48Ti+, 38Ar46Ti+, 66Zn18O+, 67Zn17O+, 68Zn16O+
38Ar48Ca+, 40Ar46Ca+, 36Ar50Ti+, 38Ar48Ti+, 40Ar46Ti+, 36Ar50Cr+, 68Zn18O+, 70Zn16O+, 69Ga17O+, 70Ge16O+
38Ar49Ti+, 40Ar47Ti+, 36Ar51V+, 70Zn17O+, 69Ga18O+, 71Ga16O+, 70Ge17O+
40Ar48Ca+, 38Ar50Ti+, 40Ar48Ti+, 38Ar50V+, 38Ar50Cr+, 70Zn18O+, 71Ga17O+, 70Ge18O+, 72Ge16O+
M2+ 168Er2+, 168Yb2+
172Yb2+ 174Yb2+, 174Hf2+
176Yb2+, 176Lu2+, 176Hf2+
(b) Pb isotopes: 204Pb+ 206Pb+ 207Pb+ 208Pb+
M+ 204Hg+ – – –
MX+
186W18O+, 187Re17O+, 186Os18O+, 187Os17O+, 188Os16O+
188Os18O+, 189Os17O+, 190Os16O+, 190Pt16O+
189Os18O+, 190Os17O+, 191Ir16O+, 190Pt17O+
190Os18O+, 192Os16O+, 191Ir17O+, 190Pt18O+, 192Pt16O+
M2+ – – – –
In the case of Pb, the interference that is most likely originates from Hg (table VI.1.b).
The isobaric interference (204Hg+) on the signal of 204Pb+ can be mathematically corrected
for by monitoring the intensity of the 202Hg+ isotope. Next to Hg, also oxides of W, Re, Os,
Ir and Pt potentially interfere the Pb isotopes, but either (i) these oxide ions are not
formed due to the very low occurrence of the parent elements, (ii) the interferences can
be mathematically corrected for by monitoring another isotope of the element involved, or
(iii) the parent elements are already removed in the preliminary separation process.
VI.2.2 – Requirements for analyte isolation
As stated in previous paragraphs, matrix-related interferences negatively influence the
accuracy and precision of the measured analyte isotope ratio. The most drastic way to
cope with these interferences is to isolate the target element prior to isotope ratio
analysis. Further, in the case of low analyte concentrations, a preliminary target element
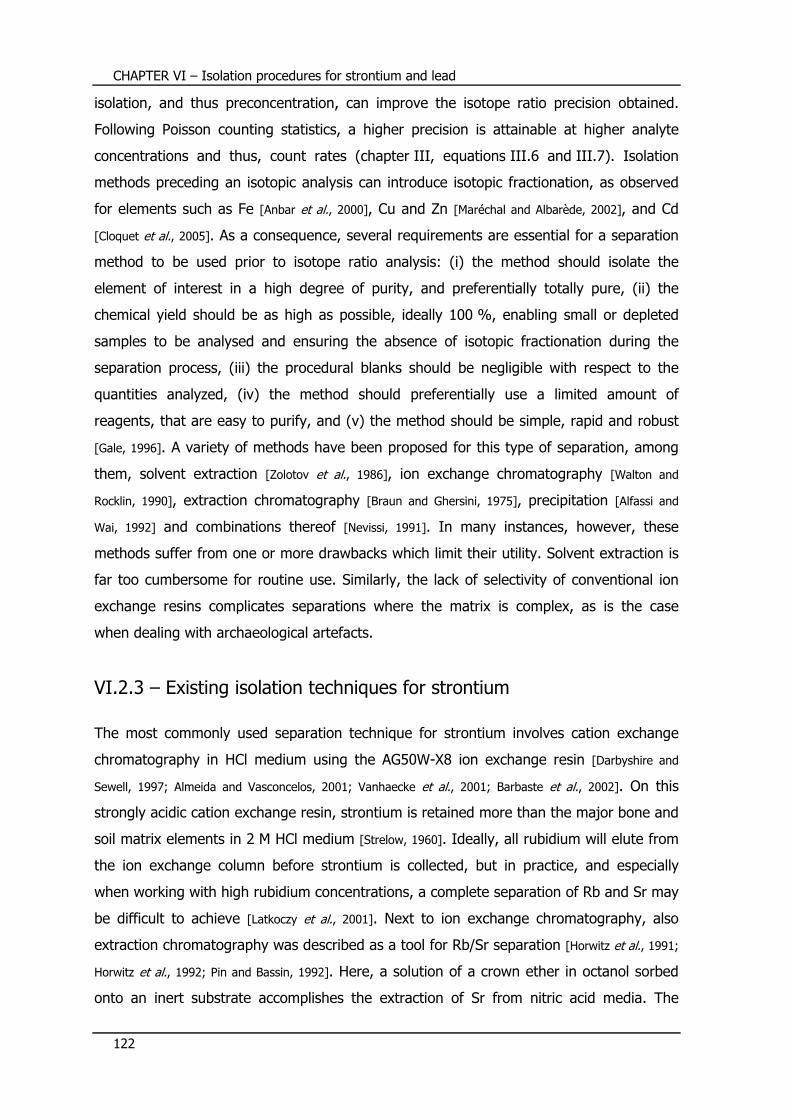
CHAPTER VI – Isolation procedures for strontium and lead
122
isolation, and thus preconcentration, can improve the isotope ratio precision obtained.
Following Poisson counting statistics, a higher precision is attainable at higher analyte
concentrations and thus, count rates (chapter III, equations III.6 and III.7). Isolation
methods preceding an isotopic analysis can introduce isotopic fractionation, as observed
for elements such as Fe [Anbar et al., 2000], Cu and Zn [Maréchal and Albarède, 2002], and Cd
[Cloquet et al., 2005]. As a consequence, several requirements are essential for a separation
method to be used prior to isotope ratio analysis: (i) the method should isolate the
element of interest in a high degree of purity, and preferentially totally pure, (ii) the
chemical yield should be as high as possible, ideally 100 %, enabling small or depleted
samples to be analysed and ensuring the absence of isotopic fractionation during the
separation process, (iii) the procedural blanks should be negligible with respect to the
quantities analyzed, (iv) the method should preferentially use a limited amount of
reagents, that are easy to purify, and (v) the method should be simple, rapid and robust
[Gale, 1996]. A variety of methods have been proposed for this type of separation, among
them, solvent extraction [Zolotov et al., 1986], ion exchange chromatography [Walton and
Rocklin, 1990], extraction chromatography [Braun and Ghersini, 1975], precipitation [Alfassi and
Wai, 1992] and combinations thereof [Nevissi, 1991]. In many instances, however, these
methods suffer from one or more drawbacks which limit their utility. Solvent extraction is
far too cumbersome for routine use. Similarly, the lack of selectivity of conventional ion
exchange resins complicates separations where the matrix is complex, as is the case
when dealing with archaeological artefacts.
VI.2.3 – Existing isolation techniques for strontium
The most commonly used separation technique for strontium involves cation exchange
chromatography in HCl medium using the AG50W-X8 ion exchange resin [Darbyshire and
Sewell, 1997; Almeida and Vasconcelos, 2001; Vanhaecke et al., 2001; Barbaste et al., 2002]. On this
strongly acidic cation exchange resin, strontium is retained more than the major bone and
soil matrix elements in 2 M HCl medium [Strelow, 1960]. Ideally, all rubidium will elute from
the ion exchange column before strontium is collected, but in practice, and especially
when working with high rubidium concentrations, a complete separation of Rb and Sr may
be difficult to achieve [Latkoczy et al., 2001]. Next to ion exchange chromatography, also
extraction chromatography was described as a tool for Rb/Sr separation [Horwitz et al., 1991;
Horwitz et al., 1992; Pin and Bassin, 1992]. Here, a solution of a crown ether in octanol sorbed
onto an inert substrate accomplishes the extraction of Sr from nitric acid media. The

CHAPTER VI – Isolation procedures for strontium and lead
123
selective resin, commercially available from Eichrom Environment (France) as Sr specTM, is
often used in microquantities packed onto microcolumns (< 1 mL resin) to purify Sr prior
to its isotope ratio analysis [Deniel and Pin, 2001; Prohaska et al., 2002; Pin et al., 2003; Fortunato et
al., 2004]. Also a combined use of extraction chromatography either after cation exchange
on AG50W-X [Waight et al., 2002] or before cation exchange using titanium phosphate
(PHOTI D) or zirconium phosphate (PHOZIR) slurried in 2 M HNO3 and loaded onto a
polystyrene carrier [Pin et al., 2003] has been successfully applied to geological materials.
Next to these manual separation techniques, also automated ion exchange procedures
using high-performance ion chromatography (HPIC) and flow injection (FI) have been
developed and even coupled online to (MC-)ICP-MS for subsequent Sr isotope ratio
analysis [Latkoczy et al., 2001; Meynadier et al., 2006; Galler et al., 2007; Garcia-Ruiz et al., 2007].
Recently, the separation of Rb and Sr via selective vaporization in an ETV-unit coupled to
an ICP – mass spectrometer (ETV-ICP-MS), has been described [Rowland et al., 2008].
VI.2.4 – Existing isolation techniques for lead
For geochemical applications, an anion exchange chromatographic separation using HBr
and HCl with AG1-X8 resin is considered as the standard method for Pb isolation [Manhès et
al., 1980; Rehkämper and Mezger, 2000; White et al., 2000; Weiss et al., 1999; Baker et al., 2004; Cloquet et
al., 2006-b]. Next to this method, also the use of iminodiacetate cation exchange columns
(MetPac CC-1) was demonstrated useful for Pb isolation from a bone matrix [Hinners et al.,
1998]. An extraction chromatographic resin, Pb specTM, which is derived from Sr specTM,
has also been developed and commercialized by Eichrom Environment [Horwitz et al., 1994;
Gale, 1996].
VI.2.5 – Strontium and lead isolation techniques used in this work
In this work, for both the target elements Sr and Pb, an extraction chromatographic
separation was evaluated. To this purpose, the commercially available resins Sr specTM for
Sr and Pb specTM for Pb – already mentioned above – were purchased from Eichrom
Environment under the form of 2 mL pre-packed columns. These columns are larger than
the microcolumns discussed above (§ VI.2.3), and thus allow the loading of a relatively
large amount of liquid sample with a complex matrix composition, such as bone tissue or
soil digests. Miniaturized methods are likely to fail in the cases where the target element
concentration is low and the matrix is heavy, as is the case for most of the samples
investigated in this work. Further, the extraction chromatographic resins Sr specTM and

CHAPTER VI – Isolation procedures for strontium and lead
124
Pb specTM should allow the use of less harmful chemicals or more diluted acids than those
used in standard Sr and Pb isolation methods (§ VI.2.3 and § VI.2.4). The performance of
the resins in terms of recovery, purity of the target element fraction obtained and
absence of isotopic fractionation after the separation process was evaluated, by applying
a separation protocol to (i) solutions obtained after digestion of soil and bone certified
reference materials (BCR CRM 141 Calcareous Loam Soil, BCR CRM 142 Light Sandy Soil,
NIST SRM 1400 Bone Ash and NIST SRM 1486 Bone Meal) following the digestion
procedures described in chapter V (§ V.4.1 and § V.4.2) and (ii) isotopic standards (NIST
SRM 981 Common Lead and NIST SRM 987 SrCO3). Also the possibility of regeneration of
the resin, allowing multiple employment of the same column, was evaluated.
VI.3 – Extraction chromatography using Sr specTM VI.3.1 – Description of the resin
In this work, the Sr specTM crown ether-based resin was used as commercially available
pre-packed 2 mL columns, packed with an inert polymeric carrier with a particle diameter
of 100-150 µm. The crown ether, 4,4’(5’)-di-tert-butylcyclohexane-18-crown-6
(figure VI.1) is present in a 1.0 M concentration in 1-octanol, and the inert
chromatographic support is loaded with 40 % (w/w) of this organic solution. The specific
combination of crown ether concentration and alcohol constitutes the resin’s selectivity for
strontium. Additional information on Sr specTM resin can be found in dedicated sources,
e.g., [Horwitz et al., 1991; Horwitz et al., 1992; Pin and Bassin, 1992].
Figure VI.1 – Crown ether 4,4’(5’)-di-tert-butylcyclohexane-18-crown-6, used in the Sr specTM and Pb specTM resins
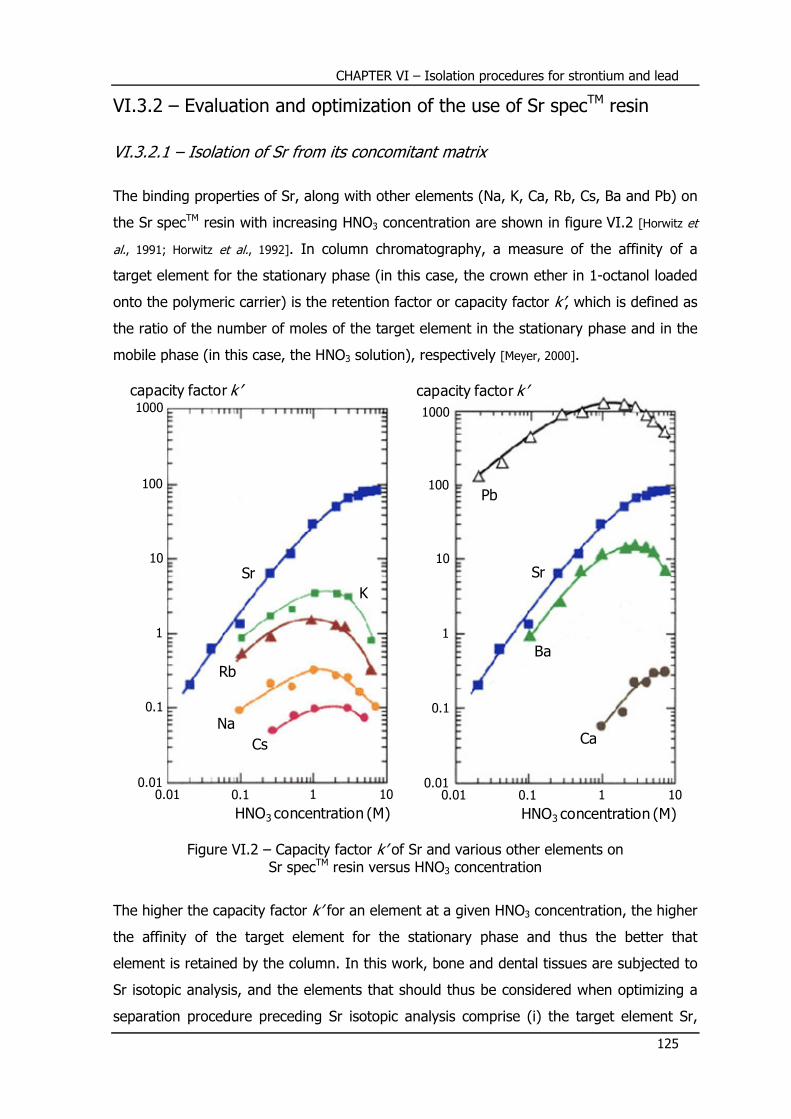
CHAPTER VI – Isolation procedures for strontium and lead
125
VI.3.2 – Evaluation and optimization of the use of Sr specTM resin
VI.3.2.1 – Isolation of Sr from its concomitant matrix
The binding properties of Sr, along with other elements (Na, K, Ca, Rb, Cs, Ba and Pb) on
the Sr specTM resin with increasing HNO3 concentration are shown in figure VI.2 [Horwitz et
al., 1991; Horwitz et al., 1992]. In column chromatography, a measure of the affinity of a
target element for the stationary phase (in this case, the crown ether in 1-octanol loaded
onto the polymeric carrier) is the retention factor or capacity factor k’, which is defined as
the ratio of the number of moles of the target element in the stationary phase and in the
mobile phase (in this case, the HNO3 solution), respectively [Meyer, 2000].
Figure VI.2 – Capacity factor k’ of Sr and various other elements on Sr specTM resin versus HNO3 concentration
The higher the capacity factor k’ for an element at a given HNO3 concentration, the higher
the affinity of the target element for the stationary phase and thus the better that
element is retained by the column. In this work, bone and dental tissues are subjected to
Sr isotopic analysis, and the elements that should thus be considered when optimizing a
separation procedure preceding Sr isotopic analysis comprise (i) the target element Sr,
capacity factor k’
HNO3 concentration (M)
1000
100
10
1
0.1
0.010.01 0.1 1 10
Sr
K
Rb
Na
Cs
capacity factor k’
HNO3 concentration (M)
1000
100
10
1
0.1
0.010.01 0.1 1 10
Sr
Pb
Ba
Ca

CHAPTER VI – Isolation procedures for strontium and lead
126
(ii) Rb, giving rise to the isobaric 87Rb+ interference (table VI.1), (iii) Pb, that exhibits a
behavior similar to that of Sr and is even better retained than Sr on the resin and (iv) the
major constituents of the bone and tooth matrix, such as Na, Mg, P, K, Ca and Fe.
Unfortunately, no information on the column behavior for, e.g., Mg and Fe is available,
and hence, this was experimentally evaluated.
The capacity factor for strontium, k’Sr, reaches its maximum value ranging from 70 to 90
at a HNO3 concentration ranging from 3 to 7 M (figure VI.2). In this concentration range,
Pb displays an affinity that is even higher than that of Sr (~ 700), while all the other
elements of interest display a k’ value not higher than 3. Further, the capacity factor k’ for
bone matrix elements is decreasing by at least a factor of two when increasing the HNO3
concentration from 3 to 7 M (Pb: 1 000 to 500, K: 3 to 1, Rb: 1 to 0.3, Na: 0.3 to 0.1),
except for Ca of which k’ stays constant around 0.3. From this observation, it can be
concluded that the sample can be loaded onto the column in a 3 to 7 M HNO3 medium, so
that the Sr is retained by the column while the matrix elements, except for Pb, show only
limited affinity for the column. Rinsing the column with an additional amount of 3 to
7 M HNO3 can result in the slightly retained matrix elements being rinsed off the column.
Lowering the HNO3 concentration to, e.g., 0.05 M results in a 100-fold decrease of the
capacity factor of Sr, so that the Sr is released from the column. Under these conditions,
also the capacity factor of Pb decreases from 500 to 300, but remains sufficiently high to
retain Pb on the column. If required, later on, Pb can be eluted from the column using
HCl [Deniel and Pin, 2001]. In view of the observations above, a strategy was suggested for
the use of Sr specTM: (i) loading the sample in 3 to 7 M HNO3 onto the column, (ii) rinsing
the column with an arbitrary volume of 20 mL 3 to 7 M HNO3 to remove slightly retained
matrix elements and (iii) elution of the pure Sr fraction with an arbitrary volume of 20 mL
0.05 M HNO3.
A first step in the optimization was to establish which HNO3 concentration – 3 or 7 M –
was the most efficient for sample loading and subsequent removal of the concomitant
matrix elements. Hereto, a digest of NIST SRM 1400 Bone Ash was split into two aliquots,
where one was diluted to 3 M HNO3, and the other to 7 M HNO3. An amount of these
aliquots was brought onto an extraction chromatographic column, so that approximately
10 µg Sr was loaded onto the column. The column loaded with the aliquot in 3 M HNO3
was subsequently rinsed with 20 mL 3 M HNO3, while the column loaded with the
7 M HNO3 aliquot was rinsed with 20 mL 7 M HNO3, after which both Sr fractions were
eluted using 20 mL 0.05 M HNO3. After elution, the Sr recovery was determined by
comparing the Sr concentrations retrieved in the original digest and in the eluted fraction.

CHAPTER VI – Isolation procedures for strontium and lead
127
This experiment was repeated 3 times, and the recovery in the 3 M HNO3 setup appeared
to be never higher than 20 %. Although 3 M HNO3 is frequently used for sample loading
and matrix removal on Sr specTM, the recovery was not reported [Prohaska et al., 2002;
Balcaen et al., 2005], or was stated as not quantitative [Pin and Bassin, 1992; Galler et al., 2007].
Using 7 M HNO3 for sample loading and column rinsing resulted in an average quantitative
Sr recovery for the 3 repetitions. As a consequence, 7 M HNO3 was chosen as the
optimum medium for sample loading onto and matrix removal from the column.
The second optimization step was the determination of the exact volumes of 7 M HNO3
and 0.05 M HNO3 solution required for complete removal of matrix elements (except for
Pb) and quantitative Sr recovery, respectively, as the volume of 20 mL used in the first
series of tests was only an arbitrary volume. This was done by loading approximately
10 µg Sr under the form of a NIST SRM 1400 Bone Ash digest in 7 M HNO3 onto the
column. Since nearly no Rb is present in NIST SRM 1400 Bone Ash, also 50 µg Rb under
the form of a standard solution in 7 M HNO3 was loaded onto the column. The solution
that passed through the column after sample loading (effluent) was collected. Next, the
column was rinsed with 20 mL 7 M HNO3 in 1 mL aliquots, with every aliquot collected
separately, followed by Sr elution with 20 mL 0.05 M HNO3, where again the 1 mL
aliquots were collected separately. The resulting 41 aliquots were semi-quantitatively
analysed (chapter II, § II.9.1) for their Sr content and the presence of bone matrix
elements using the Elan 5000 ICP – mass spectrometer. The elution profile thus obtained
is displayed in figure VI.3. All the elements determined are slightly retained by the
column, while for lead, no signal is observed for any fraction, what can be attributed to
either (i) its low concentration in NIST SRM 1400 Bone Ash or (ii) the fact that the lead
remains on the column during the whole experiment. This was not further investigated,
but the second explanation seems more likely, since the combined Sr and Pb separation
from silicate samples using Sr specTM has already been described [Gale, 1996; Deniel and Pin,
2001]. It can be seen from figure VI.3 that the Rb/Sr separation and the removal of matrix
elements is complete after rinsing the column with 10 mL of 7 M HNO3, and that the
complete Sr fraction is recovered after elution with 6 to 10 mL of 0.05 M HNO3. An
analogous experiment was performed using a BCR CRM 141 Calcareous Loam Soil digest,
and exactly the same conclusions could be drawn from the elution profile.
The separation protocol developed, consisting of (i) conditioning the column with 3 mL
7 M HNO3, followed by loading such an amount of sample in 7 M HNO3 onto the column
that 5 to 15 µg Sr is present , (ii) removal of slightly retained matrix elements by rinsing
the column with 10 mL 7 M HNO3 and (iii) elution of the purified Sr fraction with 10 mL

CHAPTER VI – Isolation procedures for strontium and lead
128
Figure VI.3 – Elution profile obtained for a NIST SRM 1400 Bone Ash digest loaded onto Sr specTM. An amount equivalent to 10 µg Sr was loaded and 50 µg Rb was
additionally spiked onto the column. R-x = 1 mL 7 M HNO3 rinse fraction x; E-x = 1 mL 0.05 M HNO3 elution fraction x.
0.05 M HNO3, was applied to the certified reference materials and the dental tissues
under study. A Sr recovery with corresponding 2s uncertainty interval of 99.5 ± 2.3 % for
soil (n=6), 100.0 ± 3.1 % for bone tissue (n=6) and 97.8 ± 4.4 % for dental tissues
(enamel and dentine) (n=34) was obtained, resulting in an average Sr recovery of
99.1 ± 2.3 % on Sr specTM resin.
VI.3.2.2 – Separation of rubidium and strontium
As was already observed from figure VI.3, the separation of Sr from the additionally
spiked Rb was complete. However, an additional experiment was conducted in order to
evaluate if the Rb/Sr separation efficiency depends on the relative amounts of Rb and Sr
present. Hereto, standard solutions containing Rb and Sr in 7 M HNO3, with a Sr/Rb ratio
of 10, 1 and 0.1, were prepared. An amount equivalent to 10 µg Sr from each of these
eff
luent
R-1
R-5
R-1
0
R-1
5
R-2
0
E-1
E-5
E-1
0
E-1
5
E-2
0
0
1
2
3
4
5
signal intensity(107 counts s-1)
effl
uent
R-1
R-5
R-1
0
R-1
5
R-2
0E-
1
E-5
E-10
E-15
E-20
signal intensity(106 counts s-1)
0
1
2
3
4
5
Sr
Pb
Zn
Al
Ba
K
Rb
Mg
Fe
Na
Ca
Sr
Pb
Zn
Al
Ba
K
Rb
Mg
Fe
Na
Ca

CHAPTER VI – Isolation procedures for strontium and lead
129
three standard solutions was loaded onto three separate columns, followed by the rinsing
and elution protocol described above, where every 1 mL fraction was collected separately.
After semi-quantitative elemental assay of the fractions, the elution profiles displayed in
figure VI.4 were obtained. It is clear that the separation of Rb and Sr is complete for
every Sr/Rb ratio investigated. The amount of rubidium present in the purified strontium
fractions of the three standard solutions was always below 0.4 µg L-1, which is
comparable to blank level.
Figure VI.4 – Elution profiles obtained for standard solutions with varying Sr/Rb ratios – (a) Sr/Rb ratio = 10 and 1; (b) Sr/Rb ratio = 0.1. R-x = 1 mL 7 M HNO3 rinse fraction x;
E-x = 1 mL 0.05 M HNO3 elution fraction x.
eff
luent
R-1
R-5
R-1
0
R-1
5
R-2
0E-1
E-5
E-1
0
E-1
5
E-2
0
0
2
4
6
8
10
signal intensity(106 counts s-1)
88Sr
10
1
Sr
Rb (Sr/Rb =10)
Rb (Sr/Rb =1)
(a)
eff
luent
R-1
R-5
R-1
0
R-1
5
R-2
0E-1
E-5
E-1
0
E-1
5
E-2
0
0
1
2
3
signal intensity(107 counts s-1)
88Sr
0.1
Sr
Rb (Sr/Rb = 0.1)
(b)

CHAPTER VI – Isolation procedures for strontium and lead
130
VI.4 – Extraction chromatography using Pb specTM VI.4.1 – Description of the resin
The extraction chromatographic resin Sr specTM (§ VI.3.1) was initially developed for the
separation and preconcentration of Sr from HNO3 solutions. It was noted that this
material also exhibits extremely strong retention of Pb over a wide range of HNO3
concentrations (figure VI.2), and even too strong for convenient stripping [Gale, 1996; Deniel
and Pin, 2001]. From this observation, Pb specTM, a modified version of Sr specTM, was
developed to achieve satisfactory lead retention from nitric acid containing aqueous
phases, while at the same time readily permitting the stripping of the sorbed Pb. Lead
extraction on the Pb specTM resin is also accomplished by means of 4,4’(5’)-di-tert-
butylcyclohexane-18-crown-6 (figure VI.1) but the crown ether is present in a lower
concentration (0.75 M) and dissolved in a higher molecular weight alcohol (isodecanol).
Pb specTM was also bought under the form of pre-packed 2 mL columns as Sr specTM.
Additional information on Pb specTM resin can be found in dedicated sources, e.g., [Horwitz
et al., 1994].
VI.4.2 – Evaluation and optimization of the use of Pb specTM resin
The capacity factor of Pb and various other elements on Pb specTM resin with increasing
HNO3 concentration is available from the literature [Horwitz et al., 1994] and shown in
figure VI.5.
Figure VI.5 – Capacity factor k’ of Pb and various other elements on Pb specTM resin versus HNO3 concentration
In view of the major elemental composition of the samples studied (soil, bone tissue,
amphorae, metallic artefacts), especially the data available for Na, K, Ca, Sr and Ba,
HNO3 concentration (M)HNO3 concentration (M)
1000
100
10
1
0.1
0.010.01 0.1 1 10
1000
100
10
1
0.1
0.010.01 0.1 1 10
Pb Pb
Tl
K
Na
Sr
Ba
Ca
capacity factor k’ capacity factor k’
CHAPTER VI – Isolation procedures for strontium and lead
131
besides Pb, are useful. Since Tl is often used in the case of Pb isotopic analysis for mass
discrimination correction via external normalization (chapter III, § III.4.2.2.1) [Rehkämper
and Mezger, 2000; White et al., 2000; Kamenov et al., 2004; Rehkämper et al., 2004; Weiss et al., 2004;
Cloquet et al., 2006-b], its absence in the sample fractions obtained after the Pb isolation
procedure has to be guaranteed. Although Tl levels in bone and soil are (very) low, the
efficiency of Tl removal has been experimentally evaluated when determining the Pb
recoveries (see below). The capacity factor k’ of Tl remains constant around 20 in the
range of 0.2 to 1.0 M HNO3 (figure VI.5). Na, K and especially Ca are major constituents
of bone tissue, Sr is present in trace element range (although at a higher level than Pb)
and Ba is present as a trace element in soils. The column shows an affinity for Sr and Ba
that is comparable to that of Tl at 1.0 M HNO3. The capacity factor k’ is below 1 for K,
below 0.2 for Na and below 0.1 for Ca in the HNO3 concentration range of 0.1-
1.0 M HNO3 (figure VI.5). At 1.0 M HNO3, k’Pb reaches its maximum value (~ 1000), so
this is the optimum HNO3 concentration for sample loading and efficient sorption of Pb
onto the resin. Sr and Ba are slightly retained under these conditions (k’Sr ~ 20 and
k’Ba ~ 10), but they are removed by rinsing the column with 0.1 M HNO3 (k’Sr ~ 1 and
k’Ba ~ 2), while k’Pb remains sufficiently high at ~ 500. As a consequence, the following
strategy was suggested: (i) loading the sample in 1.0 M HNO3 onto the column, (ii) rinsing
the column with an arbitrary volume of 20 mL 0.1 M HNO3 to remove slightly retained
matrix elements (= matrix removal) and (iii) elution of the pure Pb fraction with an
arbitrary volume of 20 mL of a suited eluent. No data are available on the capacity factors
of, e.g., Mg (bone tissue), Fe and Zn (soil), Al and Si (ceramics) and Cu and Ag (metallic
artefacts); the behavior of these elements was experimentally evaluated after application
of the proposed protocol.
In order to select a suited eluent, the following experiment was set up: 10 µg Pb from a
Pb standard solution in 1.0 M HNO3 was loaded onto an extraction chromatographic
column, followed by column rinsing with 20 mL 0.1 M HNO3. The performance in terms of
recovery for several eluent candidates – milli-Q water, ethylenediamine tetra-acetate
(EDTA) and ammonium oxalate [Horwitz et al., 1994] – was evaluated. With 20 mL milli-Q
water, only 0.38 % of the amount of Pb loaded onto the column was recovered. Next,
20 mL 0.1 M Na4EDTA solution at pH 7.5 was tested. A major drawback of EDTA for the
isolation of Pb is the strong complexing property of this organic compound. As a result,
many metals were present as impurities in the eluted fraction, and Pb levels up to
~ 10 µg L-1 were retrieved in the blank solutions. Furthermore, due to its organic
character, the presence of EDTA causes strong matrix effects (chapter II, § II.2) in ICP-

CHAPTER VI – Isolation procedures for strontium and lead
132
MS measurements. A signal suppression up to 35 % was observed for Pb. Hence, it was
decided to opt for another eluent. The next candidate was a 0.05 M (NH4)2C2O4 solution.
A Pb level below 0.5 µg L-1 was retrieved in the blank solutions, while other impurities
were only present at negligible levels. The signal suppression observed on the Pb signal
due to the presence of ammonium oxalate was below 0.5 % for 0.05 M (NH4)2C2O4 (the
highest ammonium oxalate concentration used for Pb isotope ratio measurements). The
first experiment with a 0.05 M (NH4)2C2O4 solution as eluent resulted in a quantitative Pb
recovery. As a consequence, this eluent was selected as the best suited candidate for
further employment.
The next step in the optimization was the determination of the volumes of 0.1 M HNO3
and 0.05 M (NH4)2C2O4 solution required for complete matrix removal and quantitative Pb
recovery. This was done in an experiment analogous to that described for Sr specTM resin
(§ VI.3.2.1). An amount of a soil (BCR CRM 141 Calcareous Loam Soil and BCR CRM 142
Light Sandy Soil) or bone (NIST SRM 1400 Bone Ash) digest in 1.0 M HNO3 was loaded
onto the column such that approximately 10 µg of Pb was present. The effluent was
collected. Next, the column was rinsed with 20 mL 0.1 M HNO3 and every 1 mL fraction
was collected separately for individual analysis. Then, the Pb fraction was eluted with
20 mL 0.05 M (NH4)2C2O4 solution, where again every 1 mL fraction was collected
separately. In the resulting 41 fractions (1 effluent, 20 rinse and 20 eluent fractions), Pb
and a series of soil and bone matrix elements were determined semi-quantitatively
(chapter II, § II.9.1) using the Elan 5000 ICP – mass spectrometer. The elution profile
thus obtained for a BCR CRM 142 Light Sandy Soil digest is displayed in figure VI.6. The
elements Mg and Fe display no affinity for the stationary phase. The elements Al, Si, K,
Ca, Zn, Sr and Ba are retained by the column, but are completely removed during column
rinsing. No Tl signal was observed during the optimization procedure since no detectable
amount of Tl is present in BCR CRM 142 Light Sandy Soil. The removal of matrix elements
is complete after rinsing with 10 mL 0.1 M HNO3, and the pure Pb fraction is completely
recovered after elution with 10 mL 0.05 M (NH4)2C2O4 solution. Exactly the same elution
profile and conclusion was found for a BCR CRM 141 Calcareous Loam Soil and a NIST
SRM 1400 Bone Ash digest.
Besides soil, bone tissue and ceramics, also metallic artefacts rich in copper and/or silver,
were the subject of investigation. No data on the capacity factor k’ of Cu or Ag, along with
elements present in metallic artefacts (e.g., As, Sn, Sb, Au, Bi) are available for Pb specTM.
Further, in the digestion procedure developed for metallic artefacts with a high silver
content (> 50 %) (chapter V, § V.4.5), 1 mL H2SO4 is added to the aqua regia in
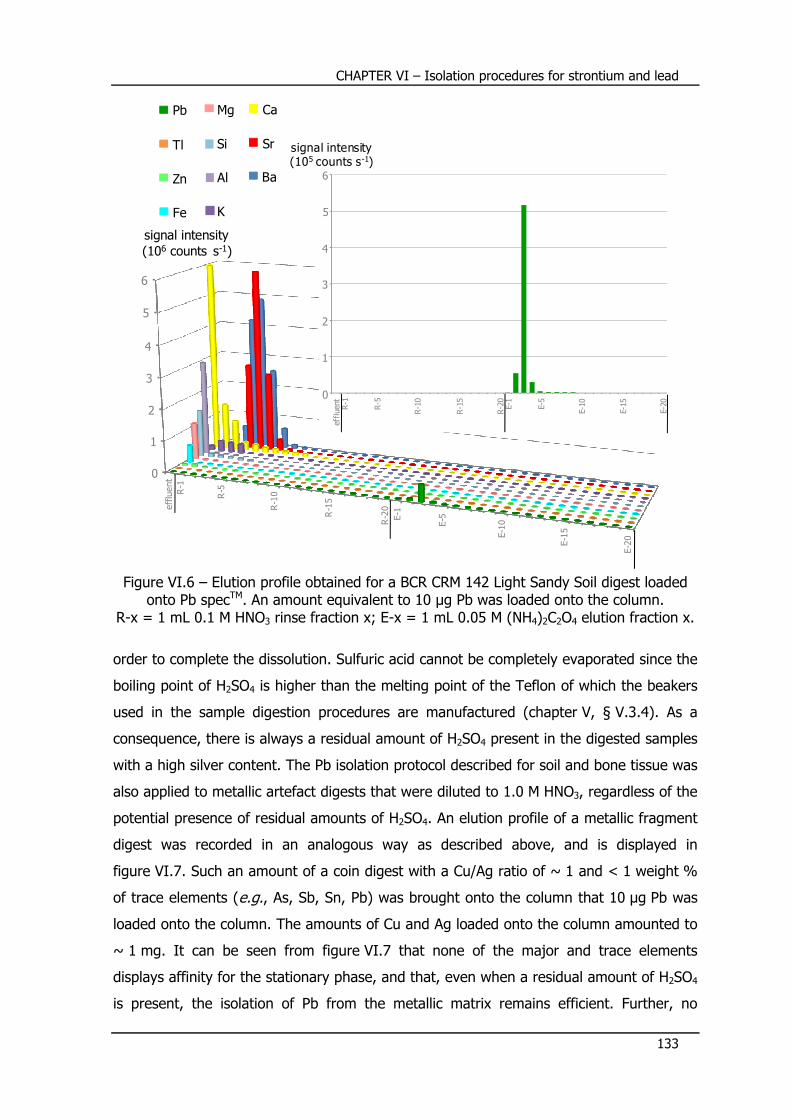
CHAPTER VI – Isolation procedures for strontium and lead
133
Figure VI.6 – Elution profile obtained for a BCR CRM 142 Light Sandy Soil digest loaded
onto Pb specTM. An amount equivalent to 10 µg Pb was loaded onto the column. R-x = 1 mL 0.1 M HNO3 rinse fraction x; E-x = 1 mL 0.05 M (NH4)2C2O4 elution fraction x.
order to complete the dissolution. Sulfuric acid cannot be completely evaporated since the
boiling point of H2SO4 is higher than the melting point of the Teflon of which the beakers
used in the sample digestion procedures are manufactured (chapter V, § V.3.4). As a
consequence, there is always a residual amount of H2SO4 present in the digested samples
with a high silver content. The Pb isolation protocol described for soil and bone tissue was
also applied to metallic artefact digests that were diluted to 1.0 M HNO3, regardless of the
potential presence of residual amounts of H2SO4. An elution profile of a metallic fragment
digest was recorded in an analogous way as described above, and is displayed in
figure VI.7. Such an amount of a coin digest with a Cu/Ag ratio of ~ 1 and < 1 weight %
of trace elements (e.g., As, Sb, Sn, Pb) was brought onto the column that 10 µg Pb was
loaded onto the column. The amounts of Cu and Ag loaded onto the column amounted to
~ 1 mg. It can be seen from figure VI.7 that none of the major and trace elements
displays affinity for the stationary phase, and that, even when a residual amount of H2SO4
is present, the isolation of Pb from the metallic matrix remains efficient. Further, no
eff
luent
R-1
R-5
R-1
0
R-1
5
R-2
0
E-1
E-5
E-1
0
E-1
5
E-2
0
0
1
2
3
4
5
6
signal intensity(106 counts s-1)
effl
uent
R-1
R-5
R-1
0
R-1
5
R-2
0E-
1
E-5
E-10
E-15
E-20
signal intensity(105 counts s-1)
0
1
2
3
4
5
6Al
Pb
Tl
Zn
Pb
Tl
Zn
FeFe
Ca
Sr
Ba
Ca
Sr
Ba
Si
Mg
K
Mg
Si
Al
K

CHAPTER VI – Isolation procedures for strontium and lead
134
Figure VI.7 – Elution profile obtained for a metallic artefact digest with a Cu/Ag ratio of ~ 1 and less than 1 % trace elements. R-x = 1 mL 0.1 M HNO3 rinse fraction x;
E-x = 1 mL 0.05 M (NH4)2C2O4 elution fraction x.
detectable amounts of W – potentially introduced by the sampling using a tungsten-
carbide miniature drill (chapter V, § V.1.3) – were found in the purified Pb fractions.
The Pb isolation method developed, was applied to the certified reference materials and
archaeological samples under investigation. Between 5 and 15 µg of Pb, depending on the
Pb concentration in the sample, was loaded onto the column. The column recoveries for
the samples were determined by elemental assay using the Elan 5000 ICP – mass
spectrometer followed by a comparison of the Pb concentration in the original digest and
that in the Pb fraction after the isolation process. Besides Pb, also Tl was monitored in the
Pb fractions, and the presence of Tl appeared to be limited to blank levels. The
experimental Pb recovery and corresponding 2s uncertainty interval was determined as
99.8 ± 5.1 % for bone tissue (n=23), 100.3 ± 1.5 % for soil (n=22), 100.0 ± 2.0 % for
ceramics (n=9), and 100.1 ± 2 % for metallic artefacts (n=42), resulting in an average
Pb recovery of 100.1 ± 0.8 % on Pb specTM resin.
VI.5 – Isotopic fractionation on the Sr and Pb resins As stated higher, no isotopic fractionation is expected to occur in nature for Sr
(chapter IV, § IV.1.1) and Pb (chapter IV, § IV.2.3). However, on-column fractionation
has been occasionally reported for both Sr and Pb. In the case of Sr, separated using
Sr specTM resin, it was found that a minimal amount of mass-dependent isotopic
eff
luent
R-1
R-5
R-1
0
R-1
5
R-2
0
E-1
E-5
E-1
0
E-1
5
E-2
0
0
2
4
6
8
10
signal intensity(106 counts s-1) Pb
Au
Bi
As
Sb
Sn
Ag
Cu
Pb
Au
Bi
Sb
Sn
Ag
As Cu

CHAPTER VI – Isolation procedures for strontium and lead
135
fractionation takes place during the course of the separation process, but that the
cumulative isotope ratio after the separation procedure does not reflect detectable
isotopic fractionation [Wakabayashi et al., 2007]. The same observation was reported for Pb
when using the standard HCl/HBr ion exchange technique, while again, the cumulative
isotope ratio after the separation procedure matches within error to the certified value
[Baker et al., 2004]. It was suggested that the isotopic fractionation effects can be minimized
by the use of small resin beds and collection of the Pb fraction in a sufficient amount of
HCl. However, the pre-packed 2 mL columns used in this work are longer than the
microcolumns used in standard methods for Sr and Pb isolations. Further, in this work, a
large sample amount, ranging from 0.1 to 10 mL, depending on the target element
concentration present, was loaded onto the column. In order to assess whether or not
isotopic fractionation is introduced by the separation procedures developed for Sr and Pb,
10 µg of target element from an isotopic standard, NIST SRM 987 SrCO3 for Sr and NIST
SRM 981 Common Lead for Pb, was conducted through the respective isolation processes,
followed by isotope ratio measurement using multi-collector ICP-MS (Thermo Electron’s
Neptune for Sr and Nu Instruments’ Nu Plasma 500 for Pb) (chapter VII). Correction for
mass discrimination was performed by external standardization (sample-standard
bracketing) with a solution of NIST SRM 987 SrCO3 for Sr isotope ratio measurements,
and with a solution of NIST SRM 981 Common Lead for Pb isotope ratio measurements. A
comparison of the isotope ratios obtained before and after the isolation procedure is given
in table VI.2.
Table VI.2 – Experimental isotope ratios obtained for Sr and Pb isotopic standards before and after extraction chromatographic separation – (a) Sr results for NIST SRM 987 SrCO3; (b) Pb results for NIST SRM 981 Common Lead. The uncertainty on the last digit is given
in parentheses and represents a 2s uncertainty interval. Accepted values taken from [Nu, 2001] for Sr and from [Galer and Abouchami, 1998] for Pb.
(a) Sr 84Sr/86Sr 84Sr/88Sr 87Sr/86Sr
before 0.0565(2) 0.00674(2) 0.71022(3)
after 0.0564(2) 0.00673(2) 0.71023(3)
accepted 0.05649 0.006748 0.710248
(b) Pb 206Pb/204Pb 207Pb/204Pb 208Pb/204Pb 207Pb/206Pb 208Pb/206Pb 208Pb/207Pb
before 16.940(8) 15.496(6) 36.716(10) 0.9148(1) 2.1674(4) 2.3698(2)
after 16.949(10) 15.508(13) 36.741(25) 0.9148(2) 2.1678(6) 2.3699(3)
accepted 16.9405 15.4963 36.7219 0.91475 2.16771 2.3697

CHAPTER VI – Isolation procedures for strontium and lead
136
A good agreement, within experimental error, between the Sr isotope ratios obtained for
NIST SRM 987 SrCO3 before and after the isolation process is established (table VI.2.a).
Further, within the external precision of the Sr measurement protocol using MC-ICP-MS,
the experimental values are in very good agreement with the accepted values for NIST
SRM 987 SrCO3 as obtained via multi-collector ICP-MS [Thirlwall, 1991; Walder and Freedman,
1992; Nu, 2001; Faure and Mensing, 2005]. As a consequence, it can be concluded that no
detectable isotopic fractionation is introduced by the extraction chromatographic isolation
procedure via Sr specTM resin. The Pb isotope ratios obtained before and after the
isolation process for NIST SRM 981 Common Lead (table VI.2.b) match within
experimental error and are in agreement with the accepted values for NIST SRM 981
Common Lead obtained via triple spike TI-MS [Galer and Abouchami, 1998]. Although the
ratios with 204Pb display a slight shift to higher values after the isolation process, they stay
within experimental uncertainty of the isotope ratios before the isolation process. In view
of the very good agreement for isotope ratios without 204Pb, it can be concluded that no
Pb isotopic fractionation is introduced by the isolation process using Pb specTM resin. The
quantitative recovery established for Sr on Sr specTM (§ VI.3.2.1) and for Pb on Pb specTM
(§ VI.4.2) already pointed towards this conclusion.
VI.6 – Multiple use of extraction chromatographic resins An experiment was set up to (i) assess the performance of the extraction
chromatographic resins Sr specTM and Pb specTM after being regenerated, so when it is
used a second time, and (ii) to test whether or not there is a change in recovery and/or
isotope ratio when the same column, after regeneration, is applied for a second time for a
matrix different from that when the column was used for the first time. For both Sr specTM
and Pb specTM, an analogous experiment was carried out, involving several columns as
summarized in table VI.3. In a first batch (pass 1), an amount of NIST SRM 987 SrCO3, a
NIST SRM 1400 Bone Ash or a NIST SRM 1486 Bone Meal digest was loaded onto a new
Sr specTM column (table VI.3.a), and an amount of a digest of BCR CRM 141 Calcareous
Loam Soil, BCR CRM 142 Light Sandy Soil or NIST SRM 1400 Bone Ash was loaded onto a
new Pb specTM column (table VI.3.b). After the respective Sr or Pb isolation procedure,
the column was washed with 100 mL milli-Q water in order to regenerate the resins. This
regeneration procedure was suggested for Pb specTM resin [Horwitz et al., 1994], but since
bone and soil are characterized by a complex matrix composition (chapter IV, § IV.4.1
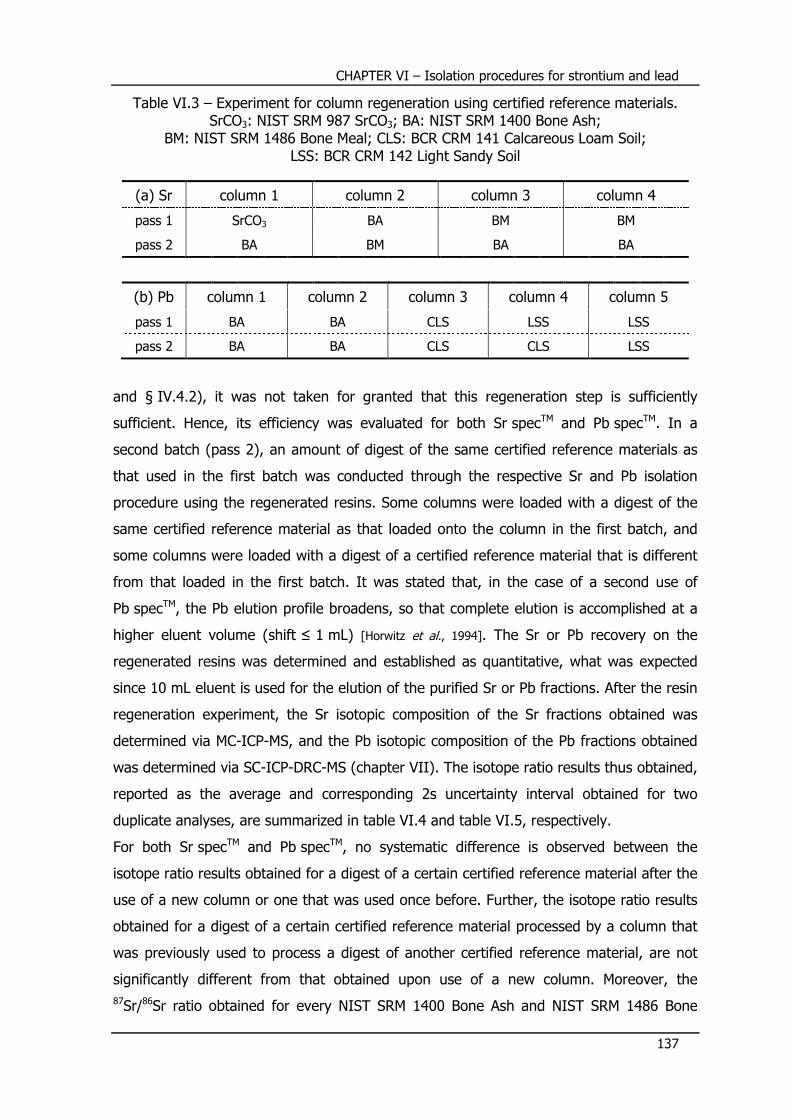
CHAPTER VI – Isolation procedures for strontium and lead
137
Table VI.3 – Experiment for column regeneration using certified reference materials. SrCO3: NIST SRM 987 SrCO3; BA: NIST SRM 1400 Bone Ash;
BM: NIST SRM 1486 Bone Meal; CLS: BCR CRM 141 Calcareous Loam Soil; LSS: BCR CRM 142 Light Sandy Soil
(a) Sr column 1 column 2 column 3 column 4
pass 1 SrCO3 BA BM BM
pass 2 BA BM BA BA
(b) Pb column 1 column 2 column 3 column 4 column 5
pass 1 BA BA CLS LSS LSS
pass 2 BA BA CLS CLS LSS
and § IV.4.2), it was not taken for granted that this regeneration step is sufficiently
sufficient. Hence, its efficiency was evaluated for both Sr specTM and Pb specTM. In a
second batch (pass 2), an amount of digest of the same certified reference materials as
that used in the first batch was conducted through the respective Sr and Pb isolation
procedure using the regenerated resins. Some columns were loaded with a digest of the
same certified reference material as that loaded onto the column in the first batch, and
some columns were loaded with a digest of a certified reference material that is different
from that loaded in the first batch. It was stated that, in the case of a second use of
Pb specTM, the Pb elution profile broadens, so that complete elution is accomplished at a
higher eluent volume (shift ≤ 1 mL) [Horwitz et al., 1994]. The Sr or Pb recovery on the
regenerated resins was determined and established as quantitative, what was expected
since 10 mL eluent is used for the elution of the purified Sr or Pb fractions. After the resin
regeneration experiment, the Sr isotopic composition of the Sr fractions obtained was
determined via MC-ICP-MS, and the Pb isotopic composition of the Pb fractions obtained
was determined via SC-ICP-DRC-MS (chapter VII). The isotope ratio results thus obtained,
reported as the average and corresponding 2s uncertainty interval obtained for two
duplicate analyses, are summarized in table VI.4 and table VI.5, respectively.
For both Sr specTM and Pb specTM, no systematic difference is observed between the
isotope ratio results obtained for a digest of a certain certified reference material after the
use of a new column or one that was used once before. Further, the isotope ratio results
obtained for a digest of a certain certified reference material processed by a column that
was previously used to process a digest of another certified reference material, are not
significantly different from that obtained upon use of a new column. Moreover, the
87Sr/86Sr ratio obtained for every NIST SRM 1400 Bone Ash and NIST SRM 1486 Bone
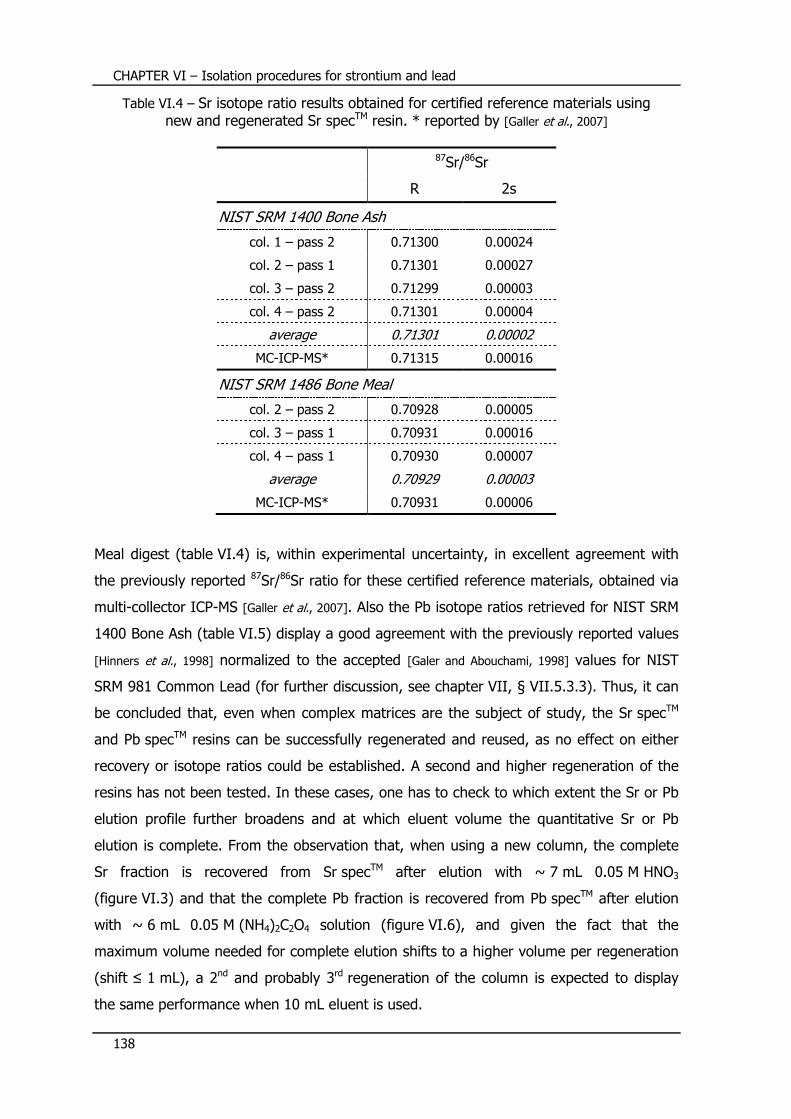
CHAPTER VI – Isolation procedures for strontium and lead
138
Table VI.4 – Sr isotope ratio results obtained for certified reference materials using new and regenerated Sr specTM resin. * reported by [Galler et al., 2007]
87Sr/86Sr
R 2s
NIST SRM 1400 Bone Ash
col. 1 – pass 2 0.71300 0.00024
col. 2 – pass 1 0.71301 0.00027
col. 3 – pass 2 0.71299 0.00003
col. 4 – pass 2 0.71301 0.00004
average 0.71301 0.00002
MC-ICP-MS* 0.71315 0.00016
NIST SRM 1486 Bone Meal
col. 2 – pass 2 0.70928 0.00005
col. 3 – pass 1 0.70931 0.00016
col. 4 – pass 1 0.70930 0.00007
average 0.70929 0.00003
MC-ICP-MS* 0.70931 0.00006
Meal digest (table VI.4) is, within experimental uncertainty, in excellent agreement with
the previously reported 87Sr/86Sr ratio for these certified reference materials, obtained via
multi-collector ICP-MS [Galler et al., 2007]. Also the Pb isotope ratios retrieved for NIST SRM
1400 Bone Ash (table VI.5) display a good agreement with the previously reported values
[Hinners et al., 1998] normalized to the accepted [Galer and Abouchami, 1998] values for NIST
SRM 981 Common Lead (for further discussion, see chapter VII, § VII.5.3.3). Thus, it can
be concluded that, even when complex matrices are the subject of study, the Sr specTM
and Pb specTM resins can be successfully regenerated and reused, as no effect on either
recovery or isotope ratios could be established. A second and higher regeneration of the
resins has not been tested. In these cases, one has to check to which extent the Sr or Pb
elution profile further broadens and at which eluent volume the quantitative Sr or Pb
elution is complete. From the observation that, when using a new column, the complete
Sr fraction is recovered from Sr specTM after elution with ~ 7 mL 0.05 M HNO3
(figure VI.3) and that the complete Pb fraction is recovered from Pb specTM after elution
with ~ 6 mL 0.05 M (NH4)2C2O4 solution (figure VI.6), and given the fact that the
maximum volume needed for complete elution shifts to a higher volume per regeneration
(shift ≤ 1 mL), a 2nd and probably 3rd regeneration of the column is expected to display
the same performance when 10 mL eluent is used.

CH
APTER
VI –
Isola
tion p
roce
dure
s for stro
ntiu
m a
nd le
ad
139
Table
VI.5
– P
b iso
tope ra
tio re
sults o
bta
ined fo
r certifie
d re
fere
nce
mate
rials u
sing
new
and re
genera
ted P
b sp
ec
TM re
sin. *
renorm
alize
d fro
m [H
inners et al., 1
998]
208Pb/207Pb
2s
0.0014
0.0039
0.0019
0.0022
0.0033
0.0003
0.0011
0.0025
0.0077
0.0010
0.0011
0.0044
0.0040
0.0065
R
2.4635
2.4631
2.4605
2.4644
2.4629
2.4642
2.4663
2.4673
2.4667
2.4667
2.4674
2.4653
2.4610
2.4646
208Pb/206Pb
2s
0.0026
0.0019
0.0008
0.0046
0.0019
0.0007
0.0002
0.0004
0.0050
0.0045
0.0006
0.0010
0.0015
0.0051
R
2.1031
2.1047
2.1026
2.1038
2.1036
2.1025
2.0762
2.0803
2.0766
2.0777
2.0810
2.0842
2.0791
2.0814
207Pb/206Pb
2s
0.0008
0.0018
0.0008
0.0011
0.0010
0.0002
0.0002
0.0010
0.0013
0.0015
0.0002
0.0009
0.0002
0.0022
R
0.8536
0.8546
0.8543
0.8537
0.8541
0.8532
0.8421
0.8433
0.8419
0.8424
0.8432
0.8454
0.8446
0.8444
208Pb/204Pb
2s
0.207
0.013
0.150
0.062
0.064
0.040
0.186
0.188
0.044
0.138
0.050
0.152
0.078
0.089
R
38.626
38.561
38.604
38.631
38.606
38.625
38.637
38.715
38.578
38.643
38.585
38.625
38.537
38.582
207Pb/204Pb
2s
0.075
0.030
0.030
0.039
0.025
0.012
0.078
0.082
0.041
0.046
0.014
0.049
0.034
0.028
R
15.680
15.655
15.684
15.676
15.674
15.675
15.670
15.688
15.643
15.667
15.638
15.666
15.653
15.652
206Pb/204Pb
2s
NIST SRM 1400 Bone Ash
0.071
0.044
0.053
0.069
0.031
0.014
BCR CRM 141 Calcareous Loam Soil
0.097
0.076
0.044
0.019
BCR CRM 142 Light Sandy Soil
0.020
0.073
0.029
0.019
R
18.368
18.333
18.357
18.363
18.355
18.371
18.607
18.604
18.589
18.600
18.546
18.529
18.530
18.535
col. 1 – pass 1
col. 1 – pass 2
col. 2 – pass 1
col. 2 – pass 2
average
TI-MS*
col. 3 – pass 1
col. 3 – pass 2
col. 4 – pass 2
average
col. 4 – pass 1
col. 5 – pass 1
col. 5 – pass 2
average
CHAPTER VI – Isolation procedures for strontium and lead
140
VI.7 – Conclusions The performance of commercially available pre-packed 2 mL extraction chromatographic
columns, containing a crown ether-based resin, was evaluated for the pure and
quantitative isolation of Sr and Pb from heavy and complex matrices of archaeological
artefacts. For Sr isolation and simultaneous separation of Rb and Sr, Sr specTM was used,
while for Pb isolation, Pb specTM was used. Both resins are based on the crown ether
4,4’(5’)-di-tert-butylcyclohexane-18-crown-6, while the selectivity of the resin for Sr or Pb
is obtained by changing the crown ether concentration in combination with a change in
the type of alcohol as solvent. It was demonstrated that the proper use of Sr specTM and
Pb specTM results in a quantitative Sr or Pb recovery, and that the separation of Rb and Sr
is complete on Sr specTM. A benefit of using these resins is that less harmful and more
diluted chemicals can be used than those used in standard Sr and Pb isolation methods.
Further, it was demonstrated that the isolation of Sr by means of Sr specTM and the
isolation of Pb by means of Pb specTM does not introduce isotopic fractionation of Sr and
Pb. The possibility of regenerating the resins, allowing multiple use of the same column,
preserving a quantitative target element recovery and without influence on the measured
isotope ratios, was demonstrated. As a consequence, it can be stated that the use of
extraction chromatographic columns based on the resins Sr specTM and Pb specTM prior to
isotopic analysis via single-collector – and multi-collector ICP-MS is a valuable alternative
for the isolation processes that were previously adopted as standard methods in the field
of geochemistry.

CHAPTER VII
Single-collector – and
multi-collector ICP-MS
measurement protocols


CHAPTER VII – Single-collector – and multi-collector ICP-MS measurement protocols
143
In this work, ICP-MS was used for the determination of (i) (trace) element concentrations
and (ii) isotopic compositions. Several ICP-MS instruments have been used (Chapter II,
§ II.8) for this purpose. A quadrupole-based PerkinElmer SCIEX Elan 5000 was used for
(semi-)quantitative elemental assay of Pb and various matrix elements in dissolved
archaeological samples, while a quadrupole-based PerkinElmer SCIEX Elan DRCplus,
equipped with a dynamic reaction cell (DRC), was used for quantitative elemental assay of
P, Ca and Sr in dental tissue of archaeological interest. This single-collector ICP – dynamic
reaction cell – mass spectrometer was also optimized for Pb isotope ratio analysis of
archaeological artefacts. Further, also two multi-collector ICP-MS instruments were used
in this work for isotope ratio analysis, namely, (i) a Nu Instruments Nu Plasma 500 for Pb
isotope ratio analysis and (ii) a Thermo Electron Neptune for Sr isotopic analysis. This
chapter presents a description of the measurement protocols developed for elemental
assay and isotope ratio analysis using the instruments mentioned above.
VII.1 – Quadrupole-based ICP-MS – elemental assay For semi-quantitative analysis (chapter II, § II.9.1), performed on the PerkinElmer Elan
5000 ICP – mass spectrometer, the calibration standard used consisted of the elements
Be, Co, Rh, In, Pb and Th, each present in a concentration of 50 µg L-1, and of which the
intensities corresponding to the isotopes 9Be, 59Co, 103Rh, 115In, 208Pb and 232Th were
monitored to calculate the corresponding relative sensitivity factors. For quantitative
element determinations, several standards with the analytes of interest at different
concentration levels were prepared. The instrumental settings and data acquisition
parameters of the Elan 5000 used for both semi-quantitative and quantitative analysis are
summarized in table VII.1.
VII.2 – ICP-DRC-MS – P, Ca and Sr determination The Servatius – project (chapter X) focuses on Sr isotope ratio analysis of dental tissues
of archaeological interest. As already stated higher (chapter IV, § IV.3.1), it is important
to verify that the Sr analyzed at present is a reflection of the biogenic strontium in the
dental tissues, and that the Sr isotope ratios are not altered by diagenetic Sr arising from
contamination during burial. Bone and dentine are susceptible to diagenesis, while enamel
is more resistant [Kohn et al., 1999; Budd et al., 2000]. One way to assess the significance of
diagenesis is by monitoring the Ca/P ratio of the calcified tissue investigated [Bentley, 2006].

CHAPTER VII – Single-collector – and multi-collector ICP-MS measurement protocols
144
Table VII.1 – (semi-)quantitative analysis using the Elan 5000 ICP – mass spectrometer – (a) instrumental settings; (b) data acquisition parameters
(a) instrumental settings
RF power 1000 W
plasma gas flow rate 15 L min-1
auxiliary gas flow rate 0.8 L min-1
nebulizer gas flow rate 0.80 – 0.85 L min-1*
sampling cone Ni, aperture diameter 1.0 mm
skimmer Ni, aperture diameter 1.0 mm
sample delivery peristaltic pump
sample uptake rate 1 mL min-1
(b) data acquisition parameters
scanning mode peak hopping
dwell time 50 ms
settling time 5 ms
number of acquisition points per spectral peak
1
number of sweeps 20
number of readings 3
number of replicates 5
replicate time ~ 17 s per isotope
detector dead time 69 ns
* daily optimized for (i) maximum sensitivity and (ii) minimal oxide formation
It was argued that if the Ca/P ratio is near its biogenic value, what remains in the bone
tissue is largely the biogenic calcium and strontium [Price et al., 1994; Hoppe et al., 2003;
Bentley, 2006]. Besides the Ca/P ratio, also the Sr concentration had to be determined. A
methodology was hence developed that allowed a simultaneous determination of P, Ca
and Sr in a single instrumental run, so that in the same time, the Sr concentrations of the
digested dental tissues could be determined, along with the Ca/P ratios to evaluate the
occurrence of diagenesis.
VII.2.1 – Selection of the target isotopes of P, Ca and Sr
Dental tissues are largely composed of inorganic carbonate hydroxyapaptite (chapter IV,
§ IV.4.2), which implies that Ca and P are major elements in these tissues. The exact
elemental composition of these tissues is susceptible to variation, but a value of
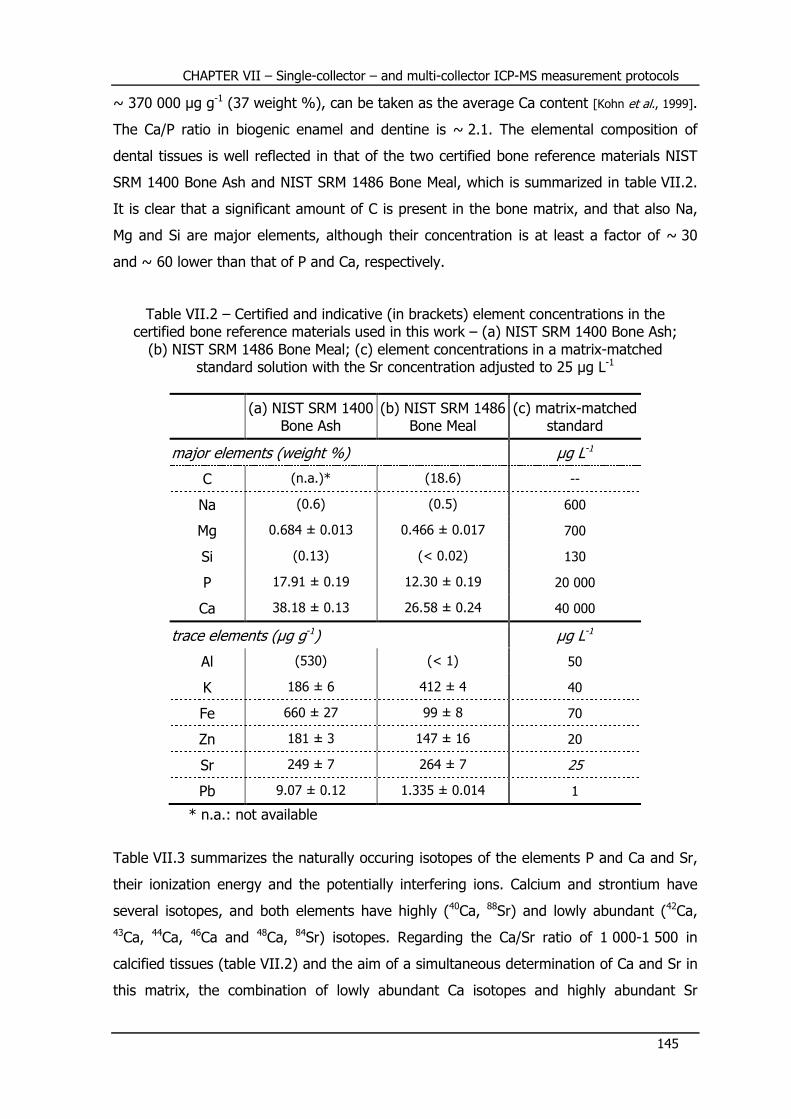
CHAPTER VII – Single-collector – and multi-collector ICP-MS measurement protocols
145
~ 370 000 µg g-1 (37 weight %), can be taken as the average Ca content [Kohn et al., 1999].
The Ca/P ratio in biogenic enamel and dentine is ~ 2.1. The elemental composition of
dental tissues is well reflected in that of the two certified bone reference materials NIST
SRM 1400 Bone Ash and NIST SRM 1486 Bone Meal, which is summarized in table VII.2.
It is clear that a significant amount of C is present in the bone matrix, and that also Na,
Mg and Si are major elements, although their concentration is at least a factor of ~ 30
and ~ 60 lower than that of P and Ca, respectively.
Table VII.2 – Certified and indicative (in brackets) element concentrations in the
certified bone reference materials used in this work – (a) NIST SRM 1400 Bone Ash; (b) NIST SRM 1486 Bone Meal; (c) element concentrations in a matrix-matched
standard solution with the Sr concentration adjusted to 25 µg L-1
(a) NIST SRM 1400 Bone Ash
(b) NIST SRM 1486 Bone Meal
(c) matrix-matched standard
major elements (weight %) µg L-1
C (n.a.)* (18.6) --
Na (0.6) (0.5) 600
Mg 0.684 ± 0.013 0.466 ± 0.017 700
Si (0.13) (< 0.02) 130
P 17.91 ± 0.19 12.30 ± 0.19 20 000
Ca 38.18 ± 0.13 26.58 ± 0.24 40 000
trace elements (µg g-1) µg L-1
Al (530) (< 1) 50
K 186 ± 6 412 ± 4 40
Fe 660 ± 27 99 ± 8 70
Zn 181 ± 3 147 ± 16 20
Sr 249 ± 7 264 ± 7 25
Pb 9.07 ± 0.12 1.335 ± 0.014 1
* n.a.: not available
Table VII.3 summarizes the naturally occuring isotopes of the elements P and Ca and Sr,
their ionization energy and the potentially interfering ions. Calcium and strontium have
several isotopes, and both elements have highly (40Ca, 88Sr) and lowly abundant (42Ca,
43Ca, 44Ca, 46Ca and 48Ca, 84Sr) isotopes. Regarding the Ca/Sr ratio of 1 000-1 500 in
calcified tissues (table VII.2) and the aim of a simultaneous determination of Ca and Sr in
this matrix, the combination of lowly abundant Ca isotopes and highly abundant Sr

CHAPTER VII – Single-collector – and multi-collector ICP-MS measurement protocols
146
isotopes should result in easily measurable count rates that are not excessively high for
either element. The Ca/P ratio of 2.1 implies that also high P concentrations need to be
measured on the only P isotope available. Phosphorus however, is ionized to a much
lesser extent in the ICP because of its very high first ionization energy compared to that
of Ca and Sr (table VII.3), resulting in a much lower P sensitivity. On the basis of these
considerations, it was expected that the simultaneous determination of the mono-isotopic
P, Ca via its low abundant isotopes and Sr via its higher abundant isotopes could be
accomplished.
Table VII.3 – Ionization energy and representative isotopic composition of P, Ca and Sr, potentially interfering ions in Ar ICP-MS and their background-equivalent concentration. Ionization energies from [Moore, 1970]; isotopic abundances from [De Laeter et al., 2003].
ionization energy (eV)
isotope(s) abundance
(%) potential interfering ion(s) BEC (%)
(a) P 10.486 31P 100 14N16O1H+, 15N16O+ 20
(b) Ca 6.113 40Ca 96.941 40Ar+, 40K+ n.d.
42Ca 0.647 14N3+, 26Mg16O+, 40Ar1H2
+, 84Sr2+ 20
43Ca 0.135 14N31H+, 27Al16O+, 86Sr2+ 3
44Ca 2.086 12C16O2+, 14N2
16O+, 28Si16O+, 88Sr2+ 6
46Ca 0.004 14N16O2+ n.d.
48Ca 0.187 31P16O1H+, 36Ar12C+ n.d.
(c) Sr 5.695 84Sr 0.56
see chapter VI, table VI.1.a
n.d.
86Sr 9.86 8
87Sr 7.00 n.d.
88Sr 82.58 9
* n.d.: not determined
Phosphorus suffers from N- and O- based interferences at its m/z ratio of 31. The most
abundant Ca isotope, 40Ca, is spectrally interfered by the intense 40Ar+ peak. The mass
resolution required to resolve these isobaric ions is ~ 200 000, making the 40Ca isotope
inaccessible for determination via standard quadrupole-based and even high resolution
ICP-MS instrumentation. The use of NH3 in a dynamic reaction cell was shown to result in
separation of these isobaric interferences [Hattendorf et al., 2005; Boulyga et al., 2007]. Besides
the 40Ca isotope, also the five other much lower abundant Ca isotopes suffer from spectral
interferences. All of these isotopes are hindered by plasma- and solvent-related
interferences (e.g., ArH2+, N2O
+, NO2+). Because of the very low abundance of 46Ca, and

CHAPTER VII – Single-collector – and multi-collector ICP-MS measurement protocols
147
the potentially important P-based interference (POH+) on 48Ca, it was decided not to
consider the 46Ca and 48Ca isotopes for elemental assay. The isotopes 42Ca, 43Ca and 44Ca
were selected as target Ca isotopes. The interference from Sr2+ on the selected Ca
isotopes was expected as negligible regarding (i) the much lower Sr abundance compared
to the Ca abundance (Ca/Sr = 1 000-1 500) and (ii) the low amount of Sr2+ ions formed
in the ICP (chapter II, § II.9). The importance of the other potentially interfering ions was
experimentally evaluated. The N-, O- and Ar-based interferences were expected to be
more important than the matrix-based interferences (e.g., MgO+, AlO+) because of the
very high relative Ca concentrations.
The low abundance of 84Sr and the isobaric 87Rb interference on 87Sr exclude the use of
these isotopes, leaving 86Sr and 88Sr as target Sr isotopes. These isotopes may be
spectrally interfered by ArCa+ molecular ions (chapter VI, table VI.1.a) and Ca2+ dimers,
especially in the case of dental tissues, where Ca is the major matrix constituent.
In order to obtain a clear insight into the extent to which spectral interferences are
potential problems in the determination of the target elements via the selected isotopes
(31P, 42Ca, 43Ca, 44Ca, 86Sr and 88Sr), so-called ‘background-equivalent concentrations’
(BEC) were determined. The background-equivalent concentration represents the
contribution of interfering ion(s) to the analyte signals, and is expressed as the apparent
analyte concentration caused by the interfering ion(s). The signal intensities at the m/z
ratios corresponding to the Ca isotopes in a matrix-matched standard (table VII.2.c) in
which no Ca is present, can be translated into Ca-equivalent concentrations using the
sensitivity for Ca. An analogous approach was followed for P and Sr, and the background-
equivalent concentrations can be expressed relative to the concentration present, as
summarized in table VII.3. It can be seen that the major interference affects the use of
the 31P and 42Ca isotopes, and amounts to ~ 20 % of the analyte concentration, while the
magnitude of interference is similar (~ 10 % of the analyte concentration) for 44Ca, 86Sr
and 88Sr. Obviously, a measurement protocol is required that provides interference-free
conditions for the determination of the target isotopes.
VII.2.2 – Optimization of ICP-DRC-MS for P, Ca and Sr determination
The use of a quadrupole-based ICP-MS instrument, equipped with a dynamic reaction cell,
allows chemical resolution via selective ion-molecule reactions (chapter II, § II.6.2), as
has already been described for the determination of Ca and P. Methane (CH4) has been
shown as a suitable reaction gas for Ca concentration [Chen and Jiang, 2002; Wu et al., 2003]
CHAPTER VII – Single-collector – and multi-collector ICP-MS measurement protocols
148
and isotope ratio determinations [Stürup et al., 2006], while ammonia (NH3) has been
reported as useful in the measurement of the 44Ca/40Ca ratio [Hattendorf et al., 2005; Boulyga et
al., 2007]. However, the efficiency of NH3 in removing spectral interferences on other
isotopes than 40Ca and 44Ca was not reported yet. Phosphorus determination can be
performed by the oxidation of P+ to PO+ by means of using oxygen (O2) in the dynamic
reaction cell, followed by P determination on m/z 47, corresponding to the 31P16O+ signal
[Wu et al., 2003; Bandura et al., 2004; Yang and Jiang, 2004]. Since the performance of CH4 had
already been studied in detail for Ca isotope ratio determinations [Stürup et al., 2006],
ammonia (NH3) was selected to play the role of reaction gas, and its suitability for
interference-free determination of the Ca isotopes and for the elimination of interfering
molecular ions on 31P+, 86Sr+ and 88Sr+ was evaluated.
When NH3 is used in the dynamic reaction cell, the dominating reaction mechanism that
takes place is a charge-transfer reaction (chapter II, § II.6.2.2.3). Whether or not a
reaction will take place can be estimated by means of the relative first ionization energies.
The ionization energy of Ca and Sr (table VII.3) is lower than that of NH3 (10.3 eV), so
that no charge transfer between Ca+ and Sr+ on one hand and NH3 on the other hand,
can take place. The ionization energies of C, N, O, Ar and molecules that are a
combination of these elements are in the range of 11-16 eV, so that positively charged
ions consisting of the cited atoms can transfer their charge to a neutral NH3 molecule. In
the case of Ar, the Ar+ ions formed in the ICP will react with NH3 in the dynamic reaction
cell, resulting in Ar and NH3+. Next to thermodynamic conditions, also kinetic conditions
must be favorable (chapter II, § II.6.2.2.2). However, it can be taken as a guideline that
in the case of charge transfer reactions, a spontaneous reaction will proceed at a
sufficiently high reaction rate. Interference on Sr is mainly due to ArCa+ ions, and their
reaction behavior with NH3 was experimentally evaluated. Phosphorus has a first
ionization energy that is slightly higher than that of NH3 (table VII.3), so that it is
expected from thermodynamics that P+ will react with NH3 to form P and NH3+. For this
reason, it was expected that a different reaction gas (e.g., O2) would be required for P
determination, so that in what follows below, no optimization for P is described.
VII.2.2.1 – Optimization of the NH3 gas flow rate
The optimum reaction gas flow rate is found where the signal arising from the analyte ion
is maximized with respect to the signal arising from the interfering ion(s). In what follows,
the signal corresponding to the analyte and that corresponding to the interfering ion will

CHAPTER VII – Single-collector – and multi-collector ICP-MS measurement protocols
149
be referred to as ‘signal’ and ‘background’, respectively. Optimizing the reaction gas flow
rate hence consists in determining the maximal signal-to-background ratio, and implies
the fundamental requirement that the analyte and the background show a different
behavior relative to the reaction gas. The ion signal obtained is not a linear function of the
reaction gas flow (pressure). The signal profiles obtained for the analyte, Ca in this case,
are the result of two combined phenomena: (i) collisional focusing/scattering and (ii)
sequential damping of ion energies [Bandura et al., 2001]. As the reaction gas flow rate, and
thus, the pressure in the cell, is increased, the ions migrate towards the axis of the
quadrupole, resulting in an increase in ion transmission efficiency. The detected ion signal
thus increases until scattering losses dominate. Collisions with the gas at higher pressure
cause sequential damping of the ion energy, and the number of collisions that an ion
experiences increases because of a lower velocity of the ions, resulting in a decreasing ion
signal. The background signal will remain nearly unchanged at low gas flow rates, but
with an increasing pressure inside the cell, the interfering ions will react with the reaction
gas, resulting in a decreasing ion signal [Bandura et al., 2001; Tanner et al., 2002].
First, the optimum reaction gas flow rate was determined for Ca. Hereto, an 800 µg L-1 Ca
standard solution in 0.14 M HNO3 was prepared (resulting intensities are referred to as
‘signal’). An 0.14 M HNO3 solution was used to monitor the ‘background’ signals, since the
major interferences expected are N- and O- based and hence arise from the HNO3 matrix
and the ambient air. The NH3 gas flow rate was increased in steps of 0.1 mL min-1 in the
range of 0 to 1 mL min-1. All gas flow rates are expressed in Ar-equivalent units
(chapter II, § II.6.2.1); the conversion factor for NH3 equals 0.56. The experimental
findings are displayed in figure VII.1. As can be seen in these figures, the
signal/background ratio increases with increasing NH3 flow rates. The most drastic
improvement in the signal to background ratio is observed for 42Ca. At NH3 flow rates
above 0.5 mL min-1, the ratio is improved with a factor of ~ 200 compared to vented
mode. The improvement is less pronounced for the other Ca isotopes. An improvement
with a factor of ~ 20 is observed for 43Ca at a flow rate higher than 0.6 mL min-1, while
the signal/background ratio at m/z 44 increases with a factor of ~ 10 over the
optimization range.
A similar optimization was performed for Sr. Hereto, a 25 µg L-1 Sr standard solution and
a 40 mg L-1 Ca background solution, both in 0.14 M HNO3, were prepared and monitored
with increasing NH3 flow rate. The results are displayed in figure VII.2. An improvement in
the signal/background ratio over a factor of 10 is observed for both Sr isotopes at a gas
flow rate of 1 mL min-1 compared to vented mode.

CHAPTER VII – Single-collector – and multi-collector ICP-MS measurement protocols
150
Figure VII.1 – Signal intensities of Ca and interfering ions versus the NH3 flow rate
signal intensity(counts s-1)
0 0.1 0.2 0.3 0.4 0.5 0.6 0.7
102
10
10.8 0.9 1.0
103
104
105
106
0
50
100
150
200
250
intensity ratiosignal background signal/background
(a) 42Ca
0 0.1 0.2 0.3 0.4 0.5 0.6 0.7
102
10
10.8 0.9 1.0
103
104
105
0
50
100
150
200
(b) 43Ca
NH3 flow rate (mL min-1)0 0.1 0.2 0.3 0.4 0.5 0.6 0.7
102
10
10.8 0.9 1.0
103
104
105
106
0
50
100
150
(c) 44Ca

CHAPTER VII – Single-collector – and multi-collector ICP-MS measurement protocols
151
Figure VII.2 – Signal intensities of Sr and interfering ions versus the NH3 flow rate
From the experimental data obtained for the lowly abundant Ca and the highly abundant
Sr isotopes, a compromise value had to be determined for the NH3 flow rate, since the
aim is the simultaneous determination of Ca and Sr. The most significant improvement in
signal-to-background ratio is observed for the 42Ca and 43Ca isotopes, while the
improvement is less pronounced for the 44Ca, 86Sr and 88Sr isotopes. The optimal NH3 flow
rate is found from 0.6 mL min-1 onwards for Ca, while for Sr, a continuous increase of the
signal/background ratio was established, which becomes less pronounced from
0.8 mL min-1. Herefrom, an NH3 flow rate of 0.8 mL min-1 was taken as the compromise
value. Under these conditions, the signal/background ratios are improved with a factor of
~ 200 for 42Ca, ~ 20 for 43Ca and ~ 10 for 44Ca, 86Sr and 88Sr.
signal intensity(counts s-1)
0 0.1 0.2 0.3 0.4 0.5 0.6 0.7
102
10
10.8 0.9 1.0
103
104
105
106
0
50
100
150
intensity ratiosignal background signal/background
(a) 86Sr
NH3 flow rate (mL min-1)0 0.1 0.2 0.3 0.4 0.5 0.6 0.7
102
10
10.8 0.9 1.0
103
104
105
106
0
50
100
150
(b) 88Sr
107
CHAPTER VII – Single-collector – and multi-collector ICP-MS measurement protocols
152
VII.2.2.2 – Optimization of the rejection parameter q (RPq)
The setting of the rejection parameter q (RPq) allows to remove newly formed ions in the
dynamic reaction cell (Chapter II, § II.6.2.2.5). The measurements for optimization of the
NH3 gas flow rate were performed at an RPq setting of 0.45, which is the standard value.
However, in order to remove molecular interfering ions potentially formed inside the
dynamic reaction cell, an optimization of the RPq was carried out. Increasing the RPq
value implies that the low-mass cutoff boundary of the DRC quadrupole bandpass window
is increased. As a consequence, parent ions that give rise to new interfering ions and with
an m/z ratio higher than that removed at an RPq setting of 0.45, are eliminated from the
DRC quadrupole. In order to determine the optimal RPq setting, two matrix-matched
standards (table VII.2) were prepared, and in each standard, either Ca or Sr were omitted
since the aim of the optimization is to obtain the signals arising from interfering ions on
the m/z ratios of these elements. Instead of Ca and Sr, Sc and Rh were respectively
added to the standard in a concentration of 25 µg L-1. The Sc signal at m/z 45 was used
as the reference signal for Ca, while the Rh signal at m/z 103 was used as the reference
signal for Sr. The signal corresponding to Sc and Rh can be referred to as ‘signal’, while
the signal corresponding to interfering ions on m/z ratios of Ca and Sr are referred to as
‘background’. The optimum RPq value is found there where the signal/background ratio
reaches its maximum value. The ion intensities for Sc, Rh and interfering ions on m/z
ratios corresponding to the selected Ca and Sr isotopes were monitored with an RPq
setting ranging from 0.35 to 0.75 in steps of 0.1, and resulted in the diagrams presented
in figure VII.3. A general trend is that the signal/background ratio increases with the RPq
value. Increasing the RPq has the largest influence on the m/z ratio 43. Here, an
improvement of the signal/background ratio of ~ 20 is achieved in the RPq range
monitored. A large jump in the ratio of signal to background is observed at an RPq value
of 0.65, corresponding to the removal of a precursor ion with an m/z ratio around 30.
Suggested candidates are Al, Si and P, that might respectively form 27Al16O+, 29Si14N+ and
31P12C+ in the DRC. The latter seems the least likely since no C was added to the matrix-
matched standard (table VII.2). The identification of the interfering ion was beyond the
aim of this work and hence, not further investigated. The increase in RPq has a smaller
effect on the other m/z values for Ca, and results in an improvement of the
signal/background ratio with a factor of ~ 7 for 42Ca and ~ 15 for 44Ca. The improvement
on the 86Sr and 88Sr isotopes is limited to a factor of ~ 1.5. It follows that the best signal-
to-background ratio is obtained at an RPq value of 0.75 for all target isotopes. However,
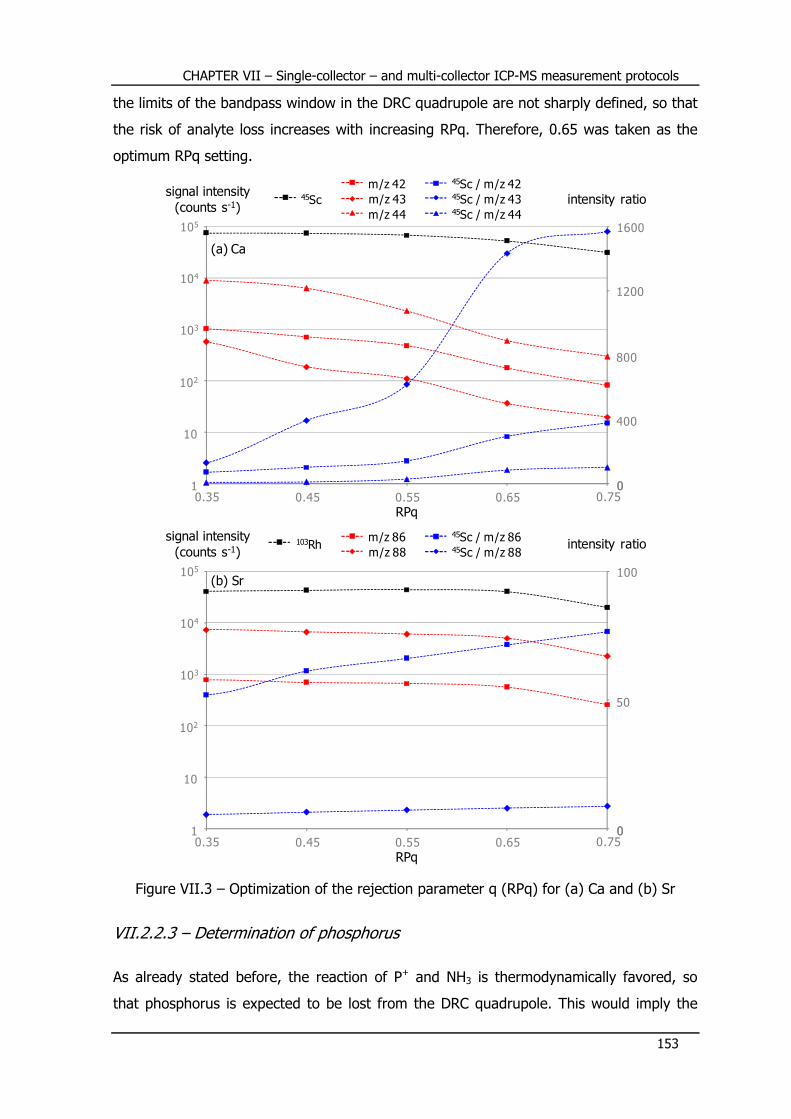
CHAPTER VII – Single-collector – and multi-collector ICP-MS measurement protocols
153
the limits of the bandpass window in the DRC quadrupole are not sharply defined, so that
the risk of analyte loss increases with increasing RPq. Therefore, 0.65 was taken as the
optimum RPq setting.
Figure VII.3 – Optimization of the rejection parameter q (RPq) for (a) Ca and (b) Sr
VII.2.2.3 – Determination of phosphorus
As already stated before, the reaction of P+ and NH3 is thermodynamically favored, so
that phosphorus is expected to be lost from the DRC quadrupole. This would imply the
signal intensity(counts s-1)
0.35 0.45 0.55 0.65
102
10
10.75
103
104
0
800
1200
1600
intensity ratio
(a) 86Sr
45Sc
m/z 42 45Sc / m/z 42m/z 43
m/z 44
45Sc / m/z 4345Sc / m/z 44
RPq
105
0
400
(a) Ca
signal intensity(counts s-1)
0.35 0.45 0.55 0.65
102
10
10.75
103
104
0
50
100
intensity ratio103Rhm/z 86 45Sc / m/z 86m/z 88 45Sc / m/z 88
RPq
105
0
(b) Sr

CHAPTER VII – Single-collector – and multi-collector ICP-MS measurement protocols
154
need of using a different reaction gas, e.g., O2. However, the measurement of standard
solutions containing phosphorus with NH3 in the dynamic reaction cell, introduced at a
flow rate of 0.8 mL min-1, resulted in a linear relation between signal intensity and
concentration. From this observation, it was expected that the determination of
phosphorus is also possible via the measurement protocol developed. A thermodynamical
explanation for the experimental observation could be that the ionization energy of NH3
(10.3 eV) is only slightly lower than that of P (10.5 eV), so that an equilibrium condition is
reached in the conversion of P+ to P. From a kinetic point of view, it seems likely that the
reaction rate of the conversion of NO+ and NOH+ is higher than the conversion rate of P+
to P with NH3, resulting in a suppression of the interfering signal relative to the P+ signal.
A detailed study on the P+ and NO+/NOH+ behavior in the DRC pressurized with NH3 was
beyond the aim of this study, but P was also experimentally determined under the same
conditions as Ca and Sr.
VII.2.3 – Validation of the ICP-DRC-MS measurement protocol
The measurement protocol developed was applied to the simultaneous determination of
P, Ca and Sr in digested certified bone reference materials NIST SRM 1400 Bone Ash and
NIST SRM 1486 Bone Meal. Vanadium and rhodium were selected as internal standards,
where the 51V isotope served as internal standard for P and Ca, while the Sr signals were
referenced to the 103Rh signal. The instrumental settings and data acquisition parameters
for the simultaneous determination of P, Ca and Sr via ICP-DRC-MS with NH3 as a
reaction gas are summarized in table VII.4.
The experimentally obtained P, Ca and Sr concentrations and recoveries for the certified
bone reference materials NIST SRM 1400 Bone Ash and NIST SRM 1486 Bone Meal have
already been summarized in chapter V, table V.3. As can be seen there, the agreement
between the experimental results and the certified values is excellent. The concentrations
reported are the average value of the concentrations found via the individual isotopes,
and the agreement between the individual results is excellent. This implies that a
simultaneous and interference-free determination of the Ca and Sr isotopes is possible,
and that the various interfering molecular ions are successfully removed in the dynamic
reaction cell via chemical resolution. It has not been proven that the interferences on P+
are resolved, but the experimental results show that P determination is nevertheless
successful. Detection limits of the measurement protocol for a bone matrix were found
more than sufficient for the application presented here, and were established as 3 µg L-1

CHAPTER VII – Single-collector – and multi-collector ICP-MS measurement protocols
155
for P, 2 µg L-1 for Ca via its 42Ca, 43Ca and 44Ca isotopes, and 200 ng L-1 for Sr determined
via its 86Sr and 88Sr isotopes.
Table VII.4 – Simultaneous determination of P, Ca and Sr using the Elan DRCplus
ICP – mass spectrometer – (a) instrumental settings;(b) data acquisition parameters; (c) DRC parameters
(a) instrumental settings
RF power 1200 W
plasma gas flow rate 17 L min-1
auxiliary gas flow rate 1.2 L min-1
nebulizer gas flow rate 0.95 – 1.00 L min-1*
sampling cone Ni, aperture diameter 1.1 mm
skimmer Ni, aperture diameter 0.9 mm
extraction lens voltage 10 – 12 V*
sample delivery peristaltic pump
sample uptake rate 1 mL min-1
(b) data acquisition parameters
isotopes monitored 31P, 42Ca, 43Ca, 44Ca, 51V, 86Sr, 88Sr, 103Rh
scanning mode peak hopping
dwell time 50 ms
settling time 3 ms
number of acquisition points per spectral peak
1
number of sweeps 20
number of readings 3
number of replicates 5
replicate time ~ 16 s per isotope
(c) DRC parameters
NH3 gas flow rate 0.8 mL min-1$
RPa 0
RPq 0.65
* daily optimized for maximum sensitivity and < 3% oxide formation $ gas flow rate in Ar-equivalent units. The conversion factor for NH3 equals 0.56.
VII.2.4 – Conclusions
A measurement protocol was developed for the simultaneous determination of P, Ca and
Sr in dental tissues. Hereto, NH3 was used as a reaction gas in the dynamic reaction cell

CHAPTER VII – Single-collector – and multi-collector ICP-MS measurement protocols
156
of a DRC-equipped quadrupole-based ICP – mass spectrometer. It was shown that,
compared to vented mode, a significant improvement of the signal-to-background ratio is
obtained at a gas flow rate of 0.8 mL min-1 in combination with an RPq setting of 0.65,
and that the detection limits for P, Ca and Sr are improved by at least a factor of 10. The
method was validated by application to certified bone reference materials and
demonstrated accurate and reliable. The method was applied to determine the Ca/P ratio
of dental tissues of archaeological interest to evaluate the biogenic integrity of these
tissues after burial (chapter X).
VII.3 – MC-ICP-MS – Sr isotopic composition After extraction chromatographic isolation of Sr (chapter VI, § VI.3.2.1), the purified Sr
fraction of the archaeological samples was present in 0.05 M HNO3. The Sr concentration
was subsequently adjusted to ~ 200 µg L-1 by dilution with 0.14 M HNO3 and the diluted
samples were subsequently submitted to strontium isotope ratio analysis using a Thermo
Electron Neptune (chapter II, § II.8). Instrumental settings and data acquisition
parameters for this instrument are summarized in table VII.5. The instrument was
operated at low resolution mode (R = 400). Strontium isotope ratios were measured
using static multicollection where the cups Low 3, Low 2, Low 1, Axial, High 1 and High 2
were used to monitor the ion intensities corresponding to 83Kr, 84Sr + 84Kr, 85Rb,
86Sr + 86Kr, 87Sr + 87Rb and 88Sr, respectively (table VII.5.b). Data acquisition was done in
30 cycles of 5 s integration, grouped in blocks of 5 cycles. Outliers were removed by the
software on the basis of a 2s-test (95 % confidence interval). A solution of 200 µg L-1 Sr
resulted in a typical total Sr ion beam of 8-10 V. The samples were run using the sample-
standard bracketing technique with a 200 µg L-1 Sr isotopic standard solution of NIST SRM
987 SrCO3, that was previously conducted through the extraction chromatographic
isolation procedure. Blank Sr signals were always negligible compared to the Sr intensities
encountered for standards and samples (< 0.1 %). Between consecutive runs, the sample
introduction system was rinsed a few minutes with 0.14 M HNO3 in order to minimize
memory effects.
Russell’s law (chapter III, equation III.11) was used for mass discrimination correction on
the basis of the invariant 86Sr/88Sr ratio (= 0.1194). The intensity obtained for 83Kr was
used to correct the intensities obtained at m/z 84 and 86 for Kr interferences, using the
numerical 84Kr/83Kr and 86Kr/83Kr ratios of 4.95652 and 1.50435, respectively, and taking
into account mass discrimination on these experimental ratios. The average difference
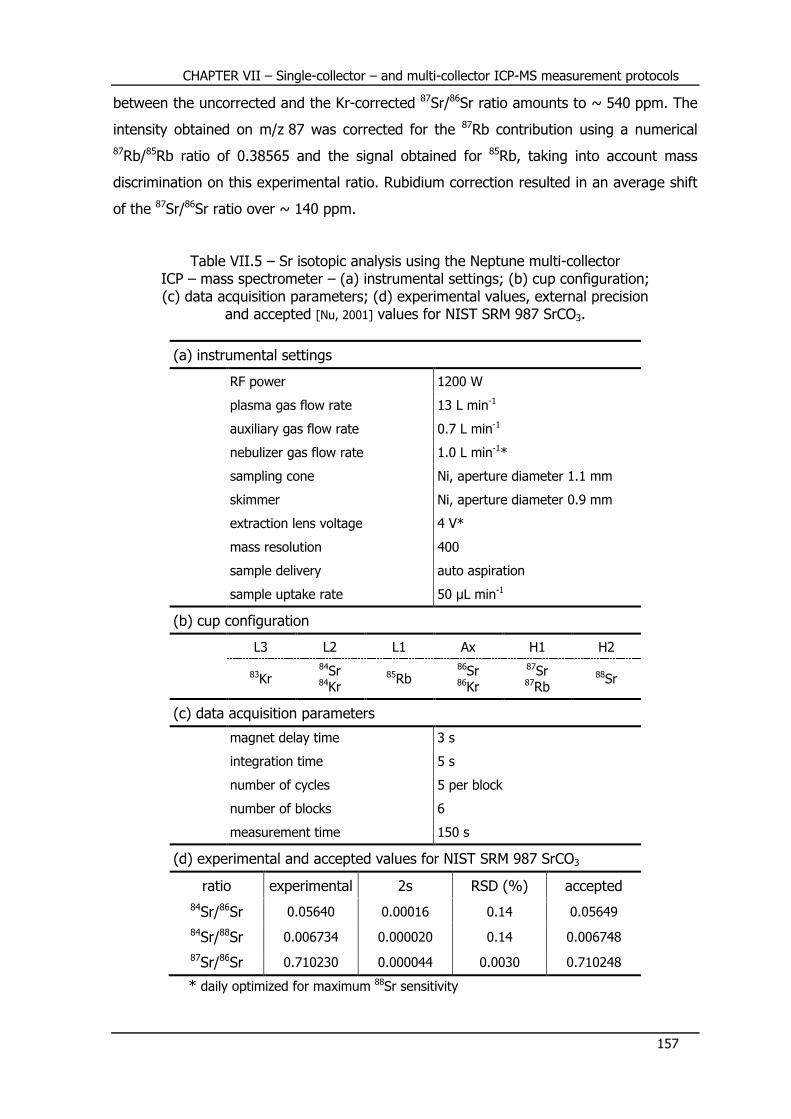
CHAPTER VII – Single-collector – and multi-collector ICP-MS measurement protocols
157
between the uncorrected and the Kr-corrected 87Sr/86Sr ratio amounts to ~ 540 ppm. The
intensity obtained on m/z 87 was corrected for the 87Rb contribution using a numerical
87Rb/85Rb ratio of 0.38565 and the signal obtained for 85Rb, taking into account mass
discrimination on this experimental ratio. Rubidium correction resulted in an average shift
of the 87Sr/86Sr ratio over ~ 140 ppm.
Table VII.5 – Sr isotopic analysis using the Neptune multi-collector
ICP – mass spectrometer – (a) instrumental settings; (b) cup configuration; (c) data acquisition parameters; (d) experimental values, external precision
and accepted [Nu, 2001] values for NIST SRM 987 SrCO3.
(a) instrumental settings
RF power 1200 W
plasma gas flow rate 13 L min-1
auxiliary gas flow rate 0.7 L min-1
nebulizer gas flow rate 1.0 L min-1*
sampling cone Ni, aperture diameter 1.1 mm
skimmer Ni, aperture diameter 0.9 mm
extraction lens voltage 4 V*
mass resolution 400
sample delivery auto aspiration
sample uptake rate 50 µL min-1
(b) cup configuration
L3 L2 L1 Ax H1 H2
83Kr 84Sr 84Kr
85Rb 86Sr 86Kr
87Sr 87Rb
88Sr
(c) data acquisition parameters
magnet delay time 3 s
integration time 5 s
number of cycles 5 per block
number of blocks 6
measurement time 150 s
(d) experimental and accepted values for NIST SRM 987 SrCO3
ratio experimental 2s RSD (%) accepted
84Sr/86Sr 0.05640 0.00016 0.14 0.05649
84Sr/88Sr 0.006734 0.000020 0.14 0.006748
87Sr/86Sr 0.710230 0.000044 0.0030 0.710248
* daily optimized for maximum 88Sr sensitivity
CHAPTER VII – Single-collector – and multi-collector ICP-MS measurement protocols
158
The external precision of the measurement protocol was calculated on the basis of the
mass discrimination corrected values retrieved for the NIST SRM 987 SrCO3 isotopic
standard throughout the entire measurement session (3 days). An external precision of
30 ppm (0.003 % RSD) was established on the 87Sr/86Sr ratio, and of 1 400 ppm
(0.14 % RSD) on the 84Sr/86Sr and 84Sr/88Sr ratios (table VII.5.d). Within the external
precision, the experimental values retrieved for NIST SRM 987 SrCO3 are in excellent
agreement with the accepted literature values [Thirlwall, 1991; Walder and Freedman, 1992; Nu,
2001; Faure and Mensing, 2005].
VII.4 – MC-ICP-MS – Pb isotopic composition After the Pb isolation procedure (chapter VI, § VI.4.2), the Pb fraction of the
archaeological samples was present in a 0.05 M (NH4)2C2O4 solution. In order to remove
the ammonium oxalate present in the Pb fractions prior to multi-collector ICP-MS Pb
isotope ratio analysis, an aliquot of the sample was evaporated to dryness, followed by
addition of 1 mL 14 M HNO3 + 1 mL 10 M H2O2. After a few hours, the sample was
evaporated to dryness again. Finally, the residue was taken up in 0.5 M HNO3 + 0.2 M HF,
thereby adjusting the Pb concentration to ~ 30 µg L-1. Thallium (NIST SRM 997 Thallium
isotopic standard) was added in a concentration of ~ 7.5 µg L-1, resulting in a Pb/Tl ratio
of ~ 4.
The Pb isotope ratios reported in this work were obtained using a Nu Instruments’ Nu
Plasma 500 (chapter II, § II.8). Instrumental settings and data acquisition parameters for
this instrument are summarized in table VII.6. The instrument was run at a standard
mass resolution of 450. Lead isotope ratio measurements were carried out by static
multicollection, where the detectors Low 4, Low 3, Low 2, Low 1, Axial, High 1 and High 2
were used to record the ion intensities of 202Hg, 203Tl, 204Pb + 204Hg, 205Tl, 206Pb, 207Pb and
208Pb, respectively. Data acquisition was done in 60 cycles of 5 s integration, grouped in
blocks of 20 cycles. Outliers were removed by the software on the basis of a 2s-test
(95 % confidence interval). A 30 µg L-1 Pb solution doped with 7.5 µg L-1 Tl typically
yielded a Pb total ion beam intensity of 5-7 10-11 A. The samples were run using the
sample-standard bracketing technique with a 30 µg L-1 Pb isotopic standard solution of
NIST SRM 981 Common Lead, that was previously conducted through the extraction
chromatographic isolation procedure, doped with 7.5 µg L-1 Tl (NIST SRM 997 Thallium
isotopic standard). The intensity measured at m/z 204 was corrected for the
204Hg interference using a 204Hg/202Hg ratio of 0.229. The 204Hg/204Pb ratio was found as

CHAPTER VII – Single-collector – and multi-collector ICP-MS measurement protocols
159
Table VII.6 – Pb isotopic analysis using the Nu Plasma 500 multi-collector ICP – mass spectrometer – (a) instrumental settings; (b) cup configuration; (c) data acquisition parameters; (d) experimental values, external precision
and accepted [Galer and Abouchami, 1998] values for NIST SRM 981 Common Lead.
(a) instrumental settings
RF power 1300 W
plasma gas flow rate 13 L min-1
auxiliary gas flow rate 0.7 L min-1
nebulizer gas flow rate 1.0 L min-1*
sampling cone Ni, aperture diameter 1.1 mm
skimmer Ni, aperture diameter 0.9 mm
extraction lens voltage 4 V*
mass resolution 450
sample delivery auto aspiration (Aridus)
sample uptake rate 80 µL min-1
(b) cup configuration
L4 L3 L2 L1 Ax H1 H2
202Hg 203Tl 204Pb 204Hg
205Tl 206Pb 207Pb 208Pb
(c) data acquisition parameters
magnet delay time 3 s
integration time 5 s
number of cycles 20 per block
number of blocks 3
measurement time 300 s
(d) experimental and accepted values for NIST SRM 981 Common Lead
ratio experimental 2s RSD (%) accepted
206Pb/204Pb 16.9436 0.0064 0.0188 16.9405
207Pb/204Pb 15.4995 0.0054 0.0176 15.4963
208Pb/204Pb 36.7305 0.0139 0.0189 36.7219
207Pb/206Pb 0.91478 0.00009 0.0050 0.91475
208Pb/206Pb 2.16771 0.00019 0.0044 2.16771
208Pb/207Pb 2.3697 0.0002 0.0039 2.3697
* daily optimized for maximum 208Pb sensitivity
negligible in all the samples investigated (average: 4 10-5). Blank Pb signals always were
below 1 %, and in most cases, even less than 0.1 % of the Pb signals encountered for
samples and standards. Thus, blank contributions could be neglected, but for the sake of

CHAPTER VII – Single-collector – and multi-collector ICP-MS measurement protocols
160
consistency, a blank correction was always performed. Between two consecutive runs, the
sample introduction system was rinsed with 0.5 M HNO3 for a few minutes in order to
minimize memory effects.
Mass discrimination correction was performed via Russell’s law (chapter III,
equation III.11) following the empirical method first described for Cu and Zn isotopes
[Maréchal et al., 1999] applied to Pb and Tl isotopes [White et al., 2000]. Russell’s equation was
used to calculate the mass discrimination factors βTl and βPb using the certified
205Tl/203Tl ratio of 2.38714 for NIST SRM 997 Thallium isotopic standard and the accepted
208Pb/206Pb ratio of 2.16771 for NIST SRM 981 Common Lead [Galer and Abouchami, 1998],
respectively. Plotting βPb versus βTl for the standard solution, obtained throughout the
entire measurement session resulted in a linear relation. This relation was used to
calculate the mass discrimination factor βPb for every unknown sample from the
corresponding experimentally determined βTl value for that sample, and the mass
discrimination factor βPb was subsequently used to calculate the true Pb isotope ratios.
The external precision reported on the samples was calculated by means of the Pb
isotope ratios obtained for the NIST SRM 981 Common Lead standard during the entire
measurement session (5 days), and was established to be 180-190 ppm (0.018-
0.019 % RSD) for the ratios with 204Pb, and 40-50 ppm (0.004-0.005 % RSD) for the
other ratios (table VII.6.d). Within the external precision, the average Pb isotope ratios
obtained for NIST SRM 981 Common Lead throughout the entire session match the
accepted values [Galer and Abouchami, 1998] very well.
VII.5 – SC-ICP-DRC-MS – Pb isotopic composition As already discussed higher (chapter III, § III.3.1), the use of a non-reactive collision gas
(e.g., Ne, Ar) in the dynamic reaction cell of a single-collector quadrupole-based ICP-MS
instrument results in an improved isotope ratio precision [Bandura and Tanner, 1999; Bandura et
al., 2000]. Ions extracted from the ICP on slightly different moments are mixed in the cell,
thereby mitigating the effect of short-term fluctuations on the measured isotope ratio and
resulting in a better isotope ratio precision [Bandura and Tanner, 1999; Bandura et al., 2000]. A
measurement protocol for Pb isotope ratio determination via single-collector ICP –
dynamic reaction cell – MS (SC-ICP-DRC-MS) was developed, on the basis of the use of a
collision gas in the DRC in order to obtain improved isotope ratio precisions
(< 0.2 % RSD) on Pb isotopic compositions compared to the precision attainable with
standard quadrupole-based ICP-MS.
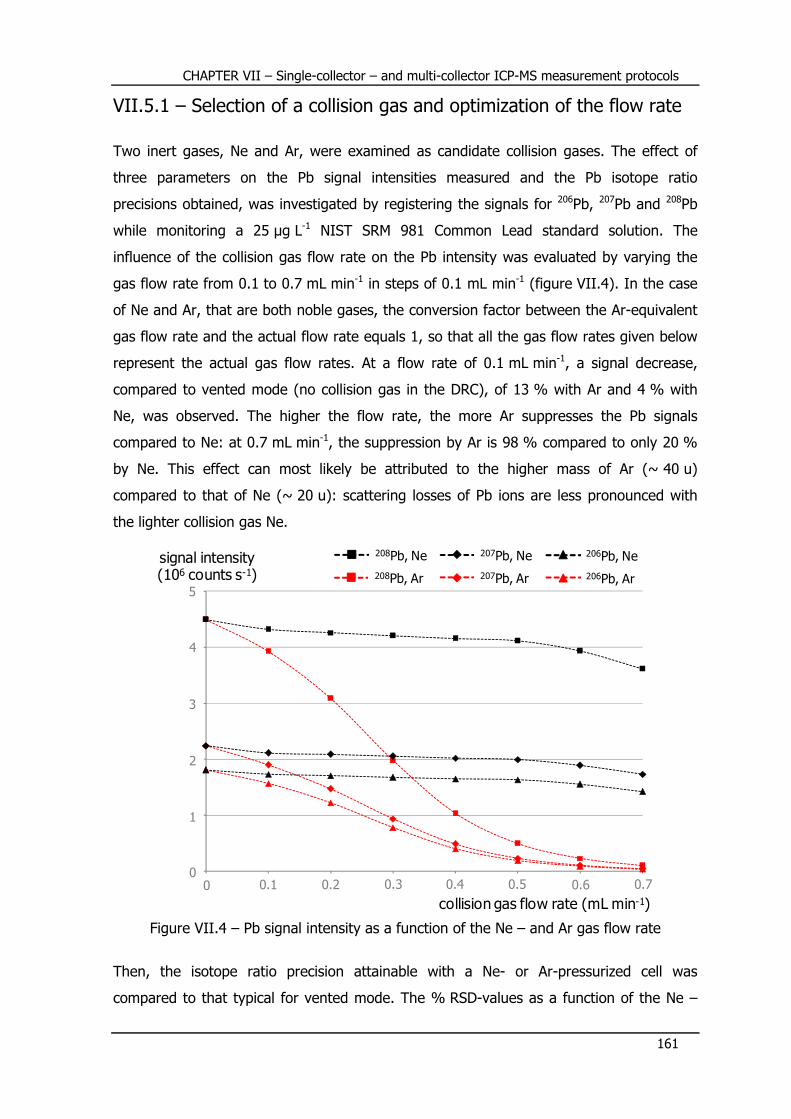
CHAPTER VII – Single-collector – and multi-collector ICP-MS measurement protocols
161
VII.5.1 – Selection of a collision gas and optimization of the flow rate
Two inert gases, Ne and Ar, were examined as candidate collision gases. The effect of
three parameters on the Pb signal intensities measured and the Pb isotope ratio
precisions obtained, was investigated by registering the signals for 206Pb, 207Pb and 208Pb
while monitoring a 25 µg L-1 NIST SRM 981 Common Lead standard solution. The
influence of the collision gas flow rate on the Pb intensity was evaluated by varying the
gas flow rate from 0.1 to 0.7 mL min-1 in steps of 0.1 mL min-1 (figure VII.4). In the case
of Ne and Ar, that are both noble gases, the conversion factor between the Ar-equivalent
gas flow rate and the actual flow rate equals 1, so that all the gas flow rates given below
represent the actual gas flow rates. At a flow rate of 0.1 mL min-1, a signal decrease,
compared to vented mode (no collision gas in the DRC), of 13 % with Ar and 4 % with
Ne, was observed. The higher the flow rate, the more Ar suppresses the Pb signals
compared to Ne: at 0.7 mL min-1, the suppression by Ar is 98 % compared to only 20 %
by Ne. This effect can most likely be attributed to the higher mass of Ar (~ 40 u)
compared to that of Ne (~ 20 u): scattering losses of Pb ions are less pronounced with
the lighter collision gas Ne.
Figure VII.4 – Pb signal intensity as a function of the Ne – and Ar gas flow rate
Then, the isotope ratio precision attainable with a Ne- or Ar-pressurized cell was
compared to that typical for vented mode. The % RSD-values as a function of the Ne –
0 0.1 0.2 0.3 0.4 0.5 0.6 0.7
5
signal intensity(106 counts s-1)
collision gas flow rate (mL min-1)
4
3
2
1
0
208Pb, Ne
208Pb, Ar
207Pb, Ne
207Pb, Ar
206Pb, Ne
206Pb, Ar
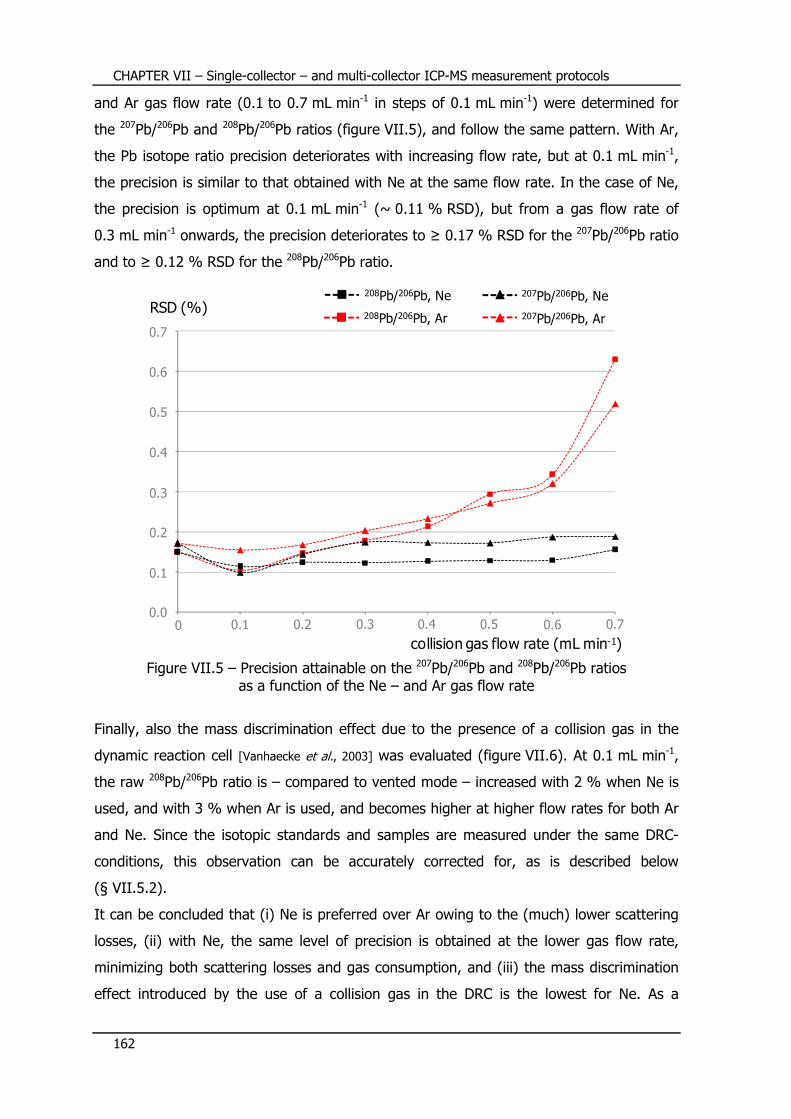
CHAPTER VII – Single-collector – and multi-collector ICP-MS measurement protocols
162
and Ar gas flow rate (0.1 to 0.7 mL min-1 in steps of 0.1 mL min-1) were determined for
the 207Pb/206Pb and 208Pb/206Pb ratios (figure VII.5), and follow the same pattern. With Ar,
the Pb isotope ratio precision deteriorates with increasing flow rate, but at 0.1 mL min-1,
the precision is similar to that obtained with Ne at the same flow rate. In the case of Ne,
the precision is optimum at 0.1 mL min-1 (~ 0.11 % RSD), but from a gas flow rate of
0.3 mL min-1 onwards, the precision deteriorates to ≥ 0.17 % RSD for the 207Pb/206Pb ratio
and to ≥ 0.12 % RSD for the 208Pb/206Pb ratio.
Figure VII.5 – Precision attainable on the 207Pb/206Pb and 208Pb/206Pb ratios
as a function of the Ne – and Ar gas flow rate
Finally, also the mass discrimination effect due to the presence of a collision gas in the
dynamic reaction cell [Vanhaecke et al., 2003] was evaluated (figure VII.6). At 0.1 mL min-1,
the raw 208Pb/206Pb ratio is – compared to vented mode – increased with 2 % when Ne is
used, and with 3 % when Ar is used, and becomes higher at higher flow rates for both Ar
and Ne. Since the isotopic standards and samples are measured under the same DRC-
conditions, this observation can be accurately corrected for, as is described below
(§ VII.5.2).
It can be concluded that (i) Ne is preferred over Ar owing to the (much) lower scattering
losses, (ii) with Ne, the same level of precision is obtained at the lower gas flow rate,
minimizing both scattering losses and gas consumption, and (iii) the mass discrimination
effect introduced by the use of a collision gas in the DRC is the lowest for Ne. As a
0 0.1 0.2 0.3 0.4 0.5 0.6 0.7
0.5
RSD (%)
collision gas flow rate (mL min-1)
0.4
0.3
0.2
0.1
0.0
208Pb/206Pb, Ne
208Pb/206Pb, Ar
207Pb/206Pb, Ne
207Pb/206Pb, Ar
0.6
0.7
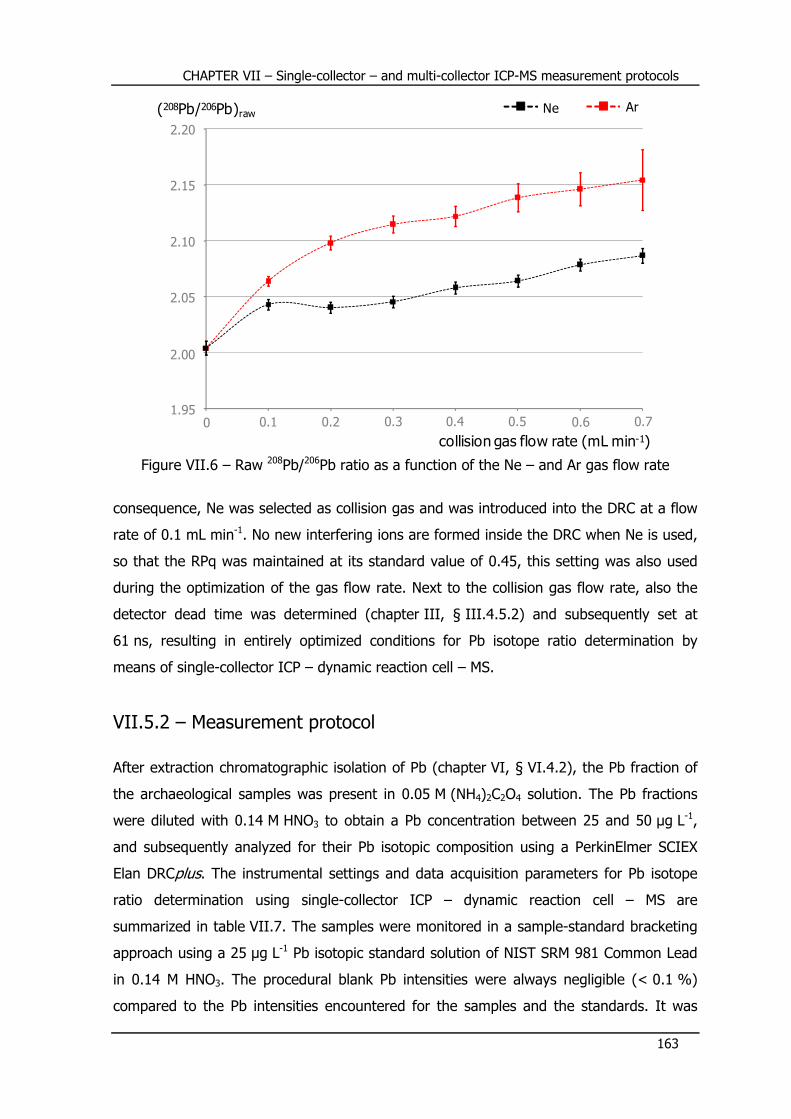
CHAPTER VII – Single-collector – and multi-collector ICP-MS measurement protocols
163
Figure VII.6 – Raw 208Pb/206Pb ratio as a function of the Ne – and Ar gas flow rate
consequence, Ne was selected as collision gas and was introduced into the DRC at a flow
rate of 0.1 mL min-1. No new interfering ions are formed inside the DRC when Ne is used,
so that the RPq was maintained at its standard value of 0.45, this setting was also used
during the optimization of the gas flow rate. Next to the collision gas flow rate, also the
detector dead time was determined (chapter III, § III.4.5.2) and subsequently set at
61 ns, resulting in entirely optimized conditions for Pb isotope ratio determination by
means of single-collector ICP – dynamic reaction cell – MS.
VII.5.2 – Measurement protocol
After extraction chromatographic isolation of Pb (chapter VI, § VI.4.2), the Pb fraction of
the archaeological samples was present in 0.05 M (NH4)2C2O4 solution. The Pb fractions
were diluted with 0.14 M HNO3 to obtain a Pb concentration between 25 and 50 µg L-1,
and subsequently analyzed for their Pb isotopic composition using a PerkinElmer SCIEX
Elan DRCplus. The instrumental settings and data acquisition parameters for Pb isotope
ratio determination using single-collector ICP – dynamic reaction cell – MS are
summarized in table VII.7. The samples were monitored in a sample-standard bracketing
approach using a 25 µg L-1 Pb isotopic standard solution of NIST SRM 981 Common Lead
in 0.14 M HNO3. The procedural blank Pb intensities were always negligible (< 0.1 %)
compared to the Pb intensities encountered for the samples and the standards. It was
0 0.1 0.2 0.3 0.4 0.5 0.6 0.7
(208Pb/206Pb)raw
collision gas flow rate (mL min-1)
2.10
2.15
2.05
2.00
1.95
Ne Ar
2.20

CHAPTER VII – Single-collector – and multi-collector ICP-MS measurement protocols
164
Table VII.7 – Pb isotopic analysis using the Elan DRCplus ICP – mass spectrometer – (a) instrumental settings; (b) data acquisition parameters; (c) DRC parameters; (d) experimental values, external precision and accepted [Galer and Abouchami, 1998]
values for NIST SRM 981 Common Lead.
(a) instrumental settings
RF power 1200 W
plasma gas flow rate 17 L min-1
auxiliary gas flow rate 1.2 L min-1
nebulizer gas flow rate 0.95 – 1.00 L min-1*
sampling cone Ni, aperture diameter 1.1 mm
skimmer Ni, aperture diameter 0.9 mm
extraction lens voltage 10 – 12 V*
sample delivery peristaltic pump
sample uptake rate 1 mL min-1
(b) data acquisition parameters
isotopes monitored 204Pb, 206Pb, 207Pb, 208Pb
scanning mode peak hopping
dwell time 2 ms
settling time 200 µs
number of acquitition points per spectral peak
1
number of sweeps 500
number of readings 10
number of replicates 15, final 10 taken into account
replicate time ~ 46 s
detector dead time 61 ns
(c) DRC parameters
Ne gas flow rate 0.1 mL min-1$
RPa 0
RPq 0.45
(d) experimental and accepted values for NIST SRM 981 Common Lead
ratio experimental 2s RSD (%) accepted
206Pb/204Pb 16.9410 0.0537 0.16 16.9405
207Pb/204Pb 15.4967 0.0469 0.15 15.4963
208Pb/204Pb 36.7230 0.1228 0.17 36.7219
207Pb/206Pb 0.91474 0.00172 0.09 0.91475
208Pb/206Pb 2.16771 0.00256 0.06 2.16771
208Pb/207Pb 2.3698 0.0036 0.08 2.3697
* daily optimized for maximum 208Pb sensitivity; $ actual gas flow rate

CHAPTER VII – Single-collector – and multi-collector ICP-MS measurement protocols
165
observed that the same isotope ratios were obtained with and without blank correction.
However, a blank correction was always consistently performed.
Data acquisition consisted of 15 replicates of ~ 46 s each, establishing a total sample
measurement time of ~ 11 min. When the DRC is pressurized, the cell opens/closes at the
start/end of every sample measurement, causing a ‘delay time’ before a homogeneous
pressure within the cell is established again. As a consequence, considerable signal
fluctuations can occur during the first 2-4 replicates, resulting in an isotope ratio precision
that is up to 0.04 % RSD better when only the final 10 replicates are considered. Thus,
only replicates 6 to 15 were used for isotope ratio calculations, and the measurement
time for the first 5 replicates should be regarded as a stabilization time. The 206Pb/204Pb,
207Pb/204Pb, 208Pb/204Pb, 207Pb/206Pb, 208Pb/206Pb and 208Pb/207Pb intensity ratios for the
10 replicates for both standards and samples were calculated. A Q-test on the 95 %
confidence interval was performed, but the occurrence of outliers was sporadic. The
average and the corresponding 2s uncertainty interval and relative standard deviation
(% RSD) were calculated from the 10 replicates for every sample and standard. Mass
discrimination correction was performed by external standardization (sample-standard
bracketing, chapter III, § III.4.2.2.2), and the sample ratios were calculated using
equation III.13, with the accepted values for NIST SRM 981 Common Lead [Galer and
Abouchami, 1998] as reference values.
The external precision of the measurement protocol was calculated on the basis of the
mass discrimination corrected Pb isotope ratios for the NIST SRM 981 Common Lead
standard. As the Pb concentration for the measured samples (25-50 µg L-1) is equal to or
higher than that for the isotopic standard (25 µg L-1), the external precision calculated
from the standards can be regarded as a ‘worst case’ limit for the precision attainable for
the samples (counting statistics). The external precision was established to be typically
0.15-0.17 % RSD for ratios with 204Pb (206Pb/204Pb, 207Pb/204Pb and 208Pb/204Pb), and 0.06-
0.09 % RSD for the ratios 207Pb/206Pb, 208Pb/206Pb and 208Pb/207Pb (table VII.7.d).
VII.5.3 – Validation of the SC-ICP-DRC-MS measurement protocol
The accuracy of the single-collector ICP-DRC-MS measurement protocol developed has
been validated by comparing the data obtained to the corresponding values obtained via
multi-collector ICP-MS. The accuracy and reproducibility of the entire method developed
for Pb isotope ratio analysis (Pb isolation (chapter VI, § VI.4.2) + single-collector ICP-
DRC-MS measurement) has been validated by (i) duplicate analyses of bone and soil
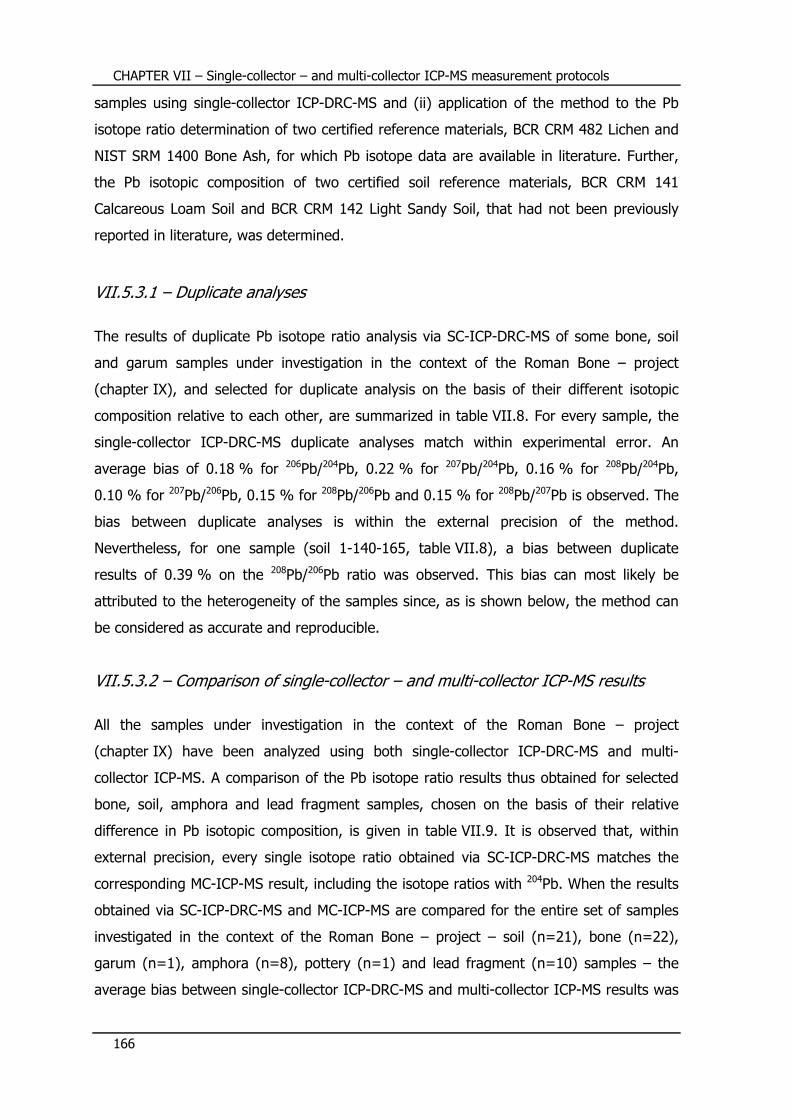
CHAPTER VII – Single-collector – and multi-collector ICP-MS measurement protocols
166
samples using single-collector ICP-DRC-MS and (ii) application of the method to the Pb
isotope ratio determination of two certified reference materials, BCR CRM 482 Lichen and
NIST SRM 1400 Bone Ash, for which Pb isotope data are available in literature. Further,
the Pb isotopic composition of two certified soil reference materials, BCR CRM 141
Calcareous Loam Soil and BCR CRM 142 Light Sandy Soil, that had not been previously
reported in literature, was determined.
VII.5.3.1 – Duplicate analyses
The results of duplicate Pb isotope ratio analysis via SC-ICP-DRC-MS of some bone, soil
and garum samples under investigation in the context of the Roman Bone – project
(chapter IX), and selected for duplicate analysis on the basis of their different isotopic
composition relative to each other, are summarized in table VII.8. For every sample, the
single-collector ICP-DRC-MS duplicate analyses match within experimental error. An
average bias of 0.18 % for 206Pb/204Pb, 0.22 % for 207Pb/204Pb, 0.16 % for 208Pb/204Pb,
0.10 % for 207Pb/206Pb, 0.15 % for 208Pb/206Pb and 0.15 % for 208Pb/207Pb is observed. The
bias between duplicate analyses is within the external precision of the method.
Nevertheless, for one sample (soil 1-140-165, table VII.8), a bias between duplicate
results of 0.39 % on the 208Pb/206Pb ratio was observed. This bias can most likely be
attributed to the heterogeneity of the samples since, as is shown below, the method can
be considered as accurate and reproducible.
VII.5.3.2 – Comparison of single-collector – and multi-collector ICP-MS results
All the samples under investigation in the context of the Roman Bone – project
(chapter IX) have been analyzed using both single-collector ICP-DRC-MS and multi-
collector ICP-MS. A comparison of the Pb isotope ratio results thus obtained for selected
bone, soil, amphora and lead fragment samples, chosen on the basis of their relative
difference in Pb isotopic composition, is given in table VII.9. It is observed that, within
external precision, every single isotope ratio obtained via SC-ICP-DRC-MS matches the
corresponding MC-ICP-MS result, including the isotope ratios with 204Pb. When the results
obtained via SC-ICP-DRC-MS and MC-ICP-MS are compared for the entire set of samples
investigated in the context of the Roman Bone – project – soil (n=21), bone (n=22),
garum (n=1), amphora (n=8), pottery (n=1) and lead fragment (n=10) samples – the
average bias between single-collector ICP-DRC-MS and multi-collector ICP-MS results was

CHAPTER VII –
Single-co
llecto
r – and m
ulti-co
llecto
r ICP-M
S m
easurement p
rotocols
167
Table VII.8
– Results o
f duplica
te Pb iso
tope ra
tio analysis via
SC-IC
P-DRC-M
S of
selecte
d sa
mples in
vestig
ated in
the co
ntext o
f the Roman Bone – project
208Pb/207Pb
0.0036
2.4721
2.4777
2.4722
2.4756
2.4741
2.4704
2.4627
2.4666
2.4586
2.4626
2.4484
2.4539
2.4588
2.4620
2.4564
2.4561
208Pb/206Pb
0.0026
2.0527
2.0607
2.0566
2.0605
2.0611
2.0629
2.0742
2.0780
2.0671
2.0684
2.0792
2.0810
2.0733
2.0768
2.0853
2.0845
207Pb/206Pb
0.0017
0.8300
0.8317
0.8324
0.8323
0.8331
0.8343
0.8437
0.8425
0.8408
0.8399
0.8473
0.8482
0.8445
0.8438
0.8489
0.8487
208Pb/204Pb
0.123
38.803
38.794
38.695
38.729
38.770
38.721
38.489
38.591
38.537
38.478
38.467
38.376
38.308
38.436
38.438
38.430
207Pb/204Pb
0.047
15.693
15.652
15.626
15.617
15.677
15.633
15.692
15.640
15.688
15.615
15.613
15.639
15.631
15.612
15.635
15.647
206Pb/204Pb
0.054
18.899
18.819
18.815
18.764
18.809
18.781
18.557
18.565
18.644
18.590
18.415
18.438
18.509
18.508
18.416
18.436
2s
1
2
1
2
1
2
1
2
1
2
1
2
1
2
1
2
soil samples
1-140-165
6-265-328
59-43-63
bone samples
1-140-165
6-265-328
51-54-165
59-43-63
garum
13-2-236
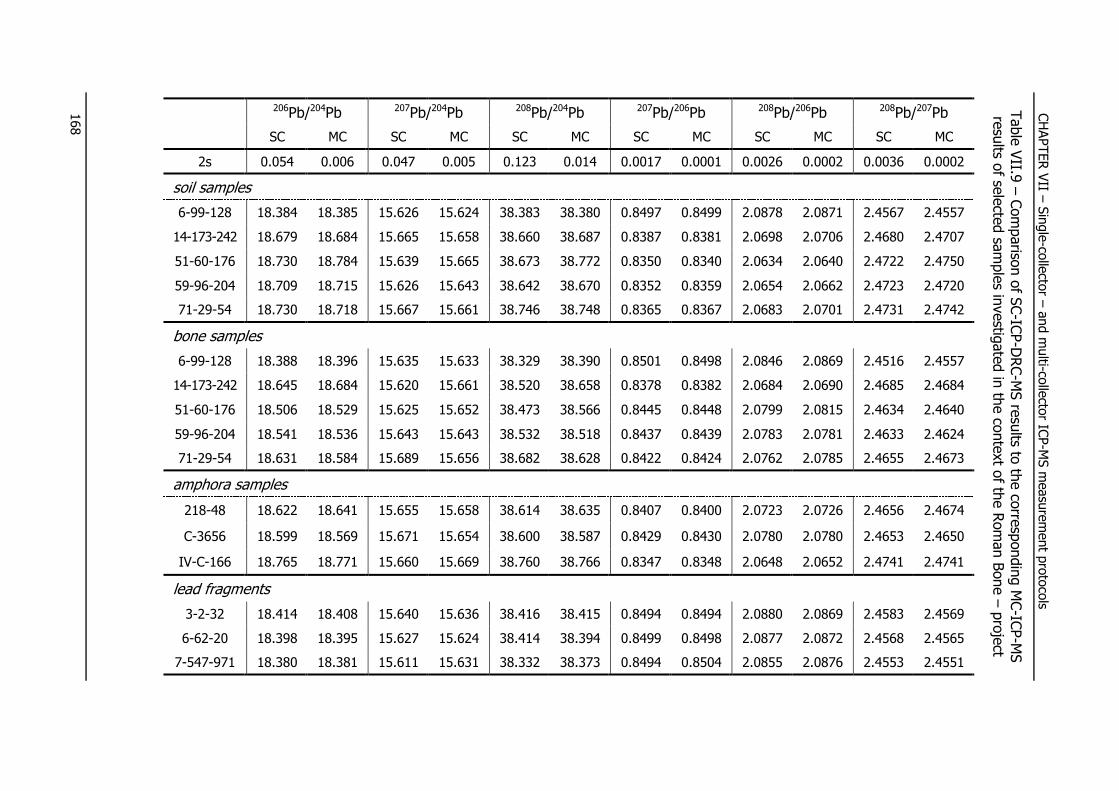
CHAPTER VII –
Single-co
llecto
r – and m
ulti-co
llecto
r ICP-M
S m
easurement p
rotocols
168
Table VII.9
– Compariso
n of S
C-IC
P-DRC-M
S re
sults to
the co
rresponding MC-IC
P-M
S
results o
f selecte
d sa
mples in
vestig
ated in
the co
ntext o
f the Roman Bone – project
208Pb/207Pb
MC
0.0002
2.4557
2.4707
2.4750
2.4720
2.4742
2.4557
2.4684
2.4640
2.4624
2.4673
2.4674
2.4650
2.4741
2.4569
2.4565
2.4551
SC
0.0036
2.4567
2.4680
2.4722
2.4723
2.4731
2.4516
2.4685
2.4634
2.4633
2.4655
2.4656
2.4653
2.4741
2.4583
2.4568
2.4553
208Pb/206Pb
MC
0.0002
2.0871
2.0706
2.0640
2.0662
2.0701
2.0869
2.0690
2.0815
2.0781
2.0785
2.0726
2.0780
2.0652
2.0869
2.0872
2.0876
SC
0.0026
2.0878
2.0698
2.0634
2.0654
2.0683
2.0846
2.0684
2.0799
2.0783
2.0762
2.0723
2.0780
2.0648
2.0880
2.0877
2.0855
207Pb/206Pb
MC
0.0001
0.8499
0.8381
0.8340
0.8359
0.8367
0.8498
0.8382
0.8448
0.8439
0.8424
0.8400
0.8430
0.8348
0.8494
0.8498
0.8504
SC
0.0017
0.8497
0.8387
0.8350
0.8352
0.8365
0.8501
0.8378
0.8445
0.8437
0.8422
0.8407
0.8429
0.8347
0.8494
0.8499
0.8494
208Pb/204Pb
MC
0.014
38.380
38.687
38.772
38.670
38.748
38.390
38.658
38.566
38.518
38.628
38.635
38.587
38.766
38.415
38.394
38.373
SC
0.123
38.383
38.660
38.673
38.642
38.746
38.329
38.520
38.473
38.532
38.682
38.614
38.600
38.760
38.416
38.414
38.332
207Pb/204Pb
MC
0.005
15.624
15.658
15.665
15.643
15.661
15.633
15.661
15.652
15.643
15.656
15.658
15.654
15.669
15.636
15.624
15.631
SC
0.047
15.626
15.665
15.639
15.626
15.667
15.635
15.620
15.625
15.643
15.689
15.655
15.671
15.660
15.640
15.627
15.611
206Pb/204Pb
MC
0.006
18.385
18.684
18.784
18.715
18.718
18.396
18.684
18.529
18.536
18.584
18.641
18.569
18.771
18.408
18.395
18.381
SC
0.054
soil samples
18.384
18.679
18.730
18.709
18.730
bone samples
18.388
18.645
18.506
18.541
18.631
amphora samples
18.622
18.599
18.765
lead fragments
18.414
18.398
18.380
2s
6-99-128
14-173-242
51-60-176
59-96-204
71-29-54
6-99-128
14-173-242
51-60-176
59-96-204
71-29-54
218-48
C-3656
IV-C-166
3-2-32
6-62-20
7-547-971
CHAPTER VII – Single-collector – and multi-collector ICP-MS measurement protocols
169
established to be 0.1 % for ratios with 204Pb, and 0.05 % for the other ratios, values that
are well within the external precision of the single-collector ICP-DRC-MS measurement
protocol (table VII.7.d). Further, the dispersion of Pb isotope ratios among the displayed
set (table VII.8 and table VII.9) and the entire set (chapter IX, tables IX.1-IX.3) of
samples under investigation in the context of the Roman Bone – project is larger than the
attainable precision via SC-ICP-DRC-MS (table VII.7.d). Also for Pb isotope ratio analysis
of metallic artefacts in the context of the ed-Dur – project (chapter VIII), the Pb isotope
ratio precision offered by the SC-ICP-DRC-MS measurement protocol is sufficient. As a
conclusion, it can be stated that the single-collector ICP-DRC-MS measurement protocol,
developed for the purpose of Pb isotope ratio analysis of archaeological artefacts, leads to
accurate results and is fit-for-purpose.
VII.5.3.3 – Pb isotope ratio determination in certified reference materials
The Pb isotope ratio results obtained via SC-ICP-DRC-MS for the selected certified
reference materials after digestion and Pb isolation are summarized in table VII.10. The
Pb isotopic compostion of NIST SRM 1400 Bone ash has already been determined via TI-
MS [Hinners et al., 1998]. The double spike TI-MS values reported for NIST SRM 981
Common Lead [Woodhead et al., 1995] were used in the work of Hinners et al. as reference
values. To be consistent with the normalization used throughout this work, the
experimental values for NIST SRM 1400 Bone Ash reported by Hinners et al. have been
recalculated using the triple spike TI-MS values for NIST SRM 981 Common Lead [Galer and
Abouchami, 1998] used throughout this work. As can be seen in table VII.10.a, the average
single-collector ICP-DRC-MS results obtained for NIST SRM 1400 Bone Ash via the Pb
methodology developed, are in very good agreement with the results obtained via TI-MS
following a different sample pretreatment [Hinners et al., 1998]. This confirms the developed
method’s reliability for Pb isotope ratio analysis. The replicate results are given in
chapter VI, table VI.5, as a part of the regeneration experiment of Pb specTM resin.
The Pb isotopic composition of the certified soil reference materials BCR CRM 141
Calcareous Loam Soil and BCR CRM 142 Light Sandy Soil has not been reported yet. In
table VII.10.b-c, the average Pb isotope ratio data obtained via the SC-ICP-DRC-MS
protocol are summarized. The replicate results are given chapter VI, table VI.5, as a part
of the regeneration experiment of Pb specTM resin.
The Pb isolation procedure and single-collector ICP-DRC-MS measurement protocol was
further applied to a certified reference material with a matrix composition that is also

CHAPTER VII –
Single-co
llecto
r – and m
ulti-co
llecto
r ICP-M
S m
easurement p
rotocols
170
Table VII.1
0 – Pb iso
tope ra
tio re
sults o
btained via
single-co
llecto
r ICP-DRC-M
S
for se
lecte
d ce
rtified re
ference m
ateria
ls. Literature data are ta
ken fro
m
[Hinners et al., 1
998] (b
one) a
nd [C
loquet et al., 2
006-b] (lich
en). T
he re
plica
te re
sults
for ce
rtified bone and so
il reference m
ateria
ls are give
n in
chapter V
I, table VI.5
208Pb/207Pb
2.4629
0.0033
2.4642
0.0003
2.4667
0.0010
2.4646
0.0065
2.4085
0.0047
2.4078
0.0004
208Pb/206Pb
2.1036
0.0019
2.1025
0.0007
2.0777
0.0045
2.0814
0.0051
2.1296
0.0012
2.1288
0.0003
207Pb/206Pb
0.8541
0.0010
0.8532
0.0002
0.8424
0.0015
0.8444
0.0022
0.8842
0.0024
0.8841
0.0001
208Pb/204Pb
38.606
0.064
38.625
0.040
38.643
0.138
38.582
0.089
37.495
0.235
37.490
0.020
207Pb/204Pb
15.674
0.025
15.675
0.012
15.667
0.046
15.652
0.028
15.568
0.061
15.570
0.007
206Pb/204Pb
(a) NIST SRM 1400 Bone Ash
18.355
0.031
18.371
0.014
(b) BCR CRM 141 Calcareous Loam Soil
18.600
0.019
(c) BCR CRM 142 Light Sandy Soil
18.535
0.019
(d) BCR CRM 482 Lichen
17.607
0.114
17.611
0.007
SC-ICP-DRC-MS (n=4)
2s
TI-MS (n=7)*
2s
SC-ICP-DRC-MS (n=3)
2s
SC-ICP-DRC-MS (n=4)
2s
SC-ICP-DRC-MS (n=3)
2s
MC-ICP-MS (n=4)*
2s

CHAPTER VII – Single-collector – and multi-collector ICP-MS measurement protocols
171
complex, but different from that of bone tissue and soils. For the certified reference
material BCR CRM 482 Lichen, Pb isotope ratios, obtained via multi-collector ICP-MS, have
been reported [Cloquet et al., 2006-b]. After digestion of this reference material according to
the method described in the work cited above, the digest was conducted through the
extraction chromatographic separation procedure used throughout this work (chapter VI,
§ VI.4.2) and analyzed for its Pb isotopic composition using SC-ICP-DRC-MS. As can be
seen from table VII.10.d, there is an excellent agreement between the results obtained
via single-collector ICP-DRC-MS and multi-collector ICP-MS. This agreement suggests that
the method developed is suitable for a wide range of applications involving Pb isotopic
analysis of complex matrices.
VII.5.4 – Conclusions
A methodology, consisting of an extraction chromatographic Pb isolation procedure,
followed by Pb isotope ratio measurement using single-collector ICP – dynamic reaction
cell – MS, has been developed for the purpose of Pb isotope ratio analysis of
archaeological artefacts. It has been proven that the methodology is applicable for a wide
range of applications of Pb isotope ratio analysis, even when very complex matrices are
the subject of study, and for which an excellent isotope ratio precision, as offered by MC-
ICP-MS, is not mandatory.
Literature Pb isotope ratio precision values obtained via single-collector sector field ICP-
MS cover the range of 0.04-0.27 % RSD [Woolard et al., 1998; De Wannemacker et al., 2000;
Krachler et al., 2004]. The use of ICP-DRC-MS for Pb isotope ratio measurements in peat
cores, making use of an Ar/H2 mixture at a gas flow rate of 0.5 mL min-1 [Jackson et al.,
2004] resulted in a Pb isotope ratio precision below 0.5 % RSD for the ratios without 204Pb
for the samples, and below 0.1 % RSD for the 206Pb/207Pb ratio of the NIST SRM 981
Common Lead isotopic standard. The single-collector ICP-DRC-MS measurement protocol
developed in this work, using Ne as a collision gas in a dynamic reaction cell (DRC), is
more precise than ‘traditional’ quadrupole-based ICP-MS and offers a Pb isotope ratio
precision that is similar to or better than the best results reported for sector field ICP-MS
and ICP-DRC-MS. Further, the method was shown as accurate and reproducible, with Pb
isotope ratio results similar to multi-collector ICP-MS and TI-MS results, also for the ratios
with 204Pb.


CHAPTER VIII
Provenancing
pre-Islamic metallic artefacts
excavated at ed-Dur
and Khor Rori


CHAPTER VIII – Provenancing pre-Islamic metallic artefacts excavated at ed-Dur and Khor Rori
175
This chapter presents and discusses Pb isotope ratio data that were obtained for metallic
artefacts excavated at the sites of ed-Dur (Emirate of Umm al-Qaiwain, United Arab
Emirates) and Khor Rori (Oman). The collection of metallic artefacts investigated, consists
of copper-based (unalloyed copper, brass, bronze), lead-based (lead and litharge) and
silver fragments and objects. Also a set of local South-East Arabian coins, manufactured
from a copper-silver alloy, were investigated. The metallic artefacts were studied to obtain
insight into the trade relations between the Roman Empire and the Indian subcontinent
during the period 1st century BC – 1st half 2nd century AD, and the position of ed-Dur in
this trading network.
In what follows, the sites of ed-Dur and Khor Rori and the artefacts investigated are
shortly discussed, followed by a presentation of the Pb isotope ratio results. These are
subsequently compared to literature Pb isotope ratios for copper and silver/lead ores, with
the aim of determining the provenance of the metallic artefacts. The analytical findings
are then translated into the most important archaeological implications. A detailed
discussion of the entire archaeological context is beyond the scope of this chapter; the
interested reader is referred to a PhD thesis entirely devoted to this topic [Delrue, 2008].
VIII.1 – Geography, history and archaeology VIII.1.1 – The archaeological site of ed-Dur
The site of ed-Dur is situated on the west coast of the Oman Peninsula, near the
sheltered lagoon of Khor al-Beidah in the Emirate of Umm al-Qaiwain, United Arab
Emirates (figure VIII.1). The site extends to about 1 kilometer inland and is hidden
behind a dune that protects it from winds coming from the sea. The true extent of the
site during its heydays is hard to determine as shards were found over a vast area, but it
is believed that the spread was at least 2-3 square kilometers [Haerinck, 2001; Delrue, 2008].
Ed-Dur is the only large coastal site identified so far between Qatar and the Strait of
Hormuz, which connects the Persian Gulf and the Gulf of Oman (figure VIII.1), with a
main occupation phase dating between the 1st century BC and the 1st half of the
2nd century AD. The settlement must have profited from its position, as the coast itself
between Umm al-Qaiwain and Dubai is renowned for its dangerous shoals and reefs. The
proximity of the lagoon provided the possibility of fishing and collecting shellfish, while
the sea itself permitted fishing in open sea and international commercial traffic. Next to
the sea, also traditional routes via land were important. One of these led to the fertile
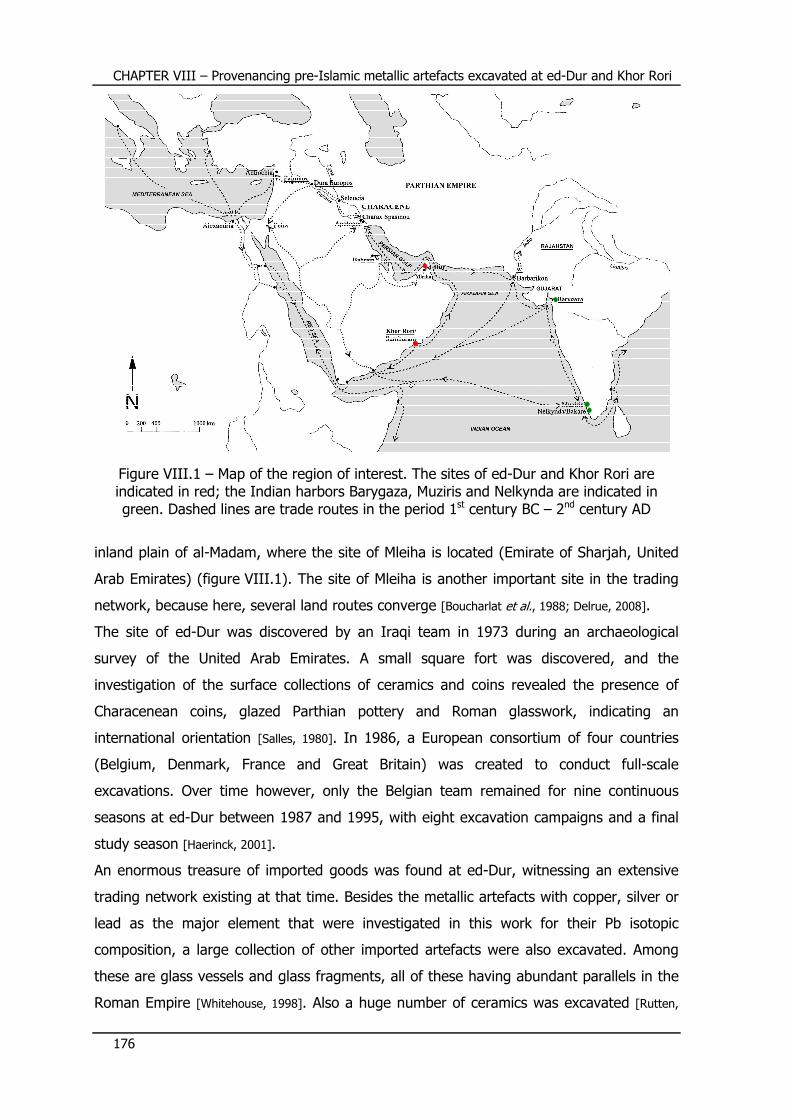
CHAPTER VIII – Provenancing pre-Islamic metallic artefacts excavated at ed-Dur and Khor Rori
176
Figure VIII.1 – Map of the region of interest. The sites of ed-Dur and Khor Rori are indicated in red; the Indian harbors Barygaza, Muziris and Nelkynda are indicated in green. Dashed lines are trade routes in the period 1st century BC – 2nd century AD
inland plain of al-Madam, where the site of Mleiha is located (Emirate of Sharjah, United
Arab Emirates) (figure VIII.1). The site of Mleiha is another important site in the trading
network, because here, several land routes converge [Boucharlat et al., 1988; Delrue, 2008].
The site of ed-Dur was discovered by an Iraqi team in 1973 during an archaeological
survey of the United Arab Emirates. A small square fort was discovered, and the
investigation of the surface collections of ceramics and coins revealed the presence of
Characenean coins, glazed Parthian pottery and Roman glasswork, indicating an
international orientation [Salles, 1980]. In 1986, a European consortium of four countries
(Belgium, Denmark, France and Great Britain) was created to conduct full-scale
excavations. Over time however, only the Belgian team remained for nine continuous
seasons at ed-Dur between 1987 and 1995, with eight excavation campaigns and a final
study season [Haerinck, 2001].
An enormous treasure of imported goods was found at ed-Dur, witnessing an extensive
trading network existing at that time. Besides the metallic artefacts with copper, silver or
lead as the major element that were investigated in this work for their Pb isotopic
composition, a large collection of other imported artefacts were also excavated. Among
these are glass vessels and glass fragments, all of these having abundant parallels in the
Roman Empire [Whitehouse, 1998]. Also a huge number of ceramics was excavated [Rutten,

CHAPTER VIII – Provenancing pre-Islamic metallic artefacts excavated at ed-Dur and Khor Rori
177
2006]. Some of these were shown to be produced locally, while the largest group (72 %)
was imported. Southern Mesopotamia and North-East Arabia were identified as the main
providers. Further, also stone vessels [Zutterman, 2003], human and animal figurines [Daems,
2004-a; Daems, 2004-b] and beads [Haerinck, 2003] witness an international trade system of ed-
Dur with the Mediterranean region, the Roman Empire, the Parthian Empire, Arabia and
the Indian subcontinent [Delrue, 2008].
VIII.1.2 – The archaeological site of Khor Rori
Next to metallic artefacts originating from the archaeological site of ed-Dur, also a few
metallic artefacts originating from the archaeological site of Khor Rori, were investigated.
The coastal settlement of Khor Rori was founded on the Dhofar Coast (Oman)
(figure VIII.1) in the early 1st century AD [Sedov, 1996] and its foundation was connected to
the increase in maritime trade between the Roman Empire and the Indian subcontinent at
the beginning of the era. It was a port that was mainly used for trade in incense. Possibly,
Khor Rori was built on top of an earlier settlement that may have been a stopping place
on the ancient sea routes to India or Oman for trade in everyday goods and metals.
Although the importance of the site of Khor Rori for metal production and/or trade is not
well-known, there is evidence of iron and bronze working during the history of Khor Rori
and a northern route that connects Khor Rori to inland Oman is hypothesized to be linked
to the copper trade [Avanzini, 2002; Delrue, 2008].
VIII.1.3 – Historical written sources on trade
The goal of the study presented here was to provenance the metallic artefacts
investigated, in order to contribute to a more profound insight in the trade system
between the Roman Empire and the Indian subcontinent at the period of occupation of
the site of ed-Dur, and to further clarify the commercial routes via which the trade system
took place. Two important historical sources, the Periplus Maris Erythraei (Periplus of the
Erythraean Sea) and Plinius’ Naturalis Historia (Natural History) were written during the
time that ed-Dur was inhabited and provide direct information concerning the trade
between the Roman Empire and the Indian subcontinent, such as the goods shipped, the
itineraries followed and the harboring places. Next to this textual information, there is a
growing body of archaeological evidence to support (or reject) the statements in these
sources.

CHAPTER VIII – Provenancing pre-Islamic metallic artefacts excavated at ed-Dur and Khor Rori
178
The Naturalis Historia [Plinius] can be considered as an encyclopedia on the knowledge in
the 1st century AD and was composed by Pliny (Plinius) the Elder. This work is further
referred to as ‘Plinius’. The Periplus Maris Erythraei [Periplus] (further in the text referred to
as ‘Periplus’) is a Greek commercial trade handbook generally accepted to date from the
1st century AD or shortly thereafter. The anonymous author, probably an Egyptian Greek,
wrote it as a technical guide for merchants and sailors who set sail from the ports of
Roman Egypt at the Red Sea to the coast of Africa, the western and southern coasts of
Arabia and the western coast of India. The detailed information on the traded goods in
this work is rather atypical, since a periplus is foremost a guide for seamen, whereas the
Periplus considered here is in the first place a guide for merchants. This is what makes
this Periplus such an exceptional and valuable document [Delrue, 2008].
VIII.2 – Samples investigated in this work The metallic artefacts that were available for lead isotope ratio analysis can be divided
into three groups, according to the metal that is the major component of the
object/fragment: (i) copper-based artefacts, (ii) lead-based artefacts and (iii) silver
objects. An overview of the samples investigated, their physical appearance and lead
concentration is given in tables VIII.1-4. The lead concentrations, as determined using
SEM-EDX (scanning electron microscopy – electron dispersive X-ray spectrometry) were
provided with the samples. Preceding Pb isotope ratio analysis, the Pb concentrations
were also determined using quadrupole-based ICP-MS (PerkinElmer SCIEX Elan 5000),
and the ICP-MS results were in most cases lower, but matched largely within 50 % with
the SEM-EDX values. The discrepancy can be attributed to the facts that (i) SEM-EDX is a
semi-quantitative technique only and (ii) the objects investigated do not show a
homogeneous distribution of lead, as was also demonstrated by surface analysis using
SEM and optical microscopy. However, the SEM-EDX results provide an accuracy that is
sufficient to distinguish leaded (> 4 % Pb, chapter IV, § IV.4.4) from non-leaded alloys.
Twenty-one copper-based artefacts were investigated (table VIII.1). The set comprises
3 unalloyed copper, 5 brass and 13 bronze artefacts (chapter IV, § IV.4.4). Of these 13
bronze objects, SEM-EDX analysis revealed that 10 of them can be classified as leaded
bronze (table VIII.1). Six samples from the copper-based artefacts set originate from the
site of Khor Rori (KR in sample code): 1 unalloyed copper, 2 bronze and 3 leaded bronze
fragments. The other copper-based artefacts originate from the site of ed-Dur.
CHAPTER VIII – Provenancing pre-Islamic metallic artefacts excavated at ed-Dur and Khor Rori
179
The lead-based fragments are summarized in table VIII.2 and consist of 18 items, which
were all found at the site of ed-Dur. Most of these (15) were provided as fragments.
Three lead fragments – BS 269 (bulla) and S 0024 and Z 019 (assumed to be ingots) –
were supposed to be particularly important, and hence indicated as ‘lead proxies’
(table VIII.2). A bulla is an Indian imitation of a Roman coin that was manufactured in
clay, gold, silver, faience, or, as is the case here, lead. Its use was primarily as a
decorative pendant. The fact that item BS 269 was certainly made in India [Delrue, 2008]
makes it a valuable object. Lead fragment S 0024 was supposed to be an ingot, which is a
tradable form of lead. It has a monogram imprinted that can provide a clue for
provenancing this object. Also fragment Z 019 was supposed to be an ingot, but without a
clue towards its origin. Next to 15 lead fragments, also 3 litharge fragments were
provided, testifying of the extraction of silver from a copper-silver alloy on the site of ed-
Dur [Delrue, 2008], since litharge fragments are always man-made [Tylecote, 1976].
Table VIII.3 summarizes the 12 silver objects found at the site of ed-Dur. The set consists
of 5 pieces of jewelry and 7 coins. The coins can be divided into obols and tetradrachms.
Obols are smaller than tetradrachms, implying a lower monetary value. Four silver obols
and three silver tetradrachms were investigated. Besides silver tetradrachms, also a set of
18 tetradrachms consisting of a copper-silver alloy (billon) were analyzed (table VIII.4).
VIII.3 – Analytical methodology The copper- and silver-based artefacts were sampled by the use of a tungstencarbide
miniature drill (chapter V, § V.1.3), while the lead fragments were sampled by scraping an
amount of lead off the object (chapter V, § V.1.1). The powdered samples or pieces were
consequently digested according to the digestion procedures developed for this purpose
(chapter V, § V.4.5). After the digestion step, the lead fraction of the digests (except for
the lead fragments) was isolated from its metallic matrix by means of extraction
chromatography (chapter VI, § VI.4.2). Finally, the purified lead solutions were submitted
to lead isotope ratio analysis following the single-collector ICP-DRC-MS measurement
protocol developed (chapter VII, § VII.5.2). The use of Ne as a collision gas in the
dynamic reaction cell resulted in an external precision below 0.17 % RSD for the ratios
with 204Pb (206Pb/204Pb, 207Pb/204Pb, 208Pb/204Pb), and below 0.09 % RSD for the other
(207Pb/206Pb, 208Pb/206Pb and 208Pb/207Pb) ratios, and this precision proved sufficient in
grouping and distinguishing objects on the basis of their experimentally determined Pb
isotope ratios.

CHAPTER VIII –
Provenancin
g pre-Isla
mic m
etallic a
rtefacts e
xcavated at ed-Dur a
nd Khor R
ori
180
Table VIII.1
– Pb co
ncentra
tion and Pb iso
topic co
mpositio
n of co
pper-b
ased arte
facts
from th
e site
s of ed-Dur a
nd Khor R
ori
208Pb/207Pb
0.0036
2.4476
2.4817
2.4381
2.4599
2.4551
2.4520
2.4504
2.4769
2.4838
2.3574
2.4234
2.4793
2.4752
2.4672
2.4492
2.4642
2.4753
2.4789
2.4598
2.4629
2.4244
208Pb/206Pb
0.0026
2.0958
2.0765
2.0773
2.0936
2.0948
2.0926
2.0890
2.0912
2.0882
2.1899
2.1294
2.0734
2.0708
2.0838
2.0986
2.0757
2.0868
2.0716
2.0946
2.1079
2.1274
207Pb/206Pb
0.0017
0.8560
0.8367
0.8520
0.8504
0.8536
0.8535
0.8525
0.8442
0.8409
0.9297
0.8789
0.8360
0.8364
0.8446
0.8570
0.8428
0.8431
0.8360
0.8515
0.8564
0.8785
208Pb/204Pb
0.123
38.275
38.848
38.484
38.555
38.432
38.344
38.377
38.851
38.911
37.063
37.998
38.986
38.940
38.610
38.366
38.688
38.856
38.950
38.734
38.629
38.057
207Pb/204Pb
0.047
15.638
15.654
15.791
15.663
15.655
15.638
15.678
15.700
15.676
15.711
15.684
15.716
15.718
15.680
15.680
15.700
15.698
15.713
15.763
15.684
15.734
206Pb/204Pb
0.054
18.263
18.709
18.533
18.413
18.347
18.322
18.371
18.582
18.640
16.928
17.845
18.800
18.809
18.547
18.296
18.628
18.586
18.796
18.511
18.315
17.886
[Pb] (%)
--
1.4
2.3
1.7
2.3
2.1
1.5
1.6
2.7
2.8
2.8
2.7
17
22
12
12
22
13
22
12
16
13
external precision (2s)
unalloyed copper
coin (tetradrachm)
altar
fragment
brass
ring-pommel dagger
large rivet
ring-pommel dagger
ring-pommel dagger
bell pendant
bronze
ladle fragment
fragment
fragment
leaded bronze
ram’s head patera
horse applic
handle vessel
handle vessel
pedestal statuette
bead
female head applic
fragment
fragment
fragment
BS 169
N 138
KR 012
AT 013
AV 083
AW 063-4
BL 014
BO 029
AV 115
KR 009
KR 010
AV 005
AV 104
C 079
K 203
M 007
N 118
S 020
KR 007
KR 008
KR 011

CHAPTER VIII –
Provenancin
g pre-Isla
mic m
etallic a
rtefacts e
xcavated at ed-Dur a
nd Khor R
ori
181
Table VIII.2
– Pb co
ncentra
tion and Pb iso
topic co
mpositio
n of le
ad and lith
arge
fragments fro
m th
e site
of ed-Dur. L
ead fra
gments a
ssumed to
be 100 %
lead.
208Pb/207Pb
0.0036
2.4397
2.4429
2.3552
2.4406
2.4419
2.4487
2.4413
2.4459
2.4389
2.4393
2.4416
2.4420
2.3595
2.4389
2.4426
2.4445
2.4377
2.4379
208Pb/206Pb
0.0026
2.0776
2.1213
2.1844
2.1188
2.1195
2.1154
2.1213
2.1190
2.1200
2.1204
2.1216
2.1187
2.1777
2.1227
2.1155
2.1216
2.1155
2.1158
207Pb/206Pb
0.0017
0.8516
0.8682
0.9277
0.8682
0.8684
0.8639
0.8692
0.8663
0.8692
0.8694
0.8692
0.8676
0.9230
0.8700
0.8661
0.8679
0.8678
0.8671
208Pb/204Pb
0.123
38.857
38.355
37.029
38.334
38.432
38.369
38.222
38.462
38.299
38.452
38.422
38.343
37.258
38.403
38.286
38.299
38.289
38.205
207Pb/204Pb
0.047
15.942
15.710
15.723
15.707
15.738
15.666
15.658
15.725
15.702
15.763
15.736
15.702
15.791
15.720
15.686
15.668
15.706
15.658
206Pb/204Pb
0.054
18.703
18.081
16.949
18.091
18.132
18.138
18.019
18.151
18.066
18.130
18.106
18.097
17.109
18.081
18.112
18.052
18.099
18.057
[Pb] (%)
--
100
100
100
100
100
100
100
100
100
100
100
100
100
100
100
57
57
55
external precision (2s)
lead proxies
bulla
ingot ?
ingot ?
lead fragments
fragment
fragment
fragment
fragment
fragment
fragment
fragment
fragment
fragment
fragment
fragment
fragment
litharge fragments
fragment
fragment
fragment
BS 269
S 0024
Z 19
BK 1238 B
BM 1225 B
BM 1225 C
BM 1225 D
BS 1139 A
BS 1360
BS 1441 A
BS 1453 A
BS 1453 B
BS 1466
ED 1309
S 0010 C
AW 13
BO 722
BO 724 A
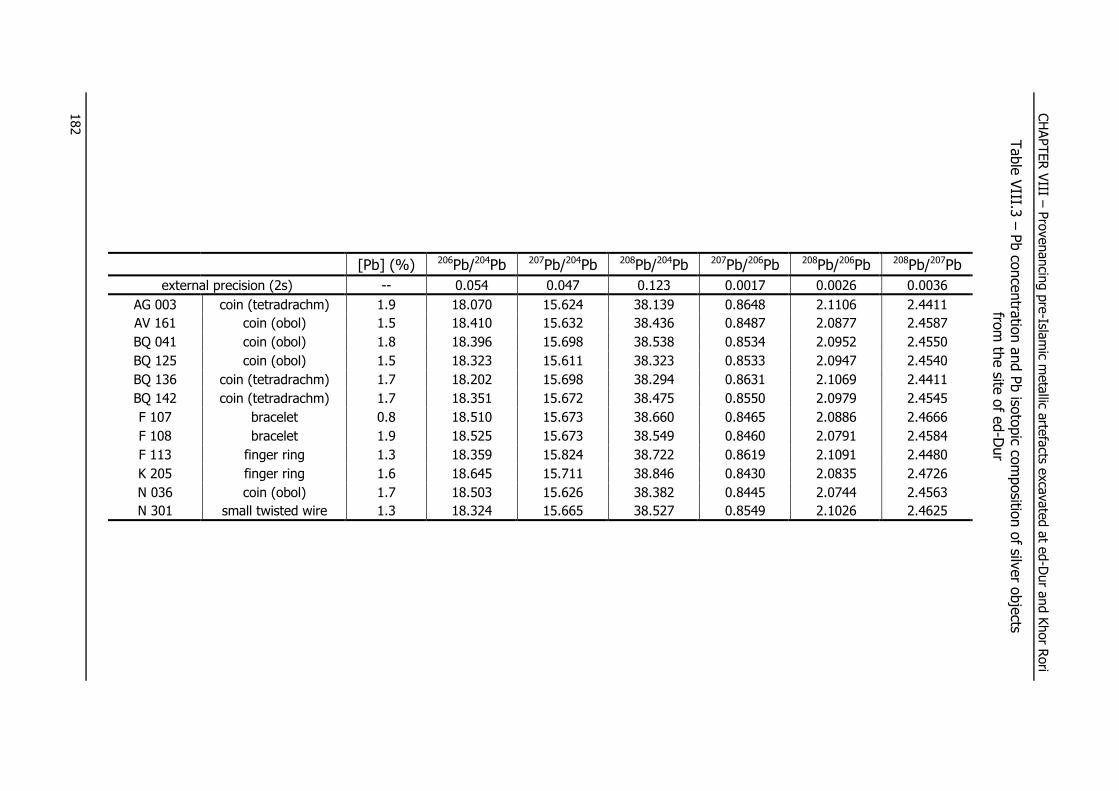
CHAPTER VIII –
Provenancin
g pre-Isla
mic m
etallic a
rtefacts e
xcavated at ed-Dur a
nd Khor R
ori
182
Table VIII.3
– Pb co
ncentra
tion and Pb iso
topic co
mpositio
n of silv
er o
bjects
from th
e site
of ed-Dur
208Pb/207Pb
0.0036
2.4411
2.4587
2.4550
2.4540
2.4411
2.4545
2.4666
2.4584
2.4480
2.4726
2.4563
2.4625
208Pb/206Pb
0.0026
2.1106
2.0877
2.0952
2.0947
2.1069
2.0979
2.0886
2.0791
2.1091
2.0835
2.0744
2.1026
207Pb/206Pb
0.0017
0.8648
0.8487
0.8534
0.8533
0.8631
0.8550
0.8465
0.8460
0.8619
0.8430
0.8445
0.8549
208Pb/204Pb
0.123
38.139
38.436
38.538
38.323
38.294
38.475
38.660
38.549
38.722
38.846
38.382
38.527
207Pb/204Pb
0.047
15.624
15.632
15.698
15.611
15.698
15.672
15.673
15.673
15.824
15.711
15.626
15.665
206Pb/204Pb
0.054
18.070
18.410
18.396
18.323
18.202
18.351
18.510
18.525
18.359
18.645
18.503
18.324
[Pb] (%)
--
1.9
1.5
1.8
1.5
1.7
1.7
0.8
1.9
1.3
1.6
1.7
1.3
external precision (2s)
coin (tetradrachm)
coin (obol)
coin (obol)
coin (obol)
coin (tetradrachm)
coin (tetradrachm)
bracelet
bracelet
finger ring
finger ring
coin (obol)
small twisted wire
AG 003
AV 161
BQ 041
BQ 125
BQ 136
BQ 142
F 107
F 108
F 113
K 205
N 036
N 301

CHAPTER VIII –
Provenancin
g pre-Isla
mic m
etallic a
rtefacts e
xcavated at ed-Dur a
nd Khor R
ori
183
Table VIII.4
– Pb co
ncentra
tion and Pb iso
topic co
mpositio
n of co
pper-silv
er a
lloy co
ins
from th
e site
of ed-Dur
208Pb/207Pb
0.0036
2.4551
2.4604
2.4679
2.4604
2.4572
2.4588
2.4516
2.4427
2.4417
2.4567
2.4464
2.4492
2.4514
2.4493
2.4477
2.4614
2.4581
2.4712
208Pb/206Pb
0.0026
2.1008
2.0858
2.0886
2.0886
2.0882
2.0954
2.0952
2.1081
2.0927
2.0933
2.0975
2.0771
2.1021
2.0943
2.0877
2.0829
2.1013
2.0964
207Pb/206Pb
0.0017
0.8554
0.8476
0.8463
0.8486
0.8496
0.8522
0.8545
0.8631
0.8573
0.8521
0.8564
0.8481
0.8575
0.8551
0.8529
0.8462
0.8553
0.8486
208Pb/204Pb
0.123
38.514
38.558
38.580
38.739
38.524
38.606
38.366
38.147
38.136
38.388
38.167
38.239
38.600
38.366
38.324
38.629
38.496
38.693
207Pb/204Pb
0.047
15.687
15.671
15.634
15.745
15.674
15.701
15.648
15.618
15.623
15.626
15.594
15.613
15.746
15.664
15.658
15.694
15.666
15.661
206Pb/204Pb
0.054
18.339
18.486
18.470
18.546
18.448
18.424
18.312
18.096
18.223
18.321
18.203
18.410
18.363
18.319
18.357
18.546
18.310
18.447
[Pb] (%)
--
1.6
2.2
2.7
1.7
1.4
0.8
1.7
2.0
1.9
1.2
2.2
1.7
1.4
2.1
1.9
1.8
1.6
1.6
external precision (2s)
coin (tetradrachm)
coin (tetradrachm)
coin (tetradrachm)
coin (tetradrachm)
coin (tetradrachm)
coin (tetradrachm)
coin (tetradrachm)
coin (tetradrachm)
coin (tetradrachm)
coin (tetradrachm)
coin (tetradrachm)
coin (tetradrachm)
coin (tetradrachm)
coin (tetradrachm)
coin (tetradrachm)
coin (tetradrachm)
coin (tetradrachm)
coin (tetradrachm)
AD 025
AV 023
BM 026
BO 043
BQ 005
BR 106
BS 043
BS 080
BS 097
BS 148
BS 172
BS 235
BS 236
BS 237
BS 254
BS 284
ED 005
N 310

CHAPTER VIII – Provenancing pre-Islamic metallic artefacts excavated at ed-Dur and Khor Rori
184
VIII.4 – Pb isotope ratio results In tables VIII.1-4, the Pb isotope ratio results, obtained for the metallic artefacts
investigated, are summarized. Graphical representations of the 208Pb/206Pb ratio versus the
207Pb/206Pb ratio and the 208Pb/204Pb ratio versus the 206Pb/204Pb ratio are given in
figure VIII.2. At first sight, two distinct isotope ratio fields can be discerned. Most of the
objects investigated are to be found in a field showing a relatively large range in isotopic
composition, covering a 208Pb/206Pb ratio between 2.07 and 2.13 (figure VIII.2.a), and a
206Pb/204Pb ratio between 17.85 and 18.80 (figure VIII.2.b). The copper-based objects
show the largest dispersion in Pb isotopic composition and cover the isotope ratio ranges
given above. A compact group of lead and litharge fragments is found at a 208Pb/206Pb
ratio of 2.115 – 2.123 and a 206Pb/204Pb ratio of 18.02 – 18.15, while one lead object
(bulla BS 269) is outside this compact group and displays a more radiogenic Pb isotopic
composition. The silver objects cover a 208Pb/206Pb ratio range of 2.075 – 2.110 and a
206Pb/204Pb ratio range of 18.07 – 18.64. The copper-silver alloy coins form an
intermingled group with the silver objects and range between 2.077 and 2.108 in
208Pb/206Pb ratio and between 18.10 and 18.55 in 206Pb/204Pb ratio. The overlap of the
silver objects with the coins suggests that silver of the same origin was used for the
objects as for the coins. Further, the proximity of some silver objects to the compact
group of lead objects suggests the use of a common ore, e.g., silver-bearing galena.
The second field is made up by 3 fragments that are much less radiogenic and
characterized by a 208Pb/206Pb ratio in the 2.177 – 2.190 range (figure VIII.2.a) and a
206Pb/204Pb ratio in the 16.93 – 17.11 range (figure VIII.2.b). This field is made up by a
bronze fragment originating from Khor Rori (KR 009), and two lead fragments originating
from ed-Dur (BS 1466 and Z 019).
VIII.5 – Provenance determination of artefacts In what follows, an attempt was made to provenance the metallic objects investigated, on
the basis of their Pb isotopic composition. Provenancing can be translated as tracing the
origin of the copper ores and silver/lead ores that were used to respectively refine the
copper and silver/lead from, that was subsequently used to manufacture the artefacts
investigated in this work. For this purpose, the experimental Pb isotope ratios were
compared to an extensive Pb isotope ratio database, consisting of several thousands of
literature data concerning the Pb isotopic composition of copper and silver/lead ore
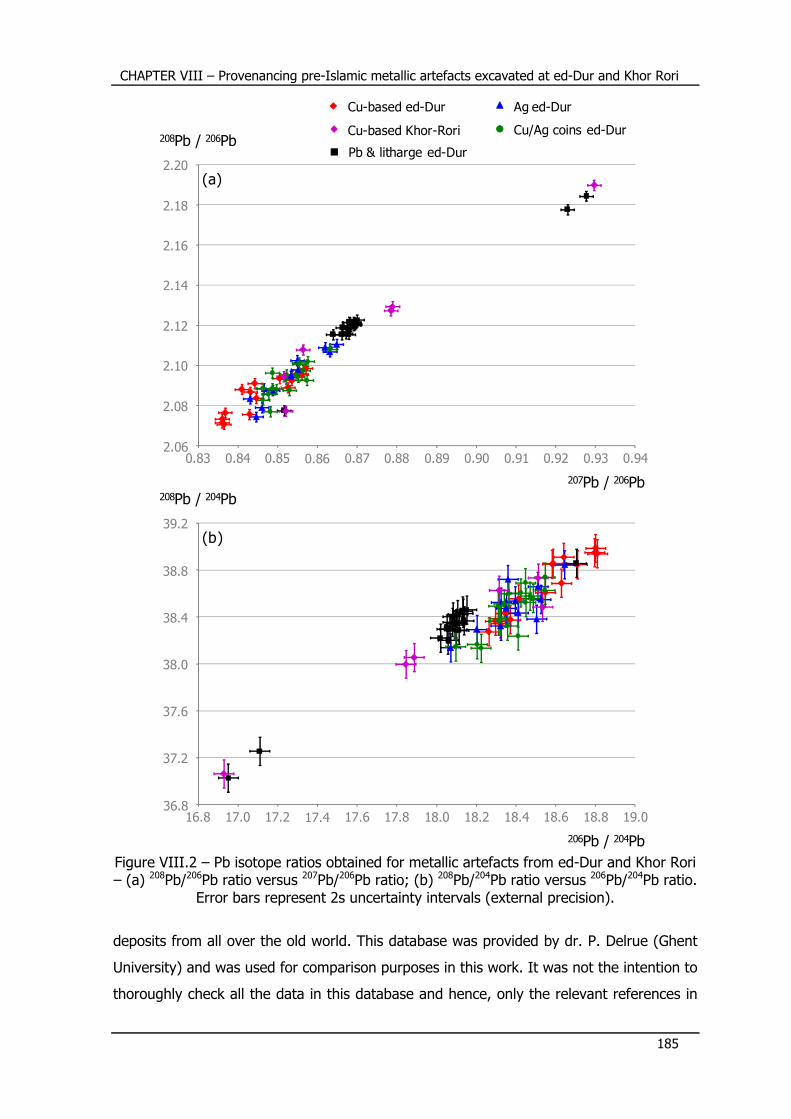
CHAPTER VIII – Provenancing pre-Islamic metallic artefacts excavated at ed-Dur and Khor Rori
185
Figure VIII.2 – Pb isotope ratios obtained for metallic artefacts from ed-Dur and Khor Rori – (a) 208Pb/206Pb ratio versus 207Pb/206Pb ratio; (b) 208Pb/204Pb ratio versus 206Pb/204Pb ratio.
Error bars represent 2s uncertainty intervals (external precision).
deposits from all over the old world. This database was provided by dr. P. Delrue (Ghent
University) and was used for comparison purposes in this work. It was not the intention to
thoroughly check all the data in this database and hence, only the relevant references in
copper ed silver
lead
0.83
207Pb / 206Pb
0.84 0.85 0.86 0.87 0.88 0.89 0.90 0.91 0.92 0.93 0.94
208Pb / 206Pb
2.06
2.08
2.10
2.12
2.14
2.20
Cu-based ed-Dur
Cu-based Khor-Rori
Ag ed-Dur
Pb & litharge ed-Dur
Cu/Ag coins ed-Dur
(a)
2.16
2.18
16.8
206Pb / 204Pb
17.0 17.2 17.4 17.6 17.8 18.0 18.2 18.4 18.6 18.8 19.0
208Pb / 204Pb
36.8
37.2
37.6
38.0
38.4
39.2
38.8
(b)

CHAPTER VIII – Provenancing pre-Islamic metallic artefacts excavated at ed-Dur and Khor Rori
186
this database were checked. An extended list containing all the literature references
making up the database can be found in [Delrue, 2008]. The best documented part of the
world is the Mediterranean region. To a lesser extent, data on ores from the Parthian
world and India were present, while Pb isotope ratio data on material from South-East
Arabia were rather limited. A drawback of the use of this database is that the dataset
contains some old data and that the results have been obtained via different techniques
with a different precision. However, the use of the database is supported by the
observation that different literature sources report very similar isotope ratio values for a
certain place of origin. Further, it should be stressed that provenance studies on the basis
of Pb isotope ratios often only allow a ‘negative’ conclusion, i.e., these studies allow to
exclude a certain ore field as a potential ore source, and that via this approach, it is not
possible to attribute an artefact to a single ore source with 100 % certainty.
Evidently, the isotope ratios obtained for copper-based artefacts were compared to data
on copper ores, while the isotope ratios obtained for silver and lead artefacts were
compared to silver/lead ores. However, it can be questioned to which extent the Pb
isotopic signature of, e.g., silver, brass and bronze, compares to that of the original
silver/lead or copper ore. The main lead mineral is galena. Secondary lead minerals, such
as cerussite and anglesite, have the same isotopic composition as that of the galena from
which they are derived. The lead isotopic composition of these minerals shows a complex
range of variations, inherent to their particular geological history (chapter IV, § IV.2). In
antiquity, almost all silver was extracted from silver-bearing galena, and always retained
some of the parent material, thus reflecting its Pb isotopic composition. However, silver is
a precious metal, so that recycling and remelting must have been common practice.
Mixing silver from different origin distorts the original Pb isotopic signature. Further, silver
is very often debased by the addition of copper, that brings its own Pb isotopic signature
[Gale and Stos-Gale, 2000]. A third point is that litharge fragments were found at ed-Dur,
which are potential residues of silver extraction from a copper-silver alloy involving the
addition of lead to the system. It has been shown that the addition of lead to silver prior
to cupellation seriously distorts the original Pb isotopic signature of the silver [Ortiz, 2003].
However, it is not known to what extent this process was used. Copper is alloyed with tin
to produce bronze. The potential contribution of lead from tin or cassiterite (SnO2), which
is found relatively pure in nature, is seen as minimal since tin deposits rarely contain any
lead [Gale and Stos-Gale, 2000; Ortiz, 2003]. Leaded bronze, in this work defined as containing
> 4 % lead, will mainly reflect the Pb isotopic composition of the lead added. Smelting
experiments and analyses of batches of raw copper have shown that certain copper ores

CHAPTER VIII – Provenancing pre-Islamic metallic artefacts excavated at ed-Dur and Khor Rori
187
can generate smelted copper with a lead content up to 4-5 %. It has been stated that
copper alloy artefacts that contain less than 4 % lead can be provenanced on the basis of
their copper Pb isotopic signature [Gale and Stos-Gale, 2000; Ortiz, 2003]. Provenancing brass
via its Pb isotopic composition is not an easy task, since lead is always associated with
zinc ores. Adding zinc to copper results in a mixing of the Pb isotopic signatures of the
copper and the zinc. However, the brasses found at ed-Dur display a very low zinc and
lead level, indicating that they are rather ‘pure’ and not the result of extensive recycling.
From this point of view, lead isotope ratios are valuable for intra-site comparison of the
brass artefacts.
For the purpose of provenance determination, the isotope ratios 207Pb/206Pb and
208Pb/206Pb are used in the discussion below, since these ratios can be most precisely
determined using the single-collector ICP – dynamic reaction cell – MS measurement
protocol developed, compared to the Pb isotope ratios with 204Pb. However, the
conclusions based on the 207Pb/206Pb and 208Pb/206Pb ratios are the same as that
established with diagrams where the 206Pb/204Pb and 208Pb/204Pb ratios are plotted with
respect to each other. Another reason is that ratios with 204Pb are less frequently
documented in the database than the ratios consisting of the most abundant Pb isotopes.
In following paragraphs, first the field consisting of the three artefacts with a 208Pb/206Pb
ratio of 2.177 – 2.190 are considered, followed by the copper-based artefacts. After that,
the lead and silver artefacts are treated together.
VIII.5.1 – Fragments BS 1466 and Z 019 (lead) and KR 009 (bronze)
First, the field formed by the two lead fragments BS 1466 and Z 019 from ed-Dur and the
bronze fragment KR 009 from Khor Rori (figure VII.2) is considered. The fragments in this
group are characterized by a Pb isotopic composition that is significantly less radiogenic
than that of the other metallic artefacts investigated. A scatterplot of the 208Pb/206Pb ratio
versus the 207Pb/206Pb ratio for these three samples is given in figure VIII.3. The bronze
object KR 009 was found as not intentionally leaded (table VIII.1), and thus it can be
assumed that its Pb isotopic composition reflects mainly that of its copper ore. The
fragments BS 1466 and Z 019 are lead fragments. Both of these contain traces of silver,
in accordance with lead that was de-silvered. The fragment Z 019 was taken from a
rather large piece of lead (12 x 7 x 3 cm) with a rough bottom side, that might indicate
molten lead being poured into a roughly hewn stone hollow, and hence suggests that this
fragment might be an ingot [Delrue, 2008].

CHAPTER VIII – Provenancing pre-Islamic metallic artefacts excavated at ed-Dur and Khor Rori
188
In figure VIII.3, the Pb isotope ratio data corresponding to copper and silver/lead ores
from the database that display a similar Pb isotopic composition are superposed onto the
experimental data. Although there is no overlap, the only relevant matches for both
copper and lead fragments appear to be ores from the Indian subcontinent. Not much
data on Indian ores are available however. The most closely related ores are these from
the region or Rajasthan (figure VIII.1), that are characterized by a 208Pb/206Pb ratio of
2.19 – 2.25 [Ericson and Shirahata, 1985; Srinivasan, 1999], while the ores from the region of
Gujarat (figure VIII.1) display a 208Pb/206Pb ratio 2.15 – 2.16 [Ericson and Shirahata, 1985;
Srinivasan, 1999]. The Rajasthan ores are polymetallic, containing lead and zinc, and both
copper and silver deposits are present [Ericson and Shirahata, 1985], explaining the fact that
some copper and silver/lead ore data points plot in the same place (figure VIII.3).
Figure VIII.3 – 208Pb/206Pb ratio versus 207Pb/206Pb ratio for bronze fragments KR 009
(Khor Rori) and lead fragments BS 1466 and Z 019 (ed-Dur), and literature data (references: see text) for Indian copper and silver/lead ores. Error bars represent
2s uncertainty intervals (external precision).
The Pb isotopic composition of the bronze fragment KR 009 does not exactly overlap with
the Indian copper ore data (figure VIII.3), but the copper can be a mix of different ore
sources of Indian origin. Another possibility is that the copper ore at the origin of the
object is, as yet, still unidentified regarding the vastness of the Indian subcontinent and
the relatively few Pb isotope ratio data available for this region. In any case, the origin of
the copper in the bronze fragment is most likely Indian, an assumption that is supported
sardinia
lead
0.89
207Pb / 206Pb
0.91 0.93 0.95 0.97 0.99
208Pb / 206Pb
2.14
2.16
2.18
2.20
2.22
2.26
Cu-based Khor-Rori
Pb ed-Dur
India – Cu ores
2.24
India – Ag/Pb ores
CHAPTER VIII – Provenancing pre-Islamic metallic artefacts excavated at ed-Dur and Khor Rori
189
by historical evidence that ore sources in Rajasthan were exploited at ‘early times’
[Chakraborti, 1966].
The provenance of the two ed-Dur lead fragments BS 1466 and Z 019 can be derived in
the same way as the bronze fragment from Khor Rori, and is most probably linked to
Indian silver/lead ores from the region of Rajasthan. Again, no overlap is observed, which
leads to different suggestions. First, the lead can be a mix of (i) lead originating from
several regions in India, or (ii) lead originating from India and lead originating from the
Roman Empire (see § VIII.5.3). Second, the ore source at the origin of these objects may
still remain to be identified. Based on the physical appearance of the object Z 019 and its
Pb isotopic signature, it can be suggested that this object is a lead ingot of Indian origin.
An additional argument for assigning a non-European origin to the fragments KR 009,
BS 1466 and Z 019, is found in their high 207Pb/206Pb ratios (0.923 – 0.930), indicating an
age of 1.2-1.3 billion years according to the Stacey-Kramers growth curve [Stacey and
Kramers, 1975], an age that is older than that of most of the European Pb deposits.
VIII.5.2 – Copper-based artefacts
A scatterplot representing the 208Pb/206Pb ratio versus the 207Pb/206Pb ratio for the copper-
based artefacts – unalloyed copper, brass and bronze (table VIII.1) – is given in
figure VIII.4. The bronze fragment KR 009 was discussed above (§ VIII.5.1) and is not
further considered here.
Two bronze fragments originating from Khor Rori (KR 010 and KR 011) display a
208Pb/206Pb ratio of 2.127 – 2.129 (figure VIII.4). One of these fragments (KR 011) is
leaded (table VIII.1), what leads to the expectation that its Pb signature is originating
from the lead added rather than from the copper. The rest of the bronze artefacts occur
in a lower 208Pb/206Pb ratio range of 2.07 – 2.11 and are scattered throughout this isotope
ratio range (figure VIII.4). The brass objects are found at a 208Pb/206Pb ratio of 2.089 –
2.095 and form a relatively compact group. Apart from the fact that brass is hard to
provenance by comparing its Pb isotopic composition to that of copper ores due to the
zinc added, it can be concluded that the brass is derived from the same basic materials.
The three unalloyed-copper objects appear to be rather different in Pb isotopic
composition.
The fact that some bronze artefacts were leaded and that the Pb isotopic signature of
brass can be biased by Pb coming from the zinc, implies that care should be taken when
comparing to copper ore data. From a comparison of the experimental results to the

CHAPTER VIII – Provenancing pre-Islamic metallic artefacts excavated at ed-Dur and Khor Rori
190
Figure VIII.4 – 208Pb/206Pb ratio versus 207Pb/206Pb ratio for copper-based artefacts from
ed-Dur and Khor Rori, and literature data (references: see text) for Sardinian, Spanish and Cypriot copper ores. Error bars represent 2s uncertainty intervals (external precision).
database, it was established that many ore fields resulted in overlap with the
experimental data to at least some extent. This is the case for ores originating from, e.g.,
Bulgaria, Greece, Italy and Turkey (figure VIII.6). However, the best agreement was
found with copper ore sources from Cyprus, Sardinia and Spain, regions that are known
as important sources of copper to the Roman Empire [Delrue, 2008]. The Pb isotope ratio
data for Cypriot, Sardinian and Spanish copper ores are superposed on the experimental
data in figure VIII.4. The Cypriot copper ores are mainly found at a 208Pb/206Pb ratio of
2.07 – 2.08 [Stos-Gale et al., 1986; Gale et al., 1997; Stos-Gale et al., 1997; Stos-Gale et al., 1998-a;
Attanasio et al., 2001; Ortiz, 2003], while the bulk of the Spanish ores is found between 2.09
and 2.11 in 208Pb/206Pb ratio [Stos-Gale et al., 1995; Attanasio et al., 2001; Ortiz, 2003]. The
Sardinian copper ores show a Pb isotopic composition that is rather dispersed among the
experimental 208Pb/206Pb ratio range [Gale and Stos-Gale, 1987; Stos-Gale et al., 1995; Stos-Gale et
al., 1997; Attanasio et al., 2001; Begemann et al., 2001]. From the match with Cypriot, Sardinian
and Spanish copper ores, a Mediterranean/Roman origin of the copper in the investigated
objects from ed-Dur is put forward. This assumption is archaeologically supported by the
knowledge that Sardinia and Spain were extensively mined by the Romans until ca.
sardinia
copper ed
silver
lead
0.825
207Pb / 206Pb
0.835 0.845 0.855 0.865 0.875 0.885
208Pb / 206Pb
2.06
2.08
2.10
2.12
2.14
unalloyed copper
brass
Sardinia – Cu ores
bronze Cyprus – Cu ores
leaded bronze
Spain – Cu ores
KR 010
KR 011
AV 005
M 007

CHAPTER VIII – Provenancing pre-Islamic metallic artefacts excavated at ed-Dur and Khor Rori
191
50 AD. Further archaeological evidence is provided by the Pb isotopic composition
observed for the bronze patera (AV 005) and pedestal statuette (M 007), matching mainly
Mediterranean copper ores (figure VIII.4 and figure VIII.6). A patera is a bowl or pan with
a long, round, frequently ribbed handle. Often, this handle is decorated with a ram’s
head. These vessels became widespread in the Roman Empire during the 1st century AD
and served mainly for cooking and serving food. It is unquestionable that this object is of
Mediterranean/Roman origin [Delrue, 2008]. The pedestal statuette (M 007) was found
together with two more Roman objects. Little information is available on this object.
However, two similar pedestals have been reported, both in Roman context. From this, it
can be suggested that the pedestal is also Roman [Delrue, 2008]. An attribution of the ore
sources to Roman provenance indicates that these objects of Roman manufacture are
made from copper originating from Roman ore sources.
For the two bronze Khor Rori fragments with a 208Pb/206Pb ratio of 2.127 – 2.129 (KR 010
and KR 011), no agreement is found with the Cypriot, Sardinian and Spanish copper ores
(figure VIII.4). However, their Pb isotopic composition may be explained by mixing of
copper stemming from Indian and Roman ore sources. It might be argued, at least for the
unleaded fragment KR 010, that it contains copper from the Indian subcontinent, so that
its Pb isotopic signature shifts towards Indian ores. Combining the facts that bronze
fragment KR 009 (figure VIII.3) is probably Indian and that crucibles used for copper
melting were retrieved at Khor Rori [Delrue, 2008], suggests that copper from both source
regions (Mediterranean and Indian) were mixed. Considering the collection of bronze
fragments originating from Khor Rori as a whole (figure VIII.2 and table VIII.1), their Pb
isotope ratios reveal that most of these are rather atypical compared to the bronze
artefacts originating from ed-Dur. This observation might imply that the metal supply to
the site of Khor Rori was different from that to the site of ed-Dur.
VIII.5.3 – Silver and lead artefacts
A scatterplot representing the 208Pb/206Pb ratio versus the 207Pb/206Pb ratio for the lead
and litharge fragments and silver objects investigated in this work is given in figure VIII.5.
The leaded bronze fragments discussed above (§ VIII.5.2) are also shown in figure VIII.5
since the Pb isotopic signature is probably closer to that of the lead added than to the
copper in the bronze artefact. The lead fragments BS 1466 and Z 019 with a less
radiogenic Pb isotopic composition have been discussed and provenanced in § VIII.5.1
and are not further discussed below.
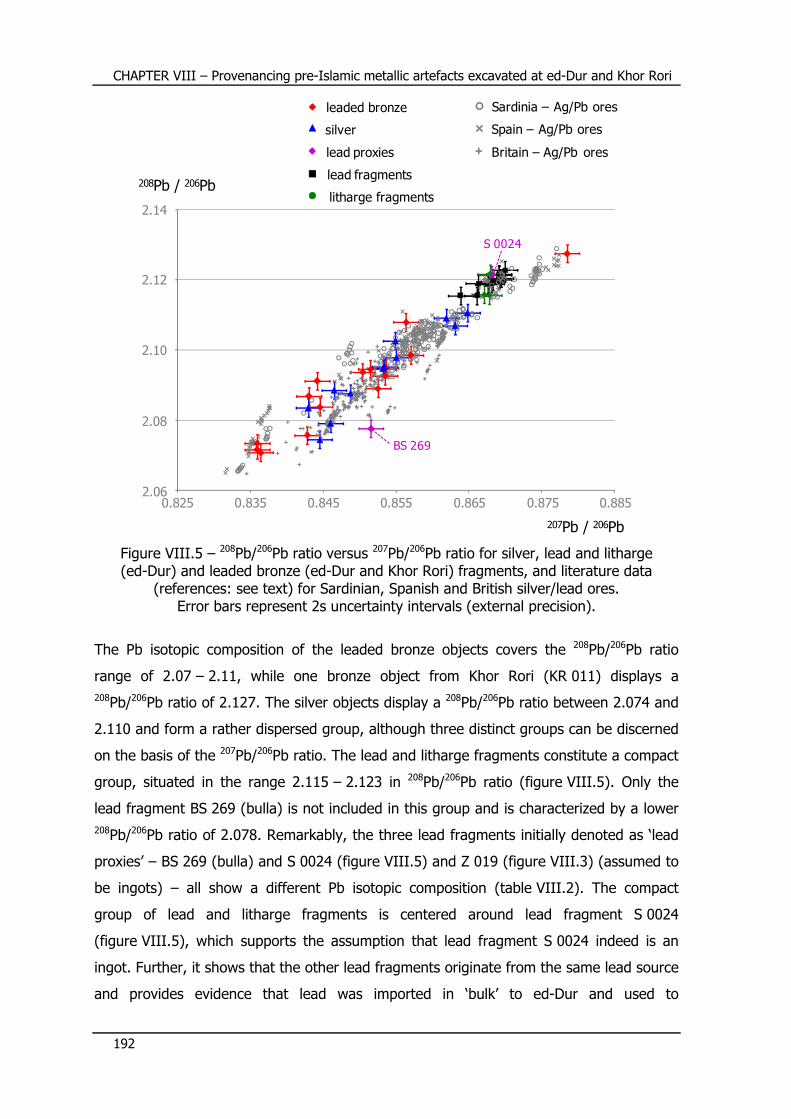
CHAPTER VIII – Provenancing pre-Islamic metallic artefacts excavated at ed-Dur and Khor Rori
192
Figure VIII.5 – 208Pb/206Pb ratio versus 207Pb/206Pb ratio for silver, lead and litharge (ed-Dur) and leaded bronze (ed-Dur and Khor Rori) fragments, and literature data
(references: see text) for Sardinian, Spanish and British silver/lead ores. Error bars represent 2s uncertainty intervals (external precision).
The Pb isotopic composition of the leaded bronze objects covers the 208Pb/206Pb ratio
range of 2.07 – 2.11, while one bronze object from Khor Rori (KR 011) displays a
208Pb/206Pb ratio of 2.127. The silver objects display a 208Pb/206Pb ratio between 2.074 and
2.110 and form a rather dispersed group, although three distinct groups can be discerned
on the basis of the 207Pb/206Pb ratio. The lead and litharge fragments constitute a compact
group, situated in the range 2.115 – 2.123 in 208Pb/206Pb ratio (figure VIII.5). Only the
lead fragment BS 269 (bulla) is not included in this group and is characterized by a lower
208Pb/206Pb ratio of 2.078. Remarkably, the three lead fragments initially denoted as ‘lead
proxies’ – BS 269 (bulla) and S 0024 (figure VIII.5) and Z 019 (figure VIII.3) (assumed to
be ingots) – all show a different Pb isotopic composition (table VIII.2). The compact
group of lead and litharge fragments is centered around lead fragment S 0024
(figure VIII.5), which supports the assumption that lead fragment S 0024 indeed is an
ingot. Further, it shows that the other lead fragments originate from the same lead source
and provides evidence that lead was imported in ‘bulk’ to ed-Dur and used to
sardiniacopper ed
silver
lead
0.825
207Pb / 206Pb
0.835 0.845 0.855 0.865 0.875 0.885
208Pb / 206Pb
2.06
2.08
2.10
2.12
2.14
silver
litharge fragments
Sardinia – Ag/Pb ores
lead fragments
leaded bronze
Spain – Ag/Pb ores
lead proxies Britain – Ag/Pb ores
S 0024
BS 269

CHAPTER VIII – Provenancing pre-Islamic metallic artefacts excavated at ed-Dur and Khor Rori
193
manufacture the desired lead objects on-site. Moreover, the litharge fragments centered
around the ingot S 0024 show that lead from the same source as for the ingot was used
in the cupellation process for the purification of silver. The bulla BS 269 shows a Pb
isotopic composition that is quite different from that of the ingot S 0024 and that of the
lead and litharge fragments (figure VIII.5). Since the bulla BS 269 was certainly not
produced at ed-Dur, but is beyond doubt of Indian manufacture [Delrue, 2008], such a
result could be expected. Unfortunately, bulla BS 269 is neither linked to ingot Z 019 to
which an Indian provenance was attributed (§ VIII.4.1). However, an agreement with an
unalloyed copper fragment (KR 012) is observed (figure VIII.2 and figure VIII.4). This
bronze fragment originates from Khor Rori and it was concluded from the provenance of
the copper-based artefacts (§ VIII.4.2) that the metal supply to the site of Khor Rori is
probably different from that to the site of ed-Dur.
Comparison of the Pb isotope ratio data obtained for the silver and leaded bronze
artefacts with silver/lead ore source regions revealed that, for the objects with a
208Pb/206Pb ratio above 2.09, there is an excellent overlap with Sardinian and Spanish ores
(figure VIII.5), compared to other source regions. Most part of the literature data on the
Pb isotopic composition of Sardinian [Gale and Stos-Gale, 1987; Stos-Gale et al., 1995; Stos-Gale et
al., 1997; Begemann et al., 2001] and Spanish [Stos-Gale et al., 1995; Pernicka et al., 1998; Santos
Zalduegui et al., 2004] silver/lead ores report a 208Pb/206Pb ratio in the range of 2.09 – 2.13,
although also values around 2.07 are documented to a lesser extent. Sardinia and Spain
were already put forward as the most probable ore sources for the leaded bronze
artefacts on the basis of comparison to copper ore data (§ VIII.4.2). However, with only
Sardinia and Spain as ore source fields, the silver objects with a 208Pb/206Pb below 2.09
remain barely explained, suggesting that an additional source field was required. Further
comparison to the Pb isotope data in the database indeed showed that the ore sources of
the United Kingdom and Wales complete the source attribution of all the silver objects
investigated. The 208Pb/206Pb ratio ranges between 2.07 and 2.10 for the silver/lead ores
from the United Kingdom [Rohl, 1996], and between 2.09 and 2.11 for the silver/lead ores
from Wales [Rohl, 1996] (figure VIII.5). Next to Sardinia, Spain, the United Kingdom and
Wales, also Bulgaria, France and Italy show overlap to a certain extent (figure VIII.6) and
hence, cannot be excluded as additional potential ore source regions. The source
attribution to Sardinia and Spain on the one hand, and to the United Kingdom and Wales
on the other hand, can be explained on the basis of archaeological data. Possibly, a
chronological factor is at play here. It is known that the Romans extensively mined the
Sardinian and Spanish ores during the 1st century AD. After the annexation of Great

CHAPTER VIII – Provenancing pre-Islamic metallic artefacts excavated at ed-Dur and Khor Rori
194
Figure VIII.6 – 208Pb/206Pb ratio versus 207Pb/206Pb ratio for metallic artefacts from ed-Dur and Khor Rori, and literature data for Bulgarian [Stos-Gale et al., 1998-b; Gale et al., 2003], French [Trincherini et al., 2001], Greek [Barnes et al., 1974; Stos-Gale et al., 1996; Stos-Gale et al., 1997], Italian [Stos-Gale et al., 1995; Boni et al., 2000; Ortiz, 2003; Klein et al., 2004-a] and Turkish
[Yener et al., 1991; Sayre et al., 2001] copper and/or silver/lead ores. Error bars represent 2s uncertainty intervals (external precision).
Britain to the Roman Empire, British lead ores, that were more easily accessible, became
available. By ca. 70 AD, the British ore fields had become the main providers of lead and
silver ores [Delrue, 2008]. These data fall well within the occupation phase of ed-Dur
(1st century BC – 1st half 2nd century AD). Some silver objects that have been attributed to
British silver/lead ore source fields indeed date from a later time [Delrue, 2008]. In any
case, the provenance of the silver and leaded bronze fragments is most likely Roman.
A similar comparison of the experimental Pb isotope ratios obtained for the lead and
litharge fragments with the database showed an excellent agreement with the Sardinian
and Spanish silver/lead ores. As a consequence, the ingot S 0024 and most of the lead
fragments found at ed-Dur can, with a high degree of certainty, be identified as of
Mediterranean/Roman origin. The isotopic composition of the bulla BS 269, which is
certainly produced in India [Delrue, 2008], does not appear to be Sardinian or Spanish as is
ingot S 0024, and neither Indian as is ingot Z 019. The best match for bulla BS 269 is
copper ed
silver
lead
Cu-based ed-Dur
Cu-based Khor-Rori
Ag ed-Dur
Pb & litharge ed-Dur
Cu/Ag coins ed-Dur
0.825
207Pb / 206Pb
0.835 0.845 0.855 0.865 0.875 0.885
208Pb / 206Pb
2.06
2.08
2.10
2.12
2.14
2.04
Bulgaria – Cu ores
France – Ag/Pb ores
Italy – Cu & Ag/Pb ores
Greece – Cu & Ag/Pb ores
Turkey – Cu & Ag/Pb ores
sardinia

CHAPTER VIII – Provenancing pre-Islamic metallic artefacts excavated at ed-Dur and Khor Rori
195
with British silver/lead ores. This observation could be explained by assuming that the
bulla was manufactured in India with lead imported from the Roman Empire, and was
subsequently exported from India to ed-Dur.
The tetradrachm coins (table VIII.4), manufactured from a copper-silver alloy (billon)
form an intermingled group with the copper-based and silver artefacts (figure VIII.2). The
attribution of Roman ore sources to the copper-based and silver artefacts implies that also
the local South-East Arabian coins are manufactured from Roman ores.
VIII.6 – Conclusions and implications on trade Provenancing copper-based artefacts excavated at the site of ed-Dur showed that the Pb
isotopic signature is linked to ore sources from Cyprus, Sardinia and Spain, which implies
that the ed-Dur objects are made from Roman copper. Three bronze samples (KR 009,
KR 010 and KR 011), excavated at the site of Khor Rori, deviate in Pb isotopic composition
from the samples excavated at ed-Dur. One of these samples (KR 009) can be linked to
Indian copper ores. The attribution of the sample from Khor Rori to an Indian origin is
intriguing. The Periplus and Pliny both state that copper was imported into India from the
Roman world and suggest that no local copper was produced in India [Periplus; Plinius;
Delrue, 2008]. The findings here rather contradict this and suggest that at least to some
extent, copper was produced in India and, apparently, exported to Oman. There is
evidence that sources in Rajasthan were exploited at ‘early times’ [Chakraborti, 1966]. This
region would have had an outlet via the harbor of Barygaza. Barygaza is indeed
mentioned in the Periplus, as sending shipments of copper to the Gulf. The dependence
of India on imported Roman copper might have been less significant than suggested in
the Periplus and Pliny, and rather meant to create a surplus than to fill a shortage [Delrue,
2008]. Further, the bronze fragments from Khor Rori are observed as atypical in Pb
isotopic composition compared to the objects from ed-Dur, implying that the metal supply
to the site of ed-Dur was different from that to the site of Khor Rori [Delrue, 2008].
The lead fragments investigated, except for 3 items, all show a very similar Pb isotopic
composition and are grouped around an ingot (S 0024) with a stamped monogram. The
very good agreement with Sardinian and Spanish ores allows the conclusion that this lead
is of Roman origin. However, two lead fragments (BS 1466 and Z 019), of which one
(Z 019) probably is an ingot, show a Pb isotopic composition similar to that of the
deviating bronze fragment from Khor Rori, and can probably be attributed to India. The
identification of two objects as Indian can be explained by a chronological factor that is at
CHAPTER VIII – Provenancing pre-Islamic metallic artefacts excavated at ed-Dur and Khor Rori
196
play, namely that these objects date from the 2nd half of the 1st century AD [Delrue, 2008].
In this period, the Indian mines of Rajasthan were opened, as evidenced by a study of
the Indian coinage [Seeley and Turner, 1984]. It was observed that in the second half of the
1st century AD, the Pb isotopic signature drastically changed from a Mediterranean
(Sardinia and Spain) into an Indian (Rajasthan) signature. As a consequence, the
provenancing of lead fragments found at ed-Dur fits the idea that India was producing
and even exporting lead to some extent. In any case, the two samples from ed-Dur are
the first to demonstrate that India was exporting, and thus also producing, lead before
the 2nd century AD [Delrue, 2008]. Also one of the Khor Rori bronzes seems to originate
from the same Indian region. The lead from fragment BS 269 (bulla) that is certainly of
Indian manufacture [Delrue, 2008], does not show a correlation with Indian lead ores, but
rather appears to be of British origin.
The litharge fragments show a Pb isotopic composition that is similar to that of the
Roman ingot and the lead fragments, which implies that the same lead is used in the
cupellation process to obtain silver. The silver objects were established as stemming from
Sardinian and Spanish ores, but these ore source fields do not explain the isotopic
composition of all the silver objects investigated. Including the British ore source fields,
exploited by the Romans from ca. 50 AD and dominating from ca. 70 AD onwards, leads
to a complete source attribution to the silver objects, and the conclusion that the silver is
originating from the Roman Empire. The local South-East Arabian coins are manufactured
from a copper-silver alloy (billon) and form an intermingled group with the copper-based
and silver artefacts, from which it can be concluded that also these coins were made from
Roman ores.
The results from Pb isotope ratio analysis and provenancing of metallic artefacts from ed-
Dur and Khor Rori can be considered in the light of the trade relations and routes
operated in the period between the 1st century BC – 1st half 2nd century AD. It is known
from the Periplus that, during the 1st century AD, the Romans were exporting lead
towards the Indian subcontinent, which apparently also ended up at ed-Dur. The question
remains via which trade channel ed-Dur was provided with lead. Three possible routes
can be suggested, based on textual and archaeological research [Delrue, 2008]. The main
trade route between the Roman Empire and the Indian subcontinent was via the Red Sea
along the South-Arabian coast, past the mouth of the Gulf, towards India (figure VIII.1).
Later on, a direct route across the open sea was opened. The lead arrived in the Indian
subcontinent via the harbors of Barygaza on the north-west coast, and Muziris and
Nelkynda on the south-west coast of India. The metal that arrived in India could then be

CHAPTER VIII – Provenancing pre-Islamic metallic artefacts excavated at ed-Dur and Khor Rori
197
re-exported towards the Gulf, as is illustrated in the Periplus for copper metal, but not for
lead. Theoretically however, it is entirely possible that also lead was shipped to the Gulf
region via this route [Delrue, 2008].
A second possibility is that Roman lead was already disembarked in one of the South-
Arabian ports and then transported to the Gulf via local trade routes by ship or across
land (figure VIII.1). However, there is scarce evidence of contacts between South Arabia
and ed-Dur, which makes this possibility less probable [Delrue, 2008].
The third option is that the lead came from an entirely different direction, namely via the
Palmyrene-Characenean network (figure VIII.1). This implies that the metal travelled from
the Eastern Mediterranean across Syria, to Palmyra. There, it was taken on the Euphrates
and travelled downstream to the city of Characene, and continuing its route down the
Gulf to eventually reach ed-Dur [Delrue, 2008].
This puzzle can be solved by considering the lead isotope ratio data obtained for the ingot
S 0024 and the bulla BS 269. The lead of the ingot S 0024 was provenanced as Roman,
and an interesting feature of this ingot is the stamped monogram on it. Similar and even
the same monograms were found on some South-East Arabian coins and some pottery
shards. It resembles monograms on coins from Characene and Seleucia, and an intaglio
of a Characenean finger-ring. The meaning of this monogram is unfortunately unknown,
but it could be the abbreviation of Attambelos, who was a Characenean king [Delrue, 2008].
When the hypothesis is assumed that this monogram indeed is Characenean, it indicates
that the lead metal passed through the city of Characene. It is known that the links
between ed-Dur and Characene were tight. This is evidenced by the large amount of
South Mesopotamian ceramics and coins originating from Characene found at ed-Dur.
Moreover, a more general link between ed-Dur and the Parthian culture is found in the
appearance of ring-pommel daggers [Delrue, 2006], and the similarity in some iron objects
[Delrue, 2008]. Combining the strong link between ed-Dur and Characene, the appearance
of a monogram possibly of Characenean origin on the ingot S 0024 and the absence of
lead listed as an export product in the otherwise detailed Periplus, leads to the conclusion
that an itinerary of the lead ingot via the Palmyrene-Characenean network is very
plausible [Delrue, 2008].
The lead of the bulla, on the other hand, shows correlation with the British ore sources
and can probably be identified as Roman. However, this bulla is certainly made in India
[Delrue, 2008]. When the lead in the bulla indeed is Roman, this demonstrates the use of
the first trade route suggested above, where the lead was shipped from the Roman
Empire to India, processed and used to manufacture artefacts from, that were

CHAPTER VIII – Provenancing pre-Islamic metallic artefacts excavated at ed-Dur and Khor Rori
198
subsequently shipped to the Gulf region. The reason why this itinerary is not mentioned in
the Periplus remains unclear.

CHAPTER IX
Investigation of
infant exposure to lead
during the Roman Era


CHAPTER IX – Investigation of infant exposure to lead during the Roman Era
201
This chapter summarizes and discusses Pb isotope ratio data that were obtained in the
framework of a multidisciplinary study, involving the fields of archaeology, toxicology and
analytical chemistry, investigating the cause of high infant lead exposure in the Roman
Era. The goal of the study was to identify the sources of the high lead levels retrieved in
inhumed infant bone tissue samples, and more specifically to find out whether the high
lead concentration in bone can be attributed to diagenesis. A detailed discussion on the
toxicological and archaeological context and implications is largely beyond the scope of
this chapter, and the interested reader is referred to two papers entirely devoted to these
topics [de Wolff et al., 2008; Smits et al., 2008].
IX.1 – Toxicological and historical background IX.1.1 – Toxicology of lead
Lead is a widely used metal, e.g., in ancient times, for manufacturing trays and kitchen
utensils and in more recent times, for the production of electric batteries for vehicles, as
an additive in gasoline and in paints. At the same time, lead is a versatile, insidious and
persistent poison. Metallic lead has belonged to the human environment for over
5 000 years [Philip and Gerson, 1994-a]. Effects of lead toxicity, which manifests itself by, e.g.,
anemia, nephrotoxicity and nervous system disorders, have already been described by
Hippocrates in 370 BC [Philip and Gerson, 1994-a]. Many more negative effects of lead are
known at present. Organic (tetraethyl) lead affects the nervous system [Gidlow, 2004], while
inorganic lead acts on different body functions and systems, e.g., heme synthesis [Piomelli,
2002], reproduction [Hu, 1991], nervous system and kidneys [Philip and Gerson, 1994-b]. From
epidemiological studies, inconclusive evidence has been found as to a causal relation
between lead exposure and the incidence of cancer. At present, there are insufficient data
for suggesting that lead compounds are carcinogenic to humans [IARC, 1987]. Especially
children and pregnant women are vulnerable to the negative effects of lead. Additional
and more detailed information on lead toxicity can be found in dedicated sources, e.g.,
[Gidlow, 2004; Papanikolaou et al., 2005].
Lead can enter the body via different pathways: by absorption through the intestines after
oral ingestion, by inhalation through the lungs, by direct swallowing, and through the skin
[Philip and Gerson, 1994-a]. Inorganic lead absorption takes place throughout the respiratory
and gastrointestinal tracts, while organic (tetraethyl) lead can be absorbed via the skin.
After lead exposure, the lead is absorbed into the blood and transported to other tissues.

CHAPTER IX – Investigation of infant exposure to lead during the Roman Era
202
Lead predominantly accumulates in three compartments: blood, soft tissues, and bone
[Rabinowitz, 1991]. Approximately 99 % of the lead in blood is found in the erythrocytes,
leaving about 1 % in the plasma. More than 95 % of lead is deposited in skeletal bone as
insoluble phosphate [Rabinowitz, 1991]. In adults, 80 to 95 % of the total body burden of
lead is found in the skeleton; for children, this is only 73 %. Lead has an estimated half-
life of 20 to 30 years in bone tissue [Rabinowitz et al., 1976; Papanikolaou et al., 2005] and its
concentration in bone and teeth increases as a function of age. In general, lead is
excreted extremely slowly from the body. Its biological half-life is estimated at 10 years
[Philip and Gerson, 1994-a].
IX.1.2 – The use of lead in the Roman Era
In the Roman Era, lead was used for a variety of applications. Next to the manufacturing
of water pipes and lead tools, lead-containing food additives have been described, such
as sapa and defrutum [Smits, 2006]. These are derived from grapes, and boiled in vessels
made of lead or leaded bronze [Columella; Plinius]. From experiments with ancient recipes, it
was estimated that sapa and defrutum would have contained 240-1 000 µg L-1 of lead
[Kobert, 1909; Eisinger, 1977]. This syrup was added to numerous dishes for its sweet taste to,
e.g., garum, a fermented fish sauce, and for conservation purposes of, e.g., wine and
fruits. It was estimated that the lead level in wine by the addition of sapa would amount
to 15-30 µg L-1 [Hofmann, 1883], and even (much) higher [Nriagu, 1983-a; Needleman, 2004].
The mental and physical health of a number of emperors, as evidenced from written
sources, could point towards lead poisoning [Suetonius]. Claudius was walking with unequal
steps and dragged his right foot, displayed involuntary movements of the head and spoke
and laughed with a strange-sounding voice. Tiberius suffered from encephalopathy and
was famous for his drinking habits. Also Caligula and Nero were alcoholics. Extravagance,
immorality, intolerance, paranoia and cruelty featured their behavior. Most of the
emperors also suffered from saturnine gout [Celsus], a likely symptom of lead poisoning
due to the inhibited excretion of uric acid and the deposition of urate crystals in the joints.
Also the low number of offspring from the aristocracy [Suetonius] can be attributed to a
decreasing fertility as a consequence of lead poisoning. The downfall of the Roman
Empire has even been suggested as a direct or indirect consequence of excessive lead
uptake [Gilfillan, 1965; Nriagu, 1983-a; Nriagu, 1983-b].

CHAPTER IX – Investigation of infant exposure to lead during the Roman Era
203
IX.2 – Sampling site and history of research The study presented here focuses on the cemetery of a Roman settlement, excavated in
the village of Valkenburg, situated on the Southern shore of the river Rhine a few
kilometres west of the city of Leiden (Lugdunum Batavorum), in the West of The
Netherlands close to the North Sea (figure IX.1). The river Rhine marked the Northern
frontier in this part of the Roman Empire. This frontier was defended by many military
fortresses connected by the Roman road. In the period 1st – 3rd century AD, several
military forces were settled in a fortress at Valkenburg, at that time known as Pretorium
Agrippinae. In the vicinity, archaeological excavations uncovered the remains of a civilian
settlement and a large cemetery [Bult and Hallewas, 1986; Bult and Hallewas, 1987; Bult and
Hallewas, 1990]. This cemetery yielded many cremation graves, as older children and adults
were customarily cremated in Roman days. However, the Roman rule also stipulated that
young infants (without teeth) should be buried instead of being cremated [Plinius].
Approximately 35 % of the total population (on the basis of the cremation and inhumation
graves) died before the age of fourteen, while approximately 14 % even died in the first
year of life [Smits, 2006].
Figure IX.1 – Geographical location of Valkenburg (The Netherlands, Europe)
In most Roman cemeteries, the remains of very young infants (buried in inhumation
graves) are mostly absent because of the fragility of the remains and the acidic soil
conditions that often did not favor the preservation of bone tissue. Moreover, these small
and fragile bones are easily missed as a result of the archaeological excavation methods
typically used in the field. At Valkenburg however, an exceptionally high number of infant
graves was discovered, even providing a fair insight into the percentage of infant graves
in relation to the total cemetery population. The excavations at the grave field resulted in
the discovery of the remains of a total of 683 individuals in 520 cremation graves and
134 inhumation graves. The age and/or sex could be determined for 503 individuals. In
176 graves – 81 cremation graves and 95 inhumation graves – skeletal remains of

CHAPTER IX – Investigation of infant exposure to lead during the Roman Era
204
children between 0 and 14 years of age were discovered. It was established that 84 of
the 95 inhumed infant skeletons found, stemmed from infants younger than 1 year [Smits,
2006]. These skeletons are relatively well-preserved as the soil in that region is alkaline
due to deposition of sea shells. To investigate the cause of this high infant mortality, self-
evidently, only the skeletal remains are accessible. In paleopathology, the cause of death
can seldom be detected from the bone material. In this case however, the availability of
infant remains in association with the existing theories of the abundant use of lead during
the Roman period instigated a chemical-toxicological study of the infant bones to discover
whether the ingestion of lead during pregnancy might have been contributing to or even
be at the origin of the death of these infants.
A preliminary study, in which the lead concentration in the femora of 33 neonates was
determined using electrothermal AAS after acid digestion, showed that the bones of all
individuals displayed a considerable lead concentration, ranging between 12 and
388 µg g-1 with an average of 103 ± 87 µg g-1. The surrounding soil showed a much
lower lead concentration of 18 ± 7 µg g-1 [de Wolff et al., 2001]. From these observations, it
could not be a priori excluded that diagenesis – post-mortem lead exchange between
bone and surrounding soil – is the main source of the lead found in the bones. Therefore,
a new study, carried out within the scope of this thesis, was designed, with the intention
to reveal the source(s) of the lead found in the bones via lead isotope ratio analysis. The
aim was to clarify if the bone lead has entered the bone via diagenesis (from the soil) or
via another mechanism, e.g., ante-mortem lead uptake via lead-rich food consumed by
the mother. Therefore, in addition to the infant bone tissue, also soil and other potential
sources of bone lead such as garum, lead objects and amphorae were investigated for
their Pb isotopic composition.
IX.3 – Samples investigated in this work A set of 22 infant bone tissue samples, taken throughout the entire excavation site, was
subject to Pb isotopic analysis. The bone samples were taken from femora of deceased
and stillborn Roman infants of which the sex is, as yet, not determined. The cortical bone
tissue (hard outer tissue) was sampled. This area is free of foreign material – and thus
provides the most accurate results – in contradiction to trabecular bone (inner tissue in
which the bone metabolism occurs), which contains excessive amounts of intruded soil
particles and hence, is less reliable. Every bone sample was accompanied by a sample
from the surrounding soil from which the bone was excavated, thus leading to 22 pairs of
CHAPTER IX – Investigation of infant exposure to lead during the Roman Era
205
bone tissue and soil. Only small sample amounts (≤ 1 g) of bone and soil were available.
Potential sources of bone lead, next to soil, consisted of a sample of fish bones, 10 lead
fragments, 1 pottery fragment and 8 amphora samples. The fish bones originate from a
large earthenware bowl, which was excavated at the site and which was filled with
hundreds of fish bones. This find was interpreted as the remains of the well-known
Roman dish garum (§ IX.1.2). In the following text, this fish bone sample will always be
referred to as ‘garum’. Of the 10 lead fragments supplied, one was mounted onto a
pottery shard, in a construction that resembles a mill. This object was identified as
stemming from a container for food conservation. The pottery fragment was also
sampled. Further, 8 amphora samples were provided. These amphorae, as opposed to the
other samples that were excavated at Valkenburg, originate from an archaeological site in
Nijmegen, but date from the same period.
IX.4 – Analytical methodology After the suited sample pretreatment of the bone tissue, garum, soil, amphora, pottery
and lead fragment samples (chapter V, § V.1.1 and § V.1.2), the powdered samples were
digested according to the corresponding digestion procedures (chapter V, § V.4.1,
§ V.4.2, § V.4.4 and § V.4.5). After the digestion step, the lead fraction of the digests
(except for lead fragments) was isolated from the concomitant matrix by means of
extraction chromatography (chapter VI, § VI.4.2). Finally, the purified lead solutions were
submitted to lead isotope ratio analysis using a Nu Plasma 500 multi-collector ICP-MS
instrument (ETH Zürich) (chapter VII, § VII.4).
IX.5 – Pb concentration and Pb isotope ratio results IX.5.1 – Pb concentration results
The Pb concentration retrieved in the artefacts investigated is summarized in table IX.1-3.
The soil Pb content (table VII.1) ranges from 13 to 71 µg g-1 (< 5 % RSD) with an
average of 28 µg g-1, being a normal range for lead in soil, although distinguishing
background Pb levels from levels affected by anthropogenic activities is difficult. Average
lead levels for different soil types range from 10 to 67 µg g-1, with an average of 32 µg g-1
[Kabata-Pendias and Pendias, 1984-c], while the Pb concentration in the upper continental crust
equals 20 µg g-1 [Taylor and McLennan, 1995] (chapter IV, § IV.4.1). The Pb concentration for
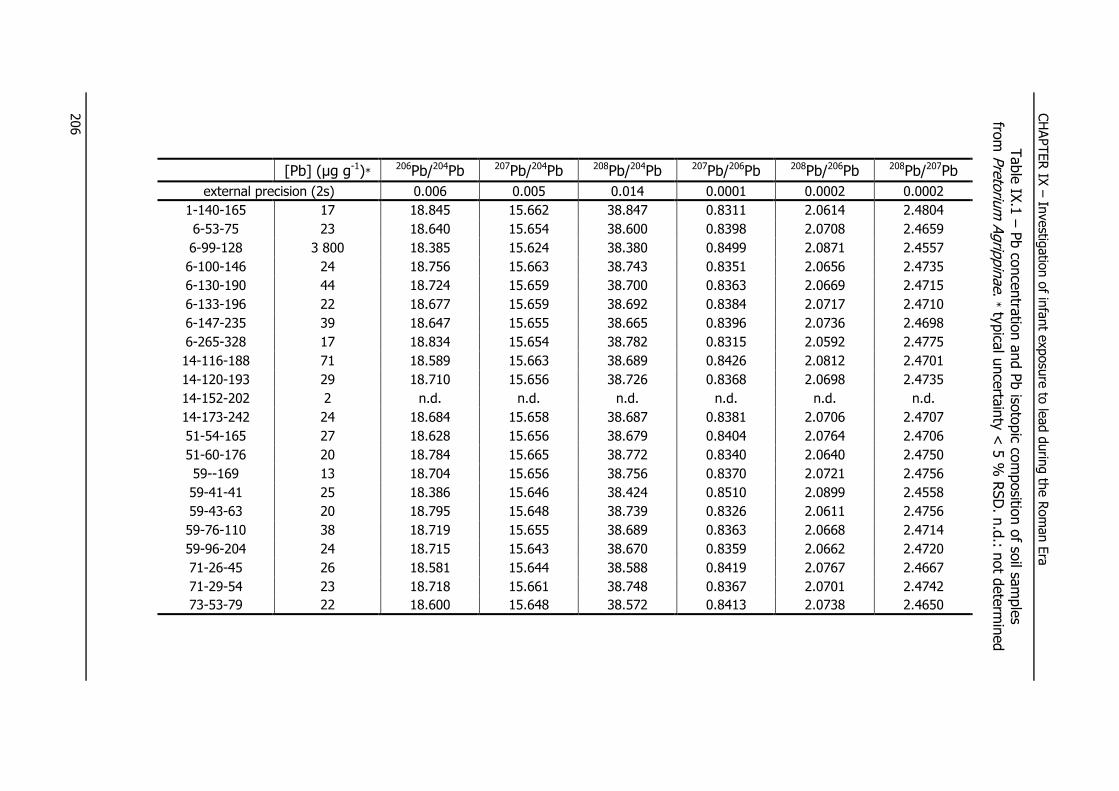
CHAPTER IX
– In
vestig
atio
n of in
fant e
xposure to
lead durin
g th
e Roman Era
206
Table IX
.1 – Pb co
ncentra
tion and Pb iso
topic co
mpositio
n of so
il samples
from Pretoriu
m Agrip
pinae. * ty
pica
l uncerta
inty < 5 %
RSD. n
.d.: n
ot d
eterm
ined
208Pb/207Pb
0.0002
2.4804
2.4659
2.4557
2.4735
2.4715
2.4710
2.4698
2.4775
2.4701
2.4735
n.d.
2.4707
2.4706
2.4750
2.4756
2.4558
2.4756
2.4714
2.4720
2.4667
2.4742
2.4650
208Pb/206Pb
0.0002
2.0614
2.0708
2.0871
2.0656
2.0669
2.0717
2.0736
2.0592
2.0812
2.0698
n.d.
2.0706
2.0764
2.0640
2.0721
2.0899
2.0611
2.0668
2.0662
2.0767
2.0701
2.0738
207Pb/206Pb
0.0001
0.8311
0.8398
0.8499
0.8351
0.8363
0.8384
0.8396
0.8315
0.8426
0.8368
n.d.
0.8381
0.8404
0.8340
0.8370
0.8510
0.8326
0.8363
0.8359
0.8419
0.8367
0.8413
208Pb/204Pb
0.014
38.847
38.600
38.380
38.743
38.700
38.692
38.665
38.782
38.689
38.726
n.d.
38.687
38.679
38.772
38.756
38.424
38.739
38.689
38.670
38.588
38.748
38.572
207Pb/204Pb
0.005
15.662
15.654
15.624
15.663
15.659
15.659
15.655
15.654
15.663
15.656
n.d.
15.658
15.656
15.665
15.656
15.646
15.648
15.655
15.643
15.644
15.661
15.648
206Pb/204Pb
0.006
18.845
18.640
18.385
18.756
18.724
18.677
18.647
18.834
18.589
18.710
n.d.
18.684
18.628
18.784
18.704
18.386
18.795
18.719
18.715
18.581
18.718
18.600
[Pb] (µg g-1)*
external precision (2s)
17
23
3 800
24
44
22
39
17
71
29
2
24
27
20
13
25
20
38
24
26
23
22
1-140-165
6-53-75
6-99-128
6-100-146
6-130-190
6-133-196
6-147-235
6-265-328
14-116-188
14-120-193
14-152-202
14-173-242
51-54-165
51-60-176
59--169
59-41-41
59-43-63
59-76-110
59-96-204
71-26-45
71-29-54
73-53-79

CHAPTER IX
– In
vestig
atio
n of in
fant e
xposure to
lead durin
g th
e Roman Era
207
Table IX
.2 – Pb co
ncentra
tion and Pb iso
topic co
mpositio
n of b
one and garum sa
mples
from Pretoriu
m Agrip
pinae. * ty
pica
l uncerta
inty < 5 %
RSD
208Pb/207Pb
0.0002
2.4652
2.4670
2.4557
2.4667
2.4666
2.4646
2.4678
2.4659
2.4665
2.4651
2.4662
2.4684
2.4578
2.4640
2.4698
2.4654
2.4624
2.4685
2.4624
2.4652
2.4673
2.4628
2.4578
208Pb/206Pb
0.0002
2.0783
2.0736
2.0869
2.0796
2.0707
2.0751
2.0734
2.0705
2.0832
2.0781
2.0757
2.0690
2.0845
2.0815
2.0670
2.0767
2.0784
2.0761
2.0781
2.0754
2.0785
2.0827
2.0849
207Pb/206Pb
0.0001
0.8431
0.8405
0.8498
0.8431
0.8395
0.8420
0.8402
0.8397
0.8446
0.8430
0.8416
0.8382
0.8481
0.8448
0.8369
0.8423
0.8441
0.8410
0.8439
0.8419
0.8424
0.8457
0.8483
208Pb/204Pb
0.014
38.616
38.631
38.390
38.629
38.613
38.577
38.646
38.577
38.623
38.573
38.609
38.658
38.413
38.566
38.663
38.609
38.502
38.651
38.518
38.581
38.628
38.529
38.436
207Pb/204Pb
0.005
15.665
15.659
15.633
15.660
15.654
15.652
15.660
15.644
15.659
15.648
15.654
15.661
15.629
15.652
15.653
15.660
15.636
15.658
15.643
15.650
15.656
15.645
15.638
206Pb/204Pb
0.006
18.581
18.630
18.396
18.575
18.647
18.591
18.640
18.632
18.540
18.561
18.599
18.684
18.428
18.529
18.705
18.592
18.525
18.617
18.536
18.589
18.584
18.498
18.435
[Pb] (µg g-1)*
external precision (2s)
110
79
32 000
150
64
31
170
160
320
200
29
44
300
340
59
120
120
88
47
23
160
75
670
bone
1-140-165
6-53-75
6-99-128
6-100-146
6-130-190
6-133-196
6-147-235
6-265-328
14-116-188
14-120-193
14-152-202
14-173-242
51-54-165
51-60-176
59--169
59-41-41
59-43-63
59-76-110
59-96-204
71-26-45
71-29-54
73-53-79
garum
13-2-236

CHAPTER IX
– In
vestig
atio
n of in
fant e
xposure to
lead durin
g th
e Roman Era
208
Table IX
.3 – Pb co
ncentra
tion and Pb iso
topic co
mpositio
n of a
mphora, p
otte
ry and
lead fra
gment sa
mples fro
m Pretoriu
m Agrip
pinae. * ty
pica
l uncerta
inty < 5 %
RSD.
§ lead fra
gments a
ssumed to
be 100 %
lead
208Pb/207Pb
0.0002
2.4650
2.4758
2.4669
2.4741
2.4598
2.4702
2.4674
2.4659
2.4599
2.4573
2.4556
2.4569
2.4567
2.4560
2.4565
2.4551
2.4563
2.4556
2.4585
208Pb/206Pb
0.0002
2.0780
2.0640
2.0742
2.0652
2.0827
2.0710
2.0726
2.0799
2.0740
2.0862
2.0872
2.0869
2.0873
2.0873
2.0872
2.0876
2.0865
2.0871
2.0863
207Pb/206Pb
0.0001
0.8430
0.8337
0.8408
0.8348
0.8467
0.8384
0.8400
0.8434
0.8431
0.8490
0.8500
0.8494
0.8496
0.8499
0.8498
0.8504
0.8495
0.8499
0.8486
208Pb/204Pb
0.014
38.587
38.793
38.629
38.766
38.533
38.687
38.635
38.643
38.474
38.449
38.378
38.415
38.412
38.379
38.394
38.373
38.408
38.367
38.442
207Pb/204Pb
0.005
15.654
15.669
15.659
15.669
15.665
15.661
15.658
15.671
15.641
15.647
15.630
15.636
15.635
15.627
15.624
15.631
15.637
15.624
15.637
206Pb/204Pb
0.006
18.569
18.795
18.623
18.771
18.501
18.680
18.641
18.579
18.551
18.430
18.388
18.408
18.403
18.386
18.395
18.381
18.408
18.382
18.426
[Pb] (µg g-1)*
external precision (2s)
45
28
31
31
41
29
32
31
3 000
lead fragments §
1 000 000
1 000 000
1 000 000
1 000 000
1 000 000
1 000 000
1 000 000
1 000 000
1 000 000
1 000 000
amphorae
C-3656
C-3668
C-3675
IV-C-166
IV-C-173
212-65
218-48
GM-3
pottery
5-67-499
1-14-35
2-24-10
3-2-32
4-55-99
5-67-499
6-62-20
7-547-971
8-41-1048
9-63-60
10--5185
CHAPTER IX – Investigation of infant exposure to lead during the Roman Era
209
the bones (table IX.2) ranges between 23 and 340 µg g-1 (< 5 % RSD) with an average
of 129 µg g-1. This is remarkably close to the previous results obtained for 33 neonates
with AAS [de Wolff et al., 2001] (§ IX.2). As a comparison, the bone lead level for non-
occupationally exposed ‘modern’ teenagers, obtained via X-ray fluorescence spectrometry,
was found to range up to 14.2 µg Pb per gram bone mineral, with an average of
4.0 ± 4.4 µg g-1 [Hoppin et al., 1997; Farias et al., 1998]. For every bone-soil pair, the Pb
concentration in the bone is higher by a factor of 2 to 10 compared to the corresponding
soil. One soil sample (14-152-202, table IX.1) shows a very low Pb concentration (only
2 µg g-1), while the corresponding bone sample contains 29 µg g-1 of Pb (table IX.2),
which is not the lowest Pb concentration found for the entire set of bones. The bone-soil
pair 6-99-128 (tables IX.1-2), on the other hand, shows an exceptionally high lead
concentration compared to the other samples. The reason for the high lead concentration
displayed by this pair remains unclear, as no lead objects were found inside this grave.
Most of the amphorae display a similar Pb concentration in the range of 28 to 32 µg g-1
(< 5 % RSD), while two display a slightly higher Pb concentration of 41 and 45 µg g-1
(table IX.3). The average Pb concentration of the amphorae equals 34 µg g-1, which is in
the range of normal Pb levels for soil. Since ceramics are derived from soil, a similar lead
content for both could have been expected. Unlike the amphorae, the pottery fragment is
characterized by a very high Pb concentration of 3 000 µg g-1 (table IX.3). The use of
laser ablation ICP-MS (chapter II, § II.2.3.2) for Pb determination on the inner and outer
surface of the shard revealed that the lead is mainly present in a thin layer on both the
inner and outer surface. The lead is inhomogeneously distributed over both the inner and
outer surface, and the Pb concentration on the inner surface (the side that was in contact
with food) is up to factor of ~ 500 higher than the Pb concentration on the outer surface,
indicating a contamination of the inner surface of the bowl with lead. Also the garum
contains the considerable amount of 670 µg g-1 lead (table IX.2). The lead fragments
were assumed to be 100 % lead (table IX.3).
Controversy exists concerning the origin of high lead concentrations as retrieved in bone
tissue dating from the Roman – or in general, any historical – era. Lead levels higher than
biogenic ranges found in Roman bone tissue were, on the one hand considered as the
result of dietary uptake or uptake by inhalation [Martinez-Garcia et al., 2005], and on the other
hand ascribed to diagenesis as the most important process leading to these high Pb
concentrations [Millard, 2006; Zapata et al., 2006]. In the samples studied here, it was found
that (i) the Pb levels are 2 to 10 times higher in the bone than in the surrounding soil,
and (ii) one soil (14-152-202) has a very low Pb concentration (2 µg g-1) compared to a

CHAPTER IX – Investigation of infant exposure to lead during the Roman Era
210
much higher Pb concentration of the corresponding bone (29 µg g-1). On the one hand, it
seems unlikely that all the lead present in the soil has moved into the bone, although this
cannot be excluded since the specific structure of bone might allow the incorporation of
Pb in the bone against a concentration gradient. On the other hand, the observation that
samples linked to food (pottery as a food container and garum as a lead-enriched fish
sauce) display elevated Pb concentrations, suggests that Pb uptake from food appears to
be likely. However, this statement is only based on lead concentrations, while lead isotope
ratios can provide a more profound insight into the relative contribution of diagenesis to
the Pb found in the bones at present [Millard, 2006].
IX.5.2 – Pb isotope ratio results
The Pb isotope ratio results obtained for the samples investigated are summarized in
table IX.1-3. Graphical representations of the 208Pb/206Pb ratio versus the 207Pb/206Pb ratio
and the 206Pb/204Pb ratio versus the 208Pb/204Pb ratio are given in figure IX.2. Due to the
very small amount of soil 14-152-202 available (~ 10 mg), in combination with the very
low Pb concentration (table IX.1), no reliable Pb isotope ratio measurement could be
performed on this sample. In figures IX.2.a-b, three groups can be distinguished: (i) a
compact group of lead fragments with a 206Pb/204Pb ratio between 18.38 and 18.43 and a
208Pb/206Pb ratio between 2.086 and 2.088, (ii) a group of soil samples, covering a
206Pb/204Pb ratio range between 18.58 and 18.85 and a 208Pb/206Pb ratio range between
2.059 and 2.081 (soil samples 6-99-128 and 59-41-41 excluded) and (iii) a group of bone
samples, located in-between the groups of lead objects on one side, and soil samples on
the other side, in a 206Pb/204Pb ratio range of 18.50 – 18.70 and a 208Pb/206Pb ratio range
of 2.067 – 2.083 (bone samples 6-99-128 and 51-54-165 excluded). The lead in the soil
samples is more radiogenic than that in the bones, which is again more radiogenic than
the lead of the fragments. The bone-soil pair 6-99-128 is characterized by a Pb isotopic
composition similar to that of the lead fragments, as are the soil 59-41-41 and the bone
51-54-165 (figure IX.2). The garum displays a Pb isotopic composition that is between
that of the lead fragments and the bone samples but close to that of the lead fragments
with a 206Pb/204Pb ratio of 18.44 and a 208Pb/206Pb ratio of 2.085 (figure IX.2). The
amphorae excavated at Nijmegen all show a Pb isotopic composition that is similar to that
of the soil samples from Valkenburg, and can be divided in four subgroups, scattered
throughout a 206Pb/204Pb ratio range of 18.50 – 18.80 and a 208Pb/206Pb ratio range
between 2.064 and 2.083 (figure IX.2). The pottery fragment, found at a 206Pb/204Pb ratio

CHAPTER IX – Investigation of infant exposure to lead during the Roman Era
211
Figure IX.2 – Graphical representation of the Pb isotope ratio results – (a) 208Pb/206Pb ratio versus 207Pb/206Pb ratio; (b) 206Pb/204Pb ratio versus 208Pb/204Pb ratio.
Error bars are included in the symbol size or represent 2s uncertainty intervals (external precision).
of 18.55 and a 208Pb/206Pb ratio of 2.074, displays a Pb isotopic composition that is
different from that of the lead fragment that was attached to it (5-67-499). Further, this
pottery fragment appears to be rather atypical in Pb isotopic composition and does not
seem to fit in one of the groups as defined above (figure IX.2).
0.830
207Pb / 206Pb
0.835 0.845 0.850 0.855
208Pb / 206Pb
2.055
2.060
2.065
2.070
2.075
bone
soil garum
potterylead object
(a)
2.085
garum
pottery
amphorasoil
bone lead object
amphora
2.090
2.095
2.080
0.840
local background
earth’s crust
pottery
garum
lead objects
38.3
208Pb / 204Pb
38.4 38.6 38.7 38.8
206Pb / 204Pb
18.3
18.4
18.5
18.6
18.7
(b)18.9
18.8
38.5 38.9
local background
earth’s crust
pottery
garum
lead objects

CHAPTER IX – Investigation of infant exposure to lead during the Roman Era
212
A comparison of the 208Pb/206Pb ratio for every bone-soil pair is presented in figure IX.3. It
can be seen that most of the bone-soil pairs display a significantly different Pb isotopic
composition for the bone and corresponding soil. The 208Pb/206Pb ratio is systematically
higher for the bones than for the soils, except for six bone-soil pairs. Two of these six
pairs (6-99-128 and 6-147-235) display the same 208Pb/206Pb ratio, while the other four
pairs (14-173-242, 59--169, 59-41-41 and 71-26-45) display a 208Pb/206Pb ratio that is
higher for the soils than for the bones. The spread in 208Pb/206Pb ratio is lower for the
bones than for the soils. The procentual shift in 208Pb/206Pb isotope ratio from soil to bone
(figure IX.3) varies between –0.64 % (bone-soil pair 59-41-41) and 0.84 % (bone-soil
pair 51-60-176). However, no systematic correlation is observed between, on the one
hand, the magnitude of the 208Pb/206Pb isotope ratio shift, and on the other hand, (i) the
well where the sample was taken (indicated by the first number in the sample
identification code, as given in tables IX.1-2) and (ii) the absolute values of the 208Pb/206Pb
isotope ratios for bone and soil. Furthermore, no systematic trend could be discerned
between the absolute difference in the 208Pb/206Pb ratio for bone and corresponding soil,
on the one hand, and the absolute difference in concentration between bone and
corresponding soil, on the other hand. The apparent lack of a systematic correlation
between the difference in 208Pb/206Pb ratio and the difference in Pb concentration for bone
and corresponding soil may be explained by a different Pb exposure and Pb uptake during
life, but could, however, also be attributed to the process of diagenesis [Radosevich, 1993].
The graphical representation of the 208Pb/206Pb ratio versus the 207Pb/206Pb ratio
(figure IX.2.a) displays an alignment of the bones with the soils, garum and lead
fragments. This suggests that the bone lead is a mix between lead originating from at
least 2 sources: (i) soils and (ii) lead fragments and/or garum, indicating that the process
of diagenesis is probably not the only lead source for bone. Furthermore, owing to the
high precision of the measurement, it could be deduced that at least one additional lead
source is required for complete clarification (figure IX.2.a). This assumption is confirmed
in the representation of the 206Pb/204Pb ratio versus the 208Pb/204Pb ratio (figure IX.2.b),
where the spread of the samples is wider. The observation that the samples are no longer
aligned (figure IX.2.b) indeed confirms the need of at least one additional lead source.
The pottery fragment, displaying a Pb concentration of 3 000 µg g-1, could be addressed
as such.
A scatterplot where, respectively, the 208Pb/206Pb ratio and the 206Pb/204Pb ratio is plotted
versus the inverse of the Pb concentration is given in figure IX.4. From these graphs,
2 soil endmembers can be clearly identified: (i) a group consisting of 4 soils: 1-140-165,

CHAPTER IX – Investigation of infant exposure to lead during the Roman Era
213
Figure IX.3 – 208Pb/206Pb ratios for the bone-soil pairs, organised according to decreasing difference (%) between the 208Pb/206Pb ratio for the soil and corresponding bone sample
6-265-328, 51-60-176 and 59-43-63, and (ii) soil 59--169. The first endmember is
constituted of the group of 4 soils mentioned above, all of which were excavated at a
different well (indicated by the first number in the sample identification code). The
average Pb isotopic composition of this 4-soil group equals 18.81 for 206Pb/204Pb, 15.66 for
207Pb/204Pb, 38.79 for 208Pb/204Pb, 0.832 for 207Pb/206Pb and 2.061 for 208Pb/206Pb, which is
in agreement with the range of Pb isotope ratio values given for North-West European
continental crust and sediments [Elbaz-Poulichet et al., 1984; Elbaz-Poulichet et al., 1986; Weiss et al.,
1999]. Furthermore, these 4 soils display Pb concentrations between 17 and 20 µg g-1
(table IX.1), which is in the range of the Pb concentration of the upper continental crust
[Taylor and McLennan, 1995]. As a consequence, this endmember may represent the earth’s
crust. The soil 59--169 displays a 208Pb/206Pb ratio of 2.072 and a Pb concentration of
13 µg g-1, being the lowest Pb concentration after the atypically low Pb concentration for
soil 14-152-202 (2 µg g-1) (table IX.1). This soil, 59--169, appears to be different from the
average earth’s crust in terms of Pb concentration and Pb isotopic composition, as was
confirmed by duplicate analysis. The difference might be attributed to a local variation,
resulting from a variation in the mineral components of the local sediments. Another
explanation might be that this soil sample was enriched in a specific mineral component.
This second soil endmember, soil 59--169, is further referred to as a ‘local background’.
208Pb / 206Pb
2.055
2.060
2.065
2.070
2.075
bone soil
2.085
shift soil – bone
2.090
2.095
2.080
6-147-235
-0.7
-0.5
-0.3
-0.1
0.1
0.5
0.7
0.9
0.3
shif tsoilbone shift (%)
51-60-176
71-26-45
14-173-242
59--169
59-41-41
59-96-204
59-43-63
6-265-328
59-76-110
73-53-79
71-29-54
14-120-193
1-140-165
6-100-146
51-54-165
6-130-190
6-133-196
6-53-75
14-116-188
6-99-128

CHAPTER IX – Investigation of infant exposure to lead during the Roman Era
214
Figure IX.4 – 208Pb/206Pb ratio (a) and 206Pb/204Pb ratio (b) versus
the inverse of the Pb concentration. Error bars are included in the symbol size.
Next to soil, the group of lead fragments and garum can be considered as a lead source
(figure IX.4). For the garum, it was observed that (i) its isotopic composition approaches
that of the Pb from the fragments (figure IX.2) and (ii) its Pb concentration amounts to
670 µg g-1 (table IX.2), a concentration that is twice as high as the highest bone lead
concentration, found for sample 51-60-176 (6-99-128 excluded) (table IX.2). From this
observation, the garum can be considered as contaminated with Pb coming from the lead
0.00
1 / [Pb] (g µg-1)
0.04 0.06 0.07 0.08
208Pb / 206Pb
2.055
2.060
2.065
2.070
2.075
bone
soil garum
potterylead object
(a)
2.085
garum
pottery
amphorasoil
bone lead object
amphora
2.090
2.095
2.080
0.050.030.020.01
local background
earth’s crust
pottery
garum
lead objects
0.00
1 / [Pb] (g µg-1)
0.04 0.06 0.07 0.08
206Pb / 204Pb
18.3
18.4
18.5
18.6
18.7
(b)18.9
18.8
0.050.030.020.01
local background
earth’s crust
pottery
garum
lead objects

CHAPTER IX – Investigation of infant exposure to lead during the Roman Era
215
fragments, and thus represents a proxy for the lead fragments. Since the garum was
ingested by the Romans as a fish sauce enriched with sapa, (§ IX.1.2) it makes sense to
consider garum as a source of bone lead. Further, also lead coming from the lead
fragments (by, e.g., drinking water) is a likely source of bone lead. The observation that a
higher bone lead concentration (lower 1/Pb value) is characterized by an isotopic
composition approaching that of garum and lead objects, confirms the assumption of
garum, on its turn contaminated by Pb coming from the lead fragments, as a third
endmember.
The three endmembers identified so far – soil 59--169, group of soils 1-140-165, 6-265-
328, 51-60-176 and 59-43-63 and lead fragments + garum – are indicated in figure IX.2
and figure IX.4. In figure IX.2, the Pb isotopic composition of most of the bone samples is
explained by these 3 endmembers. However, this is not the case in figure IX.4, indicating
that a fourth endmember is needed. Defining the pottery fragment 5-67-499, displaying a
Pb concentration of 3 000 µg g-1 (table IX.3), enriched in Pb at its inner surface, and
stemming from a bowl used for the conservation of food, as a fourth endmember, results
in a quasi-complete source attribution of all the bone samples investigated.
An attempt was made to calculate the maximal amount of Pb that could be contributed to
the bone lead levels by the process of diagenesis, by assuming that the lead retrieved in
the bone tissue at present is a mix of lead originating from only two lead sources: (i) soil
and (ii) lead fragments. The following (simplifying) assumptions were made: (i) the Pb
isotopic composition of the bone tissue at the moment of death (R,) equals the
average Pb isotopic composition of the lead fragments (R ); in other words,
lead from the lead fragments was the only source of bone lead before death, (ii) the Pb
concentration and Pb isotopic composition of the bone tissue at present (bone
and R,, respectively) have evolved from the original Pb concentration and Pb
isotopic composition of the bone (bone and R, R , respectively)
by post-mortem diagenesis only; in other words, the process of diagenesis is the only
source of bone lead after death, (iii) the Pb concentration of the soil does not change by
the process of diagenesis, and (iv) only unidirectional diagenesis (from soil to bone) has
taken place. In the case where the assumptions given above are not met, as it is in
reality, diagenesis will have resulted in a lower relative contribution. As a consequence,
with the assumptions made, the contribution of diagenesis calculated is always the
maximal contribution possible. From the maximal amount of Pb arising from diagenesis,
also the minimal bone lead concentration at the moment of death can be estimated. For
CHAPTER IX – Investigation of infant exposure to lead during the Roman Era
216
every bone-soil pair, the amount of Pb that was incorporated into the bone after death
and that originates from the soil (bone ), was calculated using an equation
derived from isotope dilution analysis [Heumann, 1988; Vanhaecke et al., 2006], as follows:
bone ! "
# $ R!&'( ) R*&" , ! "
R*&" , ! " ) R( +, -+./ "!
(equation IX.1)
The difference between the Pb concentration at present in the bone (bone) and
the maximal fraction that was contributed by the process of diagenesis (bone ),
yields the minimal Pb concentration that must have been present at the moment of death.
The Pb contribution of the process of diagenesis to the lead retrieved in the bone at
present can be expressed relative to the lead concentration of the bone at present as
follows:
% diagenesis 100 -&/ !&'(
! " (equation IX.2)
These calculations were carried out for every bone-soil pair, using every Pb isotope ratio
determined (R = 206Pb/204Pb, 207Pb/204Pb, 208Pb/204Pb, 207Pb/206Pb, 208Pb/206Pb or
208Pb/207Pb), and the results are summarized in table IX.4. In some cases, e.g., in the
exceptional case wherein the Pb isotope ratio of the bone is not in-between that of the
corresponding soil and the average Pb isotope ratio of the lead fragments, contributions
of diagenesis to the bone lead concentration below 0 % or above 100 % were obtained.
These results were not further considered. Hence, the range given in table IX.4 is defined
by the lowest and the highest value retrieved when only the percentages between 0 and
100 % are considered. For most of the bone-soil pairs, a spread lower than 20 % is
obtained from calculations based on the different isotope ratios. Only for 5 bone-soil pairs
(6-53-75, 6-147-235, 14-173-242, 59--169 and 71-26-45), the contribution of diagenesis
to the bone lead is near to 100 %, while most of the other bone-soil pairs display a
diagenesis contribution that is (well) below 80 %. The corresponding minimal bone lead
concentrations at the moment of death are considerably higher than the bone lead level
for non-occupationally exposed ‘modern’ teenagers that was found to range up to
14.2 µg Pb per gram bone mineral, with an average of 4.0 ± 4.4 µg g-1 [Hoppin et al., 1997;
Farias et al., 1998]. As a consequence, it can be concluded that diagenesis is probably not
the only source of bone lead, and thus it can be suggested that infant Pb exposure must
have taken place at Pretorium Agrippinae.
As a conclusion, soil, lead fragments and pottery were established as sources of bone
lead. Four endmembers, indicated in figure IX.2 and figure IX.4, have been identified:

CHAPTER IX – Investigation of infant exposure to lead during the Roman Era
217
Table IX.4 – maximal contribution of diagenesis to the Pb concentration as currently present in the bone, and corresponding minimal Pb concentration in the bone
at the moment of death. -- : result < 0 % or > 100 % was obtained.
bone-soil pair
maximal contribution of
diagenesis to the present bone Pb concentration (%)
minimal Pb concentration
of the bone at the moment of decease (µg g-1)
1-140-165 33 – 49 56 – 73
6-53-75 83 – 96 3 – 14
6-99-128 28 – 69 9 600 – 23 000
6-100-146 34 – 89 16 – 97
6-130-190 67 – 81 12 – 21
6-133-196 56 – 78 7 – 14
6-147-235 85 – 97 5 – 26
6-265-328 45 – 59 65 – 87
14-116-188 66 – 86 46 – 110
14-120-193 51 – 64 74 – 100
14-152-202 -- --
14-173-242 84 – 99 0 – 7
51-54-165 4 – 23 230 – 290
51-60-176 24 – 60 140 – 260
59--169 70 – 91 6 – 18
59-41-41 -- --
59-43-63 21 – 33 82 – 96
59-76-110 54 – 87 12 – 41
59-96-204 38 – 44 27 – 29
71-26-45 85 – 96 1 – 3
71-29-54 50 – 81 30 – 81
73-53-79 32 – 80 15 – 51
(i) soil 59--169 as a local soil background, (ii) a group of 4 soils (1-140-165, 6-265-328,
51-60-176 and 59-43-63), which is representative for the upper continental crust,
(iii) garum, contaminated with Pb from the lead fragments, and the lead fragments
themselves, and (iv) the pottery fragment, stemming from a bowl for the conservation of
food. These findings, and a calculation of the maximal Pb concentration contributed to the
bone lead concentration by the process of diagenesis, allow the conclusion that the
process of diagenesis is most likely not the only lead source for bone lead. The bone lead
appears to be a mix between geogenic lead (soil lead) and dietary exposure lead, taken
CHAPTER IX – Investigation of infant exposure to lead during the Roman Era
218
up from e.g., garum, drinking water and conserved food. It is likely that this dietary lead
was taken up by the mother and was subsequently transferred to the foetus.
Four samples (bone and soil 6-99-128, bone 51-54-165 and soil 59-41-41) display a Pb
isotopic composition that is similar to that of the lead objects and the garum (figure IX.2).
Both the bone tissue and the soil for the sample set 6-99-128 show a very high lead
concentration and an isotopic composition clearly deviating from that of the other bone-
soil pairs (table IX.1-2), indicating a very high degree of contamination with lead from the
lead fragments. In figure IX.4, the soil 59-41-41 is located far out of the range displayed
by the other samples. For the moment, the reason why the soil 59-41-41 displays an
isotopic composition clearly different from that of the other soil samples, remains
unexplained.
IX.6 – Conclusions The Pb isotopic investigation of infant bone tissue dating from the Roman Era, along with
possible sources of bone lead such as the surrounding soil, garum, lead fragments,
pottery and amphorae, has revealed that at least an important fraction of the lead present
in the bones must already have been present at the moment of death. Two sources of
bone lead have been identified, namely, soil and food. These sources are represented in
four endmembers. Two endmembers are soils, a local background and a group
representative of the upper continental crust. A third endmember consists of lead
fragments and garum contaminated with lead from the lead fragments, and a fourth
endmember is a pottery shard stemming from a bowl used for the conservation of food. It
was shown that the process of diagenesis is not the only source of bone lead, but that the
bone lead is a mixture of geogenic (soil) lead and dietary exposure lead taken up from,
e.g., garum, drinking water and conserved food. It is likely that this dietary lead was
taken up by the mother, and subsequently transferred from the mother to the foetus
during pregnancy.
CHAPTER X
Investigation of
the grave field population
around the Servatius complex


CHAPTER X – Investigation of the grave field population around the Servatius complex
221
In this chapter, an explorative study is presented, in which the heterogeneity of the grave
field population around the basilica dedicated to the Saint Servatius in Maastricht (The
Netherlands) is investigated. For this purpose, the 87Sr/86Sr ratio of the dental tissues,
enamel and dentine, from a number of individuals, excavated at the Pandhof site and the
Vrijthof site, were determined and compared. The 87Sr/86Sr isotope ratio in dental tissues
can provide insight into population migration in the past. Strontium passes unfractionated
after intake from the food sources and the environment into the blood and is incorporated
into the skeletal tissues. The strontium isotopic composition of tooth enamel, which is
formed during childhood and is not remodeled throughout life, hence reflects the
bioavailable 87Sr/86Sr ratio of the place of birth, while the strontium isotopic composition
of tooth dentine, which remodels during life, reflects the 87Sr/86Sr ratio of the place of
residence in the last years of life. A different 87Sr/86Sr ratio for enamel and dentine thus
points at a relocation of an individual during his/her life history, under the condition that
the biogenic Sr isotopic signature has not been blurred by post-mortem contamination
with strontium from diagenetic (soil) origin (chapter IV, § IV.3.1). First, the archaeological
background on the Servatius complex, the sites Pandhof and Vrijthof, and the samples
investigated are briefly discussed. Then, the influence of the process of diagenesis on the
strontium present in the dental tissues, is evaluated. Next, the Sr isotope ratio results are
presented and discussed, followed by preliminary conclusions on the migration behavior
of the individuals excavated on the sites of Pandhof and Vrijthof.
X.1 – History of Servatius The Servatius basilica, located in Maastricht (The Netherlands) (figure X.1), was built in
honor of Servatius, who was the bishop of Tongeren in the 4th century AD. The
construction of the basilica was started in the 6th century AD, following the impulse of
Monulfus, the bishop of Maastricht at that time. At present, the Servatius basilica is one of
the most impressive monuments of the Low Countries and testifies of 1 600 years of
religion, going back to the earliest Christianity in the valley of the river Maas in the late-
antique era.
The rich history of the Servatius complex is well documented under the form of written
sources, liturgical traditions and numerous objects preserved in the treasure of the
basilica. However, excavations that started about 50 years ago in and around the
Servatius complex revealed an, until then, ‘hidden’ archive, consisting of buildings and
graves. A wealth of wall remains, sarcophagi, grave findings, fragments of architecture,
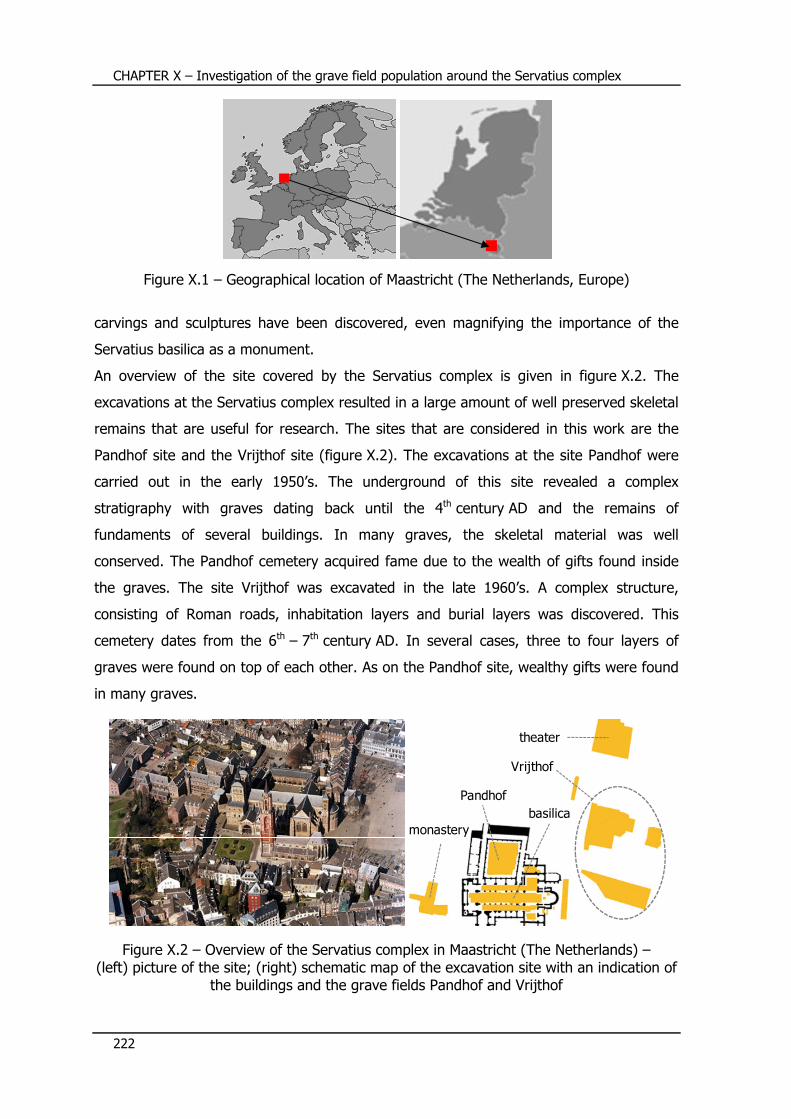
CHAPTER X – Investigation of the grave field population around the Servatius complex
222
Figure X.1 – Geographical location of Maastricht (The Netherlands, Europe)
carvings and sculptures have been discovered, even magnifying the importance of the
Servatius basilica as a monument.
An overview of the site covered by the Servatius complex is given in figure X.2. The
excavations at the Servatius complex resulted in a large amount of well preserved skeletal
remains that are useful for research. The sites that are considered in this work are the
Pandhof site and the Vrijthof site (figure X.2). The excavations at the site Pandhof were
carried out in the early 1950’s. The underground of this site revealed a complex
stratigraphy with graves dating back until the 4th century AD and the remains of
fundaments of several buildings. In many graves, the skeletal material was well
conserved. The Pandhof cemetery acquired fame due to the wealth of gifts found inside
the graves. The site Vrijthof was excavated in the late 1960’s. A complex structure,
consisting of Roman roads, inhabitation layers and burial layers was discovered. This
cemetery dates from the 6th – 7th century AD. In several cases, three to four layers of
graves were found on top of each other. As on the Pandhof site, wealthy gifts were found
in many graves.
Figure X.2 – Overview of the Servatius complex in Maastricht (The Netherlands) –
(left) picture of the site; (right) schematic map of the excavation site with an indication of the buildings and the grave fields Pandhof and Vrijthof
Pandhof
monastery
theater
basilica
Vrijthof
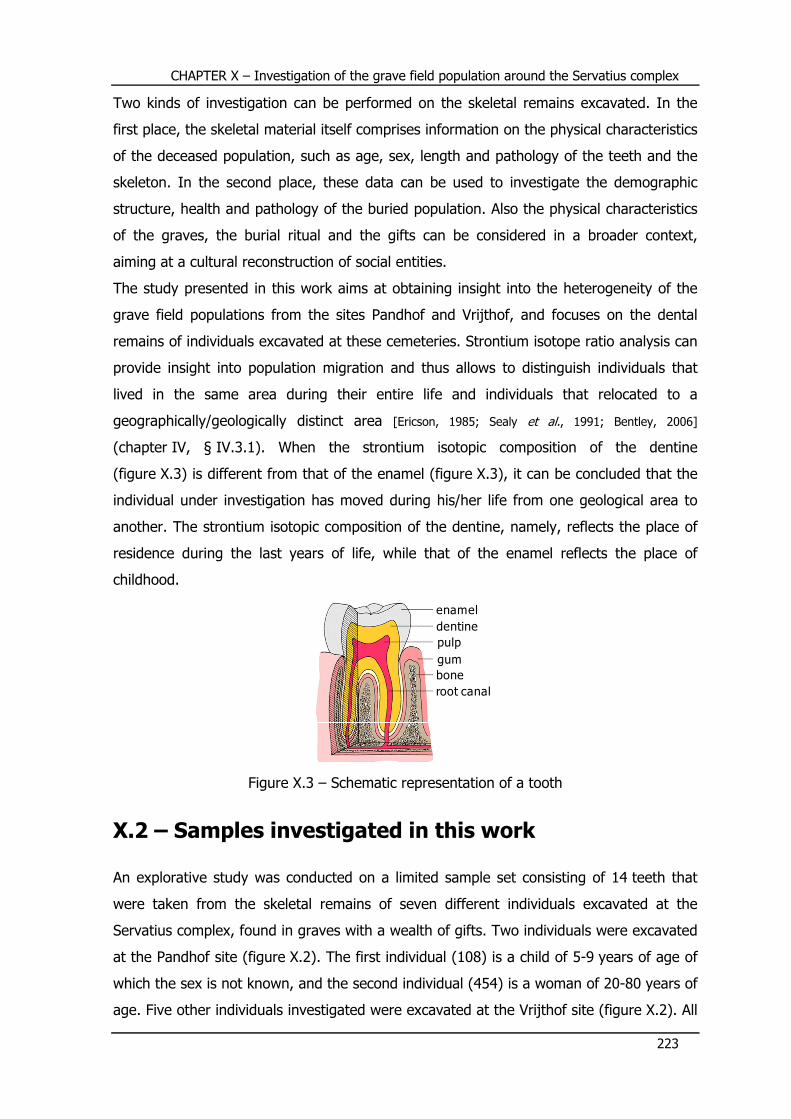
CHAPTER X – Investigation of the grave field population around the Servatius complex
223
Two kinds of investigation can be performed on the skeletal remains excavated. In the
first place, the skeletal material itself comprises information on the physical characteristics
of the deceased population, such as age, sex, length and pathology of the teeth and the
skeleton. In the second place, these data can be used to investigate the demographic
structure, health and pathology of the buried population. Also the physical characteristics
of the graves, the burial ritual and the gifts can be considered in a broader context,
aiming at a cultural reconstruction of social entities.
The study presented in this work aims at obtaining insight into the heterogeneity of the
grave field populations from the sites Pandhof and Vrijthof, and focuses on the dental
remains of individuals excavated at these cemeteries. Strontium isotope ratio analysis can
provide insight into population migration and thus allows to distinguish individuals that
lived in the same area during their entire life and individuals that relocated to a
geographically/geologically distinct area [Ericson, 1985; Sealy et al., 1991; Bentley, 2006]
(chapter IV, § IV.3.1). When the strontium isotopic composition of the dentine
(figure X.3) is different from that of the enamel (figure X.3), it can be concluded that the
individual under investigation has moved during his/her life from one geological area to
another. The strontium isotopic composition of the dentine, namely, reflects the place of
residence during the last years of life, while that of the enamel reflects the place of
childhood.
Figure X.3 – Schematic representation of a tooth
X.2 – Samples investigated in this work An explorative study was conducted on a limited sample set consisting of 14 teeth that
were taken from the skeletal remains of seven different individuals excavated at the
Servatius complex, found in graves with a wealth of gifts. Two individuals were excavated
at the Pandhof site (figure X.2). The first individual (108) is a child of 5-9 years of age of
which the sex is not known, and the second individual (454) is a woman of 20-80 years of
age. Five other individuals investigated were excavated at the Vrijthof site (figure X.2). All
enamel
dentine
pulp
gum
bone
root canal

CHAPTER X – Investigation of the grave field population around the Servatius complex
224
of them are women and 20-35 years of age. Both an incisor and a molar from the seven
individuals were available for investigation, hence forming a group of 4 teeth from the
Pandhof site and a group of 10 teeth from the Vrijthof site.
X.3 – Analytical methodology After leaching the whole teeth in 0.1 M acetic acid and carefully separating enamel and
dentine (chapter V, § V.1.1), these tissues were digested according to the digestion
protocol developed for this purpose (chapter V, § V.4.3). After digestion, the Sr content
and the Ca/P ratio of the digests was determined following the ICP-DRC-MS measurement
protocol developed hereto (chapter VII, § VII.2). Prior to the determination of the
87Sr/86Sr isotope ratios using a Neptune multi-collector ICP-MS instrument (chapter VII,
§ VII.3), the strontium fraction of the digests was isolated from the concomitant matrix by
means of extraction chromatography (chapter VI, § VI.3.2).
X.4 – Evaluation of diagenetic alteration As mentioned earlier (chapter IV, § IV.3.1), the occurrence of diagenesis may alter the
biogenic element concentrations and, in the case of Sr, result in a 87Sr/86Sr ratio that is
different from the biogenic 87Sr/86Sr ratio. When comparing the strontium isotopic
composition of enamel and dentine, it is important to verify a priori that the biogenic Sr
isotope ratios have not been altered by the addition of diagenetic strontium arising from
contamination during burial. Bone and dentine are susceptible to diagenesis [Price et al.,
1992; Hedges, 2002; Nielsen-Marsh and Hedges, 2000-a], while enamel is more resistant [Kohn et al.,
1999; Budd et al., 2000]. It has been argued that diagenetic strontium can be removed by
proper sample cleaning, e.g., with a weak acid [Price et al., 1992; Sillen and Sealy, 1995; Nielsen-
Marsh and Hedges, 2000-b]. The idea is that leaching skeletal tissue in 0.1-1 M acetic acid will
dissolve the diagenetic strontium present in carbonate in the pore spaces, while retaining
the original dietary strontium more strongly bound in the Ca site of the inorganic matrix
[Price et al., 1994; Ezzo et al., 1997]. Several diagenetic proxies, or indicators, have been
identified as useful for evaluating whether or not a significant diagenetic alteration has
taken place, such as changes in crystallinity, carbonate content and the concentration of
uranium and rare earth elements (REE) [Burton et al., 1999; Balter et al., 2002; Lee-Thorp and
Sponheimer, 2003; Labs-Hochstein and MacFadden, 2006]. Because of the very low U and REE
content in living organisms [Buseth et al., 1998; Hinners et al., 1998], elevated concentrations of
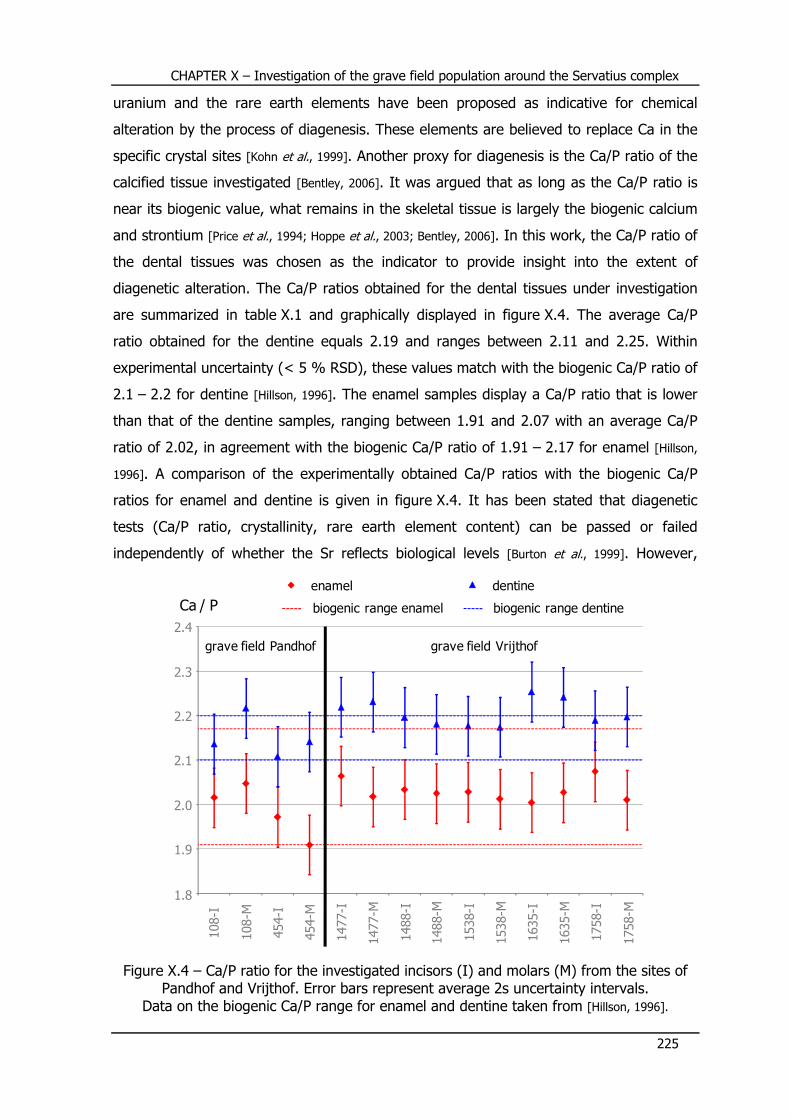
CHAPTER X – Investigation of the grave field population around the Servatius complex
225
uranium and the rare earth elements have been proposed as indicative for chemical
alteration by the process of diagenesis. These elements are believed to replace Ca in the
specific crystal sites [Kohn et al., 1999]. Another proxy for diagenesis is the Ca/P ratio of the
calcified tissue investigated [Bentley, 2006]. It was argued that as long as the Ca/P ratio is
near its biogenic value, what remains in the skeletal tissue is largely the biogenic calcium
and strontium [Price et al., 1994; Hoppe et al., 2003; Bentley, 2006]. In this work, the Ca/P ratio of
the dental tissues was chosen as the indicator to provide insight into the extent of
diagenetic alteration. The Ca/P ratios obtained for the dental tissues under investigation
are summarized in table X.1 and graphically displayed in figure X.4. The average Ca/P
ratio obtained for the dentine equals 2.19 and ranges between 2.11 and 2.25. Within
experimental uncertainty (< 5 % RSD), these values match with the biogenic Ca/P ratio of
2.1 – 2.2 for dentine [Hillson, 1996]. The enamel samples display a Ca/P ratio that is lower
than that of the dentine samples, ranging between 1.91 and 2.07 with an average Ca/P
ratio of 2.02, in agreement with the biogenic Ca/P ratio of 1.91 – 2.17 for enamel [Hillson,
1996]. A comparison of the experimentally obtained Ca/P ratios with the biogenic Ca/P
ratios for enamel and dentine is given in figure X.4. It has been stated that diagenetic
tests (Ca/P ratio, crystallinity, rare earth element content) can be passed or failed
independently of whether the Sr reflects biological levels [Burton et al., 1999]. However,
Figure X.4 – Ca/P ratio for the investigated incisors (I) and molars (M) from the sites of
Pandhof and Vrijthof. Error bars represent average 2s uncertainty intervals.
Data on the biogenic Ca/P range for enamel and dentine taken from [Hillson, 1996].
Ca / P
1.8
1.9
2.0
2.1
2.2
enamel
2.4
amphorabone dentine
2.3
108-I
108-M
454-I
454-M
1758-M
1758-I
1477-I
1477-M
1488-I
1635-M
1635-I
1538-M
1538-I
1488-M
grave field Pandhof grave field Vrijthof
biogenic range dentinebiogenic range enamel

CHAPTER X – In
vestig
atio
n of th
e grave fie
ld populatio
n around th
e Servatiu
s complex
226
Table X.1 – Ca/P ra
tio, S
r concentra
tion and 87Sr/
86Sr ra
tio fo
r the enamel and
dentin
e sa
mples fro
m th
e grave fie
ld populatio
ns o
f the site
s Pandhof a
nd Vrijth
of a
t the Servatiu
s complex, M
aastrich
t. * ty
pica
l uncerta
inty < 5 %
RSD
enamel 87Sr/86Sr
0.00004
0.70961
0.70964
0.70933
0.70928
0.70959
0.70979
0.70994
0.70978
0.70998
0.71006
0.70960
0.70941
0.71025
0.70966
[Sr] (µg g-1)
*
390
110
250
110
140
90
160
170
130
130
110
130
120
130
Ca/P
0.10
2.02
2.05
1.97
1.91
2.06
2.02
2.03
2.03
2.03
2.01
2.00
2.03
2.07
2.01
dentine 87Sr/86Sr
0.00004
0.70963
0.70962
0.70934
0.70931
0.71024
0.71028
0.71030
0.71017
0.71043
0.71051
0.71055
0.71033
0.71051
0.71024
[Sr] (µg g-1)
*
70
550
350
150
170
170
220
190
210
170
200
200
190
160
Ca/P
0.10
2.14
2.22
2.11
2.14
2.22
2.23
2.20
2.18
2.18
2.17
2.25
2.24
2.19
2.20
tooth type
external precision (2s)
grave field Pandhof
incisor
molar
incisor
molar
grave field Vrijthof
incisor
molar
incisor
molar
incisor
molar
incisor
molar
incisor
molar
108
108
454
454
1477
1477
1488
1488
1538
1538
1635
1635
1758
1758
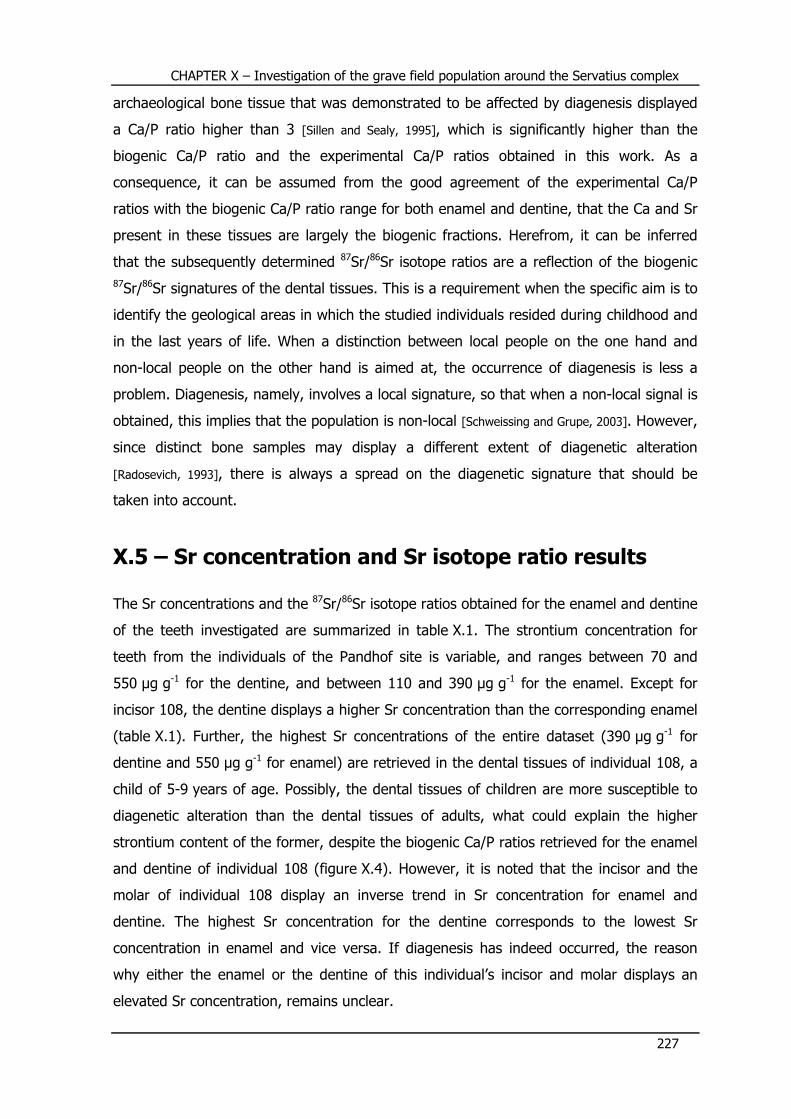
CHAPTER X – Investigation of the grave field population around the Servatius complex
227
archaeological bone tissue that was demonstrated to be affected by diagenesis displayed
a Ca/P ratio higher than 3 [Sillen and Sealy, 1995], which is significantly higher than the
biogenic Ca/P ratio and the experimental Ca/P ratios obtained in this work. As a
consequence, it can be assumed from the good agreement of the experimental Ca/P
ratios with the biogenic Ca/P ratio range for both enamel and dentine, that the Ca and Sr
present in these tissues are largely the biogenic fractions. Herefrom, it can be inferred
that the subsequently determined 87Sr/86Sr isotope ratios are a reflection of the biogenic
87Sr/86Sr signatures of the dental tissues. This is a requirement when the specific aim is to
identify the geological areas in which the studied individuals resided during childhood and
in the last years of life. When a distinction between local people on the one hand and
non-local people on the other hand is aimed at, the occurrence of diagenesis is less a
problem. Diagenesis, namely, involves a local signature, so that when a non-local signal is
obtained, this implies that the population is non-local [Schweissing and Grupe, 2003]. However,
since distinct bone samples may display a different extent of diagenetic alteration
[Radosevich, 1993], there is always a spread on the diagenetic signature that should be
taken into account.
X.5 – Sr concentration and Sr isotope ratio results The Sr concentrations and the 87Sr/86Sr isotope ratios obtained for the enamel and dentine
of the teeth investigated are summarized in table X.1. The strontium concentration for
teeth from the individuals of the Pandhof site is variable, and ranges between 70 and
550 µg g-1 for the dentine, and between 110 and 390 µg g-1 for the enamel. Except for
incisor 108, the dentine displays a higher Sr concentration than the corresponding enamel
(table X.1). Further, the highest Sr concentrations of the entire dataset (390 µg g-1 for
dentine and 550 µg g-1 for enamel) are retrieved in the dental tissues of individual 108, a
child of 5-9 years of age. Possibly, the dental tissues of children are more susceptible to
diagenetic alteration than the dental tissues of adults, what could explain the higher
strontium content of the former, despite the biogenic Ca/P ratios retrieved for the enamel
and dentine of individual 108 (figure X.4). However, it is noted that the incisor and the
molar of individual 108 display an inverse trend in Sr concentration for enamel and
dentine. The highest Sr concentration for the dentine corresponds to the lowest Sr
concentration in enamel and vice versa. If diagenesis has indeed occurred, the reason
why either the enamel or the dentine of this individual’s incisor and molar displays an
elevated Sr concentration, remains unclear.
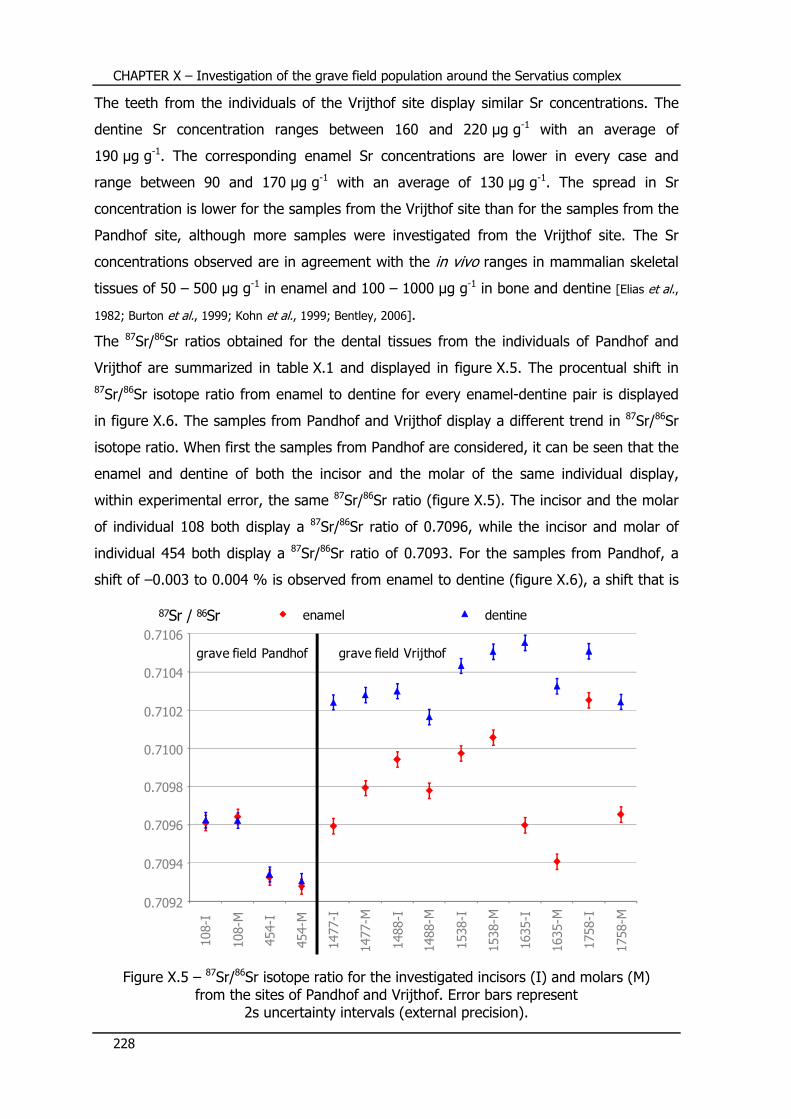
CHAPTER X – Investigation of the grave field population around the Servatius complex
228
The teeth from the individuals of the Vrijthof site display similar Sr concentrations. The
dentine Sr concentration ranges between 160 and 220 µg g-1 with an average of
190 µg g-1. The corresponding enamel Sr concentrations are lower in every case and
range between 90 and 170 µg g-1 with an average of 130 µg g-1. The spread in Sr
concentration is lower for the samples from the Vrijthof site than for the samples from the
Pandhof site, although more samples were investigated from the Vrijthof site. The Sr
concentrations observed are in agreement with the in vivo ranges in mammalian skeletal
tissues of 50 – 500 µg g-1 in enamel and 100 – 1000 µg g-1 in bone and dentine [Elias et al.,
1982; Burton et al., 1999; Kohn et al., 1999; Bentley, 2006].
The 87Sr/86Sr ratios obtained for the dental tissues from the individuals of Pandhof and
Vrijthof are summarized in table X.1 and displayed in figure X.5. The procentual shift in
87Sr/86Sr isotope ratio from enamel to dentine for every enamel-dentine pair is displayed
in figure X.6. The samples from Pandhof and Vrijthof display a different trend in 87Sr/86Sr
isotope ratio. When first the samples from Pandhof are considered, it can be seen that the
enamel and dentine of both the incisor and the molar of the same individual display,
within experimental error, the same 87Sr/86Sr ratio (figure X.5). The incisor and the molar
of individual 108 both display a 87Sr/86Sr ratio of 0.7096, while the incisor and molar of
individual 454 both display a 87Sr/86Sr ratio of 0.7093. For the samples from Pandhof, a
shift of –0.003 to 0.004 % is observed from enamel to dentine (figure X.6), a shift that is
Figure X.5 – 87Sr/86Sr isotope ratio for the investigated incisors (I) and molars (M)
from the sites of Pandhof and Vrijthof. Error bars represent 2s uncertainty intervals (external precision).
87Sr / 86Sr
0.7092
0.7094
0.7096
0.7098
0.7100
enamel
0.7104
amphorabone dentine
0.7102
108-I
108-M
454-I
454-M
1758-M
1758-I
1477-I
1477-M
1488-I
1635-M
1635-I
1538-M
1538-I
1488-M
grave field Pandhof grave field Vrijthof
0.7106
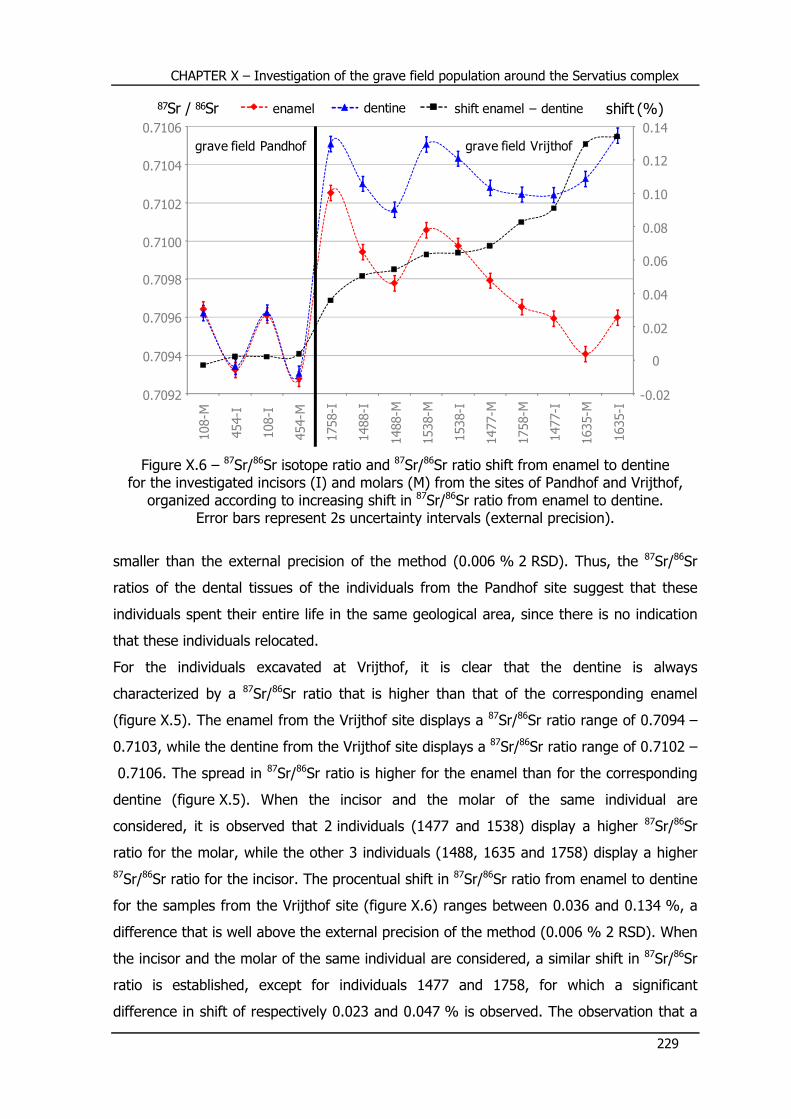
CHAPTER X – Investigation of the grave field population around the Servatius complex
229
Figure X.6 – 87Sr/86Sr isotope ratio and 87Sr/86Sr ratio shift from enamel to dentine
for the investigated incisors (I) and molars (M) from the sites of Pandhof and Vrijthof,
organized according to increasing shift in 87Sr/86Sr ratio from enamel to dentine. Error bars represent 2s uncertainty intervals (external precision).
smaller than the external precision of the method (0.006 % 2 RSD). Thus, the 87Sr/86Sr
ratios of the dental tissues of the individuals from the Pandhof site suggest that these
individuals spent their entire life in the same geological area, since there is no indication
that these individuals relocated.
For the individuals excavated at Vrijthof, it is clear that the dentine is always
characterized by a 87Sr/86Sr ratio that is higher than that of the corresponding enamel
(figure X.5). The enamel from the Vrijthof site displays a 87Sr/86Sr ratio range of 0.7094 –
0.7103, while the dentine from the Vrijthof site displays a 87Sr/86Sr ratio range of 0.7102 –
0.7106. The spread in 87Sr/86Sr ratio is higher for the enamel than for the corresponding
dentine (figure X.5). When the incisor and the molar of the same individual are
considered, it is observed that 2 individuals (1477 and 1538) display a higher 87Sr/86Sr
ratio for the molar, while the other 3 individuals (1488, 1635 and 1758) display a higher
87Sr/86Sr ratio for the incisor. The procentual shift in 87Sr/86Sr ratio from enamel to dentine
for the samples from the Vrijthof site (figure X.6) ranges between 0.036 and 0.134 %, a
difference that is well above the external precision of the method (0.006 % 2 RSD). When
the incisor and the molar of the same individual are considered, a similar shift in 87Sr/86Sr
ratio is established, except for individuals 1477 and 1758, for which a significant
difference in shift of respectively 0.023 and 0.047 % is observed. The observation that a
shift enamel – dentine87Sr / 86Sr
0.7092
0.7094
0.7096
0.7098
0.7100
0.7104
0.7102
108-I
108-M
454-I
454-M
1758-M
1758-I
1477-I
1477-M
1488-I
1635-M
1635-I
1538-M
1538-I
1488-M
grave field Pandhof grave field Vrijthof
0.7106
enamel dentine
-0.02
0
0.02
0.04
0.06
0.10
0.12
0.14
0.08
shift (%)

CHAPTER X – Investigation of the grave field population around the Servatius complex
230
difference in 87Sr/86Sr ratio is established for the enamel and dentine of all the individuals
from Vrijthof investigated, might suggest that the strontium present in both of these
dental tissues is of different geological origin. Probably the most likely explanation is that
the individuals excavated at the Vrijthof site resided, during the last years of life, in an
area that is geologically distinct from the area they resided in during childhood and thus,
that these individuals have relocated during their life history. Alternatively, but less likely,
the different 87Sr/86Sr ratio of enamel and dentine can be attributed to the consumption of
food from non-local origin.
A graphical presentation of the 87Sr/86Sr ratio versus the inverse of the Sr concentration is
given in figure X.7. The dentine from the individuals at the Vrijthof site constitutes a
rather compact group, while also the enamel samples can be considered as a rather
widely dispersed group. As opposed to the samples from the Vrijthof site, the enamel and
dentine samples from the Pandhof site form a widely dispersed and intermingled group
with a more narrow spread in 87Sr/86Sr ratio, which can probably in part be attributed to
the limited number of samples, but a wider Sr concentration range.
Figure X.7 – 87Sr/86Sr ratio versus the inverse of the Sr concentration for the
dentine and enamel from the individuals of Pandhof and Vrijthof. Error bars represent 2s uncertainty intervals (external precision).
On the basis of the 87Sr/86Sr ratio versus the inverse of the Sr concentration (figure X.7)
for the dentine samples, a clear difference is established between the individuals from
Pandhof on the one hand and the individuals from Vrijthof on the other hand. It could be
87Sr / 86Sr
0.7092
0.7094
0.7096
0.7098
0.7100
enamel Vrijthof
0.7104
0.7102
0.7106
0.000
1 / [Sr] (g µg-1)
0.012 0.0150.0090.0060.003
D
E
D
E
dentine Vrijthofdentine Pandhof
enamel Pandhof

CHAPTER X – Investigation of the grave field population around the Servatius complex
231
suggested that the individuals from both grave fields resided in a distinct geological area
during the last years of life.
The enamel samples from the Pandhof site display a 87Sr/86Sr ratio that overlaps with the
87Sr/86Sr ratio range displayed by the enamel samples from the Vrijthof site. Hence, on
the basis of the 87Sr/86Sr ratio in enamel, the individuals from the Pandhof site and the
Vrijthof site cannot be distinguished and thus it cannot be excluded that possibly all the
individuals investigated spent their childhood in the same geological area. However, the
Sr concentrations show a larger dispersion for the samples from the Pandhof site than for
that from the Vrijthof site. On the one hand, the larger spread in Sr concentration for the
samples from the Pandhof site is remarkable and when it would be considered as
significant, it could be an argument in stating that the population on the Pandhof site is
different from that on the Vrijthof site. On the other hand, the significance of the different
Sr concentrations for the populations from Pandhof and Vrijthof can be doubted, since Sr
concentrations in skeletal tissues are highly variable and susceptible to variations due to,
e.g., diet, so that the difference in concentration may not be linked to geological origin
but rather to a specific individual’s diet. Further, diagenesis may have had an influence on
the biogenic signals, despite the fact that the experimentally determined Ca/P ratios
reflect biogenic values. The analysis of more samples originating from the Pandhof site for
diagenetic proxies, Sr concentration and 87Sr/86Sr isotope ratio is necessary to provide the
answer to the question whether or not the differences in Sr concentration can be
attributed to a different origin of the populations on the Pandhof and the Vrijthof site.
X.6 – Conclusions and future The 87Sr/86Sr isotope ratio analysis of the dental remains of a limited number of
individuals from the Pandhof site and the Vrijthof site on the Servatius complex in
Maastricht (The Netherlands) suggest a difference between the populations of the two
grave fields. From the analysis of the teeth of 2 individuals from the Pandhof site, it
seems that this grave field has been used to bury individuals that did not move
throughout their life history. The analysis of the teeth of 5 individuals excavated at the
Vrijthof site revealed that probably these individuals have relocated during their life
history. However, it cannot be deduced from the current data which dentine 87Sr/86Sr ratio
is to be considered as the local (Maastricht) 87Sr/86Sr isotope ratio and thus which
individuals spent their last years of life in the Maastricht area.

CHAPTER X – Investigation of the grave field population around the Servatius complex
232
On the basis of the explorative 87Sr/86Sr isotope ratio study conducted on a small number
of individuals, two hypotheses can be put forward concerning the migration behavior of
the individuals investigated from these grave fields, be it without an identification of the
local 87Sr/86Sr ratio and thus without an identification of the local individuals. It is stressed
that further investigation is required to show which of the following hypotheses is a
reflection of the reality, and to clarify to which extent the hypotheses suggested are
applicable to the entire population of the Pandhof and Vrijthof sites.
One hypothesis may be that the dental tissues from Pandhof, characterized by an average
87Sr/86Sr ratio of 0.7095, stem from individuals that were born and spent their entire life in
the area of Maastricht. In this case, the individuals from the Vrijthof site were born in
either the Maastricht area, or a geologically slightly distinct area as reflected in their
enamel with an average bioavailable 87Sr/86Sr ratio of 0.7098, and moved throughout their
life to another geological area, different from the area of Maastricht, that is characterized
by a local 87Sr/86Sr ratio of 0.7104 or higher, as reflected in the dentine of these
individuals. As a consequence, it could be concluded that the Pandhof site was used to
bury individuals that lived their entire life locally, while individuals that migrated to
another area than Maastricht were transferred to the Servatius complex after death to be
buried at the Vrijthof site. Alternatively, these individuals may have reintegrated into the
Maastricht area but died very shortly after the reintegration.
Another hypothesis is based upon the assumption that the individuals excavated at the
Vrijthof site spent their last years of life in the area of Maastricht and that these
individuals moved only once from the place of birth to the Maastricht area. The average
dentine 87Sr/86Sr ratio of 0.7104 has arisen from the mixing of Sr from their place of birth,
reflected in their enamel strontium with an average 87Sr/86Sr ratio of 0.7098, and Sr from
the Maastricht area, that should display a bioavailable 87Sr/86Sr ratio equal to or higher
than 0.7104. The 87Sr/86Sr ratio of the dental tissues from the individuals at the Pandhof
site would indicate in this case that these individuals spent their entire life in an area that
is geologically distinct from the area in which the individuals from the Vrijthof site resided
during their last years of life, and would lead to the conclusion that the individuals
excavated at the Pandhof site were transferred to the Servatius complex after death to be
buried at the Pandhof site.
More research is needed to elucidate which hypothesis is the most likely. More enamel
and dentine samples from individuals from both grave fields should be analyzed for their
87Sr/86Sr ratios in order to clarify (i) if the individuals on the Pandhof site and the Vrijthof
site share a common place of birth, in other words, if the enamel of the individuals from

CHAPTER X – Investigation of the grave field population around the Servatius complex
233
both sites can be considered as one group in terms of its 87Sr/86Sr ratio and (ii) which
population displays the local bioavailable 87Sr/86Sr ratio in its dentine, and thus which
individuals resided in the Maastricht area during their last years of life. When the
conclusions are to be extended to the entire populations on the Pandhof and Vrijthof
sites, more research is required concerning the homogeneity of the population from each
grave field in terms of dental 87Sr/86Sr ratios. It was observed for the individuals of the
Vrijthof site that the incisor and the molar display the same trend in 87Sr/86Sr ratios, that
are however slightly different in absolute value. From this observation, in combination
with the knowledge that a specific diet (rich or poor in Sr) leads to a specific dentine
87Sr/86Sr ratio, it is likely that the uncertainty on the dental 87Sr/86Sr ratios has been
underestimated, so that the intra-population spread on the 87Sr/86Sr ratio needs to be
determined before concluding that a population has relocated. Further, also the
evaluation of diagenetic alteration can be extended to several diagenetic proxies, such as
the Ca/P ratio and the uranium and rare earth element contents. This will allow to obtain
a more reliable conclusion on the occurrence of diagenesis and to evaluate the biogenic
integrity of the experimental dental 87Sr/86Sr ratios with a higher degree of certainty.
In order to identify the local 87Sr/86Sr isotope ratio range, two approaches can be
followed. In a first approach, the 87Sr/86Sr ratio of the bioavailable Sr of the soil can be
determined, because this ratio characterizes the Sr that is taken up from local foods and
infers a change in the 87Sr/86Sr ratio of dentine after moving to a geologically distinct
area. A better approach to evaluate the local 87Sr/86Sr ratio is to use teeth instead of soil.
In this case, the 87Sr/86Sr ratio of the enamel of local small mammals, e.g., mice and
rodents, can provide a fair estimation [Hoppe et al., 1999; Price et al., 2002]. It was shown that
the variability in 87Sr/86Sr ratio is orders of magnitude smaller in animal bone and dental
tissues than in whole rocks and soils [Ezzo et al., 1997; Beard and Johnson, 2000; Price et al., 2002].
The danger when sampling modern animals is that they may consume imported foods or
local foods with ‘exotic’ strontium introduced through fertilizers or airborne sources of
strontium. In this respect, some snail species that exclusively feed on moss and thus,
reflect the local 87Sr/86Sr ratio in their shell, may be a better choice. Another, perhaps
even more reliable, approach to characterize the bioavailable local strontium is to analyze
archaeological teeth of an animal species that lived locally [Price et al., 2002; Bentley et al.,
2004; Knudson et al., 2004]. Domestic pigs are very useful in this respect, and the variability in
87Sr/86Sr ratio of pig enamel is half that of caprine and cattle, and even less than that in
human bone [Price et al., 2002; Bentley et al., 2004; Bentley and Knipper, 2005].


CHAPTER XI
Summary and conclusions


CHAPTER XI – Summary and conclusions
237
The aim of this work was to answer specific archaeological questions by means of results
obtained via isotopic analysis. The isotopic composition of strontium and lead, present in
low amounts in archaeological artefacts, was used to this purpose. A powerful technique
for isotope ratio analysis is inductively coupled plasma – mass spectrometry (ICP-MS).
Single-collector ICP-MS (SC-ICP-MS), in which the instrument is equipped with one
electron multiplier for ion detection, is suited for isotope ratio applications that do not
require the ultimate isotope ratio precision. However, when very small variations in
isotopic composition need to be addressed, multi-collector ICP-MS (MC-ICP-MS) is the
method of choice. In this work, both single-collector – and multi-collector ICP-MS were
used for isotope ratio analysis.
XI.1 – Analytical methodologies developed A first phase of this work was devoted to the development of analytical methodologies for
Pb and Sr isotope ratio analysis of archaeological artefacts. The collection of
archaeological artefacts investigated consisted of a variety of materials: soil samples,
bone and dental tissues, ceramics and metallic objects and fragments rich in copper,
silver and/or lead.
Since ICP-MS is, in its standard configuration, suited for the analysis of sample solutions,
the solid samples required to be dissolved prior to isotope ratio analysis. To this purpose,
a specific digestion procedure was developed for every sample type involved. Sample
digestion was performed by adding a well-chosen combination of concentrated mineral
acids (e.g., HNO3, HCl, HF, HClO4, H2O2) to a weighed amount (≤ 0.5 g) of homogenized
solid sample and submitting the sample-acid mixture to a microwave-assisted acid
digestion step, a hotplate digestion step, or a combination of both. The digestion
procedures developed for the various sample types succeeded in a complete dissolution of
the respective solid samples and all gave rise to quantitative target element recoveries, as
was proven by the digestion of certified reference materials with a matrix composition
similar to that of the respective sample types and analysis of the digests thus obtained.
The fact that a quantitative target element recovery was established for Sr and/or Pb,
assures that no isotopic fractionation of Sr or Pb could have been introduced by the
digestion process. Prior to acid digestion, the samples were cleaned, rinsed and prepared
for the subsequent digestion step. Soil and bone tissues were powdered by the use of a
microdismembrator, metallic objects were sampled by means of a miniature drill and
teeth were carefully cut by the use of a dental saw to obtain the separate dentine and

CHAPTER XI – Summary and conclusions
238
enamel fractions. The levels of Sr and Pb in the procedural blanks were found to be
negligible (< 0.1 %) compared to the levels of Sr and Pb present in the digested samples,
so that it can be concluded that the pretreatment step does not lead to significant
amounts of contamination.
Most of the sample types under investigation were characterized by a complex matrix
composition. In order to obtain accurate and precise isotope ratio data, a preliminary
isolation of the target element is required, especially when MC-ICP-MS will be
subsequently used for isotope ratio measurements. Hence, the next step was to develop
separation procedures that succeed in isolating Sr or Pb from the complex concomitant
matrix, preferably in pure form and in a quantitative way. An extraction chromatographic
separation, making use of a resin based on a crown ether (Sr specTM for Sr and Pb specTM
for Pb) was evaluated in its capability to meet these requirements. The optimization of the
separation procedure consisted of selecting suited reagents and determining the volumes
required for the removal of the concomitant matrix elements after loading the digest onto
the extraction chromatographic column, and for the subsequent elution of the purified Sr
or Pb fraction. It was found that the isolation of Sr by means of Sr specTM is accomplished
by (i) loading the digest in 7 M HNO3 onto the column, (ii) rinsing the column with
10 mL 7 M HNO3 for the removal of slightly retained concomitant matrix elements and (iii)
eluting the purified Sr fraction with 10 mL 0.05 M HNO3. This protocol was applied to the
isolation of Sr from digests of soil samples, bone and dental tissues, and was shown to
result in a quantitative Sr recovery, to allow the pure Sr fraction to be obtained and to
succeed in the complete separation of Sr from Rb. When these two elements are not
separated from one another, rubidium gives rise to an isobaric interference (87Rb+) on the
87Sr+ signal. The isolation of Pb by means of Pb specTM was performed in an analogous
manner. The digested sample, dissolved in 1 M HNO3, was loaded onto the extraction
chromatographic column. The removal of slightly retained concomitant matrix elements
was performed by rinsing the column with 10 mL 0.1 M HNO3 and the purified Pb fraction
was subsequently stripped from the column using a 0.05 M (NH4)2C2O4 solution. This
separation protocol was successfully applied to the isolation of Pb from digests of bone
tissue, soil samples, ceramics and metallic objects, and for each of these sample types, a
quantitative recovery was established. Further, the Pb fractions obtained were free of
residual matrix components. The isolation protocols for Sr and Pb were also applied to
isotopic standards, and the comparative Sr or Pb isotopic analysis of the respective
isotopic standards before and after the respective isolation protocol showed that no Sr or
Pb isotopic fractionation is introduced by the isolation process. Lastly, the possibility of

CHAPTER XI – Summary and conclusions
239
regenerating the extraction chromatographic resins, allowing multiple use of the same
column, was explored. It was found that rinsing with 100 mL milli-Q water is efficient in
regenerating the resin for at least a second use, without a loss in separation performance
or an influence on isotopic composition. This has been demonstrated by Sr and Pb
isotopic analysis of purified Sr or Pb fractions from certified reference materials that were
obtained with new and regenerated columns.
Strontium isotope ratio measurements were carried out using multi-collector ICP-MS. For
lead isotope ratio analysis, both single-collector ICP-MS and multi-collector ICP-MS were
used. Single-collector quadrupole-based ICP-MS is characterized by an isotope ratio
precision that is not sufficiently high for many isotope ratio applications. However, when
the quadrupole-based ICP-MS instrument is equipped with a dynamic reaction cell (DRC),
the use of a collision gas in the DRC allows an improved isotope ratio precision to be
obtained. A measurement protocol for Pb isotope ratio analysis was developed, making
use of Ne as a collision gas, introduced at a flow rate of 0.1 mL min-1 into the DRC of a
quadrupole-based ICP-MS instrument. It was demonstrated that the SC-ICP-DRC-MS
measurement protocol is more precise than traditional quadrupole-based ICP-MS, and
yields a Pb isotope ratio precision that is similar to the best precision reported for single-
collector sector field ICP-MS. A comparison of Pb isotope ratio results obtained via the SC-
ICP-DRC-MS measurement protocol to the corresponding results obtained via multi-
collector ICP-MS demonstrated that the single-collector measurement protocol provides
accurate isotope ratio results. Further, certified reference materials with a Pb isotopic
composition that is known from previous studies, were analyzed. The good agreement
between the Pb isotope ratios obtained in this work and results published in literature for
certified reference materials with a complex matrix composition confirms that the entire
analytical methodology developed – consisting of sample digestion, Pb isolation via
extraction chromatography, and isotope ratio measurement using single-collector ICP –
dynamic reaction cell – MS – is reproducible and yields accurate results that are similar to
those obtained via multi-collector ICP-MS and TI-MS, including the ratios with 204Pb.
Further, it is expected that this analytical methodology is applicable for a wide range of Pb
isotope ratio applications focusing on samples with a complex matrix composition.
The use of a well-chosen collision gas in a dynamic reaction cell results in an improved
isotope ratio precision. The introduction of a well-chosen reaction gas into the DRC allows
the analyte signals to be freed from spectral overlap originating from plasma-based or
matrix-based molecular ions via chemical resolution. A strategy was developed for the
simultaneous determination of P, Ca and Sr in dental tissue digests, in order to evaluate

CHAPTER XI – Summary and conclusions
240
the biogenic integrity of these tissues. The determination of P by means of ICP-MS is
hampered by the occurrence of NO+/NOH+ signals in the mass spectrum, Ca isotopes
mainly suffer from spectral interferences caused by Ar-containing molecular ions, and
when working with high Ca concentrations (as is the case for dental tissues), ArCa+
molecular ions interfere with the Sr+ signals. The use of NH3 in the dynamic reaction cell,
introduced at a flow rate of 0.8 mL min-1 and with an RPq setting of 0.65, resulted in a
significant reduction of signals arising from interfering ions, and an improvement of the
detection limit with at least a factor of 10 was established. The measurement protocol
was validated by the determination of P, Ca and Sr in certified reference materials, and
from the good agreement between certified concentrations and experimentally retrieved
concentrations, it was concluded that the measurement protocol yields accurate results.
XI.2 – Archaeological projects The analytical methodology developed for Sr and Pb isotopic analysis was, in a second
phase of this work, applied to archaeological artefacts, in the framework of three distinct
archaeological projects. Two projects focused on Pb isotope ratio analysis, in which,
respectively, provenancing of metallic objects and investigation of infant lead exposure in
the Roman Era were aimed at. A third project aimed at the use of Sr isotope ratios to
obtain insight into the migration behavior of historical individuals.
A first study focused on the provenance determination of metallic artefacts, excavated on
the archaeological sites of ed-Dur (Emirate of Umm al-Qaiwain, United Arab Emirates) and
Khor Rori (Oman), aiming at obtaining insight into the trade relations between the Roman
Empire and the Indian subcontinent in the period 1st century BC – 2nd century AD, and the
position of ed-Dur in the metal-trading network. The collection of metallic artefacts
studied consisted of silver objects and copper-based (unalloyed copper, brass and bronze)
and lead-based (lead and litharge) fragments and objects, that were investigated for their
Pb isotopic composition using single-collector ICP-DRC-MS. Provenancing the artefacts
was performed by comparing the experimentally determined Pb isotope ratios to Pb
isotope ratio data for copper and silver/lead ores from a wide range of geographical areas
over the old world. The copper-based objects excavated at the site of ed-Dur are linked to
ore sources from Cyprus, Sardinia and Spain, which implies that the ed-Dur objects are
made from Roman copper. Three bronze samples, excavated at the site of Khor Rori,
deviate in Pb isotopic composition from the samples excavated at ed-Dur. One of these
samples can be linked to Indian copper ores. This observation implies that, at least to
CHAPTER XI – Summary and conclusions
241
some extent, copper was produced in India at that time. The lead and litharge fragments,
except for 3 items, all show a very similar Pb isotopic composition and are grouped
around an ingot with a stamped monogram. The very good agreement with Sardinian and
Spanish ore sources allows the conclusion that this lead is of Roman origin. However, two
lead fragments show a Pb isotopic composition similar to that of the deviating bronze
sample from Khor Rori, and could be attributed to India. These two lead fragments from
ed-Dur are the first to demonstrate that India was exporting, and thus also producing,
lead before the 2nd century AD. The litharge fragments show a Pb isotopic composition
that is similar to that of the Roman ingot and the lead fragments, what implies that the
same lead is used in the cupellation process to obtain silver. The silver objects were
identified as stemming from Sardinian, Spanish and British ores, thus attributing their
provenance to the Roman Empire. Further, on the basis of the monogram imprinted on
the Roman lead ingot, it was suggested that metal was exported from the Roman Empire
to the Indian subcontinent via an itinerary from the Eastern Mediterranean across Syria,
to Palmyra. There, it was taken on the Euphrates and travelled downstream to the city of
Characene, and continuing its route down the Gulf to eventually reach ed-Dur for further
transport or local employment in, e.g., the purification of silver.
In a second study, the origin of high lead concentrations retrieved in infant bone tissue,
excavated at a Roman settlement in the village of Valkenburg (The Netherlands) was
investigated. The collection of samples consisted of infant bone tissue displaying elevated
Pb concentrations, along with samples from the surrounding soil and additional potential
sources of bone lead, such as fish bones, ceramics and lead fragments. The Pb isotopic
investigation of these artefacts has revealed that an important fraction of the lead found
at present in the bone tissue must already have been present at the moment of death,
thus that diagenesis – post-mortem lead exchange between bone and soil – is not the
main source of bone lead. Two sources of bone lead have been identified, namely, soil
and food. These sources are represented in four endmembers. Two endmembers are soils
that represent the upper continental crust and the local soil background. The lead
fragments and garum, a fermented fish sauce enriched with a syrup having a high lead
content, were identified as a third endmember. The fourth endmember was found to be a
pottery sherd stemming from a bowl that was used for the conservation of food. The
infant bone lead is a mixture of geogenic (soil) lead and dietary exposure lead, taken up
from, e.g., garum, drinking water and conserved food. It is likely that the infants have
been exposed to lead that was taken up by the mother and subsequently transferred to
the foetus during pregnancy.

CHAPTER XI – Summary and conclusions
242
The third project focused on the dental tissues (enamel and dentine) of the grave field
population around the basilica dedicated to the Saint Servatius in Maastricht (The
Netherlands). In an explorative study, the dental tissues of a small number of individuals
excavated on two sites, Pandhof and Vrijthof, were studied. The strontium isotopic
composition of enamel reflects the geological area of residence during childhood, while
that of dentine reflects the geological area of residence during the last years of life. A
difference in strontium isotopic composition of enamel and dentine hence implies that the
individual under study has relocated throughout his/her life history. A comparison of
87Sr/86Sr isotope ratios of dentine and enamel from individuals from the Pandhof and the
Vrijthof site suggests that the individuals buried on the Pandhof site did not relocate
during their life history, while the individuals at the Vrijthof site migrated from one area to
another geologically distinct area. From the enamel 87Sr/86Sr ratios, it cannot be excluded
that the individuals from Pandhof and Vrijthof spent their childhood in the same geological
area. However, the analysis of more samples from both the Pandhof and the Vrijthof site
is required to confirm or reject this hypothesis and to obtain insight into the homogeneity
of the populations of Pandhof and Vrijthof in terms of 87Sr/86Sr ratios. Within a population,
individuals having a different diet (e.g., poor or rich in Sr) will display a different dentine
87Sr/86Sr ratio. Further, from the present data it is not clear which individuals spent their
last years of life in the Maastricht area. To clarify this, the local bioavailable 87Sr/86Sr ratio
needs to be determined. This can be performed by determining the bioavailable 87Sr/86Sr
ratio from the soil, because this ratio characterizes the strontium that is taken up from the
food. Another, and better, way to evaluate the local bioavailable 87Sr/86Sr ratio is the
determination of the 87Sr/86Sr ratio of the enamel of local small mammals such as mice
and rodents, or that of the shell of snail species that exclusively feed on moss. The best
approach for characterizing the bioavailable local strontium is to analyze the enamel of an
archaeological animal species that certainly lived locally during the same period, such as
domestic pigs.

HOOFDSTUK XII
Samenvatting en besluit


HOOFDSTUK XII – Samenvatting en besluit
245
Het doel van dit werk bestond erin een antwoord te bieden op archeologische vragen
door middel van strontium- en looodisotopenanalyse. Een krachtige techniek voor de
bepaling van isotopenverhoudingen is inductief gekoppeld plasma – massaspectrometrie
(ICP-MS). Een ICP-MS instrument uitgerust met slechts één elektronenvermenigvuldiger
voor iondetectie (single-collector ICP-MS) is geschikt voor deze toepassingen waar een
uitmuntende isotopenprecisie niet vereist is. Wanneer echter heel kleine verschillen in
isotopische samenstelling dienen vastgesteld te worden, is multi-collector ICP-MS de
aangewezen techniek. In dit werk werden zowel single-collector – als multi-collector ICP-
MS aangewend voor isotopenanalyse.
XII.1 – Ontwikkelde analytische strategie Een eerste fase van dit werk was gewijd aan het ontwikkelen van analytische strategieën
voor strontium- en loodisotopenanalyse van archeologische artefacten. De verzameling
bestudeerde archeologische artefacten bestond uit bodemstalen, bot- en tandweefsels,
aardewerk en metallische objecten met een hoog koper-, zilver- en/of loodgehalte.
Gezien ICP-MS in de standaardconfiguratie geschikt is voor de analyse van vloeibare
monsters, was het noodzakelijk de aangeleverde artefacten vooraf in oplossing te
brengen. Hiertoe werd voor ieder type monster een specifieke digestieprocedure op punt
gesteld. De procedure bestond erin een welgekozen combinatie van minerale zuren
(HNO3, HCl, HF, HClO4, H2O2) toe te voegen aan een afgewogen hoeveelheid (≤ 0.5 g)
homogeen vast monster, en dit geheel te onderwerpen aan een microgolf-geassisteerde
zure digestie, een digestie in een beker op een verwarmplaat, of een combinatie van
beide. Elk type monster kon volledig in oplossing worden gebracht door het te
onderwerpen aan de geschikte digestieprocedure. De ontwikkelde digestieprocedures
werden gevalideerd door het toepassen van deze methoden voor digestie van
gecertificeerde referentiematerialen met een matrixsamenstelling gelijkaardig aan die van
het type monster waarvoor de procedure werd op punt gesteld, en de daaropvolgende
analyse wees op een kwantitatieve recovery van de targetelementen. Op basis van de
kwantitatieve recovery voor strontium en/of lood kon besloten worden dat er geen
isotopische fractionatie van strontium of lood werd geïntroduceerd door de digestiestap.
Voorafgaand aan de zure digestie werden de artefacten op een geschikte manier
schoongemaakt en gehomogeniseerd. Bodemmonsters en botweefsel werden verpulverd
door gebruik te maken van een microdismembrator, metallische artefacten werden
bemonsterd aan de hand van een miniatuur-boor en met behulp van aangepast

HOOFDSTUK XII – Samenvatting en besluit
246
gereedschap werd van de aangeleverde tanden het tandglazuur gescheiden van de
dentine. De gehaltes aan strontium en lood teruggevonden in de procedureblanco’s was
verwaarloosbaar (< 0.1 %) in vergelijking met de gehaltes aan strontium en lood in de in
oplossing gebrachte artefacten. Hieruit werd besloten dat er tijdens de
monstervoorbehandeling en de daaropvolgende digestie geen significante hoeveelheid
contaminatie optreedt.
Het merendeel van de onderzochte artefacten werd gekenmerkt door een complexe
matrixsamenstelling. Voorafgaand aan isotopische analyse, en vooral bij gebruik van
multi-collector ICP-MS, was het dan ook aangewezen het strontium of het lood te isoleren
van de begeleidende matrix. Bijgevolg was de volgende stap in de analytische strategie
het ontwikkelen van isolatieprocedures die er bij voorkeur in slagen het targetelement
kwantitatief en zuiver te isoleren van de begeleidende matrix. Als isolatiemethode werd
geopteerd voor een extractiechromatografische scheiding, gebruik makend van een hars
waarop zich een kroonether bevindt (Sr specTM voor Sr en Pb specTM voor Pb). De
optimalisatie van de isolatieprocedure bestond erin de geschikte reagentia te selecteren
die ervoor zorgen dat, in een eerste stap, het targetelement (Sr of Pb) sterk weerhouden
wordt door het hars terwijl de begeleidende matrixelementen van de kolom worden
gespoeld. De tweede stap bestaat er dan in door middel van een geschikt reagens de
zuivere Sr of Pb fractie van de kolom te elueren. De isolatie van strontium door middel
van Sr specTM werd bewerkstelligd door het opgeloste monster op te nemen in 7 M HNO3
en vervolgens op de kolom te brengen, de begeleidende matrixelementen te verwijderen
door de kolom te spoelen met 10 mL 7 M HNO3, en uiteindelijk de zuivere Sr fractie te
elueren met 10 mL 0.05 M HNO3. Deze isolatieprocedure werd toegepast op opgeloste
bodem- en botmonsters, en bleek efficiënt te zijn in het scheiden van Rb en Sr en verder
te resulteren in de zuivere Sr fractie op kwantitatieve wijze. Op analoge wijze als voor
Sr specTM werd Pb specTM geoptimaliseerd voor de isolatie van lood. Het opgeloste
monster werd opgenomen in 1.0 M HNO3 en op de kolom gebracht, de begeleidende
matrixelementen werden van de kolom gespoeld met 10 mL 0.1 M HNO3 en de gezuiverde
Pb fractie werd gerecupereerd met 10 mL 0.05 M (NH4)2C2O4 in milli-Q water. Deze
isolatieprocedure werd aangewend om lood te isoleren uit opgeloste bodemmonsters,
botweefsel, aardewerk en metallische fragmenten, en voor ieder type monster werd
vastgesteld dat de zuivere loodfractie, vrij van overtollige matrixelementen, op
kwantitatieve wijze werd bekomen. De extractiechromatografische procedures ontwikkeld
voor de isolatie van strontium en lood werden eveneens toegepast op isotopische
standaarden, en uit de later bepaalde isotopenverhoudingen kon besloten worden dat de

HOOFDSTUK XII – Samenvatting en besluit
247
isolatieprocedure voor zowel Sr als Pb geen isotopische fractionatie van Sr of Pb
introduceert. Tenslotte werd ook nog nagegaan of eenzelfde extractiechromatografische
kolom meerdere malen kan aangewend worden na regeneratie van het hars. De
regeneratie bleek mogelijk te zijn door, na gebruik van de kolom, deze te spoelen met
100 mL milli-Q water. Het op deze wijze geregenereerde hars werd daarna aangewend
voor de isolatie Sr of Pb uit een tweede opgelost bodem- of botmonster, en er werd
vastgesteld via Sr en Pb isotopische analyse van referentiematerialen, waarbij de zuivere
Sr of Pb fracties werden bekomen door gebruik van een nieuwe en een geregenereerde
kolom, dat de isolatie met een geregenereerde kolom dezelfde efficiënt vertoont als een
nieuwe kolom.
Multi-collector ICP-MS werd ingezet voor de bepaling van strontiumisotopenverhoudigen.
Loodisotopenverhoudingen werden bepaald via zowel single-collector – als multi-collector
ICP-MS. Single-collector ICP-MS geeft aanleiding tot een isotopenprecisie die niet
voldoende is voor vele toepassingen van isotopenanalyse. Wanneer echter een
quadrupool-gebaseerde ICP – massaspectrometer uitgerust is met een dynamische
reactiecel (DRC), laat het gebruik van een botsingsgas in deze DRC toe een verbeterde
isotopenprecisies te bekomen. In het kader van dit werk werd een meetprotocol
ontwikkeld voor de bepaling van loodisotopenverhoudingen door middel van SC-ICP-DRC-
MS. Wanneer neon wordt binnengeleid in de DRC aan een gasdebiet van 0.1 mL min-1,
werd vastgesteld dat isotopenprecisies werden bekomen die vergelijkbaar zijn met de
beste resultaten gerapporteerd voor single-collector sector veld ICP-MS. Verder werd
aangetoond, door het vergelijken van experimentele Pb isotopenverhoudingen bekomen
via SC-ICP-DRC-MS en de corresponderende Pb isotopenverhoudingen bekomen via MC-
ICP-MS, dat het ontwikkelde meetprotocol accurate resultaten oplevert. Daarnaast
werden ook een aantal referentiematerialen met een gekende isotopische samenstelling
geanalyseerd. Uit de uitstekende overeenkomst tussen de resultaten bekomen via de
ontwikkelde methodologie en literatuurwaarden bekomen via MC-ICP-MS of TI-MS kan
besloten worden dat de volledige analytische strategie, bestaande uit zure digestie,
isolatie van de zuivere Pb fractie, en het daaropvolgende meetprotocol via SC-ICP-DRC-
MS, aanleiding geeft tot accurate resultaten, die gelijkaardig zijn aan deze bekomen via
MC-ICP-MS en TI-MS, zelfs voor de isotopenverhoudingen met 204Pb. Het is heel
waarschijnlijk dat de ontwikkelde strategie met succes kan toegepast worden op een
brede waaier aan toepassingen waarin het bepalen van Pb isotopenverhoudingen in
complexe matrices centraal staat.

HOOFDSTUK XII – Samenvatting en besluit
248
Het gebruik van een geschikt botsingsgas in een dynamische reactiecel resulteert in een
verbeterde isotopenprecisie. De introductie van een weloverwogen geselecteerd
reactiegas in de dynamische reactiecel laat toe spectrale interferenties, veroorzaakt door
matrix- of plasma-gerelateerde ionen, te onderdrukken via chemische resolutie. Een
meetprotocol werd op punt gesteld voor de gelijktijdige bepaling van P, Ca en Sr in
opgelost tandweefsel, met als doel de biogene integriteit van deze weefsels te
beoordelen. De bepaling van P door middel van ICP-MS wordt bemoeilijkt door de
signalen afkomstig van NO+ en NOH+ moleculaire ionen in het massaspectrum. De
isotopen van calcium worden voornamelijk geïnterfereerd door Ar-bevattende moleculaire
ionen, en wanneer gewerkt wordt met hoge Ca concentraties – zoals het geval is bij
tandweefsel – veroorzaken ArCa+ ionen spectrale overlap met de Sr+ signalen. Het
gebruik van NH3 als reactiegas in de dynamische reactiecel, geïntroduceerd in de DRC
met een debiet van 0.8 mL min-1 en met een RPq instelling van 0.65, zorgde voor een
significante reductie van de signalen afkomstig van interfererende ionen en een
verbetering van de detectielimiet met tenminste een factor 10. Het meetprotocol werd
gevalideerd door de bepaling van P, Ca en Sr in opgeloste bot gecertificeerde
referentiematerialen, en uit de goede overeenkomst tussen de gecertificeerde en de
experimenteel bepaalde resultaten werd besloten dat het ontwikkelde meetprotocol leidt
tot accurate resultaten.
XII.2 – Archeologische projecten De analytische strategie ontwikkeld voor Sr en Pb isotopische analyse werd in een tweede
fase van dit werk toegepast op archeologische artefacten. In twee projecten was lood het
targetelement, en werd Pb isotopenanalyse ingezet voor, respectievelijk, de
herkomstbepaling van metallische artefacten, en onderzoek naar blootstelling aan lood
gedurende de kindertijd in het Romeinse tijdperk. In een derde project werd gepoogd
inzicht te verkrijgen in migratie van individuen door middel van variaties in de strontium
isotopische samenstelling van hun tandweefsels.
In een eerste studie werden loodisotopenverhoudingen aangewend voor de
herkomstbepaling van metallische artefacten die blootgelegd werden op de
archeologische sites ed-Dur (Emiraat van Umm al-Qaiwain, Verenigde Arabische
Emiraten) en Khor Rori (Oman). Het doel van deze studie was een dieper inzicht te
verschaffen in de handelsrelaties tussen het Romeinse Rijk en het Indische subcontinent
en de positie van ed-Dur in dit netwerk gedurende de periode 1ste eeuw vC – 2e eeuw nC.

HOOFDSTUK XII – Samenvatting en besluit
249
De collectie metallische artefacten bestond uit fragmenten en objecten rijk in koper
(zuiver koper, messing en brons), lood (lood en loodglit fragmenten) of zilver. De
herkomstbepaling werd uitgevoerd door het vergelijken van de experimentele Pb
isotopenverhoudingen met waarden voor koper en zilver/lood ertsen van vrijwel de gehele
oude wereld. Dit wees uit dat de fragmenten rijk in koper gevonden op de site ed-Dur
gelinkt zijn aan ertsen van Cyprus, Sardinië en Spanje, wat impliceert dat deze
fragmenten vervaardigd zijn met Romeins koper. Drie bronzen fragmenten, gevonden op
de site Khor Rori, vertonen een duidelijk verschillende Pb isotopische samenstelling en
één van deze bronzen fragmenten kan met hoge waarschijnlijkheid gelinkt worden aan
Indische koperertsen. Deze vaststelling suggereert dat India in deze tijd koper won uit
ertsen en dat ook exporteerde. De loden en loodglit fragmenten vertonen een heel
gelijkaardige isotopische samenstelling, en vormen een nauw veld dat gecentreerd is rond
een verhandelbare blok lood (ingot). Twee loden fragmenten vertonen echter een Pb
isotopische samenstelling gelijkaardig aan die van het, vermoedelijk Indische, bronzen
fragment van Khor Rori, wat leidt tot de suggestie dat ook deze twee fragmenten van
Indische oorsprong zijn. Deze twee fragmenten zijn de eerste aanwijzingen dat India voor
de 2e eeuw nC lood won uit loodertsen en dit lood ook exporteerde. De loodglit
fragmenten worden gekarakteriseerd door een Pb isotopische samenstelling gelijkaardig
aan die van de ingot en de andere loden fragmenten, wat erop wijst dat lood van
dezelfde oorsprong werd gebruikt voor het zuiveringsproces van zilver. De zilveren
objecten kunnen gelinkt worden aan ertsen van Sardinië, Spanje en het Verenigd
Koninkrijk, wat erop wijst dat ook de oorsprong van deze objecten Romeins is. Verder
kon, op basis van het monogram teruggevonden op de Romeinse ingot, een route
gesuggereerd worden via dewelke lood geëxporteerd werd vanuit het Romeinse Rijk naar
het Indische subcontinent. Met een grote waarschijnlijkheid werd het lood via de
oostelijke Middellandse Zee getransporteerd doorheen Syrië tot Palmyra. Vanaf Palmyra
werd het verscheept over de Eufraat naar de stad Characene en dan verder via de Golf
naar ed-Dur. Eens aangekomen in ed-Dur werd het lood lokaal gebruikt, of
getransporteerd richting India.
In een tweede studie werd de bron van hoge loodconcentraties, teruggevonden in het
botweefsel van overleden pasgeboren Romeinse kinderen, onderzocht. De kinderskeletjes
werden opgegraven in Valkenburg (Nederland). De collectie onderzochte artefacten
bestond uit botweefsel met een verhoogde loodconcentratie, monsters van de
omringende bodem en andere potentiële bronnen voor lood in het bot, zoals visgraten,
aardewerk en loden fragmenten. De bepaling van de lood-isotopische samenstelling van
HOOFDSTUK XII – Samenvatting en besluit
250
deze artefacten heeft uitgewezen dat een belangrijke fractie van het lood teruggevonden
in het botweefsel daar reeds aanwezig was op het tijdstip van overlijden, en dus dat
diagenese – de post-mortem lood uitwisseling tussen bodem en bot – niet de
voornaamste bron is van het lood in het botweefsel. Twee bronnen voor lood in bot zijn
geïdentificeerd, namelijk, de bodem en het voedsel. De bodem als bron voor bot-lood
wordt vertegenwoordigd door de aardkorst en een bodem die representatief is voor de
lokale geogene lood achtergrond. De voeding als bron wordt vertegenwoordigd door
enerzijds de loden fragmenten, samen met garum, een gefermenteerde vissaus waaraan
sapa, een zoete siroop met een hoog loodgehalte, werd toegevoegd, en anderzijds een
potscherf, die afkomstig is van een kom van aardewerk waarin voedsel werd bewaard.
Het lood teruggevonden in de kinderbotjes is een mengsel van geogeen (bodem) lood, en
lood opgenomen via de voeding uit garum, drinkwater en bewaard voedsel. Het is
waarschijnlijk dat de kinderen werden blootgesteld aan lood dat door de moeder werd
opgenomen via de voeding, en vervolgens werd doorgegeven aan de foetus gedurende
de zwangerschap.
Het derde project had als doel de strontium isotopische samenstelling te bepalen van
tandweefsels (glazuur en dentine) van de grafveldpopulatie rond de basiliek opgedragen
aan de Heilige Servatius (Maastricht, Nederland). In een verkennende studie werden de
tanden van een klein aantal individuen, opgegraven op de sites Pandhof en Vrijthof,
bestudeerd. De strontium isotopische samenstelling van het tandglazuur weerspiegelt het
geologische gebied waarin een individu verbleef gedurende zijn/haar kindertijd, terwijl
deze van dentine een weerspiegeling is van het geologische gebied waarin een individu
de laatste jaren van zijn/haar leven doorbracht. Een verschil in strontium isotopische
samenstelling voor tandglazuur en dentine wijst er dus op dat een individu gedurende
zijn/haar leven gemigreerd heeft van een welbepaald geologisch gebied naar een ander,
geologisch verchillend, gebied. Uit een vergelijking van de experimentele 87Sr/86Sr
isotopenverhoudingen teruggevonden voor de individuen van Pandhof en Vrijthof kan
gesuggereerd worden dat de individuen van Pandhof hun hele leven hebben doorgebracht
in eenzelfde geologische streek, terwijl de individuen van Vrijthof migreerden naar een
geologisch verschillende streek. Verder onderzoek is echter nodig om deze hypotheses te
bevestigen, of te verwerpen. De analyse van bijkomende glazuur- en dentine monsters is
nodig om een inzicht te verkrijgen in de homogeneïteit van de 87Sr/86Sr
isotopenverhouding binnen de populaties van Pandhof en Vrijthof. Immers kan de dentine
van individuen uit eenzelfde populatie een verschillende 87Sr/86Sr isotopenverhouding
vertonen naar gelang het dieet van die persoon (vb. arm of rijk in Sr). Verder kan uit de

HOOFDSTUK XII – Samenvatting en besluit
251
huidige data niet worden afgeleid welke onderzochte individuen hun laatste levensjaren
doorbrachten in de streek van Maastricht. Om dit op te helderen dient de lokale
biobeschikbare 87Sr/86Sr isotopenverhouding te worden bepaald. Dit kan gedaan worden
door het biobeschikbare strontium te extraheren uit de bodem en de 87Sr/86Sr verhouding
van deze fractie te bepalen, aangezien deze isotopenverhouding het strontium
karakteriseert dat wordt opgenomen via de voeding. Een andere, en betere, manier om
de biobeschikbare 87Sr/86Sr verhouding te achterhalen is de 87Sr/86Sr verhouding te
bepalen van het tandglazuur van lokale zoogdieren, zoals muizen en knaagdieren, of deze
van slakkenhuisjes van slakkensoorten die zich enkel voeden met mos. De beste manier,
echter, is de 87Sr/86Sr analyse van het tandglazuur van archeologische dieren die met
zekerheid lokaal verbleven gedurende dezelfde periode, zoals bijvoorbeeld varkens.


References


REFERENCES
255
[Alfassi and Wai, 1992] – ZB Alfassi and CM Wai (1992) Preconcentration techniques for trace elements. CRC Press, Boston [Almeida and Vasconcelos, 2001] – CM Almeida and MTSD Vasconcelos (2001) J Anal At Spectrom 16:607-611 [Anbar, 2004] – AD Anbar (2004) Molybdenum stable isotopes: observations, interpretations and directions. In: CM Johnson, BL Beard and F Albaréde (eds) Reviews in mineralogy & geochemistry, vol. 55. Geochemistry of non-traditional stable isotopes. Mineralogical Society of America, Washington:429-454 [Anbar et al., 2000] – AD Anbar, JE Roe, J Barling and KH Nealson (2000) Science 288:126-128 [Anbar et al., 2001] – AD Anbar, KA Knab and J Barling (2001) Anal Chem 73:1425-1431 [Andrén et al., 2004] – H Andrén, I Rodushkin, A Stenberg, D Malinovsky and DC Baxter (2004) J Anal At Spectrom 19:1217-1224 [Anicich, 1993] – VG Anicich (1993) Astrophys J Suppl Ser 84:215-315 [Appelblad et al., 2001] – PK Appelblad, I Rodushkin and DC Baxter (2001) Anal Chem 73:2911-2919 [Arnay-De-La-Rosa et al., 1998] – M Arnay-De-La-Rosa, E Gonzalez-Reimers, J Velasco-Vazquez, L Galindo-Martin, E Delgado-Ureta, F Santolaria-Fernandez and N Barros-Lopez (1998) Sci Total Envir 209:107-111 [Attanasio et al., 2001] – D Attanasio, G Bultrini and GM Ingo (2001) Archaeometry 43:529-547 [Aufderheide, 1989] – AC Aufderheide (1989) Chemical analysis of skeletal remains. In: MY Iscan and KAR Kennedy (eds) Reconstruction of like from the skeleton. Liss Inc., New York:237-260 [Avanzini, 2002] – A Avanzini (2002) Khor Rori report 1. In: A Avanzini (ed) Arabia antica. Universita di Pisa, Pisa [Baker et al., 2004] – J Baker, D Peate, T Waight and C Meyzen (2004) Chem Geol 211:275-303 [Baker et al., 2006] – J Baker, S Stos and T Waight (2006) Archaeometry 48:45-56 [Balcaen et al., 2005] – L Balcaen, I De Schrijver, L Moens and F Vanhaecke (2005) Int J Mass Spectrom 242:251-255 [Balter et al., 2002] – V Balter, H Bocherens, A Person, N Labourdette, M Renard and B Vandermeersch (2002) Palaeogeogr Palaeoclimatol Palaeoecol 186:127-143 [Bandura and Tanner, 1999] – DR Bandura and SD Tanner (1999) At Spectrosc 20:69-72 [Bandura et al., 2000] – DR Bandura, VI Baranov and SD Tanner (2000) J Anal At Spectrom 15:921-928 [Bandura et al., 2001] – DR Bandura, VI Baranov and SD Tanner (2001) Fresenius J Anal Chem 370:454-470 [Bandura et al., 2004] – DR Bandura, O Ornatsky and L Liao (2004) J Anal At Spectrom 19:96-100 [Baranov and Tanner, 1999] – VI Baranov and SD Tanner (1999) J Anal At Spectrom 14:1133-1142 [Barbaste et al., 2002] – M Barbaste, K Robinson, S Guilfoyle, B Medina and R Lobinski (2002) J Anal At Spectrom 17:135-137 [Barnes et al., 1974] – IL Barnes, WR Shields, TJ Murphy and RH Brill (1974) Isotopic analysis of Laurion lead ores. In: CW Beck (ed) Archaeological chemistry. American Chemical Society, Washington:1-10 [Barone, 1982] – JP Barone (1982) The role of hydroxyapatite in biological systems. In: LJ Anghileri and AM Tuffet-Anghileri (eds) The role of calcium in biological systems, volume 1. CRC Press, Boca Raton:27-40 [Barone et al., 2004] – G Barone, V Crupi, S Galli, F Longo, D Majolino, P Mazzoleni and S Spagnolo (2004) Archaeometry 46:553-568

REFERENCES
256
[Barone et al., 2005] – G Barone, A Lo Giudice, P Mazzoleni, A Pezzino, D Barilaro, V Crupi and M Triscari (2005) Archaeometry 47:745-762 [Bashkin, 2002] – VN Bashkin (2002) Modern Biogeochemistry. Kluwer Academic, Dordrecht [Beard and Johnson, 2000] – BL Beard and CM Johnson (2000) J Forensic Sci 45:1049-1061 [Beauchemin et al., 1988] – D Beauchemin, JW McLaren and SS Berman (1988) J Anal At Spectrom 3:775-780 [Begemann et al., 2001] – F Begemann, S Schmitt-Strecker, E Pernicka and F Lo Schiavo (2001) Eur J Archaeol 4:43-85 [Begley and Sharp, 1994] – IS Begley and BL Sharp (1994) J Anal At Spectrom 9:171-176 [Begley and Sharp, 1997] – IS Begley and BL Sharp (1997) J Anal At Spectrom 12:395-402 [Bellis et al., 2008] – DJ Bellis, KM Hetter, MF Verostek and PJ Parsons (2008) J Anal At Spectrom 23:298-308 [Belshaw et al., 1998] – NS Belshaw, PA Freedman, RK O’Nions, M Frank and Y Guo (1998) Int J Mass Spectrom 181:51-58 [Belshaw et al., 2000] – NS Belshaw, XK Zhu, Y Guo and RK O’Nions (2000) Int J Mass Spectrom 197:191-195 [Bentley, 2006] – RA Bentley (2006) J Archaeol Method Theory 13:135-187 [Bentley and Knipper, 2005] – RA Bentley and C Knipper (2005) Archaeometry 47:629-644 [Bentley et al., 2004] – RA Bentley, TD Price and E Stephan (2004) J Archaeol Sci 31:365-375 [Bettinelli et al., 2000-a] – M Bettinelli, C Baffi, GM Beone and S Spezia (2000) At Spectrosc 21:50-59 [Bettinelli et al., 2000-b] – M Bettinelli, GM Beone, S Spezia and C Baffi (2000) Anal Chim Acta 424:289-296 [Bigeleisen, 1998] – J Bigeleisen (1998) Proc Natl Acad Sci USA 95:4808-4809 [Bigeleisen and Mayer, 1947] – J Bigeleisen and MG Mayer (1947) J Chem Phys 15:261-267 [Bigi et al., 1997] – A Bigi, G Cojazzi, S Panzavolta, A Ripamonti, N Roveri, M Romanello, KN Suarez and L Moro (1997) J Inorg Biochem 68:45-51 [Birck, 2004] – JL Birck (2004) An overview of isotopic anomalies in extraterrestrial materials and their nucleosynthetic heritage. In: CM Johnson, BL Beard and F Albaréde (eds) Reviews in mineralogy & geochemistry, vol. 55. Geochemistry of non-traditional stable isotopes. Mineralogical Society of America, Washington:25-64 [Blum et al., 2000] – JD Blum, EH Taliaferro, MT Weisse and RT Holmes (2000) Biogeochemistry 49:87-101 [Boni et al., 2000] – M Boni, G Di Maio, R Frei and IM Villa (2000) Archaeometry 42:201-208 [Botto and Zhu, 1994] – RI Botto and JJ Zhu (1994) J Anal At Spectrom 9: 905-912 [Boucharlat et al., 1988] – R Boucharlat, E Haerinck, CS Phillips and DT Potts (1988) Akkadica 58:1-26 [Boulyga et al., 2007] – SF Boulyga, U Klötzli, G Stingeder and T Prohaska (2007) Anal Chem 79:7753-7760 [Bower et al., 2005] – NW Bower, SR Getty, CP Smith, ZR Simpson and JM Hoffman (2005) Int J Osteoarchaeol 15:360-370 [Bower et al., 2007] – NW Bower, SA McCants, JM Custodio, ME Ketterer, SR Getty and JM Hoffman (2007) Sci Total Envir 372:463-473 [Brännvall et al., 1999] – ML Brännvall, R Bindler, I Renberg, O Emteryd, J Bartnicki and K Billstrom (1999) Environ Sci Technol 33:4391-4395

REFERENCES
257
[Braun and Ghersini, 1975] – T Braun and G Ghersini (1975) Extraction Chromatography. Elsevier, New York [Brilli et al., 2005] – M Brilli, G Cavazzini and B Turi (2005) J Archaeol Sci 32:1543-1551 [Budd et al., 2000] – P Budd, J Montgomery, B Barreiro and RG Thomas (2000) Appl Geochem 15:687-694 [Bult and Hallewas, 1986] – EJ Bult and DP Hallewas (1986) Graven bij Valkenburg I: het archeologisch onderzoek in 1985. Delft [Bult and Hallewas, 1987] – EJ Bult and DP Hallewas (1987) Graven bij Valkenburg II: het archeologisch onderzoek in 1986. Delft [Bult and Hallewas, 1990] – EJ Bult and DP Hallewas (1990) Graven bij Valkenburg III: het archeologisch onderzoek in 1987 en 1988. Delft [Burton et al., 1999] – JH Burton, TD Price and WD Middleton (1999) J Archaeol Sci 26:609-616 [Busch et al., 1988] – KL Busch, GL Glish and SA McLuckey (1988) Mass spectrometry: techniques and applications of tandem mass spectrometry. VCH, New York [Buseth et al., 1998] – E Buseth, G Wibetoe and I Martinsen (1998) J Anal At Spectrom 13:1039-1049 [Butler et al., 1997] – WT Butler, HH Ritchie and ALJJ Bronckers (1997) Extracellular matrix proteins of dentine. In: DJ Chadwick and G Cardew (eds) Dental enamel. Wiley, Chichester:107-117 [Capo et al., 1998] – RC Capo, BW Stewart and OA Chadwick (1998) Geoderma 82:197-225 [Carey and Caruso, 1992] – JM Carey and JA Caruso (1992) Crit Rev Anal Chem 23:397-439 [Carlson, 1996] – AK Carlson (1996) J Archaeol Sci 23:557-567 [Celsus] – Celsus, De Medicina. Translated in EH Warmington (1971) De Medicina. Harvard University Press, Cambridge [Chakraborti, 1966] – H Chakraborti (1966) Trade and commerce of ancient India (c. 200 BC – c AD 650). Academic Publishers, Calcutta [Chamberlain et al., 1997] – CP Chamberlain, JD Blum, RT Holmes, XH Feng, TW Sherry and GR Graves (1997) Oecologia 109:132-141 [Chen and Jiang, 2002] – KL Chen and SJ Jiang (2002) Anal Chim Acta 470:223-228 [Chiaradia et al., 2003] – M Chiaradia, A Gallay and W Todt (2003) Appl Geochem 18:353-370 [Cloquet et al., 2005] – C Cloquet, O Rouxel, J Carignan and G Libourel (2005) Geostand Geoanal Res 29:95-106 [Cloquet et al., 2006-a] – C Cloquet, J Carignan, G Libourel, T Sterckeman and E Perdrix (2006) Environ Sci Technol 40:2525-2530 [Cloquet et al., 2006-b] – C Cloquet, J Carignan and G Libourel (2006) Atmos Environ 40:574-587 [Collerson et al., 2002] – KD Collerson, BS Kamber and R Schoenberg (2002) Chem Geol 188:65-83 [Columella] – Columella, De Re Rustica. Translated in K Ahrens (1976) Über Landwirtschaft: ein Lehr- und Handbuch der gesamten Acker- und Viehwirtschaft aus dem 1. Jahrhundert u.Z.. Akad-Verlag, Berlin [Coplen et al., 2002] – TB Coplen, JK Böhlke, P De Bièvre, T Ding, NE Holden, JA Hopple, HR Krouse, A Lamberty, HS Peiser, K Révész, SE Rieder, KJR Rosman, E Roth, PDP Taylor, RD Vocke and YK Xiao (2002) Pure Appl Chem 74:1987-2017 [Craddock, 1995] – PT Craddock (1995) Early metal mining and production. Edinburgh University Press, Edinburgh

REFERENCES
258
[Daems, 2004-a] – A Daems (2004) Arab Arch Epig 15:92-104 [Daems, 2004-b] – A Daems (2004) Arab Arch Epig 15:229-239 [Dams et al., 1995] – RFJ Dams, J Goossens and L Moens (1995) Microchim Acta 119:277-286 [Darbyshire and Sewell, 1997] – DPF Darbyshire and RJ Sewell (1997) Chem Geol 143:81-93 [Darke and Tyson, 1994] – SA Darke and JF Tyson (1994) Microchem J 50:310-336 [Date and Gray, 1981] – AR Date and AL Gray (1981) Analyst 106:1255-1267 [Date and Gray, 1983-a] – AR Date and AL Gray (1983) Int J Mass Spectrom Ion Proc 48:357-360 [Date and Gray, 1983-b] – AR Date and AL Gray (1983) Analyst 108:159-165 [Date and Gray, 1983-c] – AR Date and AL Gray (1983) Spectrochim Acta B 38:29-37 [Date and Gray, 1985] – AR Date and AL Gray (1985) Spectrochim Acta B 40:115-122 [Davis et al., 1990] – AM Davis, A Hashimoto, RN Clayton and TK Mayeda (1990) Nature 347:655-658 [De Bièvre et al., 1993] – P De Bièvre, JR De Laeter, HS Peiser and WP Reed (1993) Mass Spectrom Rev 12:143-172 [De Hoffmann et al., 1996] – E De Hoffmann, J Charette and V Stroobant (1996) Mass spectrometry. Masson, Paris:39-98 [De Laeter et al., 2003] – JR De Laeter, JK Böhlke, P De Biévre, H Hidaka, HS Peiser, KJR Rosman and PDP Taylor (2003) Pure Appl Chem 75:683-800 [De Wannemacker et al., 2000] – G De Wannemacker, F Vanhaecke, L Moens, A Van Mele and H Thoen (2000) J Anal At Spectrom 15:323-327 [de Wolff et al., 2001] – FA de Wolff, TJ Hessing, E Smits and GB van der Voet (2001) Toxicol Sci suppl:60 [de Wolff et al., 2008] – F de Wolff, E Smits, D De Muynck, C Cloquet, L Moens and F Vanhaecke (2008) in preparation [Degryse et al., 2006] – P Degryse, J Schneider, U Haack, V Lauwers, J Poblome, M Waelkens and P Muchez (2006) J Archaeol Sci 33:494-501 [Delrue, 2006] – P Delrue (2006) Arab Arch Epig 17:201-213 [Delrue, 2008] – P Delrue (2008) Archaeometallurgical analyses of pre-islamic artefacts from ed-Dur (Emirate of Umm al-Qaiwain, U.A.E.). PhD dissertation, Department of Languages and Cultures of the Near East and North Africa, Ghent University [Delves and Campbell, 1993] – HT Delves and MJ Campbell (1993) Environ Geochem Health 15:75-84 [Deniel and Pin, 2001] – C Deniel and C Pin (2001) Anal Chim Acta 426:95-103 [Dietz, 1965] – LA Dietz (1965) Rev Sci Instr 36:1763-1770 [Douglas, 1989] – DJ Douglas (1989) Can J Spectrosc 34:38-49 [Douglas and Tanner, 1998] – DJ Douglas and SD Tanner (1998) Fundamental considerations in ICPMS. In: A Montaser (ed) Inductively coupled plasma mass spectrometry. Wiley-VCH, New York:615-679 [Driessens and Verbeeck, 1990] – FCM Driessens and RMH Verbeeck (1990) Biominerals. CRC Press, Boca Raton [Eiden et al., 1996] – GC Eiden, CJ Barinaga and DW Koppenaal (1996) J Anal At Spectrom 11:317-322

REFERENCES
259
[Eisinger, 1977] – J Eisinger (1977) Trends Biochem Sci 2:147-150 [Ekstroem and Gustavsson, 1993] – H Ekstroem and I Gustavsson (1993) Application of ICP-MS to steel, other metals, and metal alloys. In: G Holland and AN Eaton (eds) Applications of plasma source mass spectrometry II. Royal Society of Chemistry, Cambridge:150-157 [Elbaz-Poulichet et al., 1984] – F Elbaz-Poulichet, P Holliger, WW Huang and JM Martin (1984) Nature 308:409-411 [Elbaz-Poulichet et al., 1986] – F Elbaz-Poulichet, P Holliger, JM Martin and D Petit (1986) Sci Total Envir 54:61-76 [Elias et al., 1982] – RW Elias, Y Hirao and CC Patterson (1982) Geochim Cosmochim Acta 46:2561-2580 [Engström et al., 2004] – E Engström, A Stenberg, DC Baxter, D Malinovsky, I Makinen, S Ponni and I Rodushkin (2004) J Anal At Spectrom 19:858-866 [Erel et al., 1994] – YG Erel, Y Harlavan and JD Blum (1994) Geochim Cosmochim Acta 58:5299-5306 [Ericson, 1985] – JE Ericson (1985) J Hum Evol 14:503-514 [Ericson and Shirahata, 1985] – JE Ericson and H Shirahata (1985) Lead isotope analysis of ancient copper and base metal ore deposits in Western India. In: PA England and L van Zelst (eds) Application of science in examination of works of art. Museum of Fine Arts, Boston:207-212 [Erkkila et al., 1992] – J Erkkila, R Armstrong, V Riihimaki, DR Chettle, A Paakkari, M Scott, L Somervaille, J Starck, B Kock and A Aitio (1992) Brit J Ind Med 49:631-644 [Ettler et al., 2004] – V Ettler, M Mihaljevic and M Komarek (2004) Anal Bioanal Chem 378:311-317 [Evans and Giglio, 1993] – EH Evans and JJ Giglio (1993) J Anal At Spectrom 8:1-18 [Evans et al., 1995] – EH Evans, JJ Giglio, TM Castillano and JA Caruso (1995) Inductively coupled and microwave induced plasma sources for mass spectrometry. Royal Society of Chemistry, Cambridge [Ezzo et al., 1997] – JA Ezzo, CM Johnson and TD Price (1997) J Archaeol Sci 24:447-466 [Falciani et al., 2000] – R Falciani, E Novaro, M Marchesini and M Gucciardi (2000) J Anal At Spectrom 15:561-565 [Farias et al., 1998] – P Farias, H Hu, E Rubenstein, F Meneses-Gonzalez, E Fishbein, E Palazuelos, A Aro and M Hernandez-Avila (1998) Environ Health Perspect 106:733-737 [Farmer et al., 1994] – JG Farmer, CL Sugden, AB MacKenzie, GH Moody and M Fulton (1994) Environ Technol 15:593-599 [Faure, 1986-a] – G Faure (1986) Principles of isotope geology. Wiley, New York:117-140 [Faure, 1986-b] – G Faure (1986) Principles of isotope geology. Wiley, New York:282-308 [Faure, 1986-c] – G Faure (1987) Principles of isotope geology. Wiley, New York:309-340 [Faure and Mensing, 2005] – G Faure and TM Mensing (2005) Isotopes: principles and applications. Wiley, Hoboken:75-112 [Feldmann et al., 1999-a] – I Feldmann, N Jakubowski and D Stuewer (1999) Fresenius J Anal Chem 365:415-421 [Feldmann et al., 1999-b] – I Feldmann, N Jakubowski, C Thomas and D Stuewer (1999) Fresenius J Anal Chem 365:422-428 [Fortunato et al., 2004] – G Fortunato, K Mumic, S Wunderli, L Pillonel, JO Bosset and G Gremaud (2004) J Anal At Spectrom 19:227-234

REFERENCES
260
[Freestone et al., 2003] – IC Freestone, KA Leslie, M Thirlwall and Y Gorin-Rosen (2003) Archaeometry 45:19-32 [Furuta, 1991] – N Furuta (1991) J Anal At Spectrom 6:199-203 [Gale, 1996] – NH Gale (1996) Anal Chim Acta 332:15-21 [Gale and Stos-Gale, 1987] – NH Gale and ZA Stos-Gale (1987) Oxhide ingots from Sardinia, Crete and Cyprus and the Bronze Age copper trade: new scientific evidence. In: MS Balmuth (ed) Studies in Sardinian archaeology III. Nuragic Sardinia and the Mycenaean World. Archaeopress, Oxford:159-198 [Gale and Stos-Gale, 2000] – NH Gale and Z Stos-Gale (2000) Lead isotope analysis applied to provenance studies. In: E Ciliberto and G Spoto (eds) Modern analytical methods in art and archaeology. Wiley, New York:503-584 [Gale et al., 1997] – NH Gale, ZA Stos-Gale, G Maliotis and N Annetts (1997) Archaeometry 39:237-246 [Gale et al., 2003] – NH Gale, ZA Stos-Gale, A Raduncheva, I Panayotov, I Ivanov, P Lilov and T Todorov (2003) Early metallurgy in Bulgaria. In: PT Craddock and J Lang (eds) Mining and metal production through the ages. British Museum Press, London:122-173 [Galer and Abouchami, 1998] – SJG Galer and W Abouchami (1998) Miner Mag 62A:491-492 [Galler et al., 2007] – P Galler, A Limbeck, SF Boulyga, G Stingeder, T Hirata and T Prohaska (2007) Anal Chem 79:5023-5029 [Galy et al., 2001] – A Galy, NS Belshaw, L Halicz and RK O’Nions (2001) Int J Mass Spectrom 208:89-98 [Garcia-Ruiz et al., 2007] – S Garcia-Ruiz, M Moldovan and JIG Alonso (2007) J Chrom A 1149:274-281 [Ghazi, 1994] – AM Ghazi (1994) Appl Geochem 9:627-636 [Ghazi et al., 1994] – AM Ghazi, KJ Reinhard, MA Holmes and E Durrance (1994) Amer J Phys Anthropol 95:427-434 [Gidlow, 2004] – DA Gidlow (2004) Occup-Med Oxford 54:76-81 [Giessmann and Greb, 1994] – U Giessmann and U Greb (1994) Fresenius J Anal Chem 350:186-193 [Gilfillan, 1965] – SC Gilfillan (1965) J Occup Med 7:53-60 [Graustein 1989] – WC Graustein (1989) 87Sr/86Sr ratios measure the sources and flow of strontium in terrestrial ecosystems. In: PW Rundel, JR Ehleringer and KA Nagy (eds) Stable isotopes in ecological research, vol. 68. Ecological studies. Springer, New York:491-512 [Gray, 1975] – AL Gray (1975) Analyst 100:289-299 [Gray, 1985] – AL Gray (1985) Analyst 110:551-556 [Gray, 1986] – AL Gray (1986) J Anal At Spectrom 1:403-405 [Gray, 1989] – AL Gray (1989) The origins, realization, and performance of ICP-MS systems. In: AR Date and AL Gray (eds) Applications of inductively coupled plasma mass spectrometry. Blackie, Glasgow:1-42 [Gray and Date, 1983] – AL Gray and AL Date (1983) Int J Mass Spectrom Ion Proc 46:7-10 [Gulson, 1996] – BL Gulson (1996) Environ Health Perspect 104:306-312 [Gulson and Gillings, 1997] – BL Gulson and BR Gillings (1997) Environ Health Perspect 105:820-824 [Gulson and Wilson, 1994] – B Gulson and D Wilson (1994) Arch Environ Health 49:279-283 [Gulson et al., 1995] – BL Gulson, JJ Davis and J Bawdensmith (1995) Sci Total Envir 164:221-235

REFERENCES
261
[Gulson et al., 1997] – BL Gulson, CW Jameson and BR Gillings (1997) J Forensic Sci 42:787-791 [Günther et al., 1999] – D Günther, SE Jackson and HP Longerich (1999) Spectrochim Acta B 54:381-409 [Habashi, 1994] – F Habashi (1994) A history of metallurgy. Métallurgie extractive Québec, Québec [Habicht-Mauche et al., 2002] – JA Habicht-Mauche, ST Glenn, MP Schmidt, R Franks, H Milford and AR Flegal (2002) J Archaeol Sci 29:1043-1053 [Haerinck, 2001] – E Haerinck (2001) Excavations at ed-Dur (Umm al-Qaiwain, United Arab Emirates), volume II: the tombs. Peeters, Leuven [Haerinck, 2003] – E Haerinck (2003) Arab Arch Epig 14:88-94 [Halicz et al., 1999] – L Halicz, A Galy, NS Belshaw and RK O’Nions (1999) J Anal At Spectrom 14:1835-1838 [Halliday et al., 1995] – AN Halliday, DC Lee, JN Christensen, AJ Walder, PA Freedman, CE Jones, CM Hall, W Yi and D Teagle (1995) Int J Mass Spectrom Ion Proc 146-147:21-33 [Halliday et al., 1998] – AN Halliday, DC Lee, JN Christensen, M Rehkämper, W Yi, X Luo, CM Hall, CJ Ballentine, T Pettke and C Stirling (1998) Geochim Cosmochim Acta 62:919-940 [Hattendorf et al., 2005] – B Hattendorf, H Wanner, H Gu, S Dorn and D Günther (2005) Determination of Ca-44-isotope markers for parasitoid studies using dynamic reaction cell ICPMS. In: G Holland and DR Bandura (eds) Plasma source mass spectrometry: current trends and future developments. Royal Society of Chemistry, Cambridge:91-98 [Hedges, 2002] – REM Hedges (2002) Archaeometry 44:319-328 [Held and Taylor, 1999] – A Held and PDP Taylor (1999) J Anal At Spectrom 14:1075-1079 [Heumann, 1988] – KG Heumann (1988) Isotope dilution mass spectrometry. In: F Adams, R Gijbels and R van Grieken (eds) Inorganic mass spectrometry. Wiley, New York:301-376 [Heumann et al., 1998] – KG Heumann, SM Gallus, G Rädlinger and J Vogl (1998) J Anal At Spectrom 13:1001-1008 [Hillson, 1986] – S Hillson (1986) Teeth. Cambridge University Press, Cambridge [Hillson, 1996] – S Hillson (1996) Dental anthropology. Cambridge University Press, Cambridge [Hinners et al., 1998] – TA Hinners, R Hughes, PM Outridge, WJ Davis, K Simon and DR Woolard (1998) J Anal At Spectrom 13:963-970 [Hirata, 1996] – T Hirata (1996) Analyst 121:1407-1411 [Hirata, 1997] – T Hirata (1997) Geochim Cosmochim Acta 61:4439-4448 [Hobson, 1999] – KA Hobson (1999) Oecologia 120:314-326 [Hofmann, 1883] – KB Hofmann (1883) Die Getränke der Griechen und Römer vom hygienischen Standpunkte. Archiv für Geschichte der Medizin [Hong et al., 1994] – SM Hong, JP Candelone, CC Patterson and CF Boutron (1994) Science 265:1841-1843 [Hoogewerff et al., 2001] – J Hoogewerff, W Papesch, M Kralik, M Berner, P Vroon, H Miesbauer, O Gaber, KH Künzel and J Kleinjans (2001) J Archaeol Sci 28:983-989 [Hoppe et al., 1999] – KA Hoppe, PL Koch, RW Carlson and SD Webb (1999) Geology 27:439-442 [Hoppe et al., 2003] – KA Hoppe, PL Koch and TT Furutani (2003) Int J Osteoarchaeol 13:20-28 [Hoppin et al., 1997] – JA Hoppin, A Aro, H Hu and PB Ryan (1997) Pediatrics 100:365-370

REFERENCES
262
[Horlick and Montaser, 1998] – G Horlick and A Montaser (1998) Analytical characteristics of ICPMS. In: A Montaser (ed) Inductively coupled plasma mass spectrometry. Wiley-VCH, New York:503-588 [Horwitz et al., 1991] – EP Horwitz, ML Dietz and DE Fisher (1991) Anal Chem 63:522-525 [Horwitz et al., 1992] – EP Horwitz, R Chiarizia and ML Dietz (1992) Solv Extr Ion Exch 10:313-336 [Horwitz et al., 1994] – EP Horwitz, ML Dietz, S Rhoads, C Felinto, NH Gale and J Houghton (1994) Anal Chim Acta 292:263-273 [Houk et al., 1980] – RS Houk, VA Fassel, GD Flesch, HJ Svec, AL Gray and CE Taylor (1980) Anal Chem 52:2283-2289 [Hu, 1991] – H Hu (1991) Am J Public Health 81:1070-1072 [IARC, 1987] – International Agency for Research on Cancer (1987) Monographs on the evaluation of the carcinogenic risk of chemicals to humans. Suppl. 6:230-232 [Ingle and Crouch, 1972] – JD Ingle and SR Crouch (1972) Anal Chem 44:777-784 [Ingle et al., 2003] – CP Ingle, BL Sharp, MSA Horstwood, RR Parrish and DJ Lewis (2003) J Anal At Spectrom 18:219-229 [Iyengar, 1976] – GV Iyengar (1976) Radiochem Radioanal Lett 24:35-42 [Jackson, 2001] – TA Jackson (2001) Can J Fish Aquat Sci 58:185-196 [Jackson et al., 2004] – BP Jackson, PV Winger and PJ Lasier (2004) Environ Pollut 130:445-451 [Jakubowski et al., 1998] – N Jakubowski, L Moens and F Vanhaecke (1998) Spectrochim Acta B 53:1739-1763 [Jarvis et al., 1992] – KE Jarvis, AL Gray and RS Houk (1992) Handbook of inductively coupled plasma mass spectrometry. Blackie, London [Johnson et al., 2004-a] – CM Johnson, BL Beard and F Albaréde (2004) Overview and general concepts. In: CM Johnson, BL Beard and F Albaréde (eds) Reviews in mineralogy & geochemistry, vol. 55. Geochemistry of non-traditional stable isotopes. Mineralogical Society of America, Washington:1-24 [Johnson et al., 2004-b] – CM Johnson, BL Beard, EE Roden, DK Newman and KH Nealson (2004) Isotopic constraints on biogeochemical cycling of Fe. In: CM Johnson, BL Beard and F Albaréde (eds) Reviews in mineralogy & geochemistry, vol. 55. Geochemistry of non-traditional stable isotopes. Mineralogical Society of America, Washington:359-408 [Kabata-Pendias and Pendias, 1984-a] – A Kabata-Pendias and H Pendias (1984) Trace elements in soils and plants. CRC Press, Boca Raton:15-31 [Kabata-Pendias and Pendias, 1984-b] – A Kabata-Pendias and H Pendias (1984) Trace elements in soils and plants. CRC Press, Boca Raton:33-50 [Kabata-Pendias and Pendias, 1984-c] – A Kabata-Pendias and H Pendias (1984) Trace elements in soils and plants. CRC Press, Boca Raton:151-169 [Kabata-Pendias and Pendias, 1984-d] – A Kabata-Pendias and H Pendias (1984) Trace elements in soils and plants. CRC Press, Boca Raton:91-125 [Kamenov et al., 2004] – GD Kamenov, PA Mueller and MR Perfit (2004) J Anal At Spectrom 19:1262-1267 [Keinonen, 1992] – M Keinonen (1992) Sci Total Envir 113:251-268 [Kennett et al., 2002] – DJ Kennett, S Sakai, H Neff, R Gossett and DO Larson (2002) J Archaeol Sci 29:443-455
REFERENCES
263
[Kennett et al., 2004] – DJ Kennett, AJ Anderson, MJ Cruz, GR Clark and GR Summerhayes (2004) Archaeometry 46:35-46 [King and Harrison, 1989] – FL King and WW Harrison (1989) Int J Mass Spectrom Ion Proc 89:171-185 [King et al., 1988] – FL King, AL McCormack and WW Harrison (1988) J Anal At Spectrom 3:883-886 [Kingston and Jassie, 1988] – HM Kingston and LB Jassie (1988) J Res Nat Bur Stand 93:269-274 [Kingston and Walter, 1998] – HM Kingston and PJ Walter (1998) The art and science of microwave sample preparations for trace and ultratrace elemental analysis. In: A Montaser (ed) Inductively coupled plasma mass spectrometry. Wiley-VCH, New York:33-81 [Klein et al., 2004-a] – S Klein, Y Lahaye, GP Brey and HM Von Kaenel (2004) Archaeometry 46:469-480 [Klein et al., 2004-b] – M Klein, F Jesse, HU Kasper and A Golden (2004) Archaeometry 46:339-356 [Kniseley et al., 1974] – RN Kniseley, H Amenson, CC Butler and VA Fassel (1974) Appl Spectrosc 28:285-286 [Knudson et al., 2004] – KJ Knudson, TD Price, JE Buikstra and DE Blom (2004) Archaeometry 46:5-18 [Knudson et al., 2005] – KJ Knudson, TA Tung, KC Nystrom, TD Price and PD Fullagar (2005) J Archaeol Sci 32:903-913 [Kobert, 1909] – R Kobert (1909) Chronische Bleivergiftigung im klassischen Altertum. In: P Diergart (ed) Beiträge aus der Geschichte der Chemie. Franz Deuticke, Leipzig [Koch et al., 1992] – PL Koch, AN Halliday, LM Walter, RF Stearley, TJ Huston and GR Smith (1992) Earth Planet Sci Lett 108:277-287 [Koch et al., 1995] – PL Koch, J Heisinger, C Moss, RW Carlson, ML Fogel and AK Behrensmeyer (1995) Science 267:1340-1343 [Kohn et al., 1999] – MJ Kohn, MJ Schoeninger and WW Barker (1999) Geochim Cosmochim Acta 63:2737-2747 [Koirtyohann, 1994] – SR Koirtyohann (1994) Spectrochim Acta B 49:1305-1311 [Koppenaal et al., 2004] – DW Koppenaal, GC Eiden and CJ Barinaga (2004) J Anal At Spectrom 19:561-570 [Krachler et al., 2004] – M Krachler, G Le Roux, B Kober and W Shotyk (2004) J Anal At Spectrom 19:354-361 [Kurz, 1979] – EA Kurz (1979) Amer Lab 11:67-82 [Labs-Hochstein and MacFadden, 2006] – J Labs-Hochstein and BJ MacFadden (2006) Geochim Cosmochim Acta 70:4921-4932 [Latino et al., 2001] – J Latino, K Neubauer and RE Wolf (2001) At Spectrosc 22:306-311 [Latkoczy et al., 1998] – C Latkoczy, T Prohaska, G Stingeder and M Teschler-Nicola (1998) J Anal At Spectrom 13:561-566 [Latkoczy et al., 2001] – C Latkoczy, T Prohaska, M Watkins, M Teschler-Nicola and G Stingeder (2001) J Anal At Spectrom 16:806-811 [Lee-Thorp and Sponheimer, 2003] – J Lee-Thorp and M Sponheimer (2003) J Anthropol Archaeol 22:208-216 [Leya et al., 2000] – I Leya, R Wieler and AN Halliday (2000) Earth Planet Sci Lett 175:1-12 [Lindemann, 1919] – FA Lindemann (1919) Philosoph Mag 38:173-181 [Lindemann and Aston, 1919] – FA Lindemann and FW Aston (1919) Philosoph Mag 37:523-535

REFERENCES
264
[Little et al., 2004] – NC Little, LJ Kosakowsky, RJ Speakman, MD Glascock and JC Lohse (2004) J Radioanal Nucl Chem 262:103-110 [Longerich et al., 1987] – HP Longerich, BJ Fryer and DF Strong (1987) Spectrochim Acta B 42:39-48 [Malinovskiy et al., 2007] – D Malinovskiy, DC Baxter and I Rodushkin (2007) Environ Sci Technol 41:1596-1600 [Mallory-Greenough et al., 1998] – LM Mallory-Greenough, JD Greenough and JV Owen (1998) J Archaeol Sci 25:85-97 [Manhès et al., 1980] – G Manhès, CJ Allègre, B Dupré and B Hamelin (1980) Earth Planet Sci Lett 47:370-382 [Maréchal and Albarède, 2002] – C Maréchal and F Albarède (2002) Geochim Cosmochim Acta 66:1499-1509 [Maréchal et al., 1999] – CN Maréchal, P Télouk and F Albarède (1999) Chem Geol 156:251-273 [Marengo et al., 2005] – E Marengo, M Aceto, E Robotti, MC Liparota, M Bobba and G Panto (2005) Anal Chim Acta 537:359-375 [Marr, 1979] – IL Marr (1979) A Handbook of decomposition: methods in analytical chemistry. Wiley, New York [Martinez-Garcia et al., 2005] – MJ Martinez-Garcia, JM Moreno, J Moreno-Clavel, N Vergara, A Garcia-Sanchez, A Guillamon, M Porti and S Moreno-Grau (2005) Sci Total Envir 348:51-72 [Marzo et al., 2007] – P Marzo, F Laborda and J Perez-Arantegui (2007) At Spectrosc 28:195-201 [May et al., 1999] – TW May, RH Wiedmeyer, LD Brown and SW Casteel (1999) At Spectrosc 20:199-211 [McConnell, 1973] – D McConnell (1973) Apatite, its crystal chemistry, mineralogy, utilization and geologic and biologic occurrences. Springer, Vienna [Meinhard et al., 1992] – BA Meinhard, DK Brown and JE Meinhard (1992) Appl Spectrosc 46: 1134-1139 [Meyer, 2000] – VR Meyer (2000) Practical high-performance liquid chromatography. Wiley, Chichester:14-51 [Meynadier et al., 2006] – L Meynadier, C Gorge, JL Birck and CJ Allegre (2006) Chem Geol 227:26-36 [Michiels and De Bièvre, 1983] – E Michiels and P De Bièvre (1983) Int J Mass Spectrom Ion Proc 48:369-372 [Millard, 2006] – A Millard (2006) Sci Total Envir 354:295-297 [Moens and Jakubowski, 1998] – L Moens and N Jakubowski (1998) Anal Chem 70:251-256 [Moens et al., 1995] – L Moens, F Vanhaecke, J Riondato and R Dams (1995) J Anal At Spectrom 10:569-574 [Moens et al., 2001] – LJ Moens, FF Vanhaecke, DR Bandura, VI Baranov and SD Tanner (2001) J Anal At Spectrom 16:991-994 [Montaser et al., 1998-a] – A Montaser, MG Minnich, JA McLean, H Liu, JA Caruso and CW McLeod (1998) Sample introduction in ICPMS. In: A Montaser (ed) Inductively coupled plasma mass spectrometry. Wiley-VCH, New York:83-264 [Montaser et al., 1998-b] – A Montaser, JA McLean, H Liu and JM Mermet (1998) An introduction to ICP spectrometries for elemental analysis. In: A Montaser (ed) Inductively coupled plasma mass spectrometry. Wiley-VCH, New York:1-31 [Moore, 1970] – CE Moore (1970) Ionization potentials and ionization limits derived from the analysis of optical spectra. In: DR Lide (ed) (1991) Handbook of chemistry and physics, 72nd edition. CRC Press, Boca Raton:10:211-212
REFERENCES
265
[Moorey, 1994] – PRS Moorey (1994) Ancient Mesopotamian materials and industries. The archaeological evidence. Clarendon Press, Oxford [Müller et al., 2003] – W Müller, H Fricke, AN Halliday, MT McCulloch and JA Wartho (2003) Science 302:862-866 [Myers et al., 1994] – DP Myers, GLP Yang and GM Hieftje (1994) J Am Soc Mass Spectrom 5:1008-1016 [Myers et al., 1995-a] – DP Myers, G Li, PP Mahoney and GM Hieftje (1995) J Am Soc Mass Spectrom 6:400-410 [Myers et al., 1995-b] – DP Myers, G Li, PP Mahoney and GM Hieftje (1995) J Am Soc Mass Spectrom 6:411-420 [Needleman, 2004] – H Needleman (2004) Annu Rev Med 55:209-222 [Nelms et al., 2001] – SM Nelms, CR Quétel, T Prohaska, J Vogl and PDP Taylor (2001) J Anal At Spectrom 16:333-338 [Nevissi, 1991] – AE Nevissi (1991) J Radioanal Nucl Chem 148:121-131 [Nielsen-Marsh and Hedges, 2000-a] – CM Nielsen-Marsh and REM Hedges (2000) J Archaeol Sci 27:1139-1150 [Nielsen-Marsh and Hedges, 2000-b] – CM Nielsen-Marsh and REM Hedges (2000) J Archaeol Sci 27:1151-1159 [Niu and Houk, 1996] – H Niu and RS Houk (1996) Spectrochim Acta B 51:779-815 [Nu, 2001] – Nu Instruments Ltd (2001) Isotopic standard ratios [Nriagu, 1983-a] – JO Nriagu (1983) Lead and lead poisoning in antiquity. John Wiley & Sons, New York [Nriagu, 1983-b] – JO Nriagu (1983) N Engl J Med 308:660-663 [O’Neil, 1986] – JR O’Neil (1986) Rev Mineral 16:1-40 [Olesik and Bates, 1995] – JW Olesik and LC Bates (1995) Spectrochim Acta B 50:285-303 [Ortiz, 2003] – MAH Ortiz (2003) Prehistoric mining and metallurgy in South West Iberian Peninsula. Archaeopress, Oxford [Outridge et al., 1996] – PM Outridge, RJ Hughes and RD Evans (1996) At Spectrosc 17:1-8 [Papadopoulou et al., 2004] – DN Papadopoulou, GA Zachariadis, AN Anthemidis, NC Tsirliganis and JA Stratis (2004) Anal Chim Acta 505:173-181 [Papanikolaou et al., 2005] – NC Papanikolaou, EG Hatzidaki, S Belivanis, GN Tzanakakis and AM Tsatsakis (2005) Med Sci Monit 11:329-336 [Park et al., 2000] – CJ Park, KH Cho, JK Suh and MS Han (2000) J Anal At Spectrom 15:567-570 [Patterson et al., 1991] – C Patterson, J Ericson, M Manea-Krichten and H Shirahata (1991) Sci Total Envir 107:205-236 [Periplus] – Periplus Maris Erythraei. Translated in L Casson (1989) The Periplus Maris Erythraei. Princeton University Press, Princeton [Pernicka et al., 1998] – A Pernicka, T Rehren and S Schmitt-Strecker (1998) Late Uruk silver production by cupellation at Habuba Kabira, Syria. In: T Rehren, A Hauptmann and JD Muhly (eds) Metallurgica Antiqua. Deutsches Bergbau-Museum, Bochum:123-134 [Peters and Beauchemin, 1993] – GR Peters and D Beauchemin (1993) Spectrochim Acta B 48:1481-1494

REFERENCES
266
[Peters et al., 1986] – GJ Peters, EJ Laurensse, A Leyva and HM Pinedo (1986) Clin Chim Acta 158:193-198 [Philip and Gerson, 1994-a] – AT Philip and B Gerson (1994) Clin Lab Med 14:423-444 [Philip and Gerson, 1994-b] – AT Philip and B Gerson (1994) Clin Lab Med 14:651-670 [Pin and Bassin, 1992] – C Pin and C Bassin (1992) Anal Chim Acta 269:249-255 [Pin et al., 2003] – C Pin, S Joannon, C Bosq, B Le Fèvre and PJ Gauthier (2003) J Anal At Spectrom 18:135-141 [Piomelli, 2002] – S Piomelli (2002) Pediatr Clin N Am 49:1285-1304 [Platzner, 1997] – IT Platzner (1997) Modern isotope ratio mass spectrometry. Wiley, Chichester:403-447 [Plinius] – Plinius, Naturalis Historia. Translated in H Rackham (1947) Naturalis Historia. Harvard University Press, Cambridge [Ponting, 2002] – MJ Ponting (2002) Archaeometry 44:555-571 [Ponting and Segal, 1998] – M Ponting and I Segal (1998) Archaeometry 40:109-122 [Price and Gestsdottir, 2006] – TD Price and H Gestsdottir (2006) Antiquity 80:130-144 [Price et al., 1992] – TD Price, J Blitz, J Burton and JA Ezzo (1992) J Archaeol Sci 19:513-529 [Price et al., 1994] – TD Price, CM Johnson, JA Ezzo, J Ericson and JH Burton (1994) J Archaeol Sci 21:315-330 [Price et al., 2002] – TD Price, JH Burton and RA Bentley (2002) Archaeometry 44:117-135 [Price et al., 2006] – TD Price, V Tiesler and JH Burton (2006) Amer J Phys Anthropol 130:485-490 [Prohaska et al., 1999] – T Prohaska, S Hann, C Latkoczy and G Stingeder (1999) J Anal At Spectrom 14:1-8 [Prohaska et al., 2002] – T Prohaska, C Latkoczy, G Schultheis, M Teschler-Nicola and G Stingeder (2002) J Anal At Spectrom 17:887-891 [Quétel et al., 1997] – CR Quétel, B Thomas, OFX Donard and FE Grousset (1997) Spectrochim Acta B 52:177-187 [Quétel et al., 2000] – CR Quétel, T Prohaska, M Hamester, W Kerl and PDP Taylor (2000) J Anal At Spectrom 15:353-358 [Rabinowitz, 1987] – MB Rabinowitz (1987) Biol Tr Elem Res 12:223-229 [Rabinowitz, 1991] – MB Rabinowitz (1991) Environ Health Perspect 91:33-37 [Rabinowitz et al., 1976] – MB Rabinowitz, GW Wetherill and JD Kopple (1976) J Clin Invest 58:260-270 [Radosevich, 1993] – SC Radosevich (1993) The six deadly sins of trace element analysis: a case of wishful thinking in science. In: MK Sandford (ed) Investigations of ancient human tissue: chemical analyses in anthropology. Gordon & Breach, Philadelphia:269-332 [Rehkämper and Halliday, 1998] – M Rehkämper and AN Halliday (1998) Int J Mass Spectrom 181:123-133 [Rehkämper and Halliday, 1999] – M Rehkämper and AN Halliday (1999) Geochim Cosmochim Acta 63:935-944 [Rehkämper and Mezger, 2000] – M Rehkämper and K Mezger (2000) J Anal At Spectrom 15:1451-1460 [Rehkämper et al., 2001] – M Rehkämper, M Schönbächler and CH Stirling (2001) Geostand Newslett-J Geost 25:23-40

REFERENCES
267
[Rehkämper et al., 2002] – M Rehkämper, M Frank, JR Hein, D Porcelli, A Halliday, J Ingri and V Liebetrau (2002) Earth Planet Sci Lett 197:65-81 [Rehkämper et al., 2004] – M Rehkämper, F Wombacher and JK Aggarwal (2004) Stable isotope analysis by multiple collector ICP-MS. In: PA de Groot (ed) Handbook of stable isotope analytical techniques, vol. 1. Elsevier, Amsterdam:692-725 [Reinhard and Ghazi, 1992] – KJ Reinhard and AM Ghazi (1992) Amer J Phys Anthropol 89:183-195 [Resano et al., 2005] – M Resano, J Perez-Arantegui, E Garcia-Ruiz and F Vanhaecke (2005) J Anal At Spectrom 20:508-514 [Richter et al., 2006] – FM Richter, RA Mendybaev, JN Christensen, ID Hutcheon, RW Williams, NC Sturchio and AD Beloso (2006) Geochim Cosmochim Acta 70:277-289 [Riondato et al., 2001] – J Riondato, F Vanhaecke, L Moens and R Dams (2001) Fresenius J Anal Chem 370:544-552 [Robinson et al., 1995] – C Robinson, J Kirkham, SJ Brookes, WA Bonass and RC Shore (1995) Int J Dev Biol 39:145-152 [Rodushkin et al., 2004] – I Rodushkin, A Stenberg, H Andrén, D Malinovskiy and DC Baxter (2004) Anal Chem 76:2148-2151 [Rohl, 1996] – BM Rohl (1996) Archaeometry 38:165-180 [Rokita et al., 1993] – E Rokita, C Hermes, HF Nolting and J Ryczek (1993) J Cryst Growth 130:543-552 [Rosenfeld et al., 1997] – A Rosenfeld, S Ilani and M Dvorachek (1997) J Archaeol Sci 24:857-864 [Roth, 1997] – E Roth (1997) Pure Appl Chem 69:1753-1828 [Rowan and Houk, 1989] – JT Rowan and RS Houk (1989) Appl Spectrosc 43:976-980 [Rowland et al., 2008] – A Rowland, TB Housh and JA Holcombe (2008) J Anal At Spectrom 23:167-172 [Russ, 1989] – GP Russ III (1989) Isotope ratio measurements using ICP-MS. In: AR Date and AL Gray (eds) Applications of inductively coupled plasma mass spectrometry. Blackie, Glasgow:90-114 [Russ and Bazan, 1987] – GP Russ and JM Bazan (1987) Spectrochim Acta B 42:49-62 [Russell et al., 1978] – WA Russell, DA Papanastassiou and TA Tombrello (1978) Geochim Cosmochim Acta 42:1075-1090 [Rutten, 2006] – K Rutten (2006) Het aardewerk van ed-Dur (Umm al-Qaiwain, V.A.E.) uit de late 1ste eeuw voor tot de vroege 2de eeuw na Christus. Technologische, typologische en vergelijkende studie met een analyse van de ruimtelijke verspreiding en handel in en voorbij de Perzische Golf. PhD dissertation, Department of Languages and Cultures of the Near East and North Africa, Ghent University [Salles, 1980] – JF Salles (1980) Archaeol UAE 2-3:79-91 [Santos Zalduegui et al., 2004] – JF Santos Zalduegui, S Garcia De Madinabeitia, JI Gil Ibarguchi and F Palero (2004) Archaeometry 46:625-634 [Sayre et al., 2001] – EV Sayre, EC Joel, MJ Blackman, KA Yener and H Ozbal (2001) Archaeometry 43:77-115 [Schauble, 2004] – EA Schauble (2004) Applying stable isotope fractionation theory to new systems. In: CM Johnson, BL Beard and F Albaréde (eds) Reviews in mineralogy & geochemistry, vol. 55. Geochemistry of non-traditional stable isotopes. Mineralogical Society of America, Washington:65-111 [Schweissing and Grupe, 2003] – MM Schweissing and G Grupe (2003) J Archaeol Sci 30:1373-1383 [Scott et al., 1974] – RH Scott, VA Fassel, RN Kniseley and DE Nixon (1974) Anal Chem 46:75-81

REFERENCES
268
[Seah, 1995] – MP Seah (1995) Surf Interface Anal 23:729-732 [Sealy et al., 1991] – JC Sealy, NJ Van der Merwe, A Sillen, FJ Kruger and HW Krueger (1991) J Archaeol Sci 18:399-416 [Sedov, 1996] – AV Sedov (1996) Qana’ (Yemen) and the Indian Ocean: the archaeological evidence. In: HP Ray and JF Salles (eds) Tradition and archaeology, early maritime contacts in the Indian Ocean. Manohar, New Delhi:11-35 [Seeley and Turner, 1984] – NJ Seeley and PJ Turner (1984) Metallurgical investigation of three early Indian coinages: implications for metal trading and dynastic chronology. In: B Allchin (ed) South Asian archaeology 1981. Cambridge University Press, Cambridge:331-333 [Sheppard et al., 1990] – BS Sheppard, WL Shen, TM Davidson and JA Caruso (1990) J Anal At Spectrom 5:697-700 [Shotyk et al., 1998] – W Shotyk, D Weiss, PG Appleby, AK Cheburkin, R Frei, M Gloor, JD Kramers, S Reese and WO Van der Knaap (1998) Science 281:1635-1640 [Sillen and Sealy, 1995] – A Sillen and JC Sealy (1995) J Archaeol Sci 22:313-320 [Sillen et al., 1995] – A Sillen, G Hall and R Armstrong (1995) J Hum Evol 28:277-285 [Sillen et al., 1998] – A Sillen, G Hall, S Richardson and R Armstrong (1998) Geochim Cosmochim Acta 62:2463-2473 [Skulan et al., 2002] – JL Skulan, BL Beard and CM Johnson (2002) Geochim Cosmochim Acta 66:2995-3015 [Smits, 2006] – E Smits (2006) Leven en sterven langs de Limes. PhD dissertation, University of Amsterdam [Smits et al., 2008] – E Smits, F de Wolff, D De Muynck, C Cloquet, L Moens and F Vanhaecke (2008) in preparation [Srinivasan, 1999] – S Srinivasan (1999) Archaeometry 41:91-116 [Stacey and Kramers, 1975] – JS Stacey and JD Kramers (1975) Earth Planet Sci Lett 26:207-221 [Stos-Gale et al., 1986] – ZA Stos-Gale, NH Gale and U Zwicker (1986) The copper trade in the South-East Mediterranean region. Preliminary scientific evidence. The department of Antiquities, Cyprus:122-144 [Stos-Gale et al., 1995] – ZA Stos-Gale, NH Gale, J Houghton and R Speakman (1995) Archaeometry 37:407-415 [Stos-Gale et al., 1996] – ZA Stos-Gale, NH Gale and N Annetts (1996) Archaeometry 38:381-390 [Stos-Gale et al., 1997] – ZA Stos-Gale, G Maliotis, NH Gale and N Annetts (1997) Archaeometry 39:83-123 [Stos-Gale et al., 1998-a] – ZA Stos-Gale, G Maliotis and NH Gale (1998) A preliminary survey of the Cypriot slag heaps and their contribution to the reconstruction of copper production in Cyprus. In: T Rehren, A Hauptmann and JD Muhly (eds) Metallurgica Antiqua. Deutsches Bergbau-Museum, Bochum:235-262 [Stos-Gale et al., 1998-b] – ZA Stos-Gale, NH Gale, N Annetts, T Todorov, P Lilov, A Raduncheva and I Panayotov (1998) Archaeometry 40:217-226 [Strelow, 1960] – FWE Strelow (1960) Anal Chem 32:1185-1188 [Stürup et al., 2006] – S Stürup, L Bendahl and B Gammelgaard (2006) J Anal At Spectrom 21:297-304 [Suetonius] – Suetonius, The twelve Caesars. Translated in M Grant (1975) The twelve Caesars. Charles Scribner’s Sons, London [Sulcek and Povondra, 1989] – Z Sulcek and P Povondra (1989) Methods of decomposition in inorganic analysis. CRC Press, Boca Raton
REFERENCES
269
[Sun et al., 1987] – XF Sun, BTG Ting, SH Zeisel and M Janghorbani (1987) Analyst 112:1223-1228 [Tanner and Baranov, 1999] – SD Tanner and VI Baranov (1999) At Spectrosc 20:45-52 [Tanner et al., 1994] – SD Tanner, LM Cousins and DJ Douglas (1994) Appl Spectrosc 48:1367-1372 [Tanner et al., 2002] – SD Tanner, VI Baranov and DR Bandura (2002) Spectrochim Acta B 57:1361-1452 [Taylor and McLennan, 1995] – SR Taylor and SM McLennan (1995) Rev Geophys 33:241-265 [Taylor et al., 1995] – PDP Taylor, P De Bièvre, AJ Walder and A Entwistle (1995) J Anal At Spectrom 10:395-398 [Taylor et al., 1998] – HE Taylor, RA Huff and A Montaser (1998) Novel applications of ICP-MS. In: A Montaser (ed) Inductively coupled plasma mass spectrometry. Wiley-VCH, New York:681-807 [Thirlwall, 1991] – MF Thirlwall (1991) Chem Geol 94:85-104 [Thornton and Ehlers, 2003] – CP Thornton and CB Ehlers (2003) IAMS Journal 23:3-8 [Tomascak et al., 1999] – PB Tomascak, RW Carlson and SB Shirey (1999) Chem Geol 158:145-154 [Trickett et al., 2003] – MA Trickett, P Budd, J Montgomery and J Evans (2003) Appl Geochem 18:653-658 [Trincherini et al., 2001] – PR Trincherini, P Barbero, P Qurati, C Domergue and L Long (2001) Archaeometry 43:393-406 [Tunstall and Amarasiriwardena, 2002] – S Tunstall and D Amarasiriwardena (2002) Microchem J 73:335-347 [Turner et al., 1997] – P Turner, T Merren, J Speakman and C Haines (1997) Interface studies in the ICP – mass spectrometer. In: G Holland and SD Tanner (eds) Plasma source mass spectrometry, developments and applications. Royal Society of Chemistry, Cambridge:28-34 [Turner et al., 1998] – PJ Turner, DJ Mills, E Schröder, G Lapitajs, G Jung, LA Iacone, DA Haydar and A Montaser (1998) Instrumentation for low- and high resolution ICPMS. In: A Montaser (ed) Inductively coupled plasma mass spectrometry. Wiley-VCH, New York:421-501 [Tylecote, 1962] – RF Tylecote (1962) Metallurgy in archaeology: a prehistory of metallurgy in the British Isles. Edward Arnold Publishers Ltd, London [Tylecote, 1976] – RF Tylecote (1976) A history of metallurgy. The metals society, London [Underwood, 1977-a] – EJ Underwood (1977) Trace elements in human and animal nutrition. Academic Press, New York:430-458 [Underwood, 1977-b] – EJ Underwood (1977) Trace elements in human and animal nutrition. Academic Press, New York:410-423 [Urey, 1947] – HC Urey (1947) J Chem Soc (London):562-581 [Urey and Greiff, 1935] – HC Urey and LJ Greiff (1935) J Am Chem Soc 57:321-327 [Vandecasteele et al., 1988] – C Vandecasteele, M Nagels, H Vanhoe and R Dams (1988) Anal Chim Acta 211:91-98 [Vanhaecke and Moens, 2004] – F Vanhaecke and L Moens (2004) Anal Bioanal Chem 378:232-240 [Vanhaecke et al., 1992] – F Vanhaecke, H Vanhoe, R Dams and C Vandecasteele (1992) Talanta 39:737-742 [Vanhaecke et al., 1996-a] – F Vanhaecke, M Van Holderbeke, L Moens and R Dams (1996) J Anal At Spectrom 11:543-548 [Vanhaecke et al., 1996-b] – F Vanhaecke, L Moens, R Dams and P Taylor (1996) Anal Chem 68:567-569

REFERENCES
270
[Vanhaecke et al., 1997] – F Vanhaecke, L Moens, R Dams, I Papadakis and P Taylor (1997) Anal Chem 69:268-273 [Vanhaecke et al., 1998] – F Vanhaecke, G De Wannemacker, L Moens, R Dams, C Latkoczy, T Prohaska and G Stingeder (1998) J Anal At Spectrom 13:567-571 [Vanhaecke et al., 1999] – F Vanhaecke, L Moens, R Dams, L Allen and S Georgitis (1999) Anal Chem 71:3297-3303 [Vanhaecke et al., 2001] – F Vanhaecke, G De Wannemacker, L Moens and P Van den Haute (2001) Fresenius J Anal Chem 371:915-920 [Vanhaecke et al., 2003] – F Vanhaecke, L Balcaen, I Deconinck, I De Schrijver, CM Almeida and L Moens (2003) J Anal At Spectrom 18:1060-1065 [Vanhaecke et al., 2006] – F Vanhaecke, L Balcaen and P Taylor (2006) Use of ICP-MS for isotope ratio measurements. In: S Hill (ed) Inductively coupled plasma mass spectrometry and its applications. Blackwell Publishing, Oxford:160-225 [Veillon and Margoshe, 1968] – C Veillon and M Margoshe (1968) Spectrochim Acta B 23:503-533 [Veis, 1989] – A Veis (1989) Biochemical studies of vertebrate tooth mineralization. In: S Mann, J Webb and RJP Williams (eds) Biomineralization: chemical and biochemical perspectives. VCH, New York:189-222 [Verstraete et al., 1998] – D Verstraete, J Riondato, J Vercauteren, F Vanhaecke, L Moens, R Dams and M Verloo (1998) Sci Total Envir 218:153-160 [Vieira et al., 1986] – PA Vieira, H Zhizhuang, SK Chan and A Montaser (1986) Appl Spectrosc 40:1141-1146 [Vukovic et al., 1998] – Z Vukovic, S Lazic, I Tutunovic and S Raicevic (1998) J Serb Chem Soc 63:387-393 [Waight et al., 2002] – T Waight, J Baker and D Peate (2002) Int J Mass Spectrom 221:229-244 [Wakabayashi et al., 2007] – T Wakabayashi, T Ohno, Y Fukushi, T Komiya and T Hirata (2007) Geochim Cosmochim Acta 71S:A1079 [Walczyk, 2004] – T Walczyk (2004) Anal Bioanal Chem 378:229-231 [Walder and Freedman, 1992] – AJ Walder and PA Freedman (1992) J Anal At Spectrom 7:571-575 [Walder and Furuta, 1993] – AJ Walder and N Furuta (1993) Anal Sci 9:675-680 [Walder et al., 1993] – AJ Walder, I Platzner and PA Freedman (1993) J Anal At Spectrom 8:19-23 [Wallach and Chausmer, 1990] – S Wallach and AB Chausmer (1990) Metabolism of trace metals in animals and man: part I: non-essential pollutant metals. In: ND Priest and FL Van de Vyver (eds) Trace metals and fluoride in bones and teeth. CRC Press, Boca Raton:231-252 [Walters and Barnardt, 1988] – PE Walters and CA Barnardt (1988) Spectrochim Acta B 43:325-337 [Walton and Rocklin, 1990] – HF Walton and RD Rocklin (1990) Ion exchange in analytical chemistry. CRC Press, Boston [Weeks, 2004] – LR Weeks (2004) Arab Arch Epig 15:240-252 [Weiss et al., 1999] – D Weiss, W Shotyk, JD Kramers and M Gloor (1999) Atmos Environ 33:3751-3763 [Weiss et al., 2004] – DJ Weiss, B Kober, A Dolgopolova, K Gallagher, B Spiro, G Le Roux, TFD Mason, M Kylander and BJ Coles (2004) Int J Mass Spectrom 232:205-215 [Weyer and Schwieters, 2003] – S Weyer and JB Schwieters (2003) Int J Mass Spectrom 226:355-368 [White et al., 2000] – WM White, F Albarède and P Télouk (2000) Chem Geol 167:257-270
REFERENCES
271
[Whitehouse, 1998] – D Whitehouse (1998) Excavations at ed-Dur (Umm al-Qaiwain, United Arab Emirates), volume I: the glass vessels. Peeters, Leuven [Wombacher and Rehkämper, 2003] – F Wombacher and M Rehkämper (2003) J Anal At Spectrom 18:1371-1375 [Woodhead et al., 1995] – JD Woodhead, F Volker and MT McCulloch (1995) Analyst 120:35-39 [Woolard et al., 1998] – D Woolard, R Franks and DR Smith (1998) J Anal At Spectrom 13:1015-1019 [Wopenka and Pasteris, 2005] – B Wopenka and JD Pasteris (2005) Mat Sci Eng C-Biomim Supram S 25:131-143 [Wu et al., 2003] – MC Wu, SJ Jiang and TS Hsi (2003) Anal Bioanal Chem 377:154-158 [Yaffe et al., 1983] – Y Yaffe, CP Flessel, JJ Wesolowski, A Del Rosario, GN Guirguis, V Matias, TE Degarmo, GC Coleman, JW Gramlich and WR Kelly (1983) Arch Environ Health 38:237-245 [Yang and Jiang, 2004] – CH Yang and SJ Jiang (2004) Spectrochim Acta B 59:1389-1394 [Yener et al., 1991] – KA Yener, EV Sayre, EC Joel, H Ozbal, IL Barnes and RH Brill (1991) J Archaeol Sci 18:541-577 [Yoshinaga et al., 1998] – J Yoshinaga, M Yoneda, M Morita and T Suzuki (1998) Appl Geochem 13:403-413 [Young et al., 1997] – SMM Young, P Budd, R Haggerty and AM Pollard (1997) Archaeometry 39:379-392 [Young et al., 2002] – ED Young, A Galy and H Nagahara (2002) Geochim Cosmochim Acta 66:1095-1104 [Zapata et al., 2006] – J Zapata, C Perez-Sirvent, MJ Martinez-Sanchez and P Tovar (2006) Sci Total Envir 369:357-368 [Zhu et al., 2000-a] – XK Zhu, RK O’Nions, Y Guo, NS Belshaw and D Rickard (2000) Chem Geol 163:139-149 [Zhu et al., 2000-b] – XK Zhu, RK O’Nions, YL Guo and BC Reynolds (2000) Science 287:2000-2002 [Zolotov et al., 1986] – YA Zolotov, NM Kuzmin, OM Petrukhin and BY Spivakov (1986) Anal Chim Acta 180:137-161 [Zoorob et al., 1998] – GK Zoorob, JW McKiernan and JA Caruso (1998) Microchim Acta 128:145-168 [Zutterman, 2003] – C Zutterman (2003) Arab Arch Epig 14:81-87