Development of Regional Labour Markets under Enterprise ...
31
Economics Education and Research Consortium Final Project Report Development of Regional Labour Markets under Enterprise Restructuring Process Tatyana Chetvernina Irina Soboleva Svetlana Lomonosova E-print No 96-050 This project was supported by the Economics Education and Research Consortium Any opinions expressed here are those of the author and not those of the Economics Education and Research Consortium. Research dissemination by the EERC may include views on policy, but the EERC itself takes no institutional policy positions Economics Education and Research Consortium 2000 T.Ya. Chetvernina, I.V. Soboleva, S.V. Lomonosova 2000
Transcript of Development of Regional Labour Markets under Enterprise ...
Economics Education and Research Consortium
Final Project Report
Development of Regional LabourMarkets under Enterprise Restructuring Process
Tatyana Chetvernina
Irina Soboleva
Svetlana Lomonosova
E-print No 96-050
This project was supported by the EconomicsEducation and Research Consortium
Any opinions expressed here are those of the author and not those ofthe Economics Education and Research Consortium.
Research dissemination by the EERC may include views on policy,but the EERC itself takes no institutional policy positions
Economics Education and Research Consortium 2000 T.Ya. Chetvernina, I.V. Soboleva, S.V. Lomonosova 2000
2
DEVELOPMENT OF REGIONAL LABOUR MARKETS UNDER ENTERPRISERESTRUCTURING PROCESS
T.Chetvernina (Head), I.Soboleva, S.Lomonosova
Stylised facts about the Rusian labour market
During the 1990-s in the process of market reorientation of the Russian economy theemployment situation has worsened considerably. The fact is manifested in the reduction ofeconomic activity rate; reduction of employment which amounted to 10 mln during the period1991-1997, growth of the unemployment rate from 4,7% in 1992 to 9,1% in 1997, growth ofthe average unemployment duration as a result of the labour demand reduction.
Under these conditions the problem of estimating current and perspective labour de-mand of Russian industrial enterprises is of great theoretical and practical interest.As it is known, in Russia the prolonged decline of industrial output was not accompanied byan adequate reduction in employment. During the first half of 1990-s industrial output de-clined more than twofold versus only 25% reduction in employment. This allows to suggest ahypothesis that Russian enterprises accumulate internal labour surplus. The hypothesis wastested by several researches (Аукуционек С., Капелюшников Р., 1995; Виноградова Е.,1996; Кабалина В., Козина И., Донова И., 1996; Московская А., 1997 ) analysing the la-bour surplus structure and the reasons for its preserving.
Research on the tendencies of employment in Russia was also carried out by the Cen-tre for Labour Market Studies RAS. According to the Russian Labour Flexibility Survey(RLFS detailed characteristic of the survey is given below) from the beginning of 1990-s thereduction of employment in Russian industry is observed. Each year the employment on thepanel enterprises reduced steadily by about 8%. Notwithstanding the fact that during the pe-riod observed economic situation and dynamics of industrial production as well as the legisla-tive base changed several times the employment dynamics remained stable1. We presumethere must be serious internal reasons for such enterprise and employees behaviour that mustbe analysed more thoroughly.
One of the key instruments of the vast and elaborated theory of modelling enterprisebehaviour (including enterprise labour demand) is the mathematical apparatus of the produc-tion function (Cobb-Douglas function). We applied this apparatus for building the model oflabour demand in the industry of Russia.
As it is known the nearer is the economic situation to a free competitive market beingin the state of long-term equilibrium the better are the conditions for model-building andeconometric estimation. State interference in the economy, cyclical, structural and financialcrises, monopolies exist practically in any contemporary society. Still the Cobb-Douglas appa-ratus is widely applied for analysing microeconomics processes all over the world and eco-nomics in transition are no exception.
Still in the case of Russia it is suitable to assess the extent to which the competitiveand equilibrium assumptions apply in the national economy.
1 For details see [8] (“The mechanism of internal adaptation...”, M.,1995 )

3
I. The usual approach to economic modelling demands competitive environment,placing a hard budget constraint and an effective constraint from the demand side on eacheconomic unit.
In a classical command economy which Russia was until the beginning of the 1990-sthe budget constraint ineffective. In the course of market reorientation the budget constraintgrew harder and the validity of the demand constraint increased. This was due to price andtrade liberalisation as well as privatisation and enterprise restructuring initiated by the market-oriented members of the government. Between 1993 and 1996 about 14 thousand companieswere “privatised”. By 1995 about 70% of total production was accounted for by what couldloosely be called the “private sector”. This allows us to presume that by the middle of the dec-ade market oriented economy system was established, albeit in chaotic conditions and withnumerous distortions. This year Russia is bound to be recognised as a market economy by EU.Mainly the less developed market economies were against granting Russia the market econ-omy rights but they remained a minority. The position of those countries could be explainedby their fear to loose competitive advantage and not by objective evaluation of the economicsituation in Russia.
Still the budget constraint in Russia is not as hard as it could be at least for the fol-lowing reasons:1) Industrial monopolies. Because of the minor role given to de-monopolisation of the pro-duction system on the first stages of transition, with price liberalisation hyper-inflationarypressures were unleashed. Partial price liberalisation in January 1992 generated an inflationaryprocess in which consumer and producer price rose by over 2500% in less than a year. Soprofit maximisation was achieved to a large part by price growth and not by cost reduction.The process was slowed only in 1996-1997 but not because competitive environment wasbuilt. A barrier on inflation was erected by a freeze on prices by monopolistic industries plus afurther deflationary “policy” of ents in Federal spending on social and cultural activities;2) Weakness of tax and normative regulation. A highly complicated tax system together withweak discipline of tax-paying produce a possibility not only for partial tax-evasion but evenfor direct refuse to pay taxes. As compared to 1994 in 1995 tax debt grew 200% andamounted to 57,4 trln roubles. By international standards the proportion of taxation that isactually paid has been very low. The IMF estimated that the Russian authorities were collect-ing taxes equivalent to about 9% of the GDP.3) There is system of government support of selected enterprises and branches of industry aswell as practice of selected regions, cities or sectors.4) Widespread development of peculiar forms of credit and non-pecuniary exchange, the mostcommon of which are the following:- non-payments which can be regarded as a form of forced tied credit. From 1992 in the Rus-sian economy the process of growing indebtedness between enterprises which endangers eco-nomic entities was generated. In 1995 as compared to 1994 in debtedness to suppliers in-creased 120% and amounted to 122,3 trln roubles;- barter, meaning direct or indirect exchange of commodities. Some experts share the viewthat the problem of not-collecting taxes stems not from intentional concealing of income butfrom the fact that the real price of goods bartered is 15-20% lower than it is started in the en-terprise accounting books. The others are bound to think that “barter prices” are high than theprices of the world market (see Karpov. Virtual miracles of Russian economy - Expert, 1998,N2, p.8);

4
- quasi-monetary exchanges (dishonoured bills, etc.). In some branches of industry such asenergetic non-monetary payments amount to 90-95% of all sales.- non-monetary payments bias the existing output statistics. Discount on arreared paymentssometimes is as big as 50% of reported output or sales. Therefore the reality may differ a greatdeal from official statistics.
II. Among other economic assumptions frequently used when analysing labour mar-kets is the assumption that firms behave rationally (in the neo-classical sense) and they areaimed at profit maximisation. Of course, in Russia market reorientation has led to a consider-able change in the motives of enterprise management. Increased efficiency of the demand con-straint became a barrier to output maximisation disregarding the costs of such strategy. Themotivation system of a Russian enterprise manager is usually very complicated but the strat-egy or even tactics of survival usually is a key element in it. In the middle of the 1990-s it hasbecome evident that a majority of managers are usually motivated by short-term objectivesignoring the long-term interests of production and thus hindering the efficiency growth. Insome cases they manage to receive considerable short-term profits exploiting the situation ofeconomic disorder, unstable property rights and weak legislation. The costs of their businessactivities are usually born by society.
III. The econometric estimation of a relationship among several macroeconomic indi-cators assumes a stable economic situation in the sense of long-term equilibrium. Otherwisethe Lucas critique applies and one has to check for the regime changes over time and possiblestructural breaks in the relationship. Market reorientation of Russian economy took place un-der an unprecedented decline of production and moderate production decline the “shock-therapy” measures of 1992 led to a catastrophic fall of output.
Between 1989-1996 industrial output reduced more than twofold and a slight recoveryhas been manifested only since the end of 1996. Yet the observed growth is incomparablewith the decline of the previous years.
The stated above characteristics of the economic situation in Russia cannot but placerestrictions on the applicability of traditional econometric analysis including Cobb-Douglasfunction to the behaviour of Russian industrial enterprises. Therefore we thought it necessaryto complement the mathematical model with qualitative analysis of empirical informationcollected when working on this project and during several previous years. We hope this willprovide a more comprehensive outlook on the processes of labour demand generation in Rus-sian industry.
Data and descriptive characteristics
This research is based upon socio-economic survey of industrial enterprises (RussianLabour Flexibility Survey -- RLFS), conducted by the Centre of Labour Market Studies of theInstitute of Economics RAS since 1991. At that time the survey was initiated by ILO andUSSR Goskomstat (the researchers of the Centre being only co-executors). From 1993 thesurvey was continued by ILO and the Centre and since 1996 it is conducted solely under theinitiative and with the might of the researchers of the Centre in close cooperation with socio-economic centres of nine Russian regions.
The characteristic feature of our survey is not only its scale (monitoring conducted bythe Ministry of Labour covered not more than 150 enterprises and was never conducted on aregular basis), but in richness and detailed character of information on labour and employmentreceived during the seven years crucial for the transition to market economy. Besides the sur-

5
vey is a sort of enterprise monitoring (starting from 1991 for Moscow, Moscovskaya oblastand St.Petersburg, from 1993 for Nizhegorodskaya and Ivanovskaya oblast, from 1995 forVladimirskaya oblast, etc.) since it is held every year one and the same month (June) and cov-ers basically the same questions (though the questionnaire is a bit modified each year whilesome pressing questions are included and the ones that lost their urgency are omitted) and thesame enterprise panel. In 1996 the survey covered 497 enterprises in * Russian Regions (Mos-cow, Moskovskaya oblast, St.Petersburg, Nizhegorodskaya oblast, Ivanovskaya oblast,Vladimirskaya oblast, Chelyabinskaya oblast, city of Naberezhnyie Chelny).
The survey results are not representative for the whole of Russia but are representativefor each of the regions surveyed. The regional sampling was carried out by economico-statistical institutions of the regions concerned according to two criteria: the structure of re-gional manufacturing industry and enterprise size.
The survey methodology was initially developed by ILO (by Dr.G.Standing person-ally) and applied in 15 different countries including Eastern Europe and CIS (Ukraine, Kir-giziya and Armenia). Only in Russia though the survey was held regularly year by year duringthe 1990s. the survey methodology is based on the collection of economic information first ofall on labour and unemployment relations on the enterprise level (in enterprise departmentsdealing with labour and wage, accounting, etc.) and from an extensive interview with enter-prise Director or Deputy Director.
The first (economic) part of the questionnaire includes detailed questions on the eco-nomic indicators of enterprise activity: number of employed by gender and professional cate-gories (no statistical institution supplies such information), labour turnover by professionalcategory, vacancies, hiring and separations by gender and professional category, number ofhours worked, remuneration by professional category including tariff and bonus payments,dividends. Questions on the enterprise expenditures on wages and salaries, training and re-training and social sphere (if it exists) are also included.
The second part of the questionnaire (economico-sociological) includes estimates ofdifferent aspects of the enterprise activity as well as such indicators as the rate of productioncapacity usage, the share of non-tariff payments in the overall employee’s income, full andpartial production stoppages (weeks, wage arrears periods. The information supplied is veri-fied by the enterprise Director (or his/her Deputy) in different enterprise administration de-partments.
The second part of the questionnaire (interview with the Director) may be divided intoseveral blocks:1. Economic situation of the enterprise: usage of production capacities, sources of invest-ment, debts, main problems met by the enterprise during the current year, existence of socialsphere, its conditions and Director’s future plans concerning its development.2. Personnel strategy of the management: hiring and firing preferences and priorities, exis-tence of labour surplus and the reasons for keeping it, the management plans concerning pres-ervation or changing the professional structure of employed if organisational changes occur,introducing new technology, changing production profiles, etc.3. Management’s reactions on continuing economic crisis: production stoppages, lay-offs,inter-enterprise mobility of employees, wage and salary non-payments and arrears, etc.4. The employment impact of technological innovations, changes in labour organisationand in nomenclature produced.5. The practised systems of employee remuneration.6. The employer-employee relations (trade unions, collective agreements, strikes).

6
7. Practised by administration systems and forms of hiring by professional category.8. System of employee training and retraining: training of new-hires, training with the aimof labour productivity growth, training for improving remuneration and career prospects, re-training preferences by gender and age.
Quality and reliability of the information received are provided by two main moments:- Support of the enterprise managers with whom close and steady relations have been devel-oped during several years of cooperation and to whom regular analytical information on thesurvey results is supplied (including 1997).- High qualification and experience of the interviewers conducting the field works. As our ex-perience shows, the kind of survey we conduct can be carried out only by highly qualifiedspecialists in the field of economics and statistics aquainted with the labour economies, sincetheir consultation and explanations are frequently needed to ensure proper calculations ofcertain indicators included in the questionnaire. One of the most complicated items is relativeremuneration of male and female labour. The help of the interviewers is also frequentlyneeded when filling the table on employment structure by age and gender. Wrongly or care-lessly filled questionnaires are exposed right away or in the extreme case in the process of thelogical control. They are either not accepted at all or returned to the enterprise for correcting ifthe faults could be easily dealt with. We are very particular as far as the selection and instruc-tion of the interviewers in each region are concerned. (In St.Petersburg, for example, the in-terviewer team was changed three times). The Head of each interviewer team is supplied witha booklet containing detailed explanations concerning each item of the questionnaire. Duringthe survey period and while logical control is conducted we keep close phone contact with theregional interviewer team Heads for operative control.
In Moscow and Moscovskaya oblast the field works are carried out by the researchersof the Centre themselves.
In 1997, because of the lack of financing the survey was carried out on a very reducedscale. The number of regions surveyed was cut down from 8 to 3 and the number of enter-prises covered -- from 497 to 186 (the Project stipulated 180). Both parts of the questionnairewere reduced and simplified.
The selection of regions (Moscow, Nizhegorodskaya oblast) was based upon the fol-lowing considerations:First, the regions selected differ by their current economic situation and potential. Moscow isa well-to-do region with high economic potential. Nizhegorodskaya oblast is a region en-counting many complicated problems but its economic potential is also high. And Ivanov-skaya oblast is undoubtedly one of the most depressed regions of Russia.
The integrational differences outlined above are supported by such integrative indica-tors as regional GDP per capita and the rate of industrial output reduction. According to theGoscomstat data on GDP per capita for 1995, Moscow occupied one of the top positions(177%), Nizhegorodskaya oblast was somewhere in the middle of the scale (99%) and Iva-novskaya oblast was twice beneath the average indicator for Russia (53%)2. As regards indus-trial production reduction rate during 1992-1995 the three regions selects also fell into differ-ent categories (although in each of them the reduction has taken place). In Moscow the reduc-
2 The average indicator for Russia is taken for 100%.
7
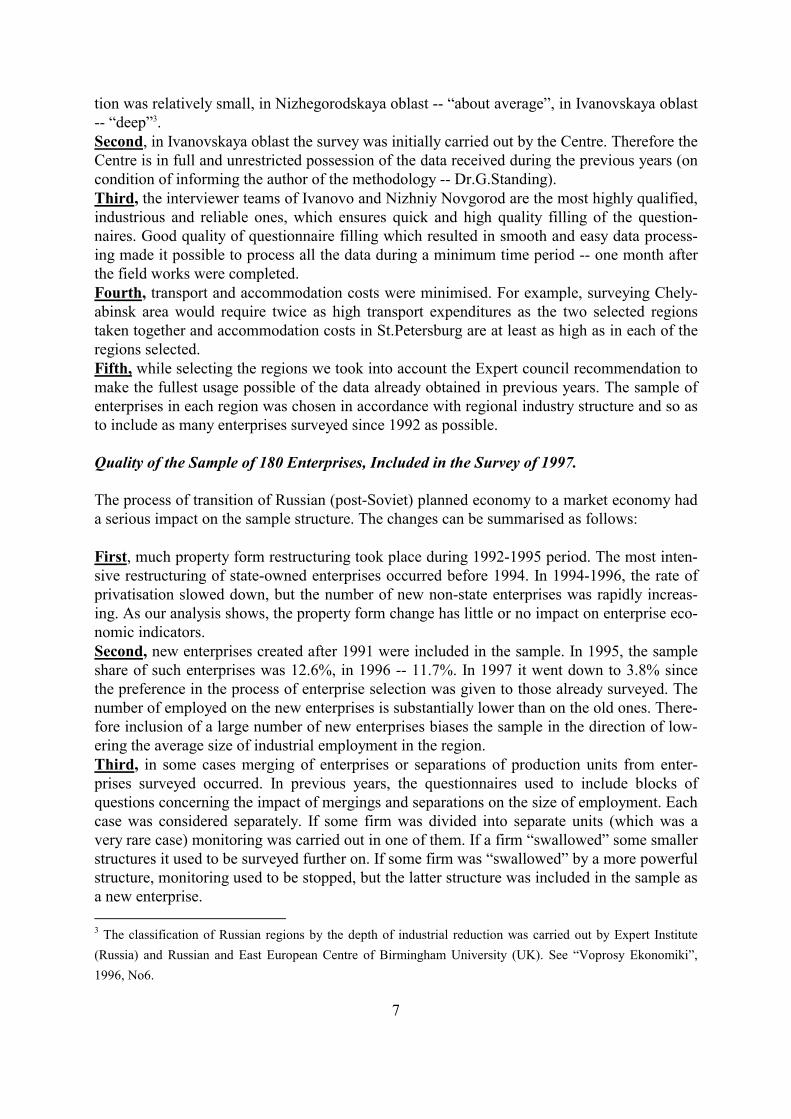
tion was relatively small, in Nizhegorodskaya oblast -- “about average”, in Ivanovskaya oblast-- “deep”3.Second, in Ivanovskaya oblast the survey was initially carried out by the Centre. Therefore theCentre is in full and unrestricted possession of the data received during the previous years (oncondition of informing the author of the methodology -- Dr.G.Standing).Third, the interviewer teams of Ivanovo and Nizhniy Novgorod are the most highly qualified,industrious and reliable ones, which ensures quick and high quality filling of the question-naires. Good quality of questionnaire filling which resulted in smooth and easy data process-ing made it possible to process all the data during a minimum time period -- one month afterthe field works were completed.Fourth, transport and accommodation costs were minimised. For example, surveying Chely-abinsk area would require twice as high transport expenditures as the two selected regionstaken together and accommodation costs in St.Petersburg are at least as high as in each of theregions selected.Fifth, while selecting the regions we took into account the Expert council recommendation tomake the fullest usage possible of the data already obtained in previous years. The sample ofenterprises in each region was chosen in accordance with regional industry structure and so asto include as many enterprises surveyed since 1992 as possible.
Quality of the Sample of 180 Enterprises, Included in the Survey of 1997.
The process of transition of Russian (post-Soviet) planned economy to a market economy hada serious impact on the sample structure. The changes can be summarised as follows:
First, much property form restructuring took place during 1992-1995 period. The most inten-sive restructuring of state-owned enterprises occurred before 1994. In 1994-1996, the rate ofprivatisation slowed down, but the number of new non-state enterprises was rapidly increas-ing. As our analysis shows, the property form change has little or no impact on enterprise eco-nomic indicators.Second, new enterprises created after 1991 were included in the sample. In 1995, the sampleshare of such enterprises was 12.6%, in 1996 -- 11.7%. In 1997 it went down to 3.8% sincethe preference in the process of enterprise selection was given to those already surveyed. Thenumber of employed on the new enterprises is substantially lower than on the old ones. There-fore inclusion of a large number of new enterprises biases the sample in the direction of low-ering the average size of industrial employment in the region.Third, in some cases merging of enterprises or separations of production units from enter-prises surveyed occurred. In previous years, the questionnaires used to include blocks ofquestions concerning the impact of mergings and separations on the size of employment. Eachcase was considered separately. If some firm was divided into separate units (which was avery rare case) monitoring was carried out in one of them. If a firm “swallowed” some smallerstructures it used to be surveyed further on. If some firm was “swallowed” by a more powerfulstructure, monitoring used to be stopped, but the latter structure was included in the sample asa new enterprise. 3 The classification of Russian regions by the depth of industrial reduction was carried out by Expert Institute(Russia) and Russian and East European Centre of Birmingham University (UK). See “Voprosy Ekonomiki”,1996, No6.
8
Fourth, some of the enterprises were excluded from the sample either because they failed tosurvive in the new market environment and were obliged to close, or because they refused tocooperate. In order to maintain the quality of the sample such enterprises were substitutedwith similar ones as far as industry branch and the number of employed were concerned.
Main Sample Characteristics.
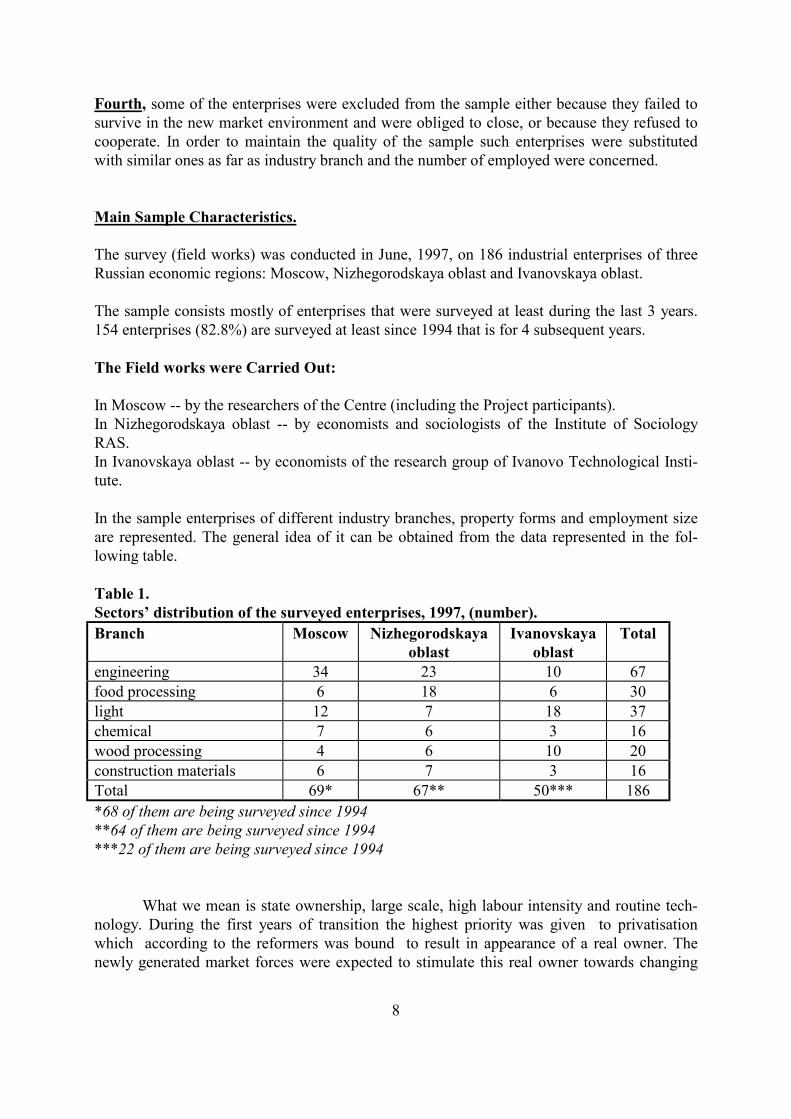
The survey (field works) was conducted in June, 1997, on 186 industrial enterprises of threeRussian economic regions: Moscow, Nizhegorodskaya oblast and Ivanovskaya oblast.
The sample consists mostly of enterprises that were surveyed at least during the last 3 years.154 enterprises (82.8%) are surveyed at least since 1994 that is for 4 subsequent years.
The Field works were Carried Out:
In Moscow -- by the researchers of the Centre (including the Project participants).In Nizhegorodskaya oblast -- by economists and sociologists of the Institute of SociologyRAS.In Ivanovskaya oblast -- by economists of the research group of Ivanovo Technological Insti-tute.
In the sample enterprises of different industry branches, property forms and employment sizeare represented. The general idea of it can be obtained from the data represented in the fol-lowing table.
Table 1.Sectors’ distribution of the surveyed enterprises, 1997, (number).Branch Moscow Nizhegorodskaya
oblastIvanovskaya
oblastTotal
engineering 34 23 10 67food processing 6 18 6 30light 12 7 18 37chemical 7 6 3 16wood processing 4 6 10 20construction materials 6 7 3 16Total 69* 67** 50*** 186*68 of them are being surveyed since 1994**64 of them are being surveyed since 1994***22 of them are being surveyed since 1994
What we mean is state ownership, large scale, high labour intensity and routine tech-nology. During the first years of transition the highest priority was given to privatisationwhich according to the reformers was bound to result in appearance of a real owner. Thenewly generated market forces were expected to stimulate this real owner towards changing
9
economic priorities, investing in innovative technologies and reorganising labour relations. Ifso, enterprise restructuring followed by the growth of labour productivity, efficiency andcompetitiveness will be a natural consequence of privatisation. Under the circumstances tech-nological modernisation and employment reduction would become inevitable. The second ar-gument supporting quick voucher privatisation was that supplying each employee with a shareof property would make all of them co-owners of enterprises interested in raising productionefficiency. Below we shall attempt to show the directions in which the economic behaviour ofthe new owners has been changing and the impact of those changes on the economic condi-tions of enterprises and employees.
Now after seven years of reforms it can be said that two of the objectives declaredbreaking gigantic enterprises into smaller units and their privatisation were to a certain extentachieved. This is supported by the data of the industrial enterprise survey conducted by ourCentre.
Privatisation and its Consequences.The first stage of privatisation was practically over by 1994. The state monopoly in
industry was overcome. From 1995 the process of reorganisation of state enterprises hasshowed down but another process - the process of creation of new small-scale private enter-prises has been gaining force.The methods of property reorganisation in manufacturing industry have been graduallychanging too. During the first three years of reforms the most popular property form wasclosed-stock company with a significant proportion of shares belonging to workers (72.6%).Since the end of 1994 open-stock companies begin to prevail. Many of newly-establishedclosed-stock companies undergo a second reorganisation into open-stock companies in thecourse of which the proportion of shares belonging to workers decreases. Since 1996 the pro-portion of closed-stock companies decreased while the proportion of open-stock companiescontinues to grow.
Table 5.Index of the proportion of state, closed-stock and open-stock companies in manufactur-ing between 1994 and 1997 (the proportion in 1994 is assumed to be 100). N=153property form in % to the previous
year1994 1995 1996 1997 1995 1996 1997
state 100 75,7 70,3 62,2 75,7 92,9 88,5open JS 100 122 125 132 122 103 105closed JS 100 111 107 104 111 97 97
It is evident that the dynamics steps from the changing proportion of co-owners in theproperty structure of privatised enterprises. It is worth noting that while the proportion ofworkers-shareholders both in on open-stock closed-stock companies has been reducing (seeTable 6), its redistribution was going differently. In open-stock enterprises the shares wereactively redistributed in favour of the administration. While in closed-stock enterprises theproportion of shares belonging to the administration has increased from 22.9% in 1994 to42.2% in 1997 (that is less then twofold), in open-stock enterprises it has increased more then5 times and reached 23.5% in 1997. In closed-stock enterprises external shareholders ap-

10
peared. Their proportion reached 8.3% in 1997. In open-stock companies the proportion ofexternal shareholders has not changed.
Table 6.Dynamics of the proportion of shares belonging to workers in 1994-1997 (%). N=153.shares belong to workers 1994 1995 1996 1997opened JS 51,8 51,2 36,9 34,7closed JS 72,6 58,7 53,5 49,6
It can be seen that the property structure has undergone considerable changes as compared to1994. On the closed-stock companies the property distribution between workers and admini-stration has equalised. In open-stock enterprises the bulk of property has changed hands be-tween workers, external shareholders and administration in favour of the latter. If this processcontinues with the same rate the workers would loose the rest of their shares in two yearswhile the shares would be equally distributed between the administration and external share-holders.
The facts stated above enable us to conclude that the process of property reorganisa-tion is not over yet. While the majority of closed-stock enterprises are bound to get a singleowner - administration - in the nearest future, it is not yet clear whether the administration orthe external share holders will become the real owners of the open-stock enterprises.
The process of property form restructuring is closely linked to the economic situationof enterprises. We have analysed the economic indicators of several property categories ofenterprises. Firstly, all enterprises were grouped by property form (state, closed-stock, open-stock). The last two categories were grouped by the proportion of shares belonging to workers.as a result 6 categories of enterprises were formed: I - state, II - closed-stock with workersshare less than 50%, III - closed-stock with workers share more than 50%, IV - open-stockwith workers share less than 25%, V - open-stock with workers share between 25% and 50%,VI - open-stock with workers share more than 50%. The proportion of each group in the totalnumber of enterprises surveyed was 18%, 12%, 10%, 21%, 27% and 12% correspondingly.
Our research has demonstrated that open-stock companies workers share more than51% are the most successful group.
In 1994 the state enterprises had the best indicators, which is natural taking into ac-count that at that moment all the other categories of enterprises experienced difficulties of re-structurisation and were in search of markets. Later sales were growing faster in the non-statesector as a result of regaining connections with customers. In 1996 open-stock companies withworkers share more than 51% regained positions and in 1997 demonstrated better perform-ance than state enterprises.
Similar picture is seen when comparing the rate of production capacity utilisation. Thebiggest decline of the utilisation rate (17%) was experienced by closed-stock companies withworkers share less than 50% and by open-stock enterprises with workers share less than 25%.Those categories of enterprises demonstrated the lowest rate of capacity utilisation (27% and30% correspondingly). The highest rate of capacity utilisation was achieved by open-stockcompanies with workers share more than 50%. State enterprises, closed-stock companies withworkers share more than 50% and open-stock companies with workers share between 25%and 50% demonstrated average results.
11
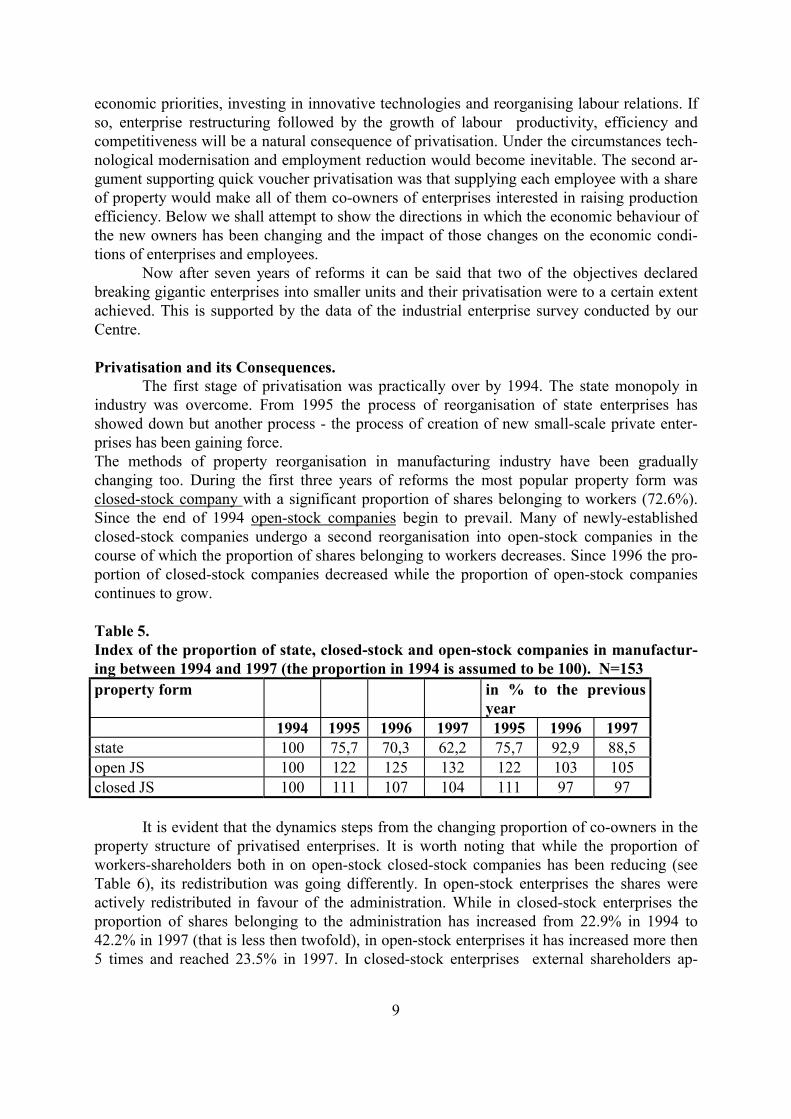
Table 7.Some economic indicators of enterprises grouped by property form and by proportionof shares belonging to workers.
I II III IV V VIcapacity utilisation199519961997
63,153,850,7
51,345,633,5
52,950,241,8
47,439,530,0
51,042,741,6
56,961,554,6
increased output:199419951997
24,332,134,8
-11,110,0
8,321,123,1
7,721,439,3
4,320,011,1
14,834,540,0
decreased output:199419951996
54,121,443,5
10055,660,0
83,452,661,5
92,364,350,0
78,363,361,1
70,444,840,0
implemented new technology199419951997
35,125,017,4
33,322,220,0
41,747,438,5
38,542,921,4
52,243,327,8
44,837,953,3
The dynamics of employment on different categories of enterprises is represented inTable 8.
Table 8.Employment changes in the enterprises different property forms
state closed JS opened JSShares belonged to workers, %
Employment changes <25%
25-50%
>51%
< 25% 25-50%
>51%
1994/93 -5,1 * * -6,0 -15,5 -3,6 -10,71995/94 -9,0 * -15,9 -11,5 +2,0 -6,8 -7,81996/95 -8,3 -20,7 -13,2 -11,6 -13,8 -12,9 +2,51997/96 -9,4 * -18,0 -11,2 -16,6 -15,3 +1,2
As is shown in the table the only category having experienced positive changes isopen-stock companies with workers share more than 50%. And the most severe employmentdecline was experienced by closed-stock with workers share less than 50%.
So far two tendencies can be traced: economic indicators are the better 1) the more isthe proportion of shares belonging to workers; 2) the more consistent the process of propertyrestructurisation is. The relatively more satisfactory performance of state enterprises in somecases may be explained by their more favourable starting positions.
There were two directions in employment declining. First one - reducing of the num-ber of employees and breaking up into smaller units. Second - Formation of the new smallenterprises. During 1993-1997 the cumulitive effect brought to increasing of the share of thesmall enterprises more than three times and decreasing twice the share of big enterprises (with

12
1000 employees and more). In Moscow and Nijnii Novgorod this process was more distinct.(See Table 9 and Diagram 1).
Table 9.Distribution of the enterprises by employment size, 1993-1997 , %employment size 1993 1994 1995 1996 1997less 100 people 7,8 11,8 15,0 20,5 25,5100-250 24,2 22,9 24,8 25,2 22,9251-500 30,7 31,4 31,4 26,5 27,5501-1000 17,0 17,6 13,1 13,2 11,8more 1000 people 20,3 16,3 15,7 14,6 12,4
Diagram 1.Shares of enterprises with number of employed less than 1000 people in Moscow andN.Novgorod oblast in 1993-1997,%
������������������������
����������������������
���������������������������������������
������������������������������������������������
��������������������������������������������������
0
1 0
2 0
3 0
4 0
5 0
1 9 9 3 1 9 9 4 1 9 9 5 1 9 9 6 1 9 9 705
1 01 52 0
2 53 0
���������������� M o sc o w N i j e g o r . R e g i o n i n a v e r a g e
Working out employment policy . From the beginning of market reorientation of the econ-omy enterprise employment policy was influenced by changes in social and economic situa-tion. The first stage in linked to institutional reorganisation of 1991-1993. The change of po-litical priorities of the last half of 1991 generated the price liberalisation of 1992, which wasseverally opposed by the majority of enterprise managers. At the time employment policy wasone of the last concerns.
During the second stage (1993-94) the main concern of the managers was privatisationand property division. The only aspect of employment policy that mattered to them was verypragmatic: how to make the employees to divide enterprise property to management`s advan-tage. It was a period of equitable property distribution and democratic innovations in thecharters of newly established corporations.
During the first two stages employment reduced steadily about 8% per year.1994/95 became a turning point for enterprise employment policy. Firstly, with ac-
complishment of the first stage of privatisation the management`s position was strengthenedand enterprise directors acquired a new status. Secondly, the ban on mass releases of redun-dant personnel was lifted. Thirdly, it became clear to many directors that simply cutting downthe employment could not raise production efficiency if not accompanied by structural reor-ganisation, changing the nomenclature and enforcing market competitiveness.
In 1995 the managers started to plan the employment size taking into account the salespossibilities, which became the most acute problem for the majority of enterprises. The im-
13
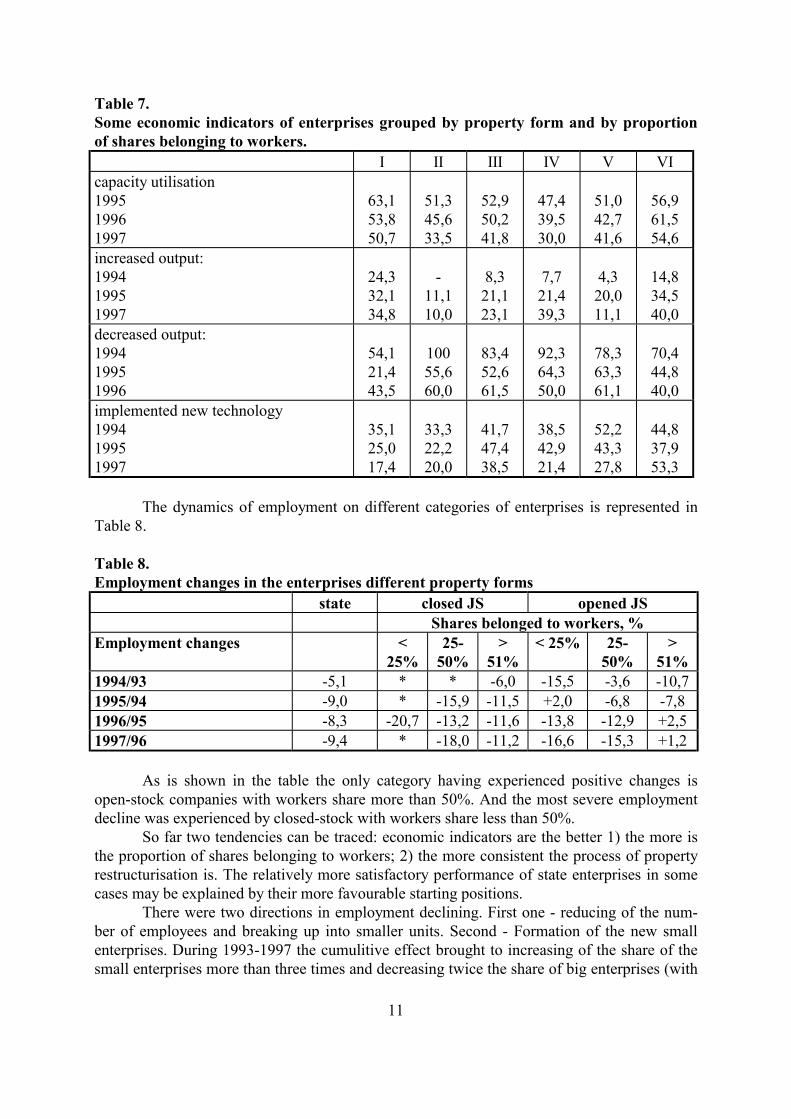
portant difference between having consumers and having solvent consumers began to emerge.The problem of non-payments became the crucial point influencing the management`sevaluation not only of employment perspectives for survival of their enterprises as well.Change of employment . Not withstanding the declared by enterprise directors lack of interestto employment problems, a pronounced employment policy linking reduction of employmentto reduction of output and the rate of production capacities usage. According to our surveydata, between 1993 and 1997 the rate of production capacity usage fell about 40% while em-ployment fell 31,4% (see diagram 2). If before 1995 the average annual reduction in employ-ment was about 8% in the late 1990s it amounted to 10,8% in 1995/96, 10,4% in 1996/97.
Diagram 2.Average number of employed at the enterprises in 1993-1997. (according to the data of thepanel of 154 enterprises, surveyed in 1994-1997), people.*
500
600
700
800
900
1000
1993 1994 1995 1996 1997
930
849803
727
638
*By the whole range of enterprises surveyed in 1997 (186 enterprise) the average number ofemployed amounted to 606 people.
Manpower releases. The decline of output and worsening of economic conditions ofthe enterprises influenced the structure of employees made redundant and the reasons forseparations. From the beginning of reforms forecasting redundancies and large-scale unem-ployment in the nearest future became a common saying. But years passed and no mass re-dundancies happened. As it was in the old times the main reason for separations was “ theown will” of voluntary quit was always not less than 60% which is very high according to in-ternational standards. The proportion of redundancies was 4 and sometimes even 10 timesless. Still the “quality” of voluntary quit during the transition period has changed considera-bly.1991 - The voluntary quits were really voluntary and not only stated as such on paper. Themain reason was finding a new higher paid and/or higher status job in the new sectors ofeconomy: cooperatives and later small private enterprises. The job offered by those sectorswere not only higher paid but gave better opportunities to realise aptitudes and aspirations ofmany ambitious workers. It was the highly qualified core personnel who quitted. According tothe enterprise directors the reasons for quits were distributed as follows: ”higher panty on thenew job” - 69,5%, “moving to another economic sector, to start one’s own business” - 9,8%,

14
“unsatisfactory work conditions” - 6%. Enterprise management usually took some pains tokeep qualified employees such as raising salaries and wages (73,6% of questioned directors)or offering various benefits including improvement of living conditions.1992-1993 - the start of privatisation. Stimulated by the growth of “work interruptions” whichsoon grew into “forced stoppages” of production full or partial, enterprise management beganactively pushing employees who had reached 55-60 years of age to “voluntary retirement”promising increases to their pensions or significant severance payments. The efforts to stopqualified personnel quits become less pronounced. Gradually administrative leave comes intobeing though the management usually pays compensation amounting to average wage. Duringthe period the rate of release of redundant workers is the highest - 13,7%.1994-1995. The paid administrative leave becomes widespread and sometimes unpaid leave ispractised. Voluntary quits are gradually replaced by separations forced by non-payment ofwages and salaries, frequent production stoppages, diminishing job security. The proportion ofsuch pseudo-voluntary quits is growing while the proportion of open releases of redundantemployees is diminishing (see table 10 )1996-1997. Enterprise administration actively stimulates pseudo-voluntary quits. While thegroup of rather more well-to-do enterprises practices both ways of cutting employment (openreleases and pseudo-voluntary quits) the group of their less lucky counterparts having no fi-nancial resources to repay the arreared wages to say nothing of severance payments just waitsfor the despaired employees to quit “on their own will”.
So, the rather low rate of releasing redundant employees in the mid 90`s was fullycompensated by pseudo-voluntary quits. The fact is certainly worth noting when evaluatingthe Ministry of Labour proposal not to pay any unemployment benefit to those unemployedwho left their enterprises “on their own will” as it is practised in some countries. The peculi-arity of Russian situation as opposed to common practice of other countries when “voluntary”separation are in fact included by severe employment conditions in consciously ignored.
Table 10.The structure of separations, by reasons in 1994-1997. N=153
Reasons 1994 1995 1996 1997“own will” 63,0 63,5 61,6 59,1retirement 13,8 14,3 18,6 17,1firing because of discipline violation 5,3 4,6 6,3 4,3redundancy releases 6,9 5,7 14,2 10,5
Changes in professional structure of employees4.During 1990-s employment restructuring took place upon the following directions.
Decline of the proportion of qualified workers in the total employment. The rate of reductionof employment of qualified workers was the highest after 1994. Notwithstanding the fact thatformally qualified workers quitted enterprises “on their own will”, as a role those werepseudo-voluntary separations induced by either non-payment of wages or very small size of
4 This part of the paper is based on researches done by A.Moskovskaya on the bases of survey of industrialenterprises 1991-1997. The full version is presented in report “Changing in professional structure of personnel ofindustrial enterprises”/

15
remuneration incomparable not only to descend consumer standards but even to the regionalliving wage. Nevertheless even during the late 1990-s rate of separations for qualified workerswas not very high and the reduction of proportion of this category in the total employment wasnot drastic. The phenomenon may be explained by the growing tenseness of regional labourmarkets coupled with a lack of possibilities for intra-regional and inter-regional migration be-cause of high cost of accommodation (housing) and transport.
For the majority of workers fear of loosing their job co-exist with the fear of not find-ing a new one in the district or city where they belong. Therefore workers usually prefer ad-ministrative leave or involuntary part-timing and many-month wait for arreared wages whilekeeping the links to their enterprise and the employed status to open unemployment/ If theRussian labour market were as flexible as it is perceived by many of officials lots of those suf-fering from unfavourable employment conditions would prefer to quit and the proportion ofqualified workers on surveyed enterprises would have declined much more drastically.
The policy of management aimed at keeping qualified personnel when it is possiblehas also contributed to restraining the rate of separations for this category. The reasons undersuch policy is that with disappearance of qualified stuff the industry profile of enterprise maybe lost and the changes for survival may be lost with it. So the management has strong mo-tives for keeping such workers in spite of the fact they are currently idle. Two thirds of enter-prises surveyed admitted to have a labour surplus.
Increase of the proportion of low-qualified workers. The dynamics of employment of unquali-fied workers is not linked to the dynamics of production as that of qualified. For instance,output decline may not lead to reduction of demand for unqualified labour if the enterpriseincreases barter operations and delivery services. Establishing departments for sailing thegoods produced in order to obtain real money may also increase the demand for unqualifiedlabour/ As unqualified workers have no specialised human capital they have no incentives tohold to internal labour market of any particular enterprise, their intra-regional mobility iscomparably high - 33 percent of all unqualified workers changed jobs annually, while only 16percent of qualified ones do so.
Growing proportion of administrative stuff. There may be two reasons to explain such proc-ess: simple bureaucratisation of management and establishment of new managing units havingclearly defined functions to solve the problems posed by the changed economic situation. Forexample, some successful enterprises have organised marketing departments and invited pro-fessionals in the field to work there. The retraining of their own managerial stuff was moreexpansive. In the most cases however organisation of departments bearing the same name isno more than reorganisation or better say renaming and enlarging of existing sales departmentwhen employees from other departments of the enterprise are transferred there without anyretraining just save the cost of inevitable otherwise separations.
Table 11.The proportion of some professional categories in total employment in
1991,1994,1996, in percentProfessional category 1991 1994 1996managerial 12,1 15,5 15,6qualified workers 64,1 63,6 61,8unqualified workers 15,2 12,1 13,1

16
On the basis of the survey data to opposite models of enterprise employment policycan be distinguished. The first behaviour model is typical for enterprises with steadily de-clining total employment. Those enterprises have reoriented their main efforts from the pro-duction sphere to the sphere of sales and services provision. Such strategy leads to dealingproportion of core production workers and increasing proportion of administrative employees.The second model is applied by enterprises where total employment has increased. The prior-ity is given to raising production efficiency through technical and technological improvement.Such strategy leads to declining proportion of both administrative employees and unqualifiedworkers.
Each model has its positive and negative aspects. On the one hand, reorientation ofprofessional structure from production workers to managing and service personnel (includingunqualified workers usually not involved in basic production activities) may in principle leadto stabilisation of enterprise economic conditions favourable for generating production growthand return of qualified personnel. Still another alternative is simple profit redistribution to theadvantage of the top enterprise management accompanied by dequalification and quits of corequalified workers. On the other hand giving priority to production efficiency may bring possi-ble results only on condition of favourable economic situation generating demand for enter-prise products. If it is not so sales crisis followed by output and employment decline is inevi-table.
Payment for Labour PolicyCurrent decade had the following tendencies in the field of payment for labour.The decrease of the State influence on the process of formation of the payment for la-
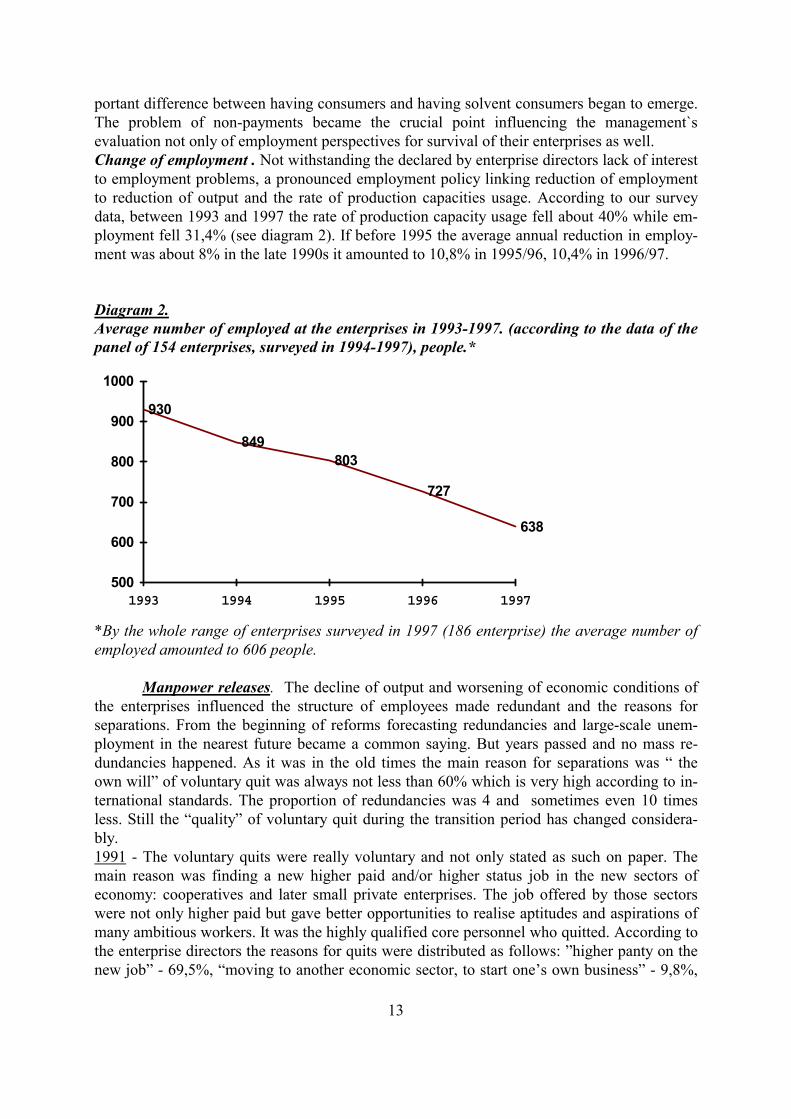
bour. The evidence of that is, in the first instance, the repudiation to use the fixed tariff sys-tem. In 1996, just 23.5% of the enterprises used tariff system to calculate the wages of theiremployees (in 1995 — 46%, in 1994 — 56% of the enterprises), 43.9% used tariff system justas guidelines for the calculation of wages of different categories of employees. At one third ofthe enterprises, directors developed their own system of payment for labour, giving up the tar-iff system. The significance of such State index as minimum wage has declined as well. TheState minimum wage index is a basis for the system of payment for labour at just 32% of theenterprises.The increase of the branch differentiation in the level of payment for labour. Light industrywas traditionally a low-wage branch. The lingering crises in this industry has led to“chronically low” wages. The wages of the workers are two times less than the wages of theworkers in food processing industry, the leading industry by the level of payment for labour.The following data testify to the stability of the tendencies. Since 1994 till 1997 the wages inengineering and construction materials industry were average by the industry. Wages in lightindustry were significantly lower (about 0.7 of the average by the industry), wages in foodprocessing industry — significantly higher (1.3 times higher than the average). Significantchanges in the level of payment for took place only in chemical industry — in 1994 wagesequalled 0.9 of the average wage, but due to the higher rate of growth, the payment for labourin chemical industry amounted to 1.16 of the average wage by industry by the year of 1997.
17
Diagram 3.Branch differentiation of the payment for labour.
0200400600800
100012001400
May, 1994 May, 1996 May, 1997
Engineering Food process. Light Woodprocess.
Chemical Constr. mat. Average
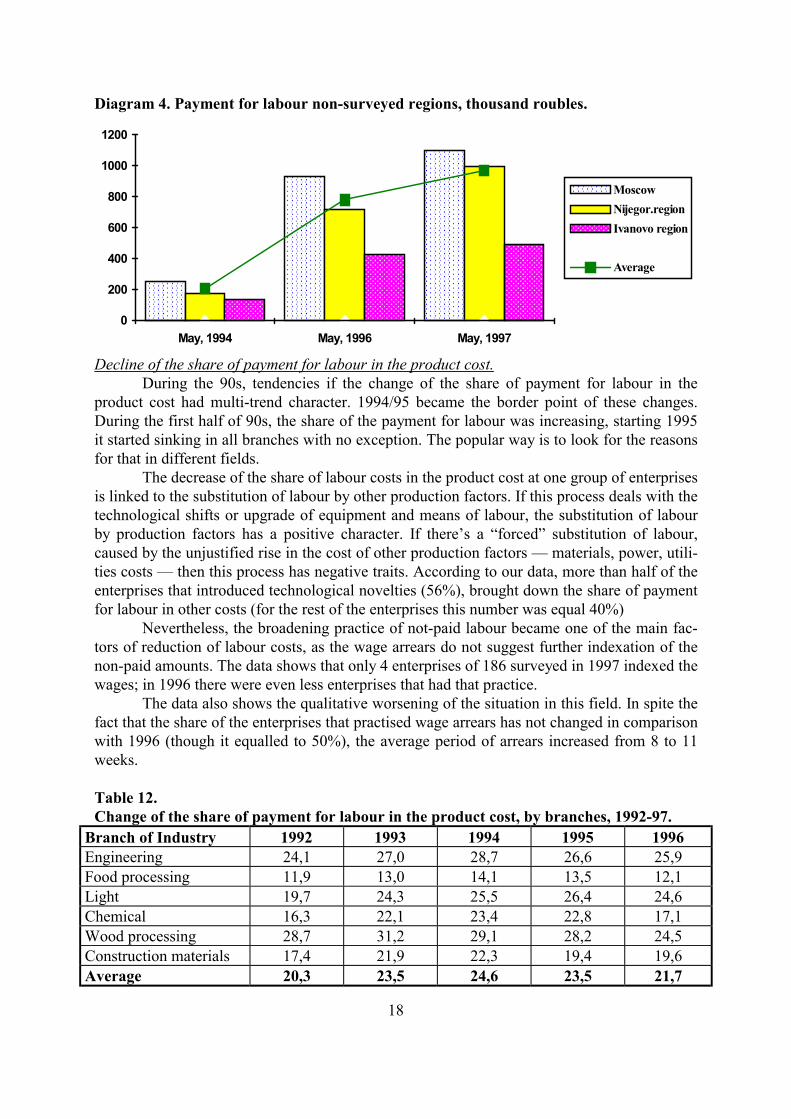
Interregional differentiation in the level of payment for labour. Process of the differentiationin payment for labour depends greatly on the typology of the selected regions. “Prosperity” ofthe Moscow region is stipulated by the status of the capital and dynamically developing labourmarket. Relative “wealth” of the Nijegorodskii region can be explained by the fact that vastinvestment opportunities and “specific” attention of the politicians since the market reformsstarted, is levelled to a great extent by the big share of the enterprises of the defence industry,that belong to the State, with all the problems, inherent for this branch (lack of State orders,idle time, problems in payment of wages, drain of qualified specialists, etc.). Steady“depression” of Ivanovo region, that is based on the multi-branch peculiarities of the region, isworsened by the region’s orientation not on the inner points of the growth of the economics,but on the traditional subsidies from the Centre.
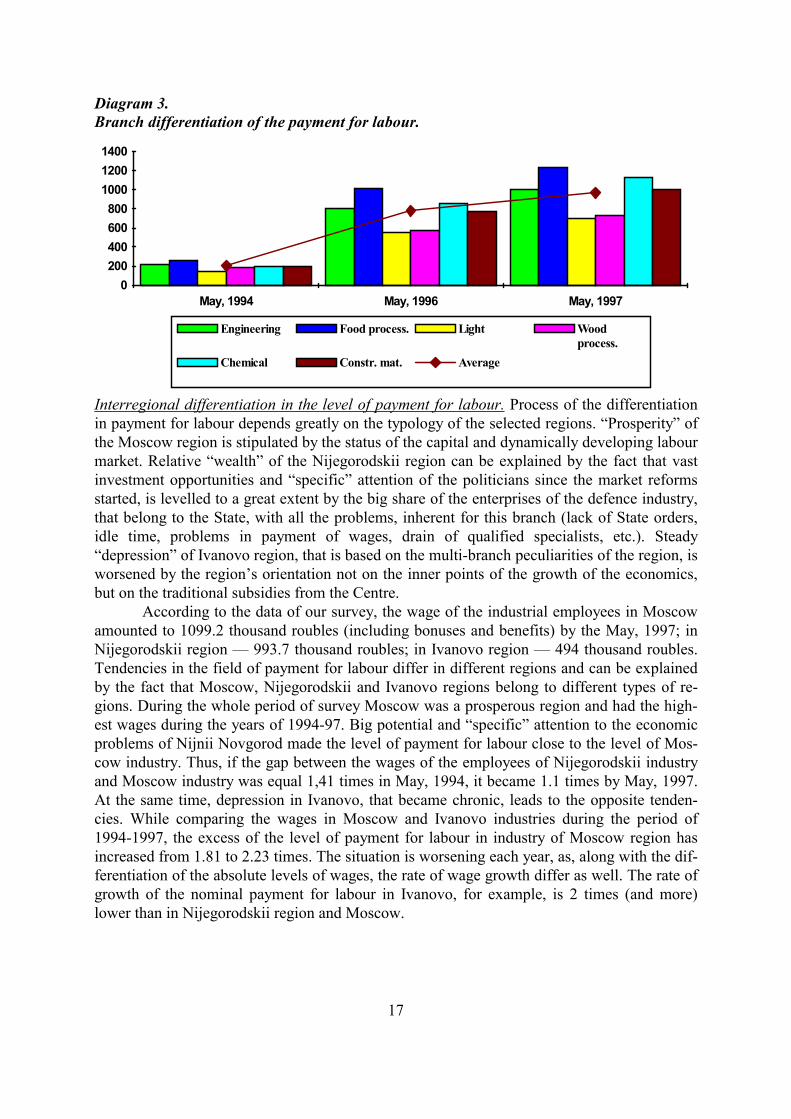
According to the data of our survey, the wage of the industrial employees in Moscowamounted to 1099.2 thousand roubles (including bonuses and benefits) by the May, 1997; inNijegorodskii region — 993.7 thousand roubles; in Ivanovo region — 494 thousand roubles.Tendencies in the field of payment for labour differ in different regions and can be explainedby the fact that Moscow, Nijegorodskii and Ivanovo regions belong to different types of re-gions. During the whole period of survey Moscow was a prosperous region and had the high-est wages during the years of 1994-97. Big potential and “specific” attention to the economicproblems of Nijnii Novgorod made the level of payment for labour close to the level of Mos-cow industry. Thus, if the gap between the wages of the employees of Nijegorodskii industryand Moscow industry was equal 1,41 times in May, 1994, it became 1.1 times by May, 1997.At the same time, depression in Ivanovo, that became chronic, leads to the opposite tenden-cies. While comparing the wages in Moscow and Ivanovo industries during the period of1994-1997, the excess of the level of payment for labour in industry of Moscow region hasincreased from 1.81 to 2.23 times. The situation is worsening each year, as, along with the dif-ferentiation of the absolute levels of wages, the rate of wage growth differ as well. The rate ofgrowth of the nominal payment for labour in Ivanovo, for example, is 2 times (and more)lower than in Nijegorodskii region and Moscow.
18
Diagram 4. Payment for labour non-surveyed regions, thousand roubles.
���������������������������������������������������
��������������������������������������������������������������������������������������������������������������������������������������������������������������������������������������������������������
������������������������������������������������������������������������������������������������������������������������������������������������������������������������������������������������������������������������
��������������������������������
�����������������������������������������������������������������������������������������������
������������������������������������������������������������������������������������������������������������
0
200
400
600
800
1000
1200
May, 1994 May, 1996 May, 1997
��������������������MoscowNijegor.region��������������������
��������������������Ivanovo region
Average
Decline of the share of payment for labour in the product cost.During the 90s, tendencies if the change of the share of payment for labour in the
product cost had multi-trend character. 1994/95 became the border point of these changes.During the first half of 90s, the share of the payment for labour was increasing, starting 1995it started sinking in all branches with no exception. The popular way is to look for the reasonsfor that in different fields.
The decrease of the share of labour costs in the product cost at one group of enterprisesis linked to the substitution of labour by other production factors. If this process deals with thetechnological shifts or upgrade of equipment and means of labour, the substitution of labourby production factors has a positive character. If there’s a “forced” substitution of labour,caused by the unjustified rise in the cost of other production factors — materials, power, utili-ties costs — then this process has negative traits. According to our data, more than half of theenterprises that introduced technological novelties (56%), brought down the share of paymentfor labour in other costs (for the rest of the enterprises this number was equal 40%)
Nevertheless, the broadening practice of not-paid labour became one of the main fac-tors of reduction of labour costs, as the wage arrears do not suggest further indexation of thenon-paid amounts. The data shows that only 4 enterprises of 186 surveyed in 1997 indexed thewages; in 1996 there were even less enterprises that had that practice.
The data also shows the qualitative worsening of the situation in this field. In spite thefact that the share of the enterprises that practised wage arrears has not changed in comparisonwith 1996 (though it equalled to 50%), the average period of arrears increased from 8 to 11weeks.
Table 12.Change of the share of payment for labour in the product cost, by branches, 1992-97.
Branch of Industry 1992 1993 1994 1995 1996Engineering 24,1 27,0 28,7 26,6 25,9Food processing 11,9 13,0 14,1 13,5 12,1Light 19,7 24,3 25,5 26,4 24,6Chemical 16,3 22,1 23,4 22,8 17,1Wood processing 28,7 31,2 29,1 28,2 24,5Construction materials 17,4 21,9 22,3 19,4 19,6Average 20,3 23,5 24,6 23,5 21,7

19
Broadening of the practice of use of flexible forms of payment for labour. It is known that inmany countries the practice of structural changes, that caused sharp cut back of production,was accompanied by the broad use of flexible systems of remuneration for labour, aimed atthe reduction of labour costs and stimulation of the labour production growth.
In Russian processing industry the situation is not that simple and differs by the aspectof time, that had its edge at 1995. During the first half of the 90s, the main trend was to reducethe share of the tariff part and to broaden the use of the flexible forms, first of all — bonuspayments. There was a correlation between the indices of the economic activities of the enter-prise and the share of the permanent part in the structure of the payment for labour. The betterwere the indices of the activities of the enterprise (utilisation ratio, lack of idle periods, in-crease in employment), the lower was the share of the tariff part in the payment for labour.With the average share of the tariff part as 70% (by all enterprises), the least value of this in-dex was observed at the enterprises of prosperous food industry and relatively prosperous fer-rous metal industry (57.2% and 64% respectively). In the “crisis” light industry the share ofthe tariff part equalled to 77.1%.
The situation started changing in 1995. First, the share of the permanent part of pay-ment for labour increased (68.2% in 1994 to 76% in 1997) and the share of bonuses decreased(23% in 1994 to 20% in 1997). Second, the increase of the share of tariff was of an unevencharacter in the part of payment for labour for different qualificational groups: most rapidgrowth was in the group of directors (64% in 1994 to 77% in 1997), least growth was in thegroup of qualified workers (66% in 1994 to 72% in 1997). Probably, it was caused by the in-creasing crises of non-payments, wage arrears and increase if the share of barter in enterprises’settlements, that was the reason for the wages to become “natural”. Under the conditions ofthe “deficit” of wage resources, it is natural that the management is trying to reduce bonuspayments in the first instance. This can also explain the wish (and, what is more important, theway) of the management to include as much “live” money in the wages as possible, that willhelp to “insure” the wages from non-money payments.
The other major peculiarity of the second half of 90s was the reduction of the share ofbenefits in the total income if the employees of the enterprises — 8% in 1994 to 3% in 1997.It is known that benefits were traditionally a measure for levelling of the incomes and supportof the categories of employees with low wages. Besides that, till 1996, benefits were not asubject for taxation, that’s why they were widely used by the enterprises. That’s why, sincethat time, reduction of the share of benefits, provided to the employees, is observed (in thefirst instance it influenced additional forms of social insurance, practised before, meal subsi-dies, etc.).
As far as the payment of dividends is concerned, they were not paid regularly andmade an insignificant value in the structure of the total income. But by the year of 1997 theshare of these payments was levelled by the categories of staff — 1.5% for directors andqualified workers (2.6% and 2.4% respectively in 1994) and 1% for non-qualified workers(2.6% in 1994).

20
Diagram 5.Structure of the total income in May, 1994 and 1997, in %.
1994
d i v i d e n d
s
2 %
t a r i f f
6 7 %
b e n e f i t s
8 %
b o n u s
2 3 %
1997
d i v i d e n d
s
1 %
t a r i f f
7 6 %
b e n e f i t s
3 %
b o n u s
2 0 %
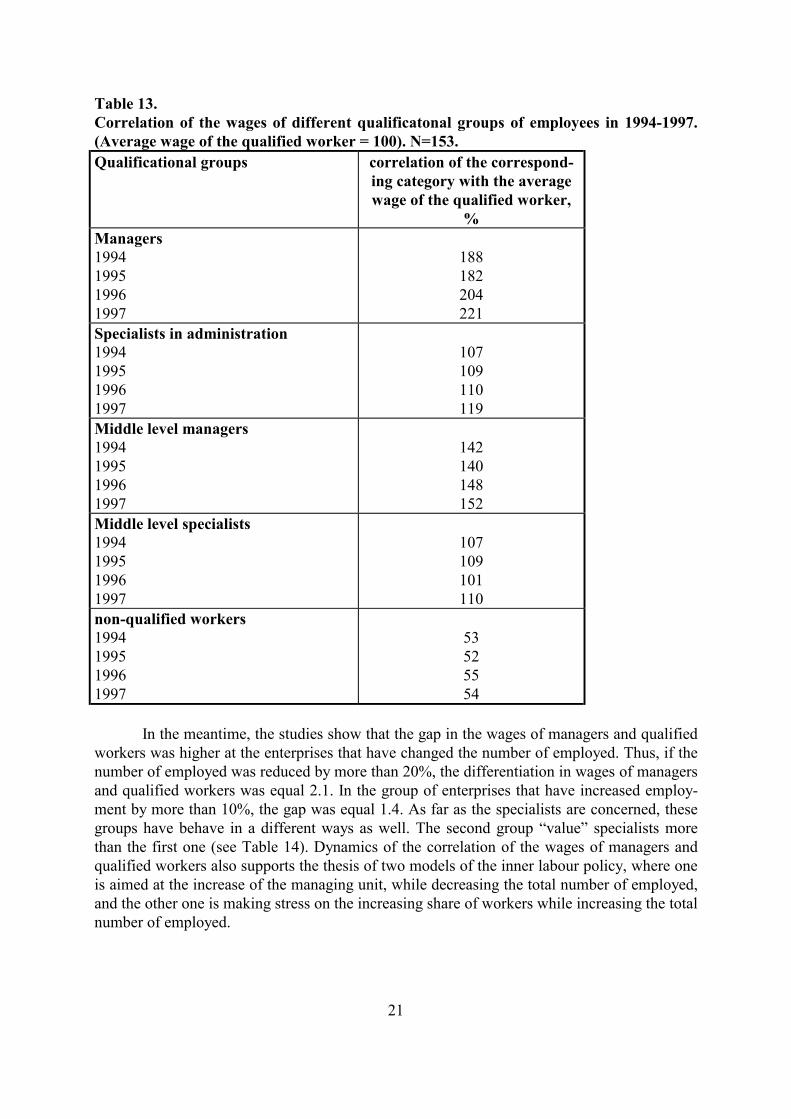
The increase of the internal differentiation in the payment for labour at the enterprise that re-sulted in (1) increasing outstripping of the wages of managers in comparison with the wagesof qualified workers, (2) relatively stable correlation between the wages of qualified and non-qualified workers and (3) “underestimation” of the specialists of the higher and middle level,as their wages are just a bit higher than the wages of qualified workers and are lagging behindsignificantly from the salaries of even the managers of the middle level (see Table 13). As theresult of the economic crisis, the economic relations between the level of qualification, qualityof labour and level of wages were destroyed.
21
Table 13.Correlation of the wages of different qualificatonal groups of employees in 1994-1997.(Average wage of the qualified worker = 100). N=153.Qualificational groups correlation of the correspond-
ing category with the averagewage of the qualified worker,
%Managers1994199519961997
188182204221
Specialists in administration1994199519961997
107109110119
Middle level managers1994199519961997
142140148152
Middle level specialists1994199519961997
107109101110
non-qualified workers1994199519961997
53525554
In the meantime, the studies show that the gap in the wages of managers and qualifiedworkers was higher at the enterprises that have changed the number of employed. Thus, if thenumber of employed was reduced by more than 20%, the differentiation in wages of managersand qualified workers was equal 2.1. In the group of enterprises that have increased employ-ment by more than 10%, the gap was equal 1.4. As far as the specialists are concerned, thesegroups have behave in a different ways as well. The second group “value” specialists morethan the first one (see Table 14). Dynamics of the correlation of the wages of managers andqualified workers also supports the thesis of two models of the inner labour policy, where oneis aimed at the increase of the managing unit, while decreasing the total number of employed,and the other one is making stress on the increasing share of workers while increasing the totalnumber of employed.

22
Table 14.Correlation of the wages (including bonuses) of some of the professional groups, de-pending on the changes of the number of employed in May, 1997. (Wage of the qualifiedworker = 100%), in %
correlation of the wages at the enter-prises
increased em-ployment more
than 10%
reduced employ-ment more than
20%managers 137 211specialists in administration 127 111Middle level managers 192 161Middle level specialists 111 101non-qualified workers 62 53
Benefits, provided to the employees.We understand benefits as different forms of address, money and quasi-money sup-
port, provided to the employees by the enterprise. These forms are not obligatory, as, for ex-ample, State guarantees (annual vacation or paid sick-lists), and are not linked directly to theresults of the activities of the employees (as bonuses or payments from profit).
We have defined three groups. First — benefits on the regular and universally-subsidirial basis that are available for all employees: (1) subsidies to cover transportationcosts; (2) subsidies to cover expenses on meals (can be of two types — either money, or cou-pons for the factory mess); (3) subsidies to cover expenses on food products and other good,purchased at the shops, owned by the enterprise.
The second group consists of support that has a regular basis, but is available only forthe specific categories of workers: (1) subsidies for those who live in the buildings that belongto the ministry or enterprise, or, in some cases assistance in renting an apartment; (2) subsidiesto cover the expenses on nursery schools, or maintenance of such schools at the expense of theenterprise; (3) additions to the pensions — available for the pensioners, both those who stillwork at the enterprise, and those who’s left the enterprise.
Third group consists of the non-regular money payments: material support, partiallypaid places in sanatoriums, resorts, etc.
Each specific enterprise has its own basket of benefits, but the analysis of the overalldata will make it possible to determine the most popular of them, i.e. those that are availablefor the workers at most of the enterprises.
As the result of the analysis carried out, it was/was not determined a significant differ-ence in ability to use the benefits between the management of the enterprise and industrialworkers and between employed full and short working day as well. Significant differences inaccess and use of the benefits were found only in the category of temporarily employed work-ers. That is why the further analysis of the data we carried out using only two types of work-ers: main industrial workers, employed full day, and temporarily employed workers. Thesummarised data of the frequency of distribution of different types of benefits for these cate-gories of employed are shown in the Table 15.

23
Table 15.Types of benefits and their availability for the different categories of employees.Types of benefits Industrial workers,
employed full workingday
Temporarily em-ployed workers*
Regular benefits of the general charactertransportation subsidies 26.4 10.2Meals subsidies 38.0 23.8Privileged price on industrial goods 8.2 6.7Regular benefits for specific categories of workersliving benefits, subsidies 14.1 1.3nursery schools subsidies 31.6 9.2additions to pensions 8.2 3.5Non-regular benefitsMaterial support 86.3 24.1resorts, sanatoriums 42.7 13.3health care 50.9 16.3nonrecurrent payments at the moment of theleave for pension
68.8 11.1
*Data is shown for the enterprises, where the share of the temporarily employed workers wasequal 63%.
As it cam be seen from the Table 15, most of the enterprises preferred to provide theiremployees with the non-regular benefits, mainly material support (83,3%) and nonrecurrentpayments at the moment of the leave for pension (68.8%). It should be mentioned that allbenefits, gathered in this group appeared to be mostly popular. Probably, it could be explainedby the relatively small financial weight of these benefits, considering the total number of em-ployed.
The second place by the frequency of distribution take the benefits, that are providedusually to all employees on the regular basis. In this group could be distinguished such bene-fits as meals subsidies (38.0%) and subsidies, covering transportation costs (26.4%). As a pe-culiarity of these types of benefits, it should be mentioned that they are stable and financiallytransparency. Usually, these very benefits may be easily checked as included in the financialexpenses of the enterprise, and as the additional income of the employees.
Benefits, provided to the specific categories of the employees appeared to be leastpopular. Thus, subsidies to cover the expenses on the nursery school are available only at31,6% of the enterprises, accommodation subsidies — 14.1%, and additions to pensions —8.2%.
Level of availability of the benefits for the temporal workers is significantly lower.Usually all types of benefits are 3-4 times less available for the temporal workers than for thepermanent workers. The least divergence is observed in the group of the regular benefits,where the gap makes up 1.5-2.5 times. These differences in ability to use different types ofbenefits can be explained by the general character of the regular payments, though even in thiscase the discrimination of the temporal workers is obvious.
At the enterprises of different property forms the differentiation in provision of thebenefits is insignificant. The only worth mentioning aspect is the significant reduction of thebenefits for the employees of the State enterprises (more than 5 times), while at the enterprises

24
of the other property forms this reduction was not more than 2.5-3.5 times. Probably, the rea-son for that are some limitations on hire of the temporal workers for the State enterprises.Among the branches of Industry, enterprises of the food processing and chemical industrieswith the stable or increasing number of employed are leading by the number of benefits pro-vided.
Social sphere of the enterprises.Even not long ago the existence of the social sphere was supposed to indicate the
prosperity of the enterprise and it’s high status. Those were mainly big enterprises of the engi-neering and chemical industries (most of them belonged to the Defence industry), as well asthe giants of the Soviet light industry, traditionally subsidised by the Centre. The social serv-ices were provided to the workers free or at a very low price and were covered at the expenseof the income of the enterprise.
During the years of economic transformations the situation changed radically. Socialsphere, became a burden for the enterprise or even a threat for it’s existence. That’s why moreand more enterprises lately are trying to get rid of the social infrastructure, to transfer it to thebalance of municipal bodies or just to sell it to somebody else. During the period of 1994-1995, 13.1% of the enterprises got rid of the social objects. In 1996-97 — 29.6%. The trans-fer of the social infrastructure under the jurisdiction of the municipal bodies was mostly activein “depressed” Ivanovo region, where the enterprises were first to feel that burden, takingaway 28.7% of their income. In 1994-1995 18% of the enterprises of Ivanovo region got rid ofthe objects of social sphere, and by 1997 just 30% of the enterprises kept the social infra-structure. The situation is different in Nijegorodskii region (where the share of the Defenceindustry is high in the industrial structure of the region), where even in 1997 61% of the en-terprises kept fully or partially their social infrastructure. It should be mentioned that till 1995most of these enterprises, being owned by the State, were not in a rush to get rid of the socialsphere, expecting the State support and State orders. Obviously, the hopes ran dry by 1996. Totestify to it, there is a sharp increase of the number of the enterprises that have transferredtheir social infrastructure fully or partially under the jurisdiction of the municipal authorities(43.3% in 1996-97). In the meantime, a big number of the enterprises of Nijegorodskii region(40.3%) are planning further relief from the social sphere (40.3% against 20% in Ivanovo re-gion).
The smoothest process of transfer of the social infrastructure can be observed at theMoscow enterprises. Annually, 12-13% of them got rid of their social sphere.
If the ratio of the transfer of the social sphere will stay at the same level, then it may beassumed that in 2-3 years only these enterprises will have social sphere, which Directors con-sider it to be necessary (in 1997 there were 25% of such Directors in Moscow, 19% in Nije-gorodskii region and 8% in Ivanovo).
25
Labour demand model and estimation
In the preliminary version of this paper we tried to create a labour demand model, us-ing the data available, that covered the period of 1994-1997, and were presented in the an-swers to the questions of the RLFS questionnaire. We should mention, that the labour demandin that model was linked to the employment rate for the prior period, wage, capacities usagelevel (%) and change (+ /-) of the production volume. Further analysis of the data for the prioryears, as well as the additional data received during processing of the questionnaires of 1997,made us to reconsider our approach towards the model.
Though we tried to use the maximum possible number of enterprises in our estima-tions, their number differed from 125 to 140, depending on the year. As the result, 103 enter-prises (for which we had all the necessary data for all years of survey) were selected for thefinal analysis5.
Among the functional forms used to analyse the labour demand in a transitional econ-omy was, for example the following:lnLt =a0 +a1lnLt-1+ a2lnQt +a3lnQt-1 + a4(w/c) t + a5(w/c) t-1+ eThis relationship was used in Korosi (1997) to analyse the employment at 600-700 export-oriented Hungarian firms.
Having in mind the data availability in our survey, in our empirical model we sug-gested that the level of employment during the current year should depend on the level of em-ployment, production volume and the ratio of a share of payment for labour to a share of ma-terial costs in the total production costs per previous year. Thus, we conducted calculations,using the following model:lnLt =a0 +a1lnLt-1+a2lnQt-1 + a3(w/c) t-1+ e
where:L - number of employed as for June, 1st, of the corresponding year. Employed are to be un-derstood as all workers of the enterprise (including permanent and temporal workers, those,working full and reduced working day), except for the women on the maternity leave andchild care leave and employed at the objects of social sphere;Q - annual production output;w/c - Ratio of a share of payment for labour to a share of material costs in the total productioncosts per previous year;e — error
The estimation of the model was carried out in two ways - least squares method (OLS-estimation) and 2-stage least squares method (2SLS-estimation)6. The results obtained areshown in tables 2 and 37.
5 Descriptive statistics are presented in Table 4.6 The following indicators were used as instrumental variables:the volume of production funds (in fact — capital stock), ratio of the production volume to the production funds,ratio of the number of employed to the production funds, level of usage of production capacities. Correlation ofthe residials with the regressors is absent. The estimation of the heteroscedasticity was not carried out as thisfunction is absent in the SPSS software we were using.
26
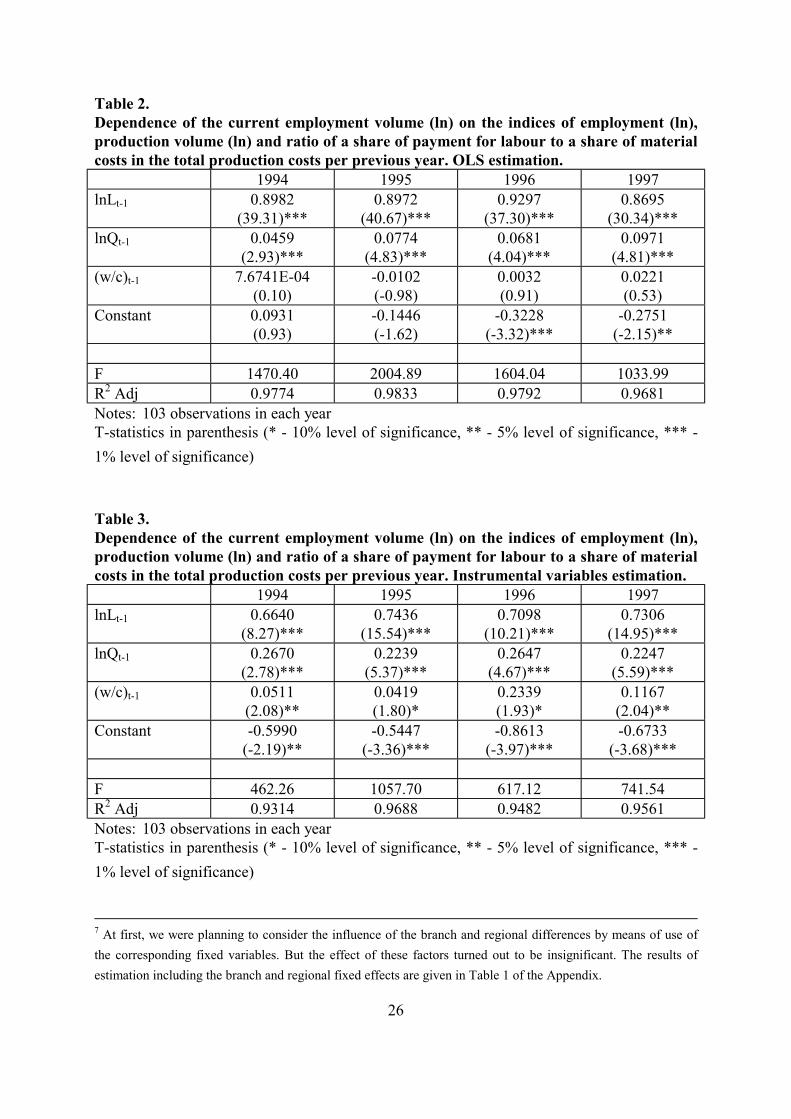
Table 2.Dependence of the current employment volume (ln) on the indices of employment (ln),production volume (ln) and ratio of a share of payment for labour to a share of materialcosts in the total production costs per previous year. OLS estimation.
1994 1995 1996 1997lnLt-1 0.8982
(39.31)***0.8972
(40.67)***0.9297
(37.30)***0.8695
(30.34)***lnQt-1 0.0459
(2.93)***0.0774
(4.83)***0.0681
(4.04)***0.0971
(4.81)***(w/c)t-1 7.6741E-04
(0.10)-0.0102(-0.98)
0.0032(0.91)
0.0221(0.53)
Constant 0.0931(0.93)
-0.1446(-1.62)
-0.3228(-3.32)***
-0.2751(-2.15)**
F 1470.40 2004.89 1604.04 1033.99R2 Adj 0.9774 0.9833 0.9792 0.9681Notes: 103 observations in each yearT-statistics in parenthesis (* - 10% level of significance, ** - 5% level of significance, *** -1% level of significance)
Table 3.Dependence of the current employment volume (ln) on the indices of employment (ln),production volume (ln) and ratio of a share of payment for labour to a share of materialcosts in the total production costs per previous year. Instrumental variables estimation.
1994 1995 1996 1997lnLt-1 0.6640
(8.27)***0.7436
(15.54)***0.7098
(10.21)***0.7306
(14.95)***lnQt-1 0.2670
(2.78)***0.2239
(5.37)***0.2647
(4.67)***0.2247
(5.59)***(w/c)t-1 0.0511
(2.08)**0.0419(1.80)*
0.2339(1.93)*
0.1167(2.04)**
Constant -0.5990(-2.19)**
-0.5447(-3.36)***
-0.8613(-3.97)***
-0.6733(-3.68)***
F 462.26 1057.70 617.12 741.54R2 Adj 0.9314 0.9688 0.9482 0.9561Notes: 103 observations in each yearT-statistics in parenthesis (* - 10% level of significance, ** - 5% level of significance, *** -1% level of significance)
7 At first, we were planning to consider the influence of the branch and regional differences by means of use ofthe corresponding fixed variables. But the effect of these factors turned out to be insignificant. The results ofestimation including the branch and regional fixed effects are given in Table 1 of the Appendix.
27
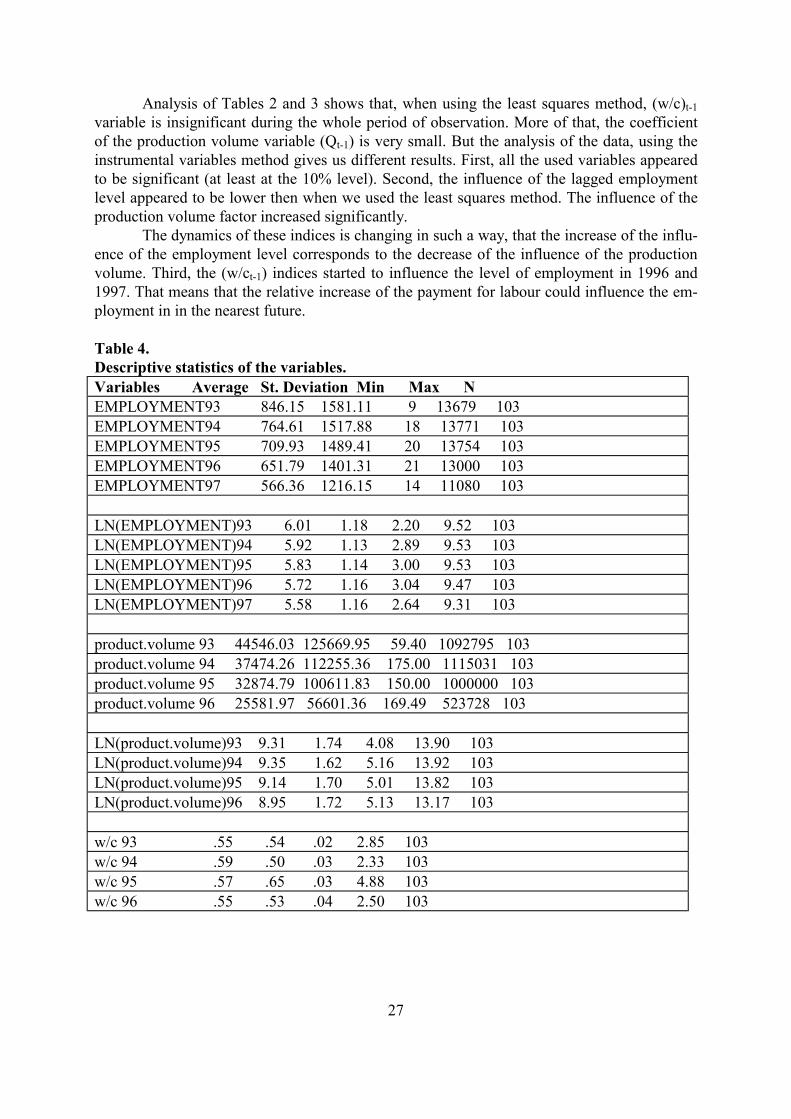
Analysis of Tables 2 and 3 shows that, when using the least squares method, (w/c)t-1variable is insignificant during the whole period of observation. More of that, the coefficientof the production volume variable (Qt-1) is very small. But the analysis of the data, using theinstrumental variables method gives us different results. First, all the used variables appearedto be significant (at least at the 10% level). Second, the influence of the lagged employmentlevel appeared to be lower then when we used the least squares method. The influence of theproduction volume factor increased significantly.
The dynamics of these indices is changing in such a way, that the increase of the influ-ence of the employment level corresponds to the decrease of the influence of the productionvolume. Third, the (w/ct-1) indices started to influence the level of employment in 1996 and1997. That means that the relative increase of the payment for labour could influence the em-ployment in in the nearest future.
Table 4.Descriptive statistics of the variables.Variables Average St. Deviation Min Max NEMPLOYMENT93 846.15 1581.11 9 13679 103EMPLOYMENT94 764.61 1517.88 18 13771 103EMPLOYMENT95 709.93 1489.41 20 13754 103EMPLOYMENT96 651.79 1401.31 21 13000 103EMPLOYMENT97 566.36 1216.15 14 11080 103
LN(EMPLOYMENT)93 6.01 1.18 2.20 9.52 103LN(EMPLOYMENT)94 5.92 1.13 2.89 9.53 103LN(EMPLOYMENT)95 5.83 1.14 3.00 9.53 103LN(EMPLOYMENT)96 5.72 1.16 3.04 9.47 103LN(EMPLOYMENT)97 5.58 1.16 2.64 9.31 103
product.volume 93 44546.03 125669.95 59.40 1092795 103product.volume 94 37474.26 112255.36 175.00 1115031 103product.volume 95 32874.79 100611.83 150.00 1000000 103product.volume 96 25581.97 56601.36 169.49 523728 103
LN(product.volume)93 9.31 1.74 4.08 13.90 103LN(product.volume)94 9.35 1.62 5.16 13.92 103LN(product.volume)95 9.14 1.70 5.01 13.82 103LN(product.volume)96 8.95 1.72 5.13 13.17 103
w/c 93 .55 .54 .02 2.85 103w/c 94 .59 .50 .03 2.33 103w/c 95 .57 .65 .03 4.88 103w/c 96 .55 .53 .04 2.50 103
28
Appendix
Stages of the empirical work on the enterprise survey
The work on the Project was conducted during the period January-December, 1997. Severalmain directions were followed.
I. Preparation and carrying out of the survey of 186 industrial enterprises in three regionsof Russia: Moscow, Ivanovskaya Oblast and Nizhegorodskaya Oblast.
The work done can be summarised as follows:1) modification of the questionnaire by making changes and additions (January-
February, 1997). During that stage a new separate question on the total sales value during1995 and 1996 in current prices was included. there was no such question in the questionnaireof the previous years, but the information on sales was crucial for the construction of themodel;
2) choice of the regions and sample construction (March-April, 1997);3) multiplying the questionnaire and accompanying materials: 200 copies of the part 1
(8 pages each), 200 copies of the part 2 (20 pages each), 180 letters for the enterprise man-agement, 180 copies of the report on the results of the previous survey (April-May, 1997);
4) instructing groups, carrying out field works in the regions (end of May -- beginningof June, 1997);
5) Field works (June, 1997);6) Data processing, verification of the base metrics with the survey data of 1996, logi-
cal control (July, 1997);7) Typing data (180 questionnaire X 500 variables + 90,000 variables) - July, 1997;8) Cleaning the database (1st week of August, 1997).
II. Operations with the database of 1997.
Standard groupings by:- number of employed, change of employment;- wage and salary, bonus payments;- share distribution;- enterprise social sphere
were made.
III. Panel database formation. The panel consists of enterprises which were covered by thesurvey during the last four years -- 1994-1997. Forming such a panel was absolutely necessaryfor construction and analysis of the labour demand model.
IV. Construction of the model. Several stages of model construction must be outlined.
1. Development of a preliminary variant of the model using the 1996 data (January-May, 1997).
2. Trying the model out using the data of previous surveys (April-May, 1997).

29
3. Modifying the model taking into account the comments of EERC experts (secondhalf of July -- August, 1997).
4. Formation of the database covering the period 1994-1997 (2nd-3rd week of August,1997).
5. Primary calculations on the basis of the model using the database formed (August,1997)8.
V. Preparation of the analytical materials (papers) on the following aspects:- changes in professional structure of the internal labour market;- labour surplus at the enterprises: tendencies and consequences;- changes in the forms of hiring of employees at the privatised enterprises;- social and economic consequences of the privatisation;- role of TU during enterprise restructuring;- training and retraining during employment restructuring;- state of the “vulnerable” groups of employees (women, youth, disabled workers);- benefits and social sphere of the enterprises.
8 The organisational part of this report demonstrates clearly that part of the expert comments could not bepossibly dealt with before August 1997, that is before final database panel was formed.

30
Table 1.Dependence of the current employment volume (ln) on the indices of employment (ln),production volume (ln) and ratio of a share of payment for labour to a share of materialcosts in the total production costs per previous year. Least squares method9.
1994 1995 1996 1997lnLt-1 0.9079
(34.67)***0.9067(32.21)***
0.9394(31.94)***
0.8553(24.56)***
lnQt-1 0.0430(2.44)**
0.0651(3.20)***
0.0630(3.15)***
0.1013(4.22)***
(w/c)t-1 0.0011(0.13)
-0.0126(-1.22)
0.0027(0.76)
0.0284(0.61)
Constant 0.0596(0.54)
-0.0745(-0.79)
-0.3031(-2.88)**
-0.2275(-1.60)
Branches (engineering as the basis)Food 0.0341
(0.63)0.0053(0.10)
0.0411(0.77)
-0.0289(-0.41)
Light -0.0034(-0.64)
-0.0913(-2.11)**
-0.0081(-0.16)
-0.0835(-1.31)
Chemical -0.0306(-0.50)
-0.0728(-1.42)
-0.0045(-0.08)
-0.0527(-0.73)
Wood processing 0.0691(0.98)
-0.0487(-0.82)
0.0127(0.19)
-0.1208(-1.41)
Construction materials 0.0151(0.19)
-0.0736(-1.11)
-0.1464(-1.96)*
-0.0355(-0.36)
Regions (Moscow as the basis)Nijnii Novgorod -0.0040
(-0.10)0.0384(1.15)
-0.0549(-1.42)
0.0513(1.01)
Ivanovo -0.0411(-0.74)
-0.0245(-0.52)
-0.0645(-1.19)
0.0682(0.99)
F 421.12 625.16 486.96 302.74R2 Adj 0.9763 0.9839 0.9794 0.9673
9 T-statistics is given in brackets; * - 10% level of significance, ** - 5% level of significance, *** - 1% level ofsignificance.

31
Literature1. C.Аукуционек, Р.Капелюшников. Почему предприятия придерживают рабочуюсилу?// МЭ и МО, 1996, №11.2. Е.Виноградова. Российские предприятия: занятость, заработная плата, социальнаяинфраструктура.//Общество и экономика. 1996, №7.3. В.Кабалина, И.Козина, И.Донова. Реструктурирование занятости на предприятиях иразвитие рынка труда в России.//Общество и экономика. 1996, №№9-10.4. Р.Капелюшников, C.Аукуционек. Трудоизбыточность и поведение предприятий.//МЭи МО, 1996, №12.5. П.Карпов. Виртуальные чудеса российской экономики.//Эксперт, 1998, №2.6. Я.Корнаи. Экономика дефицита. М., .7. Я.Магнус, П.Катышев, А.Пересецкий. Эконометрика. М., Дело, 1997.8. Механизмы адаптации внутреннего рынка труда предприятий к новымэкономическим условиям. М., ИЭ РАН,1995.9. А.Московская. Избыточная занятость на промышленных предприятиях России: pro etcontra.//Вопросы экономики, 1998, №1.10. T.Boeri, M.Burda. Active Labor Market Policies, Job Matching & the Czech Miracle.Humboldt-Universitat zu Berlin, 1995.11. M.Burda, M.Luboyva. The Impact of Active Labour Policies: a Closure Look at the Czechand Slovac Republics. Centre of Economic Policy Research, London, 1995.12. A.Drobny. Real Wages and Employment. 1988.13. P.Fallon, D.Verry. The Economics of the Labour Markets. 1988.14. Human Development Report 1996. Russian Federation. UNDP. “Academia”, 1997.15. G.Korosi. Labour Demand during Transition in Hungary (Econometric Analysis of Hun-garian Firms, 1986-1995). Budapest, Institute of Economics, 1997.16. E.Kwiatkowski, T.Tokarski. Active Labour Market Policies in Poland. An AugmentedMatching Function Approach. University of Lodz, 1995.17. P.R.J.Layard, S.J.Nicell. The Causes of British Unemployment. In: National InstituteEconomic Review, 1985, February.18. S.Mashin, A.Mannning, C.Meghir. Dynamic Model of Employment based on Firm-LevelPanel Data. In: Labor Demand and Equilibrium Wage Formation. Amsterdam,1993.19. P.Smirnov. The Economic Development of Industrial Enterprises and the Dynamics andStructure of Employment. In: Structure Adjustment without Mass Unemployment? Ed. by S.Clarke. Suffolk, 1998.