Development of quality indicators for in-home aged
239
www.pwc.com Development of quality indicators for in-home aged care Evidence review summary report December 2021
Transcript of Development of quality indicators for in-home aged

www.pwc.com
Development of quality indicators for in-home aged care Evidence review summary report
December 2021

Development of quality indicators for in-home aged care PwC ii
Disclaimer This evidence review summary report is not intended to be used by anyone other than Department of Health.
We prepared this evidence review summary report solely for Department of Health’s use and benefit in accordance with and
for the purpose set out in the Work Order with Department of Health dated 23 September 2021. In doing so, we acted
exclusively for Department of Health and considered no-one else’s interests.
We accept no responsibility, duty or liability:
• to anyone other than Department of Health in connection with this evidence review summary report
• to Department of Health for the consequences of using or relying on it for a purpose other than that referred to above.
We make no representation concerning the appropriateness of this evidence review summary report for anyone other than
Department Olof Health. If anyone other than Department of Health chooses to use or rely on it they do so at their own risk.
This disclaimer applies:
• to the maximum extent permitted by law and, without limitation, to liability arising in negligence or under statute; and
• even if we consent to anyone other than Department of Health receiving or using this evidence review summary report.
Liability limited by a scheme approved under Professional Standards legislation.

Development of quality indicators for in-home aged care PwC iii
Document control
Document status Final
Content last updated 31 October 2021
Version V0.2
Point of contact Ronelle Hutchinson
Approver Department of Health, Choice and Transparency Branch
Date of approval 10 November 2021
Version control
Version Date Summary of changes
V0.1 18 October 2021 First draft
V0.2 31 October 2021 Second draft: Updates made following feedback from the Department

Development of quality indicators for in-home aged care PwC iv
Contents
Executive summary 1
1 Project background 12
2 Evidence review methodology 14
3 Evidence review prioritised domains 18
4 Functions and Activities of Daily Living (ADLs) 21
5 Service delivery and care plans 26
6 Weight loss/malnutrition/dehydration 31
7 Falls and major injuries 35
8 Pressure injuries/skin integrity 39
9 Workforce 43
10 Pain 46
11 Continence 50
12 Hospitalisations 54
13 Depression 58
14 Carer distress 61
15 Medication Related 63
16 Wait times/system access 65
17 Behavioural symptoms 67
18 Infection (including antibiotics and vaccinations) 69
19 Cognition 71
20 Palliative care 73
21 Other clinical 75
22 Mortality 77
23 Summary and discussion 79
Appendix A References 85
Appendix B Evidence review methodology 96
Appendix C Ranked quality indicators performance characteristics 101

Development of quality indicators for in-home aged care PwC 1
Executive summary A consortium consisting of PricewaterhouseCoopers (PwC), the Centre for Health Services Research at the University of
Queensland (UQ CHSR) and the Registry of Senior Australians (ROSA) at the South Australian Health and Medical
Research Institute (SAHMRI) has been engaged by the Australian Government Department of Health (the Department) to
assist in the development of quality indicators for in-home aged care. The project, to develop quality indicators, is intended
to guide the further expansion of the National Aged Care Mandatory Quality Indicator Program (QI Program).
A targeted review of national and international literature has been undertaken to identify evidence based quality of care
domains and quality indicators for possible expansion of the QI Program to in-home aged care. The domains and quality
indicators identified were then distilled for consideration to take to consultation with aged care stakeholders and technical
experts, to inform those which should be piloted with in-home aged care services.
Evidence review and assessment
A multi-step process has been undertaken to scan and identify relevant quality of care domains and quality indicators from
published and grey literature. In line with an analytic framework developed for the project, the identified domains and
individual quality indicators have been prioritised and ranked based on the sufficiency and quality of their evidence base,
and their potential value to the QI Program.
The consumer experience and quality of life (CEQOL) domain has been excluded from this review due to work previously
completed in this area by a separate Department appointed Consortium. Figure 1 summarises the number of quality of care
domains and quality indicators that were identified at each stage of the evidence review process.
Figure 1: Number of quality of care domains and quality indicators identified by stage
Domain
theming
Data
extraction
Data
ranking
Quality
indicator
assessment
19 quality of care
domains identified
230 quality indicators
across 19 domains
identified
Top 10 rated domains
identified
110 quality indicators
assessed against the
criteria
The 110 quality indicators across 10 domains were
prioritised to reflect the quality of their evidence base
and value to the QI Program
Domains were included for review if:
• the aims of the domain and quality indicators are to improve/monitor the quality of aged care
• data collection is based on the population
• reporting and quality indicators are current.
Data about quality indicators from studies and reports was extracted through the defined search
process and each quality indicator was documented.
All domains were assessed and ranked against four criteria to identify the top 10 domains to be
included, using a standardised scoring system to determine which domains:
• include evidence based indicators
• are important to improving quality of care
• possess international agreement
• include the ability for outcomes to be influenced by aged care services.
Within these 10 domains, 175 quality indicators were identified. Of these 175 quality indicators, 65
were deemed to have insufficient evidence, leaving 110 quality indicators.
A total of 110 quality indicators within each of the top ten ranked quality of care domains were
quantitatively assessed and ranked against criteria using a standardised scoring system.
The quality indicators were ranked using two discrete methods:
(1) each quality indicator was assessed against six criteria
(2) the scores for the evidence base were plotted against the value to the QI program to derive a
prioritised listing.

Executive summary
Development of quality indicators for in-home aged care PwC 2
This review identified 19 domains of quality of care and 230 quality indicators used for in-home aged care across several
countries. Each domain was assessed and ranked in terms of:
• high quality evidence-based indicators were identified in the domain
• international agreement that the domain is important
• in-home aged care services can influence care and consumer experience in this domain
• monitoring this domain is important for high quality care and consumer experience.
Based on this quantitative assessment, the quality of care domains in ranked order are:
1. Function and Activities of Daily Living (ADLs)
2. Service delivery and care plans
3. Weight loss/malnutrition/dehydration
4. Falls and major injuries
5. Pressure injuries/skin integrity
6. Workforce
7. Pain
8. Continence
9. Hospitalisations (including emergency department presentations)
10. Depression
11. Carer distress
12. Medication related
13. Wait times/system access
14. Behavioural symptoms
15. Infection (including antibiotics and vaccinations)
16. Cognition
17. Palliative care
18. Other clinical
19. Mortality
A total of 175 associated quality indicators were identified for the top 10 ranked domains. Of the 175 quality indicators, 65
were deemed to have insufficient evidence for a full assessment, leaving 110 quality indicators to be assessed. Each of
those quality indicators has been assessed against the US National Quality Forum criteria modified for the Australian aged
care and quality indicator context, with two additional criteria proposed by the consortium and agreed to by the Department.
A standardised scoring scale was assigned by evaluating the quality indicator against the following 6 criteria:
• importance
• scientific acceptability
• feasibility
• usability
• attribution
• value to the QI Program.

Executive summary
Development of quality indicators for in-home aged care PwC 3
Quality indicators within each domain were then ranked in order of priority based on their evidence (ie the first 5 criteria) and
value to the QI Program using a prioritisation matrix. The executive summary presents the top 10 ranked quality of care
domains (in order of ranking) and their associated quality indicators (Table 1). Please note that the terms ‘clients’ and
‘patients’ are used interchangeably throughout the document as are aligned to the terminology used in their source
jurisdiction. Unique identifying names have been assigned to each quality indicator to help differentiate those that are very
similar. These unique names are at times different to the specific names used in their source documentation or jurisdiction.
Table 1: Highest ranked domains and their prioritised quality indicators
Domains Domain description and quality indicators
1. Functions and
ADLs
Chapter 4
There are two categories of activities of daily living – basic activities of daily living (ADLs) and
instrumental activities of daily living (IADLS). Basic ADLs include the fundamental skills
needed to manage basic physical needs such as personal hygiene, dressing,
toileting/continence, transferring or ambulating, and eating. IADLS are more complex tasks
such as managing finances, preparing meals and communication.
The prioritised quality indicators for this domain include:
1.1 Clients whose ability to perform daily activities (such as eating and bathing) decreased
over the six months
1.2 Clients whose ADL functioning declined (bathing, personal hygiene, locomotion)
(incidence)
1.3 Clients with a score of less than 18 on the baseline ADL Long Form who decline
further (incidence)
1.4 Clients with baseline impairment and a better score on the ADL Long Form (incidence)
1.5 Clients with a score of less than 15 on the IADL self-performance summary scale at
baseline who declined (incidence)
1.6 Clients with a score of less than 18 on the baseline IADL Scale who decline further
(incidence)
1.7 Clients who decline in independence since their last assessment
1.8 Clients with a score greater than 0 on the IADL self-performance summary scale at
baseline who experience an improvement (incidence)
1.9 Clients who do not have an assistive device and have difficulty in mobility
1.10 Clients with impaired mobility within their home (incidence)
1.11 Patient improvement in ability to ambulate
1.12 Patients who improved or stayed the same in their ability to bathe
1.13 Patients who improve in self-bathing
1.14 Patients who improve or stay the same in their ability to get in and out of bed
1.15 Patients who improved in their ability to get in and out of bed
1.16 Patients who improved in their ability to get to and from and on and off the toilet
1.17 Clients who have rehabilitation potential and do not receive therapy
1.18 Patients who improve or stay the same in ability to manage toileting hygiene
1.19 Patients who improve or stay the same in their ability to get to and from and on and off
the toilet
1.20 Patients who improve or stay the same in ability to groom self
1.21 Patients who improve in their ability to dress lower body
1.22 Patients who improve in their ability to dress upper body

Executive summary
Development of quality indicators for in-home aged care PwC 4
Domains Domain description and quality indicators
2. Service delivery
and care plans
Chapter 5
The service delivery and care planning domain includes a series of services that intend to
measure whether care is planned for, integrated with, and individualised for each person.
According to the Australian Aged Care Quality Standards, aged care services are expected to
demonstrate ongoing assessment and planning with their consumers. Care planning,
specifically co-developed with clients and person centred, is recognised as a fundamental
aspect of service delivery to all consumers receiving in-home aged care services.
The prioritised quality indicators for this domain include:
2.1 Clients involved in developing their home care plan
2.2 Client input into assistance, ability to influence care times, staff ability to carry out work
in required timeframe
2.3 Clients with an updated care plan
2.4 Safety incidents related to missed or late home care visits
2.5 Clients with care plans that identify how their personal priorities and outcomes will be
met
2.6 Clients whose home care plan includes their personal priorities and outcomes
2.7 Evidence of process to ensure home care plans identify personal priorities and
outcomes of clients will be met
2.8 Clients who have a review of the outcomes of their home care plan within a year of
their previous review
2.9 Evidence of process to ensure clients have a review of the outcomes of their home
care plan at least annually
2.10 Clients who have a review of the outcomes of their home care plan within six-weeks of
the service starting
2.11 Evidence of process to ensure that clients have a review of the outcomes of their home
care plan within six-weeks of the service starting
2.12 Patients discharged to the community who do not have an unplanned admission to an
acute care hospital or long-term care hospital in the 31 days and remain alive
2.13 Evidence of process to ensure clients have a home care plan that identifies how their
provider will respond to missed or late visits
2.14 Planned home care visits that are missed
2.15 Clients with a chronic disease management plan
2.16 Clients that have a home care plan that identifies how their provider will respond to
missed or late visits
2.17 Clients who receive home care with risk prevention measures for malnutrition
2.18 Visits of less than 30 minutes with a prior agreement that a shorter visit is acceptable
2.19 Evidence of process to ensure clients have visits of at least 30 minutes unless
otherwise agreed for a specific reason
2.20 Clients who receive home care with risk prevention measures for pressure ulcers
2.21 Visits lasting 30 minutes or longer
2.22 Clients who receive home care with risk prevention measures for impaired oral health

Executive summary
Development of quality indicators for in-home aged care PwC 5
Domains Domain description and quality indicators
3. Weight
loss/malnutrition/
dehydration
Chapter 6
Unplanned weight loss is the result of deficiency in a person’s dietary intake relative to their
needs and may be a symptom and consequence of disease. Malnutrition is the lack of proper
nutrition and can be caused by not having enough to eat, not eating enough of the right
things, or not being able to use the food and nutrition that one does eat. Dehydration occurs
when you use or lose more fluid than you take into your body, and your body does not have
enough fluids to carry out its normal functions. Unplanned weight loss, malnutrition and/or
dehydration are reported in up to a third of older adults and can be associated with poor
health outcomes, reduced quality of life and related healthcare costs. Unplanned weight loss
can be a clinical symptom and consequence of poor health or presence of disease and is one
of the best indications of poor nutrition in older people. Weight loss and malnutrition are
associated with higher mortality and morbidity, including increased risk of falls and fracture,
pressure injury development, hospitalisations, infections, poor recovery from disease or
surgery, reduced physical and mental function, and lower quality of life.
The prioritised quality indicators for this domain include:
3.1 Clients who experienced weight loss
3.2 Clients with unintended weight loss at follow-up
3.3 Clients with weight loss in the last 30 days
3.4 Clients who present to Emergency Department or are hospitalised and weight loss or
malnutrition were reported
3.5 Clients with unintentional weight loss (client reported)
3.6 Clients with dehydration
3.7 Clients with dehydration in the last 30 days
4. Falls and major
injuries
Chapter 7
A fall is an event that results in a person coming to rest inadvertently on the ground or floor or
other lower level. A fall resulting in major injury is a fall that meets this definition and results in
one or more serious injuries like bone fractures, joint dislocations, or closed head injuries.
Falls in older people are a public health priority due to their high prevalence, related injuries,
increased risk of mortality and reduced quality of life. In Australia, falls are the leading cause
of hospitalised injury and injury-related deaths in older people. A third of older people living in
the community fall at least once every year. There are many factors that influence falls, and
many of these factors can be prevented.
The prioritised quality indicators for this domain include:
4.1 Clients who fell
4.2 Clients who experienced one or more falls in the last 90 days
4.3 Clients experiencing one or more falls requiring medical attention
4.4 Clients with new fall-related injuries and breaks
4.5 Clients experiencing at least one fall-related fracture
4.6 Clients with new fall-related injuries (fractures, second- or third-degree burns,
unexplained injuries)
4.7 Patients experiencing one or more falls with major injury
4.8 Clients who fall with trauma (last 30 days)
4.9 Clients with an incident of falling
4.10 Hip fractures among people 65 years and older (3 year average)
4.11 Clients with fall injuries admitted to hospital among people 80 years and older (3 year
average)

Executive summary
Development of quality indicators for in-home aged care PwC 6
Domains Domain description and quality indicators
5. Pressure injuries/
skin integrity
Chapter 8
A pressure injury is a localised injury to the skin and/or underlying tissue, usually over a bony
prominence, due to pressure, shear, or a combination of these factors. Pressure injuries are
potentially life threatening, decrease a person’s quality of life, and are expensive to manage.
The older population are at higher risk of developing pressure injuries, because of skin and
soft-tissue changes associated with ageing as well as other age-related impairments such as
malnutrition, immobility, incontinence, impaired cognitive status, and frailty.
The prioritised quality indicators for this domain include:
5.1 Percentage of quality episodes in which the patient has one or more Stage 2-4
pressure ulcers, or an unstageable ulcer/injury, present at discharge that are new or
worsened since the beginning of the quality episode
5.2 Proportion of HCP episodes where clients had an emergency department presentation
or hospitalisation where pressure injury was reported
5.3 Pressure ulcer or skin tear in the last 30 days
5.4 Incidence of clients with a skin ulcer
5.5 Proportion of clients with a pressure ulcer
6. Workforce
Chapter 9
Aged care is one of Australia’s largest service industries. In 2020 the industry employed
434,000 paid workers, with the majority (76 per cent) in direct care roles. This includes
123,048 direct care staff employed in the home care setting (home care packages and home
support services). Findings from the Royal Commission into Aged Care Quality and Safety
have reported Australia’s aged care system is understaffed and undertrained.
The prioritised quality indicators for this domain include:
6.1 Responsiveness of staff, safety living at home, and confidence in staff
6.2 Number of home care workers providing care to an older person
6.3 Staff helping a client in 14-day period (average)
6.4 Staff retention
6.5 Visits for each client per home care worker
6.6 Evidence of processes to ensure consistent team of workers for each client
6.7 Evidence of supervision discussions with home care workers (every 3 months)
6.8 Workers who had a supervision discussion (within 3 months)
7. Pain
Chapter 10
Pain affects a significant and increasing portion of older adults. Pain affects people’s
functional capabilities, activities of daily living, quality of life, and overall disability. In a
geriatric, frail person, or person with dementia, the effect of pain may be even more
pronounced and cause more serious complications.
The prioritised quality indicators for this domain include:
7.1 Clients who complained or showed evidence of daily pain
7.2 Clients with pain (on pain medication or no pain medication)
7.3 Clients who have pain and are receiving inadequate pain control or no pain medication
7.4 Clients with at least daily episodes of severe pain at follow up
7.5 Clients with daily pain (over 3 days)
7.6 Clients with inadequate pain control
7.7 Clients with a reduction in pain
7.8 Clients whose pain improved
7.9 Clients with daily severe pain

Executive summary
Development of quality indicators for in-home aged care PwC 7
Domains Domain description and quality indicators
8. Continence
Chapter 11
Incontinence is the involuntary loss of bladder and bowel control. Age-related changes
together with frailty, cognitive decline, or impaired mobility, can put older adults at risk of
incontinence. Incontinence is known to increase the risk of poor health outcomes, such as
falls, fractures, hospitalisations, mortality, poor quality of life, functional impairment, and
deterioration in mental health.
The prioritised quality indicators for this domain include:
8.1 Clients who had difficulty controlling urination
8.2 Clients who experience a decline in bladder continence
8.3 Clients who experience a decline in bladder continence (incidence)
8.4 Clients who experience an improvement in bladder continence
8.5 Patients with improvement in bowel control
8.6 Patients with bladder or bowel problem in last 30 days
8.7 Clients diagnosed with incontinence by doctor or specialised nurse
8.8 Clients with a catheter
8.9 Clients with obstipation (incidence)
9. Hospitalisation
Chapter 12
Hospitalisations are admissions to hospitals to receive treatment, which can be planned
(ie elective) or unplanned. Emergency department care is also provided in many hospitals,
and this includes urgent care provision that may or may not result in hospital admissions.
Approximately a third of Australians receiving home care packages experienced unplanned
hospitalisation each year. Many hospitalisations are considered potentially preventable with
preventative health interventions, early disease management, or potential better access to
certain care.
The top ranked quality indicators for this domain include:
9.1 Emergency Department presentation within 30 days of discharge from hospital
9.2 Emergency Department visits by new home care clients in 30 days after leaving
hospital
9.3 Patients who had a potentially preventable 30 day post-discharge readmission
9.4 Clients who require hospital stay or Emergency Department care
9.5 Hospitalisation or Emergency Department use in the 90-day period before follow-up
assessment
9.6 Readmissions for new home care clients 30 days after leaving hospital
9.7 Acute care hospitalisation during first 60 days of home health stay
9.8 Hospital admission in 30 days between surveys
9.9 Emergency Department presentation or hospitalisation for medication-related events
9.10 Patients discharged to community with no unplanned acute hospital or long-term care
facilities in 31 days after discharge
9.11 Clients who require hospitalisation, emergency department presentation or
emergent care
9.12 Emergency Department presentation for clients with dementia or clients hospitalised
for delirium or dementia
9.13 Emergency Department use without hospitalisation during the first 60 days of home
health stay

Executive summary
Development of quality indicators for in-home aged care PwC 8
Domains Domain description and quality indicators
10. Depression
Chapter 13
Depression is a common and serious mood disorder that can affect all aspects of an
individuals’ life. Individuals who suffer depression may experience persistent feelings of
sadness and hopelessness and lose interest in activities they normally would enjoy.
The top ranked quality indicators for this domain include:
10.1 Clients whose mood declined
10.2 Clients with fewer depressive symptoms
10.3 Clients with more depressive symptoms
10.4 Clients suffering from depression
Summary and discussion
The objective of this evidence review is to identify, assess and present the evidence base for quality of care domains and
quality indicators suitable for application to in-home aged care. This evidence base will inform the domains and quality
indicators for stakeholder consultations prior to the selection of quality indicators for pilot.
The evidence review and application of the analytic framework identified the top 10 ranked domains. The 175 associated
quality indicators were assessed and ranked against 6 criteria and prioritised based on the assessment of the evidence
base and value to the QI Program. Key considerations which may impact the quality indicators for pilot include:
Selecting domains and quality indicators for pilot that support the quality improvement objective of the
QI Program
This project aims to identify a set of domains and quality indicators to pilot within the in-home aged care setting in Australia.
The overall objectives of the QI Program are to:
• provide older people with more information about the quality of aged care services when making choices about
their care
• support aged care services to measure, monitor, compare and improve the quality of their services
• provide the government with system-level measures of quality in aged care and an evidence-base to inform policy and
regulation.
The pilot should include a selection of quality indicators that are able to be influenced, changed, or improved by in-home
aged care services, where their actions can change the outcome over time. Driving quality improvement can occur when the
quality indicator is used within organisations or shared in an anonymised format among organisations.
These quality indicators can be used to monitor performance over time, with the assumption that the consumer profiles are
fairly stable within an organisation or can be used among collaborating organisations to promote quality improvement
discussions.
A key consideration identified during this review is that not all quality indicators can be influenced directly by aged care
services, as evident in the ‘attribution’ criteria assessment results for the applicable quality indicators. Most quality of care
domains for in-home aged care are not exclusively affected by the service. Good outcomes for in-home aged care
consumers depends on the complex contributions of medical and allied health practitioners, local hospitals, carers and other
family members, the person themselves and the in-home aged care service.
Even for those quality indicators where there is evidence that a service can substantially influence outcomes for the
consumer, consideration needs to be given to what this might look like in a reformed in-home aged care system where
consumers can choose from more than one service provider. This may mean that outcomes of these quality indicators for

Executive summary
Development of quality indicators for in-home aged care PwC 9
the consumer may not be able to be attributed to any one service, rather they may be influenced more by the collective
interplay of multiple services supporting that person.
Several other quality indicator reporting systems tailor in-home aged care indicators to specific services or consumer groups
(eg only to in-home aged care consumers receiving nursing or clinical services in the United States of America) which is a
possible approach when considering attribution challenges.
In order to support quality improvement as a key objective of the QI Program, quality indicators for pilot could focus on
either ‘improvement’ or ‘decline’ type measurements. Stakeholder and expert advice on the technical aspects of quality
indicators will be sought to determine which approach to measurement is more useful in supporting quality improvement.
Domains and quality indicators for pilot that support the consumer information objective of the
QI Program
The pilot should include a selection of quality indicators that are meaningful to consumers and assist their understanding of
the quality of care provided by the service and how this differs from other services. The potential use of quality indicators for
identifiable public reporting requires the inclusion of quality indicators that can detect differences in the performance of in-
home aged care services.
For this reason, it is important to select quality indicators to pilot which can:
• be scored consistently within and between services,
• allow for a range of performance by services (eg no ceiling or floor effect or rare occurrences), and
• be risk adjusted to account for the variations in consumers and services (potentially requiring additional data linked at
the individual level).
Not all quality indicators identified in the review would be meaningful for consumers to support informed decision making
about in-home aged care services.
Use of quality indicators that are subject to copyright and licencing arrangements
Many of the quality indicators prioritised in this evidence review are derived from data elements (usually clinical
observations) that are subject to copyright and licensing agreements.
Licenses would need to be obtained to include these quality indicators in the pilot, as is the case for many quality indicators
used in Canada, Finland, Iceland, New Zealand and the United States of America (where interRAI systems are mandated).
Use of quality indicators that require multiple observations within a six-week pilot
Several quality indicators require multiple assessments over a longer period of time, potentially preventing appropriate
assessment during the six-week project pilot period. For example, a quality indicator that measures functional decline over 3
months will require two points of data collection (one at the start of month one and one at the end of month 3). For
indicators where repeat measures are required, in a six-week pilot study, only the base (or initial) measure can be tested for
ease of completion or prevalence of the issue, but the full indicator cannot not be calculated.
The in-home aged care system is designed to allow both choice by consumers as well as the ability to increase or decrease
services in response to variation in care needs. This poses challenges in data collection where sequential observations to
account for movement of consumers between different services are required. This could be managed within the pilot by the
careful selection of quality indicators and guidance to services and will need to be considered as part of an expanded
QI Program.

Executive summary
Development of quality indicators for in-home aged care PwC 10
The feasibility of data collection directly from aged care services for some quality indicators
Quality indicators selected for pilot are likely to require similar methods for data collection as the current QI Program,
including direct collection from services on a quarterly basis. Several quality indicators identified in this review use data
obtained from non-provider sources, potentially reducing data burden for in-home aged care services in the pilot.
The potential data collection burden for aged care services to participate in the quality indicator pilot needs to be
considered. For some of the quality indicators outlined in this review, data does not currently exist in a format that would be
easily accessible for services to report during the pilot. To operationalise many of the prioritised quality indicators in the
pilot, new data would need to be collected by services, and in some cases, using new instruments or screening tools not
routinely used.
Data collection burden may vary depending on service characteristics (eg digital record keeping, service maturity, service
size, infrastructure), data source required, number of observations or measurements needed, use of specific
instruments/tools and if the data requires specific staff to collect (eg nursing staff).
• For services that provide both residential and in-home aged care, the data collection burden for piloting some of the
quality indicators in in-home aged care may be reduced by using existing processes and reporting mechanisms
developed for domains in the current QI Program.
• For many quality indicators, a point prevalence approach is used (eg. how many in-home aged care consumers have a
pressure injury at a point in time). These types of indicators are possible to collect by in-home aged care services on a
single day or week for the pilot, but only for consumers who receive services during the pilot period. To overcome this,
some jurisdictions use a 'virtual' point prevalence approach for their quality indicators. For example, all clients of the
service are assessed every 6 months from admission to their service, and the prevalence is calculated from the most
recent assessment (which might be more than 6 months old). These issues of 'how' to collect information for all, or a
subset of, consumers in the pilot need to be considered together with careful selection of quality indicators.
Accounting for different consumer populations and types of services in the pilot
In-home aged care services are as diverse as the needs of the consumers that access them. Within in-home aged care,
considerable variation exists in the type and complexity of services offered (from gardening through to wound care) and the
consumers accessing services (from irregular support through to daily care needs, including those with the highest level of
care support needs).
Many of the domains and quality indicators would apply to only a subset of services and consumers within in-home aged
care. For example, the domain of continence contains quality indicators that would apply only to the sub-set of consumers
with incontinence issues, and to the services who specifically provide continence support.
The application of domains and quality indicators to different consumer groups within the broader in-home aged care
system poses several challenges for the pilot. Consideration should be given to tailoring the pilot to test quality indicators for
specific types of services and consumers where it makes sense to do so.
Several international quality indicator programs have incorporated risk adjustment for consumer characteristics. The need to
collect information on relevant diagnoses and underlying health profiles of the service’s populations should be considered to
understand quality indicator performance for different services during the pilot.

Executive summary
Development of quality indicators for in-home aged care PwC 11
The specific focus of quality indicators in a domain for the pilot.
Many quality indicators identified in each domain in this review reflect slight variations in definitions from different countries.
This has resulted in the inclusion of multiple quality indicators within the same domain that measure the same or very
similar concepts. Some of these variations in definitions are attributable to international bodies using different versions of
the same instruments. The value of measuring a specific concept needs to be considered when selecting quality indicators
from the range identified in each domain for pilot.
The use of validated or standardised tools for measurement
Several of the quality indicators identified in this review require the use of validated and/or standardised scoring
instruments. These may require complex measurement (eg multi-item scales), specific training requirements for data
collection and licensing and copywrite arrangements. The selection of quality indicators for pilot will need to consider if there
are validated or standardised instruments in in-home aged care that could be used to collect data and if it is feasible to
provide training on the use of specific instruments prior to the pilot.
Augmenting the evidence review with advice from stakeholders
As part of developing quality indicators for in-home aged care, the next step will be to take the domains and quality
indicators found in the evidence review to consultation with aged care stakeholders and a technical expert group. This
feedback will help guide the potential domains and quality indicators for pilot and the further expansion of the QI Program.

Project background
Project background
Development of quality indicators for in-home aged care PwC 13
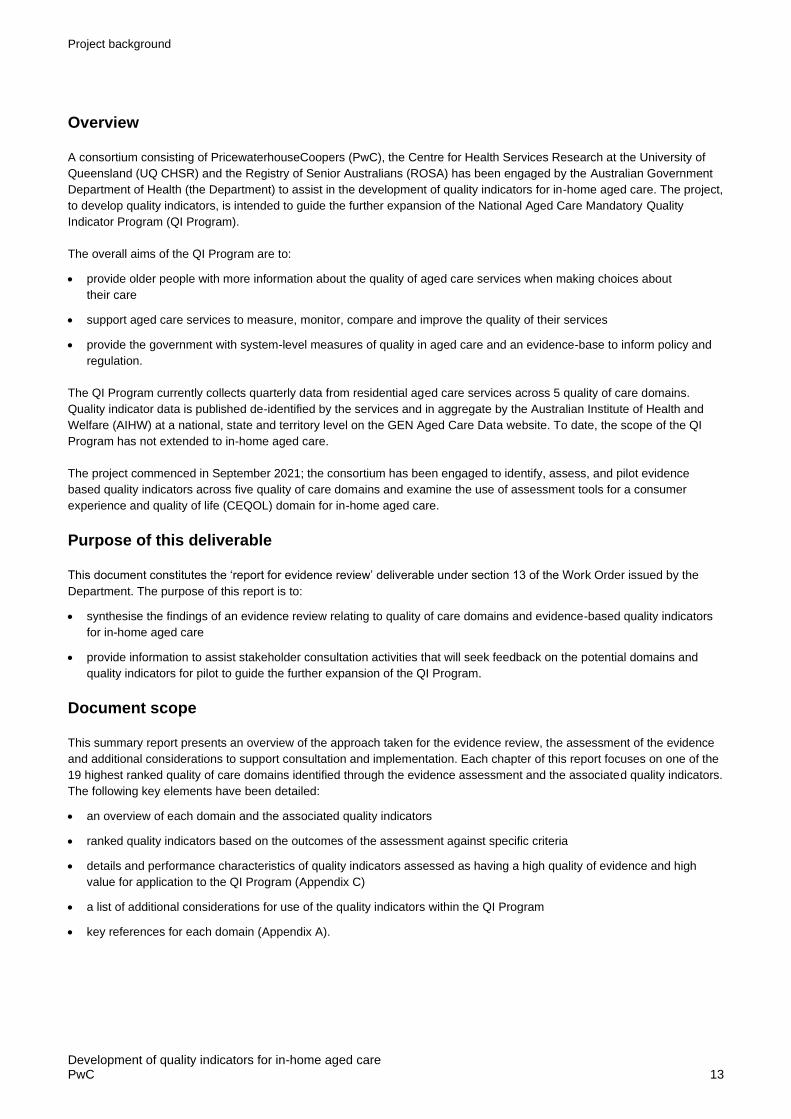
Overview
A consortium consisting of PricewaterhouseCoopers (PwC), the Centre for Health Services Research at the University of
Queensland (UQ CHSR) and the Registry of Senior Australians (ROSA) has been engaged by the Australian Government
Department of Health (the Department) to assist in the development of quality indicators for in-home aged care. The project,
to develop quality indicators, is intended to guide the further expansion of the National Aged Care Mandatory Quality
Indicator Program (QI Program).
The overall aims of the QI Program are to:
• provide older people with more information about the quality of aged care services when making choices about
their care
• support aged care services to measure, monitor, compare and improve the quality of their services
• provide the government with system-level measures of quality in aged care and an evidence-base to inform policy and
regulation.
The QI Program currently collects quarterly data from residential aged care services across 5 quality of care domains.
Quality indicator data is published de-identified by the services and in aggregate by the Australian Institute of Health and
Welfare (AIHW) at a national, state and territory level on the GEN Aged Care Data website. To date, the scope of the QI
Program has not extended to in-home aged care.
The project commenced in September 2021; the consortium has been engaged to identify, assess, and pilot evidence
based quality indicators across five quality of care domains and examine the use of assessment tools for a consumer
experience and quality of life (CEQOL) domain for in-home aged care.
Purpose of this deliverable
This document constitutes the ‘report for evidence review’ deliverable under section 13 of the Work Order issued by the
Department. The purpose of this report is to:
• synthesise the findings of an evidence review relating to quality of care domains and evidence-based quality indicators
for in-home aged care
• provide information to assist stakeholder consultation activities that will seek feedback on the potential domains and
quality indicators for pilot to guide the further expansion of the QI Program.
Document scope
This summary report presents an overview of the approach taken for the evidence review, the assessment of the evidence
and additional considerations to support consultation and implementation. Each chapter of this report focuses on one of the
19 highest ranked quality of care domains identified through the evidence assessment and the associated quality indicators.
The following key elements have been detailed:
• an overview of each domain and the associated quality indicators
• ranked quality indicators based on the outcomes of the assessment against specific criteria
• details and performance characteristics of quality indicators assessed as having a high quality of evidence and high
value for application to the QI Program (Appendix C)
• a list of additional considerations for use of the quality indicators within the QI Program
• key references for each domain (Appendix A).

Evidence review methodology

Evidence review methodology
Development of quality indicators for in-home aged care PwC 15
Objective of the evidence review
The objectives of the evidence review are to:
• identify common quality indicator domains for in-home aged care, recommending at least 10 for further consideration in
the context of the QI Program
• identify all existing quality indicators across the identified domains, with a focus on quality indicators that have
established performance characteristics and the ability to improve quality of care in meaningful ways
• using an analytic framework, assess and rank the domains and associated quality indicators in order of preference for
implementation in the Australian aged care context.
Overview of the evidence review methodology
The process involved members of the consortium comprising of clinicians, measurement scientists and policy experts, to
appraise both domains of care and their associated quality indicators. The consortium used a modified Delphi technique to
appraise the domains and quality indicators to secure consensus by undertaking several steps including:
• co-design of an analytic framework with the Department to enable a systematic and consistent assessment of quality of
care domains and prioritisation of quality indicators
• defining clear parameters for the evidence review and developing the format for evidence synthesis
• initial scan of all quality indictors and themed domains
• extraction and summary of key data from the identified literature
• identification of the range of domains for existing quality indicators
• assessment of each domain against 4 criteria (international agreement, evidence based indicators, importance, and
ability of the service to influence)
• ranking of domains in order based on their assessment against these 4 criteria
• based on this quantitative assessment, the top 10 domains have been put forward as those mostly appropriate for
consideration in the pilot
• all quality indicators within the top 10 domains were assessed against the analytic framework criteria: feasibility,
scientific acceptability, importance, attribution, usability (collectively termed ‘evidence base’) and the value to the QI
Program
• prioritisation of quality indicators based on analytic framework assessment of their evidence base and value of the
quality indicator to the QI Program.
The consortium members involved in the assessment provided individual assessments of domains and quality indicators
based on analytic framework guidance. Aggregate scores were developed and individual scores that deviated 2 points from
the median were identified. An extensive discussion was conducted with a particular focus on areas of disagreement
(ie where a member’s score varied considerably from the group median score). After discussion, all members were offered
the opportunity to rescore. Final scores were then collated to produce the final assessments and ranking. An overview of
this methodology is presented in below and a detailed methodology is included in Appendix B.
Please note that the terms ‘clients’ and ‘patients’ are used interchangeably throughout the document as are aligned to the
terminology used in their source jurisdiction. Unique identifying names have been assigned to each quality indicator to help
differentiate those that are very similar. These unique names are at times different to the specific names used in their
source documentation or jurisdiction.

Evidence review methodology
Development of quality indicators for in-home aged care PwC 16
Figure 2: Evidence review methodology
Data extraction and domain theming of quality indicators
occurred concurrently and through iterative cycles until all
quality indicators had been identified through extraction.
The analytic framework was applied in quantitative assessment of evidence review results
to ensure consistent assessment.
Step 1
Analytic
framework design
Co-designed with the
Department the analytic
framework for the consistent
assessment of:
• Domain ranking
• Quality indicator assessment
• Quality indicator
prioritisation.
Step 3
Domain
theming
The full list of quality indicators
was themed into representative
quality of care domains.
Domains were included for
review if:
• The domain and associated
quality indicators aim to
improve/monitor the quality
of age care
• Data collection is based on
the population
• Reporting and quality
indicators are contemporary
(e.g. last 10 years)
Step 6
Quality indicator
assessment
Quality indicators within the
top ten ranked quality of care
domains were quantitatively
assessed and ranked against
the following criteria using a
standardised scoring system:
1. Feasibility (e.g. data
burden)
2. Scientific acceptability
(e.g. validity, biases)
3. Importance (to the aged
care system)
4. Usability (e.g.
understandable)
5. Attribution (ability of
providers to improve), and
6. Value to the QI program
(alignment with program
goals).
Step 7
Prioritisation
and reporting
A recommended ranked set of
quality of care domains and
quality indicators with the
highest levels of evidence was
developed through the use of
the prioritisation matrix.
Quality indicators were
prioritised based on their
assessment scores from
Step 6 against:
• Evidence base (aggregate
score from criteria 1-5)
• Value to the QI Program
(score on criteria 6)
Prioritisation matrix
Step 2
Literature
review
parameters
Defined parameters to inform
the search for international
and national quality of care
domains and quality indicators
including data from:
• Academic literature
• Grey literature
• Government reports
organisation reports and
websites.
Step 4
Data
extraction
Data about quality indicators
from studies and reports were
extracted through the defined
search process (Step 2). Each
quality indicator has been
documented including:
• General descriptions
• Quality indicator type
(structural, outcome,
process)
• Numerator
• Denominator
• Exclusion criteria
• Risk adjustment
• Data collection type and
frequency
• Reporting (public, facility
level, rating systems)
• Licensing or approval
requirements
• Recommended targets.
Step 5
Domain
ranking
Domain were quantitatively
assessed and ranked against
the following criteria using a
standardized scoring system:
1. The quality of care domain
is critical to high-quality
care and consumer
experience
2. There is at least one
evidence-based quality
indicator available
3. There is international
agreement that the domain
is important
4. Services are able to
influence care and
experiences of the domain.
High
Value
Low
Value
Low
Performance
Evidence
Based
High
Performance
Value of the
QI Program

Evidence review methodology
Development of quality indicators for in-home aged care PwC 17
Parameters of the evidence review
This evidence review has some limitations requiring further consideration as outlined below:
• The availability and sufficiency of published quality indicator information. Quality indicators that lacked specific recorded
information relating to the data requirements outlined above, including reporting specifications, numerator, and
denominator definitions were excluded from this process.
• The availability of information specific to important inclusion, exclusion, and risk adjustment criteria for some quality
indicators.
• The review was undertaken in a rapid timeframe. Whilst every effort was made to leverage existing work on quality
indicators in Australia, a longer timeframe for review may have identified other quality indicators in existence.
• Slight variations in the specifications of quality indicators resulted at times in near duplications of quality indicators within
the same domain. Additionally, domains that differ subtly in collection or reporting specification, for example
measurement of improvement as opposed to decline, inflate the number of indicators measuring the same construct.
Some of these variations may be attributable to international bodies using different versions of the same instruments.
These similarities reduce the variance associated with ratings of similar quality indicators and should be noted when
interpreting indicator scores.
• Whilst CEQOL domains are evidenced in the literature, these were not included within the review process to reduce
duplication with work the Department currently has underway.

Evidence review prioritised domains

Evidence review prioritised domains
Development of quality indicators for in-home aged care PwC 19
Overview
This chapter presents the findings in relation to the evidence review of quality of care domains and the ranked assessment
of these domains for the pilot and possible expansion of the QI Program into in-home aged care.
Ranked quality of care domains
A total of 19 quality of care domains were identified through the literature review, with 230 associated quality indicators.1
The existing domains in the QI Program for residential aged care services of pressure injuries, use of physical restraint,
medications (polypharmacy and antipsychotics), falls and unplanned weight loss were included in this review.
The consortium quantitively assessed each of the 19 identified domains based on the 4 agreed criteria. The domains were
then ranked according to aggregate scoring against the criteria. The ranked list of domains is shown in Table 2. Other than
the ‘other clinical’ and ‘mortality’ domains, all other domains were assessed highly on the existence of measurable quality
indicators, international agreement of their importance, importance for quality and safety of care and able to be influenced
by the service.
Based on this quantitative assessment, the top 10 ranked quality of care domains have been put forward as those most
appropriate for consideration in the pilot and their identified quality indicators were assessed in full against the indicator
criteria (refer to Figure 2: Step 6). The results are summarised in the following chapters of this report.
Each chapter presents:
• an overview of the domain and quality indicators identified for each domain
• the ranked quality indicator for the top 10 domains and their assessment against the analytic framework
• the quality indicators prioritised with high quality of evidence and high value for application to the QI Program
• key considerations and limitations in using the quality indicators for pilot for an expanded QI Program
• details of domains outside the top 10 including ranking rationale and associated quality indicators
• relevant references associated with the evidence review of the domain.
Please note that the terms ‘clients’ and ‘patients’ are used interchangeably throughout the document as are aligned to the
terminology used in their source jurisdiction. Unique identifying names have been assigned to each quality indicator to help
differentiate those that are very similar. These unique names are at times different to the specific names used in their
source documentation or jurisdiction.
Table 2: Quality of care domains aggregated score ranking against assessment criteria
Ranking Domain name
Quality
indicators
identified
Domain assessment criteria
Aggregate
score
Measurable
quality
indicators
International
agreement
Service
able to
influence Importance
1 Function and ADLs 25
2 Service delivery
and care plans
64
3 Weight loss/
malnutrition/
dehydration
7
1 This excludes the additional domain of consumer experience and quality of life where an additional 44 indicators have been identified.

Evidence review prioritised domains
Development of quality indicators for in-home aged care PwC 20
Ranking Domain name
Quality
indicators
identified
Domain assessment criteria
Aggregate
score
Measurable
quality
indicators
International
agreement
Service
able to
influence Importance
4 Falls and major
injuries
14
5 Pressure injuries/
skin integrity
6
6 Workforce 21
7 Pain 10
8 Continence 10
9 Hospitalisations
(including
emergency
department
presentations)
14
10 Depression 4
11 Carer distress 4*
12 Medication related 14*
13 Wait times/system
access
7*
14 Behavioural
symptoms
5*
15 Infection (including
antibiotics and
vaccinations)
8*
16 Cognition 5*
17 Palliative care 5*
18 Other clinical 6*
19 Mortality 1*
Note: * Quality indicators did not progress to the next stage of assessment using analytic framework ^ Domains included in the current QI Program
High (median scores 7-9) Moderate (median scores 4-6) Low (median scores 1-3)

Functions and Activities of Daily Living (ADLs)

Functions and Activities of Daily Living (ADLs)
Development of quality indicators for in-home aged care PwC 22
Definition of this domain
Activities of daily living (ADLs) are categorised as basic and instrumental (IADLS). Basic ADLs include the fundamental
skills needed to manage basic physical needs such as personal hygiene, dressing, toileting/continence, transferring or
ambulating and eating. IADLS are more complex tasks such as managing finances, preparing meals and communication.
Why it is important to monitor this domain
Individuals accessing home care package services often report significant challenges with activities of daily living (ADL) and
instrumental activities of daily living (IADL). Between 2003 and 2014, 56 per cent of new home care recipients reported ADL
limitations with self-care, 51 per cent with walking, 17 per cent with mobility/movement, and 12 per cent with communication
during their aged care eligibility assessments.2 Almost all of these people also reported IADL limitations, most often with
domestic assistance (95 per cent). A decline in physical function, which is marked by a decrease ability to perform basic
ADLs, is often a reason for people to seek aged care services,3 and is associated with falls, hospitalisations, disability, entry
into residential aged care, and death.4 5 While functional decline can be a normal part of the ageing process, it is
exacerbated by chronic conditions, cognitive impairment, and other co-existing conditions. Appropriate care and support
can slow or improve the rate of decline of physical functioning and ADL needs. Interventions that help minimise or prevent
functional decline include physical activity, social interaction, physical therapy, occupational therapy, and speech language
therapy.6 7 Monitoring of function change can help trigger referrals to geriatric assessments to examine disease-related
functional changes, potential onset of frailty, and examine if additional therapies are necessary. 8
According to the Australian Aged Care Quality Standards (Standard 3, requirement 3(d)),9 aged care services are expected
to detect and provide support to address changes and deterioration of ‘mental, cognitive or physical function, capacity or
condition’ of their consumers’.
Quality indicators for this domain
A total of 25 quality indicators for this domain were identified in the evidence review. The quality indicators measure a range
of concepts including specific types of ADLs, improvement or decline and unexpected decline. Of the 25 quality indicators
identified, 3 were considered to have insufficient information to assess against the assessment criteria. The remaining 22
quality indicators were assessed against the assessment criteria with results indicated in Table 3.
The 22 quality indicators were also assessed against the prioritisation matrix, with 22 assessed as having a high evidence
base and being of high value to the QI Program (see Figure 3). The performance characteristics of these prioritised quality
indicators is outlined in Table 16 in Appendix C.
2 Registry of Senior Australians (ROSA) 2019 3 Kadushin 2004 4 Deandrea et al 2010 5 O’Caoimh et al 2015 6 McLaren et al 2013 7 Tak et al 2013 8 Quinn et al 2011 9 Australian Government. Aged Care Quality and Safety Commission 2021

Functions and Activities of Daily Living (ADLs)
Development of quality indicators for in-home aged care PwC 23
Table 3: Quality indicator assessment results
Unique
ID Quality indicators
Fe
as
ibil
ity
Imp
ort
an
ce
Us
ab
ilit
y
Sc
ien
tifi
c
ac
ce
pta
bil
ity
Att
rib
uti
on
Va
lue
to
th
e
QI
Pro
gra
m
1.1 Clients whose ability to perform daily activities
(such as eating and bathing) decreased over the
six months
1.2 Clients whose ADL functioning declined (bathing,
personal hygiene, locomotion) (incidence)
1.3 Clients with a score of less than 18 on the baseline
ADL Long Form who decline further (incidence)
1.4 Clients with baseline impairment and a better score
on the ADL Long Form (incidence)
1.5 Clients with a score of less than 15 on the IADL
self-performance summary scale at baseline who
declined (incidence)
1.6 Clients with a score of less than 18 on the baseline
IADL Scale who decline further (incidence)
1.7 Clients who decline in independence since their
last assessment
1.8 Clients with a score greater than 0 on the IADL
self-performance summary scale at baseline who
experience an improvement (incidence)
1.9 Clients who do not have an assistive device and
have difficulty in mobility
1.10 Clients with impaired mobility within their home
(incidence)
1.11 Patient improvement in ability to ambulate
1.12 Patient who improved or stayed the same in their
ability to bathe
1.13 Patients who improve in self-bathing
1.14 Patients who improve or stay the same in their
ability to get in and out of bed
1.15 Patients who improved in their ability to get in and
out of bed*
1.16 Patients who improved in their ability to get to and
from and on and off the toilet
1.17 Clients who have rehabilitation potential and do not
receive therapy

Functions and Activities of Daily Living (ADLs)
Development of quality indicators for in-home aged care PwC 24
Unique
ID Quality indicators
Fe
as
ibil
ity
Imp
ort
an
ce
Us
ab
ilit
y
Sc
ien
tifi
c
ac
ce
pta
bil
ity
Att
rib
uti
on
Va
lue
to
th
e
QI
Pro
gra
m
1.18 Patients who improve or stay the same in ability to
manage toileting hygiene
1.19 Patients who improve or stay the same in their
ability to get to and from and on and off the toilet
1.20 Patients who improve or stay the same in ability to
groom self
1.21 Patients who improve in their ability to dress lower
body
1.22 Patients who improve in their ability to dress upper
body
Note: Feasibility, scientific acceptability, importance, and usability assessment criteria drawn from the US NQF.
High (median scores 7-9) Moderate (median scores 4-6) Low (median scores 1-3)
Figure 3: Prioritisation of quality indicators for this domain against matrix

Functions and Activities of Daily Living (ADLs)
Development of quality indicators for in-home aged care PwC 25
Quality indicators pilot considerations
There are several considerations for the piloting of these quality indicators:
• Varied definitions for ADLs are used and advice will need to be sought on the most suitable definition for the Australian
context. There is an opportunity for stakeholders to advise on quality indicators reflecting all aspects of ADLs or only
some components (eg indicators regarding toileting, getting out of bed of mobility).
• Several quality indicators within this domain focus on similar ADL concepts, but measure either an improvement or
decline in ADLs. There is an opportunity for stakeholder to advise on whether there is a preference to measure
improvement or decline in ADLs.
• Many of the quality indicators in this domain require sequential and linked assessments of individual consumers
conducted in a standardised manner. For example, any quality indicator that measures ‘improvement’ or ‘decline’
requires two observational points. Within a six-week pilot cycle, it may not be possible to conduct two observations in a
way that is consistent with the definitions used in the quality indicators.
• Some of the indicators in this domain require the use of validated or standardised tools to assess ADLs. Licenses to use
these tools may need to be gained for use in the pilot (eg interRAI derived indicators). There is an opportunity for
stakeholders to advise on tools or methods (such as timed up and go assessment) currently used in in-home aged care
that would be fit for purpose as a data collection tool. Alternatively, the use of the ADL measures built into the Australian
National Aged Care Classification (AN-ACC) could be considered.
• There is an opportunity for stakeholders to advise on the ability of in-home aged care services to influence the quality
indicators through their own actions. Some quality indicators identified for this domain may reflect minimal opportunity
for improvements (overall decline), but others may reflect an ability for the provider to influence (eg improvements in
ability to self-bathe if that is a specific focus of the in-home aged care support). Adding to this complexity is the ability of
the pilot to capture if multiple in-home aged care services are provided to an individual consumer and how, if at all,
these multiple services contribute to the outcome in these quality indicators.
• Some quality indicators identified in the evidence review in this domain may need to be considered for the pilot in light of
different consumer populations within the in-home aged care context. For example, some quality indicators may only be
appropriate for consumers receiving higher or more frequent levels of in-home support.
• Consideration is needed for the pilot as to the type of staff from in-home aged care services who will be required to
collect data for these quality indicators. There is an opportunity for stakeholders to advise on the type of in-home aged
care workers required for the collection of data on ADLs.

Service delivery and care plans

Service delivery and care plans
Development of quality indicators for in-home aged care PwC 27
Definition of this domain
This domain encompasses services and other aspects of service delivery for individuals in their home care settings. For
example, they include care planning, which is an assessment and plan conducted by the aged care provider to meet the
needs of clients, or whether certain services identified in care plans are received.
Why it is important to monitor this domain
This domain includes a series of services that intend to measure whether in-home aged care is planned for, integrated with,
and individualised for each aged care consumer. For example, care planning, risk assessment, and integrated care
measures, examine whether individualised needs have been assessed and care plans are developed, that incorporates an
understanding of the person’s goals and preferences to ensure the delivery of person-centred safe and effective care.
According to the Australian Aged Care Quality Standards (Standard 2, requirement 3(a)),10 aged care providers are
expected to demonstrate ongoing assessment and planning with their consumers, which addresses consumers’ needs,
informs their care, coordinates their care with other organisations, is reviewed regularly when circumstances change, and
are effectively communicated and documented.
Quality indicators for this domain
A total of 64 quality indicators for this domain were identified in the evidence review. Of these, 42 quality indicators were
considered to have insufficient information to assess against the assessment criteria. The remaining 22 quality indicators
were assessed against the assessment criteria with results indicated in Table 4.
The 22 quality indicators were also assessed against the prioritisation matrix with all assessed as having a high evidence
base and being of high value to the QI Program (see Figure 4). The performance characteristics of these prioritised quality
indicators is outlined in Table 17 in Appendix C.
Table 4: Quality indicator assessment results
Unique
ID Quality indicators
Fe
as
ibil
ity
Imp
ort
an
ce
Usa
bil
ity
Sc
ien
tifi
c
ac
ce
pta
bil
ity
Att
rib
uti
on
Va
lue
to
th
e
QI
Pro
gra
m
2.1 Clients involved in developing their home care plan
2.2 Client input into assistance, ability to influence care
times, staff ability to carry out work in required
timeframe
2.3 Clients with an updated care plan
2.4 Safety incidents related to missed or late home
care visits
2.5 Clients with care plans that identify how their
personal priorities and outcomes will be met
2.6 Clients whose home care plan includes their
personal priorities and outcomes
10 Australian Government. Aged Care Quality and Safety Commission 2021

Service delivery and care plans
Development of quality indicators for in-home aged care PwC 28
Unique
ID Quality indicators
Fe
as
ibil
ity
Imp
ort
an
ce
Us
ab
ilit
y
Sc
ien
tifi
c
ac
ce
pta
bil
ity
Att
rib
uti
on
Va
lue
to
th
e
QI
Pro
gra
m
2.7 Evidence of process to ensure home care plans
identify personal priorities and outcomes of clients
will be met
2.8 Clients who have a review of the outcomes of their
home care plan within a year of their previous
review
2.9 Evidence of process to ensure clients have a
review of the outcomes of their home care plan at
least annually
2.10 Clients who have a review of the outcomes of their
home care plan within six-weeks of the service
starting
2.11 Evidence of process to ensure that clients have a
review of the outcomes of their home care plan
within six-weeks of the service starting
2.12 Patients discharged to the community who do not
have an unplanned admission to an acute care
hospital or long-term care hospital in the 31 days
and remain alive
2.13 Evidence of process to ensure clients have a home
care plan that identifies how their provider will
respond to missed or late visits
2.14 Planned home care visits that are missed
2.15 Clients with a chronic disease management plan
2.16 Clients that have a home care plan that identifies
how their provider will respond to missed or late
visits
2.17 Clients who receive home care with risk prevention
measures for malnutrition
2.18 Visits of less than 30 minutes with a prior
agreement that a shorter visit is acceptable
2.19 Evidence of process to ensure clients have visits of
at least 30 minutes unless otherwise agreed for a
specific reason
2.20 Clients who receive home care with risk prevention
measures for pressure ulcers
2.21 Visits lasting 30 minutes or longer
2.22 Clients who receive home care with risk prevention
measures for impaired oral health
Note: Feasibility, scientific acceptability, importance, and usability assessment criteria drawn from the US NQF.
High (median scores 7-9) Moderate (median scores 4-6) Low (median scores 1-3)

Service delivery and care plans
Development of quality indicators for in-home aged care PwC 29
Figure 4: Prioritisation of quality indicators for this domain against matrix
Quality indicators pilot considerations
There are several issues that need to be considered in using the indicators in this domain for the pilot:
• Many of the quality indicators identified in the review are process indicators that reflect service delivery aspects entirely
within the control of the in-home aged care provider. This means that many of these quality indicators are not subject to
the challenges of attribution, however this could be impacted by the program design of a new In-Home Care Program.
• There are a wide range of concepts of service delivery identified in the quality indicators in the review, ranging from risk
planning, care planning through to time of service. Most quality indicators (regardless of measurement focus) did not
score highly in terms of scientific properties. Consideration needs to be given to the balance between using these quality
indicators in a pilot where there are sub-optimal scientific properties but highly amenable to supporting quality
improvement and consumer choice within an expanded in-home QI Program.
• Some quality indicators identified in the evidence review in this domain may need to be considered for the pilot in light of
different consumer populations within the in-home aged care context. For example, some quality indicators may only be
appropriate for consumers receiving higher or more frequent levels of in-home support as the problem might only occur
in a small proportion of the population served.
• Consideration is needed for the pilot as to the type of staff from the in-home aged care service who are appropriate to
collect data for these quality indicators. There is an opportunity for stakeholders to advise on the type of in-home aged
care workers who are appropriate to collect data directly from clients (for those indicators that require it).
• Quality indicators that quantify the amount of time spent in a home care episode (eg 30 minutes or less) may
inadvertently drive poorer service practice when applied to the Australian context. Definitions for optimal time amounts
for home care services in Australia to achieve quality outcomes are unavailable and without this evidence, it may be
premature to include quality indicators that define this within the pilot.

Service delivery and care plans
Development of quality indicators for in-home aged care PwC 30
• Some of the higher ranked quality indicators identified for this domain relate to health care practices (such as the quality
indicator of clients with chronic disease management plans) that are likely to be within the direct control of the health
care system rather than able to be influenced by in-home aged care services. There is an opportunity for stakeholders to
advise on which quality indicators in this domain are within the direct influence of the service.

Weight loss/malnutrition/dehydration

Weight loss/malnutrition/dehydration
Development of quality indicators for in-home aged care PwC 32
Definition of this domain
Unplanned weight loss is the result of deficiency in a person’s dietary intake relative to their needs and may be a symptom
and consequence of disease. Malnutrition is the lack of proper nutrition and can be caused by not having enough to eat, not
eating enough of the right things, or not being able to use the food and nutrition that one does eat. Dehydration occurs when
you use or lose more fluid than you take into your body, and your body does not have enough fluids to carry out its normal
functions.
Why it is important to monitor this domain
Unintended weight loss and malnutrition has been reported in up to 30 per cent of older adults11 12 and is associated with
poor health outcomes, reduced quality of life and related healthcare costs.13 14 Unplanned weight loss can be a clinical
symptom and consequence of poor health or presence of disease, and is one of the best indications of poor nutrition in the
older population.15 Unplanned weight loss and malnutrition are associated with higher mortality and morbidity, including
increased risk of falls and fracture, pressure injury development, hospitalisations, infections, poor recovery from disease or
surgery, reduced physical and mental function, and lower quality of life.16 Dehydration affects up to 30 per cent of older
people and can be associated with serious health issues and reduced quality of life. Poor health outcomes associated with
dehydration include higher risk of falls and fractures, delirium, urinary tract infections, renal failure, prolonged recovery from
illness or surgery, and mortality.17 18
While malnutrition is a geriatric syndrome, its causes are not well understood and is not just the result of age-related
changes. The presence of chronic conditions such as cancer or dementia, medication-related adverse effects (ie altered
taste or smell, anorexia, nausea, and vomiting) and polypharmacy are known to result in weight loss and malnutrition.19 20
In addition, other non-clinical factors are also known to play a role in malnutrition, including quality of meals provided, dining
environment, financial constraints, and assistance provided by staff.21
Quality indicators for this domain
A total of 7 quality indicators for this domain were identified in the evidence review and all were considered to have
sufficient information to assess against the assessment criteria with results indicated in Table 5.
The 7 quality indicators were also assessed against the prioritisation matrix with all assessed as having a high evidence
base and being of high value to the QI Program (see Figure 5) Figure 5. The performance characteristics of these prioritised
quality indicators is outlined in Table 18 in Appendix C.
11 Alibhai et al 2005 12 Banks et al 2007 13 Rasheed & Woods 2013 14 Volkert et al 2019 15 Dorner 2010 16 Volkert et al 2019 17 Wotton et al 2008 18 Miller 2015 19 Volkert et al 2019 20 Gaddey & Holder 2014 21 Volkert et al 2019

Weight loss/malnutrition/dehydration
Development of quality indicators for in-home aged care PwC 33
Table 5: Quality indicator assessment results
Unique
ID Quality indicators
Fe
as
ibil
ity
Imp
ort
an
ce
Us
ab
ilit
y
Sc
ien
tifi
c
ac
ce
pta
bil
ity
Att
rib
uti
on
Va
lue
to
th
e
QI
Pro
gra
m
3.1 Clients who experienced weight loss
3.2 Clients with unintended weight loss at follow-up
3.3 Clients with weight loss in the last 30 days
3.4 Clients who present to Emergency Department or
are hospitalised and weight loss or malnutrition
were reported
3.5 Clients with unintentional weight loss (client
reported)
3.6 Clients with dehydration
3.7 Clients with dehydration in the last 30 days
Note: Feasibility, scientific acceptability, importance, and usability assessment criteria drawn from the US NQF.
High (median scores 7-9) Moderate (median scores 4-6) Low (median scores 1-3)
Figure 5: Prioritisation of quality indicators for this domain against matrix.

Weight loss/malnutrition/dehydration
Development of quality indicators for in-home aged care PwC 34
Quality indicators pilot considerations
There are several issues that need to be considered in using the indicators in this domain for the pilot:
• Many of the quality indicators in this domain require sequential and linked assessments of individual consumers
conducted in a standardised manner. For example, any quality indicator that measure ‘weight loss’ requires two
observational points. Within a six-week pilot cycle, it may not be possible to conduct two observations in a way that is
consistent with the definitions used in the quality indicators.
• The weight loss quality indicator measures currently used in the QI Program for residential aged care could be
considered for the in-home aged care pilot. They align with some quality indicators identified in this review.
• There are several challenges associated with data collection of weight loss, malnutrition, and dehydration quality
indicators within an in-home aged care pilot. These challenges relate to ensuring consistency and accuracy of data
collection (eg which scales are used, time of day weight is measured). For many quality indicators, a point prevalence
approach is used (how many in-home aged care consumers have unplanned weight loss at a point in time). These types
of quality indicators may be possible to collect for in-home aged care on a single day or week for the pilot but only for
the consumers who receive services during the pilot period and who have a previous weight recorded. To overcome
this, the pilot could use a 'virtual' point prevalence approach. For example, all clients of the service are assessed every 6
months from admission to their service, and the prevalence is calculated from the most recent assessment (which might
be more than 6 months old). There is an opportunity for stakeholders to advise on these issues of ‘how’ to collect
information for all, or a subset of, consumers.
• Some quality indicators identified in the evidence review in this domain may need to be considered for the pilot in light of
different consumer populations within the in-home aged care context. For example, some indicators may only be
appropriate for consumers receiving services that have a direct role in nutrition and hydration (eg meal services).
• Consideration is needed for the pilot as to the type of staff from the in-home aged care service who are appropriate to
collect data for these quality indicators. There is an opportunity for stakeholders to advise the type of in-home aged care
workers who are appropriate to collect data directly from clients (for those quality indicators that require it).

Falls and major injuries

Falls and major injuries
Development of quality indicators for in-home aged care PwC 36
Definition of this domain
A fall is an event that results in a person coming to rest inadvertently on the ground or floor or other lower level. A fall
resulting in major injury is a fall that meets this definition and results in one or more serious injuries like bone fractures, joint
dislocations, or closed head injuries.
Why it is important to monitor this domain
Falls in older people are a public health priority due to their high prevalence, related injuries, increased risk of mortality and
reduced quality of life.22 23 In Australia, falls are the leading cause of hospitalised injury (41 per cent) and injury-related
deaths (37 per cent of all deaths).24 It is estimated that the total healthcare costs associated with fall-related injuries in the
older population in Australia in 2021 will be $790 million.25 A third of older people living in the community fall at least once
every year.26
While there are many factors that contribute to falls, some can be prevented. Intrinsic fall risk factors (eg mobility problems,
cognitive impairment, frailty) and extrinsic fall risk factors (eg environmental factors such as lighting or flooring, organisation
factors (eg staff)) can be targeted through interventions.27 For example, medication use is one of the most modifiable risk
factors for falls.28 Several medication classes are associated with higher risk of falls can and should be optimised in older
individuals, for example, antidepressants, antipsychotics, hypnotics and benzodiazepines.29
Fractures, especially hip fractures, are a common injury associated with a fall. Approximately a third of fall-related injuries in
community based older people result in fractures.30 In 2015-16 in Australia, 93 per cent of hip fractures were the result of a
fall-related injury, and 87 per cent of falls resulted in minimal trauma (low-impact).31 Hip fracture is associated with
decreased mobility and quality of life, admission to residential aged care, and significant higher risk of death.32 33
Approximately 25 per cent of people with a hip fracture die within one year of the fracture and over 50 per cent of people will
have some degree of functional impairment after a year.34 35
Quality indicators for this domain
A total of 14 quality indicators for this domain were identified in the evidence review and 3 were considered to have
insufficient information to assess against the assessment criteria. Eleven quality indicators were assessed against the
assessment criteria with results indicated in Table 6.
The 11 quality indicators were also assessed against the prioritisation matrix with 11 assessed as having a high evidence
base and being of high value to the QI Program (see Figure 6). The performance characteristics of these prioritised quality
indicators is outlined in Table 19 in Appendix C. Performance characteristics of non-prioritised quality indicators in this
domain are available in the evidence review assessment log and are not presented here for brevity.
22 Bergen et al 2014 23 Hartholt et al 2011 24 Australian Institute of Health and Welfare 2018 25 Moller 2010 26 Deandrea et al 2013 27 Deandrea et al 2013 28 Woolcott et al 2009 29 Woolcott et al 2009 30 Verma et al 2016 31 Australian Institute of Health and Welfare 2018 32 Bentler et al 2009 33 Pasco et al 2005 34 Bentler et al 2009 35 Pasco et al 2005

Falls and major injuries
Development of quality indicators for in-home aged care PwC 37
Table 6: Quality indicator assessment results
Unique
ID Quality indicators
Fe
as
ibil
ity
Imp
ort
an
ce
Us
ab
ilit
y
Sc
ien
tifi
c
ac
ce
pta
bil
ity
Att
rib
uti
on
Va
lue
to
th
e
QI
Pro
gra
m
4.1 Clients who fell
4.2 Clients who experienced one or more falls in the
last 90 days
4.3 Clients experiencing one or more falls requiring
medical attention
4.4 Clients with new fall-related injuries and breaks
4.5 Clients experiencing at least one fall-related
fracture
4.6 Clients with new fall-related injuries (fractures,
second- or third-degree burns, unexplained
injuries)
4.7 Patients experiencing one or more falls with major
injury
4.8 Clients who fall with trauma (last 30 days)
4.9 Clients with an incident of falling
4.10 Hip fractures among people 65 years and older
(3 year average)
4.11 Clients with fall injuries admitted to hospital among
people 80 years and older (3 year average)
Note: Feasibility, scientific acceptability, importance, and usability assessment criteria drawn from the US NQF.
High (median scores 7-9) Moderate (median scores 4-6) Low (median scores 1-3)
Figure 6: Prioritisation of quality indicators for this domain against matrix.

Falls and major injuries
Development of quality indicators for in-home aged care PwC 38
Quality indicators pilot considerations
There are several issues that need to be considered in using the indicators in this domain for the pilot:
• Some quality indicators identified in the evidence review in this domain may need to be considered for the pilot in light of
different consumer populations within the in-home aged care context. For example, some indicators may only be
appropriate for consumers receiving higher or more frequent levels of in-home support (for example the higher levels of
home care package or those receiving specific falls prevention services) as the problem might only occur in a small
proportion of the population served.
• Consideration is needed for the pilot as to the type of staff from the in-home aged care service who are appropriate to
collect data for these quality indicators. There is an opportunity for stakeholders to advise the type of in-home aged care
workers are appropriate to collect data on falls.
• Considerations are needed as to the ability of in-home aged care services to influence the quality indicators through
their own actions. Some quality indicators identified for this domain may reflect minimal opportunity for improvements if
the fall is unrelated to the episode of care (eg proportion of clients of the service who fell at any time). Adding to this
complexity is the ability of the pilot to capture if multiple in-home aged care services are provided to an individual
consumer and how, if at all, these multiple services contribute to the outcome in these quality indicators. There is an
opportunity for stakeholders to advise the quality indicators in this domain are within the direct influence of the service.
• There are several practical issues in piloting some of the quality indicators. For example, a consumer of an in-home
aged care service falls and experiences a major injury requiring hospitalisation. In this case, the consumer may spend
considerable time within hospital and be removed from the in-home aged care client listing for service. There is an
opportunity for stakeholders to advise on these practical issues.
• The falls quality indicator measures currently used in the QI Program for residential aged care could be considered for
the in-home aged care pilot. They align with many quality indicator concepts identified in this evidence review.

Pressure injuries/skin integrity

Pressure injuries/skin integrity
Development of quality indicators for in-home aged care PwC 40
Definition of domain
Pressure injuries are a localised injury to the skin and/or the underlying tissue that usually occurs over a bony prominence
that arises from pressure, friction, and shear.36
Why it is important to monitor this domain
The older population are at higher risk of developing pressure injuries, as a consequence of skin and soft-tissue changes
associated with ageing as well as other age-related impairments such as malnutrition, immobility, incontinence, impaired
cognitive status and frailty.37 Most pressure injuries occur in people over the age of 70 and when they are ill and experience
mobility issues.38 At least 4 per cent of home care recipients had a pressure injury in 2016.39 Pressure injuries are
associated with increased pain, discomfort, immobility and mortality in addition to decreased quality of life.40 41 However,
they are considered to be largely preventable and caregivers may be able to play a role in preventing them.42 43
The QI Program for residential aged care includes quality indicators for pressure injuries. The two quality indicators consider
the proportion of care recipients at the service with one or more pressure injuries, and the proportion of care recipients at
the service with one or more pressure injuries reported against each of the 6 pressure injury stages documented in the ICD-
10-Australian Modified (AM) pressure injury classification system (outlined in the Prevention and Treatment of Pressure
Ulcers/Injuries: Clinical Practice Guideline 2019).
Quality indicators for this domain
A total of 6 quality indicators for this domain were identified in the evidence review and one was considered to have
insufficient information to assess against the assessment criteria. Five quality indicators were assessed against the
assessment criteria with results indicated in Table 7.
The 5 quality indicators were also assessed against the prioritisation matrix with all assessed as having a high evidence
base and being of high value to the QI Program (see Figure 7). The performance characteristics of these prioritised quality
indicators is outlined in Table 20 in Appendix C. Of note, the current residential QI Program includes indicators for pressure
injuries (some of which are similar in concept to those that were identified in use in other jurisdictions within home care
services).
Table 7: Quality indicator assessment results
Unique
ID Quality indicators
Fe
as
ibil
ity
Imp
ort
an
ce
Usa
bil
ity
Sc
ien
tifi
c
ac
ce
pta
bil
ity
Att
rib
uti
on
Va
lue
to
th
e
QI
Pro
gra
m
5.1 Percentage of quality episodes in which the patient
has one or more Stage 2-4 pressure ulcers, or an
unstageable ulcer/injury, present at discharge that
are new or worsened since the beginning of the
quality episode
36 European Pressure Ulcer Advisory Panel and National Pressure Ulcer Advisory Panel (NPUAP) 2009 37 European Pressure Ulcer Advisory Panel and National Pressure Ulcer Advisory Panel (NPUAP) 2019 38 Edsberg et al 2014 39 Caughey et al 2021 40 Gorecki et al 2009 41 Song et al 2019 42 European Pressure Ulcer Advisory Panel and National Pressure Ulcer Advisory Panel (NPUAP) 2019 43 Rafiei et al 2021

Pressure injuries/skin integrity
Development of quality indicators for in-home aged care PwC 41
Unique
ID Quality indicators
Fe
as
ibil
ity
Imp
ort
an
ce
Us
ab
ilit
y
Sc
ien
tifi
c
ac
ce
pta
bil
ity
Att
rib
uti
on
Va
lue
to
th
e
QI
Pro
gra
m
5.2 Proportion of HCP episodes where clients had an
emergency department presentation or
hospitalisation where pressure injury was reported
5.3 Pressure ulcer or skin tear in the last 30 days
5.4 Incidence of clients with a skin ulcer
5.5 Proportion of clients with a pressure ulcer
Note: Feasibility, scientific acceptability, importance, and usability assessment criteria drawn from the US NQF.
High (median scores 7-9) Moderate (median scores 4-6) Low (median scores 1-3)
Figure 7: Prioritisation of quality indicators for this domain against matrix.
Quality indicators pilot considerations
There are several issues that need to be considered in using the indicators in this domain for the pilot:
• Some quality indicators identified in the evidence review in this domain may need to be considered for the pilot in light of
different consumer populations within the in-home aged care context. For example, some quality indicators may only be
appropriate for consumers receiving higher or more frequent levels of in-home support (for example the higher levels of
home care package or those receiving wound care or personal care services) as the problem might only occur in a small
proportion of the population served. There is an opportunity for stakeholders to advise on the appropriateness of quality
indicators in this domain for different sub-groups of in-home aged care consumers.

Pressure injuries/skin integrity
Development of quality indicators for in-home aged care PwC 42
• Consideration is needed for the pilot as to the type of staff from the in-home aged care service who are appropriate to
collect data for these quality indicators. There is an opportunity for stakeholders to advise on the type of in-home aged
care workers who are appropriate to collect data on pressure injuries. It may not be possible within the time frames of
the pilot to train non-nursing staff to accurately identify and stage pressure injuries for in-home aged care consumers.
• Considerations are needed as to the ability of in-home aged care services to influence the quality indicators through
their own actions. Quality indicators identified for this domain may reflect minimal opportunity for improvements if the
pressure injury is unrelated to the episode of care (eg for non-wound care services). There is an opportunity for
stakeholders to advise which quality indicators in this domain are within the direct influence of the service.
• The pressure injuries quality indicator measures currently used in the QI Program for residential aged care could be
considered for the in-home aged care pilot. They align with many of the quality indicator concepts identified in this
evidence review.

Workforce

Workforce
Development of quality indicators for in-home aged care PwC 44
Definition of domain
The aged care industry is diverse and is made up predominantly of small to medium enterprises spread across community,
home, and residential aged care settings44. The industry relies on a diverse workforce that is diverse as the settings and
consumers it services – from carers and personal support workers through to specialised clinicians.
Why it is important to monitor this domain
Aged care is one of Australia’s largest service industries, that in 2020 included 434,000 paid workers, with the majority (76
per cent) in direct care roles. This includes 123,048 direct care staff employed in the home care setting (home care
packages and home support services).45 Findings from the Royal Commission into Aged Care Quality and Safety have
reported Australia’s aged care system is understaffed and undertrained. Inadequate staffing levels, skill mix and appropriate
trainings are principal causes of substandard care in the current system.46 Staffing of aged care is currently not captured at
the national level but is monitored through the National Aged Care Workforce Census and Survey conducted every 4 years
by the National Institute of Labour Studies.47
Quality indicators for this domain
A total of 21 quality indicators for this domain were identified in the evidence review and 13 were considered to have
insufficient information to assess against the assessment criteria. Eight quality indicators were assessed against the
assessment criteria with results indicated in Table 8.
The 8 quality indicators were also assessed against the prioritisation matrix with all assessed as having a high evidence
base and being of high value to the QI Program (see Figure 8). The performance characteristics of these prioritised quality
indicators is outlined in Table 21 in Appendix C.
Table 8: Quality indicator assessment results
Unique
ID Quality indicators
Fe
as
ibil
ity
Imp
ort
an
ce
Usa
bil
ity
Sc
ien
tifi
c
ac
ce
pta
bil
ity
Att
rib
uti
on
Va
lue
to
th
e
QI
Pro
gra
m
6.1 Responsiveness of staff, safety living at home, and
confidence in staff
6.2 Number of home care workers providing care to an
older person
6.3 Staff helping a client in 14-day period (average)
6.4 Staff retention
6.5 Visits for each client per home care worker
6.6 Evidence of processes to ensure consistent team
of workers for each client
6.7 Evidence of supervision discussions with home
care workers (every 3 months)
44 Australian Government, 2018 45 Australian Government Department of Health 2021 46 Royal Commission into Aged Care Quality and Safety 2021 47 Australian Government Department of Health 2021

Workforce
Development of quality indicators for in-home aged care PwC 45
Unique
ID Quality indicators
Fe
as
ibil
ity
Imp
ort
an
ce
Us
ab
ilit
y
Sc
ien
tifi
c
ac
ce
pta
bil
ity
Att
rib
uti
on
Va
lue
to
th
e
QI
Pro
gra
m
6.8 Workers who had a supervision discussion (within
3 months)
Note: Feasibility, scientific acceptability, importance, and usability assessment criteria drawn from the US NQF.
High (median scores 7-9) Moderate (median scores 4-6) Low (median scores 1-3)
Figure 8: Prioritisation of quality indicators for this domain against matrix.
Quality indicators pilot considerations
There are several issues that need to be considered in using the indicators in this domain for the pilot:
• Many of the quality indicators identified in the review are process indicators that reflect aspects of service delivery
entirely within the control of the in-home aged care provider. This means that many of these quality indicators are not
subject to the challenges of attribution and limited potential for quality improvement seen in quality indicators in many of
the domains.
• There are a wide range of concepts of service delivery identified in the quality indicators in the review – ranging from
staff retention through to continuity of staff for the in-home aged care consumer. Most quality indicators (regardless of
measurement focus) did not score highly in terms of scientific properties. Consideration needs to be given to the
balance between using these quality indicators in a pilot where there are sub-optimal scientific properties, however, are
highly amenable to supporting quality improvement and consumer choice within an expanded in-home QI Program.
• The quality indicators in this domain are reflective of countries' specific environments, regulatory workforce policies, and
own practice standards. Unlike other domains, the specific quality indicators within this domain can inform the
development of quality indicators for the Australian setting that align with Australian policies, however themselves as
described in the literature may not be applicable for the pilot without tailoring.

Pain

Pain
Development of quality indicators for in-home aged care PwC 47
Definition of domain
The 2020 International Association for the Study of Pain definition of pain is “an unpleasant sensory and emotional
experience associated with, or resembling that associated with, actual or potential tissue damage.”48
Why it is important to monitor this domain
Pain is a common, debilitating, and at times a treatable, symptom of a series of illnesses that affect older adults.49
Musculoskeletal conditions, like arthritis and back pain, are some of the most common afflictions in older adults and these
are associated with an increased risk of chronic pain. In Australia, it is estimated that 15-20 per cent of the general
population have chronic pain.50 Pain affects a significant and increasing portion of older adults, including those accessing
aged care services, with 16 per cent of those having aged care eligibility assessments reporting pain as one of top 10
conditions affecting their need for assistance with activities of daily living and social participation.51 52 53
Pain affects people’s functional capabilities, activities of daily living, quality of life, and overall disability.54 55 In a geriatric,
frail person, or person with dementia, the effect of pain may be even more pronounced and cause more serious
complications.56 57 58 59 Pharmacological management of pain is common in older people, but older people are also more
susceptible to the potential complications and side effects associated with pain medications, such as non-steroidal anti-
inflammatory drugs (NSAIDs) and opioids. Adverse events include functional impairment, falls, respiratory depression,
constipation, dependency from opioids60 as well as associated renal, gastrointestinal, and cardiovascular effects from
NSAIDs.61
Quality indicators for this domain
A total of 10 quality indicators for this domain were identified in the evidence review and one was considered to have
insufficient information to assess against the assessment criteria. Nine quality indicators were assessed against the
assessment criteria with results indicated in Table 9.
The 9 quality indicators were also assessed against the prioritisation matrix with all assessed as having a high evidence
base and being of high value to the QI Program (see Figure 9). The performance characteristics of these prioritised quality
indicators is outlined in Table 22 in Appendix C.
48 Srinivasa et al,2020 49 Abdulla A et al 2013
50 Blyth FM et al 2001
51 Reid et al 2015
52 Abdulla et al 2018
53 Inacio et al 2020
54 Abdulla et al 2018
55 Inacio et al 2020
56 Reid et al 2015
57 Barber & Gibson 2009
58 Patel et al 2013
59 Corbett et al 2012
60 Roxburgh et al, 2011. 61 Risser et al, 2009 and Caughey et al, 2011.

Pain
Development of quality indicators for in-home aged care PwC 48
Table 9: Quality indicator assessment results
Unique
ID Quality indicators
Fe
as
ibil
ity
Imp
ort
an
ce
Us
ab
ilit
y
Sc
ien
tifi
c
ac
ce
pta
bil
ity
Att
rib
uti
on
Va
lue
to
th
e
QI
Pro
gra
m
7.1 Clients who complained or showed evidence of
daily pain
7.2 Clients with pain (on pain medication or no pain
medication)
7.3 Clients who have pain and are receiving
inadequate pain control or no pain medication
7.4 Clients with at least daily episodes of severe pain
at follow up
7.5 Clients with daily pain (over 3 days)
7.6 Clients with inadequate pain control
7.7 Clients with a reduction in pain
7.8 Clients whose pain improved
7.9 Clients with daily severe pain
Note: Feasibility, scientific acceptability, importance, and usability assessment criteria drawn from the US NQF.
High (median scores 7-9) Moderate (median scores 4-6) Low (median scores 1-3)
Figure 9: Prioritisation of quality indicators for this domain against matrix.

Pain
Development of quality indicators for in-home aged care PwC 49
Quality indicators pilot considerations
There are several issues that need to be considered in using the indicators in this domain for the pilot:
• Varied definitions and measurement tools for pain are used and advice is sought on the most useful for the Australian
context.
• Several quality indicators focus on similar concepts in pain but measure either improvement or decline in pain. There is
an opportunity for stakeholders to advise on whether there is a preference to measure improvement or decline in pain.
• Many of the quality indicators in this domain require sequential and linked assessments of individual consumers
conducted in a standardised manner. For example, any quality indicator that measure ‘improvement’ or ‘decline’
requires two observational points. Within a six-week pilot cycle, it may not be possible to conduct two observations in a
way that is consistent with the definitions used in the quality indicators. For quality indicators that measure incidence of
daily or weekly pain, this consideration would not apply.
• Considerations are needed as to the ability of in-home aged care services to influence the quality indicators through
their own actions. Some quality indicators identified for this domain may reflect minimal opportunity for the service
provider to directly manage pain of the consumer and outcomes may be attributable to health care management by
clinicians providing care in the community.
• There is an opportunity for stakeholders to advise on specific quality indicators in terms of the time frame in which
measurement of pain should be made. Some quality indicators define this (eg daily or within the last 7 days), yet others
do not have a defined time period specified in public documentation.

Continence

Continence
Development of quality indicators for in-home aged care PwC 51
Overview of domain
Continence is the ability to control one’s bladder and bowel elimination and incontinence is the involuntary loss of bladder
and bowel control. It can be considered a part of activities of daily living (ADLs). Incontinence is not a physiological part of
the ageing process. Age-related changes together with frailty, cognitive decline, or impaired mobility, can put older adults at
risk of incontinence.62 63 Incontinence is known to increases the risk of poor health outcomes, such as falls, fractures,
hospitalisations, mortality, poor quality of life, functional impairment, and deterioration in mental health.64 65 66 67 68
There is limited Australian data on incontinence prevalence, but some suggest that 12-13 per cent of people suffer from
faecal incontinence and 37-63 per cent of women and 8-22 per cent of men over 80 suffer from urinary incontinence.69 70
Incontinence also significantly affects individual’s caregivers, who are at higher risk of having a lower reported wellbeing,
greater worry and depression, and general weariness and lack of energy whilst caring for someone with incontinence.71
Quality indicators for this domain
A total of 10 quality indicators for this domain were identified in the evidence review and one was considered to have
insufficient information to assess against the assessment criteria. Nine quality indicators were assessed against the
assessment criteria with results indicated in Table 10.
The 9 quality indicators were also assessed against the prioritisation matrix with all assessed as having a high evidence
base and being of high value to the QI Program (see Figure 10). The performance characteristics of these prioritised quality
indicators is outlined in Table 23 in Appendix C.
Table 10: Quality indicator assessment results
Unique
ID Quality indicators
Fe
as
ibil
ity
Imp
ort
an
ce
Usa
bil
ity
Sc
ien
tifi
c
ac
ce
pta
bil
ity
Att
rib
uti
on
Va
lue
to
th
e
QI
Pro
gra
m
8.1 Clients who had difficulty controlling urination
8.2 Clients who experience a decline in bladder
continence
8.3 Clients who experience a decline in bladder
continence (incidence)
8.4 Clients who experience an improvement in bladder
continence
8.5 Patients with improvement in bowel control
8.6 Patients with bladder or bowel problem in last 30
days
62 Lim 2016 63 Guinane & Crone 2018 64 Lim 2016 65 Nakanishi et al 1999 66 Chiarelli et al 2009 67 Chiarelli 2011 68 Xu et al 2019 69 Australian Institution of Health and Welfare 2013 70 Guinane & Crone 2017 71 Australian Institution of Health and Welfare 2013

Continence
Development of quality indicators for in-home aged care PwC 52
Unique
ID Quality indicators
Fe
as
ibil
ity
Imp
ort
an
ce
Us
ab
ilit
y
Sc
ien
tifi
c
ac
ce
pta
bil
ity
Att
rib
uti
on
Va
lue
to
th
e
QI
Pro
gra
m
8.7 Clients diagnosed with incontinence by doctor or
specialised nurse
8.8 Clients with a catheter
8.9 Clients with obstipation (incidence)
Note: Feasibility, scientific acceptability, importance, and usability assessment criteria drawn from the US NQF.
High (median scores 7-9) Moderate (median scores 4-6) Low (median scores 1-3)
Figure 10: Prioritisation of quality indicators for this domain against matrix.
Quality indicators pilot considerations
There are several considerations for the piloting of these quality indicators:
• Continence related quality indicators may need to be considered for the pilot in light of different consumer populations
within the in-home aged care context. For example, some quality indicators may only be appropriate for consumers
receiving higher or more frequent levels of in-home support (for example the higher levels of home care packages) as
the problem might only occur in a small proportion of the population served.
• Several quality indicators focus on similar concepts in continence but measure either improvement or decline in
continence. There is an opportunity for stakeholders to advise on weather quality indicators should measure decline or
improvement and which is more useful for the quality improvement objective of the QI Program.
• Many of the quality indicators in this domain require sequential and linked assessments of individual consumers
conducted in a standardised manner. For example, any quality indicator that measure ‘improvement’ or ‘decline’
requires two observational points. Within a six-week pilot cycle, it may not be possible to conduct two observations in a
way that is consistent with the definitions used in the quality indicators.

Continence
Development of quality indicators for in-home aged care PwC 53
• The quality indicators identified for this domain cover a range of concepts associated with continence. It is necessary to
determine whether quality indicators should reflect multiple aspects of continence (bladder and bowel) or only one
aspect (bladder or bowel).
• There is an opportunity for stakeholders to advise on the ability of in-home aged care services to influence the quality
indicators through their own actions. Many quality indicators identified for this domain may reflect minimal opportunity for
the service provider to directly influence the incidence of incontinence for consumers. Quality indicators relating to the
effective management of incontinence were unable to be identified in the evidence review.

Development of quality indicators for in-home aged care PwC 54
Hospitalisations

Hospitalisations
Development of quality indicators for in-home aged care PwC 55
Definition of domain
Hospitalisations are admissions to hospitals to receive treatment, which can be planned (ie elective) or unplanned.
Emergency department care is also provided in many hospitals, and this includes urgent care provision that may or may not
result in hospital admissions.
Why it is important to monitor this domain
In 2016, 38 per cent of Australians receiving home care packages experienced an unplanned hospitalisation, 44 per cent
experienced an emergency department (ED) presentation, and 11 per cent a potentially preventable hospitalisation.72 Many
hospitalisations are considered potentially preventable with preventative health interventions, early disease management, or
potential better access to certain care.73
Unintended consequences of hospitalisations in older people include increased cognitive and functional decline, falls,
disability, fractures, and other serious health events, which are often exacerbated in the presence of dementia and cognitive
decline in older people.74 75 76 77 On the other hand, many hospitalisations of older people are necessary for their health
and wellbeing, including treatment of major health conditions and injuries that are unavoidable among frail older people.
Quality indicators for this domain
A total of 14 quality indicators for this domain were identified in the evidence review and one was considered to have
insufficient information to assess against the assessment criteria. Thirteen quality indicators were assessed against the
assessment criteria with results indicated in Table 11.
The 13 quality indicators were also assessed against the prioritisation matrix with 13 assessed as having a high evidence
base and being of high value to the QI Program (see Figure 11). The performance characteristics of this prioritised quality
indicators is outlined in Table 23 in Appendix C.
Table 11: Quality indicator assessment results
Unique
ID Quality indicators
Fe
as
ibil
ity
Imp
ort
an
ce
Usa
bil
ity
Sc
ien
tifi
c
ac
ce
pta
bil
ity
Att
rib
uti
on
Va
lue
to
th
e
QI
Pro
gra
m
9.1 Emergency Department presentation within 30
days of discharge from hospital
9.2 Emergency Department visits by new home care
clients in 30 days after leaving hospital
9.3 Patients who had a potentially preventable 30 day
post-discharge readmission
9.4 Clients who require hospital stay or Emergency
Department care
9.5 Hospitalisation or Emergency Department use in
the 90-day period before follow-up assessment
72 MC I 2021 73 Australian Government Australian Institute of Health and Welfare 2019 74 Fogg et al 2018 75 Pedone et al 2005 76 Loyd et al 2020 77 Wolinsky et al 2009

Hospitalisations
Development of quality indicators for in-home aged care PwC 56
Unique
ID Quality indicators
Fe
as
ibil
ity
Imp
ort
an
ce
Us
ab
ilit
y
Sc
ien
tifi
c
ac
ce
pta
bil
ity
Att
rib
uti
on
Va
lue
to
th
e
QI
Pro
gra
m
9.6 Readmissions for new home care clients 30 days
after leaving hospital
9.7 Acute care hospitalisation during first 60 days of
home health stay
9.8 Hospital admission in 30 days between surveys
9.9 Emergency Department presentation or
hospitalisation for medication-related events
9.10 Patients discharged to community with no
unplanned acute hospital or long-term care
facilities in 31 days after discharge
9.11 Clients who require hospitalisation, emergency
department presentation or emergent care
9.12 Emergency Department presentation for clients
with dementia or clients hospitalised for delirium or
dementia
9.13 Emergency Department use without hospitalisation
during the first 60 days of home health stay
Note: Feasibility, scientific acceptability, importance, and usability assessment criteria drawn from the US NQF.
High (median scores 7-9) Moderate (median scores 4-6) Low (median scores 1-3)
Figure 11: Prioritisation of quality indicators for this domain against matrix

Hospitalisations
Development of quality indicators for in-home aged care PwC 57
Quality indicators pilot considerations
There are several considerations for the piloting of these quality indicators:
• Most quality indicators identified in the evidence review use non-provider level data regarding hospital admissions. The
pilot is intending to collect primary data regarding quality indicators directly from in-home aged care services which may
be inconsistent with the use of these quality indicators.
• Quality indicators identified for this domain vary in relation to aspects of measurement such as Emergency Department
or hospitalisation events. There is an opportunity for stakeholders to advise on which aspects of the domain are
important to take to pilot. Several quality indicators ranked highly in the evidence review, focus on general
hospitalisation and ED presentations which are generic measures of service utilisation and may be difficult to inform
targeted quality improvement efforts for services.
• There is an opportunity for stakeholders to advise on the ability of in-home aged care services to influence the quality
indicators through their own actions. Many quality indicators identified for this domain may reflect minimal opportunity for
improvements depending on the health profile of the in-home aged care consumer population being serviced by the in-
home aged care service provider. For example, these quality indicators may not be appropriate to apply to in-home
aged care services that relate to house maintenance, gardening or domestic services but may relate to personal care
and nursing in-home aged care services.
• Some quality indicators (for example readmission within 30 days) may more appropriately reflect the adequacy of post-
acute care (and many other influencing factors) rather than actions of the in-home aged care service. There is an
opportunity for stakeholders to advise on which quality indicators in this domain are considered to be within the direct
influence of the service.

Depression

Depression
Development of quality indicators for in-home aged care PwC 59
Definition of domain
Depression is a common and serious mood disorder that can affect all aspects of an individuals’ life. Individuals who suffer
depression may experience persistent feeling of sadness and hopelessness and lose interest in activities they normally
would enjoy. Not all depression is formally ‘diagnosed’ by a health practitioner.
Why it is important to monitor this domain
The prevalence of depressive disorders later in life is between 5-37 per cent.78 While depression prevalence estimates for
older Australians receiving home care services specifically are unknown, at least 36 per cent of older Australians received
pharmacological treatment for depression in 2015.79 Depression is associated with higher mortality, morbidity, lower quality
of life,80 and as well as potential exacerbation of physical illnesses and dementia.81 Depression and depressive symptoms
can be managed, improved or resolved through behavioural or pharmacological therapies, and these are often sought from
general practitioners.82 83 Pharmacological treatment in older adults can often complicate already complex comorbidity
management, associated polypharmacy and cause subsequent drug interactions.84
According to the Australian Aged Care Quality Standards (Standard 3, requirement 3(d)),85 aged care providers are
expected to detect and provide support to address changes and deterioration of ‘mental, cognitive or physical function,
capacity or condition’ of their consumers.
Quality indicators for this domain
A total of 4 quality indicators for this domain were identified in the evidence review and all were considered to have
sufficient information to assess against the assessment criteria with results indicated in Table 12.
The 4 quality indicators assessed against the prioritisation matrix were all assessed as having a high evidence base and
being of high value to the QI Program (see Figure 12). The performance characteristics of this indicators is outlined in Table
24 in Appendix C.
Table 12: Quality indicator assessment results
Unique
ID Quality indicators
Fe
as
ibil
ity
Imp
ort
an
ce
Usa
bil
ity
Sc
ien
tifi
c
ac
ce
pta
bil
ity
Att
rib
uti
on
Va
lue
to
th
e
QI
Pro
gra
m
10.1 Clients whose mood declined
10.2 Clients with fewer depressive symptoms
10.3 Clients with more depressive symptoms
10.4 Clients suffering from depression
Note: Feasibility, scientific acceptability, importance, and usability assessment criteria drawn from the US NQF.
High (median scores 7-9) Moderate (median scores 4-6) Low (median scores 1-3)
78 Luppa et al 2012 79 Inacio et al 2021 80 Alexopoulos 2005 81 Kok & Reynolds 2017 82 Alexopoulos 2005 83 Kok & Reynolds 2017 84 Kok & Reynolds 2017 85 Australian Government Aged Care Quality and Safety Commission 2021

Depression
Development of quality indicators for in-home aged care PwC 60
Figure 12: Prioritisation of quality indicators for this domain against matrix.
Quality indicators pilot considerations
There are several considerations for the piloting of these quality indicators:
• Varied definitions for depression, mood or depressive systems are used and advice is sought on the most suitable
definition for the Australian context.
• Quality indicators focus on similar concepts in depression but measure either improvement (fewer) or decline (more) in
depression, mood, or depressive symptoms. There is an opportunity for stakeholders to advise on whether there is a
preference to measure improvement, decline or both in depression, mood or depressive symptoms.
• Many of the quality indicators in this domain require sequential and linked assessments of individual consumers
conducted in a standardised manner. For example, any quality indicator that measure ‘improvement’ or ‘decline’
requires two observational points. Within a six-week pilot cycle, it may not be possible to conduct two observations in a
way that is consistent with the definitions used in the quality indicators.
• There is an opportunity for stakeholders to advise on the type of staff from the in-home aged care service who are
appropriate to collect data for these quality indicators. Stakeholders may be able to advise on the type of in-home aged
care workers who are appropriate to collect data on depression. It may not be possible within the time frames of the pilot
to train non-nursing staff to accurately identify and measure depressive symptoms for in-home aged care consumers.
• Many of the quality indicators in this domain require the use of validated or standardised tools to assess depression.
Licenses to use these tools may need to be obtained before these can be used in the pilot (eg interRAI derived
indicators). There is an opportunity for stakeholders to advise on tools currently used in practice that would be fit for
purpose as the data collection tool for depression for in-home aged care.

Carer distress

Carer distress
Development of quality indicators for in-home aged care PwC 62
Definition of domain
A carer is a person who provides support and care to another person. In the aged care context, a carer is often the person
who is a family, friend or other non-paid person providing care and support to the older person living in the community.
Carers are an important part of the Australian aged care system.
Why it is important to monitor this domain
In 2018 10 per cent of Australians reported being a carer for someone with either a disability or factors associated with
ageing86. A third (33 per cent) of these carers were the primary care giver, which means being responsible for core
activities of daily living for someone. Being a caregiver has well documented detrimental effects on the carer’s own health
and wellbeing, including poor emotional wellbeing, high levels of distress, sleep disturbances, depression, and challenges
with social isolation and loneliness87. Support for carers exists nationally but varies regarding reach, coverage, and
accessibility. However, this support, some of which is offered through the Commonwealth Home and Support Services (eg
respite care), lacks evidence supporting the impact on carer’s wellbeing despite reported satisfaction by carers that use
such programs88.
Domain ranking
This quality of care domain was ranked relatively low in the list of 19 domains identified in this review. This domain was
assessed as low on the ability of the service to influence. It was assessed as having one or more evidence based quality
indicator, international agreement on the definition and measurement of quality indicators in this domain, the importance of
this domain for quality aged care. See Table 2 for ranking and assessment against domain criteria. Given the low ranking
when assessed on these domains, the 4 indicators identified that related to carer distress did not progress to a full
assessment against the quality indicator criteria and are not recommended for consideration in the pilot.
Quality indicators identified for this domain (in alphabetical order)
• clients whose primary informal caregiver experienced distress, anger, or depression in relation to their caregiving role or
were unable to continue (over the last year)
• clients whose unpaid caregivers experience distress (over the last year)
• clients with caregivers who express distress, anger and or depression at baseline and follow-up (over 6-month period)
• clients with informal caregivers who report distress.
The performance characteristics of these indicators are outlined in Table 25 in Appendix C.
86 Australian Government, 2021. 87 Social Policy Research Center, 2019. 88 Social Policy Research Center, 2019.

Medication Related

Medication Related
Development of quality indicators for in-home aged care PwC 64
Definition of domain
Medications are some of the most common medical interventions and in 2019 Australia declared medicine safety its tenth
national health priority area89. Problems with medications were the most frequent reason for complaints to the Aged Care
Quality and Safety Commission90 and the focus of one third of all online submissions to the Royal Commission into Aged
Care Quality and Safety91.
Why it is important to monitor this domain
With the increasing prevalence of multimorbidity (multiple chronic conditions) and associated polypharmacy (use of multiple
medications) in the growing older population, older people’s medication related needs have become increasingly complex92.
This complex medication use is associated with an increased risk of adverse events and poor health outcomes. The
evidence indicates a clear need to systematically, and routinely, monitor and assess medication-related quality of care.
Domain ranking
This quality of care domain was ranked relatively low in the list of 19 domains identified in this review. This domain was
assessed as low on the ability of the service to influence. It was assessed as having one or more evidence based quality
indicator, international agreement on the definition and measurement of quality indicators in this domain, the importance of
this domain for quality aged care. See Table 2 for ranking and assessment against domain criteria. Refer to Table 2 for
ranking and assessment against domain criteria. Given the low ranking when assessed on these domains, the quality
indicators identified that related to medication did not progress to a full assessment against the quality indicator criteria and
are not recommended for consideration in the pilot.
Quality indicators identified for this domain (in alphabetical order)
• clients or carers who are instructed on how to monitor the effectiveness of drug therapy, how to recognise potential
adverse effects, and how and when to report problems
• clients who are chronic opioid users (for at least 90 days)
• clients who had at least one potential period of high sedative load (SL≥3) medication use (in a 91-day period)
• clients who have a drug regimen review conducted at the start or resumption of care with follow-up completed for
identified issues
• clients who have been treated with an antipsychotic drug
• clients who have received a home medication review
• clients who improve in their ability to take their medications correctly (by mouth)
• clients who improve or stay the same in their ability to take their medications correctly (by mouth)
• clients who were dispensed at least one antibiotic for systemic use
• clients who were dispensed at least one antipsychotic medication
• clients with 10 or more medications
• clients with at least one of 4 indicators of inappropriate drug use
• clients with inconsistent drug intake
• clients with 3 or more psychoactive drugs concurrently.
The performance characteristics of these quality indicators are outlined in Table 26 in Appendix C.
89 ACQSHC, 2020 90 ACQSC 2020. 91 Australian Government Department of Health. 2012. 92 Inacio et al 2021.

Development of quality indicators for in-home aged care PwC 65
Wait times/system access

Wait times/system access
Development of quality indicators for in-home aged care PwC 66
Definition of domain
Wait times are the amount of time that individuals usually have to wait between being assessed (or approved) for a service
and actually receiving the service.
Why it is important to monitor this domain
Waiting periods for services are often used as quality indicators of system level stress, unmet needs, and access barriers93.
Particularly within aged care, a shorter time between an aged care eligibility assessment (or application in other countries),
service approvals, and entering care is preferred and long waiting times can indicate unmet needy.
Domain ranking
This quality of care domain was ranked relatively low in the list of 19 domains identified in this review. This domain was
assessed as low on the ability of the service to influence and international agreement on the definition and measurement of
quality indicators in this domain. It was assessed as having one or more evidence based quality indicators and important for
quality aged care. See Table 2 for ranking and assessment against domain criteria. Given the low ranking when assessed
on these domains, the 7 quality indicators identified that related to waiting times did not progress to a full assessment
against the quality indicator criteria and are not recommended for consideration in the pilot.
Quality indicators identified for this domain (in alphabetical order)
• clients who waited 5 days or less from date of authorisation for personal support services
• clients who waited 5 days or less from date of authorisation for nursing services
• clients whose care started or resumed on the physician-ordered date (if provided), or otherwise within 2 days of the
referral date or inpatient discharge date, whichever is later
• median number of days clients waited for home care services
• median number of days clients waited for services following Aged Care Assessment Program assessment approval
• median number of days clients waited for services from the date that the initial referral was received
• number of days clients waited for services from the date of application.
The performance characteristics of this indicators is outlined in Table 27 in Appendix C.
93 McIntyre & Chow, 2020.

Behavioural symptoms

Behavioural symptoms
Development of quality indicators for in-home aged care PwC 68
Definition of this domain
Behaviour and personality changes are often part of the progression of dementia. These symptoms often include
moodiness, anxiety, apathy, agitation, irritability sleeping problems, wandering, and confusion.
Why it is important to monitor this domain
Dementia is often associated with behavioural and psychosocial symptoms of dementia (BPSD)94. BPSD can be associated
with poor staff training and availability as well as individual’s pain, depression, and cognitive impairment95. These symptoms
are often managed with pharmacological treatment and contribute to the over-reliance on antipsychotics in in-home aged
care, despite recommendations that first line of treatment be non-pharmacological96. Most interventions for BPSD have low
to very low evidence.
Domain ranking
This quality of care domain was ranked relatively low in the list of 19 domains identified in this review. This domain was
assessed as low on the ability of the service to influence. It was assessed as having one or more evidence based quality
indicators, international agreement on the definition and measurement of indicators in this domain and important for quality
aged care. Refer to Table 2 for ranking and assessment against domain criteria. Given the low ranking when assessed on
these domains, the indicators identified that related to behavioural symptoms did not progress to a full assessment against
the quality indicator criteria and are not recommended for consideration in the pilot.
Quality indicators identified for this domain (in alphabetical order)
• clients who improve in their frequency of experiencing confusion
• clients whose communication ability declined (problems understanding, or being understood by, other people)
• clients with a score of less than 8 on the communication scale (problems understanding others or making themselves
understood) who experience a decline (over 6 months)
• clients with delirium
• clients with some difficulty on the communication scale (problems understanding others or making themselves
understood) who experience an improvement (over 6 months).
The performance characteristics of these quality indicators are outlined in Table 28 in Appendix C.
94 AIHW, 2020. 95 Laver et al, 2016. And Nazir et al, 2011. 96 Laver et al, 2016 and Westaway et al, 2020.

Infection (including antibiotics and vaccinations)

Infection (including antibiotics and vaccinations)
Development of quality indicators for in-home aged care PwC 70
Definition of domain
Infections are a significant cause of mortality and morbidity in older people, who often may not have the typical symptoms of
infections (eg fever, respiratory symptoms). This lack of typical symptoms makes early detection of these conditions
challenging. Vaccines are effective ways to protect people against infections caused by bacteria and viruses. These
biological substances are given to people to stimulative the body’s immune response against disease.
Why it is important to monitor this domain
Older people are at high risk of infection and sepsis, partially due to age-related factors such as pathological changes to
the immune system, malnutrition, incontinence, functional disability, impaired cognitive status, and presence of chronic
diseases97. Minimisation of infection-related risks throughout infection control (including offer and monitor vaccinations)
and appropriate antibiotics use are both requirements of the Australian Aged Care Quality Standards (Standard 3,
requirement 3(g))98.
Domain ranking
This quality of care domain was ranked relatively low in the list of 19 domains identified in this review. This domain was
assessed as low on the ability of the service to influence and importance. It was assessed as having one or more evidence
based quality indicators and international agreement on the definition and measurement of quality indicators in this domain.
See Table 2 for ranking and assessment against domain criteria. Given the low ranking when assessed on these domains,
the quality indicators identified that related to infection control did not progress to a full assessment against the quality
indicator criteria and are not recommended for consideration in the pilot.
Quality indicators identified for this domain (in alphabetical order)
• clients who are offered and decline the influenza vaccination for the current flu season
• clients who did not receive the influenza vaccination (incidence)
• clients who did not receive the influenza vaccination (prevalence)
• clients who received the influenza vaccination for the current flu season
• clients who were did not receive the current influenza immunization due to medical contraindication
• clients with a respiratory infection (in the last 30 days)
• clients with a urinary tract infection (in the last 30 days)
• clients with a urinary tract infection (incidence).
The performance characteristics of these quality indicators are outlined in Table 29 in Appendix C.
97 Van Buul et al, 2012. 98 Australian Government, ACQSC.

Cognition

Cognition
Development of quality indicators for in-home aged care PwC 72
Definition of domain
Cognitive impairment usually refers to an individual having memory and thinking problems, learning new things, or
concentrating.
Why it is important to monitor this domain
Cognitive impairment can be related to several aetiologies, is estimated to be present in 10-20 per cent of older adults. This
is usually a precursor to dementia, which affects over 50 per cent of residents of aged care services and 20 per cent of
home care package recipients99. Monitoring cognitive decline may lead to opportunities to delay and improve the cognitive
declines100. However, there is no strong evidence to support a single intervention to prevent decline and dementia, which
likely requires a multifaced approach along the life course101.
According to the Australian Aged Care Quality Standards (Standard 3, requirement 3(d)),102 aged care providers are
expected to detect and provide support to address changes and deterioration of ‘mental, cognitive, or physical function,
capacity or condition of the consumers. There is controversy within the psychogeriatric field about the tools used to
measure quality indicators in this domain and consensus for measures is required103.
Domain ranking
This quality of care domain was ranked low in the list of 19 domains identified in this review. This domain ranked high on the
assessment of the existing of one or more evidence based quality indicators and international agreement on the definition
and measurement of quality indicators in this domain. It was assessed less well in relation to the importance of this domain
for quality aged care and the ability of the service to influence. Refer to Table 2 for ranking and assessment against domain
criteria. Given the low ranking when assessed on these domains, the 5 quality indicators identified that related to cognition
did not progress to a full assessment against the quality indicator criteria and are not recommended for consideration in the
pilot.
Quality indicators identified for this domain (in alphabetical order)
• clients with a score of less than 6 on the Cognitive Performance Scale at baseline who experience a further decline
(over 6 months)
• clients with cognitive disorders (over the last 30 days)
• clients with cognitive impairment
• clients with some baseline cognitive impairment on the Cognitive Performance Scale who experience an improvement
(over 6 months)
• percentage of clients whose cognitive ability declined (assessed on the Cognitive Performance Scale).
The performance characteristics of these quality indicators are outlined in Table 30 in Appendix C.
99 Langa and Levine, 2014, and Inacio et al, 2021. 100 Petersen et al, 2018. 101 Livingston et al, 2020. 102 Australian Government, 2020 103 Hirdes et al, 2019.

Palliative care

Palliative care
Development of quality indicators for in-home aged care PwC 74
Definition of domain
Palliative care is care that is provided for individuals with life limiting illnesses.
Why it is important to monitor this domain
Person-centred care at the end of life can improve individuals’ quality of life104. Preparing, using, and maintaining advance
care directives in aged care particularly for individuals with dementia, is one of the Australian National Palliative Care
Strategies priorities under the goal of investment in a skilled workforce and system to deliver palliative care.
The Australian Aged Care Quality Standards have two requirements that refer to palliative care/end of life care. The first is
regarding advance care planning and end of life planning assessment (Standard 2.3(b)) and the second refers to ensuring
the needs and preferences of individuals are acknowledged and comfort and dignity preserved (Standard 3.3(c)).105
Domain ranking
This quality of care domain was ranked low in the list of 19 domains identified in this review. This domain ranked lower on
the assessment of the existing of one or more evidence based quality indicators and international agreement on the
definition and measurement of quality indicators in this domain. It was assessed well in relation to the importance of this
domain for quality aged care and the ability of the service to influence. Refer to Table 2 for ranking and assessment against
domain criteria. Given the low ranking when assessed on these domains, the quality indicators identified that related to
palliative care did not progress to a full assessment against the quality indicator criteria and are not recommended for
consideration in the pilot.
Quality indicators identified for this domain (in alphabetical order)
• clients who had an assessment of pain in the 7 days before death
• clients who had an unplanned visit to the Emergency Department in the 30 days before death
• clients who lived in the community and received at least one home care service in the 30 days before death
• involvement of family in guiding palliative care programs
• mastery of palliative care skills.
The performance characteristics of these quality indicators are outlined in Table 31 in Appendix C.
104 Australian Government, 2018. 105 Australian Government, 2020.

Other clinical

Other clinical
Development of quality indicators for in-home aged care PwC 76
Definition of domain
Clinical care is health care that includes the prevention, treatment and management of illness or injury, as well as the
maintenance of psychosocial, mental, and physical well-being. It includes care provided by doctors, nurses, pharmacists,
allied health professionals and other regulated health practitioners. Organisations providing clinical care are expected to
make sure it is best practice, meets the consumer’s needs, and optimises the consumer’s health and well-being106.
Why it is important to monitor this domain
Older people receiving in-home aged care services commonly have multiple chronic conditions (multimorbidity), with
significant clinical care needs107. Provision of home care services aims to facilitate the ongoing care, management of
symptoms and monitoring of these conditions. For example, dyspnoea interfering with activity levels, is an important health
status indicator, impacting on quality of life and ability to conduct a range of daily activities108. In the United States 70 per
cent of patients who receive home care services have some dyspnoea interfering with activities, which can be a risk factor
for hospitalisation109.
Domain ranking
This quality of care domain was ranked low in the list of 19 domains identified in this review. This domain ranked low on the
assessment of the existing of one or more evidence based quality indicators, international agreement on the definition and
measurement of quality indicators in this domain, the importance of this domain for quality aged care and the ability of the
service to influence. See Table 2 for ranking and assessment against domain criteria. Given the low ranking when assessed
on these domains, the indicators identified that related to other clinical issues did not progress to a full assessment against
the quality indicator criteria and are not recommended for consideration in the pilot.
Quality indicators identified for this domain (in alphabetical order)
• cases of unplanned extubation (incidence)
• clients who have mouth problems
• clients who improve in dyspnoea
• clients with new or reoccurring pre-existing disease (in the last 30 days)
• clients with poor dyspnea control (in the last 30 days)
The performance characteristics of these quality indicators are outlined in Table 32 in Appendix C.
106 Australian Government, 2021. 107 Inacio et al, 2021. 108 Centre for Medicare and Medicade Services. 2020. 109 Centre for Medicare and Medicade Services. 2020 and Fortinsky et al, 2021.

Mortality

Mortality
Development of quality indicators for in-home aged care PwC 78
Definition of domain
Mortality is the number of deaths within a given population.
Why it is important to monitor this domain
Mortality rates can be used as an indicator of overall population health and quality of health care systems. The identification
of deaths that are likely premature and potentially preventable for older people in aged care may provide a sensitive marker
of suboptimal care.
Strategies to prevent these potentially avoidable deaths together with a national policy framework and regulatory body to
reduce harm in aged care has since been advocated for.
Domain ranking
This quality of care domain was ranked last in the list of 19 domains identified in this review. This domain ranked low on the
assessment of the existing of one or more evidence based quality indicators, international agreement on the definition and
measurement of quality indicators in this domain, the importance of this domain for quality aged care and the ability of the
service to influence. See Table 2 for ranking and assessment against domain criteria. Given the low ranking when assessed
on these domains, the one quality indicator identified that related to mortality did not progress to a full assessment against
the quality indicator criteria and are not recommended for consideration in the pilot.
Quality indicators identified for this domain (in alphabetical order)
• clients who had a premature death.
The performance characteristics of this indicator are outlined in Table 33 in Appendix C.

Summary and discussion

Summary and discussion
Development of quality indicators for in-home aged care PwC 80
Summary and discussion
The objective of this evidence review is to identify, assess and present the evidence base for quality of care domains and
quality indicators suitable for application to in-home aged care. This evidence will inform the domains and quality indicators
to take to consultation with stakeholders prior to the selection of quality indicators for pilot.
The evidence review identified 19 domains of quality of care and 230 quality indicators used for in-home aged care across
several countries. Each domain was assessed and ranked in terms of:
• the importance to monitor for quality
• the domain had at least one evidence based indicator
• there is international agreement that the domain is important
• the in-home aged care service can influence care and experiences in the domain.
As outlined previously, the evidence review and application of the analytic framework resulted in the top 10 domains, with
175 quality indicators assessed and ranked against 6 criteria, and then prioritised based on the assessment of the evidence
base and value to the QI Program. Key considerations that may impact the quality indicators chosen to take to pilot have
been identified, including:
• selecting domains and quality indicators for pilot that support the quality improvement objective of the QI Program
• selecting domains and quality indicators for pilot that support the consumer information objective of the QI Program
• use of quality indicators that are subject to copyright and licencing arrangements
• use of quality indicators that require multiple observations within a six-week pilot
• the feasibility of data collection directly from in-home aged care services for some quality indicators
• accounting for different consumer populations and types of services in the pilot
• the preference for quality indicators that focus on improvement or decline
• the use of validated or standardised tools for measurement.
Each of these considerations for pilot is outlined in more detail below.
Selecting domains and quality indicators for pilot that support the quality improvement objective of the
QI Program
This project aims to identify a set of domains and quality indicators to pilot within the in-home aged care setting in Australia.
The overall objectives of the QI Program are to:
• provide older people with more information about the quality of aged care services when making choices about their
care
• support aged care services to measure, monitor, compare and improve the quality of their services
• provide the government with system-level measures of quality in aged care and an evidence-base to inform policy and
regulation.
The pilot should include a selection of quality indicators that are able to be influenced, changed, or improved by in-home
aged care services, where their actions can change the outcome over time. Driving quality improvement can occur when the
quality indicator is used within organisations or shared in an anonymised format among organisations.
These quality indicators can be used to monitor performance over time, with the assumption that the consumer profiles are
fairly stable within an organisation or can be used among collaborating organisations to promote quality improvement
discussions.

Summary and discussion
Development of quality indicators for in-home aged care PwC 81
A key consideration identified during this review is that not all quality indicators can be influenced directly by aged care
services, this is evident in the ‘attribution’ criteria assessment results for the applicable quality indicators. Most quality of
care domains for in-home aged care are not exclusively affected by the service. Good outcomes for in-home aged care
consumers depends on the complex contributions of medical and allied health practitioners, local hospitals, carers and other
family members, the person themselves and the in-home aged care service.
Even for those quality indicators where there is evidence that a service can substantially influence outcomes for the
consumer, consideration needs to be given to how this might look like in the context of a reformed in-home aged care
system where consumers can choose from more than one in-home aged care service supplier. This may mean that
outcomes on these quality indicators for the consumer may not be able to be attributed to any one service, rather they may
be influenced more by the collective interplay of multiple services supporting that person.
Several other quality indicator reporting systems have been found to tailor in-home aged care indicators to specific services
or consumer groups (eg only to home care consumers receiving nursing or clinical services in the United States of
America), a possible approach to be considered in addressing attribution challenges.
In order to support quality improvement as a key objective of the QI Program, quality indicators for pilot could focus on
either ‘improvement’ or ‘decline’ type measurements. Stakeholder and expert advice on the technical aspects of quality
indicators will be sought to determine which approach to measurement is more useful in supporting quality improvement.
Domains and quality indicators for pilot that support the consumer information objective of the
QI Program
The pilot should include a selection of quality indicators that are meaningful to consumers and assists their understanding of
the quality of care and service provided by the aged care service and how this differs from other aged care services. The
potential use of quality indicators for identifiable public reporting requires quality indicators that can detect differences in the
performance of in-home aged care services.
For this reason, it is important to select quality indicators to pilot which can:
• be scored consistently within and between services,
• allow for a range of performance by services (eg no ceiling or floor effect or rare occurrences), and
• be risk adjusted to account for the variations in consumers and services (potentially requiring additional data linked at
the individual level).
Not all quality indicators identified in the review would be meaningful for consumers to support informed decision making
about in-home aged care services.
Use of quality indicators that are subject to copyright and licencing arrangements
Many of the quality indicators prioritised in this evidence review with high quality of evidence and high value for application
to the QI Program, are derived from data elements (usually clinical observations) that are subject to copyright and licensing
agreements.
Licenses would need to be obtained to include these quality indicators in the pilot, as is the case for the majority of quality
indicators used in Canada, Finland, Iceland, New Zealand, and the United States of America (where interRAI systems are
mandated).

Summary and discussion
Development of quality indicators for in-home aged care PwC 82
Use of quality indicators that require multiple observations within a six-week pilot
Several quality indicators require multiple assessments over a longer period of time, potentially preventing appropriate
assessment during the six-week project pilot period. For example, a quality indicator that measures the functional decline
over 3 months will require two points of data collection (one at the start of month one and one at the end of month 3). For
indicators where repeat measures are required, in a six-week pilot study, only the base (or initial) measure can be tested for
ease of completion or prevalence of the issue, but the full indicator cannot not be calculated.
The in-home aged care system is designed to allow both choice by consumers as well as to increase or decrease supports
in response to variation in care needs. This poses challenges in data collection where sequential observations to account
for movement of consumers between different services are required. This could be managed within the pilot by the careful
selection of quality indicators and guidance to services and will need to be considered as part of an expanded QI Program.
The feasibility of data collection directly from aged care services for some quality indicators
Quality indicators selected for pilot are likely to require similar methods for data collection as the current QI Program,
including direct collection from services on a quarterly basis. Several quality indicators identified in this review use data
obtained from non-provider sources, potentially reducing data burden for in-home aged care services in the pilot.
The potential data collection burden for aged care services to participate in the quality indicator pilot needs to be
considered. For some of the quality indicators outlined in this review, data does not currently exist in a format that would be
easily accessible for services to report on during the pilot. To operationalise many of the prioritised quality indicators in the
pilot, new data would need to be collected by in-home aged care services and in some cases using new instruments or
screening tools not routinely used.
Data collection burden may vary depending on service characteristics (eg digital record keeping, service maturity, service
size, infrastructure), data source required, number of observations or measurements needed, use of specific
instruments/tools and if the data requires specific staff to collect (eg nursing staff).
• For services who offer both residential and in-home aged care support, the data collection burden for piloting some of
these quality indicators in the in-home aged care environment may be reduced as they be able to use existing
processes and reporting mechanisms developed for domains, they already report on for the QI Program.
• For many quality indicators, a point prevalence approach is used (how many in-home aged care consumers have a
problem at a point in time). These types of indicators are possible to collect in home care on a single day or week for the
pilot but only for the consumers who receive services during the pilot period. To overcome this, some jurisdictions use a
'virtual' point prevalence approach for their quality indicators. For example, all clients of the service are assessed every
6 months from admission to their service, and the prevalence is calculated from the most recent assessment (which
might be more than 6 months old). These issues of ‘how’ to collect information for all, or a subset of, consumers in the
pilot need to be considered together with careful selection of quality indicators.
Accounting for different consumer populations and types of services in the pilot
In-home aged care services are as diverse as the needs of the consumers that access them. Within in-home aged care,
considerable variation exists in the type and complexity of services offered by a service (from gardening through to wound
care) and the type of consumers accessing in-home aged care services (from irregular support through to daily care needs
including those with the highest level of care support needs).
Many of the domains and quality indicators would apply to only a subset of services and consumers within the Australian in-
home aged care sector. For example, the domain of continence contains quality indicators that would apply only to the sub-
set of consumers with incontinence issues, and to the services who specifically provide continence support.

Summary and discussion
Development of quality indicators for in-home aged care PwC 83
The application of domains and quality indicators to different consumer groups within the broader in-home aged care
system poses several challenges for the pilot. Consideration should be given to tailoring the pilot to test quality indicators to
specific types of services and consumers where it makes sense to do so.
Several international quality indicator programs have incorporated risk adjustment for consumer characteristics. The need to
collect information on relevant diagnoses and underlying health profiles of the service’s populations should be considered to
understand quality indicator performance for different services during the pilot.
The specific focus of quality indicators in a domain for the pilot.
Many quality indicators identified in each domain in the review reflect slight variations in quality indicator definitions from
different countries. This has resulted in the inclusion of multiple quality indicators within the same domain that measure the
same or very similar concepts. Some of these variations in definitions are attributable to international bodies using different
versions of the same instruments. The value of measuring a specific concept needs to be considered when selecting quality
indicators from the range identified in each domain to take to pilot.
The use of validated or standardised tools for measurement
Several the quality indicators identified in the review require the use of validated and/or standardised scoring instruments.
These may require complex measurement (eg multi-item scales), specific training requirements for data collection and
licensing and copywrite arrangements. The selection of quality indicators for pilot will need to consider if there are existing
validated or standardised instruments used in in-home aged care that could be used to collect the data and if it is feasible to
provide training on the use of specific instruments prior to the pilot.
Augmenting the evidence review with advice from stakeholders
This evidence review has identified quality of care domains with quality indicators for each domain. Those with the highest
evidence base and value to the QI Program have been prioritised and ranked.
As part of developing quality indicators for in-home aged care, the next step will be to take the domains and quality
indicators found in the evidence review to consultation with aged care stakeholders and a technical expert group. This
feedback will help guide the potential domains and quality indicators for pilot and the further expansion of the QI Program.
The objective of the consultation process is to enable all relevant parties the opportunity to provide verbal and/or written
feedback on the potential domains and associated quality indicators identified in the evidence review including any technical
findings highlighted during the review and assessment of each quality indicator. It will also provide an opportunity to gain
feedback on CEQOL assessment tools identified by the Department. This feedback will help guide the potential domains
and quality indicators for pilot and the further expansion of the QI Program.

Appendices
Appendix A References 85
Appendix B Evidence review methodology 96
Appendix C Ranked quality indicators performance characteristics 101

Development of quality indicators for in-home aged care PwC 85
Appendix A References References for chapter four: Function and ADLs
• Australian Government. Aged Care Quality and Safety Commission. The Aged Care Quality Standards (Quality
Standards). 2021. (Accessed September 25, 2021, at https://www.agedcarequality.gov.au/providers/standards.)
• Deandrea S, Lucenteforte E, Bravi F, Foschi R, La Vecchia C, Negri E. Risk factors for falls in community-dwelling older
people: a systematic review and meta-analysis. Epidemiology 2010;21:658-68.
• Kadushin G. Home health care utilization: a review of the research for social work. Health Soc Work 2004;29:219-44.
• McLaren AN, Lamantia MA, Callahan CM. Systematic review of non-pharmacologic interventions to delay functional
decline in community-dwelling patients with dementia. Aging Ment Health 2013;17:655-66.
• O'Caoimh R, Cornally N, Weathers E, et al. Risk prediction in the community: A systematic review of case-finding
instruments that predict adverse healthcare outcomes in community-dwelling older adults. Maturitas 2015;82:3-21.
• Quinn TJ, McArthur K, Ellis G, Stott DJ. Functional assessment in older people. BMJ 2011;343:d4681.
• Tak E, Kuiper R, Chorus A, Hopman-Rock M. Prevention of onset and progression of basic ADL disability by physical
activity in community dwelling older adults: a meta-analysis. Ageing Res Rev 2013;12:329-38.
• The Registry of Senior Australians (ROSA) Stage 1 Report. 2019. (Accessed September 29, 2021, at
https://static1.squarespace.com/static/5b8c84fc4cde7abe6c3e7d7c/t/5ce2517a3e267200019ce7a7/1558335882656/RO
SA_Stage1_Report_Final_Updated16-05-2019.pdf).
References for specific quality indicators
• Engaging in daily activities, engaging in activities involving movement: Igarashi A, et al. Quality Assurance in
Long-Term Care and Development of Quality Indicators for Japan. Gerontol Geriatr Med. 2020 6:1-8, and
https://doi.org/10.1177/2333721420975320, and Fukui C, Igarashi A, Noguchi-Watanabe M, et al. Development of
quality indicators for evaluating the quality of long-term care. Geriatr Gerontol Int. 2021 1-2.
https://doi.org/10.1177/233372.
• Declined Activities of Daily Living (ADLs), declined Instrumental Activities of Daily Living (IADLs):
https://secure.cihi.ca/free_products/hcrs-ca-output-specifications-manual-2021-2022-en.pdf,
https://indicatorlibrary.cihi.ca/display/HSPIL/Wait+Times+for+Home+Care+Services, and
https://secure.cihi.ca/free_products/HCRS-Data-Submission-Specs-2017-2018-EN.pdf, and
https://indicatorlibrary.cihi.ca/display/HSPIL/Caregiver+Distress, Canadian Institute for Health Information. Home Care
Reporting System – Contact Assessment: Output Specifications, 2021-2022. Ottawa, ON: CIHI; 2021.
• ADL improvement, ADL decline, IADL improvement, IADL decline: Foebel AD, van Hout HP, van der Roest HG, et
al. Quality of care in European home care programs using the second generation interRAI Home Care Quality Indicators
(HCQIs). BMC Geriatr. 2015;15:148. Published 2015 Nov 14. doi:10.1186/s12877-015-0146-5 , and Morris, J.N., Fries,
B.E., Frijters, D. et al. interRAI home care quality indicators. BMC Geriatr 13, 127 (2013). https://doi.org/10.1186/1471-
2318-13-127.
• Number of cases of ADL decline: Tang X, Chen X, Pang Y and Zhou L. The development of quality indicators for
home care in China. Int J Qual Health Care. 2018;30:208-218, and Tang X, Ge S, Ma C and al. e. Evaluating the Quality
of Home Care in China Using the Home Care Quality Assessment Tool. Journal of Transcultural Nursing.
2021;32:173-179.
• Decline independence, rehabilitation potential and no therapies, difficulty in locomotion and no assistive device,
impaired locomotion in home: Wagner A, Zúñiga F, Rüesch P, Schaffert R, Dratva J, on behalf of the HCD Research
Group (2020) Selecting home care quality indicators based on the Resident Assessment Instrument-Home Care (RAI-
HC) for Switzerland: A public health and healthcare providers' perspective. PLoS ONE 15(12): e0244577.
https://doi.org/10.1371/journal.pone.0244577, and Burla L, Schaffert R, Mylaeus M and Rüesch P. Developing and
testing quality indicators in home care in Switzerland. Public Health Service. 2010;72:106-113, and Vincent C and
Staines A. Enhancing the quality and safety of Swiss healthcare. www.bag.admin.ch › bag › qualitaetssicherung. 2019.

References
Development of quality indicators for in-home aged care PwC 86
• Stabilization in grooming, improvement in upper body dressing, improvement in lower body dressing,
improvement in bathing, stabilisation in bathing, improvement in toilet transferring, stabilisation in toilet
transferring, stabilisation in toileting hygiene, improvement in bed transferring, stabilization in bed transferring,
improvement in ambulation/locomotion: https://cmit.cms.gov/CMIT_public/ViewMeasure?MeasureId=785#tab1.
References for chapter five: Service delivery and care plans
• Australian Government. Aged Care Quality and Safety Commission. The Aged Care Quality Standards (Quality
Standards). 2021. (Accessed September 25, 2021, at https://www.agedcarequality.gov.au/providers/standards.)
References for specific quality indicators
• Chronic Disease Management Plan: Inacio MC, Lang C, Caughey GE, Bray SCE, Harrison SL, Whitehead C,
Visvanathan R, Evans K, Corlis M, Cornell V, Wesselingh S. The Registry of Senior Australians outcome monitoring
system: quality and safety indicators for residential aged care. Int J Qual Health Care. 2020 Nov 9;32(8):502-510. doi:
10.1093/intqhc/mzaa078. PMID: 32696038, and Caughey GE, Lang C, Bray S, Whitehead C, Visvanathan R, Evans K,
Corlis M, Cornell V, Wesselingh S, Inacio MC. Development and Prevalence of Quality and Safety Indicators for Home
Care Recipients in Australia. Submitted BMJ Quality and Safety. 2021.
• Sound rules and regulations about recording and handling doctor's orders, sound rules and regulations about
storage and disposal of sterile items in home environment, sound rules and regulations about hand hygiene in
home environment, sound rules and regulations about placing home care operational items, sound rules and
regulations about medical related waste disposal in home environment, sound rules and regulations about risk
prevention in home environment, environmental preparations for home care operation meet the requirements,
the percentage of quality area preparations before home care operation, being equipped with appropriate
vehicle for home visits, being equipped with appropriate tools to carry home care functions , being equipped
with medical and nursing documents related to home visit, being properly equipped for home care, being
equipped with medication and supplies for first aid according to specific situations , monitoring vital signs of
home patients, monitoring complications of home patients, monitoring home patients with different tubes in
term of drainage volume, colour, quality, and degree of patency, assessing needs of home patients, assessing
nutrition condition of home patients, assessing skin condition of home patients, assessing safety of home
patients, assessing psychological status of home patients, home care technology can meet demand of
community residents, home care technology operation process complying with operational standards,
implementing basic nursing according to individual home patient's condition, the percentage of quality
preparation of sterile items before home care operation, the percentage of nurses properly carrying sterile
items, the percentage of quality preparation of personal appearance before home care operation, the
percentage of qualified preparation of hand hygiene before home care operation, health education and
guidelines for home patients, health education and guidelines for caregivers of home patients, the percentage
of proper management of adverse events, the percentage of proper disposal of specimens, the percentage of
proper disposal of medical waste, development and implementation of rehabilitation plans, percentage of
follow-up implementation: Tang X, Chen X, Pang Y and Zhou L. The development of quality indicators for home care
in China. Int J Qual Health Care. 2018;30:208-218, and Tang X, Ge S, Ma C and al. e. Evaluating the Quality of Home
Care in China Using the Home Care Quality Assessment Tool. Journal of Transcultural Nursing. 2021;32:173-179.
• Influence and enough time in home services, risk prevention measures for malnutrition, risk prevention
measures for pressure ulcers, risk prevention measures for impaired oral health, an updated care plan:
www.socialstyrelsen.se/statistik-och-data/oppna-jamforelser/socialtjanst/aldreomsorg/, and Sweden's Municipalities and
the County Council and the National Board of Health and Welfare. 2018. Open comparisons 2017. Care for the elderly.
Comparisons between municipalities and counties. https://webbutik.skl.se/sv/artiklar/oppna-jamforelser-vard-och-
omsorg-om-aldre-2017.html.
• Discharge to community: https://cmit.cms.gov/CMIT_public/ViewMeasure?MeasureId=181#tab1.
References for chapter six: Weight loss, malnutrition and dehydration
• Alibhai SM, Greenwood C, Payette H. An approach to the management of unintentional weight loss in elderly people.
CMAJ 2005;172:773-80.

References
Development of quality indicators for in-home aged care PwC 87
• Banks M, Ash S, Bauer J, Gaskill D. Prevalence of malnutrition in adults in Queensland public hospitals and residential
aged care facilities. Nutr Diet 2007;64:172-8.
• Dorner B. Practice Paper of the American Dietetic Association: Individualized Nutrition Approaches for Older Adults in
Health Care Communities. J Am Dietetic Assoc 2010;110:1554-63.
• Gaddey HL, Holder K. Unintentional weight loss in older adults. Am Fam Physician 2014;89:718-22.
• Miller HJ. Dehydration in the older adult. J Gerontol Nursing 2015;41:8-13.
• Rasheed S, Woods RT. Malnutrition and quality of life in older people: a systematic review and meta-analysis. Ageing
research reviews 2013;12:561-6.
• Volkert D, Beck AM, Cederholm T, et al. Management of malnutrition in older patients-current approaches, evidence and
open questions. J Clin Med 2019;8:974-80.
• Wotton K, Rannitch K, Munt R. Prevalence, risk factors and strategies to prevent dehydration in older adults. Comtemp
Nurse 2008;31:16-9.
References for specific quality indicators
• Maintaining nutritional status, prevention of dehydration: Igarashi A, et al. Quality Assurance in Long-Term Care
and Development of Quality Indicators for Japan. Gerontol Geriatr Med. 2020 6:1-8.
https://doi.org/10.1177/2333721420975320, and Fukui C, Igarashi A, Noguchi-Watanabe M, et al. Development of
quality indicators for evaluating the quality of long-term care. Geriatr Gerontol Int. 2021 1-2.
https://doi.org/10.1177/233372.
• Weight loss and malnutrition: Inacio MC, Lang C, Caughey GE, Bray SCE, Harrison SL, Whitehead C, Visvanathan
R, Evans K, Corlis M, Cornell V, Wesselingh S. The Registry of Senior Australians outcome monitoring system: quality
and safety indicators for residential aged care. Int J Qual Health Care. 2020 Nov 9;32(8):502-510. doi:
10.1093/intqhc/mzaa078. PMID: 32696038, and Caughey GE, Lang C, Bray S, Whitehead C, Visvanathan R, Evans K,
Corlis M, Cornell V, Wesselingh S, Inacio MC. Development and Prevalence of Quality and Safety Indicators for Home
Care Recipients in Australia. Submitted BMJ Quality and Safety. 2021.
• Weight loss: https://secure.cihi.ca/free_products/hcrs-ca-output-specifications-manual-2021-2022-en.pdf, and
https://indicatorlibrary.cihi.ca/display/HSPIL/Wait+Times+for+Home+Care+Services, and
https://secure.cihi.ca/free_products/HCRS-Data-Submission-Specs-2017-2018-EN.pdf, and
https://indicatorlibrary.cihi.ca/display/HSPIL/Caregiver+DistressCanadian Institute for Health Information, and Home
Care Reporting System – Contact Assessment: Output Specifications, 2021-2022. Ottawa, ON: CIHI; 2021.
• Weight loss: Foebel AD, van Hout HP, van der Roest HG, et al. Quality of care in European home care programs using
the second generation interRAI Home Care Quality Indicators (HCQIs). BMC Geriatr. 2015;15:148. Published 2015 Nov
14. doi:10.1186/s12877-015-0146-5, and Morris, J.N., Fries, B.E., Frijters, D. et al. interRAI home care quality
indicators. BMC Geriatr 13, 127 (2013). https://doi.org/10.1186/1471-2318-13-127.
• Dehydration: Wagner A, Zúñiga F, Rüesch P, Schaffert R, Dratva J, on behalf of the HCD Research Group (2020)
Selecting home care quality indicators based on the Resident Assessment Instrument-Home Care (RAI-HC) for
Switzerland: A public health and healthcare providers' perspective. PLoS ONE 15(12): e0244577.
https://doi.org/10.1371/journal.pone.0244577, and Burla L, Schaffert R, Mylaeus M and Rüesch P. Developing and
testing quality indicators in home care in Switzerland. Public Health Service. 2010;72:106-113, and Vincent C and
Staines A. Enhancing the quality and safety of Swiss healthcare. www.bag.admin.ch › bag › qualitaetssicherung. 2019.
References for chapter seven: Falls and major injuries
• Australian Institute of Health and Welfare. Australia's health 2018. Australia's health series no. 16. AUS 221. Canberra:
AIHW. 2018.
• Australian Institute of Health and Welfare. Hip fracture incidence and hospitalisations in Australia 2015-16. Cat. no. PHE
226. Canberra: AIHW. 2018.
• Bentler SE, Liu L, Obrizan M, et al. The aftermath of hip fracture: discharge placement, functional status change, and
mortality. Am J Epidemiol 2009; 170:1290-9.

References
Development of quality indicators for in-home aged care PwC 88
• Bergen G, Stevens MR, Burns ER. Falls and fall injuries among adults aged ?65 years-United States, 2014. MMWR
Morb Mortal Wkly Rep 2016; 65:993-8.
• Deandrea S, Bravi F, Turati F, et al. Risk factors for falls in older people in nursing homes and hospitals. A systematic
review and meta-analysis. Arch Gerontol Geriatrics 2013; 56:407-15.
• Hartholt KA, van Beeck EF, Polinder S, et al. Societal consequences of falls in the older population: injuries, healthcare
costs, and long-term reduced quality of life. J Trauma 2011; 71:748-53.
• Moller J. Projected costs of fall related injury to older persons due to demographic change in Australia. Report to the
Commonwealth Department of Health and Ageing under the National Falls Prevention for Older People Initiative.
Accessed Feb 17, 2010. 2003.
• Pasco JA, Sanders KM, Hoekstra FM, et al. The human cost of fracture. Osteoporos Int 2005; 16:2046-52.
• Verma SK, Willetts JL, Corns HL, Marucci-Wellman HR, Lombardi DA, Courtney TK. Falls and Fall-Related Injuries
among Community-Dwelling Adults in the United States. PLOS ONE 2016; 11:e0150939.
• Woolcott JC, Richardson KJ, Wiens MO, et al. Meta-analysis of the impact of 9 medication classes on falls in elderly
persons. Arch Intern Med 2009; 169:1952-60.
References for specific quality indicators
• Prevention of fall with trauma: Igarashi A, et al. Quality Assurance in Long-Term Care and Development of Quality
Indicators for Japan. Gerontol Geriatr Med. 2020 6:1-8, https://doi.org/10.1177/2333721420975320, and Fukui C,
Igarashi A, Noguchi-Watanabe M, et al. Development of quality indicators for evaluating the quality of long-term care.
Geriatr Gerontol Int. 2021 1-2. https://doi.org/10.1177/233372.
• Falls, fractures: Inacio MC, Lang C, Caughey GE, Bray SCE, Harrison SL, Whitehead C, Visvanathan R, Evans K,
Corlis M, Cornell V, Wesselingh S. The Registry of Senior Australians outcome monitoring system: quality and safety
indicators for residential aged care. Int J Qual Health Care. 2020 Nov 9;32(8):502-510. doi: 10.1093/intqhc/mzaa078.
PMID: 32696038, and Caughey GE, Lang C, Bray S, Whitehead C, Visvanathan R, Evans K, Corlis M, Cornell V,
Wesselingh S, Inacio MC. Development and Prevalence of Quality and Safety Indicators for Home Care Recipients in
Australia. Submitted BMJ Quality and Safety. 2021.
• Falls, injuries and breaks: https://secure.cihi.ca/free_products/hcrs-ca-output-specifications-manual-2021-2022-en.pdf,
https://indicatorlibrary.cihi.ca/display/HSPIL/Wait+Times+for+Home+Care+Services
https://secure.cihi.ca/free_products/HCRS-Data-Submission-Specs-2017-2018-EN.pdf,
https://indicatorlibrary.cihi.ca/display/HSPIL/Caregiver+Distress, and Canadian Institute for Health Information. Home
Care Reporting System – Contact Assessment: Output Specifications, 2021-2022. Ottawa, ON: CIHI; 2021.
• Falls, injuries: Foebel AD, van Hout HP, van der Roest HG, et al. Quality of care in European home care programs
using the second generation interRAI Home Care Quality Indicators (HCQIs). BMC Geriatr. 2015;15:148. Published
2015 Nov 14. doi:10.1186/s12877-015-0146-5, and Morris, J.N., Fries, B.E., Frijters, D. et al. interRAI home care quality
indicators. BMC Geriatr 13, 127 (2013). https://doi.org/10.1186/1471-2318-13-127.
• Incidence or number of cases of falling out of bed, incidence or number of cases of falls, incidence or number
of cases of new fractures: Tang X, Chen X, Pang Y and Zhou L. The development of quality indicators for home care
in China. Int J Qual Health Care. 2018;30:208-218, and Tang X, Ge S, Ma C and al. e. Evaluating the Quality of Home
Care in China Using the Home Care Quality Assessment Tool. Journal of Transcultural Nursing. 2021;32:173-179.
• Fall injuries among people 80 years and older, fractures of hip among people 65 years and older:
www.socialstyrelsen.se/statistik-och-data/oppna-jamforelser/socialtjanst/aldreomsorg/, and Sweden's Municipalities and
the County Council and the National Board of Health and Welfare. 2018. Open comparisons 2017. Care for the elderly.
Comparisons between municipalities and counties. https://webbutik.skl.se/sv/artiklar/oppna-jamforelser-vard-och-
omsorg-om-aldre-2017.html.
• Falls with major injury: https://www.cms.gov/Medicare/Quality-Initiatives-Patient-Assessment-
Instruments/HomeHealthQualityInits/Home-Health-Quality-Measures, and Process measures:
https://www.cms.gov/files/document/home-health-process-measures-table-oasis-d1-11-2019.pdf, and Outcome
measures: https://www.cms.gov/files/document/home-health-outcome-measures-table-oasis-d1-11-2019.pdf, and Risk
Adjustment: https://www.cms.gov/files/document/risk-adjustment-technicalspecifications508cfinal.pdf.

References
Development of quality indicators for in-home aged care PwC 89
References for chapter eight: Pressure injury and skin integrity
• Caughey GE, C L, Bray S, et al. Development and Prevalence of Quality and Safety Indicators for Home Care
Recipients in Australia. BMJ Qual Saf 2021;Submitted October 2021.
• Edsberg LE, Langemo D, Baharestani MM, Posthauer ME, Goldberg M. Unavoidable pressure injury: state of the
science and consensus outcomes. J Wound Ostomy Continence Nurs 2014;41:313-34.
• European Pressure Ulcer Advisory Panel and National Pressure Ulcer Advisory Panel (NPUAP). International guideline
prevention of pressure ulcers: quick reference guide, NPUAP, USA. 2009.
• European Pressure Ulcer Advisory Panel and National Pressure Ulcer Advisory Panel (NPUAP). Prevention and
Treatment of Pressure Ulcers/Injuries: Clinical Practice Guideline. 3rd edition. 2019. (Accessed October 4, 2021, at
http://www.internationalguideline.com/static/pdfs/Quick_Reference_Guide-10Mar2019.pdf.)
• Gorecki C, Brown JM, Nelson EA, et al. Impact of pressure ulcers on quality of life in older patients: a systematic review.
J Am Geriatr Soc 2009;57:1175-83.
• Rafiei H, Vanaki Z, Mohammadi E, Hosseinzadeh K. The Role of Family Caregivers in Pressure Injury Prevention
Guidelines: A Scoping Review. Home Healthc Now 2021;39:253-60.
• Song YP, Shen HW, Cai JY, Zha ML, Chen HL. The relationship between pressure injury complication and mortality risk
of older patients in follow-up: A systematic review and meta-analysis. Int Wound J 2019;16:1533-44.
References for specific quality indicators
• Prevention of pressure ulcer: Igarashi A, et al. Quality Assurance in Long-Term Care and Development of Quality
Indicators for Japan. Gerontol Geriatr Med. 2020 6:1-8. https://doi.org/10.1177/2333721420975320, and Fukui C,
Igarashi A, Noguchi-Watanabe M, et al. Development of quality indicators for evaluating the quality of long-term care.
Geriatr Gerontol Int. 2021 1-2. https://doi.org/10.1177/233372.
• Pressure injury: Inacio MC, Lang C, Caughey GE, Bray SCE, Harrison SL, Whitehead C, Visvanathan R, Evans K,
Corlis M, Cornell V, Wesselingh S. The Registry of Senior Australians outcome monitoring system: quality and safety
indicators for residential aged care. Int J Qual Health Care. 2020 Nov 9;32(8):502-510. doi: 10.1093/intqhc/mzaa078.
PMID: 32696038, and Caughey GE, Lang C, Bray S, Whitehead C, Visvanathan R, Evans K, Corlis M, Cornell V,
Wesselingh S, Inacio MC. Development and Prevalence of Quality and Safety Indicators for Home Care Recipients in
Australia. Submitted BMJ Quality and Safety. 2021.
• Incidence or number of cases of new pressure ulcers: Tang X, Chen X, Pang Y and Zhou L. The development of
quality indicators for home care in China. Int J Qual Health Care. 2018;30:208-218, and Tang X, Ge S, Ma C and al. e.
Evaluating the Quality of Home Care in China Using the Home Care Quality Assessment Tool. Journal of Transcultural
Nursing. 2021;32:173-179.
• Skin ulcer: Wagner A, Zúñiga F, Rüesch P, Schaffert R, Dratva J, on behalf of the HCD Research Group (2020)
Selecting home care quality indicators based on the Resident Assessment Instrument-Home Care (RAI-HC) for
Switzerland: A public health and healthcare providers' perspective. PLoS ONE 15(12): e0244577.
https://doi.org/10.1371/journal.pone.0244577, and Burla L, Schaffert R, Mylaeus M and Rüesch P. Developing and
testing quality indicators in home care in Switzerland Public Health Service. 2010;72:106-113, and Vincent C and
Staines A. Enhancing the quality and safety of Swiss healthcare. www.bag.admin.ch › bag › qualitaetssicherung. 2019.
• Changes in skin integrity post-acute care: Pressure ulcer/injury:
https://cmit.cms.gov/CMIT_public/ViewMeasure?MeasureId=187#tab1.
References for chapter nine: Workforce
• Australian Government. Department of Health. 2020 Aged Care Workforce Census Report.
https://www.health.gov.au/resources/publications/2020-aged-care-workforce-census. 2021.
• Australian Government. Department of Health. 2018. A MATTER OF CARE Australia's Aged Care Workforce Strategy
Report of the Aged Care Workforce Strategy Taskforce.

References
Development of quality indicators for in-home aged care PwC 90
• Royal Commission into Aged Care Quality and Safety. Final Report. Care, dignity and respect. Volume 1.
Summary and Recommendations. https://agedcare.royalcommission.gov.au/sites/default/files/2021-03/final-report-
volume-1_0.pdf. 2021.
References for specific quality indicators
• The number of home nursing staff is reasonable, the qualifications of home staff meet the requirements, the
quality rate of home care staff job training, sound rules and regulations about double-check before home
visiting, emergency response capability of home care staff, developing and rehearsing emergency plan to cope
with different emergency rescues in home environment, the percentage of qualified rehabilitation nursing,
satisfaction rate among home care staff members, dismissal rate of home care nurses: Tang X, Chen X, Pang Y
and Zhou L. The development of quality indicators for home care in China. Int J Qual Health Care. 2018;30:208-218,
and Tang X, Ge S, Ma C and al. e. Evaluating the Quality of Home Care in China Using the Home Care Quality
Assessment Tool. Journal of Transcultural Nursing. 2021;32:173-179.
• Attendance, trust and security in special housing, personal continuity within the home:
www.socialstyrelsen.se/statistik-och-data/oppna-jamforelser/socialtjanst/aldreomsorg/, and Sweden's Municipalities and
the County Council and the National Board of Health and Welfare. 2018. Open comparisons 2017. Care for the elderly.
Comparisons between municipalities and counties. https://webbutik.skl.se/sv/artiklar/oppna-jamforelser-vard-och-
omsorg-om-aldre-2017.html.
References for chapter ten: Pain
• Abdulla A, Adams N, Bone M, et al. Guidance on the management of pain in older people. Age Ageing 2013;42 Suppl
1:i1-57. DOI: 10.1093/ageing/afs200.
• Blyth FM, March LM, Brnabic AJ, Jorm LR, Williamson M, Cousins MJ. Chronic pain in Australia: a prevalence study.
Pain 2001;89:127-34.
• Abdulla A, Adams N, Bone M, et al. Guidance on the management of pain in older people. Age Ageing 2013;42 Suppl
1:i1-57.
• Barber JB, Gibson SJ. Treatment of chronic non-malignant pain in the elderly: safety considerations. Drug Saf
2009;32:457-74.
• Corbett A, Husebo B, Malcangio M, et al. Assessment and treatment of pain in people with dementia. Nat Rev Neurol
2012;8:264-74.
• Inacio MC, Visvanathan R, Lang C, et al. Pain in Older Australians Seeking Aged Care Services: Findings from the
Registry of Older South Australians (ROSA). JAMDA 2020;21:132-3.
• Patel KV, Guralnik JM, Dansie EJ, Turk DC. Prevalence and impact of pain among older adults in the United States:
findings from the 2011 National Health and Aging Trends Study. Pain 2013;154:2649-57.
• Reid MC, Eccleston C, Pillemer K. Management of chronic pain in older adults. BMJ 2015;350:h532.
• Risser A, Donovan D, Heintzman J, Page T. NSAID prescribing precautions. Am Family Physician 2009;80(12):1371-
1388.
• Roxburgh A, Bruno R, Larance B, Burns L. Prescription of opioid analgesics and related harms in Australia. Med J Aust
2011;195(5):280-4. (https://www.ncbi.nlm.nih.gov/pubmed/21895598).
• Srinivasa N, et al. The Revised IASP definition of pain: concepts, challenges, and compromises Pain. 2020 Sep 1;
161(9): 1976-1982.
References for specific quality indicators
• Coping with pain: Igarashi A, et al. Quality Assurance in Long-Term Care and Development of Quality Indicators for
Japan. Gerontol Geriatr Med. 2020 6:1-8. https://doi.org/10.1177/2333721420975320, and Fukui C, Igarashi A,
Noguchi-Watanabe M, et al. Development of quality indicators for evaluating the quality of long-term care. Geriatr
Gerontol Int. 2021 1-2. https://doi.org/10.1177/233372.

References
Development of quality indicators for in-home aged care PwC 91
• Pain-Inadequate medication, Daily pain: https://secure.cihi.ca/free_products/hcrs-ca-output-specifications-manual-
2021-2022-en.pdf, and https://indicatorlibrary.cihi.ca/display/HSPIL/Wait+Times+for+Home+Care+Services, and
https://secure.cihi.ca/free_products/HCRS-Data-Submission-Specs-2017-2018-EN.pdf, and
https://indicatorlibrary.cihi.ca/display/HSPIL/Caregiver+DistressCanadian Institute for Health Information. Home Care
Reporting System – Contact Assessment: Output Specifications, 2021-2022. Ottawa, ON: CIHI; 2021.
• Pain not controlled, pain improvement, daily severe pain: Foebel AD, van Hout HP, van der Roest HG, et al. Quality
of care in European home care programs using the second generation interRAI Home Care Quality Indicators (HCQIs).
BMC Geriatr. 2015;15:148. Published 2015 Nov 14. doi:10.1186/s12877-015-0146-5, and Morris, J.N., Fries, B.E.,
Frijters, D. et al. interRAI home care quality indicators. BMC Geriatr 13, 127 (2013). https://doi.org/10.1186/1471-2318-
13-127.
• Inadequate pain control, improvement of pain, daily severe pain: Wagner A, Zúñiga F, Rüesch P, Schaffert R,
Dratva J, on behalf of the HCD Research Group (2020) Selecting home care quality indicators based on the Resident
Assessment Instrument-Home Care (RAI-HC) for Switzerland: A public health and healthcare providers' perspective.
PLoS ONE 15(12): e0244577, and https://doi.org/10.1371/journal.pone.0244577, and Burla L, Schaffert R, Mylaeus M
and Rüesch P. Developing and testing quality indicators in home care in Switzerland. Public Health Service.
2010;72:106-113, and Vincent C and Staines A. Enhancing the quality and safety of Swiss healthcare.
www.bag.admin.ch › bag › qualitaetssicherung. 2019.
References for chapter eleven: Continence
• Australian Institute of Health and Welfare. Incontinence in Australia. Cat. no. DIS 61. Canberra: AIHW. 2013.
• Chiarelli P. Continence assessment in residential aged care. Aust J Ageing 2011;30:2-.
• Chiarelli PE, Mackenzie LA, Osmotherly PG. Urinary incontinence is associated with an increase in falls: a systematic
review. Aust J Physiother 2009;55:89-95.
• Guinane J, Crone R. Faecal incontinence in older people in Australia and New Zealand: A narrative review. Aus NZ
Cont J 2017;23:6-13.
• Guinane J, Crone R. Management of faecal incontinence. Aus J Gen Practitioners 2018;47:40-3.
• Lim D. Management of urinary incontinence in residential care. Aus Fam Physician 2016;45:498-502.
• Nakanishi N, Tatara K, Shinsho F, et al. Mortality in relation to urinary and faecal incontinence in elderly people living at
home. Age Ageing 1999;28:301-6.
• Xu D, Kane R, Arling G. Relationship between nursing home quality indicators and potentially preventable
hospitalisation. BMJ Qual Saf 2019;28:524-33.
References for specific quality indicators
• Prevention of bladder/bowel problem: Igarashi A, et al. Quality Assurance in Long-Term Care and Development of
Quality Indicators for Japan. Gerontol Geriatr Med. 2020 6:1-8. https://doi.org/10.1177/2333721420975320, and Fukui
C, Igarashi A, Noguchi-Watanabe M, et al. Development of quality indicators for evaluating the quality of long-term care.
Geriatr Gerontol Int. 2021 1-2. https://doi.org/10.1177/233372.
• Bladder continence: https://secure.cihi.ca/free_products/hcrs-ca-output-specifications-manual-2021-2022-en.pdf, and
https://indicatorlibrary.cihi.ca/display/HSPIL/Wait+Times+for+Home+Care+Services
https://secure.cihi.ca/free_products/HCRS-Data-Submission-Specs-2017-2018-EN.pdf, and
https://indicatorlibrary.cihi.ca/display/HSPIL/Caregiver+DistressCanadian Institute for Health Information, and Home
Care Reporting System – Contact Assessment: Output Specifications, 2021-2022. Ottawa, ON: CIHI; 2021.
• Bladder decline, bladder improvement: Foebel AD, van Hout HP, van der Roest HG, et al. Quality of care in European
home care programs using the second generation interRAI Home Care Quality Indicators (HCQIs) BMC Geriatr.
2015;15:148. Published 2015 Nov 14. doi:10.1186/s12877-015-0146-5, and Morris, J.N., Fries, B.E., Frijters, D. et al.
interRAI home care quality indicators. BMC Geriatr 13, 127 (2013). https://doi.org/10.1186/1471-2318-13-127.
• Obstipation: Wagner A, Zúñiga F, Rüesch P, Schaffert R, Dratva J, on behalf of the HCD Research Group (2020)
Selecting home care quality indicators based on the Resident Assessment Instrument-Home Care (RAI-HC) for
Switzerland: A public health and healthcare providers' perspective. PLoS ONE 15(12): e0244577.

References
Development of quality indicators for in-home aged care PwC 92
https://doi.org/10.1371/journal.pone.0244577, and Burla L, Schaffert R, Mylaeus M and Rüesch P. Developing and
testing quality indicators in home care in Switzerland. Public Health Service. 2010;72:106-113, and Vincent C and
Staines A. Enhancing the quality and safety of Swiss healthcare. www.bag.admin.ch › bag › qualitaetssicherung. 2019.
• Improvement in bowel incontinence: https://cmit.cms.gov/CMIT_public/ViewMeasure?MeasureId=807#tab1
https://www.cms.gov/Medicare/Quality-Initiatives-Patient-Assessment-Instruments/HomeHealthQualityInits/Home-
Health-Quality-Measures Process measures: https://www.cms.gov/files/document/home-health-process-measures-
table-oasis-d1-11-2019.pdf, and Outcome measures: https://www.cms.gov/files/document/home-health-outcome-
measures-table-oasis-d1-11-2019.pdf Risk Adjustment: https://www.cms.gov/files/document/risk-adjustment-
technicalspecifications508cfinal.pdf, and https://cmit.cms.gov/CMIT_public/ViewMeasure?MeasureId=2581#tab1, and
https://cmit.cms.gov/CMIT_public/ViewMeasure?MeasureId=803#tab2.
References for chapter twelve: Hospitalisations (including emergency department
presentations)
• Australian Government. Australian Institute of Health and Welfare. Potentially preventable hospitalisations in Australia
by age groups and small geographic areas, 2017-18. 2019. (Accessed October 1, 2021, at
https://www.aihw.gov.au/reports/primary-health-care/potentially-preventable-hospitalisations/contents/overview.)
• Fogg C, Griffiths P, Meredith P, Bridges J. Hospital outcomes of older people with cognitive impairment: An integrative
review. Int J Geriatr Psychiatry 2018.
• Loyd C, Markland AD, Zhang Y, et al. Prevalence of Hospital-Associated Disability in Older Adults: A Meta-analysis. J
Am Med Dir Assoc 2020;21:455-61 e5.
• MC I. Registry of Senior Australians. Report prepared by the Registry of Senior Australians for ECH Inc, July 2021.
2021.
• Pedone C, Ercolani S, Catani M, et al. Elderly patients with cognitive impairment have a high risk for functional decline
during hospitalization: the GIFA Study. J Gerontol A Biol Sci Med Sci 2005;60:1576-80.
• Wolinsky FD, Bentler SE, Liu L, et al. Recent hospitalization and the risk of hip fracture among older Americans. J
Gerontol A Biol Sci Med Sci 2009;64:249-55.
References for specific quality indicators
• Prevention of hospital admission: Igarashi A, et al. Quality Assurance in Long-Term Care and Development of
Quality Indicators for Japan. Gerontol Geriatr Med. 2020 6:1-8. https://doi.org/10.1177/2333721420975320 Fukui C,
Igarashi A, Noguchi-Watanabe M, et al. Development of quality indicators for evaluating the quality of long-term care.
Geriatr Gerontol Int. 2021 1-2. https://doi.org/10.1177/233372.
• Medication-related adverse events, emergency department presentation, delirium and/or dementia
hospitalisations: Inacio MC, Lang C, Caughey GE, Bray SCE, Harrison SL, Whitehead C, Visvanathan R, Evans K,
Corlis M, Cornell V, Wesselingh S. The Registry of Senior Australians outcome monitoring system: quality and safety
indicators for residential aged care. Int J Qual Health Care. 2020 Nov 9;32(8):502-510. doi: 10.1093/intqhc/mzaa078.
PMID: 32696038, and Caughey GE, Lang C, Bray S, Whitehead C, Visvanathan R, Evans K, Corlis M, Cornell V,
Wesselingh S, Inacio MC. Development and Prevalence of Quality and Safety Indicators for Home Care Recipients in
Australia. Submitted BMJ Quality and Safety. 2021.
• Hospitalisation (hospital, emergency department, emergent care): https://secure.cihi.ca/free_products/hcrs-ca-
output-specifications-manual-2021-2022-en.pdf, and
https://indicatorlibrary.cihi.ca/display/HSPIL/Wait+Times+for+Home+Care+Services
https://secure.cihi.ca/free_products/HCRS-Data-Submission-Specs-2017-2018-EN.pdf, and
https://indicatorlibrary.cihi.ca/display/HSPIL/Caregiver+DistressCanadian Institute for Health Information. Home Care
Reporting System – Contact Assessment: Output Specifications, 2021-2022. Ottawa, ON: CIHI; 2021.
• Hospitalization and emergency department use: Foebel AD, van Hout HP, van der Roest HG, et al. Quality of care in
European home care programs using the second generation interRAI Home Care Quality Indicators (HCQIs). BMC
Geriatr. 2015;15:148. Published 2015 Nov 14. doi:10.1186/s12877-015-0146-5, and Morris, J.N., Fries, B.E., Frijters, D.
et al. interRAI home care quality indicators. BMC Geriatr 13, 127 (2013). https://doi.org/10.1186/1471-2318-13-127

References
Development of quality indicators for in-home aged care PwC 93
• Readmission rate: Tang X, Chen X, Pang Y and Zhou L. The development of quality indicators for home care in China.
Int J Qual Health Care. 2018;30:208-218, and Tang X, Ge S, Ma C and al. e. Evaluating the Quality of Home Care in
China Using the Home Care Quality Assessment Tool. Journal of Transcultural Nursing. 2021;32:173-179.
• Hospitalisation, emergency department presentation or emergent care: Wagner A, Zúñiga F, Rüesch P, Schaffert
R, Dratva J, on behalf of the HCD Research Group (2020) Selecting home care quality indicators based on the Resident
Assessment Instrument-Home Care (RAI-HC) for Switzerland: A public health and healthcare providers' perspective.
PLoS ONE 15(12): e0244577. https://doi.org/10.1371/journal.pone.0244577, and Burla L, Schaffert R, Mylaeus M and
Rüesch P. Developing and testing quality indicators in home care in Switzerland. Public Health Service. 2010;72:106-
113, and Vincent C and Staines A. Enhancing the quality and safety of Swiss healthcare. www.bag.admin.ch › bag ›
qualitaetssicherung. 2019.
• Acute care hospitalisation during first 60 days of HH, emergency department use without hospitalisation during
the first 60 days of HH, discharge to community and no unplanned acute hospitalisation or LTCH in 31 days
after discharge, patients who had a potentially preventable 30 day post-discharge readmission:
https://cmit.cms.gov/CMIT_public/ViewMeasure?MeasureId=180#tab11, and https://www.cms.gov/Medicare/Quality-
Initiatives-Patient-Assessment-Instruments/HomeHealthQualityInits/Home-Health-Quality-Measures, and Process
measures: https://www.cms.gov/files/document/home-health-process-measures-table-oasis-d1-11-2019.pdf, and
Outcome measures: https://www.cms.gov/files/document/home-health-outcome-measures-table-oasis-d1-11-2019.pdf,
and Risk Adjustment: https://www.cms.gov/files/document/risk-adjustment-technicalspecifications508cfinal.pdf.
References for chapter thirteen: Depression
• Inacio MC, Lang C, Bray SCE, et al. Health status and healthcare trends of individuals accessing Australian aged care
programmes over a decade: the Registry of Senior Australians historical cohort. Intern Med J 2021;51:712-24.
• Australian Government. Aged Care Quality and Safety Commission. The Aged Care Quality Standards (Quality
Standards). 2021. (Accessed September 25, 2021, at https://www.agedcarequality.gov.au/providers/standards.)
• Luppa M, Sikorski C, Luck T, et al. Age- and gender-specific prevalence of depression in latest-life--systematic review
and meta-analysis. J Affect Disord 2012;136:212-21.
• Alexopoulos GS. Depression in the elderly. The Lancet 2005;365:1961-70.
• Kok RM, Reynolds CF, 3rd. Management of Depression in Older Adults: A Review. JAMA 2017;317:2114-22.
References for specific quality indicators
• Mood decline: https://secure.cihi.ca/free_products/hcrs-ca-output-specifications-manual-2021-2022-en.pdf,
https://indicatorlibrary.cihi.ca/display/HSPIL/Wait+Times+for+Home+Care+Services, and
https://secure.cihi.ca/free_products/HCRS-Data-Submission-Specs-2017-2018-EN.pdf, and
https://indicatorlibrary.cihi.ca/display/HSPIL/Caregiver+DistressCanadian Institute for Health Information. Home Care
Reporting System – Contact Assessment: Output Specifications, 2021-2022. Ottawa, ON: CIHI; 2021.
• Mood improvement, Mood decline: Foebel AD, van Hout HP, van der Roest HG, et al. Quality of care in European
home care programs using the second generation interRAI Home Care Quality Indicators (HCQIs). BMC Geriatr.
2015;15:148. Published 2015 Nov 14. doi:10.1186/s12877-015-0146-5, and Morris, J.N., Fries, B.E., Frijters, D. et al.
interRAI home care quality indicators. BMC Geriatr 13, 127 (2013). https://doi.org/10.1186/1471-2318-13-127.
References for chapter fourteen: Caregiver distress
• Australian Government. Australian Institute of Health and Welfare. Informal carers. 2021. (Accessed September 30,
2021, at https://www.aihw.gov.au/reports/australias-welfare/informal-carers.)
• Understanding the social and emotional needs of carers: Final report (SPRC Report 2/19). Sydney: Social Policy
Research Centre. 2019. (Accessed September 30, 2021, at https://agedcare.royalcommission.gov.au/system/files/2020-
06/RCD.9999.0131.0001.pdf.)

References
Development of quality indicators for in-home aged care PwC 94
References for chapter fifteen: Medication related
• Australian Government Aged Care Quality and Safety Commission. Residential care sector performance, October-
December 2019. Commonwealth of Australia; 2020.
• Australian Government Aged Care Quality and Safety Commission. Quality Use of Medicines and Medicines Safety
Discussion Paper 2020.
• Australian Government Department of Health. Guiding principles for medication management in residential aged care
facilities. Canberra: Commonwealth of Australia; 2012.
• Australian Government Department of Health. MBS Online. Commonwealth of Australia.
(http://www.mbsonline.gov.au/).
• .Inacio MC, Lang C, Bray SCE, et al. Health status and healthcare trends of individuals accessing Australian aged care
programmes over a decade: the Registry of Senior Australians historical cohort. Intern Med J 2021;51(5):712-724. DOI:
10.1111/imj.14871.
References for chapter sixteen: Wait times/system access
• Australian Government. Productivity Commission. Report on Government Services 2020. 14 Aged Care Services.
(https://www.pc.gov.au/research/ongoing/report-on-government-services/2021/community-services/aged-care-
services/rogs-2021-partf-section14-aged-care-services.pdf).
• McIntyre D, Chow CK. Waiting Time as an Indicator for Health Services Under Strain: A Narrative Review. Inquiry
2020;57:46958020910305. DOI: 10.1177/0046958020910305.
References for chapter seventeen: Behavioural symptoms
• Australian Government. Australian Institute of Health and Welfare. People's care needs in aged care. (https://www.gen-
agedcaredata.gov.au/Topics/Care-needs-in-aged-care).
• Laver K, Cumming RG, Dyer SM, et al. Clinical practice guidelines for dementia in Australia. Med J Aust
2016;204(5):191-3. DOI: 10.5694/mja15.01339.
• Nazir A, Arling G, Perkins AJ, Boustani M. Monitoring quality of care for nursing home residents with behavioral and
psychological symptoms related to dementia. J Am Med Dir Assoc 2011;12(9):660-7. DOI:
10.1016/j.jamda.2010.11.005.
• Westaway K, Sluggett J, Alderman C, Moffat A, Procter N, Roughead E. The extent of antipsychotic use in Australian
residential aged care facilities and interventions shown to be effective in reducing antipsychotic use: A literature review.
Dementia (London) 2020;19(4):1189-1202. DOI: 10.1177/1471301218795792.
References for chapter eighteen: Infection control
• Australian Government. Aged Care Quality and Safety Commission. The Aged Care Quality Standards (Quality
Standards). (https://www.agedcarequality.gov.au/providers/standards).
• van Buul LW, van der Steen JT, Veenhuizen RB, et al. Antibiotic use and resistance in long term care facilities. JAMDA
2012;13:568 e1-13.
References for chapter nineteen: Cognition
• Australian Government. Aged Care Quality and Safety Commission. The Aged Care Quality Standards (Quality
Standards). (https://www.agedcarequality.gov.au/providers/standards).
• Hirdes JP, van Everdingen C, Ferris J, et al. The interRAI Suite of Mental Health Assessment Instruments: An
Integrated System for the Continuum of Care. Front Psychiatry 2019;10:926. DOI: 10.3389/fpsyt.2019.00926.
• Inacio MC, Lang C, Bray SCE, et al. Health status and healthcare trends of individuals accessing Australian aged care
programmes over a decade: the Registry of Senior Australians historical cohort. Intern Med J 2021;51(5):712-724. DOI:
10.1111/imj.14871.

References
Development of quality indicators for in-home aged care PwC 95
• Langa KM, Levine DA. The diagnosis and management of mild cognitive impairment: a clinical review. JAMA
2014;312(23):2551-2561.
• Livingston G, Huntley J, Sommerlad A, et al. Dementia prevention, intervention, and care: 2020 report of the Lancet
Commission. Lancet 2020;396(10248):413-446. DOI: 10.1016/S0140-6736(20)30367-6.
• Petersen RC, Lopez O, Armstrong MJ, et al. Practice guideline update summary: Mild cognitive impairment: Report of
the Guideline Development, Dissemination, and Implementation Subcommittee of the American Academy of Neurology.
Neurology 2018;90(3):126-135. DOI: 10.1212/WNL.0000000000004826.
References for chapter twenty: Palliative care
• Australian Government. Department of Health. National Palliative Care Strategy 2018.
(https://www.health.gov.au/sites/default/files/the-national-palliative-care-strategy-2018-national-palliative-care-strategy-
2018.pdf).
• Australian Government. Aged Care Quality and Safety Commission. The Aged Care Quality Standards (Quality
Standards). (https://www.agedcarequality.gov.au/providers/standards).
• Inacio MC, Lang C, Bray SCE, et al. Health status and healthcare trends of individuals accessing Australian aged care
programmes over a decade: the Registry of Senior Australians historical cohort. Intern Med J 2021;51(5):712-724. DOI:
10.1111/imj.14871.
References for chapter twenty-one: Other clinical
• Australian Government. Aged Care Quality and Safety Commission. The Aged Care Quality Standards (Quality
Standards). 2021. (Accessed September 25, 2021, at https://www.agedcarequality.gov.au/providers/standards.)
• Centers for Medicare and Medicaid Services. CMS Measure Inventory Tool. Improvement in Dyspnea.
https://cmit.cms.gov/CMIT_public/ViewMeasure?MeasureId=187. 2020.
• Inacio MC, Lang C, Bray SCE, et al. Health status and healthcare trends of individuals accessing Australian aged care
programmes over a decade: the Registry of Senior Australians historical cohort. Intern Med J 2021;51:712-24.
• Fortinsky RH, Madigan EA, Sheehan TJ, Tullai-McGuinness S, Fenster JR. Risk factors for hospitalization among
Medicare home care patients. West J Nurs Res 2006;28:902-17.
References for chapter twenty-two: Mortality
Ibrahim JE, Ranson DL, Bugeja L. Premature deaths of nursing home residents: an epidemiological analysis. Med J Aust
2018;208(3):143. (In eng). DOI: 10.5694/mja17.00695.

Development of quality indicators for in-home aged care PwC 96
Appendix B Evidence review methodology Objective of the evidence review
The objective of the evidence review is to identify, assess and present the evidence base for quality of care domains and
quality indicators suitable for application to in-home aged care. This evidence will inform consultations with stakeholders on
the domains and quality indicators to take to pilot.
Process of evidence review
The process involved members of the PwC, UQ CHSR and ROSA consortium comprising of clinicians, measurement
scientists and policy experts, to appraise and rank both domains of care and their associated quality indicators.
Note that the consortium members that were involved in the ranking process were exposed to the range of scores in
aggregate form. An extensive discussion was conducted with a particular focus on areas of disagreement (ie where a
member’s score varied considerably from the group median score). After discussion, all members were offered the
opportunity to rescore. Final scores were then collated to produce the final rankings.
The consortia members used a simplified Delphi technique to appraise the domains and quality indicators to secure
consensus by undertaking the following steps:
1 Define and agree on the analytic framework for the assessment of the domains and quality indicators for the
project: A detailed analytic framework review plan was developed outlining the criteria for domain inclusion, the
assessment criteria for associated quality indicators and how domains and quality indicators will be ranked and
prioritised (see next section of this appendix for details on ranking and prioritisation).
2 Defined the literature review search parameters: Working with the Department, a set of clear parameters for the
evidence review and the format of the synthesis of the work was developed. A range of search strategies was used to
conduct a targeted review of international and national quality indicators and domains for in-home aged care services.
This involved review of academic literature and grey literature, including international government and relevant
organisation reports and websites. The literature review was an update and extension of previous work conducted by
the Department and consortium members, including Research Paper 8 from the Royal Commission into Aged Care
Quality and Safety. The search parameters include:
– Academic literature: Bibliographic sources of MEDLINE (Ovid) were searched using Medical Subject Headings
[MeSH] and keywords (title and/or abstract [tiab])
◦ Quality Indicators, Health Care [MeSH] OR Quality Indicators, Health Care [tiab] OR quality measure [tiab] OR
quality assessment [tiab] OR Healthcare quality indicator [tiab] OR Quality Indicators [tiab] OR quality indicator
[tiab] OR health care quality [tiab] OR process assessment [tiab] OR treatment outcome [tiab] OR “quality of
nursing care [tiab] OR care performance [tiab] OR care outcome [tiab]
◦ In-home aged care Services [MeSH] OR community care [tiab] OR in-home aged care services [tiab] OR in-
home aged care service [tiab] OR domiciliary care [tiab] OR formal in-home aged care [tiab] OR district nursing
[tiab] OR in-home aged care [tiab] OR domestic health care [tiab] OR domiciliary care [tiab] OR in-home aged
care agencies [MeSH] OR in-home aged care agencies [tiab] OR Home Health Aides [MeSH]
– Grey literature/Website Search: An internet search was conducted to search for relevant websites using the following
keywords: “quality indicator, quality measure, quality in health care”, AND “aged care, in-home aged care, nursing
home, community aged care, community services”, with the first 100 hits screened to maximise relevance.
– Country specific government websites were searched including CMS (Centres for Medicare and Medicaid Services;
www.cms.gov), Health Data.gov (www.healthdata.gov), NICE (National Institute for Health and Clinical Excellence;
www.nice.org.uk), European Society for Quality in Health Care (www.edqm.eu), European Directorate for the Quality
Use of Medicines & Healthcare (www.esqh.net) and Canadian Institute for Health Information (www.cihi.ca).

Evidence review methodology
Development of quality indicators for in-home aged care PwC 97
Reference lists of identified publications, reports and websites were also searched to identify relevant
publications/sources of information.
3 A scan of indicators and the domains was conducted: An initial scan of all quality indicators was undertaken and
then themed into quality of care domains. Identified domains were included in the report if they fulfilled the following
criteria:
– the domain and associated quality indicators are aimed at monitoring/improving the quality of in-home aged care
services at the population level
– data collection for quality indicators in the domain is population-based
– quality indicators and reporting are current (last 10 years).
The initial scan formed the basis of the domain theming exercise undertaken by the consortia. It is noted that this was
an iterative thematic review from which a total of 243 quality indicators from 14 countries were identified and
thematically grouped into 19 quality care domains. A full listing of each of the domain is presented in Table 2.
4 Extraction of data: Key data was extracted and summarised from the identified studies, reports websites and include:
– a general description of the indicators in place (country, name of indicator/system, domains,
– description of the type of indicator (eg structural, process, outcome)
– specifications of the indicator including numerator, denominator, exclusions, case-mix adjustment
– type and frequency of data collection
– framework/reporting of indicators (public reporting, facility-level reporting, rating systems)
– employment of indicators (eg measure absolute performance, comparative performance, quality improvement,
inform standards, care planning, payment)
– recommended targets.
All indicators identified at this stage were logged into an Evidence Review Assessment Log.
5 Assessment and ranking of the quality of care domains: The range of quality of care domains within the literature
for which there are existing quality indicators was identified. Quality of care domains were ranked by the consortium
against the criteria and the standardised scoring scale of 1-9 outlined in Table 13 below (with one indicating
disagreement with the criteria, and 9 indicating high agreement with the criteria).
Table 13: Domain ranking criteria and assessment rating scale
Review criteria Assessment rating
There are high quality, evidence based quality indicators for the
domain
Rate on scale 1 (disagree/low) to 9 (agree/high)
There is international agreement that the domain is important Rate on scale 1 (disagree/low) to 9 (agree/high)
In-home aged care services can influence care and experiences of
the domain
Rate on scale 1 (disagree/low) to 9 (agree/high)
The domain is important to monitor the delivery of high-quality care
and consumer experience
Rate on scale 1 (disagree/low) to 9 (agree/high)
Quality indicators from the at least 10 of the highest ranked domains were then assessed in the next step of the review.
6 Review and ranking of quality indicators against analytic framework criteria: A bespoke set of criteria was
developed for the project to guide the assessment of quality indicators. These have been developed using the US
National Quality Forum “Measure Evaluation Criteria and Guidance for Evaluating Measures of Endorsement” as a basis
but have been refined for use in the Australian aged care and quality indicator context. To develop the set of criteria, the
team at ROSA reviewed eight quality indicator criteria assessments, that included a total of 10 domains. Three
publications were identified which included a comparison of the assessment criteria. These criteria were developed for

Evidence review methodology
Development of quality indicators for in-home aged care PwC 98
health-related quality indicators and are not specific to the aged care settings but have been used for aged care quality
indicator assessment. The criteria were then ranked in order according to the frequency by which they were included in
each existing framework/reference (ie from most common to least common).
Two additional criteria were included ‘Value to the QI Program’ and ‘Attribution’ as important in the context of this
project. The indicators were quantitatively ranked using a standardised scale of 1-9 on the criteria in Table 14.
Table 14: Criteria to assess quality indicators
Criteria Description of components (refined for this project and relate to in-home aged care context)
Importance* Is the concept important to measure?
Is the indicator evidence-based?
Does the concept apply to a significant proportion of the residents/consumers in the Australian aged
care system?
Scientific
Acceptability *
Are the indicators precisely defined?
Is the data/information upon which it is based reliable?
Does the indicator demonstrate face validity, construct validity, and predictive validity?
Is there systematic bias and can that bias be addressed with an adjustment?
Does the indicator detect meaningful differences in performance among and within services?
Feasibility* Is the data collection and implementation feasible?
Is there readily available data?
Can the data be collected and/or the indicator scored with minimal burden?
Usability* Is the indicator meaningful, understandable and useful to a range of audiences?
Value to QI
Program
Monitoring this indicator can assist aged care services to measure, monitor, compare and improve
the quality of their services
Monitoring this indicator can provide older people with information about the quality of aged care
services when they are making choices about their care
Monitoring this indicator can provide the Government with information to support the quality of care
across the system of aged care in Australia
Attribution Is there an opportunity for improvement through the actions of the in-home aged care service?
*Criteria based on US NQF
Quality indicators from the top 10 ranked domains were assessed against each of the criteria descriptions and a rating
applied. Ranking scores for each criteria was quantified into an aggregate score for that QI – allowing for an order of
preference for the quality indicators in each domain to be achieved.
Table 15: Rating scale for assessment of indicators
Rating Description
High (7-9) Based on the information reviewed, there is high confidence that the criterion is met
Moderate (4-6) Based on the information reviewed, there is moderate confidence that the criterion is met
Low (1-3) Based on the information reviewed, there is low confidence that the criterion is met
Insufficient (10) There is insufficient information available to assess whether the criterion has been met. This may
include absent, incomplete, irrelevant, or non-specific information)

Evidence review methodology
Development of quality indicators for in-home aged care PwC 99
For each assessed indicator, the following information (if publicly available) was documented:
• domain to which the indicator relates
• definition of the quality indicator
• numerator: size of patient population the quality indicator would apply to
• the size of the population from which the numerator was derived from
• characteristics that would influence the inclusion/exclusion criteria of the indicator in the pilot
• how case mix adjustment will be applied to the quality indicator
• the data sources required to calculate the indicator and whether the data collection instruments are subject to licencing
agreements
• how the quality indicator data would be collected and the frequency of the collection
• where the indicator is currently used (eg sector, country, or quality indicators system)
• recommended targets or benchmarks for the quality indicator
• key references for the indicator
• the assessment of the indicator against the agreed analytic framework criteria.
Prioritisation: Quality indicators for each domain were assessed against a prioritisation matrix. Indicators were prioritised
based on their evidence and value given the objectives of the QI Program. Evidence’ was a combined average of the scores
for the first 5 criteria (feasibility, importance scientific acceptability, usability, attribution) and value to the QI Program was
the average score for this criterion. Indicators were ranked based on their level of evidence and level of value to the QI
Program to assist the final selection of indicators for further consultation and pilot testing.
Quality indicators were prioritised using a matrix that situates each quality indicator against the level of evidence and the
value to the QI Program:
• value for the QI Program axis refers to the rating for quality indicators against the value in applying it to the Australian QI
Program
• evidence based axis reflects the culminative assessment of the evidence based of the quality indicators based on the
assessment criteria of importance, feasibility, scientific acceptance, usability, and attribution.
The aim was to prioritise quality indicators that demonstrate high value for application to the QI Program and high rating
against the assessment criteria (see Figure 13) for recommendation to the Department.
Figure 13: Prioritisation matrix for the quality indicator evidence review

Evidence review methodology
Development of quality indicators for in-home aged care PwC 100
No quality indicator was ‘ruled out’ based on the data collection burden for in-home aged care services, licensing
agreements, or other enablers or barriers to implementation.
Outputs of the prioritisation framework reflect the consortium’s assessment of each quality indicator against the prioritisation
matrix. Using this prioritisation matrix allowed the identification of the quality indicators (and their domains) that are most
likely to be evidence based and of value to an expanded QI Program into in-home aged care services.

Development of quality indicators for in-home aged care PwC 101
Appendix C Ranked quality indicators performance characteristics Table 16: Function and ADLs
Rank
Quality
indicator –
unique
wording
Quality
indicator
description
Quality
indicator
country
Type and
frequency
of data
collection
Key
definitions
of terms
Calculation of
quality indicator
and reporting
methods
Types of home care
services in scope
Use
permitted
under
licence
Multiple
observation
required Risk adjusted
1.1 Clients
whose ability
to perform
daily
activities
(such as
eating and
bathing)
decreased
over the six
months
This is the
percentage of
clients, of all
ages, receiving
publicly funded
home care
services for at
least 60 days,
whose ability to
perform daily
activities (such
as eating and
bathing)
decreased over
the last six
months.
Canada110
Type of data
collection: Data
are based on
information in
Home Care
Reporting
System from
mandatory
Resident
Assessment
Instrument –
Home Care
(RAI-HC)
assessments.
Jurisdictions
differ in their
requirements
for RAI-HC
assessment
frequency.
Daily activities
bathing,
personal
hygiene and
locomotion
Decreased:
Technical
definition not
publicly
available
Numerator: The
number of long-
stay home care
clients (ie clients
who require care
for more than 60
days of continuous
service) whose
status in Activities
of Daily Living
(ADL) (bathing,
personal hygiene
and locomotion)
functioning was
higher in their prior
assessment than
their target
assessment
Denominator: The
number of home
Publicly funded home care
services, including publicly
funded services delivered by
private-sector agencies and
those funded and delivered
by the federal government
(eg Veterans Affairs). Home
care is delivered in the
community in private homes
and residential care settings,
as well as in hospitals and
ambulatory clinics. The
interRAI HC can be used to
assess persons with chronic
needs for care as well as
those with post-acute care
needs (eg after
hospitalization, in a hospital-
at-home situation). Clients
are considered for specific
RAI-HC
þ This indicator is
risk adjusted.
Adjustment
Factors: Age ≥65,
12 Months or less
between
Assessments,
Clinical Risk, Meal
Prep Difficulty,
Difficulty
housework,
Difficulty bathing,
Falls, Unsteady
gait, Admitted
Hospitals, CPS,
Number of Months
between
Assessments, ADL
Hierarchy 2+, Age
110 For Canadian based quality indicators identified in any domain, further information is available at
• https://indicatorlibrary.cihi.ca/display/HSPIL/Wait+Times+for+Home+Care+Services
• https://secure.cihi.ca/free_products/HCRS-Data-Submission-Specs-2017-2018-EN.pdf
• https://indicatorlibrary.cihi.ca/display/HSPIL/Caregiver+Distress

Ranked quality indicators performance characteristics
Development of quality indicators for in-home aged care PwC 102
Rank
Quality
indicator –
unique
wording
Quality
indicator
description
Quality
indicator
country
Type and
frequency
of data
collection
Key
definitions
of terms
Calculation of
quality indicator
and reporting
methods
Types of home care
services in scope
Use
permitted
under
licence
Multiple
observation
required Risk adjusted
care clients with at
least two
consecutive
assessments
Reporting of QI:
On-Line Public
Reporting.
indicators in line with their
sub-group: acute home care;
end of life; rehabilitation; long
term supportive; maintenance
client.
80, Institutional
Risk, ADL
Hierarchy 3+
1.2 Clients
whose ADL
functioning
declined
(bathing,
personal
hygiene,
locomotion)
(incidence)
Percentage of
clients whose
ADL functioning
declined
(bathing,
personal
hygiene,
locomotion).
Incidence
indicator.
Canada
Type of data
collection: RAI-
HC or interRAI
HC, collected
by designated
assessors,
registered
healthcare
providers, who
have received
training on the
administration
of the tools.
Frequency of
data collection:
90 days.
ADL
Functioning:
bathing,
personal
hygiene,
locomotion
Declined:
Technical
definition not
publicly
available
Numerator: HC
clients with
worsened ADLs
self-performance
on their target
assessment
compared with
their previous
assessment.
Denominator: All
HC clients (must
have target
assessment and
had an
assessment 3-15
months prior).
Reporting of QI:
90 days. HCRS
based on 2
consecutive
quarters (to
ensure min
number of
assessments to
apply risk
adjustment
procedures).
Publicly funded home care
services, including publicly
funded services delivered by
private-sector agencies and
those funded and delivered
by the federal government
(eg Veterans Affairs). Home
care is delivered in the
community in private homes
and residential care settings,
as well as in hospitals and
ambulatory clinics. The
interRAI HC can be used to
assess persons with chronic
needs for care as well as
those with post-acute care
needs (eg after
hospitalization, in a hospital-
at-home situation).
Clients are considered for
specific indicators in line with
their sub-group: acute home
care; end of life;
rehabilitation; long term
supportive; maintenance
client.
RAI-HC
þ Risk adjustment at
individual client
level (individual
covariates) and
home care
organizational
level (direct
standardization)
Stratified by ADL
summary scale.

Ranked quality indicators performance characteristics
Development of quality indicators for in-home aged care PwC 103
Rank
Quality
indicator –
unique
wording
Quality
indicator
description
Quality
indicator
country
Type and
frequency
of data
collection
Key
definitions
of terms
Calculation of
quality indicator
and reporting
methods
Types of home care
services in scope
Use
permitted
under
licence
Multiple
observation
required Risk adjusted
Reporting of QI:
On-Line Public
Reporting. See
https://www.cihi.ca
/en/home-care for
further information
1.3 Clients with
a score of
less than 18
on the
baseline
ADL Long
Form who
decline
further
(incidence)
Proportion of
HC clients with
a score of less
than 18 on the
baseline ADL
long form who
decline further.
Incidence
indicator.
EU111
Type of data
collection: Data
collected using
RAI-HC
European but
using 2nd
generation
European
interRAI HCQIs.
Data collected
by specially
trained
assessors,
usually nurses,
who verify
collected
information that
included direct
interviews of
home care
clients and
family
members, as
well as review
of physician
reports and
Technical
definitions not
publicly
available.
Numerator:
Number of HC
clients with a
score of less than
18 on the baseline
ADL long form
who decline
further.
Denominator: All
HC clients with
baseline
impairment and
assessments at
both baseline and
target assessment
(at 6 months).
Reporting of QI:
Reporting in
publication level
for 7 countries:
Czech Republic,
Denmark, Finland,
Germany, Italy,
and the
Netherlands for
HC recipients.
Information not available in
public materials.
RAI-HC
European
ý Adjusted for:
difficulty with meal
preparation,
housework and
bathing, unsteady
gait, Cognitive
Performance Scale
score, institutional
risk, ADL hierarchy
scale score.
Stratification: IADL
summary scale
111 Information about quality indicators for European nations can be found in Foebel et al, 2015. https://bmcgeriatr.biomedcentral.com/articles/10.1186/s12877-015-0146-5

Ranked quality indicators performance characteristics
Development of quality indicators for in-home aged care PwC 104
Rank
Quality
indicator –
unique
wording
Quality
indicator
description
Quality
indicator
country
Type and
frequency
of data
collection
Key
definitions
of terms
Calculation of
quality indicator
and reporting
methods
Types of home care
services in scope
Use
permitted
under
licence
Multiple
observation
required Risk adjusted
medical
records.
Frequency of
data collection:
6 monthly.
https://www.ncbi.nl
m.nih.gov/pmc/arti
cles/PMC4647796
/#Sec12
1.4 Clients with
baseline
impairment
and a better
score on the
ADL Long
Form
(incidence)
Proportion of
HC clients with
baseline
impairment and
a better score
on the ADL long
form. Incidence
indicator.
EU
Type of data
collection: Data
collected using
RAI-HC
European but
using 2nd
generation
European
interRAI HCQIs.
Data collected
by specially
trained
assessors,
usually nurses,
who verify
collected
information that
included direct
interviews of
home care
clients and
family
members, as
well as review
of physician
reports and
medical
records.
Technical
definitions of
impairment
and ADL are
not publicly
available.
Numerator:
Number of HC
clients with
baseline
impairment and a
better score on the
ADL long form.
Denominator: All
HC clients with
baseline
impairment and
assessments at
both baseline and
target assessment
(at 6 months).
Reporting of QI:
Reporting in
publication level
for 7 countries:
Czech Republic,
Denmark, Finland,
Germany, Italy,
and the
Netherlands for
HC recipients.
https://www.ncbi.nl
m.nih.gov/pmc/arti
cles/PMC4647796
/#Sec12"
Information not available in
public materials.
RAI-HC
European
þ Adjusted for: not
independent
cognition, ADL
decline, clinical
risk, falls,
hospitalizations,
ADL hierarchy
scale score.
Stratification: IADL
capacity scale
score

Ranked quality indicators performance characteristics
Development of quality indicators for in-home aged care PwC 105
Rank
Quality
indicator –
unique
wording
Quality
indicator
description
Quality
indicator
country
Type and
frequency
of data
collection
Key
definitions
of terms
Calculation of
quality indicator
and reporting
methods
Types of home care
services in scope
Use
permitted
under
licence
Multiple
observation
required Risk adjusted
Frequency of
data collection:
6 monthly.
1.5 Clients with
a score of
less than 15
on the IADL
self-
performance
summary
scale at
baseline
who
declined
(incidence)
Proportion of
HC clients with
a score less
than 15 on the
IADL self-
performance
summary scale
at baseline who
declined (had a
higher score).
Incidence
indicator.
EU
Type of data
collection: Data
collected using
RAI-HC
European but
using 2nd
generation
European
interRAI HCQIs.
Data collected
by specially
trained
assessors,
usually nurses,
who verify
collected
information that
included direct
interviews of
home care
clients and
family
members, as
well as review
of physician
reports and
medical
records.
Frequency of
data collection:
6 monthly.
Technical
definitions of
decline and
ADL are not
publicly
available.
Numerator: Number
of HC clients with a
score less than 15
on the IADL self-
performance
summary scale at
baseline who
declined (had a
higher score).
Incidence indicator.
Denominator: All
HC clients with a
IADL score less
than 15 at baseline
and both baseline
and target
assessment (at 6
months).
Reporting of QI:
Reporting in
publication level for
7 countries: Czech
Republic, Denmark,
Finland, Germany,
Italy, and the
Netherlands for HC
recipients.
https://www.ncbi.nl
m.nih.gov/pmc/articl
es/PMC4647796/#
Sec12
Information not available in
public materials.
RAI-HC
European
þ
Adjusted for:
difficulty with meal
preparation and
housework,
institutional risk,
ADL hierarchy
scale score.
Stratification:
clinical risk.

Ranked quality indicators performance characteristics
Development of quality indicators for in-home aged care PwC 106
Rank
Quality
indicator –
unique
wording
Quality
indicator
description
Quality
indicator
country
Type and
frequency
of data
collection
Key
definitions
of terms
Calculation of
quality indicator
and reporting
methods
Types of home care
services in scope
Use
permitted
under
licence
Multiple
observation
required Risk adjusted
1.6 Clients with
a score of
less than 18
on the
baseline
IADL Scale
who decline
further
(incidence)
Percentage of
clients with a
score of less
than 18 on the
baseline IADL
declined.
Incidence
indicator.
Canada
RAI-HC or
interRAI HC,
collected by
designated
assessors,
registered
healthcare
providers, who
have received
training on the
administration
of the tools.
Frequency of
data collection:
90 days.
IADL:
Technical
definition not
publicly
available
Decline
further:
Technical
definition not
publicly
available
Numerator: HC
clients with
worsened IADLs
self-performance
on their target
assessment
compared with
their previous
assessment.
Denominator: All
HC clients (must
have target
assessment and
had an
assessment 3-15
months prior).
Reporting of QI: 90
days. HCRS based
on 2 consecutive
quarters (to ensure
min number of
assessments to
apply risk
adjustment
procedures).
Reported at
National,
Province/Territory
level. Reporting.
See
https://www.cihi.ca/
en/home-care for
further information
Publicly funded home care
services, including publicly
funded services delivered by
private-sector agencies and
those funded and delivered
by the federal government
(eg Veterans Affairs). Home
care is delivered in the
community in private homes
and residential care settings,
as well as in hospitals and
ambulatory clinics.
The interRAI HC can be used
to assess persons with
chronic needs for care as well
as those with post-acute care
needs (eg after
hospitalization, in a hospital-
at-home situation).
Clients are considered for
specific indicators in line with
their sub-group: acute home
care; end of life;
rehabilitation; long term
supportive; maintenance
client.
RAI-HC
þ Risk adjustment at
individual client
level (individual
covariates) and
home care
organizational
level (direct
standardization).
Stratified by IADL
summary scale.

Ranked quality indicators performance characteristics
Development of quality indicators for in-home aged care PwC 107
Rank
Quality
indicator –
unique
wording
Quality
indicator
description
Quality
indicator
country
Type and
frequency
of data
collection
Key
definitions
of terms
Calculation of
quality indicator
and reporting
methods
Types of home care
services in scope
Use
permitted
under
licence
Multiple
observation
required Risk adjusted
1.7 Clients who
decline in
independenc
e since their
last
assessment
Prevalence of
clients who
have a decline
in
independence
since last
assessment
Switzerland
Swiss RAI-HC
data are
measured
within a 90-day
period at entry
to home care
services
(baseline) and
calculated six
monthly unless
there is a
significant
clinical change.
Definitions of
decline and
independence
not publicly
available.
Numerator: not
available
Denominator: not
available
Reporting of QI:
The Swiss RAI-HC
QIs only used for
internal quality
management in
non-profit home
care organisations
and there are no
national standards
for home care.
No cantonal
(regions) or
national agencies
are collecting this
data or publicly
report on quality of
care indicators.
Information not publicly
available
Swiss RAI-
HC
change.
1.8 Clients with
a score
greater than
0 on the
IADL self-
performance
summary
scale at
baseline
who
experience
an
improvement
(incidence)
Proportion of
HC clients with
a score greater
than 0 on the
IADL self-
performance
summary scale
at baseline who
experience an
improvement
(lower score).
Incidence
indicator.
EU
Data collected
using RAI-HC
European but
using 2nd
generation
European
interRAI HCQIs.
Data collected
by specially
trained
assessors,
usually nurses,
who verify
collected
Technical
definitions of
decline and
ADL are not
publicly
available.
Numerator:
Number of HC
clients with a
score greater than
0 on the IADL self-
performance
summary scale at
baseline who
experience an
improvement
(lower score).
Incidence
indicator.
Information not available in
public materials.
RAI-HC
European
þ
Adjusted for:
sadness, ADL
decline.
Stratification:
clinical risk."

Ranked quality indicators performance characteristics
Development of quality indicators for in-home aged care PwC 108
Rank
Quality
indicator –
unique
wording
Quality
indicator
description
Quality
indicator
country
Type and
frequency
of data
collection
Key
definitions
of terms
Calculation of
quality indicator
and reporting
methods
Types of home care
services in scope
Use
permitted
under
licence
Multiple
observation
required Risk adjusted
information that
included direct
interviews of
home care
clients and
family
members, as
well as review
of physician
reports and
medical
records.
Frequency of
data collection:
6 monthly."
Denominator: All
HC clients with a
IADL score greater
than 0 at baseline
and both baseline
and target
assessment (at 6
months).
Reporting of QI:
Reporting in
publication level
for 7 countries:
Czech Republic,
Denmark, Finland,
Germany, Italy,
and the
Netherlands for
HC recipients.
https://www.ncbi.nl
m.nih.gov/pmc/arti
cles/PMC4647796
/#Sec12
1.9 Clients who
do not have
an assistive
device and
have
difficulty in
mobility
Prevalence of
clients who do
not have an
assistive device
and have
difficulty in
mobility
Switzerland
Swiss RAI-HC
data are
measured
within a 90-day
period at entry
to home care
services
(baseline) and
calculated six
monthly unless
there is a
significant
clinical change.
Technical
definitions of
terms not
available
Numerator: not
available
Denominator: not
available
Reporting of QI:
The Swiss RAI-HC
QIs only used for
internal quality
management in
non-profit home
care organisations
and there are no
Information not publicly
available
Swiss RAI-
HC

Ranked quality indicators performance characteristics
Development of quality indicators for in-home aged care PwC 109
Rank
Quality
indicator –
unique
wording
Quality
indicator
description
Quality
indicator
country
Type and
frequency
of data
collection
Key
definitions
of terms
Calculation of
quality indicator
and reporting
methods
Types of home care
services in scope
Use
permitted
under
licence
Multiple
observation
required Risk adjusted
national standards
for home care.
No cantonal
(regions) or
national agencies
are collecting this
data or publicly
report on quality of
care indicators.
1.10 Clients with
impaired
mobility
within their
home
(incidence)
Incidence of
clients with
impaired
mobility within
home
Switzerland
Swiss RAI-HC
data are
measured
within a 90-day
period at entry
to home care
services
(baseline) and
calculated six
monthly unless
there is a
significant
clinical change.
Technical
definitions of
terms not
available
Numerator: not
available
Denominator: not
available
Reporting of QI:
The Swiss RAI-HC
QIs only used for
internal quality
management in
non-profit home
care organisations
and there are no
national standards
for home care.
No cantonal
(regions) or
national agencies
are collecting this
data or publicly
report on quality of
care indicators.
Information not publicly
available
Swiss RAI-
HC
1.11 Patient
improvement
in ability to
ambulate
Percentage of
home health
quality episodes
of care during
which the
OASIS based
measures.
(Outcome
Assessment
Information Set
Technical
definitions of
terms such as
ambulate are
not available in
Numerator:
Number of home
health quality
episodes of care
where the value
Applicable to all home care
consumers expect those who
are receiving only non-skilled
services; For whom neither
Medicare nor Medicaid is
þ þ
Adjusted for where
appropriate: age,
sex, payment

Ranked quality indicators performance characteristics
Development of quality indicators for in-home aged care PwC 110
Rank
Quality
indicator –
unique
wording
Quality
indicator
description
Quality
indicator
country
Type and
frequency
of data
collection
Key
definitions
of terms
Calculation of
quality indicator
and reporting
methods
Types of home care
services in scope
Use
permitted
under
licence
Multiple
observation
required Risk adjusted
patient
improved in
ability to
ambulate.
USA112 (OASIS-D1)
(Standardized
Patient
Assessments,
non-HER
Electronic
Clinical Data)).
Entry of HH
service and the
last 5 days of
every 60 day
period
beginning with
the start of care
date.
public
information.
recorded on the
discharge
assessment
indicates less
impairment in
ambulation/locomo
tion at discharge
than at start (or
resumption) of
care.
Denominator:
Number of home
health quality
episodes of care
ending with a
discharge during
the reporting
period, other than
those covered by
generic or
measure-specific
exclusions.
Reporting of QI:
90 days.
Home Health
Quality Reporting
(CMS and
providers).
Home Health
Compare (CMS,
providers and
paying for HH care (patients
receiving care under a
Medicare or Medicaid
Managed Care Plan are not
excluded from the OASIS
reporting requirement.
source, care
start/admission
source, risk of
hospitalisation,
available
assistance, clinical
factors (pain,
pressure ulcer,
stasis ulcer,
dyspnoea, urinary
status, bowel
incontinence,
cognitive function,
anxiety, confusion,
depression
screening,
behavioural
symptoms), ADLs,
medication
management,
supervision/safety
assistance, health
condition
diagnoses.
112 Further information regarding USA quality indicators is available at https://www.cms.gov/Medicare/Quality-Initiatives-Patient-Assessment-Instruments/HomeHealthQualityInits/Home-Health-Quality-Reporting-Requirements and for
individual indicators see https://cmit.cms.gov/CMIT_public/ListMeasures

Ranked quality indicators performance characteristics
Development of quality indicators for in-home aged care PwC 111
Rank
Quality
indicator –
unique
wording
Quality
indicator
description
Quality
indicator
country
Type and
frequency
of data
collection
Key
definitions
of terms
Calculation of
quality indicator
and reporting
methods
Types of home care
services in scope
Use
permitted
under
licence
Multiple
observation
required Risk adjusted
publicly reported),
and is part of the 5
star quality rating
(CMS, providers
and publicly
reported online
includes 7 QIs).
1.12 Patient who
improved or
stayed the
same in their
ability to
bathe
Percentage of
home health
quality episodes
of care during
which the
patient
improved or
stayed the
same in the
ability to bathe.
USA
OASIS based
measures.
(Outcome
Assessment
Information Set
(OASIS-D1)
(Standardized
Patient
Assessments,
non-HER
Electronic
Clinical Data)).
Entry of HH
service and the
last 5 days of
every 60 day
period
beginning with
the start of care
date.
Technical
definitions of
terms are not
available in
public
information.
Numerator:
Number of home
health quality
episodes of care
where the value
recorded on the
discharge
assessment
indicates the same
or less impairment
in bathing at
discharge than at
start (or
resumption) of
care.
Denominator:
Number of home
health quality
episodes of care
ending with a
discharge during
the reporting
period, other than
those covered by
generic or
measure-specific
exclusions.
Applicable to all home care
consumers expect those who
are receiving only non-skilled
services; For whom neither
Medicare nor Medicaid is
paying for HH care (patients
receiving care under a
Medicare or Medicaid
Managed Care Plan are not
excluded from the OASIS
reporting requirement.
þ þ
Adjusted for where
appropriate: age,
sex, payment
source, care
start/admission
source, risk of
hospitalisation,
available
assistance, clinical
factors (pain,
pressure ulcer,
stasis ulcer,
dyspnoea, urinary
status, bowel
incontinence,
cognitive function,
anxiety, confusion,
depression
screening,
behavioural
symptoms), ADLs,
medication
management,
supervision/safety
assistance, health
condition
diagnoses.

Ranked quality indicators performance characteristics
Development of quality indicators for in-home aged care PwC 112
Rank
Quality
indicator –
unique
wording
Quality
indicator
description
Quality
indicator
country
Type and
frequency
of data
collection
Key
definitions
of terms
Calculation of
quality indicator
and reporting
methods
Types of home care
services in scope
Use
permitted
under
licence
Multiple
observation
required Risk adjusted
Reporting of QI:
90 days.
Home Health
Quality Reporting
(CMS and
providers)
1.13 Patients who
improve in
self-bathing
Percentage of
home health
quality episodes
of care during
which the
patient got
better at bathing
self.
USA
OASIS based
measures.
(Outcome
Assessment
Information Set
(OASIS-D1)
(Standardized
Patient
Assessments,
non-HER
Electronic
Clinical Data)).
Entry of HH
service and the
last 5 days of
every 60 day
period
beginning with
the start of care
date.
Technical
definitions of
terms are not
available in
public
information.
Numerator:
Number of home
health quality
episodes of care
where the value
recorded on the
discharge
assessment
indicates less
impairment in
bathing at
discharge than at
start (or
resumption) of
care.
Denominator:
Number of home
health quality
episodes of care
ending with a
discharge during
the reporting
period, other than
those covered by
generic or
measure-specific
exclusions.
Reporting of QI:
90 days.
Applicable to all home care
consumers expect those who
are receiving only non-skilled
services; For whom neither
Medicare nor Medicaid is
paying for HH care (patients
receiving care under a
Medicare or Medicaid
Managed Care Plan are not
excluded from the OASIS
reporting requirement.
þ þ
Adjusted for where
appropriate: age,
sex, payment
source, care
start/admission
source, risk of
hospitalisation,
available
assistance, clinical
factors (pain,
pressure ulcer,
stasis ulcer,
dyspnoea, urinary
status, bowel
incontinence,
cognitive function,
anxiety, confusion,
depression
screening,
behavioural
symptoms), ADLs,
medication
management,
supervision/safety
assistance, health
condition
diagnoses.

Ranked quality indicators performance characteristics
Development of quality indicators for in-home aged care PwC 113
Rank
Quality
indicator –
unique
wording
Quality
indicator
description
Quality
indicator
country
Type and
frequency
of data
collection
Key
definitions
of terms
Calculation of
quality indicator
and reporting
methods
Types of home care
services in scope
Use
permitted
under
licence
Multiple
observation
required Risk adjusted
Home Health
Quality Reporting
(CMS and
providers).
Home Health
Compare (CMS,
providers and
publicly reported),
and is part of the 5
star quality rating
(CMS, providers
and publicly
reported online
includes 7 QIs).
1.14 Patients who
improve or
stay the
same in their
ability to get
in and out of
bed
Percentage of
home health
episodes of
care during
which the
patient
improved or
stayed the
same in ability
to get in and out
of bed.
USA
OASIS based
measures.
(Outcome
Assessment
Information Set
(OASIS-D1)
(Standardized
Patient
Assessments,
non-HER
Electronic
Clinical Data)).
Entry of HH
service and the
last 5 days of
every 60 day
period
beginning with
the start of care
date.
Technical
definitions of
terms are not
available in
public
information.
Numerator:
Number of home
health episodes of
care where the
value recorded on
the discharge
assessment
indicates the same
or less impairment
in bed transferring
at discharge than
at start (or
resumption) of
care.
Denominator:
Number of home
health episodes of
care ending with a
discharge during
the reporting
period, other than
those covered by
Applicable to all home care
consumers expect those who
are receiving only non-skilled
services.
For whom neither Medicare
nor Medicaid is paying for HH
care (patients receiving care
under a Medicare or Medicaid
Managed Care Plan are not
excluded from the OASIS
reporting requirement.
þ þ

Ranked quality indicators performance characteristics
Development of quality indicators for in-home aged care PwC 114
Rank
Quality
indicator –
unique
wording
Quality
indicator
description
Quality
indicator
country
Type and
frequency
of data
collection
Key
definitions
of terms
Calculation of
quality indicator
and reporting
methods
Types of home care
services in scope
Use
permitted
under
licence
Multiple
observation
required Risk adjusted
generic or
measure-specific
exclusions.
Reporting of QI:
90 days.
Home Health
Quality Reporting
(CMS and
providers)
1.15 Patients who
improved in
their ability
to get in and
out of bed
Percentage of
home health
quality episodes
of care during
which the
patient
improved in
ability to get in
and out of bed.
USA
OASIS based
measures.
(Outcome
Assessment
Information Set
(OASIS-D1)
(Standardized
Patient
Assessments,
non-HER
Electronic
Clinical Data)).
Entry of HH
service and the
last 5 days of
every 60 day
period
beginning with
the start of care
date.
Technical
definitions of
terms are not
available in
public
information.
Numerator:
Number of home
health quality
episodes of care
where the value
recorded on the
discharge
assessment
indicates less
impairment in bed
transferring at
discharge than at
start (or
resumption) of
care.
Denominator:
Number of home
health quality
episodes of care
ending with a
discharge during
the reporting
period, other than
those covered by
generic or
Applicable to all home care
consumers expect those who
are receiving only non-skilled
services; For whom neither
Medicare nor Medicaid is
paying for HH care (patients
receiving care under a
Medicare or Medicaid
Managed Care Plan are not
excluded from the OASIS
reporting requirement.
þ þ
Adjusted for where
appropriate: age,
sex, payment
source, care
start/admission
source, risk of
hospitalisation,
available
assistance, clinical
factors (pain,
pressure ulcer,
stasis ulcer,
dyspnoea, urinary
status, bowel
incontinence,
cognitive function,
anxiety, confusion,
depression
screening,
behavioural
symptoms), ADLs,
medication
management,
supervision/safety
assistance, health

Ranked quality indicators performance characteristics
Development of quality indicators for in-home aged care PwC 115
Rank
Quality
indicator –
unique
wording
Quality
indicator
description
Quality
indicator
country
Type and
frequency
of data
collection
Key
definitions
of terms
Calculation of
quality indicator
and reporting
methods
Types of home care
services in scope
Use
permitted
under
licence
Multiple
observation
required Risk adjusted
measure-specific
exclusions.
Reporting of QI:
90 days.
Home Health
Quality Reporting
(CMS and
providers).
Home Health
Compare (CMS,
providers and
publicly reported),
and is part of the 5
star quality rating
(CMS, providers
and publicly
reported online
includes 7 QIs).
condition
diagnoses.
1.16 Patients who
improved in
their ability
to get to and
from and on
and off the
toilet
Percentage of
home health
quality episodes
of care during
which patients
improved in
ability to get to
and from and
on and off the
toilet.
USA
OASIS based
measures.
(Outcome
Assessment
Information Set
(OASIS-D1)
(Standardized
Patient
Assessments,
non-HER
Electronic
Clinical Data)).
Entry of HH
service and the
last 5 days of
every 60 day
period
Technical
definitions of
terms are not
available in
public
information.
Numerator:
Number of home
health quality
episodes of care
where the value
recorded on the
discharge
assessment
indicates the same
or less impairment
in bathing at
discharge than at
start (or
resumption) of
care.
Denominator:
Number of home
Applicable to all home care
consumers except those who
are receiving only non-skilled
services; For whom neither
Medicare nor Medicaid is
paying for HH care (patients
receiving care under a
Medicare or Medicaid
Managed Care Plan are not
excluded from the OASIS
reporting requirement.
þ þ

Ranked quality indicators performance characteristics
Development of quality indicators for in-home aged care PwC 116
Rank
Quality
indicator –
unique
wording
Quality
indicator
description
Quality
indicator
country
Type and
frequency
of data
collection
Key
definitions
of terms
Calculation of
quality indicator
and reporting
methods
Types of home care
services in scope
Use
permitted
under
licence
Multiple
observation
required Risk adjusted
beginning with
the start of care
date.
health quality
episodes of care
ending with a
discharge during
the reporting
period, other than
those covered by
generic or
measure-specific
exclusions.
Reporting of QI:
90 days.
Home Health
Quality Reporting
(CMS and
providers)
1.17 Clients who
have
rehabilitation
potential and
do not
receive
therapy
Prevalence of
clients who
have
rehabilitation
potential and do
not receive
therapy
Switzerland
Swiss RAI-HC
data are
measured
within a 90-day
period at entry
to home care
services
(baseline) and
calculated six
monthly unless
there is a
significant
clinical change.
Technical
definitions of
terms not
available
Numerator: not
available
Denominator: not
available
Reporting of QI:
The Swiss RAI-HC
QIs only used for
internal quality
management in
non-profit home
care organisations
and there are no
national standards
for home care.
No cantonal
(regions) or
national agencies
are collecting this
data or publicly
Information not publicly
available
Swiss RAI-
HC

Ranked quality indicators performance characteristics
Development of quality indicators for in-home aged care PwC 117
Rank
Quality
indicator –
unique
wording
Quality
indicator
description
Quality
indicator
country
Type and
frequency
of data
collection
Key
definitions
of terms
Calculation of
quality indicator
and reporting
methods
Types of home care
services in scope
Use
permitted
under
licence
Multiple
observation
required Risk adjusted
report on quality of
care indicators.
1.18 Patients who
improve or
stay the
same in
ability to
manage
toileting
hygiene
Percentage of
home health
quality episodes
of care during
which patients
improved or
stayed the
same in ability
to manage
toileting
hygiene.
USA
OASIS based
measures.
(Outcome
Assessment
Information Set
(OASIS-D1)
(Standardized
Patient
Assessments,
non-HER
Electronic
Clinical Data)).
Entry of HH
service and the
last 5 days of
every 60 day
period
beginning with
the start of care
date.
Technical
definitions of
terms are not
available in
public
information.
Numerator:
Number of home
health quality
episodes of care
where the
discharge
assessment
indicates the same
or less impairment
in toileting hygiene
at discharge than
at start/resumption
of care.
Denominator:
Number of home
health quality
episodes of care
ending with a
discharge during
the reporting
period, other than
those covered by
generic or
measure-specific
exclusions.
Reporting of QI:
90 days.
Home Health
Quality Reporting
(CMS and
providers)
Applicable to all home care
consumers except those who
are receiving only non-skilled
services; For whom neither
Medicare nor Medicaid is
paying for HH care (patients
receiving care under a
Medicare or Medicaid
Managed Care Plan are not
excluded from the OASIS
reporting requirement
þ þ

Ranked quality indicators performance characteristics
Development of quality indicators for in-home aged care PwC 118
Rank
Quality
indicator –
unique
wording
Quality
indicator
description
Quality
indicator
country
Type and
frequency
of data
collection
Key
definitions
of terms
Calculation of
quality indicator
and reporting
methods
Types of home care
services in scope
Use
permitted
under
licence
Multiple
observation
required Risk adjusted
1.19 Patients who
improve or
stay the
same in their
ability to get
to and from
and on and
off the toilet
Percentage of
home health
quality episodes
of care during
which patients
improved or
stayed the
same in ability
to get to and
from and on
and off the
toilet.
USA
OASIS based
measures.
(Outcome
Assessment
Information Set
(OASIS-D1)
(Standardized
Patient
Assessments,
non-HER
Electronic
Clinical Data)).
Entry of HH
service and the
last 5 days of
every 60 day
period
beginning with
the start of care
date.
Technical
definitions of
terms are not
available in
public
information.
Numerator:
Number of home
health quality
episodes of care
where the value
recorded on the
discharge
assessment
indicates the same
or less impairment
in getting to and
from and on and
off the toilet at
discharge than at
start (or
resumption) of
care.
Denominator:
Number of home
health quality
episodes of care
ending with a
discharge during
the reporting
period, other than
those covered by
generic or
measure-specific
exclusions.
Reporting of QI:
90 days.
Home Health
Quality Reporting
(CMS and
providers)
Applicable to all home care
consumers except those who
are receiving only non-skilled
services; For whom neither
Medicare nor Medicaid is
paying for HH care (patients
receiving care under a
Medicare or Medicaid
Managed Care Plan are not
excluded from the OASIS
reporting requirement
þ þ

Ranked quality indicators performance characteristics
Development of quality indicators for in-home aged care PwC 119
Rank
Quality
indicator –
unique
wording
Quality
indicator
description
Quality
indicator
country
Type and
frequency
of data
collection
Key
definitions
of terms
Calculation of
quality indicator
and reporting
methods
Types of home care
services in scope
Use
permitted
under
licence
Multiple
observation
required Risk adjusted
1.20 Patients who
improve or
stay the
same in
ability to
groom self
Percentage of
home health
quality episodes
of care during
which patients
improved or
stayed the
same in ability
to groom self.
USA
OASIS based
measures.
(Outcome
Assessment
Information Set
(OASIS-D1)
(Standardized
Patient
Assessments,
non-HER
Electronic
Clinical Data)).
Entry of HH
service and the
last 5 days of
every 60 day
period
beginning with
the start of care
date.
Technical
definitions of
terms are not
available in
public
information.
Numerator:
Number of home
health quality
episodes of care
where the value
recorded on the
discharge
assessment
indicates the same
or less impairment
in grooming
themselves at
discharge than at
start (or
resumption) of
care.
Denominator:
Number of home
health quality
episodes of care
ending with a
discharge during
the reporting
period, other than
those covered by
generic or
measure-specific
exclusions.
Reporting of QI:
90 days.
Home Health
Quality Reporting
(CMS and
providers)
Applicable to all home care
consumers except those who
are receiving only non-skilled
services; For whom neither
Medicare nor Medicaid is
paying for HH care (patients
receiving care under a
Medicare or Medicaid
Managed Care Plan are not
excluded from the OASIS
reporting requirement
þ þ
Yes. Adjusted for
where appropriate:
age, sex, payment
source, care
start/admission
source, risk of
hospitalisation,
available
assistance, clinical
factors (pain,
pressure ulcer,
stasis ulcer,
dyspnoea, urinary
status, bowel
incontinence,
cognitive function,
anxiety, confusion,
depression
screening,
behavioural
symptoms), ADLs,
medication
management,
supervision/safety
assistance, health
condition
diagnoses.

Ranked quality indicators performance characteristics
Development of quality indicators for in-home aged care PwC 120
Rank
Quality
indicator –
unique
wording
Quality
indicator
description
Quality
indicator
country
Type and
frequency
of data
collection
Key
definitions
of terms
Calculation of
quality indicator
and reporting
methods
Types of home care
services in scope
Use
permitted
under
licence
Multiple
observation
required Risk adjusted
1.21 Patients who
improve in
their ability
to dress
lower body
Percentage of
home health
quality episodes
of care during
which patients
improved in
ability to dress
lower body.
USA
OASIS based
measures.
(Outcome
Assessment
Information Set
(OASIS-D1)
(Standardized
Patient
Assessments,
non-HER
Electronic
Clinical Data)).
Entry of HH
service and the
last 5 days of
every 60 day
period
beginning with
the start of care
date.
Technical
definitions of
terms are not
available in
public
information.
Numerator:
Number of home
health quality
episodes of care
where the value
recorded on the
discharge
assessment
indicates less
impairment in
dressing their
lower body at
discharge than at
start (or
resumption) of
care.
Denominator:
Number of home
health quality
episodes of care
ending with a
discharge during
the reporting
period, other than
those covered by
generic or
measure-specific
exclusions.
Reporting of QI:
90 days.
Home Health
Quality Reporting
(CMS and
providers)
Applicable to all home care
consumers except those who
are receiving only non-skilled
services; For whom neither
Medicare nor Medicaid is
paying for HH care (patients
receiving care under a
Medicare or Medicaid
Managed Care Plan are not
excluded from the OASIS
reporting requirement
þ þ

Ranked quality indicators performance characteristics
Development of quality indicators for in-home aged care PwC 121
Rank
Quality
indicator –
unique
wording
Quality
indicator
description
Quality
indicator
country
Type and
frequency
of data
collection
Key
definitions
of terms
Calculation of
quality indicator
and reporting
methods
Types of home care
services in scope
Use
permitted
under
licence
Multiple
observation
required Risk adjusted
1.22 Patients who
improve in
their ability
to dress
upper body
Percentage of
home health
quality episodes
of care during
which patients
improved in
ability to dress
upper body.
USA
OASIS based
measures.
(Outcome
Assessment
Information Set
(OASIS-D1)
(Standardized
Patient
Assessments,
non-HER
Electronic
Clinical Data)).
Entry of HH
service and the
last 5 days of
every 60 day
period
beginning with
the start of care
date.
Technical
definitions of
terms are not
available in
public
information.
Numerator:
Number of home
health quality
episodes of care
where the value
recorded on the
discharge
assessment
indicates less
impairment in
dressing their
upper body at
discharge than at
start (or
resumption) of
care.
Denominator:
Number of home
health quality
episodes of care
ending with a
discharge during
the reporting
period, other than
those covered by
generic or
measure-specific
exclusions.
Reporting of QI:
90 days.
Home Health
Quality Reporting
(CMS and
providers)
Applicable to all home care
consumers except those who
are receiving only non-skilled
services; For whom neither
Medicare nor Medicaid is
paying for HH care (patients
receiving care under a
Medicare or Medicaid
Managed Care Plan are not
excluded from the OASIS
reporting requirement
þ þ
Yes. Adjusted for
where appropriate:
age, sex, payment
source, care
start/admission
source, risk of
hospitalisation,
available
assistance, clinical
factors (pain,
pressure ulcer,
stasis ulcer,
dyspnoea, urinary
status, bowel
incontinence,
cognitive function,
anxiety, confusion,
depression
screening,
behavioural
symptoms), ADLs,
medication
management,
supervision/safety
assistance, health
condition
diagnoses.

Ranked quality indicators performance characteristics
Development of quality indicators for in-home aged care PwC 122
Table 17: Delivery and Care Plans
Rank
Quality
indicator –
unique
wording
Quality
indicator
description
Quality
indicator
country
Type and
frequency
of data
collection
Key
definitions
of terms
Calculation of
quality indicator
and reporting
methods
Types of home care
services in scope
Use
permitted
under
licence
Multiple
observation
required Risk adjusted
2.1 Clients
involved in
developing
their home
care plan
This is the
percentage of
publicly funded
home care
clients, of all
ages, who
agreed or
disagreed (on a
5 point Likert
scale) that they
felt involved in
developing their
home care plan.
Canada
Client and
Caregiver
Experience
Evaluation
(CCEE) Survey
is intended to
be an ongoing
evaluation tool,
with four
sample waves
conducted
annually in each
region. The
survey
population
comprises
individuals who
have received
publicly funded
home care
services. Both
active and
discharged
clients are
included in the
survey
population.
Technical
definitions not
publicly
available
Numerator: The
number of
respondents who
responded, given
a five point Likert
scale (strongly
agreed, somewhat
agreed, neither
agreed nor
disagreed,
somewhat
disagreed, or
strongly
disagreed) to the
survey question:
"Thinking about
the planning of
your care, please
tell me whether
you agree or
disagree with the
following
statements: I felt
involved in
developing my
plan.
Denominator: The
number of total
responses to the
statement
Reporting of QI:
On-Line Public
Reporting, Public
Reports (annual
Publicly funded home care
services, including publicly
funded services delivered by
private-sector agencies and
those funded and delivered
by the federal government
(eg Veterans Affairs). Home
care is delivered in the
community in private homes
and residential care settings,
as well as in hospitals and
ambulatory clinics. The
interRAI HC can be used to
assess persons with chronic
needs for care as well as
those with post-acute care
needs (eg after
hospitalization, in a hospital-
at-home situation).
Clients are considered for
specific indicators in line with
their sub-group: acute home
care; end of life;
rehabilitation; long term
supportive; maintenance
client.
RAI-HC

Ranked quality indicators performance characteristics
Development of quality indicators for in-home aged care PwC 123
Rank
Quality
indicator –
unique
wording
Quality
indicator
description
Quality
indicator
country
Type and
frequency
of data
collection
Key
definitions
of terms
Calculation of
quality indicator
and reporting
methods
Types of home care
services in scope
Use
permitted
under
licence
Multiple
observation
required Risk adjusted
report, bulletins,
and theme
reports)
2.2 Client input
into
assistance,
ability to
influence
care times,
staff ability
to carry out
work in
required
timeframe
Percentage of
older HC people
who answered
positively to the
three questions
a. Do the staff
take into
account your
views and
wishes on how
the assistance
should be
performed?
b. Are you
usually able to
influence at
what times the
staff come?
c. Do the staff
have enough
time to be able
to carry out their
work with you?
Sweden
Data collected
by the
municipalities
yearly, derived
from national
surveys,
administrative
data, and
registries.
National
surveys: NBHW
survey – What
do the elderly
think about
elderly care?
(from
municipalities
and counties)
Official statistics
(administrative
data): Register
of Social
Services
Interventions for
the Elderly and
Persons with
Disability,
Patient
Register,
Register of
Medicines
Technical
definitions of
terms are not
available in
public domain.
Calculation
methods not
known
Reporting of QI:
Publicly annually
at municipal level,
county level and
state. (Open
Comparisons
report annually
online) showing
providers’ quality
of care to the
elderly based on
the quality
indicators along
with grading of
their performance.
A relative
comparison
between
municipalities is
provided using a
traffic light system.
No information publicly
available.
Unknown Unknown

Ranked quality indicators performance characteristics
Development of quality indicators for in-home aged care PwC 124
Rank
Quality
indicator –
unique
wording
Quality
indicator
description
Quality
indicator
country
Type and
frequency
of data
collection
Key
definitions
of terms
Calculation of
quality indicator
and reporting
methods
Types of home care
services in scope
Use
permitted
under
licence
Multiple
observation
required Risk adjusted
National quality
registers:
Senior Alert
Registry,
Swedish
Palliative
Registry,
Dementia
Register,
Registry on
Behaviour and
Psychiatric
Symptoms.
2.3 Clients with
an updated
care plan
Proportion of
clients with an
updated care
plan
Sweden
Data collected
by the
municipalities
yearly, derived
from national
surveys,
administrative
data, and
registries.
National
surveys: NBHW
survey – What
do the elderly
think about
elderly care?
(from
municipalities
and counties)
Official statistics
(administrative
data): Register
of Social
Technical
definitions of
terms are not
available in the
public domain.
Calculation
methods not
known
Reporting of QI:
Publicly annually
at municipal level,
county level and
state. (Open
Comparisons
report annually
online) showing
providers’ quality
of care to the
elderly based on
the quality
indicators along
with grading of
their performance.
A relative
comparison
between
municipalities is
No information publicly
available
Unknown Unknown

Ranked quality indicators performance characteristics
Development of quality indicators for in-home aged care PwC 125
Rank
Quality
indicator –
unique
wording
Quality
indicator
description
Quality
indicator
country
Type and
frequency
of data
collection
Key
definitions
of terms
Calculation of
quality indicator
and reporting
methods
Types of home care
services in scope
Use
permitted
under
licence
Multiple
observation
required Risk adjusted
Services
Interventions for
the Elderly and
Persons with
Disability,
Patient
Register,
Register of
Medicines
National quality
registers:
Senior Alert
Registry,
Swedish
Palliative
Registry,
Dementia
Register,
Registry on
Behaviour and
Psychiatric
Symptoms.
provided using a
traffic light system.
2.4 Safety
incidents
related to
missed or
late home
care visits
Safety incidents
among older
people related
to missed or
late home care
visits.
UK
Data is
collected
locally. Many of
the QIs are
derived from the
adult social care
survey
(conducted
annually by
local councils)
from which the
social care-
related quality
of life
Technical
definitions of
terms are not
available in the
public domain.
Calculation
methods not
known
Beyond the
information made
available to local
authorities/regulat
ors, relatively little
information about
the quality of
individual home
care in UK is
No information publicly
available
Unknown Unknown

Ranked quality indicators performance characteristics
Development of quality indicators for in-home aged care PwC 126
Rank
Quality
indicator –
unique
wording
Quality
indicator
description
Quality
indicator
country
Type and
frequency
of data
collection
Key
definitions
of terms
Calculation of
quality indicator
and reporting
methods
Types of home care
services in scope
Use
permitted
under
licence
Multiple
observation
required Risk adjusted
(SCRQoL) tool
is derived from
(adult social
care outcomes
toolkit, ASCOT-
SCT4).
made available to
the public.
2.5 Clients with
care plans
that identify
how their
personal
priorities and
outcomes
will be met
Proportion of
older people
using home
care services
whose home
care plan
identifies how
their personal
priorities and
outcomes will
be met
UK
Data is
collected
locally. Many of
the QIs are
derived from the
adult social care
survey
(conducted
annually by
local councils)
from which the
social care-
related quality
of life
(SCRQoL) tool
is derived from
(adult social
care outcomes
toolkit, ASCOT-
SCT4).
Technical
definitions of
terms are not
available in the
public domain.
Calculation
methods not
known
Beyond the
information made
available to local
authorities/
regulators,
relatively little
information about
the quality of
individual home
care in UK is
made available to
the public.
No information publicly
available
Unknown Unknown
2.6 Clients
whose home
care plan
includes
their
personal
priorities and
outcomes
Proportion of
older people
using home
care services
whose home
care plan
includes their
personal
UK
Data is
collected
locally. Many of
the QIs are
derived from the
adult social care
survey
(conducted
annually by
Technical
definitions of
terms are not
available in the
public domain.
Calculation
methods not
known
Beyond the
information made
available to local
authorities/
regulators,
relatively little
No information publicly
available
Unknown Unknown

Ranked quality indicators performance characteristics
Development of quality indicators for in-home aged care PwC 127
Rank
Quality
indicator –
unique
wording
Quality
indicator
description
Quality
indicator
country
Type and
frequency
of data
collection
Key
definitions
of terms
Calculation of
quality indicator
and reporting
methods
Types of home care
services in scope
Use
permitted
under
licence
Multiple
observation
required Risk adjusted
priorities and
outcomes
local councils)
from which the
social care-
related quality
of life
(SCRQoL) tool
is derived from
(adult social
care outcomes
toolkit, ASCOT-
SCT4).
information about
the quality of
individual home
care in UK is
made available to
the public.
2.7 Evidence of
process to
ensure
home care
plans
identify how
personal
priorities and
outcomes of
clients will
be met
Evidence of
local processes
to ensure that
home care
plans for older
people identify
how their
personal
priorities and
outcomes will
be met.
UK
Data is
collected
locally. Many of
the QIs are
derived from the
adult social care
survey
(conducted
annually by
local councils)
from which the
social care-
related quality
of life
(SCRQoL) tool
is derived from
(adult social
care outcomes
toolkit, ASCOT-
SCT4).
Technical
definitions of
terms are not
available in the
public domain.
Calculation
methods not
known
Beyond the
information made
available to local
authorities/
regulators,
relatively little
information about
the quality of
individual home
care in UK is
made available to
the public.
No information publicly
available
Unknown Unknown
2.8 Clients who
have a
review of the
outcomes of
Proportion of
older people
using home
care services
UK
Data is
collected
locally. Many of
the QIs are
Technical
definitions of
terms are not
Calculation
methods not
known
No information publicly
available
Unknown Unknown

Ranked quality indicators performance characteristics
Development of quality indicators for in-home aged care PwC 128
Rank
Quality
indicator –
unique
wording
Quality
indicator
description
Quality
indicator
country
Type and
frequency
of data
collection
Key
definitions
of terms
Calculation of
quality indicator
and reporting
methods
Types of home care
services in scope
Use
permitted
under
licence
Multiple
observation
required Risk adjusted
their home
care plan
within a year
of their
previous
review
who have a
review of the
outcomes of
their home care
plan within a
year of their
previous review.
derived from the
adult social care
survey
(conducted
annually by
local councils)
from which the
social care-
related quality
of life
(SCRQoL) tool
is derived from
(adult social
care outcomes
toolkit, ASCOT-
SCT4).
available in the
public domain.
Beyond the
information made
available to local
authorities/
regulators,
relatively little
information about
the quality of
individual home
care in UK is
made available to
the public.
2.9 Evidence of
process to
ensure
clients have
a review of
the
outcomes of
their home
care plan at
least
annually
Evidence of
local processes
to ensure that
older people
using home
care services
have a review
of the outcomes
of their home
care plan at
least annually.
UK
Data is
collected
locally. Many of
the QIs are
derived from the
adult social care
survey
(conducted
annually by
local councils)
from which the
social care-
related quality
of life
(SCRQoL) tool
is derived from
(adult social
care outcomes
toolkit, ASCOT-
SCT4).
Technical
definitions of
terms are not
available in the
public domain.
Calculation
methods not
known
Beyond the
information made
available to local
authorities/
regulators,
relatively little
information about
the quality of
individual home
care in UK is
made available to
the public.
No information publicly
available
Unknown Unknown

Ranked quality indicators performance characteristics
Development of quality indicators for in-home aged care PwC 129
Rank
Quality
indicator –
unique
wording
Quality
indicator
description
Quality
indicator
country
Type and
frequency
of data
collection
Key
definitions
of terms
Calculation of
quality indicator
and reporting
methods
Types of home care
services in scope
Use
permitted
under
licence
Multiple
observation
required Risk adjusted
2.10 Clients who
have a
review of the
outcomes of
their home
care plan
within 6
weeks of the
service
starting
Proportion of
older people
using home
care services
who have a
review of the
outcomes of
their home care
plan within 6
weeks of the
service starting
UK
Data is
collected
locally. Many of
the QIs are
derived from the
adult social care
survey
(conducted
annually by
local councils)
from which the
social care-
related quality
of life
(SCRQoL) tool
is derived from
(adult social
care outcomes
toolkit, ASCOT-
SCT4).
Technical
definitions of
terms are not
available in the
public domain.
Calculation
methods not
known
Beyond the
information made
available to local
authorities/
regulators,
relatively little
information about
the quality of
individual home
care in UK is
made available to
the public.
No information publicly
available
Unknown Unknown
2.11 Evidence of
process to
ensure that
clients have
a review of
the
outcomes of
their home
care plan
within 6
weeks of the
service
starting
Evidence of
local processes
to ensure that
older people
using home
care services
have a review
of the outcomes
of their home
care plan within
6 weeks of
starting to use
the service.
UK
Data is
collected
locally. Many of
the QIs are
derived from the
adult social care
survey
(conducted
annually by
local councils)
from which the
social care-
related quality
of life
(SCRQoL) tool
is derived from
Technical
definitions of
terms are not
available in the
public domain.
Calculation
methods not
known
Beyond the
information made
available to local
authorities/
regulators,
relatively little
information about
the quality of
individual home
care in UK is
made available to
the public.
No information publicly
available
Unknown Unknown

Ranked quality indicators performance characteristics
Development of quality indicators for in-home aged care PwC 130
Rank
Quality
indicator –
unique
wording
Quality
indicator
description
Quality
indicator
country
Type and
frequency
of data
collection
Key
definitions
of terms
Calculation of
quality indicator
and reporting
methods
Types of home care
services in scope
Use
permitted
under
licence
Multiple
observation
required Risk adjusted
(adult social
care outcomes
toolkit, ASCOT-
SCT4).
2.12 Patients
discharged
to the
community
who do not
have an
unplanned
admission to
an acute
care hospital
or long-term
care hospital
in the
following 31
days and
remain alive
Percentage of
home health
stays in which
patients were
discharged to
the community
and do not have
an unplanned
admission to an
acute care
hospital or
LTCH in the 31
days and
remain alive in
the 31 days
following
discharge to
community.
USA
OASIS based
measures.
(Outcome
Assessment
Information Set
(OASIS-D1)
(Standardized
Patient
Assessments,
non-HER
Electronic
Clinical Data)).
Entry of HH
service and the
last 5 days of
every 60-day
period
beginning with
the start of care
date.
Technical
definitions of
terms are not
available in
public
information.
Numerator:
Number of home
health stays for
patients who do
not have an
unplanned
admission to an
acute care hospital
or LTCH in the 31-
day post-
discharge
observation
window, and who
remain alive
during the post-
discharge
observation
window.
Denominator:
Number of home
health stays that
begin during the 2-
year observation
period.
Reporting of QI:
90 days. Home
Health Quality
Reporting (CMS
and providers)
Applicable to all home care
consumers except those who
are receiving only non-skilled
services; For whom neither
Medicare nor Medicaid is
paying for HH care (patients
receiving care under a
Medicare or Medicaid
Managed Care Plan are not
excluded from the OASIS
reporting requirement
Adjusted for where
appropriate: age,
sex, payment
source, care
start/admission
source, risk of
hospitalisation,
available
assistance, clinical
factors (pain,
pressure ulcer,
stasis ulcer,
dyspnoea, urinary
status, bowel
incontinence,
cognitive function,
anxiety, confusion,
depression
screening,
behavioural
symptoms), ADLs,
medication
management,
supervision/safety
assistance, health
condition
diagnoses.

Ranked quality indicators performance characteristics
Development of quality indicators for in-home aged care PwC 131
Rank
Quality
indicator –
unique
wording
Quality
indicator
description
Quality
indicator
country
Type and
frequency
of data
collection
Key
definitions
of terms
Calculation of
quality indicator
and reporting
methods
Types of home care
services in scope
Use
permitted
under
licence
Multiple
observation
required Risk adjusted
2.13 Evidence of
process to
ensure
clients have
a home care
plan that
identifies
how their
provider will
respond to
missed or
late visits
Evidence of
local processes
to ensure that
older people
using home
care services
have a home
care plan that
identifies how
their home care
provider will
respond to
missed or late
visits.
UK
Data is
collected
locally. Many of
the QIs are
derived from the
adult social care
survey
(conducted
annually by
local councils)
from which the
social care-
related quality
of life
(SCRQoL) tool
is derived from
(adult social
care outcomes
toolkit, ASCOT-
SCT4).
Technical
definitions of
terms are not
available in the
public domain.
Calculation
methods not
known
Beyond the
information made
available to local
authorities/
regulators,
relatively little
information about
the quality of
individual home
care in UK is
made available to
the public.
No information publicly
available
Unknown Unknown
2.14 Planned
home care
visits that
are missed
Proportion of
planned home
care visits for
older people
that are missed.
UK
Data is
collected
locally. Many of
the QIs are
derived from the
adult social care
survey
(conducted
annually by
local councils)
from which the
social care-
related quality
of life
(SCRQoL) tool
is derived from
Technical
definitions of
terms are not
available in the
public domain.
Calculation
methods not
known
Beyond the
information made
available to local
authorities/
regulators,
relatively little
information about
the quality of
individual home
care in UK is
made available to
the public.
No information publicly
available
Unknown Unknown

Ranked quality indicators performance characteristics
Development of quality indicators for in-home aged care PwC 132
Rank
Quality
indicator –
unique
wording
Quality
indicator
description
Quality
indicator
country
Type and
frequency
of data
collection
Key
definitions
of terms
Calculation of
quality indicator
and reporting
methods
Types of home care
services in scope
Use
permitted
under
licence
Multiple
observation
required Risk adjusted
(adult social
care outcomes
toolkit, ASCOT-
SCT4).
2.15 Clients with
a chronic
disease
managemen
t plan
Proportion of
HCP episodes
where clients
received a
chronic disease
management
plan.
Australia113
Claims based
data.
Subsidised
health service
records (MBS).
Technical
definitions of
terms are not
available in the
public domain.
Numerator:
Number of HCP
episodes where
eligible recipients
had a chronic
disease
management plan
(MBS Items 721,
723, 729, 732)
Denominator:
Number of HCP
episodes
Reporting of QI:
To be published
publicly annually
at national level
and provided
privately to
individual facilities
at facility level (SA
only). HCP
episodes
Consumers on Home Care
Packages
Age, sex, number
of comorbidities.
2.16 Clients that
have a
home care
plan that
identifies
Proportion of
older people
using home
care services
who have a
UK
Data is
collected
locally. Many of
the QIs are
derived from the
Technical
definitions of
terms are not
available in the
public domain.
Calculation
methods not
known
Beyond the
information made
No information publicly
available
Unknown Unknown
113 For further information on ROSA derived quality indicators in Australia, please see Inacio et al, 2020 https://academic.oup.com/intqhc/article/32/8/502/5874335?login=true

Ranked quality indicators performance characteristics
Development of quality indicators for in-home aged care PwC 133
Rank
Quality
indicator –
unique
wording
Quality
indicator
description
Quality
indicator
country
Type and
frequency
of data
collection
Key
definitions
of terms
Calculation of
quality indicator
and reporting
methods
Types of home care
services in scope
Use
permitted
under
licence
Multiple
observation
required Risk adjusted
how their
provider will
respond to
missed or
late visits
home care plan
that identifies
how their home
care provider
will respond to
missed or late
visits.
adult social care
survey
(conducted
annually by
local councils)
from which the
social care-
related quality
of life
(SCRQoL) tool
is derived from
(adult social
care outcomes
toolkit, ASCOT-
SCT4).
available to local
authorities/
regulators,
relatively little
information about
the quality of
individual home
care in UK is
made available to
the public.
2.17 Clients who
receive
home care
with risk
prevention
measures
for
malnutrition
Percentage of
older HC people
who receive
home care with
risk prevention
measures for
malnutrition.
Sweden
Data collected
by the
municipalities
yearly, derived
from national
surveys,
administrative
data, and
registries.
National
surveys: NBHW
survey – What
do the elderly
think about
elderly care?
(from
municipalities
and counties)
Official statistics
(administrative
Technical
definitions of
terms are not
available
online.
Calculation
methods are not
known
Publicly annually
at municipal level,
county level and
state. (Open
Comparisons
report annually
online) showing
providers’ quality
of care to the
elderly based on
the quality
indicators along
with grading of
their performance.
A relative
comparison
No information publicly
available
Unknown

Ranked quality indicators performance characteristics
Development of quality indicators for in-home aged care PwC 134
Rank
Quality
indicator –
unique
wording
Quality
indicator
description
Quality
indicator
country
Type and
frequency
of data
collection
Key
definitions
of terms
Calculation of
quality indicator
and reporting
methods
Types of home care
services in scope
Use
permitted
under
licence
Multiple
observation
required Risk adjusted
data): Register
of Social
Services
Interventions for
the Elderly and
Persons with
Disability,
Patient
Register,
Register of
Medicines
National quality
registers:
Senior Alert
Registry,
Swedish
Palliative
Registry,
Dementia
Register,
Registry on
Behaviour and
Psychiatric
Symptoms.
between
municipalities is
provided using a
traffic light system.
2.18 Visits of less
than 30
minutes with
a prior
agreement
that a
shorter visit
is
acceptable
Proportion of
home care visits
to older people
of less than 30
minutes with a
prior agreement
that a shorter
visit is
acceptable
UK
Data is
collected
locally. Many of
the QIs are
derived from the
adult social care
survey
(conducted
annually by
local councils)
from which the
social care-
Technical
definitions of
terms are not
available in the
public domain.
Calculation
methods not
known
Beyond the
information made
available to local
authorities/
regulators,
relatively little
information about
the quality of
No information publicly
available
Unknown Unknown

Ranked quality indicators performance characteristics
Development of quality indicators for in-home aged care PwC 135
Rank
Quality
indicator –
unique
wording
Quality
indicator
description
Quality
indicator
country
Type and
frequency
of data
collection
Key
definitions
of terms
Calculation of
quality indicator
and reporting
methods
Types of home care
services in scope
Use
permitted
under
licence
Multiple
observation
required Risk adjusted
related quality
of life
(SCRQoL) tool
is derived from
(adult social
care outcomes
toolkit, ASCOT-
SCT4).
individual home
care in UK is
made available to
the public.
2.19 Evidence of
process to
ensure
clients have
visits of at
least 30
minutes
unless
otherwise
agreed for a
specific
reason
Evidence of
local processes
to ensure that
older people
using home
care services
have visits of at
least 30
minutes except
when short
visits for
specific tasks or
checks have
been agreed as
part of a wider
package of
support.
UK
Data is
collected
locally. Many of
the QIs are
derived from the
adult social care
survey
(conducted
annually by
local councils)
from which the
social care-
related quality
of life
(SCRQoL) tool
is derived from
(adult social
care outcomes
toolkit, ASCOT-
SCT4).
Technical
definitions of
terms are not
available in the
public domain.
Calculation
methods not
known
Beyond the
information made
available to local
authorities/
regulators,
relatively little
information about
the quality of
individual home
care in UK is
made available to
the public.
No information publicly
available
Unknown Unknown
2.20 Clients who
receive
home care
with risk
prevention
measures
Percentage of
older HC people
who receive
home care with
risk prevention
measures for
pressure ulcers.
Sweden
Data collected
by the
municipalities
yearly, derived
from national
surveys,
administrative
Technical
definitions of
terms are not
available
online.
Calculation
methods are not
known
Publicly annually
at municipal level,
county level and
No information publicly
available
Unknown

Ranked quality indicators performance characteristics
Development of quality indicators for in-home aged care PwC 136
Rank
Quality
indicator –
unique
wording
Quality
indicator
description
Quality
indicator
country
Type and
frequency
of data
collection
Key
definitions
of terms
Calculation of
quality indicator
and reporting
methods
Types of home care
services in scope
Use
permitted
under
licence
Multiple
observation
required Risk adjusted
for pressure
ulcers
data, and
registries.
National
surveys: NBHW
survey – What
do the elderly
think about
elderly care?
(from
municipalities
and counties)
Official statistics
(administrative
data): Register
of Social
Services
Interventions for
the Elderly and
Persons with
Disability,
Patient
Register,
Register of
Medicines
National quality
registers:
Senior Alert
Registry,
Swedish
Palliative
Registry,
Dementia
Register,
Registry on
Behaviour and
state. (Open
Comparisons
report annually
online) showing
providers’ quality
of care to the
elderly based on
the quality
indicators along
with grading of
their performance.
A relative
comparison
between
municipalities is
provided using a
traffic light system.

Ranked quality indicators performance characteristics
Development of quality indicators for in-home aged care PwC 137
Rank
Quality
indicator –
unique
wording
Quality
indicator
description
Quality
indicator
country
Type and
frequency
of data
collection
Key
definitions
of terms
Calculation of
quality indicator
and reporting
methods
Types of home care
services in scope
Use
permitted
under
licence
Multiple
observation
required Risk adjusted
Psychiatric
Symptoms.
2.21 Visits lasting
30 minutes
or longer
Proportion of
home care visits
to older people
lasting 30
minutes or
longer.
UK
Data is
collected
locally. Many of
the QIs are
derived from the
adult social care
survey
(conducted
annually by
local councils)
from which the
social care-
related quality
of life
(SCRQoL) tool
is derived from
(adult social
care outcomes
toolkit, ASCOT-
SCT4).
Technical
definitions of
terms are not
available in the
public domain.
Calculation
methods not
known
Beyond the
information made
available to local
authorities/
regulators,
relatively little
information about
the quality of
individual home
care in UK is
made available to
the public.
No information publicly
available
Unknown Unknown
2.22 Clients who
receive
home care
with risk
prevention
measures
for impaired
oral health
Percentage of
older HC people
who receive
home care with
risk prevention
measures for
impaired oral
health.
Sweden
Data collected
by the
municipalities
yearly, derived
from national
surveys,
administrative
data, and
registries.
National
surveys: NBHW
survey – What
do the elderly
Technical
definitions of
terms are not
available
online.
Calculation
methods are not
known
Publicly annually
at municipal level,
county level and
state. (Open
Comparisons
report annually
online) showing
providers’ quality
of care to the
elderly based on
No information publicly
available
Unknown

Ranked quality indicators performance characteristics
Development of quality indicators for in-home aged care PwC 138
Rank
Quality
indicator –
unique
wording
Quality
indicator
description
Quality
indicator
country
Type and
frequency
of data
collection
Key
definitions
of terms
Calculation of
quality indicator
and reporting
methods
Types of home care
services in scope
Use
permitted
under
licence
Multiple
observation
required Risk adjusted
think about
elderly care?
(from
municipalities
and counties)
Official statistics
(administrative
data): Register
of Social
Services
Interventions for
the Elderly and
Persons with
Disability,
Patient
Register,
Register of
Medicines
National quality
registers:
Senior Alert
Registry,
Swedish
Palliative
Registry,
Dementia
Register,
Registry on
Behaviour and
Psychiatric
Symptoms.
the quality
indicators along
with grading of
their performance.
A relative
comparison
between
municipalities is
provided using a
traffic light system.

Ranked quality indicators performance characteristics
Development of quality indicators for in-home aged care PwC 139
Table 18: Weight loss/Malnutrition/Dehydration
Rank
Quality
indicator –
unique
wording
Quality
indicator
description
Quality
indicator
country
Type and
frequency
of data
collection
Key
definitions
of terms
Calculation of
quality indicator
and reporting
methods
Types of home care
services in scope
Use
permitted
under
licence
Multiple
observation
required Risk adjusted
3.1 Clients who
experienced
weight loss
Percentage of
clients who
experienced
weight loss.
Canada
90 days.
RAI-HC or
interRAI HC,
collected by
designated
assessors,
registered
healthcare
providers, who
have received
training on the
administration
of the tools
Weight Loss:
5% of more
weight loss in
last 30 days or
10% of more
in last 180
days.
Numerator: Total
number of HC
clients who had
5% or more weight
loss in last 30
days or 10% or
more in last 180
days.
Denominator:
Total number of
HC Clients
Reporting of QI:
90 days. HCRS
based on 2
consecutive
quarters (to
ensure min
number of
assessments to
apply risk
adjustment
procedures).
Reported at
National,
Province/Territory
level.
Publicly funded home care
services, including publicly
funded services delivered by
private-sector agencies and
those funded and delivered
by the federal government
(eg Veterans Affairs). Home
care is delivered in the
community in private homes
and residential care settings,
as well as in hospitals and
ambulatory clinics. The
interRAI HC can be used to
assess persons with chronic
needs for care as well as
those with post-acute care
needs (eg after
hospitalization, in a hospital-
at-home situation).
Clients are considered for
specific indicators in line with
their sub-group: acute home
care; end of life;
rehabilitation; long term
supportive; maintenance
client.
RAI-HC
Risk adjustment at
individual client
level (individual
covariates) and
home care
organizational
level (direct
standardization).
3.2 Clients with
unintended
weight loss
at follow-up
Proportion of
HC clients with
any unintended
weight loss at
follow-up.
EU
6 monthly.
Data collected
using RAI-HC
European but
using 2nd
generation
Technical
definitions of
unintended
weight loss are
not publicly
available.
Numerator:
Number of HC
clients with any
unintended weight
loss at follow-up.
Prevalence
indicator.
Information not available in
public materials.
RAI-HC
European
6-monthly
Adjusted for:
clinical risk.

Ranked quality indicators performance characteristics
Development of quality indicators for in-home aged care PwC 140
Rank
Quality
indicator –
unique
wording
Quality
indicator
description
Quality
indicator
country
Type and
frequency
of data
collection
Key
definitions
of terms
Calculation of
quality indicator
and reporting
methods
Types of home care
services in scope
Use
permitted
under
licence
Multiple
observation
required Risk adjusted
European
interRAI HCQIs.
Data collected
by specially
trained
assessors,
usually nurses,
who verify
collected
information that
included direct
interviews of
home care
clients and
family
members, as
well as review
of physician
reports and
medical
records.
Denominator: All
HC clients with a
baseline and
target assessment
Reporting of QI:
Reporting in
publication level
for 7 countries:
Czech Republic,
Denmark, Finland,
Germany, Italy,
and the
Netherlands for
HC recipients.
https://www.ncbi.nl
m.nih.gov/pmc/arti
cles/PMC4647796
/#Sec12"
3.3 Clients with
weight loss
in the last 30
days
Weight loss in
the last 30 days
Japan
Data collected
by service
providers
(nurses or case
managers) and
client/family
members in 30
day look back
period.
Further details
unknown.
Technical
definitions of
terms are not
available in the
public domain.
Calculation details
unknown.
Information not available in
public materials.
Unknown 30-day
lookback
period
Unknown
3.4 Clients who
present to
Emergency
Proportion of
HCP episodes
where clients
Australia
Claims based
data.
(Hospitalisation
Technical
definitions of
terms are not
Numerator:
Number of HCP
episodes where a
Consumers on Home Care
Packages

Ranked quality indicators performance characteristics
Development of quality indicators for in-home aged care PwC 141
Rank
Quality
indicator –
unique
wording
Quality
indicator
description
Quality
indicator
country
Type and
frequency
of data
collection
Key
definitions
of terms
Calculation of
quality indicator
and reporting
methods
Types of home care
services in scope
Use
permitted
under
licence
Multiple
observation
required Risk adjusted
Department
or are
hospitalised
and weight
loss or
malnutrition
were
reported
had any
emergency
department
presentation or
hospitalisation,
where weight
loss or
malnutrition
were reported.
data (unplanned
admissions and
emergency
department
presentations).
12 monthly
available in the
public domain.
client had a
hospitalisation/
emergency
department
presentation
for/with
malnutrition/weight
loss diagnoses
(recorded in any of
the discharge
diagnoses).
Denominator:
Number of HCP
episodes
To be published
publicly annually
at national level
and provided
privately to
individual facilities
at facility level (SA
only).
Age, sex, number
of comorbidities
3.5 Clients with
unintentional
weight loss
(client
reported)
Proportion of
unintentional
weight loss (ie
malnutrition)
reported by the
client.
Netherlands
Self-recording
by care
providers every
year for all
clients.
Technical
definitions of
terms are not
available in the
public domain
Calculation
methods unknown
Care providers’
performance is
monitored, and
governments’
accountability
reports make
information
available to the
public. Public
reporting is
mandatory and
No information in the public
domain
Unknown

Ranked quality indicators performance characteristics
Development of quality indicators for in-home aged care PwC 142
Rank
Quality
indicator –
unique
wording
Quality
indicator
description
Quality
indicator
country
Type and
frequency
of data
collection
Key
definitions
of terms
Calculation of
quality indicator
and reporting
methods
Types of home care
services in scope
Use
permitted
under
licence
Multiple
observation
required Risk adjusted
includes indicators
of care
effectiveness and
safety and user
experiences.
3.6 Clients with
dehydration
Prevalence of
clients who are
dehydrated
Switzerland
Swiss RAI-HC
data are
measured
within a 90-day
period at entry
to home care
services
(baseline) and
calculated six
monthly unless
there is a
significant
clinical change.
Technical
definitions of
terms are not
publicly
available.
Calculation
methods not
known.
The Swiss RAI-HC
QIs only used for
internal quality
management in
non-profit home
care organisations
and there are no
national standards
for home care.
No cantonal
(regions) or
national agencies
are collecting this
data or publicly
report on quality of
care indicators.
Information is not publicly
available.
Swiss RAI-
HC
3.7 Clients with
dehydration
in the last 30
days
Dehydration in
the last 30 days
Japan
Data collected
by service
providers
(nurses or case
managers) and
client/family
members in 30
day look back
period.
Further details
unknown.
Technical
definitions of
terms are not
publicly
available.
Calculation details
unknown.
Information not in the public
domain
Unknown Unknown

Ranked quality indicators performance characteristics
Development of quality indicators for in-home aged care PwC 143
Table 19: Falls and Major Injuries
Rank
Quality
indicator –
unique
wording
Quality
indicator
description
Quality
indicator
country
Type and
frequency
of data
collection
Key
definitions
of terms
Calculation of
quality indicator
and reporting
methods
Types of home care
services in scope
Use
permitted
under
licence
Multiple
observation
required Risk adjusted
4.1 Clients who
fell
Percentage of
clients who fell.
Canada
RAI-HC or
interRAI HC,
collected by
designated
assessors,
registered
healthcare
providers, who
have received
training on the
administration
of the tools.
Fell/Fall:
technical
definition not
publicly
available.
Numerator: Total
number of HC
clients who had a
fall within the past
90 days (current
target
assessment).
Denominator:
Total number of
HC clients
Reporting of QI:
90 days. HCRS
based on 2
consecutive
quarters (to
ensure min
number of
assessments to
apply risk
adjustment
procedures).
Reported at
National,
Province/Territory
level.
Publicly funded home care
services, including publicly
funded services delivered by
private-sector agencies and
those funded and delivered
by the federal government
(eg Veterans Affairs). Home
care is delivered in the
community in private homes
and residential care settings,
as well as in hospitals and
ambulatory clinics. The
interRAI HC can be used to
assess persons with chronic
needs for care as well as
those with post-acute care
needs (eg after
hospitalization, in a hospital-
at-home situation).
Clients are considered for
specific indicators in line with
their sub-group: acute home
care; end of life;
rehabilitation; long term
supportive; maintenance
client.
RAI-HC
Risk adjustment at
individual client
level (individual
covariates) and
home care
organizational
level (direct
standardization).
Stratified by
clinical risk.
4.2 Clients who
experienced
one or more
falls in the
last 90 days
Proportion of
HC clients who
experienced
one or more
falls in the last
90 days.
EU
6 monthly but
falls in 90 days
prior
assessment.
Data collected
using RAI-HC
European but
Technical
definitions of
falls are not
publicly
available.
Numerator:
Number of HC
clients who
experienced one
or more falls in the
last 90 days.
Information not available in
public materials.
RAI-HC
European
Adjusted for: use
of assistive device,
unsteady gait, ADL
hierarchy scale,
age over 80 years.

Ranked quality indicators performance characteristics
Development of quality indicators for in-home aged care PwC 144
Rank
Quality
indicator –
unique
wording
Quality
indicator
description
Quality
indicator
country
Type and
frequency
of data
collection
Key
definitions
of terms
Calculation of
quality indicator
and reporting
methods
Types of home care
services in scope
Use
permitted
under
licence
Multiple
observation
required Risk adjusted
using 2nd
generation
European
interRAI HCQIs.
Data collected
by specially
trained
assessors,
usually nurses,
who verify
collected
information that
included direct
interviews of
home care
clients and
family
members, as
well as review
of physician
reports medical
records.
Prevalence
indicator.
Denominator: All
HC clients with a
target assessment
Reporting in
publication level
for 7 countries:
Czech Republic,
Denmark, Finland,
Germany, Italy,
and the
Netherlands for
HC recipients.
https://www.ncbi.nl
m.nih.gov/pmc/arti
cles/PMC4647796
/#Sec12"
Stratification:
clinical risk
4.3 Clients
experiencing
one or more
falls
requiring
medical
attention
Proportion of
HCP episodes
where clients
experienced
one or more
falls requiring
medical
attention.
Australia
Claims based
data.
(Hospitalisation
data (unplanned
admissions and
emergency
department
presentations)
and national
death index
data).
Technical
definitions of
terms are not
available in the
public domain.
Numerator:
Number of HCP
episodes where
clients had an
emergency
department
presentation,
hospitalisation, or
death, or injury
cause for fall.
Denominator:
Number of HCP
episodes
Consumers on Home Care
Packages
Age, sex,
comorbidities,
dementia, mobility

Ranked quality indicators performance characteristics
Development of quality indicators for in-home aged care PwC 145
Rank
Quality
indicator –
unique
wording
Quality
indicator
description
Quality
indicator
country
Type and
frequency
of data
collection
Key
definitions
of terms
Calculation of
quality indicator
and reporting
methods
Types of home care
services in scope
Use
permitted
under
licence
Multiple
observation
required Risk adjusted
To be published
publicly annually
at national level
and provided
privately to
individual facilities
at facility level (SA
only).
4.4 Clients with
new fall-
related
injuries and
breaks
Percentage of
clients with new
injuries and
breaks
(fractures,
second- or
third-degree
burns or
unexplained
injuries).
Canada
90 days.
RAI-HC or
interRAI HC,
collected by
designated
assessors,
registered
healthcare
providers, who
have received
training on the
administration
of the tools.
Injuries:
fractures,
second or third
degree burns
or unexplained
injuries.
Further
technical
definitions not
available
publicly.
Numerator: HC
clients with a new
injury or break that
occurred in the
past 90 days
(target
assessment).
Denominator: All
HC clients (must
have target
assessment and
had an
assessment 3-15
months prior).
Reporting of QI:
90 days. HCRS
based on 2
consecutive
quarters (to
ensure min
number of
assessments to
apply risk
adjustment
procedures).
Reported at
National,
Publicly funded home care
services, including publicly
funded services delivered by
private-sector agencies and
those funded and delivered
by the federal government
(eg Veterans Affairs). Home
care is delivered in the
community in private homes
and residential care settings,
as well as in hospitals and
ambulatory clinics. The
interRAI HC can be used to
assess persons with chronic
needs for care as well as
those with post-acute care
needs (eg after
hospitalization, in a hospital-
at-home situation).
Clients are considered for
specific indicators in line with
their sub-group: acute home
care; end of life;
rehabilitation; long term
supportive; maintenance
client.
RAI-HC
Risk adjustment at
individual client
level (individual
covariates) and
home care
organizational
level (direct
standardization).
Stratified by
clinical risk.

Ranked quality indicators performance characteristics
Development of quality indicators for in-home aged care PwC 146
Rank
Quality
indicator –
unique
wording
Quality
indicator
description
Quality
indicator
country
Type and
frequency
of data
collection
Key
definitions
of terms
Calculation of
quality indicator
and reporting
methods
Types of home care
services in scope
Use
permitted
under
licence
Multiple
observation
required Risk adjusted
Province/Territory
level.
4.5 Clients
experiencing
at least one
fall-related
fracture
Proportion of
HCP episodes
where clients
experience at
least one
fracture.
Australia
Claims based
data.
(Hospitalisation
data (unplanned
admissions and
emergency
department
presentations).
12 monthly
Technical
definitions of
terms are not
available in the
public domain.
Numerator:
Number of HCP
episodes where
clients had an
emergency
department
presentation or
hospitalisation for
fracture, or
secondary
diagnosis where
onset is not during
the hospitalisation,
the external cause
of the
hospitalisation is
fall, treatment for
which MBS paid
for, and deaths
from fractures.
Denominator:
Number of HCP
episodes
To be published
publicly annually
at national level
and provided
privately to
individual facilities
at facility level (SA
only).
Consumers on Home Care
Packages
Age, sex,
comorbidities,
dementia, mobility,
osteoporosis

Ranked quality indicators performance characteristics
Development of quality indicators for in-home aged care PwC 147
Rank
Quality
indicator –
unique
wording
Quality
indicator
description
Quality
indicator
country
Type and
frequency
of data
collection
Key
definitions
of terms
Calculation of
quality indicator
and reporting
methods
Types of home care
services in scope
Use
permitted
under
licence
Multiple
observation
required Risk adjusted
4.6 Clients with
new fall-
related
injuries
(fractures,
second- or
third-degree
burns,
unexplained
injuries)
Proportion of
HC clients with
new injuries –
fractures,
second- or
third-degree
burns or
unexplained
injuries – since
baseline.
EU
6 monthly.
Data collected
using RAI-HC
European but
using 2nd
generation
European
interRAI HCQIs.
Data collected
by specially
trained
assessors,
usually nurses,
who verify
collected
information that
included direct
interviews of
home care
clients and
family
members, as
well as review
of physician
reports and
medical
records.
Injuries:
fractures,
second or their
degree burns
or unexplained
injuries.
Numerator:
Number of HC
clients with new
injuries –
fractures, second-
or third-degree
burns or
unexplained
injuries – since
baseline.
Prevalence
indicator.
Denominator: All
HC clients with a
target assessment
Reporting in
publication level
for 7 countries:
Czech Republic,
Denmark, Finland,
Germany, Italy,
and the
Netherlands for
HC recipients.
https://www.ncbi.nl
m.nih.gov/pmc/arti
cles/PMC4647796
/#Sec12
Information not available in
public materials.
RAI-HC
European
Adjusted for: ADL
decline, pain,
unsteady gait.
Stratification:
clinical risk.
4.7 Patients
experiencing
one or more
falls with
major injury
Percentage of
quality episodes
in which the
patient
experiences
USA
OASIS based
measures.
(Outcome
Assessment
Information Set
Technical
definitions of
terms are not
available in
Numerator:
Number of quality
episodes in which
the patient
experienced one
Applicable to all home care
consumers except those who
are receiving only non-skilled
services; For whom neither
Medicare nor Medicaid is

Ranked quality indicators performance characteristics
Development of quality indicators for in-home aged care PwC 148
Rank
Quality
indicator –
unique
wording
Quality
indicator
description
Quality
indicator
country
Type and
frequency
of data
collection
Key
definitions
of terms
Calculation of
quality indicator
and reporting
methods
Types of home care
services in scope
Use
permitted
under
licence
Multiple
observation
required Risk adjusted
one or more
falls with major
injury (defined
as bone
fractures, joint
dislocations,
and closed-
head injuries
with altered
consciousness,
or subdural
hematoma)
during the home
health episode.
(OASIS-D1)
(Standardized
Patient
Assessments,
non-HER
Electronic
Clinical Data)).
Entry of HH
service and the
last 5 days of
every 60 day
period
beginning with
the start of care
date.
public
information.
or more falls that
resulted in major
injury during the
episode of care.
Denominator:
Number of home
health quality
episodes ending
with a discharge
during the
reporting period,
other than those
covered by
generic or
measure-specific
exclusions.
90 days. Home
Health Quality
Reporting (CMS
and providers)
paying for HH care (patients
receiving care under a
Medicare or Medicaid
Managed Care Plan are not
excluded from the OASIS
reporting requirement
4.8 Clients who
fall with
trauma (last
30 days)
Fall with trauma
in the last 30
days/from the
last survey to
the present
Japan
Data collected
by service
providers
(nurses or case
managers) and
client/family
members.30
days lookback
period.
Technical
definitions of
terms are not
available
online.
Calculation
method unknown
Unknown Unknown
4.9 Clients with
an incident
of falling
Proportion of
clients with an
incident of
falling.
Netherlands
Self-recording
by care
providers every
year for all
clients.
Technical
definitions of
terms are not
available
online.
Calculation
method unknown
Care providers’
performance is
monitored, and
No information in the public
domain
Unknown Unknown Unknown

Ranked quality indicators performance characteristics
Development of quality indicators for in-home aged care PwC 149
Rank
Quality
indicator –
unique
wording
Quality
indicator
description
Quality
indicator
country
Type and
frequency
of data
collection
Key
definitions
of terms
Calculation of
quality indicator
and reporting
methods
Types of home care
services in scope
Use
permitted
under
licence
Multiple
observation
required Risk adjusted
governments’
accountability
reports make
information
available to the
public. Public
reporting is
mandatory and
includes indicators
of care
effectiveness and
safety and user
experiences.
4.10 Hip fractures
among
people 65
years and
older (3 year
average)
Number of hip
fractures among
people 65 years
and older per
100,000 people,
average values
for the past 3
years.
Sweden
Data collected
by the
municipalities
yearly, derived
from national
surveys,
administrative
data, and
registries.
National
surveys: NBHW
survey – What
do the elderly
think about
elderly care?
(from
municipalities
and counties)
Official statistics
(administrative
data): Register
of Social
Technical
definitions of
terms are not
available
online.
Calculation
methods not
known.
Publicly annually
at municipal level,
county level and
state. (Open
Comparisons
report annually
online) showing
providers’ quality
of care to the
elderly based on
the quality
indicators along
with grading of
their performance.
A relative
comparison
between
municipalities is
No information publicly
available
Unknown Unknown

Ranked quality indicators performance characteristics
Development of quality indicators for in-home aged care PwC 150
Rank
Quality
indicator –
unique
wording
Quality
indicator
description
Quality
indicator
country
Type and
frequency
of data
collection
Key
definitions
of terms
Calculation of
quality indicator
and reporting
methods
Types of home care
services in scope
Use
permitted
under
licence
Multiple
observation
required Risk adjusted
Services
Interventions for
the Elderly and
Persons with
Disability,
Patient
Register,
Register of
Medicines
National quality
registers:
Senior Alert
Registry,
Swedish
Palliative
Registry,
Dementia
Register,
Registry on
Behaviour and
Psychiatric
Symptoms.
provided using a
traffic light system.
4.11 Clients with
fall injuries
admitted to
hospital
among
people 80
years and
older (3 year
average)
Number of
people with fall
injuries per
1,000 people 80
years and older
admitted to
hospital,
average values
for the past 3
years.
Sweden
Data collected
by the
municipalities
yearly, derived
from national
surveys,
administrative
data, and
registries.
National
surveys: NBHW
survey – What
do the elderly
Technical
definitions of
terms are not
available
online.
Calculation
methods not
known.
Publicly annually
at municipal level,
county level and
state. (Open
Comparisons
report annually
online) showing
providers’ quality
of care to the
elderly based on
No information publicly
available
Unknown Unknown

Ranked quality indicators performance characteristics
Development of quality indicators for in-home aged care PwC 151
Rank
Quality
indicator –
unique
wording
Quality
indicator
description
Quality
indicator
country
Type and
frequency
of data
collection
Key
definitions
of terms
Calculation of
quality indicator
and reporting
methods
Types of home care
services in scope
Use
permitted
under
licence
Multiple
observation
required Risk adjusted
think about
elderly care?
(from
municipalities
and counties)
Official statistics
(administrative
data): Register
of Social
Services
Interventions for
the Elderly and
Persons with
Disability,
Patient
Register,
Register of
Medicines
National quality
registers:
Senior Alert
Registry,
Swedish
Palliative
Registry,
Dementia
Register,
Registry on
Behaviour and
Psychiatric
Symptoms.
the quality
indicators along
with grading of
their performance.
A relative
comparison
between
municipalities is
provided using a
traffic light system.

Ranked quality indicators performance characteristics
Development of quality indicators for in-home aged care PwC 152
Table 20: Pressure Injuries/Skin Integrity
Rank
Quality
indicator –
unique
wording
Quality
indicator
description
Quality
indicator
country
Type and
frequency
of data
collection
Key
definitions
of terms
Calculation of
quality indicator
and reporting
methods
Types of home care
services in scope
Use
permitted
under
licence
Multiple
observation
required Risk adjusted
5.1 Percentage
of quality
episodes in
which the
patient has
one or more
Stage 2-4
pressure
ulcers, or an
unstageable
ulcer/injury,
present at
discharge
that are new
or worsened
since the
beginning of
the quality
episode
This
changes in
Jan 2021
and previous
item new or
worsened
pressures
ulcers/injury
is still
reported on
Home
Health
Compare
and 5 star
Percentage of
quality episodes
in which the
patient has one
or more Stage
2-4 pressure
ulcers, or an
unstageable
ulcer/injury,
present at
discharge that
are new or
worsened since
the beginning of
the quality
episode.
USA
OASIS based
measures.
(Outcome
Assessment
Information Set
(OASIS-D1)
(Standardized
Patient
Assessments,
non-HER
Electronic
Clinical Data)).
Entry of HH
service and the
last 5 days of
every 60 day
period
beginning with
the start of care
date.
Collected every
3 months
Technical
definitions of
terms are not
available in
public
information.
Numerator:
Number of
completed quality
episodes for
patients whose
assessment at
discharge
indicates one or
more new or
worsened Stage 2-
4 or unstageable
pressure
ulcers/injuries
compared to the
start or resumption
of care
assessment
Denominator:
Number of home
health quality
episodes ending
with a discharge
during the
reporting period,
other than those
covered by
generic or
measure-specific
exclusions.
90 days. Home
Health Quality
Reporting (CMS
and providers).
Home Health
Applicable to all home care
consumers except those who
are receiving only non-skilled
services; For whom neither
Medicare nor Medicaid is
paying for HH care (patients
receiving care under a
Medicare or Medicaid
Managed Care Plan are not
excluded from the OASIS
reporting requirement
Adjusted for where
appropriate: age,
sex, payment
source, care
start/admission
source, risk of
hospitalisation,
available
assistance, clinical
factors (pain,
pressure ulcer,
stasis ulcer,
dyspnoea, urinary
status, bowel
incontinence,
cognitive function,
anxiety, confusion,
depression
screening,
behavioural
symptoms), ADLs,
medication
management,
supervision/safety
assistance, health
condition
diagnoses.

Ranked quality indicators performance characteristics
Development of quality indicators for in-home aged care PwC 153
Rank
Quality
indicator –
unique
wording
Quality
indicator
description
Quality
indicator
country
Type and
frequency
of data
collection
Key
definitions
of terms
Calculation of
quality indicator
and reporting
methods
Types of home care
services in scope
Use
permitted
under
licence
Multiple
observation
required Risk adjusted
rating
system until
replaced.
Compare (CMS,
providers and
publicly reported
online).
5.2 Clients who
present to
Emergency
Department
or are
hospitalised
with a
pressure
injury
Proportion of
HCP episodes
where clients
had an
emergency
department
presentation or
hospitalisation
where pressure
injury was
reported.
Australia
Claims based
data.
(Hospitalisation
data)
(unplanned
admissions and
emergency
department
presentations).
12 monthly
Technical
definitions of
terms are not
available in the
public domain.
Numerator:
Number of HCP
episodes where
clients had a
hospitalisation or
an emergency
department
presentation
where pressure
injury was
included in any of
the diagnoses and
was not identified
as onset during
hospitalisation
Denominator:
Number of HCP
episodes
To be published
publicly annually
at national level
and provided
privately to
individual facilities
at facility level (SA
only).
Consumers on Home Care
Packages
Age, sex, number
of comorbidities.
Stratified by high
vs low risk of
pressure injury HC
clients.
5.3 Pressure
ulcer or skin
tear in the
last 30 days
Pressure ulcer
or skin tear in
the last 30 days
Japan
Data collected
by service
providers
(nurses or case
Technical
definitions of
terms are not
Calculation
method unknown
information is not publicly
available
Unknown Unknown

Ranked quality indicators performance characteristics
Development of quality indicators for in-home aged care PwC 154
Rank
Quality
indicator –
unique
wording
Quality
indicator
description
Quality
indicator
country
Type and
frequency
of data
collection
Key
definitions
of terms
Calculation of
quality indicator
and reporting
methods
Types of home care
services in scope
Use
permitted
under
licence
Multiple
observation
required Risk adjusted
managers) and
client/family
members.
30 days
lookback
period.
publicly
available.
5.4 Incidence of
clients with
skin ulcer
Incidence of
clients with skin
ulcer
Switzerland
Swiss RAI-HC
data are
measured
within a 90-day
period at entry
to home care
services
(baseline) and
calculated six
monthly unless
there is a
significant
clinical change.
Technical
definitions of
terms are not
publicly
available.
Calculation
methods unknown
The Swiss RAI-HC
quality indicators
only used for
internal quality
management in
non-profit home
care organisations
and there are no
national standards
for home care.
No cantonal
(regions) or
national agencies
are collecting this
data or publicly
report on quality of
care indicators.
Information is not publicly
available
Swiss RAI-
HC
5.5 Proportion of
clients with a
pressure
ulcer
Proportion of
clients with a
pressure ulcer.
Netherlands
Self-recording
by care
providers every
year for all
clients.
Technical
definitions of
terms are not
publicly
available.
Calculation
methods unknown
Care providers’
performance is
monitored, and
governments’
accountability
reports make
Information is not publicly
available
Unknown Unknown

Ranked quality indicators performance characteristics
Development of quality indicators for in-home aged care PwC 155
Rank
Quality
indicator –
unique
wording
Quality
indicator
description
Quality
indicator
country
Type and
frequency
of data
collection
Key
definitions
of terms
Calculation of
quality indicator
and reporting
methods
Types of home care
services in scope
Use
permitted
under
licence
Multiple
observation
required Risk adjusted
information
available to the
public. Public
reporting is
mandatory and
includes indicators
of care
effectiveness and
safety and user
experiences.

Ranked quality indicators performance characteristics
Development of quality indicators for in-home aged care PwC 156
Table 21: Workforce
Rank
Quality
indicator –
unique
wording
Quality
indicator
description
Quality
indicator
country
Type and
frequency
of data
collection
Key
definitions
of terms
Calculation of
quality indicator
and reporting
methods
Types of home care
services in scope
Use
permitted
under
licence
Multiple
observation
required Risk adjusted
6.1 Responsiven
ess of staff,
safety living
at home,
and
confidence
in staff
Percentage of
older HC people
who answered
positively to the
three questions.
a. Do the staff
respond well to
you?
b. How safe or
insecure does it
feel to live at
home with
support from
the home
service?
3. Do you feel
confident about
the staff coming
home to you?
Sweden
Data collected
by the
municipalities
yearly, derived
from national
surveys,
administrative
data, and
registries.
National
surveys: NBHW
survey – What
do the elderly
think about
elderly care?
(from
municipalities
and counties)
Official statistics
(administrative
data): Register
of Social
Services
Interventions for
the Elderly and
Persons with
Disability,
Patient
Register,
Register of
Medicines
National quality
registers:
Senior Alert
Technical
definitions of
terms are not
available
online.
Calculation
methods unknown
Publicly annually
at municipal level,
county level and
state. (Open
Comparisons
report annually
online) showing
providers’ quality
of care to the
elderly based on
the quality
indicators along
with grading of
their performance.
A relative
comparison
between
municipalities is
provided using a
traffic light system.
No information publicly
available
Unknown Unknown

Ranked quality indicators performance characteristics
Development of quality indicators for in-home aged care PwC 157
Rank
Quality
indicator –
unique
wording
Quality
indicator
description
Quality
indicator
country
Type and
frequency
of data
collection
Key
definitions
of terms
Calculation of
quality indicator
and reporting
methods
Types of home care
services in scope
Use
permitted
under
licence
Multiple
observation
required Risk adjusted
Registry,
Swedish
Palliative
Registry,
Dementia
Register,
Registry on
Behaviour and
Psychiatric
Symptoms.
6.2 Number of
home care
workers
providing
care to an
older person
Total number of
home care
workers
providing care
to an older
person using
home care
services
UK
12 monthly.
Data is
collected
locally. Many of
the QIs are
derived from the
adult social care
survey
(conducted
annually by
local councils)
from which the
social care-
related quality
of life
(SCRQoL) tool
is derived from
(adult social
care outcomes
toolkit, ASCOT-
SCT4).
Technical
definitions of
terms are not
available in the
public domain.
Calculation
methods unknown
Beyond the
information made
available to local
authorities/
regulators,
relatively little
information about
the quality of
individual home
care in UK is
made available to
the public.
No information publicly
available
Unknown Unknown
6.3 Staff helping
a client in
14-day
Average
number of
home services
personnel
Sweden
Data collected
by the
municipalities
yearly, derived
Technical
definitions of
terms are not
Calculation
methods unknown
No further information
publicly available
Unknown Unknown

Ranked quality indicators performance characteristics
Development of quality indicators for in-home aged care PwC 158
Rank
Quality
indicator –
unique
wording
Quality
indicator
description
Quality
indicator
country
Type and
frequency
of data
collection
Key
definitions
of terms
Calculation of
quality indicator
and reporting
methods
Types of home care
services in scope
Use
permitted
under
licence
Multiple
observation
required Risk adjusted
period
(average)
helping in 14
days.
from national
surveys,
administrative
data, and
registries.
National
surveys: NBHW
survey – What
do the elderly
think about
elderly care?
(from
municipalities
and counties)
Official statistics
(administrative
data): Register
of Social
Services
Interventions for
the Elderly and
Persons with
Disability,
Patient
Register,
Register of
Medicines
National quality
registers:
Senior Alert
Registry,
Swedish
Palliative
Registry,
Dementia
Register,
available
online.
Publicly annually
at municipal level,
county level and
state. (Open
Comparisons
report annually
online) showing
providers’ quality
of care to the
elderly based on
the quality
indicators along
with grading of
their performance.
A relative
comparison
between
municipalities is
provided using a
traffic light system.

Ranked quality indicators performance characteristics
Development of quality indicators for in-home aged care PwC 159
Rank
Quality
indicator –
unique
wording
Quality
indicator
description
Quality
indicator
country
Type and
frequency
of data
collection
Key
definitions
of terms
Calculation of
quality indicator
and reporting
methods
Types of home care
services in scope
Use
permitted
under
licence
Multiple
observation
required Risk adjusted
Registry on
Behaviour and
Psychiatric
Symptoms.
6.4 Staff
retention
Staff retention
among home
care workers
UK
12 monthly.
Data is
collected
locally. Many of
the QIs are
derived from the
adult social care
survey
(conducted
annually by
local councils)
from which the
social care-
related quality
of life
(SCRQoL) tool
is derived from
(adult social
care outcomes
toolkit, ASCOT-
SCT4).
Technical
definitions of
terms are not
available in the
public domain.
Calculation
methods not
known
Beyond the
information made
available to local
authorities/
regulators,
relatively little
information about
the quality of
individual home
care in UK is
made available to
the public.
No information publicly
available
Unknown Unknown
6.5 Visits for
each client
per home
care worker
The average
number of
home care visits
each older
person receives
per home care
worker.
UK
12 monthly.
Data is
collected
locally. Many of
the QIs are
derived from the
adult social care
survey
(conducted
annually by
Technical
definitions of
terms are not
available in the
public domain.
Calculation
methods not
known
Beyond the
information made
available to local
authorities/
regulators,
relatively little
information about
No information publicly
available
Unknown Unknown

Ranked quality indicators performance characteristics
Development of quality indicators for in-home aged care PwC 160
Rank
Quality
indicator –
unique
wording
Quality
indicator
description
Quality
indicator
country
Type and
frequency
of data
collection
Key
definitions
of terms
Calculation of
quality indicator
and reporting
methods
Types of home care
services in scope
Use
permitted
under
licence
Multiple
observation
required Risk adjusted
local councils)
from which the
social care-
related quality
of life
(SCRQoL) tool
is derived from
(adult social
care outcomes
toolkit, ASCOT-
SCT4).
the quality of
individual home
care in UK is
made available to
the public.
6.6 Evidence of
processes to
ensure
consistent
team of
workers for
each client
Evidence of
local processes
to ensure that
older people
using home
care services
receive care
from a
consistent team
of home care
workers who
are familiar with
their needs.
UK
12 monthly.
Data is
collected
locally. Many of
the QIs are
derived from the
adult social care
survey
(conducted
annually by
local councils)
from which the
social care-
related quality
of life
(SCRQoL) tool
is derived from
(adult social
care outcomes
toolkit, ASCOT-
SCT4).
Technical
definitions of
terms are not
available in the
public domain.
Calculation
methods not
known
Beyond the
information made
available to local
authorities/
regulators,
relatively little
information about
the quality of
individual home
care in UK is
made available to
the public.
No information publicly
available
Unknown Unknown
6.7 Evidence of
supervision
discussions
Evidence of
local processes
to ensure that
UK
12 monthly.
Data is
collected
Technical
definitions of
terms are not
Calculation
methods not
known
No information publicly
available
Unknown Unknown

Ranked quality indicators performance characteristics
Development of quality indicators for in-home aged care PwC 161
Rank
Quality
indicator –
unique
wording
Quality
indicator
description
Quality
indicator
country
Type and
frequency
of data
collection
Key
definitions
of terms
Calculation of
quality indicator
and reporting
methods
Types of home care
services in scope
Use
permitted
under
licence
Multiple
observation
required Risk adjusted
with home
care workers
(every 3
months)
home care
providers have
practice-based
supervision
discussions with
home care
workers at least
every 3 months.
locally. Many of
the QIs are
derived from the
adult social care
survey
(conducted
annually by
local councils)
from which the
social care-
related quality
of life
(SCRQoL) tool
is derived from
(adult social
care outcomes
toolkit, ASCOT-
SCT4).
available in the
public domain.
Beyond the
information made
available to local
authorities/
regulators,
relatively little
information about
the quality of
individual home
care in UK is
made available to
the public.
6.8 Workers
who had a
supervision
discussion
(within 3
months)
Proportion of
home care
workers
supporting older
people who had
a practice-
based
supervision
discussion
within the past 3
months.
UK
12 monthly.
Data is
collected
locally. Many of
the QIs are
derived from the
adult social care
survey
(conducted
annually by
local councils)
from which the
social care-
related quality
of life
(SCRQoL) tool
is derived from
(adult social
Technical
definitions of
terms are not
available in the
public domain.
Calculation
methods not
known
Beyond the
information made
available to local
authorities/
regulators,
relatively little
information about
the quality of
individual home
care in UK is
made available to
the public.
No information publicly
available
Unknown Unknown

Ranked quality indicators performance characteristics
Development of quality indicators for in-home aged care PwC 162
Rank
Quality
indicator –
unique
wording
Quality
indicator
description
Quality
indicator
country
Type and
frequency
of data
collection
Key
definitions
of terms
Calculation of
quality indicator
and reporting
methods
Types of home care
services in scope
Use
permitted
under
licence
Multiple
observation
required Risk adjusted
care outcomes
toolkit, ASCOT-
SCT4).

Ranked quality indicators performance characteristics
Development of quality indicators for in-home aged care PwC 163
Table 22: Pain
Rank
Quality
indicator –
unique
wording
Quality
indicator
description
Quality
indicator
country
Type and
frequency
of data
collection
Key
definitions
of terms
Calculation of
quality indicator
and reporting
methods
Types of home care
services in scope
Use
permitted
under
licence
Multiple
observation
required Risk adjusted
7.1 Clients who
complained
or showed
evidence of
daily pain
This indicator
measures the
percentage of
long-stay home
care clients who
complained or
showed
evidence of
daily pain,
among clients
who received
home care
services for
more than 60
days.
Canada
Data are based
on information
in the Home
Care Reporting
System from
mandatory
Resident
Assessment
Instrument –
Home Care
(RAI-HC)
assessments.
Jurisdictions
differ in their
requirements
for RAI-HC
assessment
frequency
Pain: no pain,
less than daily,
daily (one
period) or daily
(multiple
periods)
Numerator: The
number of long-
stay home care
clients who
complained or
showed evidence
of moderate or
severe daily pain.
Denominator: The
number of long-
stay home care
clients
Reporting of QI:
Public reporting
Publicly funded home care
services, including publicly
funded services delivered by
private-sector agencies and
those funded and delivered
by the federal government
(eg Veterans Affairs). Home
care is delivered in the
community in private homes
and residential care settings,
as well as in hospitals and
ambulatory clinics. The
interRAI HC can be used to
assess persons with chronic
needs for care as well as
those with post-acute care
needs (eg after
hospitalization, in a hospital-
at-home situation).
Clients are considered for
specific indicators in line with
their sub-group: acute home
care; end of life;
rehabilitation; long term
supportive; maintenance
client.
RAI-HC
Risk adjusted
using following
covariates:
age≥65; 12 months
or less between
assessments; CPS
+1; IADL difficulty
& locomotion
difficulty; decision
making difficulty;
sadness; ADL
decline; poor
health; unstable
condition; hospital
stays. Reported
Levels of
comparability/
stratifications by
region, time.
7.2 Clients with
pain (on
pain
medication
or no pain
medication)
Percentage of
clients with
pain, on
medication or
no pain
medication.
Pain frequency
(pain present)
Canada
90 days (pain
determined in 3
days prior target
assessment)
from RAI-HC or
interRAI HC,
collected by
designated
Pain
frequency: no
pain, less than
daily, daily
(one period) or
daily (multiple
periods)
Numerator: Total
number of HC
clients who had
pain and were on
pain medication or
were not on pain
Publicly funded home care
services, including publicly
funded services delivered by
private-sector agencies and
those funded and delivered
by the federal government
(eg Veterans Affairs). Home
care is delivered in the
RAI-HC
Risk adjustment at
individual client
level (individual
covariates) and
home care
organizational

Ranked quality indicators performance characteristics
Development of quality indicators for in-home aged care PwC 164
Rank
Quality
indicator –
unique
wording
Quality
indicator
description
Quality
indicator
country
Type and
frequency
of data
collection
Key
definitions
of terms
Calculation of
quality indicator
and reporting
methods
Types of home care
services in scope
Use
permitted
under
licence
Multiple
observation
required Risk adjusted
and pain
intensity
(moderate to
horrible/
excruciating
pain) Pain
Scale.
assessors,
registered
healthcare
providers, who
have received
training on the
administration
of the tools.
Pain intensity:
no pain, mild,
moderate,
severe, time
when pain is
horrible/excruc
iating.
medication in last
3 days.
Denominator:
Total number of
HC clients.
Reporting of QI:
90 days. HCRS
based on 2
consecutive
quarters (to
ensure min
number of
assessments to
apply risk
adjustment
procedures).
Reported at
National,
Province/Territory
level.
community in private homes
and residential care settings,
as well as in hospitals and
ambulatory clinics. The
interRAI HC can be used to
assess persons with chronic
needs for care as well as
those with post-acute care
needs (eg after
hospitalization, in a hospital-
at-home situation).
level (direct
standardization).
7.3 Clients who
have pain
and are
receiving
inadequate
pain control
or no pain
medication
Proportion of
HC clients who
have pain and
are receiving
inadequate pain
control or no
pain
medication.
EU
6 monthly
Data collected
using RAI-HC
European but
using 2nd
generation
European
interRAI HCQIs.
Data collected
by specially
trained
assessors,
usually nurses,
who verify
collected
Technical
definitions of
inadequate
and pain are
not publicly
available.
Numerator:
Number of HC
clients who have
pain and are
receiving
inadequate pain
control or no pain
medication.
Prevalence
indicator.
Denominator: All
HC clients with a
target assessment
Reporting in
publication level
European
interRAI
HCQIs
Adjusted for:
clinical risk

Ranked quality indicators performance characteristics
Development of quality indicators for in-home aged care PwC 165
Rank
Quality
indicator –
unique
wording
Quality
indicator
description
Quality
indicator
country
Type and
frequency
of data
collection
Key
definitions
of terms
Calculation of
quality indicator
and reporting
methods
Types of home care
services in scope
Use
permitted
under
licence
Multiple
observation
required Risk adjusted
information that
included direct
interviews of
home care
clients and
family
members, as
well as review
of physician
reports and
medical
records.
for 7 countries:
Czech Republic,
Denmark, Finland,
Germany, Italy,
and the
Netherlands for
HC recipients.
https://www.ncbi.nl
m.nih.gov/pmc/arti
cles/PMC4647796
/#Sec12
7.4 Clients with
at least daily
episodes of
severe pain
at follow up
Number of HC
clients with at
least daily
episodes of
severe pain at
follow-up (within
past 7 days).
Prevalence
indicator.
EU
6 monthly but
pain assessed
in 7 days prior.
Data collected
using RAI-HC
European but
using 2nd
generation
European
interRAI HCQIs.
Data collected
by specially
trained
assessors,
usually nurses,
who verify
collected
information that
included direct
interviews of
home care
clients and
family
Technical
definitions of
severe and
pain are not
publicly
available.
Numerator:
Number of HC
clients with at least
daily episodes of
severe pain at
follow-up (within
past 7 days).
Prevalence
indicator.
Denominator: All
HC clients with a
target assessment
Reporting in
publication level
for 7 countries:
Czech Republic,
Denmark, Finland,
Germany, Italy,
and the
Netherlands for
HC recipients.
https://www.ncbi.nl
m.nih.gov/pmc/arti
European
interRAI
HCQIs
Adjusted for:
dyspnoea,
unsteady gait, ADL
long form score,
ADL short form
score, depression
rating scale score.
Stratification:
clinical risk.

Ranked quality indicators performance characteristics
Development of quality indicators for in-home aged care PwC 166
Rank
Quality
indicator –
unique
wording
Quality
indicator
description
Quality
indicator
country
Type and
frequency
of data
collection
Key
definitions
of terms
Calculation of
quality indicator
and reporting
methods
Types of home care
services in scope
Use
permitted
under
licence
Multiple
observation
required Risk adjusted
members, as
well as review
of physician
reports and
medical
records.
cles/PMC4647796
/#Sec12
7.5 Clients with
daily pain
(over 3
days)
Percentage of
clients with daily
pain (Pain
Scale) last 3
days.
Canada
90 days (pain
determined in 3
days prior target
assessment)
from RAI-HC or
interRAI HC,
collected by
designated
assessors,
registered
healthcare
providers, who
have received
training on the
administration
of the tools.
Pain scale: no
pain, mild,
moderate,
severe, time
when pain is
horrible/excruc
iating.
Numerator: Total
number of HC
clients who had
daily pain in past 3
days from target
assessment
Denominator:
Total number of
HC clients
90 days. HCRS
based on 2
consecutive
quarters (to
ensure min
number of
assessments to
apply risk
adjustment
procedures).
Reported at
National,
Province/Territory
level.
Publicly funded home care
services, including publicly
funded services delivered by
private-sector agencies and
those funded and delivered
by the federal government
(eg Veterans Affairs). Home
care is delivered in the
community in private homes
and residential care settings,
as well as in hospitals and
ambulatory clinics. The
interRAI HC can be used to
assess persons with chronic
needs for care as well as
those with post-acute care
needs (eg after
hospitalization, in a hospital-
at-home situation).
Clients are considered for
specific indicators in line with
their sub-group: acute home
care; end of life;
rehabilitation; long term
supportive; maintenance
client.
RAI HC
Risk adjustment at
individual client
level (individual
covariates) and
home care
organizational
level (direct
standardization).
Stratified by
clinical risk.

Ranked quality indicators performance characteristics
Development of quality indicators for in-home aged care PwC 167
Rank
Quality
indicator –
unique
wording
Quality
indicator
description
Quality
indicator
country
Type and
frequency
of data
collection
Key
definitions
of terms
Calculation of
quality indicator
and reporting
methods
Types of home care
services in scope
Use
permitted
under
licence
Multiple
observation
required Risk adjusted
7.6 Clients with
inadequate
pain control
Prevalence of
clients with
inadequate pain
control
(prevalence).
Switzerland
Swiss RAI-HC
data are
measured
within a 90-day
period at entry
to home care
services
(baseline) and
calculated six
monthly unless
there is a
significant
clinical change.
Technical
definitions of
terms are not
publicly
available.
Calculation
methods unknown
The Swiss RAI-HC
quality indicators
only used for
internal quality
management in
non-profit home
care organisations
and there are no
national standards
for home care.
No cantonal
(regions) or
national agencies
are collecting this
data or publicly
report on quality of
care indicators.
Information is not publicly
available.
Swiss RAI-
HC
7.7 Clients with
a reduction
in pain
Proportion of
HC clients with
a reduction in
pain since
baseline.
Incidence
indicator.
EU
6 monthly
Data collected
using RAI-HC
European but
using 2nd
generation
European
interRAI HCQIs.
Data collected
by specially
trained
assessors,
usually nurses,
who verify
collected
information that
Technical
definitions of
reduction and
pain are not
publicly
available.
Numerator:
Number of HC
clients who have a
reduction in pain
since baseline.
Incidence
indicator.
Denominator: All
HC clients with
pain at baseline
and both baseline
and target
assessment (at 6
months).
Reporting in
publication level
Information is not publicly
available.
European
interRAI
HCQIs
Adjusted for:
unsteady gait,
Cognitive
Performance Scale
score.
Stratification:
clinical risk

Ranked quality indicators performance characteristics
Development of quality indicators for in-home aged care PwC 168
Rank
Quality
indicator –
unique
wording
Quality
indicator
description
Quality
indicator
country
Type and
frequency
of data
collection
Key
definitions
of terms
Calculation of
quality indicator
and reporting
methods
Types of home care
services in scope
Use
permitted
under
licence
Multiple
observation
required Risk adjusted
included direct
interviews of
home care
clients and
family
members, as
well as review
of physician
reports medical
records.
for 7 countries:
Czech Republic,
Denmark, Finland,
Germany, Italy,
and the
Netherlands for
HC recipients.
https://www.ncbi.nl
m.nih.gov/pmc/arti
cles/PMC4647796
/#Sec12
7.8 Clients
whose pain
improved
Incidence of
clients whose
pain improved
from prior
assessment
(incidence).
Switzerland
Swiss RAI-HC
data are
measured
within a 90-day
period at entry
to home care
services
(baseline) and
calculated six
monthly unless
there is a
significant
clinical change.
Technical
definitions of
terms are not
publicly
available.
Calculation
methods unknown
The Swiss RAI-HC
QIs only used for
internal quality
management in
non-profit home
care organisations
and there are no
national standards
for home care.
No cantonal
(regions) or
national agencies
are collecting this
data or publicly
report on quality of
care indicators.
Information is not publicly
available.
Swiss RAI-
HC

Ranked quality indicators performance characteristics
Development of quality indicators for in-home aged care PwC 169
Rank
Quality
indicator –
unique
wording
Quality
indicator
description
Quality
indicator
country
Type and
frequency
of data
collection
Key
definitions
of terms
Calculation of
quality indicator
and reporting
methods
Types of home care
services in scope
Use
permitted
under
licence
Multiple
observation
required Risk adjusted
7.9 Clients with
daily severe
pain
Prevalence of
clients with daily
severe pain
Switzerland
Swiss RAI-HC
data are
measured
within a 90-day
period at entry
to home care
services
(baseline) and
calculated six
monthly unless
there is a
significant
clinical change.
Technical
definitions of
terms are not
publicly
available.
Calculation
methods unknown
The Swiss RAI-HC
QIs only used for
internal quality
management in
non-profit home
care organisations
and there are no
national standards
for home care.
No cantonal
(regions) or
national agencies
are collecting this
data or publicly
report on quality of
care indicators.
Information is not publicly
available.
Swiss RAI-
HC

Ranked quality indicators performance characteristics
Development of quality indicators for in-home aged care PwC 170
Table 23: Hospitalisations (Including Emergency Department Presentations)
Rank
Quality
indicator –
unique
wording
Quality
indicator
description
Quality
indicator
country
Type and
frequency
of data
collection
Key
definitions
of terms
Calculation of
quality indicator
and reporting
methods
Types of home care
services in scope
Use
permitted
under
licence
Multiple
observation
required Risk adjusted
9.1 Emergency
Department
presentation
within 30
days of
discharge
from hospital
Proportion of
HCP episodes
where clients
who were
hospitalised had
an emergency
department
presentation
within 30 days
of discharge.
Australia
Claims based
data.
(Hospitalisation
data (unplanned
admissions and
emergency
department
presentations).
Technical
definitions of
terms are not
available in the
public domain.
Numerator:
Number of aged
care recipients
who had an
emergency
department
presentation within
30 days of
entry/re-entry to
residential aged
care facility (>1
day after entry).
Denominator:
Number of HCP
episodes where
clients had been
hospitalised
Claims based
data.
(Hospitalisation
data (unplanned
admissions and
emergency
department
presentations).
12 monthly.
Consumers on Home Care
Packages
Age, sex, number
of comorbidities,
unplanned
hospitalisations in
12 months prior,
total length of stay.
9.2 Emergency
Department
visits by new
home care
clients in 30
days after
This is the
percentage of
new publicly
funded home
care clients, of
all ages, who
had an
Canada
Claims based
data.
Home Care
Database
(HCD), National
Ambulatory
Care Reporting
Emergency
department:
includes
counts of visits
to emergency
rooms
including those
Numerator: The
number of
unscheduled
emergency
department visits
by home care
clients newly
Publicly funded home care
services, including publicly
funded services delivered by
private-sector agencies and
those funded and delivered
by the federal government
(eg Veterans Affairs). Home
RAI-HC
Risk adjustment at
individual client
level (individual
covariates) and
home care
organizational

Ranked quality indicators performance characteristics
Development of quality indicators for in-home aged care PwC 171
Rank
Quality
indicator –
unique
wording
Quality
indicator
description
Quality
indicator
country
Type and
frequency
of data
collection
Key
definitions
of terms
Calculation of
quality indicator
and reporting
methods
Types of home care
services in scope
Use
permitted
under
licence
Multiple
observation
required Risk adjusted
leaving
hospital
unplanned
emergency
department visit
in 30 days after
leaving hospital.
A lower
percentage of
clients is better.
System
(NACRS),
Registered
Persons
Database
(RPDB)
that did and
did not result
in a hospital
inpatient
admission.
referred to home
care services
within 30 days of
initial hospital
discharge.
Denominator: The
number of clients
referred to home
care from hospital
who were
discharged from
hospital and
received their first
home care service
visit within the time
period of interest
Reporting of QI:
Public reporting
care is delivered in the
community in private homes
and residential care settings,
as well as in hospitals and
ambulatory clinics. The
interRAI HC can be used to
assess persons with chronic
needs for care as well as
those with post-acute care
needs (eg after
hospitalization, in a hospital-
at-home situation).
Clients are considered for
specific indicators in line with
their sub-group: acute home
care; end of life;
rehabilitation; long term
supportive; maintenance
client.
level (direct
standardization).
9.3 Patients who
had a
potentially
preventable
30 day post-
discharge
readmission
Percentage of
home health
stays in which
patients who
had an acute
inpatient
discharge within
the 30 days
before the start
of their home
health stay and
were admitted
to an acute care
hospital or
LTCH for
unplanned,
potentially
.
USA
Claims-data.
Medicare
90 days
Technical
definitions of
terms are not
available in
public
information.
Numerator:
Number of home
health stays for
patients who have
a Medicare claim
for unplanned,
potentially
preventable
readmissions in
the 30-day window
beginning two
days after home
health discharge.
Denominator:
Number of home
health stays that
Applicable to all home care
consumers except those who
are receiving only non-skilled
services ;For whom neither
Medicare nor Medicaid is
paying for HH care (patients
receiving care under a
Medicare or Medicaid
Managed Care Plan are not
excluded from the OASIS
reporting requirement
Adjusted for where
appropriate:
service factors,
provider factors,
demographic
factors, and clinical
factors.

Ranked quality indicators performance characteristics
Development of quality indicators for in-home aged care PwC 172
Rank
Quality
indicator –
unique
wording
Quality
indicator
description
Quality
indicator
country
Type and
frequency
of data
collection
Key
definitions
of terms
Calculation of
quality indicator
and reporting
methods
Types of home care
services in scope
Use
permitted
under
licence
Multiple
observation
required Risk adjusted
preventable
readmissions in
the 30-day
window
beginning two
days after home
health
discharge.
begin during the 3-
year observation
period for patients
who had an acute
inpatient hospital
discharge within
the 30 days prior
to the start of the
HH stay and were
discharged to the
community from
HH.
90 days. Claims-
data. Medicare.
9.4 Clients who
require
hospital stay
or
Emergency
Department
care
Percentage of
clients who
required
hospital stay or
emergency
department
care.
Canada
90 days.
RAI-HC or
interRAI HC,
collected by
designated
assessors,
registered
healthcare
providers, who
have received
training on the
administration
of the tools
Unplanned:
Technical
definitions not
available
publicly.
Numerator: HC
clients with an
overnight hospital
stay, emergency
department visit in
the target
assessment.
Denominator:
Total number of
HC clients.
Reporting of QI:
90 days. HCRS
based on 2
consecutive
quarters (to
ensure min
number of
assessments to
apply risk
adjustment
procedures).
Publicly funded home care
services, including publicly
funded services delivered by
private-sector agencies and
those funded and delivered
by the federal government
(eg Veterans Affairs). Home
care is delivered in the
community in private homes
and residential care settings,
as well as in hospitals and
ambulatory clinics. The
interRAI HC can be used to
assess persons with chronic
needs for care as well as
those with post-acute care
needs (eg after
hospitalization, in a hospital-
at-home situation).
Clients are considered for
specific indicators in line with
RAI-HC
Risk adjustment at
individual client
level (individual
covariates)
specifically daily
decision making
ability (cognitive
skills) and home
care organizational
level (direct
standardization).
Stratified by IADL
capacity scale
score."

Ranked quality indicators performance characteristics
Development of quality indicators for in-home aged care PwC 173
Rank
Quality
indicator –
unique
wording
Quality
indicator
description
Quality
indicator
country
Type and
frequency
of data
collection
Key
definitions
of terms
Calculation of
quality indicator
and reporting
methods
Types of home care
services in scope
Use
permitted
under
licence
Multiple
observation
required Risk adjusted
Reported at
National,
Province/Territory
level.
their sub-group: acute home
care; end of life;
rehabilitation; long term
supportive; maintenance
client.
9.5 Hospitalisati
on or
Emergency
Department
use in the
90-day
period
before
follow-up
assessment
Proportion of
HC clients who
have been
hospitalised or
visited the
emergency
department in
the 90 day
period before
the follow-up
assessment.
EU
6 monthly.
Hospitalisations
in the past 90
days.
Data collected
using RAI-HC
European but
using 2nd
generation
European
interRAI HCQIs.
Data collected
by specially
trained
assessors,
usually nurses,
who verify
collected
information that
included direct
interviews of
home care
clients and
family
members, as
well as review
of physician
reports medical
records.
Technical
definitions of
emergency
department
and
hospitalisation
s are not
publicly
available.
Numerator:
Number of HC
clients who have
been hospitalised
or visited the
emergency
department in the
90 day period
before the follow-
up assessment.
Prevalence
indicator.
Denominator: All
HC clients with a
target
assessment.
Reporting of QI:
Reporting in
publication level
for 7 countries:
Czech Republic,
Denmark, Finland,
Germany, Italy,
and the
Netherlands for
HC recipients.
https://www.ncbi.nl
m.nih.gov/pmc/arti
cles/PMC4647796
/#Sec12
Information is not publicly
available.
European
interRAI
HCQIs
Adjusted for:
physician visits,
clinical risk,
diabetes,
depression rating
scale score.
Stratification: IADL
capacity scale
score

Ranked quality indicators performance characteristics
Development of quality indicators for in-home aged care PwC 174
Rank
Quality
indicator –
unique
wording
Quality
indicator
description
Quality
indicator
country
Type and
frequency
of data
collection
Key
definitions
of terms
Calculation of
quality indicator
and reporting
methods
Types of home care
services in scope
Use
permitted
under
licence
Multiple
observation
required Risk adjusted
9.6 Readmission
s for new
home care
clients 30
days after
leaving
hospital
This indicator
measures the
percentage of
clients who
were newly
referred for
home care
services from
the hospital that
had unplanned
hospital
readmissions
within 30 days
of the initial
hospital
discharge.
Generally, a
lower
percentage is
better.
Canada
Claims based
data.
Discharge
Abstract
Database
(DAD), Home
Care Database
(HCD),
Registered
Persons
Database
(RPDB)
Unplanned:
Technical
definitions not
available
publicly.
Numerator: The
number of
unplanned
hospitalizations by
home care clients
newly referred to
home care
services within 30
days of initial
hospital discharge.
Denominator: The
number of clients
newly referred to
home care from
hospital who were
discharged from
hospital and
received their first
home care service
visit within the time
period of interest.
Reporting of QI:
Public reporting
Publicly funded home care
services, including publicly
funded services delivered by
private-sector agencies and
those funded and delivered
by the federal government
(eg Veterans Affairs). Home
care is delivered in the
community in private homes
and residential care settings,
as well as in hospitals and
ambulatory clinics. The
interRAI HC can be used to
assess persons with chronic
needs for care as well as
those with post-acute care
needs (eg after
hospitalization, in a hospital-
at-home situation).
Clients are considered for
specific indicators in line with
their sub-group: acute home
care; end of life;
rehabilitation; long term
supportive; maintenance
client.
RAI-HC
None
9.7 Acute care
hospitalisatio
n during first
60 days of
home health
stay
Percentage of
home health
stays in which
patients were
admitted to an
acute care
hospital during
the 60 days
following the
USA
Claims-data.
Medicare
90 days.
Technical
definitions of
terms are not
available in
public
information.
Numerator:
Number of home
health stays for
patients who have
a Medicare claim
for an admission
to an acute care
hospital in the 60
days following the
Applicable to all home care
consumers except those who
are receiving only non-skilled
services; For whom neither
Medicare nor Medicaid is
paying for HH care (patients
receiving care under a
Medicare or Medicaid
Managed Care Plan are not
factors,
demographic
factors, and clinical
factors.

Ranked quality indicators performance characteristics
Development of quality indicators for in-home aged care PwC 175
Rank
Quality
indicator –
unique
wording
Quality
indicator
description
Quality
indicator
country
Type and
frequency
of data
collection
Key
definitions
of terms
Calculation of
quality indicator
and reporting
methods
Types of home care
services in scope
Use
permitted
under
licence
Multiple
observation
required Risk adjusted
start of the
home health
stay.
start of the home
health stay.
Denominator:
Number of home
health stays that
begin during the
12-month
observation
period. A home
health stay is a
sequence of home
health payment
episodes
separated from
other home health
payment episodes
by at least 60
days.
"90 days.
Home Health
Quality Reporting
(CMS and
providers).
Reporting of QI:
Home Health
Compare (CMS,
providers and
publicly reported),
and is part of the 5
star quality rating
(CMS, providers
and publicly
reported online
includes 7 QIs).
excluded from the OASIS
reporting requirement

Ranked quality indicators performance characteristics
Development of quality indicators for in-home aged care PwC 176
Rank
Quality
indicator –
unique
wording
Quality
indicator
description
Quality
indicator
country
Type and
frequency
of data
collection
Key
definitions
of terms
Calculation of
quality indicator
and reporting
methods
Types of home care
services in scope
Use
permitted
under
licence
Multiple
observation
required Risk adjusted
9.8 Hospital
admission in
30 days
between
surveys
Hospital
admission in the
last 30
days/from the
last survey to
the present
Japan
Data collected
by service
providers
(nurses or case
managers) and
client/family
members. 30
days lookback
period.
Technical
definitions of
terms are not
available in the
public domain.
Calculation
method unknown.
information is not publicly
available
Unknown Unknown
9.9 Emergency
Department
presentation
or
hospitalisatio
n for
medication-
related
events
Proportion of
HCP episodes
where clients
had an
emergency
department
presentation or
hospitalisation
for medication-
related events.
Australia
Claims based
data.
(Hospitalisation
data (unplanned
admissions and
emergency
department
presentations).
12 monthly
Technical
definitions of
terms are not
available in the
public domain.
Numerator:
Number of HCP
episodes where
clients had an
emergency
department
presentation or
hospitalisation
where a
medication-related
event was the
principal discharge
diagnosis for the
encounter or the
external cause
type for the
encounter.
Denominator:
Number of HCP
episodes
To be published
publicly annually
at national level
and provided
privately to
individual facilities
Consumers on Home Care
Packages
Age, sex, number
of comorbidities.

Ranked quality indicators performance characteristics
Development of quality indicators for in-home aged care PwC 177
Rank
Quality
indicator –
unique
wording
Quality
indicator
description
Quality
indicator
country
Type and
frequency
of data
collection
Key
definitions
of terms
Calculation of
quality indicator
and reporting
methods
Types of home care
services in scope
Use
permitted
under
licence
Multiple
observation
required Risk adjusted
at facility level (SA
only).
9.10 Patients
discharged
to
community
with no
unplanned
acute
hospital or
long-term
care facilities
in 31 days
after
discharge
Percentage of
home health
stays in which
patients were
discharged to
the community
and do not have
and unplanned
admission to an
acute care
hospital or
LTCF in 31
days and
remain alive.
USA
90 days.
Claims-data.
Medicare.
Technical
definitions of
terms are not
available in
public
information.
Numerator:
Number of home
health stays for
patients who have
a Medicare claim
for patient
discharge from
home health and
do not have an
unplanned
admission to and
acute care hospital
or LTCF and
remained alive.
Denominator:
Number of home
health stays that
begin during the 2
-year observation
period.
90 days.
Home Health
Quality Reporting
(CMS and
providers).
Home Health
Compare (CMS,
providers and
publicly reported
online).
Applicable to all home care
consumers except those who
are receiving only non-skilled
services; For whom neither
Medicare nor Medicaid is
paying for HH care (patients
receiving care under a
Medicare or Medicaid
Managed Care Plan are not
excluded from the OASIS
reporting requirement
Adjusted for where
appropriate:
service factors,
provider factors,
demographic
factors, and clinical
factors.

Ranked quality indicators performance characteristics
Development of quality indicators for in-home aged care PwC 178
Rank
Quality
indicator –
unique
wording
Quality
indicator
description
Quality
indicator
country
Type and
frequency
of data
collection
Key
definitions
of terms
Calculation of
quality indicator
and reporting
methods
Types of home care
services in scope
Use
permitted
under
licence
Multiple
observation
required Risk adjusted
9.11 Clients who
require
hospitalisatio
n,
emergency
department
presentation
or emergent
care
Prevalence of
clients who are
hospitalised,
present to
emergency
department or
emergent care
Switzerland
Swiss RAI-HC
data are
measured
within a 90-day
period at entry
to home care
services
(baseline) and
calculated six
monthly unless
there is a
significant
clinical change.
Technical
definitions of
terms are not
publicly
available.
Calculation
method not
known.
The Swiss RAI-HC
QIs only used for
internal quality
management in
non-profit home
care organisations
and there are no
national standards
for home care.
No cantonal
(regions) or
national agencies
are collecting this
data or publicly
report on quality of
care
Information is not publicly
available.
Swiss RAI-
HC
9.12 Emergency
Department
presentation
for clients
with
dementia or
clients
hospitalised
for delirium
or dementia
Proportion of
HCP episodes
where clients
with dementia
had an
emergency
department
presentation or
hospitalisation
for delirium or
dementia.
Australia
Claims based
data.
(Hospitalisation
data (unplanned
admissions and
emergency
department
presentations).
12 monthly.
Technical
definitions of
terms are not
available in the
public domain.
Numerator:
Number of HC
clients with
dementia having a
hospitalisation/
emergency
department
presentation
where principal
diagnoses was
dementia or
delirium
Denominator:
Number of HCP
episodes where
Consumers on Home Care
Packages
Age, sex, number
of comorbidities.

Ranked quality indicators performance characteristics
Development of quality indicators for in-home aged care PwC 179
Rank
Quality
indicator –
unique
wording
Quality
indicator
description
Quality
indicator
country
Type and
frequency
of data
collection
Key
definitions
of terms
Calculation of
quality indicator
and reporting
methods
Types of home care
services in scope
Use
permitted
under
licence
Multiple
observation
required Risk adjusted
clients had
dementia
To be published
publicly annually
at national level
and provided
privately to
individual facilities
at facility level (SA
only).
9.13 Emergency
Department
use without
hospitalisatio
n during the
first 60 days
of home
health stay
Percentage of
home health
stays in which
patients used
the emergency
department but
were not
admitted to the
hospital during
the 60 days
following the
start of the
home health
stay.
USA
Claims-data.
Medicare
90 days.
Technical
definitions of
terms are not
available in
public
information.
Numerator:
Number of home
health stays for
patients who have
a Medicare claim
for outpatient
emergency
department use
and no claims for
acute care
hospitalization in
the 60 days
following the start
of the home health
stay.
Denominator:
Number of home
health stays that
begin during the
12-month
observation
period.
90 days. Home
Health Quality
Reporting (CMS
Applicable to all home care
consumers except those who
are receiving only non-skilled
services; For whom neither
Medicare nor Medicaid is
paying for HH care (patients
receiving care under a
Medicare or Medicaid
Managed Care Plan are not
excluded from the OASIS
reporting requirement
Adjusted for where
appropriate:
service factors,
provider factors,
demographic
factors, and clinical
factors.

Ranked quality indicators performance characteristics
Development of quality indicators for in-home aged care PwC 180
Rank
Quality
indicator –
unique
wording
Quality
indicator
description
Quality
indicator
country
Type and
frequency
of data
collection
Key
definitions
of terms
Calculation of
quality indicator
and reporting
methods
Types of home care
services in scope
Use
permitted
under
licence
Multiple
observation
required Risk adjusted
and providers).
Home Health
Compare (CMS,
providers and
publicly reported
online).

Ranked quality indicators performance characteristics
Development of quality indicators for in-home aged care PwC 181
Table 24: Depression
Rank
Quality
indicator –
unique
wording
Quality
indicator
description
Quality
indicator
country
Type and
frequency
of data
collection
Key
definitions
of terms
Calculation of
quality indicator
and reporting
methods
Types of home care
services in scope
Use
permitted
under
licence
Multiple
observation
required Risk adjusted
10.1 Clients
whose mood
declined
Percentage of
clients whose
mood declined
(assessed using
Depression
Rating Scale
(DRS)).
Incidence
indicator.
Canada
90 days.
RAI-HC or
interRAI HC,
collected by
designated
assessors,
registered
healthcare
providers, who
have received
training on the
administration
of the tools
Mood
declined;
technical
definition not
available
publicly
Numerator: HC
clients with a lower
Depression Rating
Scale (DRS) score
on their target
assessment
compared with
their prior
assessment.
Denominator: All
HC clients (must
have target
assessment and
had an
assessment 3-15
months prior).
Reporting of QI:
"90 days. HCRS
based on 2
consecutive
quarters (to
ensure min
number of
assessments to
apply risk
adjustment
procedures).
Reported at
National,
Province/Territory
level."
Publicly funded home care
services, including publicly
funded services delivered by
private-sector agencies and
those funded and delivered
by the federal government
(eg Veterans Affairs). Home
care is delivered in the
community in private homes
and residential care settings,
as well as in hospitals and
ambulatory clinics. The
interRAI HC can be used to
assess persons with chronic
needs for care as well as
those with post-acute care
needs (eg after
hospitalization, in a hospital-
at-home situation).
Clients are considered for
specific indicators in line with
their sub-group: acute home
care; end of life;
rehabilitation; long term
supportive; maintenance
client.
RAI-HC
Risk adjustment at
individual client
level (individual
covariates) and
home care
organizational
level (direct
standardization).
Stratified by ADL
hierarchy scale

Ranked quality indicators performance characteristics
Development of quality indicators for in-home aged care PwC 182
Rank
Quality
indicator –
unique
wording
Quality
indicator
description
Quality
indicator
country
Type and
frequency
of data
collection
Key
definitions
of terms
Calculation of
quality indicator
and reporting
methods
Types of home care
services in scope
Use
permitted
under
licence
Multiple
observation
required Risk adjusted
10.2 Clients with
fewer
depressive
symptoms
Proportion of
HC clients with
fewer
depressive
symptoms on
the Depression
Rating Scale at
follow-up.
Incidence
indicator.
EU
Data collected
using RAI-HC
European but
using 2nd
generation
European
interRAI HCQIs.
Data collected
by specially
trained
assessors,
usually nurses,
who verify
collected
information that
included direct
interviews of
home care
clients and
family
members, as
well as review
of physician
reports medical
records.
Technical
definitions of
fewer and
symptoms of
depression are
not publicly
available.
Numerator:
Number of HC
clients with fewer
depressive
symptoms on the
Depression Rating
Scale at follow-up
compared to
baseline.
Incidence
indicator.
Denominator: All
HC clients with
depressive
symptoms at
baseline and both
baseline and
target assessment
(at 6 months).
Reporting in
publication level
for 7 countries:
Czech Republic,
Denmark, Finland,
Germany, Italy,
and the
Netherlands for
HC recipients.
https://www.ncbi.nl
m.nih.gov/pmc/arti
cles/PMC4647796
/#Sec12
Information is not publicly
available.
European
interRAI
HCQI
Adjusted for: ADL
decline,
hospitalizations,
depression rating
scale score.
Stratification: IADL
summary scale.

Ranked quality indicators performance characteristics
Development of quality indicators for in-home aged care PwC 183
Rank
Quality
indicator –
unique
wording
Quality
indicator
description
Quality
indicator
country
Type and
frequency
of data
collection
Key
definitions
of terms
Calculation of
quality indicator
and reporting
methods
Types of home care
services in scope
Use
permitted
under
licence
Multiple
observation
required Risk adjusted
10.3 Clients with
more
depressive
symptoms
Proportion of
HC clients with
more
depressive
symptoms on
the Depression
Rating Scale at
follow-up.
Includes clients
with new
depressive
symptoms.
Incidence
indicator.
EU
6 months.
Data collected
using RAI-HC
European but
using 2nd
generation
European
interRAI HCQIs.
Data collected
by specially
trained
assessors,
usually nurses,
who verify
collected
information that
included direct
interviews of
home care
clients and
family
members, as
well as review
of physician
reports medical
records.
Technical
definitions of
more and
symptoms of
depression are
not publicly
available.
Numerator:
Number of HC
clients with more
depressive
symptoms on the
Depression Rating
Scale at follow-up
compared to
baseline. Includes
clients with new
depressive
symptoms.
Incidence
indicator.
Denominator: All
HC clients with
both baseline and
target assessment
(at 6 months).
Reporting in
publication level
for 7 countries:
Czech Republic,
Denmark, Finland,
Germany, Italy,
and the
Netherlands for
HC recipients.
https://www.ncbi.nl
m.nih.gov/pmc/arti
cles/PMC4647796
/#Sec12
Information is not publicly
available.
European
interRAI
HCQI
Adjusted for:
clinical risk,
difficulty bathing,
institutional risk

Ranked quality indicators performance characteristics
Development of quality indicators for in-home aged care PwC 184
Rank
Quality
indicator –
unique
wording
Quality
indicator
description
Quality
indicator
country
Type and
frequency
of data
collection
Key
definitions
of terms
Calculation of
quality indicator
and reporting
methods
Types of home care
services in scope
Use
permitted
under
licence
Multiple
observation
required Risk adjusted
10.4 Clients
suffering
from
depression
Proportion of
clients suffering
from
depression.
Netherlands
Self-recording
by care
providers every
year for all
clients.
Technical
definitions of
more and
symptoms of
depression are
not publicly
available.
Calculation
method not
known.
Care providers’
performance is
monitored, and
governments’
accountability
reports make
information
available to the
public. Public
reporting is
mandatory and
includes indicators
of care
effectiveness and
safety and user
experiences.
Information not available in
public domain
Unknown Unknown

Ranked quality indicators performance characteristics
Development of quality indicators for in-home aged care PwC 185
Table 25: Carer distress (in alphabetical order)
Rank
Quality
indicator –
unique
wording
Quality
indicator
description
Quality
indicator
country
Type and
frequency
of data
collection
Key
definitions
of terms
Calculation of
quality indicator
and reporting
methods
Types of home care
services in scope
Use
permitted
under
licence
Multiple
observation
required Risk adjusted
11.1 Clients
whose
primary
informal
caregiver
experienced
distress,
anger, or
depression
in relation to
their
caregiving
role or were
unable to
continue
(over the last
year)
Percentage of
clients whose
primary informal
caregiver
experienced
distress, anger,
or depression in
relation to their
caregiving role
or were unable
to continue.
Prevalence
indicator.
Canada
90 days.
RAI-HC or
interRAI HC,
collected by
designated
assessors,
registered
healthcare
providers, who
have received
training on the
administration
of the tools.
Technical
definitions not
available
publicly.
Numerator: Total
number of long-
stay HC clients
with a caregiver at
the time of their
most recent
assessment in the
given year.
Denominator:
Total number of
HC clients with
caregivers.
Reported publicly
online, 12 monthly
at National,
Province/Territory
level.
HCRS based on 2
consecutive
quarters (to
ensure min
number of
assessments to
apply risk
adjustment
procedures).
Reporting of QI:
On-Line Public
Reporting. See
https://www.cihi.ca
/en/home-care for
further information.
Publicly funded home care
services, including publicly
funded services delivered by
private-sector agencies and
those funded and delivered
by the federal government
(eg Veterans Affairs). Home
care is delivered in the
community in private homes
and residential care settings,
as well as in hospitals and
ambulatory clinics. The
interRAI HC can be used to
assess persons with chronic
needs for care as well as
those with post-acute care
needs (eg after
hospitalization, in a hospital-
at-home situation).
Clients are considered for
specific indicators in line with
their sub-group: acute home
care; end of life;
rehabilitation; long term
supportive; maintenance
client.
European
interRAI
HCQI
Risk adjustment at
individual client
level (individual
covariates) and
home care
organizational
level (direct
standardization).
Activities of Daily
Living Self-
Performance
Hierarchy Scale
(ADL Hierarchy),
Cognitive
Performance Scale
(CPS), Changes in
Health, End-Stage
Disease and Signs
and Symptoms
(CHESS).
Stratified by
cognitive
performance scale
score.

Ranked quality indicators performance characteristics
Development of quality indicators for in-home aged care PwC 186
Rank
Quality
indicator –
unique
wording
Quality
indicator
description
Quality
indicator
country
Type and
frequency
of data
collection
Key
definitions
of terms
Calculation of
quality indicator
and reporting
methods
Types of home care
services in scope
Use
permitted
under
licence
Multiple
observation
required Risk adjusted
11.2 Clients
whose
unpaid
caregivers
experience
distress
(over the last
year)
The percentage
of long-stay
home care
clients whose
unpaid
caregivers
experience
distress in a 1-
year period
Canada
Resident
Assessment
Instrument-
Home Care
(RAI-HC) or
interRAI HC
assessments.
Caregiver
distress:
Technical
definitions not
available
publicly.
Numerator: Total
number of home
care clients who,
at the time of their
most recent
assessment in the
given year, have
an unpaid
caregiver who is
experiencing
distress.
Denominator:
Total number of
long-stay home
care clients with a
caregiver at the
time of their most
recent assessment
in the given year.
Exclusions: Home
care clients
included are those
identified as
having an unpaid
caregiver on
Resident
Assessment
Instrument-Home
Care (RAI-HC) or
interRAI HC
assessments.
Assessments with
"initial
assessment" as
the reason for the
Publicly funded home care
services, including publicly
funded services delivered by
private-sector agencies and
those funded and delivered
by the federal government
(eg Veterans Affairs). Home
care is delivered in the
community in private homes
and residential care settings,
as well as in hospitals and
ambulatory clinics. The
interRAI HC can be used to
assess persons with chronic
needs for care as well as
those with post-acute care
needs (eg after
hospitalization, in a hospital-
at-home situation).
Clients are considered for
specific indicators in line with
their sub-group: acute home
care; end of life;
rehabilitation; long term
supportive; maintenance
client.
European
interRAI
HCQI
Risk adjusted
using following
covariates:
Activities of Daily
Living Self-
Performance
Hierarchy Scale
(ADL Hierarchy);
Cognitive
Performance Scale
(CPS); Changes in
Health, End-Stage
Disease and Signs
and Symptoms
(CHESS)

Ranked quality indicators performance characteristics
Development of quality indicators for in-home aged care PwC 187
Rank
Quality
indicator –
unique
wording
Quality
indicator
description
Quality
indicator
country
Type and
frequency
of data
collection
Key
definitions
of terms
Calculation of
quality indicator
and reporting
methods
Types of home care
services in scope
Use
permitted
under
licence
Multiple
observation
required Risk adjusted
assessment are
excluded.
Reporting of QI:
On-Line Public
Reporting. See
https://www.cihi.ca
/en/home-care for
further information.
11.3 Clients with
caregivers
who express
distress,
anger and or
depression
at baseline
and follow-
up (over 6-
month
period)
Proportion of
HC clients with
caregivers who
express
distress, anger
and or
depression at
baseline and
follow-up.
Incidence
indicator.
EU
6 monthly.
Data collected
using RAI-HC
European but
using 2nd
generation
European
interRAI HCQIs.
Data collected
by specially
trained
assessors,
usually nurses,
who verify
collected
information that
included direct
interviews of
home care
clients and
family
members, as
well as review
of physician
reports and
medical
records.
Technical
definitions of
carer givers
and express
distress, anger
and/or
depression are
not publicly
available.
Numerator:
Number of HC
clients with
caregivers who
express distress,
anger and or
depression at
baseline and
follow-up.
Incidence
indicator.
Denominator: All
HC clients with
caregivers who
express caregiver
distress at
baseline and with
both baseline and
target assessment
(at 6 months).
Reporting in
publication level
for 7 countries:
Czech Republic,
Denmark, Finland,
Germany, Italy,
and the
Information is not publicly
available.
European
interRAI
HCQI
Adjusted for: not
independent
cognition, IADL
difficulty, difficulty
with locomotion,
impaired decision
making, difficulty
with housework,
clinical risk.
Stratification:
Cognitive
Performance Scale
score.

Ranked quality indicators performance characteristics
Development of quality indicators for in-home aged care PwC 188
Rank
Quality
indicator –
unique
wording
Quality
indicator
description
Quality
indicator
country
Type and
frequency
of data
collection
Key
definitions
of terms
Calculation of
quality indicator
and reporting
methods
Types of home care
services in scope
Use
permitted
under
licence
Multiple
observation
required Risk adjusted
Netherlands for
HC recipients.
https://www.ncbi.nl
m.nih.gov/pmc/arti
cles/PMC4647796
/#Sec12
11.4 Clients with
informal
caregivers
who report
distress
Prevalence of
informal
caregivers who
report distress
Switzerland
Swiss RAI-HC
data are
measured
within a 90-day
period at entry
to home care
services
(baseline) and
calculated six
monthly unless
there is a
significant
clinical change.
Technical
definitions of
terms are not
publicly
available.
Collection method
unknown.
The Swiss RAI-HC
QIs only used for
internal quality
management in
non-profit home
care organisations
and there are no
national standards
for home care.
No cantonal
(regions) or
national agencies
are collecting this
data or publicly
report on quality of
care indicators.
Information is not publicly
available
Swiss RAI-
HC

Ranked quality indicators performance characteristics
Development of quality indicators for in-home aged care PwC 189
Table 26: Medication related (in alphabetical order)
Number
Quality
indicator –
unique
wording
Quality
indicator
description
Quality
indicator
country
Type and
frequency
of data
collection
Key
definitions
of terms
Calculation of
quality indicator
and reporting
methods
Types of home care
services in scope
Use
permitted
under
licence
Multiple
observation
required Risk adjusted
12.1 Clients or
carers who
are
instructed
on how to
monitor the
effectivene
ss of drug
therapy,
how to
recognise
potential
adverse
effects,
and how
and when
to report
problems
Percentage of
home health
quality
episodes of
care during
which
patient/caregiv
er was
instructed on
how to monitor
the
effectiveness
of drug
therapy, how to
recognize
potential
adverse
effects, and
how and when
to report
problems (at
the time of or
at any time
since the most
recent
SOC/ROC
assessment).
USA
OASIS based
measures.
(Outcome
Assessment
Information Set
(OASIS-D1)
(Standardized
Patient
Assessments,
non-HER
Electronic
Clinical Data)).
Entry of HH
service and the
last 5 days of
every 60 day
period
beginning with
the start of care
date.
Collected every
3 months
Technical
definitions of
terms are not
available in
public
information.
Numerator:
Number of home
health quality
episodes of care
during which
patient/caregiver
was instructed on
how to monitor the
effectiveness of
drug therapy, how
to recognize
potential adverse
effects, and how
and when to report
problems (at the
time of or at any
time since the
most recent
SOC/ROC
assessment).
Denominator:
Number of home
health quality
episodes of care
ending with a
discharge or
transfer to
inpatient facility
during the
reporting period,
other than those
covered by
generic or
Applicable to all home care
consumers except those who
are receiving only non-skilled
services; For whom neither
Medicare nor Medicaid is
paying for HH care (patients
receiving care under a
Medicare or Medicaid
Managed Care Plan are not
excluded from the OASIS
reporting requirement
Adjusted for where
appropriate:
service factors,
provider factors,
demographic
factors, and clinical
factors.

Ranked quality indicators performance characteristics
Development of quality indicators for in-home aged care PwC 190
Number
Quality
indicator –
unique
wording
Quality
indicator
description
Quality
indicator
country
Type and
frequency
of data
collection
Key
definitions
of terms
Calculation of
quality indicator
and reporting
methods
Types of home care
services in scope
Use
permitted
under
licence
Multiple
observation
required Risk adjusted
measure-specific
exclusions.
90 days. Home
Health Quality
Reporting (CMS
and providers).
Home Health
Compare (CMS,
providers and
publicly reported
online).
12.2 Clients
who are
chronic
opioid
users (for
at least 90
days)
Proportion of
HCP episodes
where clients
were chronic
opioid users
AUS
Claims based
data. (PBS
medication
data)
12 monthly.
Chronic opioid
use is defined
as continuous
opioid use for
at least 90
days, or for
120 non-
consecutive
days
Numerator:
Number of HCP
episodes where
clients were
chronic opioid
users.
Denominator:
Number of HCP
episodes
To be published
publicly annually
at national level
and provided
privately to
individual facilities
at facility level (SA
only).
Home Care Package
consumers
Age, sex, number
of comorbidities.
12.3 Clients
who had at
least one
potential
period of
high
sedative
Proportion of
HCP episodes
where clients
potentially
experienced a
high sedative
load (SL≥3)
AUS
Claims based
data. (PBS
medication
data)
12 monthly.
Technical
definitions not
publicly
available
Numerator:
Number of HCP
episodes where
clients had at least
one potential
period of high
sedative load
Home Care Package
consumers
Age, sex, number
of comorbidities
Stratified by
dementia status.

Ranked quality indicators performance characteristics
Development of quality indicators for in-home aged care PwC 191
Number
Quality
indicator –
unique
wording
Quality
indicator
description
Quality
indicator
country
Type and
frequency
of data
collection
Key
definitions
of terms
Calculation of
quality indicator
and reporting
methods
Types of home care
services in scope
Use
permitted
under
licence
Multiple
observation
required Risk adjusted
load
(SL≥3)
medication
use (in a
91-day
period)
(SL≥3) medication
use within a 91-
day period in the
reporting period of
1 year. Sedative
load is calculated
by summing the
sedative rating of
each medication
dispensed during
the same period.
Denominator:
Number of HCP
episodes
To be published
publicly annually
at national level
and provided
privately to
individual facilities
at facility level (SA
only).
12.4 Clients
with three
or more
psychoacti
ve drugs
concurrentl
y
Proportion of
persons 75
years and older
in the home
service treated
with three or
more
psychoactive
drugs
concurrently
Sweden
Data collected
by the
municipalities
yearly, derived
from national
surveys,
administrative
data, and
registries.
National
surveys: NBHW
survey – What
do the elderly
Technical
definitions of
terms are not
available
online.
Calculation
methods unknown
Publicly annually
at municipal level,
county level and
state. (Open
Comparisons
report annually
online) showing
providers’ quality
of care to the
elderly based on
the quality
No further information
publicly available
Unknown Unknown

Ranked quality indicators performance characteristics
Development of quality indicators for in-home aged care PwC 192
Number
Quality
indicator –
unique
wording
Quality
indicator
description
Quality
indicator
country
Type and
frequency
of data
collection
Key
definitions
of terms
Calculation of
quality indicator
and reporting
methods
Types of home care
services in scope
Use
permitted
under
licence
Multiple
observation
required Risk adjusted
think about
elderly care?
(from
municipalities
and counties)
Official statistics
(administrative
data): Register
of Social
Services
Interventions for
the Elderly and
Persons with
Disability,
Patient
Register,
Register of
Medicines
National quality
registers:
Senior Alert
Registry,
Swedish
Palliative
Registry,
Dementia
Register,
Registry on
Behaviour and
Psychiatric
Symptoms.
indicators along
with grading of
their performance.
A relative
comparison
between
municipalities is
provided using a
traffic light system.
12.5 Clients
who have
been
treated
Proportion of
persons aged
75 years and
older in the
Sweden
Data collected
by the
municipalities
yearly, derived
Technical
definitions of
terms are not
Calculation
methods unknown.
Publicly annually
at municipal level,
No further information
publicly available
Unknown Unknown

Ranked quality indicators performance characteristics
Development of quality indicators for in-home aged care PwC 193
Number
Quality
indicator –
unique
wording
Quality
indicator
description
Quality
indicator
country
Type and
frequency
of data
collection
Key
definitions
of terms
Calculation of
quality indicator
and reporting
methods
Types of home care
services in scope
Use
permitted
under
licence
Multiple
observation
required Risk adjusted
with an
antipsychot
ic drug
home service
who have been
treated with an
antipsychotic
drug.
from national
surveys,
administrative
data, and
registries.
National
surveys: NBHW
survey – What
do the elderly
think about
elderly care?
(from
municipalities
and counties)
Official statistics
(administrative
data): Register
of Social
Services
Interventions for
the Elderly and
Persons with
Disability,
Patient
Register,
Register of
Medicines
National quality
registers:
Senior Alert
Registry,
Swedish
Palliative
Registry,
Dementia
Register,
available
online.
county level and
state. (Open
Comparisons
report annually
online) showing
providers’ quality
of care to the
elderly based on
the quality
indicators along
with grading of
their performance.
A relative
comparison
between
municipalities is
provided using a
traffic light system.

Ranked quality indicators performance characteristics
Development of quality indicators for in-home aged care PwC 194
Number
Quality
indicator –
unique
wording
Quality
indicator
description
Quality
indicator
country
Type and
frequency
of data
collection
Key
definitions
of terms
Calculation of
quality indicator
and reporting
methods
Types of home care
services in scope
Use
permitted
under
licence
Multiple
observation
required Risk adjusted
Registry on
Behaviour and
Psychiatric
Symptoms.
12.6 Clients
who have
received a
home
medication
review
Proportion of
HCP episodes
where clients
received a
home
medication
review.
AUS
Claims based
data. (PBS
medication
data)
12 monthly.
Technical
definitions not
publicly
available
Numerator:
Proportion of HCP
episodes where
clients received a
home medication
review.
Denominator:
Number of HCP
episodes\
To be published
publicly annually
at national level
and provided
privately to
individual facilities
at facility level (SA
only).
Home Care Package
consumers
Age, sex, number
of comorbidities
12.7 Clients
who
improve in
their ability
to take
their
medication
s correctly
(by mouth)
Percentage of
home health
episodes of
care during
which the
patient
improved in
ability to take
their medicines
correctly (by
mouth).
USA
OASIS based
measures.
(Outcome
Assessment
Information Set
(OASIS-D1)
(Standardized
Patient
Assessments,
non-HER
Electronic
Clinical Data)).
Entry of HH
service and the
Technical
definitions of
terms are not
available in
public
information.
Numerator:
Number of home
health episodes of
care where the
value recorded on
the discharge
assessment
indicates less
impairment in
taking oral
medications
correctly at
discharge than at
start (or
Applicable to all home care
consumers except those who
are receiving only non-skilled
services; For whom neither
Medicare nor Medicaid is
paying for HH care (patients
receiving care under a
Medicare or Medicaid
Managed Care Plan are not
excluded from the OASIS
reporting requirement
Adjusted for where
appropriate:
service factors,
provider factors,
demographic
factors, and clinical
factors.

Ranked quality indicators performance characteristics
Development of quality indicators for in-home aged care PwC 195
Number
Quality
indicator –
unique
wording
Quality
indicator
description
Quality
indicator
country
Type and
frequency
of data
collection
Key
definitions
of terms
Calculation of
quality indicator
and reporting
methods
Types of home care
services in scope
Use
permitted
under
licence
Multiple
observation
required Risk adjusted
last 5 days of
every 60 day
period
beginning with
the start of care
date.
Collected every
3 months
resumption) of
care.
Denominator:
Number of home
health episodes of
care ending with a
discharge during
the reporting
period, other than
those covered by
generic or
measure-specific
exclusions.
90 days. Home
Health Quality
Reporting (CMS
and providers).
Home Health
Compare (CMS,
providers and
publicly reported
online).
12.8 Clients
who
improve or
stay the
same in
their ability
to take
their
medication
s correctly
(by mouth)
Percentage of
home health
quality
episodes of
care during
which the
patient
improved or
stayed the
same in ability
to take their
medicines
USA
OASIS based
measures.
(Outcome
Assessment
Information Set
(OASIS-D1)
(Standardized
Patient
Assessments,
non-HER
Electronic
Clinical Data)).
Technical
definitions of
terms are not
available in
public
information.
Numerator:
Number of home
health quality
episodes of care
where the value
recorded on the
discharge
assessment
indicates the same
or less impairment
in taking oral
medications
correctly at
Applicable to all home care
consumers except those who
are receiving only non-skilled
services; For whom neither
Medicare nor Medicaid is
paying for HH care (patients
receiving care under a
Medicare or Medicaid
Managed Care Plan are not
excluded from the OASIS
reporting requirement
Adjusted for where
appropriate:
service factors,
provider factors,
demographic
factors, and clinical
factors.

Ranked quality indicators performance characteristics
Development of quality indicators for in-home aged care PwC 196
Number
Quality
indicator –
unique
wording
Quality
indicator
description
Quality
indicator
country
Type and
frequency
of data
collection
Key
definitions
of terms
Calculation of
quality indicator
and reporting
methods
Types of home care
services in scope
Use
permitted
under
licence
Multiple
observation
required Risk adjusted
correctly (by
mouth).
Entry of HH
service and the
last 5 days of
every 60 day
period
beginning with
the start of care
date.
Collected every
3 months
discharge than at
start (or
resumption)
Denominator:
Number of home
health quality
episodes of care
ending with a
discharge during
the reporting
period, other than
those covered by
generic or
measure-specific
exclusions.
90 days. Home
Health Quality
Reporting (CMS
and providers).
Home Health
Compare (CMS,
providers and
publicly reported
online).
12.9 Clients
who were
dispensed
at least
one
antibiotic
for
systemic
use
Proportion of
HCP episodes
where clients
were
dispensed an
antibiotic
AUS
Claims based
data. (PBS
medication
data)
12 monthly.
Technical
definitions not
publicly
available
Numerator:
Proportion of HCP
episodes where
clients were
dispensed an
antibiotic
Denominator:
Number of HCP
episodes
To be published
publicly annually
Home Care Package
consumers
Age, sex, number
of comorbidities.

Ranked quality indicators performance characteristics
Development of quality indicators for in-home aged care PwC 197
Number
Quality
indicator –
unique
wording
Quality
indicator
description
Quality
indicator
country
Type and
frequency
of data
collection
Key
definitions
of terms
Calculation of
quality indicator
and reporting
methods
Types of home care
services in scope
Use
permitted
under
licence
Multiple
observation
required Risk adjusted
at national level
and provided
privately to
individual facilities
at facility level (SA
only).
12.10 Clients
who were
dispensed
at least
one
antipsychot
ic
medication
Proportion of
HCP episodes
where clients
were
dispensed an
antipsychotic.
AUS
Claims based
data. (PBS
medication
data)
12 monthly.
Technical
definitions not
publicly
available
Numerator:
Number of HCP
episodes where
clients were
dispensed at least
one antipsychotic
medication during
the reporting
period
Denominator:
Number of HCP
episodes
To be published
publicly annually
at national level
and provided
privately to
individual facilities
at facility level (SA
only).
Home Care Package
consumers
Age, sex, number
of comorbidities,
prior use of
antipsychotics.
Stratified by
dementia status.
12.11 Clients
with 10 or
more
medication
s
Proportion of
persons 75
years and older
in the home
service treated
with ten or
more
medicines.
Sweden
Data collected
by the
municipalities
yearly, derived
from national
surveys,
administrative
data, and
registries.
Technical
definitions of
terms are not
available
online.
Calculation
methods unknown
Publicly annually
at municipal level,
county level and
state. (Open
Comparisons
report annually
online) showing
No further information
publicly available
Unknown Unknown

Ranked quality indicators performance characteristics
Development of quality indicators for in-home aged care PwC 198
Number
Quality
indicator –
unique
wording
Quality
indicator
description
Quality
indicator
country
Type and
frequency
of data
collection
Key
definitions
of terms
Calculation of
quality indicator
and reporting
methods
Types of home care
services in scope
Use
permitted
under
licence
Multiple
observation
required Risk adjusted
National
surveys: NBHW
survey – What
do the elderly
think about
elderly care?
(from
municipalities
and counties)
Official statistics
(administrative
data): Register
of Social
Services
Interventions for
the Elderly and
Persons with
Disability,
Patient
Register,
Register of
Medicines
National quality
registers:
Senior Alert
Registry,
Swedish
Palliative
Registry,
Dementia
Register,
Registry on
Behaviour and
Psychiatric
Symptoms.
providers’ quality
of care to the
elderly based on
the quality
indicators along
with grading of
their performance.
A relative
comparison
between
municipalities is
provided using a
traffic light system.

Ranked quality indicators performance characteristics
Development of quality indicators for in-home aged care PwC 199
Number
Quality
indicator –
unique
wording
Quality
indicator
description
Quality
indicator
country
Type and
frequency
of data
collection
Key
definitions
of terms
Calculation of
quality indicator
and reporting
methods
Types of home care
services in scope
Use
permitted
under
licence
Multiple
observation
required Risk adjusted
12.12 Clients
with at
least one
of four
indicators
of
inappropria
te drug use
Proportion of
persons 75
years and older
in the home
service treated
with at least
one of four
indicators of
inappropriate
drug use.
Sweden
Data collected
by the
municipalities
yearly, derived
from national
surveys,
administrative
data, and
registries.
National
surveys: NBHW
survey – What
do the elderly
think about
elderly care?
(from
municipalities
and counties)
Official statistics
(administrative
data): Register
of Social
Services
Interventions for
the Elderly and
Persons with
Disability,
Patient
Register,
Register of
Medicines
National quality
registers:
Senior Alert
Registry,
Technical
definitions of
terms are not
available
online.
Calculation
methods unknown
Publicly annually
at municipal level,
county level and
state. (Open
Comparisons
report annually
online) showing
providers’ quality
of care to the
elderly based on
the quality
indicators along
with grading of
their performance.
A relative
comparison
between
municipalities is
provided using a
traffic light system.
No further information
publicly available
Unknown Unknown

Ranked quality indicators performance characteristics
Development of quality indicators for in-home aged care PwC 200
Number
Quality
indicator –
unique
wording
Quality
indicator
description
Quality
indicator
country
Type and
frequency
of data
collection
Key
definitions
of terms
Calculation of
quality indicator
and reporting
methods
Types of home care
services in scope
Use
permitted
under
licence
Multiple
observation
required Risk adjusted
Swedish
Palliative
Registry,
Dementia
Register,
Registry on
Behaviour and
Psychiatric
Symptoms.
12.13 Clients
with
inconsisten
t drug
intake
Prevalence of
clients with
inconsistent
drug intake
Switzerland
Swiss RAI-HC
data are
measured
within a 90-day
period at entry
to home care
services
(baseline) and
calculated six
monthly unless
there is a
significant
clinical change.
Technical
definitions of
terms are not
publicly
available
Calculation
method unknown.
The Swiss RAI-HC
QIs only used for
internal quality
management in
non-profit home
care organisations
and there are no
national standards
for home care.
No cantonal
(regions) or
national agencies
are collecting this
data or publicly
report on quality of
care indicators.
Information not publicly
available
Swiss RAI-
HC
12.14 Clients
who have
a drug
regimen
review
conducted
at the start
or
The
percentage of
home health
quality
episodes in
which a drug
regimen review
was conducted
USA
OASIS based
measures.
(Outcome
Assessment
Information Set
(OASIS-D1)
(Standardized
Patient
Technical
definitions of
terms are not
available in
public
information.
Numerator:
Number of quality
episodes in which:
1) The agency
conducted a drug
regimen review at
the start of care or
resumption of care
Applicable to all home care
consumers except those who
are receiving only non-skilled
services; For whom neither
Medicare nor Medicaid is
paying for HH care (patients
receiving care under a
Medicare or Medicaid
Adjusted for where
appropriate:
service factors,
provider factors,
demographic

Ranked quality indicators performance characteristics
Development of quality indicators for in-home aged care PwC 201
Number
Quality
indicator –
unique
wording
Quality
indicator
description
Quality
indicator
country
Type and
frequency
of data
collection
Key
definitions
of terms
Calculation of
quality indicator
and reporting
methods
Types of home care
services in scope
Use
permitted
under
licence
Multiple
observation
required Risk adjusted
resumption
of care
with follow-
up
completed
for
identified
issues
at the start of
care or
resumption of
care and
completion of
recommended
actions from
timely follow-up
with a
physician
occurred each
time potential
clinically
significant
medication
issues were
identified
throughout that
quality
episode.
Assessments,
non-HER
Electronic
Clinical Data)).
Entry of HH
service and the
last 5 days of
every 60 day
period
beginning with
the start of care
date.
Collected every
3 months
or the patient is
not taking any
medications and
2) If potential
clinically
significant
medication issues
were identified at
any time during
the quality
episode, then the
HHA contacted a
physician (or
physician-
designee) and
completed
prescribed/recom
mended actions by
midnight of the
next calendar day
in response to all
the identified
issues throughout
the quality
episode.
Denominator:
Number of quality
episodes ending
with a discharge
or, transfer to an
inpatient facility, or
death at home
during the
reporting period.
90 days. Home
Health Quality
Managed Care Plan are not
excluded from the OASIS
reporting requirement
factors, and clinical
factors.

Ranked quality indicators performance characteristics
Development of quality indicators for in-home aged care PwC 202
Number
Quality
indicator –
unique
wording
Quality
indicator
description
Quality
indicator
country
Type and
frequency
of data
collection
Key
definitions
of terms
Calculation of
quality indicator
and reporting
methods
Types of home care
services in scope
Use
permitted
under
licence
Multiple
observation
required Risk adjusted
Reporting (CMS
and providers).
Home Health
Compare (CMS,
providers and
publicly reported
online).

Ranked quality indicators performance characteristics
Development of quality indicators for in-home aged care PwC 203
Table 27: Wait times/system access (in alphabetical order)
Number
Quality
indicator –
unique
wording
Quality
indicator
description
Quality
indicator
country
Type and
frequency
of data
collection
Key
definitions
of terms
Calculation of
quality indicator
and reporting
methods
Types of home care
services in scope
Use
permitted
under
licence
Multiple
observation
required Risk adjusted
13.1 Clients
who waited
five days
or less
from date
of
authorisati
on for
personal
support
services
This indicator
measures the
percentage of
complex home
care patients
aged 19 and
older who
waited five
days or less for
personal
support
services. The
wait time is
described as
the number of
days between
the service
authorization
date and the
date of receipt
of Local Health
Integration
Network
(LHIN) in-home
personal
support. A
higher
percentage is
better.
Canada
RAI-HC or
interRAI HC,
collected by
designated
assessors,
registered
healthcare
providers, who
have received
training on the
administration
of the tools.
Wait time
defined as
number of
days.
Numerator: This
indicator
measures the
percentage of
complex home
care patients aged
19 and older who
waited five days or
less for personal
support services.
The wait time is
described as the
number of days
between the
service
authorization date
and the date of
receipt of Local
Health Integration
Network (LHIN) in-
home personal
support. A higher
percentage is
better.
Denominator: The
number of
complex home
care patients who
received their first
personal support
service visit within
five days of the
date they were
authorized for
Publicly funded home care
services, including publicly
funded services delivered by
private-sector agencies and
those funded and delivered
by the federal government
(eg Veterans Affairs). Home
care is delivered in the
community in private homes
and residential care settings,
as well as in hospitals and
ambulatory clinics.
The interRAI HC can be used
to assess persons with
chronic needs for care as well
as those with post-acute care
needs (eg after
hospitalization, in a hospital-
at-home situation).
Clients are considered for
specific indicators in line with
their sub-group: acute home
care; end of life;
rehabilitation; long term
supportive; maintenance
client.
RAI-HC
Risk adjustment at
individual client
level (individual
covariates) and
home care
organizational
level (direct
standardization).

Ranked quality indicators performance characteristics
Development of quality indicators for in-home aged care PwC 204
Number
Quality
indicator –
unique
wording
Quality
indicator
description
Quality
indicator
country
Type and
frequency
of data
collection
Key
definitions
of terms
Calculation of
quality indicator
and reporting
methods
Types of home care
services in scope
Use
permitted
under
licence
Multiple
observation
required Risk adjusted
personal support
services by the
LHIN.
Reporting of QI:
90 days. HCRS
based on 2
consecutive
quarters (to
ensure min
number of
assessments to
apply risk
adjustment
procedures).
Reported at
National,
Province/Territory
level.
13.2 Clients
who waited
five days
or less
from date
of
authorisati
on for
nursing
services
This indicator
measures the
percentage of
home care
patients
authorized for
nursing
services who
received their
first nursing
visit within five
days. The wait
time is
described as
the number of
days between
service
Canada
RAI-HC or
interRAI HC,
collected by
designated
assessors,
registered
healthcare
providers, who
have received
training on the
administration
of the tools.
Wait time:
Number of
days between
service
authorisation
and formal in-
home nursing.
Numerator: This
indicator
measures the
percentage of
home care
patients
authorized for
nursing services
who received their
first nursing visit
within five days.
The wait time is
described as the
number of days
between service
authorization date
and the date of
Publicly funded home care
services, including publicly
funded services delivered by
private-sector agencies and
those funded and delivered
by the federal government
(eg Veterans Affairs). Home
care is delivered in the
community in private homes
and residential care settings,
as well as in hospitals and
ambulatory clinics. The
interRAI HC can be used to
assess persons with chronic
needs for care as well as
those with post-acute care
needs (eg after
RAI-HC
Risk adjustment at
individual client
level (individual
covariates) and
home care
organizational
level (direct
standardization).
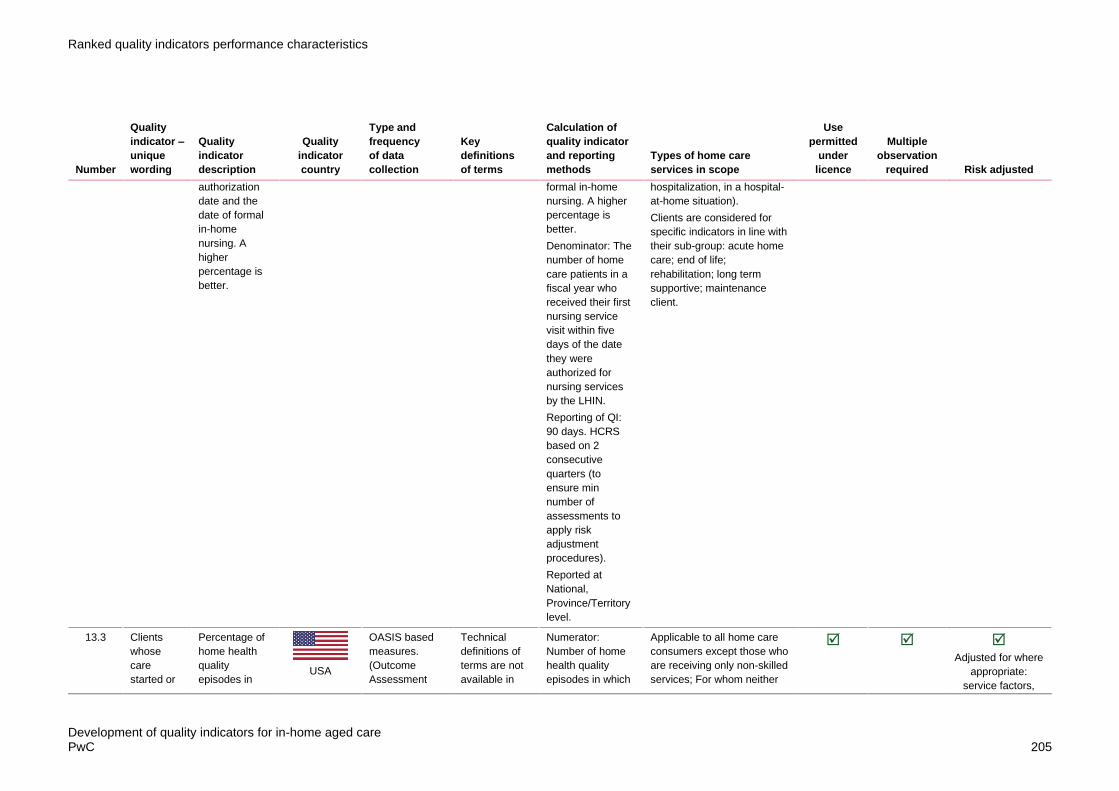
Ranked quality indicators performance characteristics
Development of quality indicators for in-home aged care PwC 205
Number
Quality
indicator –
unique
wording
Quality
indicator
description
Quality
indicator
country
Type and
frequency
of data
collection
Key
definitions
of terms
Calculation of
quality indicator
and reporting
methods
Types of home care
services in scope
Use
permitted
under
licence
Multiple
observation
required Risk adjusted
authorization
date and the
date of formal
in-home
nursing. A
higher
percentage is
better.
formal in-home
nursing. A higher
percentage is
better.
Denominator: The
number of home
care patients in a
fiscal year who
received their first
nursing service
visit within five
days of the date
they were
authorized for
nursing services
by the LHIN.
Reporting of QI:
90 days. HCRS
based on 2
consecutive
quarters (to
ensure min
number of
assessments to
apply risk
adjustment
procedures).
Reported at
National,
Province/Territory
level.
hospitalization, in a hospital-
at-home situation).
Clients are considered for
specific indicators in line with
their sub-group: acute home
care; end of life;
rehabilitation; long term
supportive; maintenance
client.
13.3 Clients
whose
care
started or
Percentage of
home health
quality
episodes in
USA
OASIS based
measures.
(Outcome
Assessment
Technical
definitions of
terms are not
available in
Numerator:
Number of home
health quality
episodes in which
Applicable to all home care
consumers except those who
are receiving only non-skilled
services; For whom neither
Adjusted for where
appropriate:
service factors,

Ranked quality indicators performance characteristics
Development of quality indicators for in-home aged care PwC 206
Number
Quality
indicator –
unique
wording
Quality
indicator
description
Quality
indicator
country
Type and
frequency
of data
collection
Key
definitions
of terms
Calculation of
quality indicator
and reporting
methods
Types of home care
services in scope
Use
permitted
under
licence
Multiple
observation
required Risk adjusted
resumed
on the
physician-
ordered
date (if
provided),
or
otherwise
within two
days of the
referral
date or
inpatient
discharge
date,
whichever
is later
which the start
or resumption
of care date
was on the
physician-
ordered
SOC/ROC date
(if provided),
otherwise was
within 2 days of
the referral
date or
inpatient
discharge date,
whichever is
later.
Information Set
(OASIS-D1)
(Standardized
Patient
Assessments,
non-HER
Electronic
Clinical Data)).
Entry of HH
service and the
last 5 days of
every 60 day
period
beginning with
the start of care
date.
Collected every
3 months
public
information.
the start or
resumption of care
date was on the
physician-ordered
SOC/ROC date (if
provided),
otherwise was
within 2 days of
the referral date or
inpatient discharge
date.
Denominator:
number of home
health quality
episodes ending
with discharge,
death, or transfer
to inpatient facility
during the
reporting period,
other than those
covered by
generic or
measure-specific
exclusions.
90 days. Home
Health Quality
Reporting (CMS
and providers).
Home Health
Compare (CMS,
providers and
publicly reported
online).
Medicare nor Medicaid is
paying for HH care (patients
receiving care under a
Medicare or Medicaid
Managed Care Plan are not
excluded from the OASIS
reporting requirement
provider factors,
demographic
factors, and clinical
factors.

Ranked quality indicators performance characteristics
Development of quality indicators for in-home aged care PwC 207
Number
Quality
indicator –
unique
wording
Quality
indicator
description
Quality
indicator
country
Type and
frequency
of data
collection
Key
definitions
of terms
Calculation of
quality indicator
and reporting
methods
Types of home care
services in scope
Use
permitted
under
licence
Multiple
observation
required Risk adjusted
13.4 Median
number of
days
clients
waited for
home care
services
This is the
median
number of days
that new clients
of publicly
funded home
care, who are
19 years or
older, waited
for home care.
It is measured
from a request
for services to
their first home
visit for those
who applied in
the community,
or from hospital
discharge to
their first home
visit for those
who applied in
the hospital. A
lower number
of days is
better.
Canada
RAI-HC or
interRAI HC,
collected by
designated
assessors,
registered
healthcare
providers, who
have received
training on the
administration
of the tools.
Wait time:
number of
days from
request for
service to the
first home visit.
Numerator: This is
the median
number of days
that new clients of
publicly funded
home care, who
are 19 years or
older, waited for
home care. It is
measured from a
request for
services to their
first home visit for
those who applied
in the community,
or from hospital
discharge to their
first home visit for
those who applied
in the hospital. A
lower number of
days is better.
Denominator: Wait
time, in days,
between
application/dischar
ge and first service
Reporting of QI:
90 days. HCRS
based on 2
consecutive
quarters (to
ensure min
number of
assessments to
apply risk
Publicly funded home care
services, including publicly
funded services delivered by
private-sector agencies and
those funded and delivered
by the federal government
(eg Veterans Affairs). Home
care is delivered in the
community in private homes
and residential care settings,
as well as in hospitals and
ambulatory clinics. The
interRAI HC can be used to
assess persons with chronic
needs for care as well as
those with post-acute care
needs (eg after
hospitalization, in a hospital-
at-home situation).
Clients are considered for
specific indicators in line with
their sub-group: acute home
care; end of life;
rehabilitation; long term
supportive; maintenance
client.
RAI-HC
Risk adjustment at
individual client
level (individual
covariates) and
home care
organizational
level (direct
standardization).

Ranked quality indicators performance characteristics
Development of quality indicators for in-home aged care PwC 208
Number
Quality
indicator –
unique
wording
Quality
indicator
description
Quality
indicator
country
Type and
frequency
of data
collection
Key
definitions
of terms
Calculation of
quality indicator
and reporting
methods
Types of home care
services in scope
Use
permitted
under
licence
Multiple
observation
required Risk adjusted
adjustment
procedures).
Reported at
National,
Province/Territory
level.
13.5 Median
number of
days
clients
waited for
services
following
Aged Care
Assessme
nt Program
assessmen
t approval
Wait time for
HCP.
AUS
Claims based
data. (PBS
medication
data)
12 monthly.
Technical
definitions not
publicly
available
Numerator: Wait
time from Aged
Care Assessment
Program (ACAP)
assessment
approval to
commencement of
first HCP, median
days (IQR)
To be published
publicly annually
at national level
and provided
privately to
individual facilities
at facility level (SA
only).
Home Care Package
consumers
Age, sex, number
of comorbidities
Stratified by
dementia status.
13.6 Median
number of
days
clients
waited for
services
from the
date that
the initial
referral
was
received
The median
number of
calendar days
that clients
waited, from
the date that
the initial
referral was
received to the
date when the
first home care
Canada
RAI-HC or
interRAI HC,
collected by
designated
assessors,
registered
healthcare
providers, who
have received
training on the
administration
of the tools.
. Technical
definitions not
publicly
available
Numerator:
Denominator: c
Reporting of QI:
90 days. HCRS
based on 2
consecutive
quarters (to
ensure min
number of
assessments to
apply risk
Publicly funded home care
services, including publicly
funded services delivered by
private-sector agencies and
those funded and delivered
by the federal government
(eg Veterans Affairs). Home
care is delivered in the
community in private homes
and residential care settings,
as well as in hospitals and
ambulatory clinics. The
RAI-HC
Risk adjustment at
individual client
level (individual
covariates) and
home care
organizational
level (direct
standardization).

Ranked quality indicators performance characteristics
Development of quality indicators for in-home aged care PwC 209
Number
Quality
indicator –
unique
wording
Quality
indicator
description
Quality
indicator
country
Type and
frequency
of data
collection
Key
definitions
of terms
Calculation of
quality indicator
and reporting
methods
Types of home care
services in scope
Use
permitted
under
licence
Multiple
observation
required Risk adjusted
service was
received.
adjustment
procedures).
Reported at
National,
Province/Territory
level.
interRAI HC can be used to
assess persons with chronic
needs for care as well as
those with post-acute care
needs (eg after
hospitalization, in a hospital-
at-home situation).
Clients are considered for
specific indicators in line with
their sub-group: acute home
care; end of life;
rehabilitation; long term
supportive; maintenance
client.
13.7 Number of
days
clients
waited for
services
from the
date of
application.
.
Waiting time
(number of
days) from
date of
application to
the date when
the person
receives home
care services.
Sweden
Data collected
by the
municipalities
yearly, derived
from national
surveys,
administrative
data, and
registries.
National
surveys: NBHW
survey – What
do the elderly
think about
elderly care?
(from
municipalities
and counties)
Official statistics
(administrative
data): Register
Technical
definitions of
terms are not
available
online.
Calculation
methods unknown
Publicly annually
at municipal level,
county level and
state. (Open
Comparisons
report annually
online) showing
providers’ quality
of care to the
elderly based on
the quality
indicators along
with grading of
their performance.
A relative
comparison
between
municipalities is
No further information
publicly available
Unknown Unknown

Ranked quality indicators performance characteristics
Development of quality indicators for in-home aged care PwC 210
Number
Quality
indicator –
unique
wording
Quality
indicator
description
Quality
indicator
country
Type and
frequency
of data
collection
Key
definitions
of terms
Calculation of
quality indicator
and reporting
methods
Types of home care
services in scope
Use
permitted
under
licence
Multiple
observation
required Risk adjusted
of Social
Services
Interventions for
the Elderly and
Persons with
Disability,
Patient
Register,
Register of
Medicines
National quality
registers:
Senior Alert
Registry,
Swedish
Palliative
Registry,
Dementia
Register,
Registry on
Behaviour and
Psychiatric
Symptoms.
provided using a
traffic light system.

Ranked quality indicators performance characteristics
Development of quality indicators for in-home aged care PwC 211
Table 28: Behavioural symptoms (in alphabetical order)
Number
Quality
indicator –
unique
wording
Quality
indicator
description
Quality
indicator
country
Type and
frequency
of data
collection
Key
definitions
of terms
Calculation of
quality indicator
and reporting
methods
Types of home care
services in scope
Use
permitted
under
licence
Multiple
observation
required Risk adjusted
14.1 Clients
who
improve in
their
frequency
of
experienci
ng
confusion
Percentage of
home health
quality
episodes of
care during
which patients
are confused
less often.
USA
OASIS based
measures.
(Outcome
Assessment
Information Set
(OASIS-D1)
(Standardized
Patient
Assessments,
non-HER
Electronic
Clinical Data)).
Entry of HH
service and the
last 5 days of
every 60 day
period
beginning with
the start of care
date.
Technical
definitions of
terms are not
available in
public
information.
Numerator:
Number of home
health quality
episodes of care
where the
discharge
assessment
indicates the
patient is confused
less often at
discharge than at
start (or
resumption) of
care.
Denominator:
Number of home
health quality
episodes of care
ending with a
discharge during
the reporting
period, other than
those covered by
generic or
measure-specific
exclusions.
Exclusion:
Denominator
exclusions: Home
health quality
episodes of care
for which the
patient, at
start/resumption of
Applicable to all home care
consumers except those who
are receiving only non-skilled
services; For whom neither
Medicare nor Medicaid is
paying for HH care (patients
receiving care under a
Medicare or Medicaid
Managed Care Plan are not
excluded from the OASIS
reporting requirement
Adjusted for where
appropriate: age,
sex, payment
source, care
start/admission
source, risk of
hospitalisation,
available
assistance, clinical
factors (pain,
pressure ulcer,
stasis ulcer,
dyspnoea, urinary
status, bowel
incontinence,
cognitive function,
anxiety, confusion,
depression
screening,
behavioural
symptoms), ADLs,
medication
management,
supervision/safety
assistance, health
condition
diagnoses.

Ranked quality indicators performance characteristics
Development of quality indicators for in-home aged care PwC 212
Number
Quality
indicator –
unique
wording
Quality
indicator
description
Quality
indicator
country
Type and
frequency
of data
collection
Key
definitions
of terms
Calculation of
quality indicator
and reporting
methods
Types of home care
services in scope
Use
permitted
under
licence
Multiple
observation
required Risk adjusted
care, was not
confused at any
time, episodes that
end with inpatient
facility transfer or
death, or patient is
nonresponsive.
90 days.
Home Health
Quality Reporting
(CMS and
providers)
14.2 Clients
whose
communic
ation ability
declined
(problems
understand
ing, or
being
understood
by, other
people)
Percentage of
clients whose
communication
ability declined
(problems
understanding,
or being
understood by,
other people).
Communicatio
n ability scale.
Incidence
indicator.
Canada
90 days.
RAI-HC or
interRAI HC,
collected by
designated
assessors,
registered
healthcare
providers, who
have received
training on the
administration
of the tools.
Not available
publicly
Numerator:
Clients with
worsened
communication
ability on their
target assessment
compared with
their previous
assessment.
Denominator: All
HC clients (must
have target
assessment and
had an
assessment 3-15
months prior).
90 days. HCRS
based on 2
consecutive
quarters (to
ensure min
number of
assessments to
Publicly funded home care
services, including publicly
funded services delivered by
private-sector agencies and
those funded and delivered
by the federal government
(eg Veterans Affairs). Home
care is delivered in the
community in private homes
and residential care settings,
as well as in hospitals and
ambulatory clinics. The
interRAI HC can be used to
assess persons with chronic
needs for care as well as
those with post-acute care
needs (eg after
hospitalization, in a hospital-
at-home situation).
Clients are considered for
specific indicators in line with
their sub-group: acute home
care; end of life;
RAI-HC
Risk adjustment at
individual client
level (individual
covariates) and
home care
organizational
level (direct
standardization).

Ranked quality indicators performance characteristics
Development of quality indicators for in-home aged care PwC 213
Number
Quality
indicator –
unique
wording
Quality
indicator
description
Quality
indicator
country
Type and
frequency
of data
collection
Key
definitions
of terms
Calculation of
quality indicator
and reporting
methods
Types of home care
services in scope
Use
permitted
under
licence
Multiple
observation
required Risk adjusted
apply risk
adjustment
procedures).
Reported at
National,
Province/Territory
level.
rehabilitation; long term
supportive; maintenance
client.
14.3 Clients
with a
score of
less than 8
on the
communic
ation scale
(problems
understand
ing others
or making
themselves
understood
) who
experience
a decline
(over 6
months)
Proportion of
HC clients with
a score of less
than 8 on the
communication
scale at
baseline who
experience a
decline (higher
score on the
communication
scale).
Includes clients
with new
difficulties in
communication
. Incidence
indicator.
EU
6 monthly.
Data collected
using RAI-HC
European but
using 2nd
generation
European
interRAI HCQIs.
Data collected
by specially
trained
assessors,
usually nurses,
who verify
collected
information that
included direct
interviews of
home care
clients and
family
members, as
well as review
of physician
reports medical
records.
Technical
definitions not
available in the
public domain
Numerator:
Number of HC
clients with a
score of less than
8 on the
communication
scale at baseline
who experience a
decline (higher
score on the
communication
scale). Includes
clients with new
difficulties in
communication.
Incidence
indicator.
Denominator: All
HC clients with
both baseline and
target assessment
(at 6 months).
Reporting in
publication level
for 7 countries:
Czech Republic,
Denmark, Finland,
Germany, Italy,
Information is not publicly
available
European
interRAI
HCQIs
Adjusted for:
difficulty managing
finances,
managing
medications, and
with phone use,
Alzheimer’s
disease, clinical
risk, ADL hierarchy
scale score.
Stratification: IADL
performance scale

Ranked quality indicators performance characteristics
Development of quality indicators for in-home aged care PwC 214
Number
Quality
indicator –
unique
wording
Quality
indicator
description
Quality
indicator
country
Type and
frequency
of data
collection
Key
definitions
of terms
Calculation of
quality indicator
and reporting
methods
Types of home care
services in scope
Use
permitted
under
licence
Multiple
observation
required Risk adjusted
and the
Netherlands for
HC recipients.
https://www.ncbi.nl
m.nih.gov/pmc/arti
cles/PMC4647796
/#Sec12
14.4 Clients
with
delirium
Prevalence of
clients with
delirium
Switzerland
Swiss RAI-HC
data are
measured
within a 90-day
period at entry
to home care
services
(baseline) and
calculated six
monthly unless
there is a
significant
clinical change.
Technical
definitions of
terms are not
publicly
available
Collection method
unknown.
The Swiss RAI-HC
QIs only used for
internal quality
management in
non-profit home
care organisations
and there are no
national standards
for home care.
No cantonal
(regions) or
national agencies
are collecting this
data or publicly
report on quality of
care indicators.
Information is not publicly
available
Swiss RAI-
HC
14.5 Clients
with some
difficulty on
the
communic
ation scale
(problems
understand
ing others
or making
Proportion of
HC clients with
some difficulty
in the
communication
scale
(problems
understanding
others or
making
EU
6 monthly.
Data collected
using RAI-HC
European but
using 2nd
generation
European
interRAI HCQIs.
Technical
definitions not
available in the
public domain
Numerator:
Number of HC
clients with some
difficulty in the
communication
scale (problems
understanding
others or making
themselves
understood) at
Information is not publicly
available
European
interRAI
HCQIs
Yes.
Adjusted for:
dementia (both
Alzheimer’s and
non), clinical risk,
sadness, Cognitive
Performance Scale
score, ADL

Ranked quality indicators performance characteristics
Development of quality indicators for in-home aged care PwC 215
Number
Quality
indicator –
unique
wording
Quality
indicator
description
Quality
indicator
country
Type and
frequency
of data
collection
Key
definitions
of terms
Calculation of
quality indicator
and reporting
methods
Types of home care
services in scope
Use
permitted
under
licence
Multiple
observation
required Risk adjusted
themselves
understood
) who
experience
an
improveme
nt (over 6
months)
themselves
understood) at
baseline who
experience an
improvement
(lower score on
the
communication
scale).
Incidence
indicator.
Data collected
by specially
trained
assessors,
usually nurses,
who verify
collected
information that
included direct
interviews of
home care
clients and
family
members, as
well as review
of physician
reports medical
records.
baseline who
experience an
improvement
(lower score on
the communication
scale). Incidence
indicator.
Denominator: All
HC clients with
some difficulty in
communication
impairment at
baseline and both
baseline and
target assessment
(at 6 months).
Reporting in
publication level
for 7 countries:
Czech Republic,
Denmark, Finland,
Germany, Italy,
and the
Netherlands for
HC recipients.
https://www.ncbi.nl
m.nih.gov/pmc/arti
cles/PMC4647796
/#Sec12
hierarchy scale
score, age over 80
years.
Stratification: IADL
capacity scale

Ranked quality indicators performance characteristics
Development of quality indicators for in-home aged care PwC 216
Table 29: Infection (including antibiotics and vaccinations) (in alphabetical order)
Number
Quality
indicator –
unique
wording
Quality
indicator
description
Quality
indicator
country
Type and
frequency
of data
collection
Key
definitions
of terms
Calculation of
quality indicator
and reporting
methods
Types of home care
services in scope
Use
permitted
under
licence
Multiple
observation
required Risk adjusted
15.1 Clients
who are
offered and
decline the
influenza
vaccination
for the
current flu
season
Percentage of
home health
quality
episodes of
care during
which patients
were offered
and refused
influenza
immunization
for the current
flu season.
USA
OASIS based
measures.
(Outcome
Assessment
Information Set
(OASIS-D1)
(Standardized
Patient
Assessments,
non-HER
Electronic
Clinical Data)).
Entry of HH
service and the
last 5 days of
every 60 day
period
beginning with
the start of care
date.
Technical
definitions of
terms are not
available in
public
information.
Numerator:
Number of home
health quality
episodes of care
during which
patients were
offered and
refused influenza
immunization for
the current flu
season.
Denominator:
Number of home
health quality
episodes of care
ending with a
discharge or
transfer to
inpatient facility
during the
reporting period,
other than those
covered by
generic or
measure-specific
exclusions.
Exclusions:
Denominator
exclusions: Home
health quality
episodes care for
which no care was
provided during
October 1 – March
Applicable to all home care
consumers except those who
are receiving only non-skilled
services; For whom neither
Medicare nor Medicaid is
paying for HH care (patients
receiving care under a
Medicare or Medicaid
Managed Care Plan are not
excluded from the OASIS
reporting requirement
Adjusted for where
appropriate: age,
sex, payment
source, care
start/admission
source, risk of
hospitalisation,
available
assistance, clinical
factors (pain,
pressure ulcer,
stasis ulcer,
dyspnoea, urinary
status, bowel
incontinence,
cognitive function,
anxiety, confusion,
depression
screening,
behavioural
symptoms), ADLs,
medication
management,
supervision/safety
assistance, health
condition
diagnoses.

Ranked quality indicators performance characteristics
Development of quality indicators for in-home aged care PwC 217
Number
Quality
indicator –
unique
wording
Quality
indicator
description
Quality
indicator
country
Type and
frequency
of data
collection
Key
definitions
of terms
Calculation of
quality indicator
and reporting
methods
Types of home care
services in scope
Use
permitted
under
licence
Multiple
observation
required Risk adjusted
31, OR the patient
died, or the patient
does not meet
age/condition
guidelines for
influenza vaccine.
90 days.
Home Health
Quality Reporting
(CMS and
providers)
15.2 Clients
who did
not receive
the
influenza
vaccination
(incidence)
Percentage of
clients who did
not receive the
influenza
vaccination.
Incidence
indicator.
Canada
90 days.
RAI-HC or
interRAI HC,
collected by
designated
assessors,
registered
healthcare
providers, who
have received
training on the
administration
of the tools.
Technical
definitions of
terms are not
available in the
public domain
Numerator: Total
number of clients
who did not
receive the
influenza
vaccination at
either target
assessment or in
prior assessments
(within 6-months).
Denominator:
Total number of
HC clients.
90 days. HCRS
based on 2
consecutive
quarters (to
ensure min
number of
assessments to
apply risk
adjustment
procedures).
Publicly funded home care
services, including publicly
funded services delivered by
private-sector agencies and
those funded and delivered
by the federal government
(eg Veterans Affairs). Home
care is delivered in the
community in private homes
and residential care settings,
as well as in hospitals and
ambulatory clinics. The
interRAI HC can be used to
assess persons with chronic
needs for care as well as
those with post-acute care
needs (eg after
hospitalization, in a hospital-
at-home situation).
Clients are considered for
specific indicators in line with
their sub-group: acute home
care; end of life;
rehabilitation; long term
RAI-HC
Risk adjustment at
individual client
level (individual
covariates) and
home care
organizational
level (direct
standardization)
Stratified by ADL
summary scale.

Ranked quality indicators performance characteristics
Development of quality indicators for in-home aged care PwC 218
Number
Quality
indicator –
unique
wording
Quality
indicator
description
Quality
indicator
country
Type and
frequency
of data
collection
Key
definitions
of terms
Calculation of
quality indicator
and reporting
methods
Types of home care
services in scope
Use
permitted
under
licence
Multiple
observation
required Risk adjusted
Reported at
National,
Province/Territory
level.
supportive; maintenance
client.
15.3 Clients
who did
not receive
the
influenza
vaccination
(prevalence)
Proportion of
HC clients who
did not receive
an influenza
vaccination at
either baseline
or 6-month
follow-up
assessments.
Prevalence
indicator.
EU
6 monthly.
Data collected
using RAI-HC
European but
using 2nd
generation
European
interRAI HCQIs.
Data collected
by specially
trained
assessors,
usually nurses,
who verify
collected
information that
included direct
interviews of
home care
clients and
family
members, as
well as review
of physician
reports and
medical
records.
Technical
definitions of
terms are not
available in the
public domain
Numerator:
Number of HC
clients who did not
receive an
influenza
vaccination at
either baseline or
6-month follow-up
assessments.
Prevalence
indicator.
Denominator: All
HC clients with a
baseline and
target
assessment.
Reporting in
publication level
for 7 countries:
Czech Republic,
Denmark, Finland,
Germany, Italy,
and the
Netherlands for
HC recipients.
https://www.ncbi.nl
m.nih.gov/pmc/arti
cles/PMC4647796
/#Sec12
Information is not publicly
available
European
interRAI
HCQIs
Adjusted for: less
than 2 h of daily
activity,
institutional risk,
Cognitive
Performance Scale
score, depression
rating scale score.
Stratification:
clinical risk.

Ranked quality indicators performance characteristics
Development of quality indicators for in-home aged care PwC 219
Number
Quality
indicator –
unique
wording
Quality
indicator
description
Quality
indicator
country
Type and
frequency
of data
collection
Key
definitions
of terms
Calculation of
quality indicator
and reporting
methods
Types of home care
services in scope
Use
permitted
under
licence
Multiple
observation
required Risk adjusted
15.4 Clients
who
received
the
influenza
vaccination
for the
current flu
season
Percentage of
home health
quality
episodes of
care during
which patients
received
influenza
immunization
for the current
flu season.
USA
OASIS based
measures.
(Outcome
Assessment
Information Set
(OASIS-D1)
(Standardized
Patient
Assessments,
non-HER
Electronic
Clinical Data)).
Entry of HH
service and the
last 5 days of
every 60 day
period
beginning with
the start of care
date.
Technical
definitions of
terms are not
available in
public
information.
Numerator:
Number of home
health quality
episodes of care
during which the
patient a) received
vaccination from
the HHA or b) had
received
vaccination from
HHA during earlier
episode of care, or
c) was determined
to have received
vaccination from
another provider.
Denominator:
Number of home
health quality
episodes of care
ending with a
discharge or
transfer to
inpatient facility
during the
reporting period,
other than those
covered by
generic or
measure-specific
exclusions.
Exclusions:
Denominator
exclusions: Home
health quality
episodes care for
Applicable to all home care
consumers except those who
are receiving only non-skilled
services; For whom neither
Medicare nor Medicaid is
paying for HH care (patients
receiving care under a
Medicare or Medicaid
Managed Care Plan are not
excluded from the OASIS
reporting requirement
Adjusted for where
appropriate: age,
sex, payment
source, care
start/admission
source, risk of
hospitalisation,
available
assistance, clinical
factors (pain,
pressure ulcer,
stasis ulcer,
dyspnoea, urinary
status, bowel
incontinence,
cognitive function,
anxiety, confusion,
depression
screening,
behavioural
symptoms), ADLs,
medication
management,
supervision/safety
assistance, health
condition diagnose

Ranked quality indicators performance characteristics
Development of quality indicators for in-home aged care PwC 220
Number
Quality
indicator –
unique
wording
Quality
indicator
description
Quality
indicator
country
Type and
frequency
of data
collection
Key
definitions
of terms
Calculation of
quality indicator
and reporting
methods
Types of home care
services in scope
Use
permitted
under
licence
Multiple
observation
required Risk adjusted
which no care was
provided during
October 1 – March
31, OR the patient
died, or the patient
does not meet
age/condition
guidelines for
influenza vaccine.
90 days.
Home Health
Quality Reporting
(CMS and
providers). Home
Health Compare
(CMS, providers
and publicly
reported online).
15.5 Clients
who were
did not
receive the
current
influenza
immunizati
on due to
medical
contraindic
ation
Percentage of
home health
quality
episodes of
care during
which patients
were
determined to
have medical
contraindicatio
n(s) to
receiving
influenza
immunization.
USA
OASIS based
measures.
(Outcome
Assessment
Information Set
(OASIS-D1)
(Standardized
Patient
Assessments,
non-HER
Electronic
Clinical Data)).
Entry of HH
service and the
last 5 days of
every 60 day
period
Technical
definitions of
terms are not
available in
public
information.
Numerator:
Number of home
health quality
episodes of care
during which
patients were
determined to
have medical
contraindication(s)
to receiving
influenza
vaccination.
Denominator:
Number of home
health quality
episodes of care
ending with a
Applicable to all home care
consumers except those who
are receiving only non-skilled
services; For whom neither
Medicare nor Medicaid is
paying for HH care (patients
receiving care under a
Medicare or Medicaid
Managed Care Plan are not
excluded from the OASIS
reporting requirement
Adjusted for where
appropriate: age,
sex, payment
source, care
start/admission
source, risk of
hospitalisation,
available
assistance, clinical
factors (pain,
pressure ulcer,
stasis ulcer,
dyspnoea, urinary
status, bowel
incontinence,
cognitive function,
Ranked quality indicators performance characteristics
Development of quality indicators for in-home aged care PwC 221
Number
Quality
indicator –
unique
wording
Quality
indicator
description
Quality
indicator
country
Type and
frequency
of data
collection
Key
definitions
of terms
Calculation of
quality indicator
and reporting
methods
Types of home care
services in scope
Use
permitted
under
licence
Multiple
observation
required Risk adjusted
beginning with
the start of care
date.
discharge or
transfer to
inpatient facility
during the
reporting period,
other than those
covered by
generic or
measure-specific
exclusions.
Exclusions:
Denominator
exclusions: Home
health quality
episodes care for
which no care was
provided during
October 1 – March
31, OR the patient
died, or the patient
does not meet
age/condition
guidelines for
influenza vaccine.
90 days.
Home Health
Quality Reporting
(CMS and
providers)
anxiety, confusion,
depression
screening,
behavioural
symptoms), ADLs,
medication
management,
supervision/safety
assistance, health
condition diagnose
15.6 Clients
with a
respiratory
infection
(in the last
30 days)
Respiratory
infection in the
last 30 days
Japan
Data collected
by service
providers
(nurses or case
managers) and
Technical
definitions of
terms are not
available in the
public domain.
Collection method
unknown.
No information in the public
domain
Unknown Unknown

Ranked quality indicators performance characteristics
Development of quality indicators for in-home aged care PwC 222
Number
Quality
indicator –
unique
wording
Quality
indicator
description
Quality
indicator
country
Type and
frequency
of data
collection
Key
definitions
of terms
Calculation of
quality indicator
and reporting
methods
Types of home care
services in scope
Use
permitted
under
licence
Multiple
observation
required Risk adjusted
client/family
members.
30 days
lookback
period.
15.7 Clients
with a
urinary
tract
infection
(in the last
30 days)
Urinary tract
infection in the
last 30 days
Japan
Data collected
by service
providers
(nurses or case
managers) and
client/family
members.
30 days
lookback
period.
Technical
definitions of
terms are not
available in the
public domain.
Collection method
unknown.
No information in the public
domain
Unknown Unknown
15.8 Clients
with a
urinary
tract
infection
(incidence)
not available
China
The data for the
validation study
were collected
directly from
each home care
provider by
trained research
staff.
Reporting/
employment of
indicators.
Technical
definitions of
terms are not
available in the
public domain.
Collection method
unknown.
Little is known
about the
implementation
and/or reporting of
home care QIs in
China.
No information in the public
domain
Unknown Unknown

Ranked quality indicators performance characteristics
Development of quality indicators for in-home aged care PwC 223
Table 30: Cognition (in alphabetical order)
Number
Quality
indicator –
unique
wording
Quality
indicator
description
Quality
indicator
country
Type and
frequency
of data
collection
Key
definitions
of terms
Calculation of
quality indicator
and reporting
methods
Types of home care
services in scope
Use
permitted
under
licence
Multiple
observation
required Risk adjusted
16.1 Clients
with a
score of
less than 6
on the
Cognitive
Perfor-
mance
Scale at
baseline
who
experience
a further
decline
(over 6
months)
Proportion of
HC clients with
a score of less
than 6 on the
Cognitive
Performance
Scale at
baseline who
experience a
further decline.
Includes clients
who
experience a
new cognitive
impairment.
Incidence
indicator.
EU
6 monthly.
Data collected
using RAI-HC
European but
using 2nd
generation
European
interRAI HCQIs.
Data collected
by specially
trained
assessors,
usually nurses,
who verify
collected
information that
included direct
interviews of
home care
clients and
family
members, as
well as review
of physician
reports medical
records.
Technical
definitions of
terms are not
available in the
public domain.
Numerator:
Number of HC
clients with a
score of less than
6 on the Cognitive
Performance
Scale at baseline
who experience a
further decline.
Includes clients
who experience a
new cognitive
impairment.
Incidence
indicator.
Denominator: All
HC clients with
both baseline and
target assessment
(at 6 months).
Reporting in
publication level
for 7 countries:
Czech Republic,
Denmark, Finland,
Germany, Italy,
and the
Netherlands for
HC recipients.
https://www.ncbi.nl
m.nih.gov/pmc/arti
cles/PMC4647796
/#Sec12
Information is not publicly
available
European
interRAI
HCQIs

Ranked quality indicators performance characteristics
Development of quality indicators for in-home aged care PwC 224
Number
Quality
indicator –
unique
wording
Quality
indicator
description
Quality
indicator
country
Type and
frequency
of data
collection
Key
definitions
of terms
Calculation of
quality indicator
and reporting
methods
Types of home care
services in scope
Use
permitted
under
licence
Multiple
observation
required Risk adjusted
16.2 Clients
with
cognitive
disorders
(over the
last 30
days)
Cognitive
disorders in the
last 30 days
Japan
Data collected
by service
providers
(nurses or case
managers) and
client/family
members.
30 days
lookback
period.
Technical
definitions of
terms are not
available in the
public domain.
Collection method
unknown.
No information in the public
domain
Unknown Unknown
16.3 Clients
with
cognitive
impairment
Unknown.
China
The data for the
validation study
were collected
directly from
each home care
provider by
trained research
staff.
Reporting/
employment of
indicators
Technical
definitions of
terms are not
available in the
public domain.
Collection method
unknown.
Little is known
about the
implementation
and/or reporting of
home care QIs in
China.
No information in the public
domain
Unknown Unknown Unknown
16.4 Clients
with some
baseline
cognitive
impairment
on the
Cognitive
Performan
ce Scale
who
experience
an
improve-
Proportion of
HC clients with
some baseline
cognitive
impairment on
the Cognitive
Performance
Scale who
experience an
improvement.
Incidence
indicator.
EU
6 monthly.
Data collected
using RAI-HC
European but
using 2nd
generation
European
interRAI HCQIs.
Data collected
by specially
trained
assessors,
usually nurses,
Technical
definitions of
terms are not
available in the
public domain.
Numerator:
Number of HC
clients with some
baseline cognitive
impairment on the
Cognitive
Performance
Scale at baseline
who experience an
improvement
Denominator: All
HC clients with
some cognitive
impairment at
Information is not publicly
available
European
interRAI
HCQIs
Adjusted for:
difficulty with
phone use,
impaired decision
making,
Alzheimer’s
diagnosis, clinical
risk, not
independent
cognition, less
than 2 h of activity
daily, Cognitive

Ranked quality indicators performance characteristics
Development of quality indicators for in-home aged care PwC 225
Number
Quality
indicator –
unique
wording
Quality
indicator
description
Quality
indicator
country
Type and
frequency
of data
collection
Key
definitions
of terms
Calculation of
quality indicator
and reporting
methods
Types of home care
services in scope
Use
permitted
under
licence
Multiple
observation
required Risk adjusted
ment (over
6 months)
who verify
collected
information that
included direct
interviews of
home care
clients and
family
members, as
well as review
of physician
reports and
medical
records.
baseline and both
baseline and
target assessment
(at 6 months).
Reporting in
publication level
for 7 countries:
Czech Republic,
Denmark, Finland,
Germany, Italy,
and the
Netherlands for
HC recipients.
https://www.ncbi.nl
m.nih.gov/pmc/arti
cles/PMC4647796
/#Sec12
Performance Scale
score.
Stratification: IADL
summary scale
16.5 Percentage
of clients
whose
cognitive
ability
declined
(assessed
on the
Cognitive
Performan
ce Scale)
Percentage of
clients whose
cognitive ability
declined
(assessed by
Cognitive
Performance
Scale).
CPS:
summarizes
the patient’s
cognitive status
based on RAI-
MDS 2.0
assessment
items relating
to short-term
memory, ability
Canada
90 days.
RAI-HC or
interRAI HC,
collected by
designated
assessors,
registered
healthcare
providers, who
have received
training on the
administration
of the tools.
Technical
definitions of
terms are not
available in the
public domain.
Numerator: HC
clients with a lower
Cognitive
Performance
Scale (CPS) score
on their target
assessment
compared with
their prior
assessment.
Denominator: All
HC clients (must
have target
assessment and
had an
assessment 3-15
months prior).
Publicly funded home care
services, including publicly
funded services delivered by
private-sector agencies and
those funded and delivered
by the federal government
(eg Veterans Affairs). Home
care is delivered in the
community in private homes
and residential care settings,
as well as in hospitals and
ambulatory clinics. The
interRAI HC can be used to
assess persons with chronic
needs for care as well as
those with post-acute care
needs (eg after
RAI-HC
Risk adjustment at
individual client
level (individual
covariates) and
home care
organizational
level (direct
standardization).
Stratified by IADL
performance
score.

Ranked quality indicators performance characteristics
Development of quality indicators for in-home aged care PwC 226
Number
Quality
indicator –
unique
wording
Quality
indicator
description
Quality
indicator
country
Type and
frequency
of data
collection
Key
definitions
of terms
Calculation of
quality indicator
and reporting
methods
Types of home care
services in scope
Use
permitted
under
licence
Multiple
observation
required Risk adjusted
to make daily
decisions,
making self-
understood
and eating.
Incidence
indicator.
90 days. HCRS
based on 2
consecutive
quarters (to
ensure min
number of
assessments to
apply risk
adjustment
procedures).
Reported at
National,
Province/Territory
level.
hospitalization, in a hospital-
at-home situation).
Clients are considered for
specific indicators in line with
their sub-group: acute home
care; end of life;
rehabilitation; long term
supportive; maintenance
client.

Ranked quality indicators performance characteristics
Development of quality indicators for in-home aged care PwC 227
Table 31: Palliative Care (in alphabetical order)
Number
Quality
indicator –
unique
wording
Quality
indicator
description
Quality
indicator
country
Type and
frequency
of data
collection
Key
definitions
of terms
Calculation of
quality indicator
and reporting
methods
Types of home care
services in scope
Use
permitted
under
licence
Multiple
observation
required Risk adjusted
17.1 Clients who
had an
assess-
ment of
pain in the
7 days
before
death
Percentage of
persons
deceased at
age 65 or older
who had an
assessment of
pain during
their last week
in life.
Sweden
Data collected
by the
municipalities
yearly, derived
from national
surveys,
administrative
data, and
registries.
National
surveys: NBHW
survey – What
do the elderly
think about
elderly care?
(from
municipalities
and counties)
Official statistics
(administrative
data): Register
of Social
Services
Interventions for
the Elderly and
Persons with
Disability,
Patient
Register,
Register of
Medicines
National quality
registers:
Senior Alert
Technical
definitions of
terms are not
available
online.
Calculation
method unknown.
Publicly annually
at municipal level,
county level and
state. (Open
Comparisons
report annually
online) showing
providers’ quality
of care to the
elderly based on
the quality
indicators along
with grading of
their performance.
A relative
comparison
between
municipalities is
provided using a
traffic light system.
No information publicly
available
Unknown Unknown

Ranked quality indicators performance characteristics
Development of quality indicators for in-home aged care PwC 228
Number
Quality
indicator –
unique
wording
Quality
indicator
description
Quality
indicator
country
Type and
frequency
of data
collection
Key
definitions
of terms
Calculation of
quality indicator
and reporting
methods
Types of home care
services in scope
Use
permitted
under
licence
Multiple
observation
required Risk adjusted
Registry,
Swedish
Palliative
Registry,
Dementia
Register,
Registry on
Behaviour and
Psychiatric
Symptoms.
17.2 Clients
who had
an
unplanned
visit to the
Emergency
Departmen
t in the 30
days
before
death
This is the
percentage of
publicly funded
home care
clients, of all
ages, who had
an unplanned
visit to the
emergency
department in
the last 30
days of life. A
lower
percentage of
clients is
better.
Unplanned
visits in the last
month of life
could indicate
they did not
receive the
care they
needed in the
community.
Canada
Claims based
data.
Home Care
Database
(HCD), National
Ambulatory
Care Reporting
System
(NACRS),
PCCF+ version
5k6A,
Registered
Persons
Database
(RPDB)
Technical
definitions of
terms are not
available in the
public domain
Numerator: The
number of
descendants
specified in the
denominator who
had at least one
unplanned
emergency
department visit
within 30 days
before death.
Denominator: The
number of home
care clients who
died in the given
fiscal year.
Exclusions: Not all
emergency
department visits
are avoidable and
do not always
represent poor
quality care.
Public Reports
(annual report,
Publicly funded home care
services, including publicly
funded services delivered by
private-sector agencies and
those funded and delivered
by the federal government
(eg Veterans Affairs). Home
care is delivered in the
community in private homes
and residential care settings,
as well as in hospitals and
ambulatory clinics. The
interRAI HC can be used to
assess persons with chronic
needs for care as well as
those with post-acute care
needs (eg after
hospitalization, in a hospital-
at-home situation).
Clients are considered for
specific indicators in line with
their sub-group: acute home
care; end of life;
rehabilitation; long term
RAI-HC
Unknown

Ranked quality indicators performance characteristics
Development of quality indicators for in-home aged care PwC 229
Number
Quality
indicator –
unique
wording
Quality
indicator
description
Quality
indicator
country
Type and
frequency
of data
collection
Key
definitions
of terms
Calculation of
quality indicator
and reporting
methods
Types of home care
services in scope
Use
permitted
under
licence
Multiple
observation
required Risk adjusted
bulletins, and
theme reports)
supportive; maintenance
client.
17.3 Clients
who lived
in the
community
and
received at
least one
home care
service in
the 30
days
before
death
This indicator
measures the
percentage of
people, who
lived in the
community
during their last
30 days who
received at
least one home
care service
within that
period,
reported as
any home care
or palliative
care
Canada
Continuing Care
Reporting
System
(CCRS),
Discharge
Abstract
Database
(DAD), Home
Care Database
(HCD), National
Ambulatory
Care Reporting
System
(NACRS),
National
Rehabilitation
Reporting
System (NRS),
Ontario Mental
Health
Reporting
System
(OMHRS),
Postal Code
Conversion File
Plus (PCCF+),
Registered
Persons
Database
(RPDB)
Technical
definitions of
terms are not
available in the
public domain
Numerator:
Number of people
specified in the
denominator, who
received at least
one home care
service during
their last 30 days
of life, reported as
any home care or
palliative care.
Denominator:
Number of people
who died and were
in the community
in the last 30 days
of their life.
Exclusions: The
data don’t show
information on the
details and quality
of the home care,
health care needs,
preferences, and
appropriateness of
the care
Public reports.
Reported Levels of
comparability/
stratifications
include Income,
Region, Rurality,
Sex, Time
Publicly funded home care
services, including publicly
funded services delivered by
private-sector agencies and
those funded and delivered
by the federal government
(eg Veterans Affairs). Home
care is delivered in the
community in private homes
and residential care settings,
as well as in hospitals and
ambulatory clinics. The
interRAI HC can be used to
assess persons with chronic
needs for care as well as
those with post-acute care
needs (eg after
hospitalization, in a hospital-
at-home situation).
Clients are considered for
specific indicators in line with
their sub-group: acute home
care; end of life;
rehabilitation; long term
supportive; maintenance
client.
RAI-HC
Unknown Unknown

Ranked quality indicators performance characteristics
Development of quality indicators for in-home aged care PwC 230
Number
Quality
indicator –
unique
wording
Quality
indicator
description
Quality
indicator
country
Type and
frequency
of data
collection
Key
definitions
of terms
Calculation of
quality indicator
and reporting
methods
Types of home care
services in scope
Use
permitted
under
licence
Multiple
observation
required Risk adjusted
17.3 Involveme
nt of family
in guiding
palliative
care
programs
not available
China
The data for the
validation study
were collected
directly from
each home care
provider by
trained research
staff.
Reporting/
employment of
indicators.
Technical
definitions of
terms are not
available in the
public domain.
Collection method
unknown.
Little is known
about the
implementation
and/or reporting of
home care QIs in
China.
No information in the public
domain
Unknown Unknown
17.4 Mastery of
palliative
care skills
not available
China
The data for the
validation study
were collected
directly from
each home care
provider by
trained research
staff.
Reporting/
employment of
indicators.
Technical
definitions of
terms are not
available in the
public domain.
Collection method
unknown.
Little is known
about the
implementation
and/or reporting of
home care QIs in
China.
No information in the public
domain
Unknown Unknown

Ranked quality indicators performance characteristics
Development of quality indicators for in-home aged care PwC 231
Table 32: Other clinical (in alphabetical order)
Number
Quality
indicator –
unique
wording
Quality
indicator
description
Quality
indicator
country
Type and
frequency
of data
collection
Key
definitions
of terms
Calculation of
quality indicator
and reporting
methods
Types of home care
services in scope
Use
permitted
under
licence
Multiple
observation
required Risk adjusted
18.1 Cases of
unplanned
extubation
(incidence)
Unknown
China
The data for the
validation study
were collected
directly from
each home care
provider by
trained research
staff.
Reporting/
employment of
indicators.
Technical
definitions of
terms are not
available in the
public domain.
Collection method
unknown.
Little is known
about the
implementation
and/or reporting of
home care QIs in
China.
No information in the public
domain
Unknown Unknown
18.2 Clients
who have
mouth
problems
Prevalence of
clients who
have mouth
problems
Switzerland
Swiss RAI-HC
data are
measured
within a 90-day
period at entry
to home care
services
(baseline) and
calculated six
monthly unless
there is a
significant
clinical change.
Technical
definitions of
terms are not
publicly
available
Calculation
method unknown.
The Swiss RAI-HC
QIs only used for
internal quality
management in
non-profit home
care organisations
and there are no
national standards
for home care.
No cantonal
(regions) or
national agencies
are collecting this
data or publicly
report on quality of
care indicators.
Information not publicly
available
Swiss RAI-
HC
18.3 Clients
who
improve in
dyspnoea
Percentage of
home health
episodes of
care during
USA
OASIS based
measures.
(Outcome
Assessment
Technical
definitions of
terms are not
available in
Numerator:
Number of home
health episodes of
care where the
Applicable to all home care
consumers except those who
are receiving only non-skilled
services; For whom neither
Adjusted for where
appropriate: age,

Ranked quality indicators performance characteristics
Development of quality indicators for in-home aged care PwC 232
Number
Quality
indicator –
unique
wording
Quality
indicator
description
Quality
indicator
country
Type and
frequency
of data
collection
Key
definitions
of terms
Calculation of
quality indicator
and reporting
methods
Types of home care
services in scope
Use
permitted
under
licence
Multiple
observation
required Risk adjusted
which the
patient became
less short of
breath or
dyspneic.
Information Set
(OASIS-D1)
(Standardized
Patient
Assessments,
non-HER
Electronic
Clinical Data)).
Entry of HH
service and the
last 5 days of
every 60 day
period
beginning with
the start of care
date.
public
information.
discharge
assessment
indicates less
dyspnea at
discharge than at
start (or
resumption) of
care.
Denominator:
Number of home
health episodes of
care ending with a
discharge during
the reporting
period, other than
those covered by
generic or
measure-specific
exclusions.
Denominator
exclusions:
Denominator
exclusions: Home
health episodes of
care for which the
patient at the
start/resumption of
care was not short
of breath at any
time episodes that
end with inpatient
facility transfer or
death.
90 days.
Medicare nor Medicaid is
paying for HH care (patients
receiving care under a
Medicare or Medicaid
Managed Care Plan are not
excluded from the OASIS
reporting requirement
sex, payment
source, care
start/admission
source, risk of
hospitalisation,
available
assistance, clinical
factors (pain,
pressure ulcer,
stasis ulcer,
dyspnoea, urinary
status, bowel
incontinence,
cognitive function,
anxiety, confusion,
depression
screening,
behavioural
symptoms), ADLs,
medication
management,
supervision/safety
assistance, health
condition
diagnoses.

Ranked quality indicators performance characteristics
Development of quality indicators for in-home aged care PwC 233
Number
Quality
indicator –
unique
wording
Quality
indicator
description
Quality
indicator
country
Type and
frequency
of data
collection
Key
definitions
of terms
Calculation of
quality indicator
and reporting
methods
Types of home care
services in scope
Use
permitted
under
licence
Multiple
observation
required Risk adjusted
Home Health
Quality Reporting
(CMS and
providers).
Home Health
Compare (CMS,
providers and
publicly reported),
and is part of the 5
star quality rating
(CMS, providers
and publicly
reported online
includes 7 QIs).
18.4 Clients
with new or
reoccurring
pre-
existing
disease (in
the last 30
days)
Occurring new
disease or
reoccurring
pre-existing
disease in the
last 30 days
Japan
Data collected
by service
providers
(nurses or case
managers) and
client/family
members.
30 days
lookback
period.
Technical
definitions of
terms are not
available in the
public domain.
Collection method
unknown.
No information in the public
domain
Unknown Unknown
18.5 Clients
with poor
dyspnea
control (in
the last 30
days)
Poor dyspnea
control in the
last 30 days
Japan
Data collected
by service
providers
(nurses or case
managers) and
client/family
members.
30 days
lookback
period.
Technical
definitions of
terms are not
available in the
public domain.
Collection method
unknown.
No information in the public
domain
Unknown Unknown

Ranked quality indicators performance characteristics
Development of quality indicators for in-home aged care PwC 234
Table 33: Mortality (in alphabetical order)
Rank
Quality
indicator –
unique
wording
Quality
indicator
description
Quality
indicator
country
Type and
frequency
of data
collection
Key
definitions
of terms
Calculation of
quality indicator
and reporting
methods
Types of home care
services in scope
Use
permitted
under
licence
Multiple
observation
required Risk adjusted
19.1 Clients
who had a
premature
death
Proportion of
HCP episodes
where clients
had a
premature
death.
AUS
Claims based
data. (National
death index
data).
12 monthly.
Technical
definitions of
terms are not
available in the
public domain.
Numerator:
Number of HCP
episodes where
clients had a
premature death,
that is their main
cause of death is
‘external’ and
considered
potentially
avoidable.
Denominator:
Number of HCP
episodes.
To be published
publicly annually
at national level
and provided
privately to
individual facilities
at facility level (SA
only).
Consumers on Home Care
Packages
Age, sex, number
of comorbidities.

www.pwc.com.au
© 2018 PricewaterhouseCoopers. All rights reserved.
PwC refers to the Australian member firm, and may sometimes refer to the PwC network.
Each member firm is a separate legal entity. Please see www.pwc.com/structure for further details.
Liability limited by a scheme approved under Professional Standards Legislation