Development of Program Level Product Quality Metrics Robert Frouin 1, Rama Hampapuram 2, Greg Hunolt...
28
Development of Program Level Product Quality Metrics Robert Frouin 1 , Rama Hampapuram 2 , Greg Hunolt 3 , Kamel Didan 4, and others 5 1 Scripps Institution of Oceanography, 2 GSFC / ESDIS, 3 SGT, 4 UofA, 5 MEaSUREs PIs _________________________________ ESDSWG Meeting – MPARWG Breakout 20-22 October 2010, New Orleans
-
Upload
madelyn-putman -
Category
Documents
-
view
220 -
download
5
Transcript of Development of Program Level Product Quality Metrics Robert Frouin 1, Rama Hampapuram 2, Greg Hunolt...

Development of Program Level
Product Quality Metrics
Robert Frouin1, Rama Hampapuram2, Greg Hunolt3, Kamel
Didan4, and others5
1Scripps Institution of Oceanography, 2GSFC / ESDIS, 3SGT, 4UofA, 5MEaSUREs PIs
_________________________________
ESDSWG Meeting – MPARWG Breakout 20-22 October 2010, New Orleans
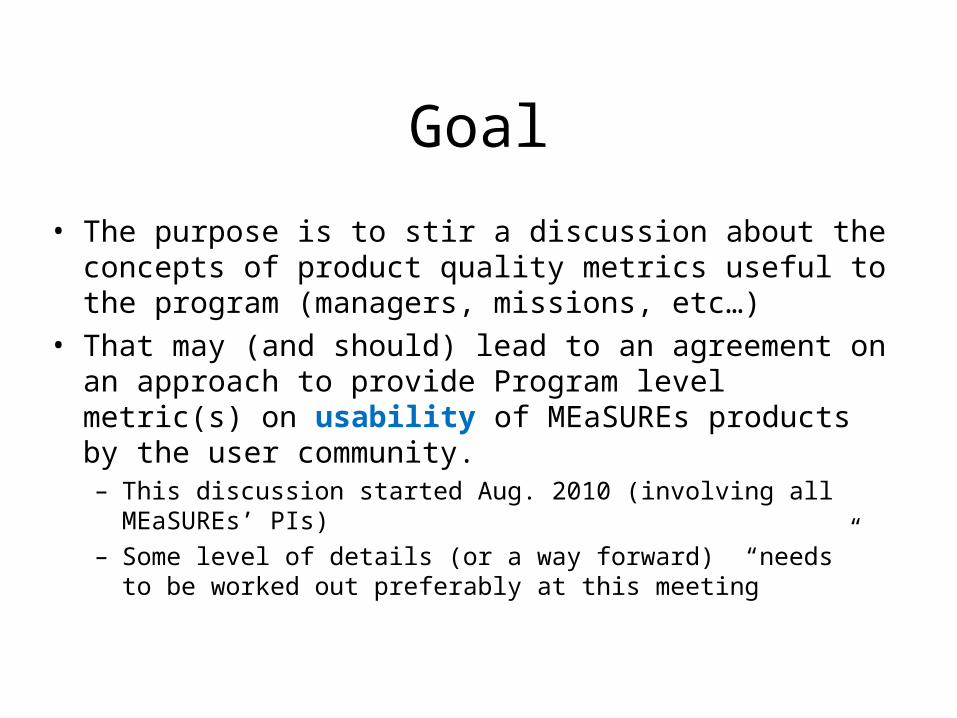
Goal
• The purpose is to stir a discussion about the concepts of product quality metrics useful to the program (managers, missions, etc…)
• That may (and should) lead to an agreement on an approach to provide Program level metric(s) on usability of MEaSUREs products by the user community.– This discussion started Aug. 2010 (involving all
MEaSUREs’ PIs)– Some level of details (or a way forward) “needs” to be
worked out preferably at this meeting

Context
• With global scale and multi-temporal data records increasingly available, easier to acquire and use for science, it becomes imperative that a programmatic level product quality metric be in place to insure they’re properly supporting science and policy making. There are four overarching themes:
• 1. Traceability (reproducibility, repeatability, etc…)• 2. Fidelity (high quality, known error and uncertainty,
etc…)• 3. Transparency (community algorithms, good practices,
documentation, interoperability, etc…)• 4. Impact (science, economics, society, etc…)
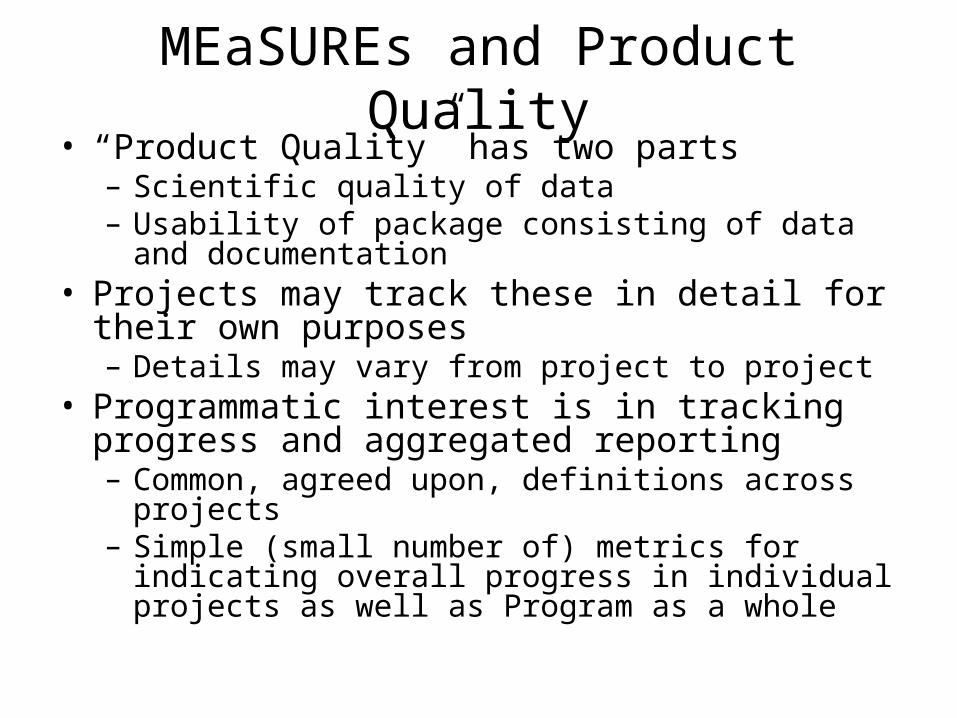
MEaSUREs and Product Quality
• “Product Quality” has two parts– Scientific quality of data– Usability of package consisting of data and
documentation• Projects may track these in detail for their
own purposes– Details may vary from project to project
• Programmatic interest is in tracking progress and aggregated reporting– Common, agreed upon, definitions across
projects– Simple (small number of) metrics for indicating
overall progress in individual projects as well as Program as a whole
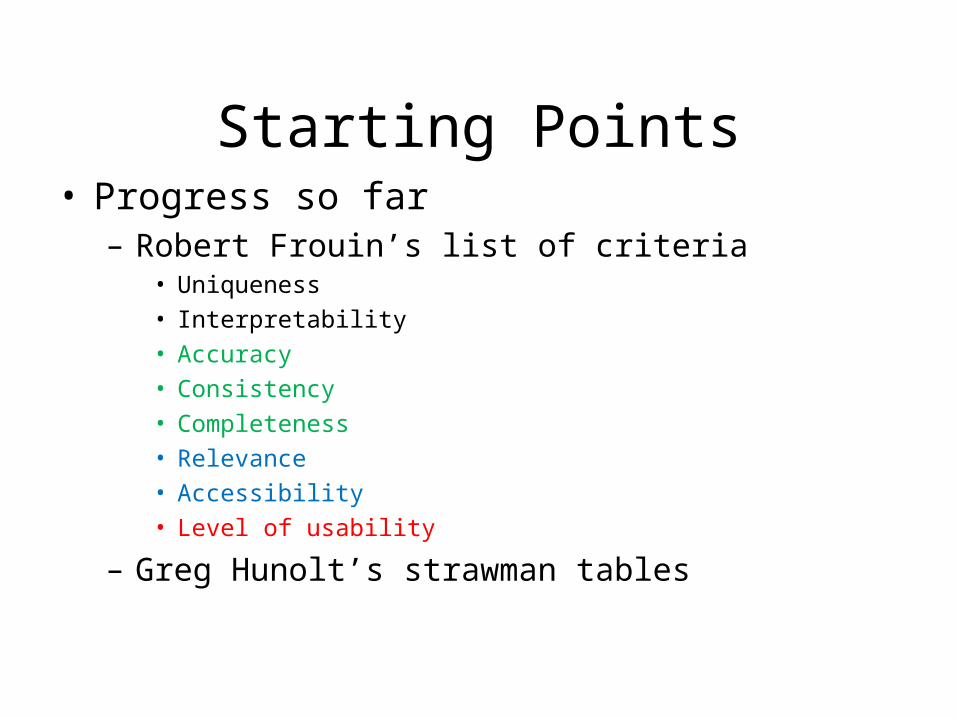
Starting Points• Progress so far
– Robert Frouin’s list of criteria• Uniqueness • Interpretability • Accuracy • Consistency • Completeness • Relevance • Accessibility • Level of usability
– Greg Hunolt’s strawman tables
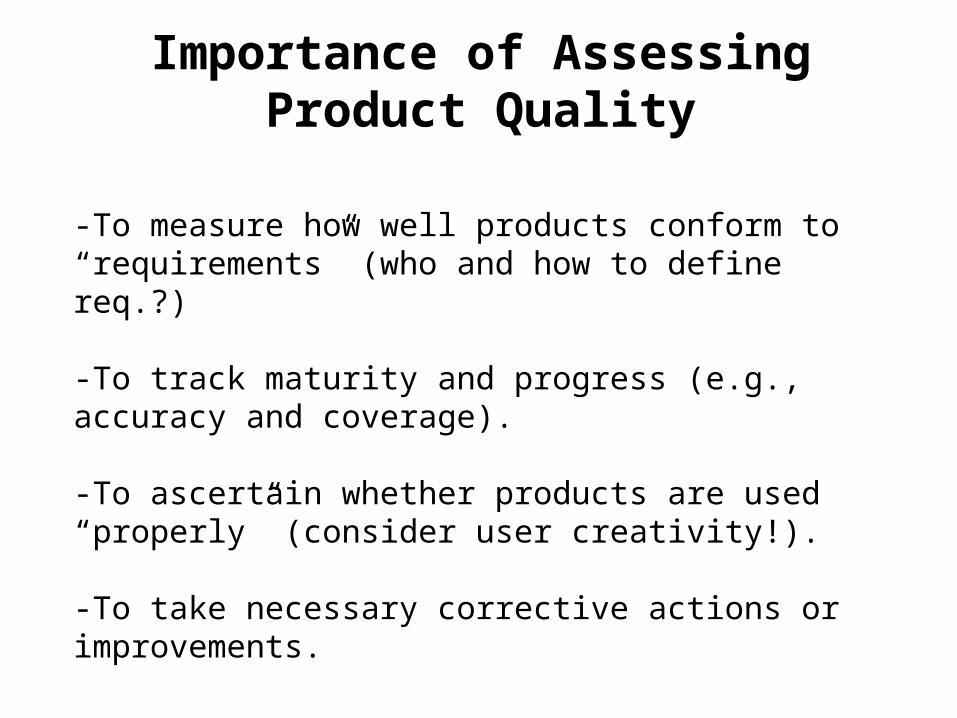
-To measure how well products conform to “requirements” (who and how to define req.?)
-To track maturity and progress (e.g., accuracy and coverage).
-To ascertain whether products are used “properly” (consider user creativity!).
-To take necessary corrective actions or improvements.
Importance of Assessing Product Quality
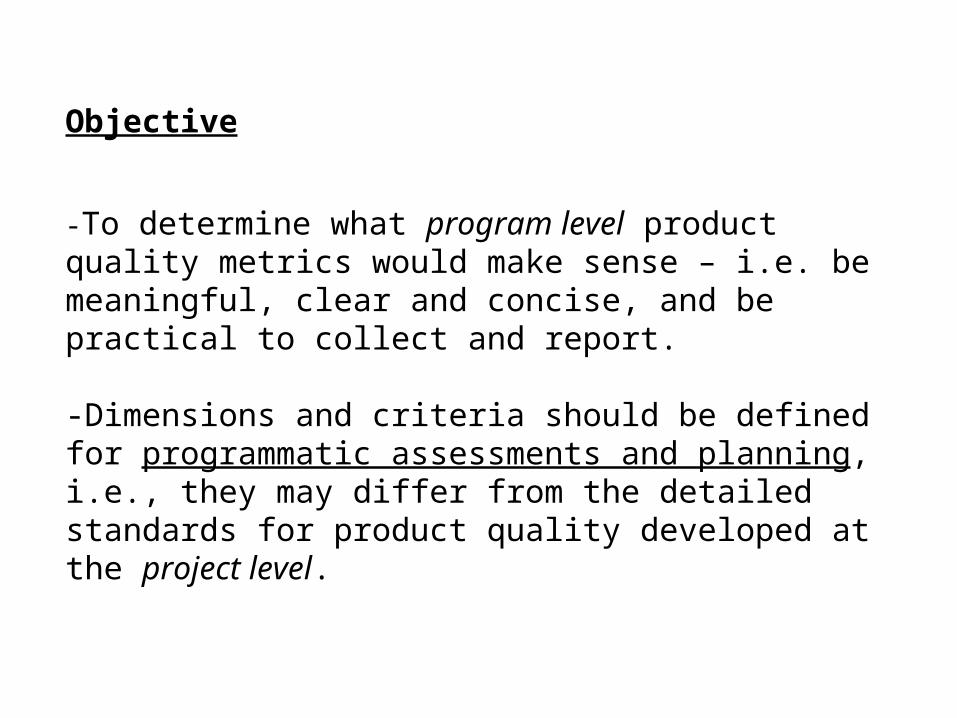
Objective
-To determine what program level product quality metrics would make sense – i.e. be meaningful, clear and concise, and be practical to collect and report.
-Dimensions and criteria should be defined for programmatic assessments and planning, i.e., they may differ from the detailed standards for product quality developed at the project level.
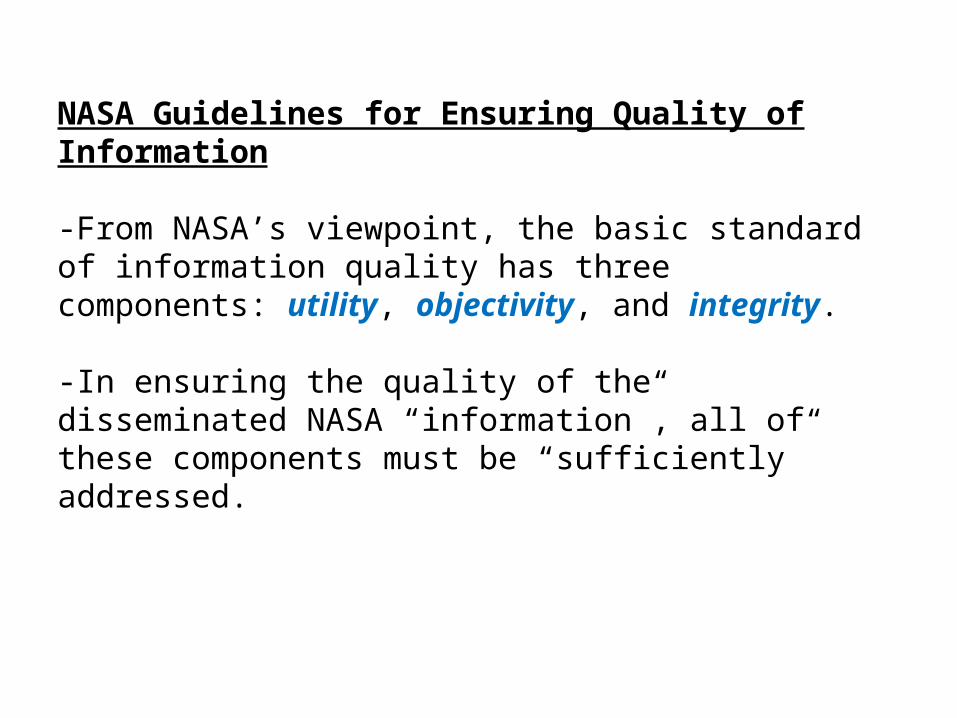
NASA Guidelines for Ensuring Quality of Information -From NASA’s viewpoint, the basic standard of information quality has three components: utility, objectivity, and integrity.
-In ensuring the quality of the disseminated NASA “information”, all of these components must be “sufficiently” addressed.
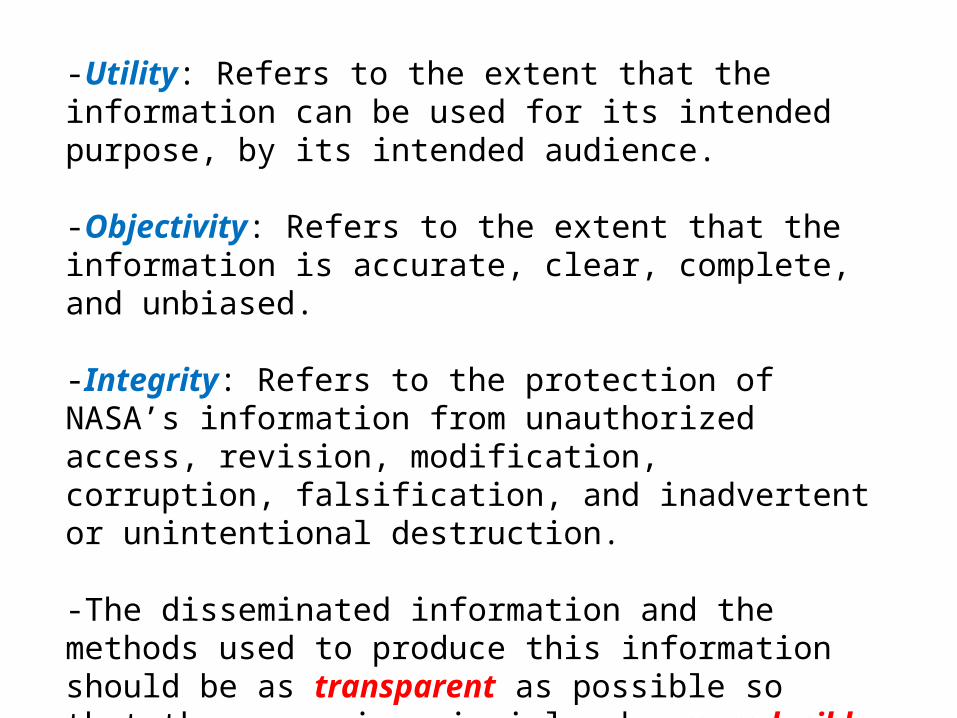
-Utility: Refers to the extent that the information can be used for its intended purpose, by its intended audience.
-Objectivity: Refers to the extent that the information is accurate, clear, complete, and unbiased.
-Integrity: Refers to the protection of NASA’s information from unauthorized access, revision, modification, corruption, falsification, and inadvertent or unintentional destruction.
-The disseminated information and the methods used to produce this information should be as transparent as possible so that they can, in principle, be reproducible by qualified individuals.

Dimensions and Criteria to Consider for Product Quality Metrics
-Uniqueness: How unique is the data set? Can it be obtained from other sources at the same temporal and spatial resolution, over the same time period, with the same accuracy?
• How “meaningful” and how to measure this?
-Interpretability: Is the data clearly defined, with appropriate symbols and units? Is the data easily comprehended? Are the algorithms explained adequately? Are possible usages and limitations of the data documented properly?
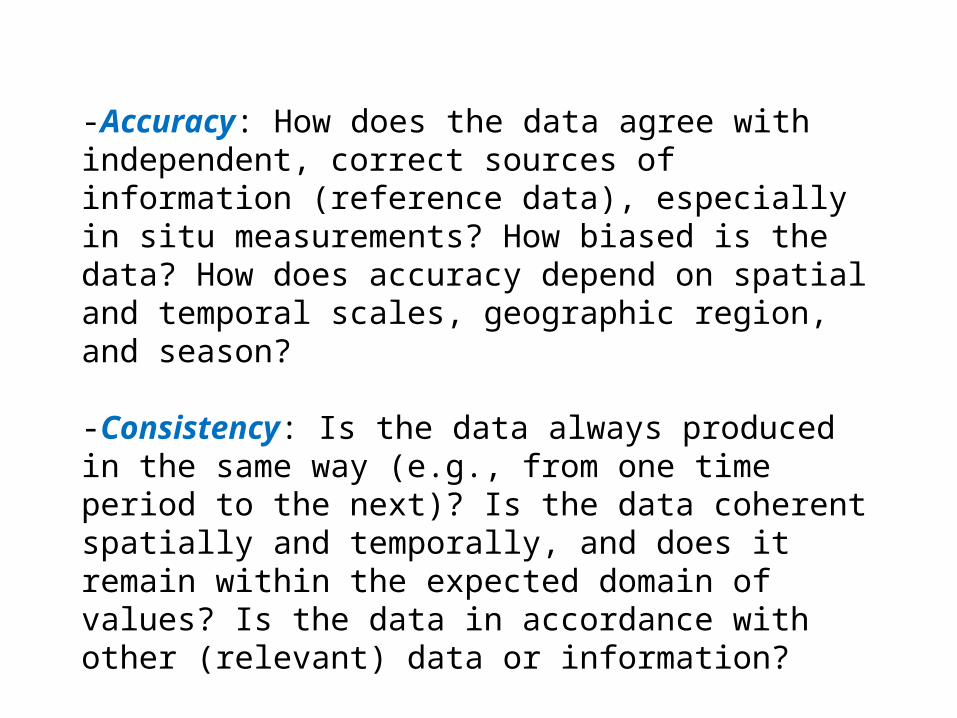
-Accuracy: How does the data agree with independent, correct sources of information (reference data), especially in situ measurements? How biased is the data? How does accuracy depend on spatial and temporal scales, geographic region, and season?
-Consistency: Is the data always produced in the same way (e.g., from one time period to the next)? Is the data coherent spatially and temporally, and does it remain within the expected domain of values? Is the data in accordance with other (relevant) data or information?
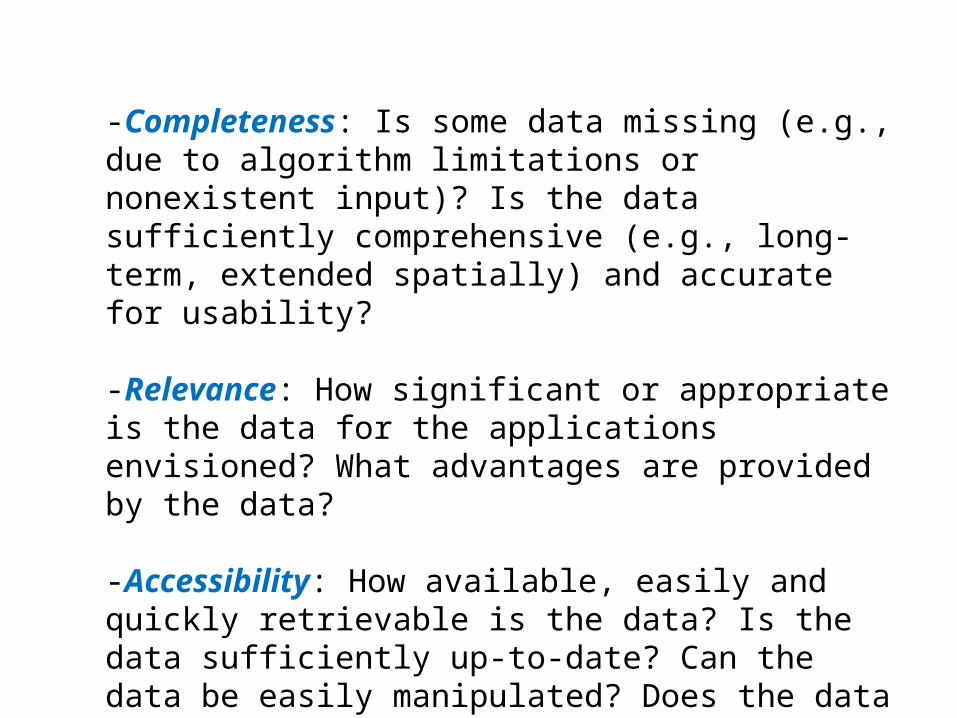
-Completeness: Is some data missing (e.g., due to algorithm limitations or nonexistent input)? Is the data sufficiently comprehensive (e.g., long-term, extended spatially) and accurate for usability?
-Relevance: How significant or appropriate is the data for the applications envisioned? What advantages are provided by the data?
-Accessibility: How available, easily and quickly retrievable is the data? Is the data sufficiently up-to-date? Can the data be easily manipulated? Does the data have security restrictions?
Straw Man Approach to Product Quality Metrics
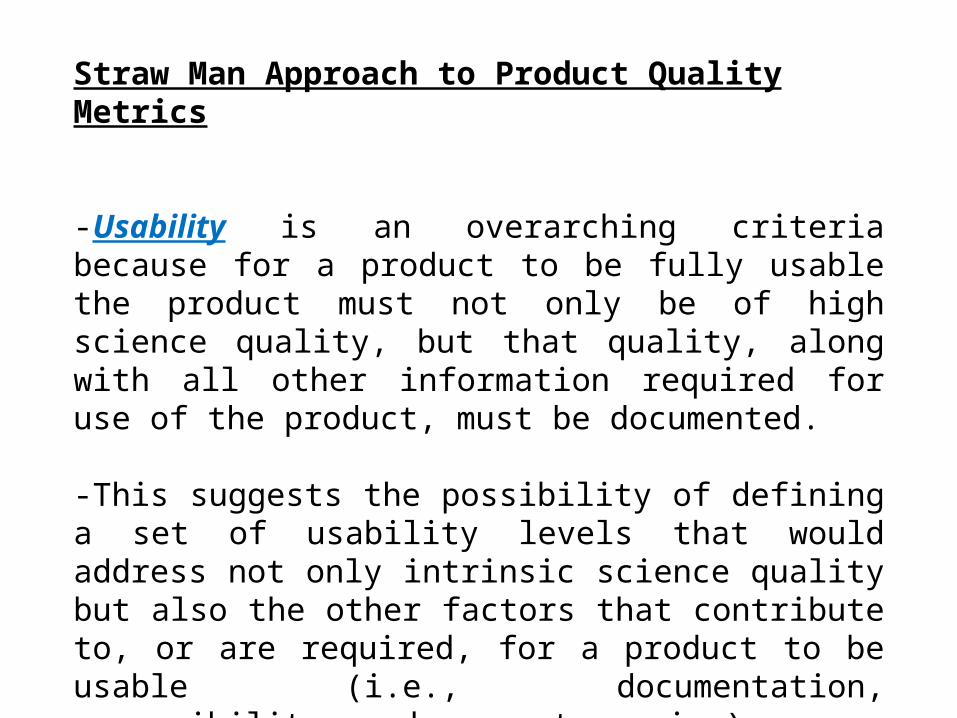
-Usability is an overarching criteria because for a product to be fully usable the product must not only be of high science quality, but that quality, along with all other information required for use of the product, must be documented.
-This suggests the possibility of defining a set of usability levels that would address not only intrinsic science quality but also the other factors that contribute to, or are required, for a product to be usable (i.e., documentation, accessibility, and support service).
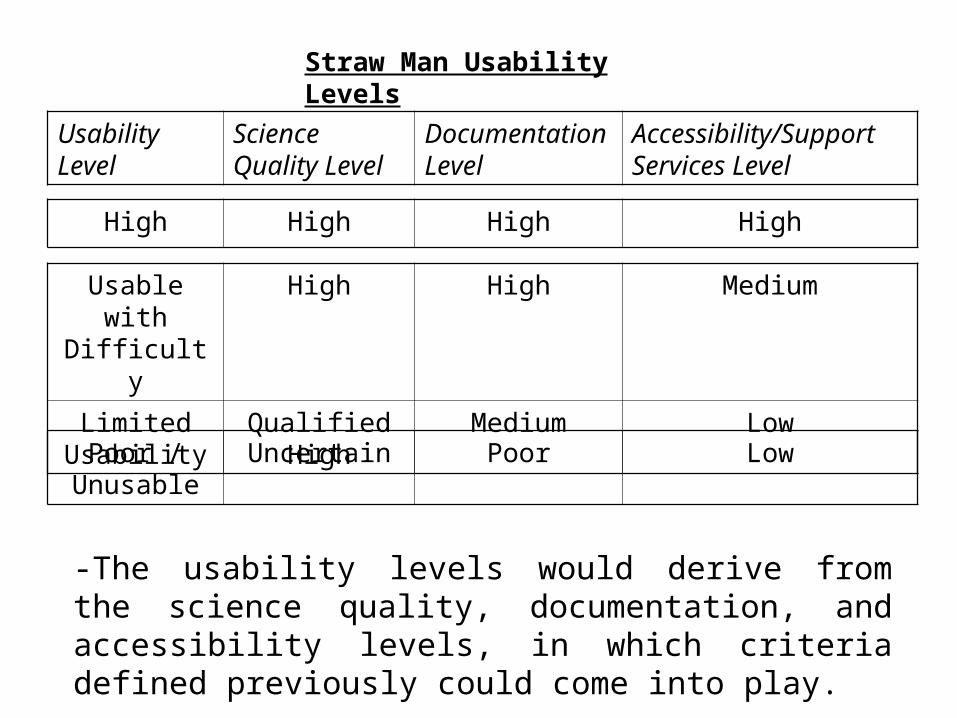
Straw Man Usability Levels
Usability Level
Science Quality Level
Documentation Level
Accessibility/Support Services Level
High High High High
Usable with Difficulty
High High Medium
Limited Usability
Qualified High
Medium Low
Poor / Unusable
Uncertain Poor Low
-The usability levels would derive from the science quality, documentation, and accessibility levels, in which criteria defined previously could come into play.
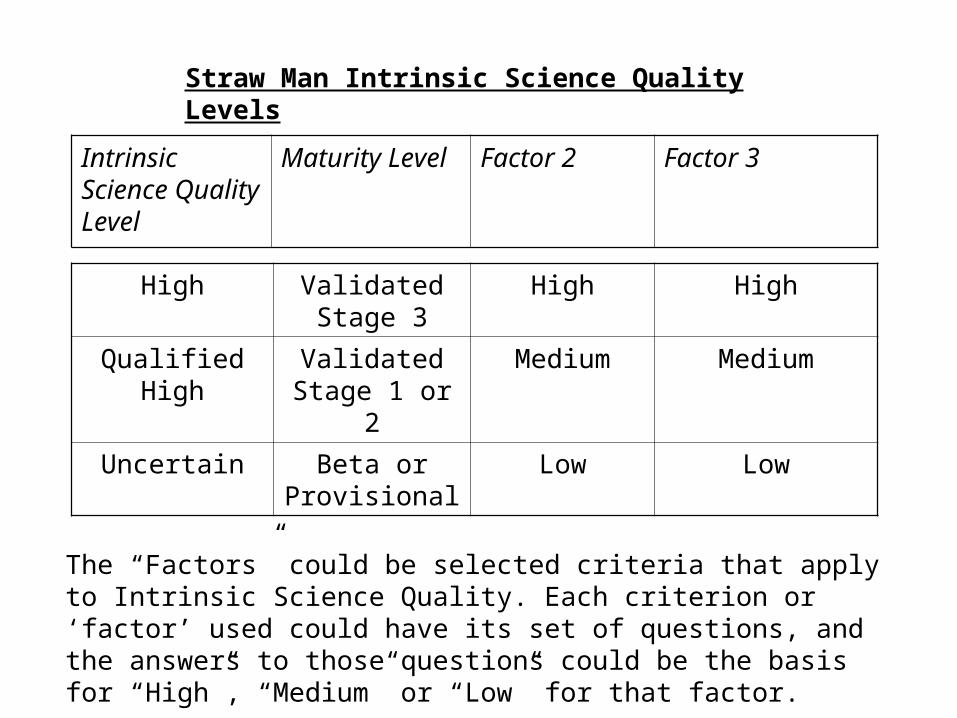
Straw Man Intrinsic Science Quality Levels
Intrinsic Science Quality Level
Maturity Level
Factor 2 Factor 3
High Validated Stage 3
High High
Qualified High
Validated Stage 1 or 2
Medium Medium
Uncertain Beta or Provisional
Low Low
The “Factors” could be selected criteria that apply to Intrinsic Science Quality. Each criterion or ‘factor’ used could have its set of questions, and the answers to those questions could be the basis for “High”, “Medium” or “Low” for that factor.
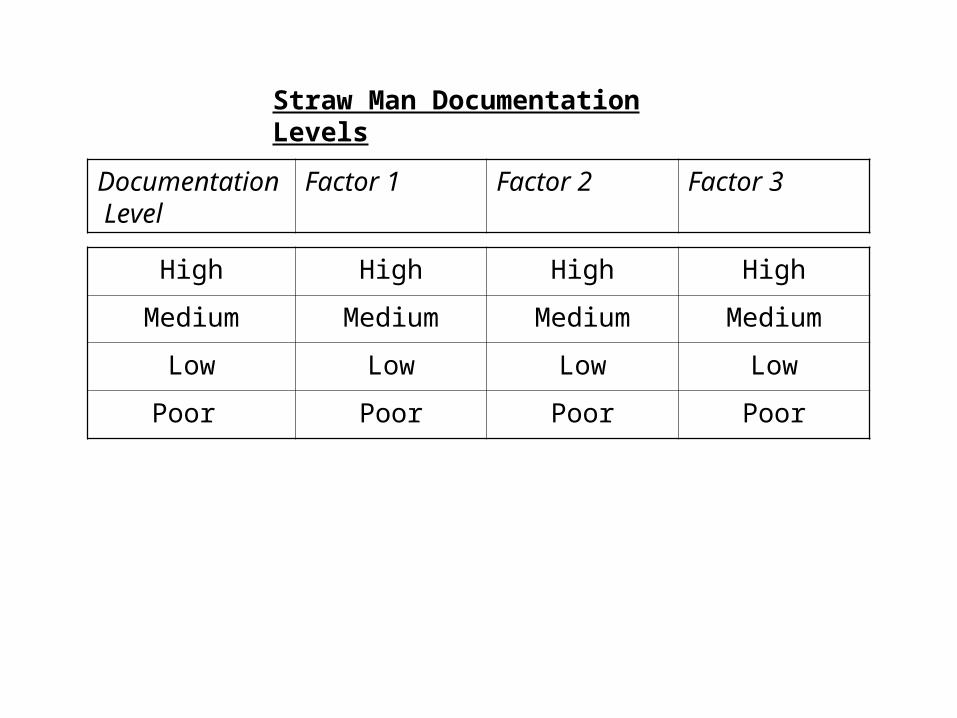
Straw Man Documentation Levels
Documentation Level
Factor 1 Factor 2 Factor 3
High High High High
Medium Medium Medium Medium
Low Low Low Low
Poor Poor Poor Poor
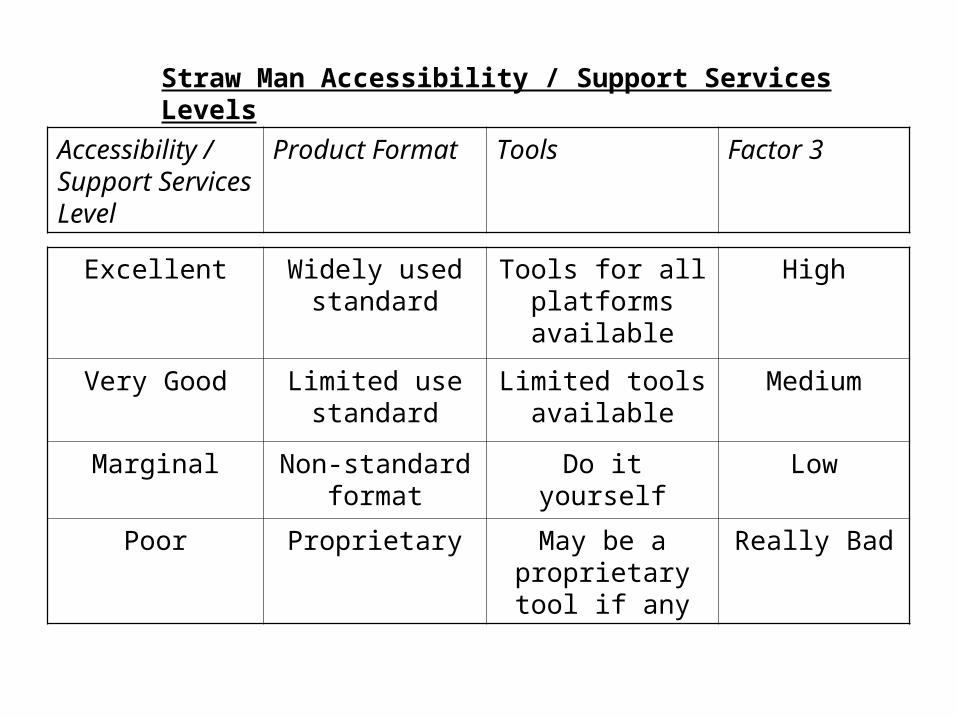
Straw Man Accessibility / Support Services Levels
Accessibility / Support Services Level
Product Format
Tools Factor 3
Excellent Widely used standard
Tools for all platforms available
High
Very Good Limited use standard
Limited tools available
Medium
Marginal Non-standard format
Do it yourself Low
Poor Proprietary May be a proprietary tool
if any
Really Bad
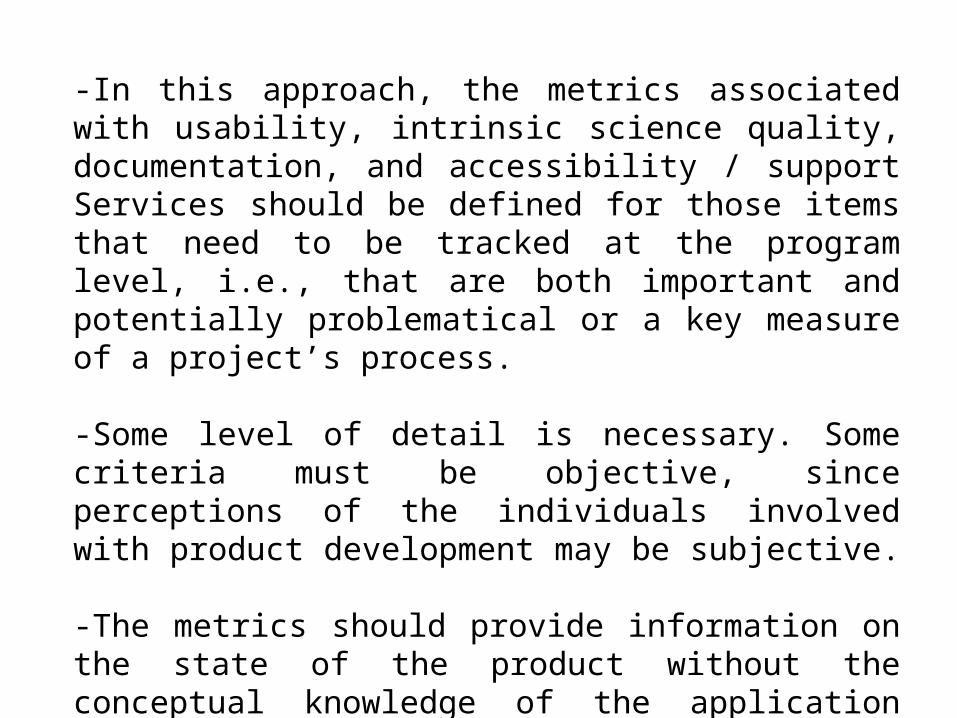
-In this approach, the metrics associated with usability, intrinsic science quality, documentation, and accessibility / support Services should be defined for those items that need to be tracked at the program level, i.e., that are both important and potentially problematical or a key measure of a project’s process.
-Some level of detail is necessary. Some criteria must be objective, since perceptions of the individuals involved with product development may be subjective.
-The metrics should provide information on the state of the product without the conceptual knowledge of the application (project-independent) and with specific applications in mind (project-dependent).
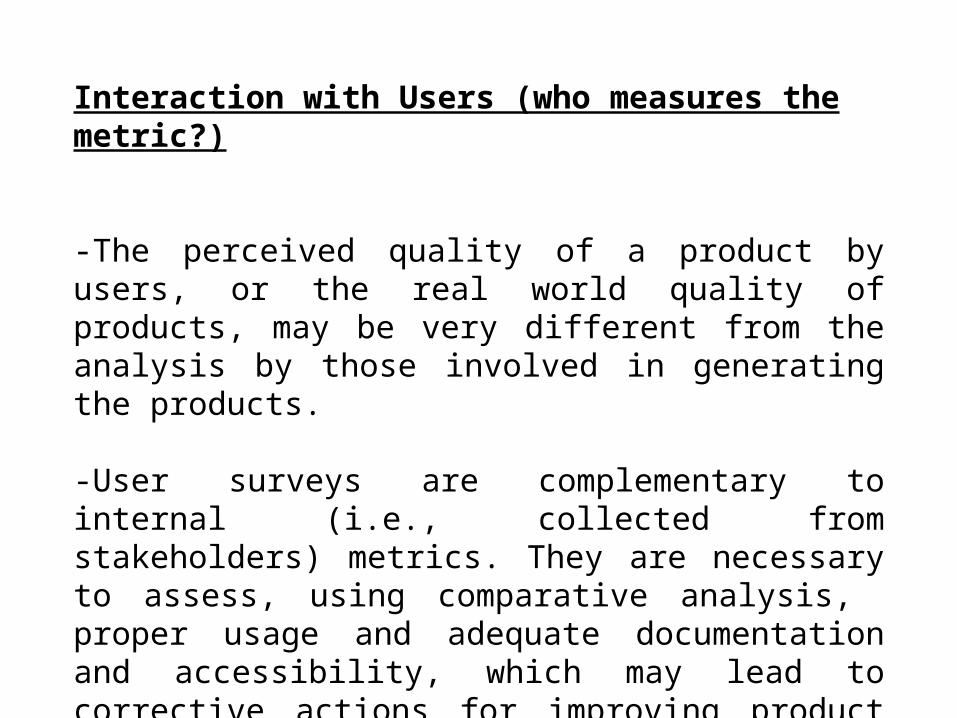
Interaction with Users (who measures the metric?)
-The perceived quality of a product by users, or the real world quality of products, may be very different from the analysis by those involved in generating the products.
-User surveys are complementary to internal (i.e., collected from stakeholders) metrics. They are necessary to assess, using comparative analysis, proper usage and adequate documentation and accessibility, which may lead to corrective actions for improving product quality.

DISCUSSIONS

BACKUP

22
Summer NDVI comparisons
Winter EVI comparisonsWinter EVI comparisons
Same sensor(s) & a “simple” reprocessing (C4 to C5) leads to major change
10+% sometimes
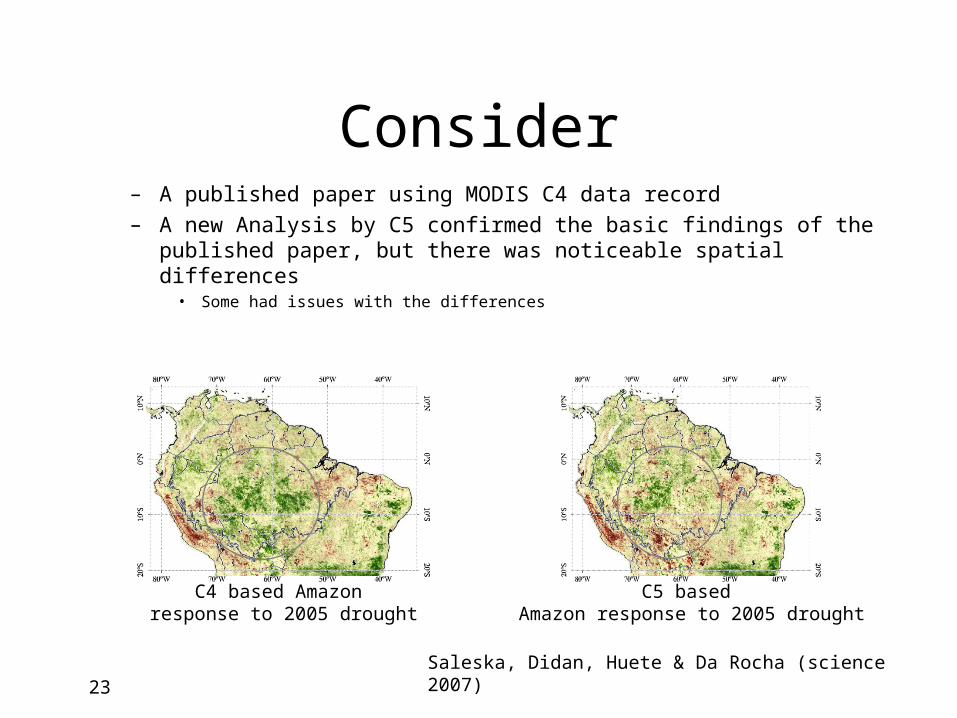
Consider– A published paper using MODIS C4 data record– A new Analysis by C5 confirmed the basic findings of the published
paper, but there was noticeable spatial differences• Some had issues with the differences
23
C4 based Amazon response to 2005 drought
C5 based Amazon response to 2005 drought
Saleska, Didan, Huete & Da Rocha (science 2007)
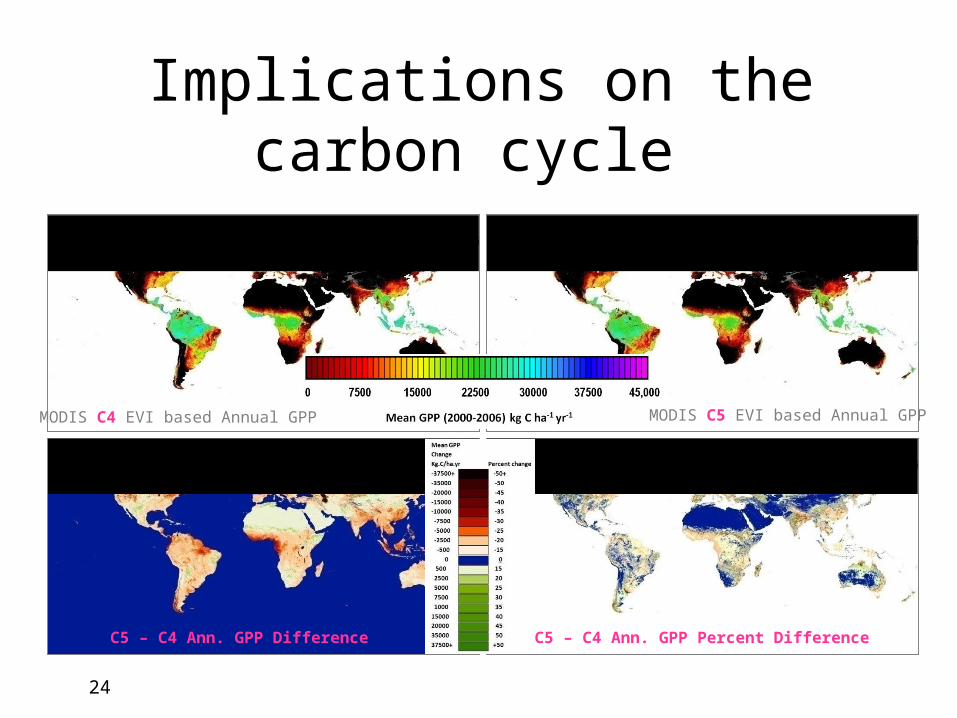
Implications on the carbon cycle
24
MODIS C4 EVI based Annual GPP MODIS C5 EVI based Annual GPP
C5 – C4 Ann. GPP Difference C5 – C4 Ann. GPP Percent Difference
Also consider
• Data from MODIS that describe the behavior of a patch of vegetation– Use all data (most users do it)
• Documentation is not clear as to what not to do ? For example atmospherically corrected data gives a false sense of “corrected”.
– Filter and use remaining data (few users do it but then it becomes a challenge to use RS data in general)
– Find a work around• Case by case basis
• The challenge is how to make sense of these issues– Error and uncertainty reported as a single number by
MODIS (Global multi-temporal data) is for the most part useless!
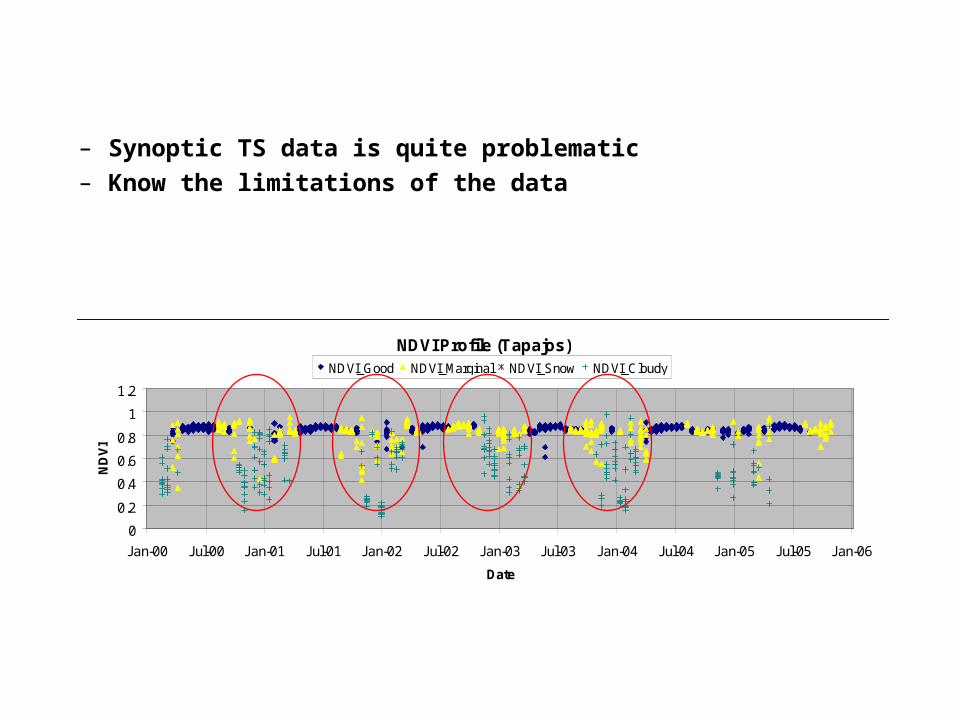
NDVI Profile (Tapajos)
0
0.2
0.4
0.6
0.8
1
1.2
Jan-00 Jul-00 Jan-01 Jul-01 Jan-02 Jul-02 Jan-03 Jul-03 Jan-04 Jul-04 Jan-05 Jul-05 Jan-06
Date
ND
VI
NDVI_Good NDVI_Marginal NDVI_Snow NDVI_Cloudy
– Synoptic TS data is quite problematic– Know the limitations of the data

Global clouds & data usefulness metricsGlobal clouds & data usefulness metrics
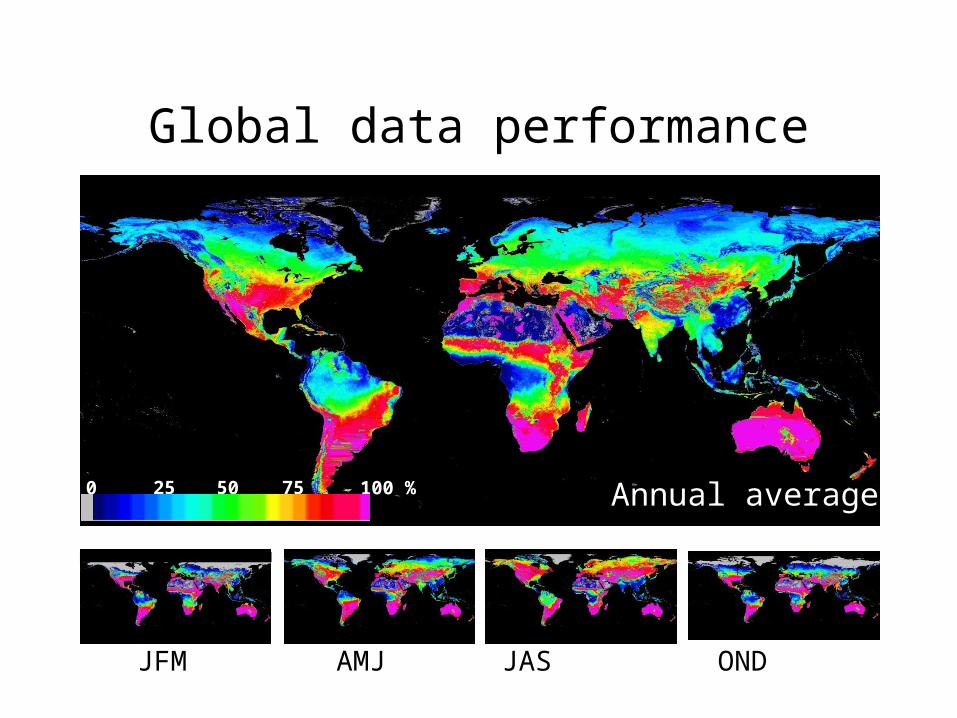
Global data performance
JFM AMJ JAS OND
Annual average0 25 100 %
50
75
![Ahmed at Kamel [i.e. Ahmed al Kamel] : the pilgrim of love ...](https://static.fdocuments.in/doc/165x107/61de3c9a772204095d52c425/ahmed-at-kamel-ie-ahmed-al-kamel-the-pilgrim-of-love-.jpg)