Potential of Psidium guajava Shoots Extract as Coagulant ...

DEVELOPMENT OF NEURAL NETWORK BASED ESTIMATOR TO DETERMINE COAGULANT DOSAGE AND TREATED WATER QUALITIES
IN A WATER TREATMENT PLANT
by
ASABRI BIN ROBENSON
Thesis submitted in fulfillment of the requirements for the degree of
Master of Science
SEPTEMBER 2008

ACKNOWLEDGEMENTS
In the Name of ALLAH, the Most Gracious, the Most Merciful. Peace be upon
Muhammad S.A.W., the best creation of ALLAH who was sent as a mercy and
guidance for humanity until the day of Qiyamah. All Praises to Almighty Allah, Who
had given me this opportunity to spend some time in the university in order to acquire
not even a drop of His countless and boundless knowledge.
Several individuals deserve special recognition for their contribution towards the
completion of this research and thesis. Great appreciation goes to Dr. Norashid Aziz,
my supervisor, for his patience, suggestions, valued assistance and supervision to me in
developing and implementing this research. A special note of thanks is also dedicated to
my co-supervisor, Dr. Syamsul Rizal Abd. Shukor, for his invaluable advice and effort
throughout my study. Not forgetting Dr. Zainal Ahmad for answering my countless
questions related to neural networks as well as the help of the Control Group of the
Chemical Engineering School, USM, for their assistance in developing and evaluating
the models. Alhamdulillah, this work was completed with financial and organizational
support from the Sabah Public Service Department, the Sabah Water Supply
Department, the Lahad Datu Water Supply Sdn. Bhd. as well as Universiti Sains
Malaysia.
This work is dedicated to my my beloved mother, Pn. Hjh. Rabiyah Yahya, and
my late father, Robenson @ Zubair Badu, without whose love and encouragement, I
would never have reached this level of education. Not forgetting to my caring and
beloved wife, Nurrohmah, for her continued love, friendship, and support throughout
these years of my candidature. To my daughters, Nurkhadijah Toheerah, and Halimah
Assa’diah, as well as to my new born baby, Muhammad Qasim, I love you all.
ii

TABLE OF CONTENTS
Page
Acknowledgements ii
Table of Contents iii
List of Tables viii
List of Figures x
List of Plates xii
List of Abbreviations xiii
Abstrak xv
Abstract xvii
CHAPTER 1 - INTRODUCTION 1
1.1 Project Background 1
1.2 Problem Statement 3
1.3 Research Objective 5
1.4 Overview of the Thesis 5
CHAPTER 2 - LITERATURE REVIEW 7
2.1 General Description of a Water Treatment Plant (WTP) 7
2.2 Overview of the Segama WTP 8
2.3 Water Quality 12
2.3.1 pH Water 13
2.3.2 Turbidity 14
2.3.3 Colour 15
2.3.4 Alkalinity 16
iii

2.3.5 Total Solids 16
2.3.6 Aluminum Residue 17
2.4 Coagulation Process 17
2.5 Existing Coagulation Control 20
2.5.1 Jar Test 20
2.5.2 Streaming Current Detector 21
2.6 Artificial Neural Network (ANN) 22
2.6.1 Overview of ANN Modeling 22
2.6.2 General Characteristics of ANN 25
2.6.3 Development of ANN model 27
2.6.3 (a) Data Division 27
2.6.3 (b) ANN Architecture 29
2.6.3 (c) The ANN Training Process 31
2.6.3 (d) Model Performance Evaluation 34
2.6.4 General Applications of ANN 35
2.6.5 ANN’s Applications in Drinking Water Industries; Review of
Studies in Modeling Coagulant Dosage 36
2.7 Nature of the Current Studies 44
CHAPTER 3 – METHODOLOGY 47
3.1 Source Data and Analysis 49
3.1.1 Data Collection 49
3.1.2 Data Analysis 49
3.2 Data Preparation 50
3.2.1 Data Normalization 50
iv

3.2.2 Data Division 50
3.3 Model Development 52
3.3.1 Software 52
3.3.2 Significant Input-Output Determination 52
3.3.2 (a) Input Determination Based on Literatures
and Priori Knowledge 53
3.3.2 (b) Input Determination Based on Analytical Studies 54
3.3.2 (c) Effects of Time Lags 55
3.3.2 (d) Regression Analysis 56
3.3.2 (e) Inputs Elimination Via Stepwise Regression 57
3.3.3 Model Architecture 57
3.3.3 (a) ANN Architecture Characteristics 58
3.3.3 (b) Model Calibration (Training) 59
3.3.3 (c) Model Validation (Generalization) 61
3.3.4 Development of Multiple-Inputs Multiple-Outputs
(MIMO) Model 63
CHAPTER 4 - RESULTS AND DISCUSSION 64
4.1. Source Data Analysis 64
4.1.1 pH water 65
4.1.2 Raw Water Turbidity 67
4.1.3 Raw Water Colour 69
4.2 Data Preparation 69
4.2.1 Correlation Coefficient Analysis 69
4.2.2 Outliers Identification 71
v
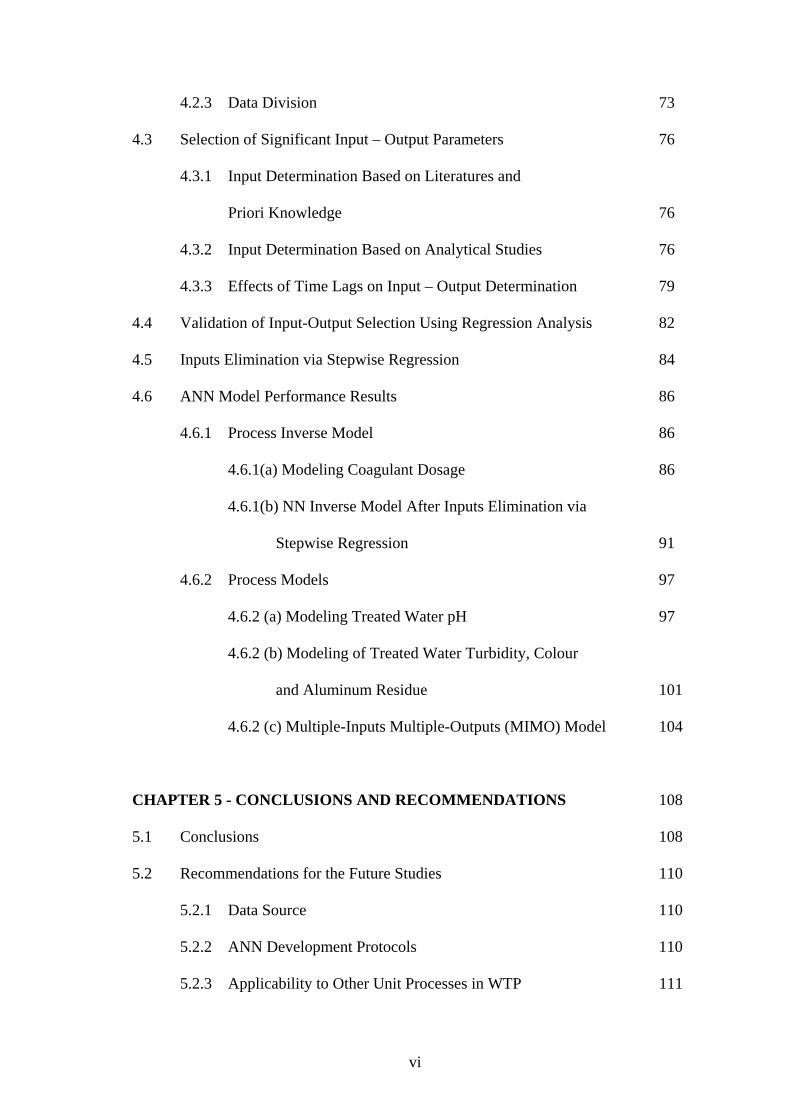
4.2.3 Data Division 73
4.3 Selection of Significant Input – Output Parameters 76
4.3.1 Input Determination Based on Literatures and
Priori Knowledge 76
4.3.2 Input Determination Based on Analytical Studies 76
4.3.3 Effects of Time Lags on Input – Output Determination 79
4.4 Validation of Input-Output Selection Using Regression Analysis 82
4.5 Inputs Elimination via Stepwise Regression 84
4.6 ANN Model Performance Results 86
4.6.1 Process Inverse Model 86
4.6.1(a) Modeling Coagulant Dosage 86
4.6.1(b) NN Inverse Model After Inputs Elimination via
Stepwise Regression 91
4.6.2 Process Models 97
4.6.2 (a) Modeling Treated Water pH 97
4.6.2 (b) Modeling of Treated Water Turbidity, Colour
and Aluminum Residue 101
4.6.2 (c) Multiple-Inputs Multiple-Outputs (MIMO) Model 104
CHAPTER 5 - CONCLUSIONS AND RECOMMENDATIONS 108
5.1 Conclusions 108
5.2 Recommendations for the Future Studies 110
5.2.1 Data Source 110
5.2.2 ANN Development Protocols 110
5.2.3 Applicability to Other Unit Processes in WTP 111
vi
5.2.4 Model Boundaries 111
5.2.5 Development of a Graphical User Interface (GUI) 111
References 112
Appendices
Appendix A: Statistical Calculations 119
Appendix B: Error Performance of ANN 121
Appendix C: Regression Analysis 125
Appendix D: Stepwise Regression Analysis 128
Appendix E: Results of Stepwise Regression Analysis via
Backward Elimination 131
List of Publications 134
vii

LIST OF TABLES
Page
Table 2.1 Treated water quality standard for JANS 13
Table 2.2 Details of the papers reviewed on the applications of ANN
in drinking water industries 45
Table 3.1 Predictive models for the Segama WTP 58
Table 4.1 Statistical analyses of the available data sets, 2005 64
Table 4.2 Correlation coefficient among parameters of raw water,
alum dosage and treated water 70
Table 4.3 Data division, mean and varians value for process
models and process inverse model 75
Table 4.4 Significant inputs using correlation coefficient, r and p-value 78
Table 4.5 Correlation coefficients for lags parameters of the Segama WTP 80
Table 4.6 Significant input-output relationship for development
neural network models at the Segama WTP 82
Table 4.7 The effects of several significant inputs on process inverse model,
using regression analysis 83
Table 4.8 Performance results of network architecture [18-19-1] for
modeling coagulant dosage, Segama WTP 89
Table 4.9 MSE for different network architectures in single and double
hidden layers on validation set 91
Table 4.10 Performance results of network architecture [11-27-9-1] for
modeling coagulant dosage, Segama WTP 93
Table 4.11 MSE for different network architectures in single and
double hidden layers on validation set 97
viii

Table 4.12 Performance results of network architecture [13-6-2-1] for
modeling treated water pH, Segama WTP 99
Table 4.13 Optimum network configuration for process models 102
Table 4.14 Performance results of MISO and MIMO models on
testing set 105
ix

LIST OF FIGURES
Page
Figure 2.1 Unit processes in water treatment plant 8
Figure 2.2 Interaction between (a) charged and (b) uncharged particles 18
Figure 2.3 From human brain to artificial neural network 23
Figure 2.4 Basic structure of ANN; feedforward neural network
with error backpropagation 26
Figure 3.1 Research methodology of ANN model development 48
Figure 3.2 Procedure of training, validation and testing of ANN 62
Figure 4.1 Scatter plot of RW pH for the Segama WTP, 2005 66
Figure 4.2 Scatter plot of RW turbidity for the Segama WTP, 2005 67
Figure 4.3 Scatter plot of RW colour for the Segama WTP, 2005 69
Figure 4.4 Box-plot of RW turbidity (NTU) 71
Figure 4.5 Raw water turbidity (NTU) characteristics, 2005 72
Figure 4.6 Scatter plot of the normalized target values for process
inverse model and process models 74
Figure 4.7 MSE values on validation set with different number of neurons
in one hidden layer 87
Figure 4.8 MSE values on validation set with different number of neurons
in the first and second hidden layer 88
Figure 4.9 Comparison of actual versus predicted coagulant dosage
on testing set, [18-19-1] 90
Figure 4.10 MSE values on validation set with different number of neurons
in the first and second hidden layer 92
x

Figure 4.11 Comparison of actual and predicted coagulant dosage on
testing set, [11-27-9-1] 94
Figure 4.12 Scatter plots of target outputs versus network output
on testing sets, for models with [18-19-1] and [11-27-9-1] 95
Figure 4.13 Residual plot of network output on [11-27-9-1] 96
Figure 4.14 MSE values on validation set with different number of neurons
in the first and second hidden layer 98
Figure 4.15 Comparison of actual and predicted TW pH on testing
set, [13-6-2-1] 99
Figure 4.16 Scatter plots of actual versus predicted treated water pH on
testing set, [13-6-2-1] 100
Figure 4.17 Residual plot of network output on [13-6-2-1] 100
Figure 4.18 Actual versus predicted TW Turbidity on testing set, [7-9-1] 103
Figure 4.19 Actual versus predicted TW Colour on testing set, [7-7-1] 103
Figure 4.20 Actual versus predicted TW Aluminum residue on
testing set, [8-9-3-1] 104
Figure 4.21 Actual versus predicted MIMO model predicting TW turbidity
and TW colour on testing set, [8-7-2] 106
Figure 4.22 Actual versus predicted MIMO model predicting TW pH and
TW aluminum residue on testing set, [17-14-2] 107
xi

LIST OF PLATES
Page
Plate 2.1 Aeration process and chemical addition 9
Plate 2.2 Three stages of baffles type flocculation tank 10
Plate 2.3 ‘Finger’ weirs colleting clarified water in sedimentation tank 11
Plate 2.4 Rapid gravity filtration tank 11
Plate 2.5 Jar testing apparatus in Segama WTP 20
Plate 4.1 Highly turbid / murky condition of Segama River 68
xii

LIST OF ABBREVIATIONS
Alum Aluminum sulphate
AI Artificial Intelligence
ANN Artificial Neural Network
BP Backpropagation algorithm
DOC Dissolved Organic Compounds
FBNN Feedback Neural Network
FFNN Feedforward Neural Network
GUI Graphical User Interface
HDPE High Density Polyethylene
HU Hazen Units (colour measurement)
JANS Jabatan Air Negeri Sabah (Sabah Water Supply
Department)
LDWS Lahad Datu Water Supply
LM Levenberg–Marquardt algorithm
LR Learning Rate
MAE Mean Absolute Error
MC Momentum Constant
MLP Multiple Linear Perceptron
MIMO Multiple-input multiple-output
MISO Multiple-input single-output
MSE Mean Square Error
NOM Natural Organic Matter
NTU Nephlometric Turbidity Unit
xiii
xiv
PAC Powdered Activated Carbon
PCA Principal Component Analysis
PE Processing elements
r-value Correlation coefficient
R2 Coefficient of determination
RW Raw water
SCADA Supervisory Control and Data Acquisition
SCD Streaming Current Detector
SSE Sum Square Error
TDS Total dissolved solids
TSS Total suspended solids
TOC Total Organic Compounds
TW Treated water
UVA-254 nm Ultraviolet Absorbance (254 nanometer)
WHO World Health Organization
WTP Water Treatment Plant

PEMBANGUNAN PENGANGGAR BERASASKAN RANGKAIAN NEURAL UNTUK MENENTUKAN DOS PENGENTAL DAN KUALITI AIR
TERAWAT DI LOJI RAWATAN AIR
ABSTRAK
Penentuan dos pengental yang optima di dalam proses pengentalan bagi
sesebuah loji rawatan air adalah amat mustahak untuk menghasilkan kualiti air terawat
yang memuaskan dan untuk mengekalkan operasi loji yang ekonomi seperti
mengurangkan tenaga kerja dan mengawal bahan kimia yang mahal. Kegagalan
menentukan dos yang optima ini akan mengurangkan kecekapan proses pengendapan
dan penapisan di dalam loji rawatan air berkenaan. Secara tradisional, ujian balang
digunakan untuk menentukan dos pengental yang optima. Walau bagaimanapun, kaedah
ini adalah mahal, memerlukan masa yang panjang dan tidak dapat memberikan tindak
balas yang segera terhadap perubahan kualiti air mentah pada masa yang sebenar.
Pemodelan seperti rangkaian neural buatan boleh digunakan untuk mengatasi
keterbatasan ini. Dalam kajian ini, model rangkaian neural berbalik dibangunkan untuk
menganggarkan dos pengental yang diperlukan di Loji Rawatan Air Segama, Lahad
Datu, Sabah, Malaysia. Di samping itu, proses model juga dibina untuk menganggarkan
kualiti air terawat yang berkaitan dengan dos pengental seperti parameter-parameter
kekeruhan, warna, pH dan baki aluminum. Model-model rangkaian neural dengan
struktur yang berbeza-beza, termasuk satu dan dua lapisan tersembunyi telah
dibangunkan. Untuk proses neural berbalik, rangkaian struktur optima yang diperolehi
adalah [11-27-9-1]. Model ini memberikan anggaran baik terhadap julat data yang
digunakan dalam latihan, dengan nilai r 0.95, MSE, 0.0019 dan MAE, 0.0024 mg/l,
apabila digunakan ke atas data ujian. Untuk proses model, dua jenis model yang berbeza
telah dibangunkan iaitu model-model berbilang-masukan satu-keluaran (MISO) dan
xv

berbilang-masukan berbilang keluaran (MIMO). Kedua-dua jenis model tersebut telah
dibangunkan untuk menentukan parameter-parameter air terawat seperti pH, kekeruhan,
warna dan baki aluminum. Rangkaian struktur yang optima bagi model MISO dapat
menentukan semua parameter kualiti air terawat, dengan tepat; nilai r di antara 0.88 dan
0.97, dan nilai MSE di antara 0.0003 hingga 0.0028. Tambahan pula, nilai-nilai MAE
yang diperolehi adalah rendah iaitu 0.035 untuk pH, 0.035 NTU untuk kekeruhan, 0.016
HU untuk warna dan 0.017 mg/l untuk baki aluminum. Sebaliknya, konfigurasi optima
model MIMO yang diperolehi adalah kurang tepat berbanding model MISO dalam
keupayaannya membuat anggaran, dengan nilai-nilai r dan MSE masing-masing di
antara 0.27 hingga 0.84 dan 0.0024 hingga 0.0179. Ringkasnya, model-model MISO
dapat mengatasi model-model MIMO dalam menganggarkan kualiti air terawat. Secara
keseluruhannya, keputusan-keputusan pemodelan rangkaian neural membuktikan
bahawa kaedah yang dicadangkan ini khususnya proses model berbalik berupaya
menganggarkan dos pengental dengan amat baik. Dengan itu, ia berpotensi besar
menggantikan kaedah konvensional iaitu ujian balang memandangkan ciri-cirinya yang
dapat memberi keputusan dengan cepat, kos operasi yang murah dan kemampuannya
untuk diaplikasikan dalam proses masa yang sebenar.
xvi

DEVELOPMENT OF NEURAL NETWORK BASED ESTIMATOR TO DETERMINE COAGULANT DOSAGE AND TREATED WATER
QUALITIES IN A WATER TREATMENT PLANT
ABSTRACT
The determination of an optimum coagulant dosage in a coagulation process for
a water treatment plant is very important in order to produce satisfactory treated water
qualities and to maintain economic plant operation such as reducing manpower and
controlling the high cost of chemicals. Failure to do this will reduce the efficiency in the
sedimentation and filtration processes in the treatment plant. Traditionally, jar tests are
used to determine the optimum coagulant dosage. However, this method is expensive,
time-consuming, and does not enable responses to changes in raw water quality in real-
time. Modeling, utilising artificial neural networks, can be used to overcome these
limitations. In this work, an inverse neural network model is developed to predict the
required coagulant dosage in the Segama Water Treatment Plant in Lahad Datu, Sabah,
Malaysia. In addition, process models were also developed for the prediction of treated
water qualities which are associated with coagulant dosage i.e. the parameters of
turbidity, colour, pH and aluminum residue. Neural network models with different
network architectures, including single and two hidden layers were developed. For the
process inverse model, the optimum network architecture obtained was [11-27-9-1].
This model performed very well over the range of data used for training, with r-value of
0.95, mean square error (MSE) of 0.0019 and mean absolute error (MAE) of 0.024 mg/l
when applied on the testing data set. For the process models, two different kinds of
models were developed namely the multiple-input single-output (MISO) and the
multiple-input multiple-output (MIMO) models. Both types of models were developed
to determine the treated water parameters such as pH, turbidity, colour and aluminum
xvii

xviii
residue. The optimum network architecture of the MISO model managed to accurately
determine all the treated water quality parameters with r-values between 0.88 and 0.97
and MSE value which ranged from 0.0003 to 0.0028. Moreover, the corresponding
values of MAE were relatively low and were recorded as 0.035 for pH, 0.035 NTU for
turbidity, 0.016 HU for colour and 0.017 mg/l for aluminum residue. On the other hand,
the optimum MIMO models configuration obtained were found to be less accurate in
prediction capabilities compared to the MISO models with r-values and MSE values
which ranged from 0.27 to 0.84 and 0.0024 to 0.0179 respectively. In conclusion, the
MISO models outperformed the MIMO models in predicting treated water qualities.
Overall, the neural network modeling results prove that the proposed technique,
particularly the process inverse model can predict the coagulant dosage very well.
Therefore, it has a great potential of replacing the conventional method; jar test due to
its quick responsive tools, economical operating cost and its capability to be applied in
real-time process.

CHAPTER 1
INTRODUCTION
1.1 Project Background
The water industry is working very hard to produce high quality drinking water
at a lower cost in order to meet the mandatory drinking water quality standard. Drinking
water comes from two major sources: surface water such as lakes, rivers, and reservoirs;
and groundwater, which is pumped from wells. Raw water from the source are pumped
to the treatment plant and transformed into safe drinking water through treatment
processes which involve physical, chemical and biological changes. Since surface water
is exposed to the environment and can be easily contaminated, it normally has to go
through several treatment processes such as coagulation, flocculation, sedimentation,
filtration, pH adjustment, and disinfection processes before the drinking water quality
standard can be achieved.
The coagulation process is done by adding coagulant to the water. In this
process, the coagulant electrochemically attracts solids and colloidal particles to form a
bulky precipitate. The solid precipitate is allowed to settle to the bottom of the
sedimentation tank and then removed by discharging it as sludge. The next stage is
filtration where the particles passing through the previous stages are removed. The
filters are backwashed periodically in order to remove any collected matter. This energy
intensive cleaning is required more regularly if the coagulation in the clarification stage
is not performing well. In the next stage, the filtered water will go to the disinfection or
chlorination process in order to eliminate the available micro-pollutants and finally lime
will be added to adjust the pH value. The water is then stored in a contact tank in order
to increase the retention time of the chemical reaction, particularly in the disinfection
1

process. Finally the treated water is stored in a reservoir and is ready to be distributed
through the water supply network.
Among all the processes involved in the water treatment plant (WTP), the
coagulation process is considered as the most important and crucial stage as it allows
the removal of dirt and colloidal particles. Coagulant dosing is not only the major
control parameters in the coagulation process but it also represents the major operation
cost in a water treatment plant. Good coagulation control is very important in order to
produce satisfactory treated water qualities and to maintain the economic value of the
plant operation. On the other hand, poor control of the same will cause wastage of
chemicals, low water qualities and failure in the sedimentation and filtration processes
(Valentin et al., 1999). In addition, excessive coagulant dosage particularly aluminum
sulphate (Al2(SO4)3.18H2O) has been linked to several medical disorders such as
osteomalacia, dialysis enceohalopathy syndrome, Alzheimer’s disease and renal failure
(Mirsepassi, 2004).
In practice, the required concentration of coagulant dosage to destabilize any
colloidal particles in the WTP is typically evaluated by jar testing (Lamrini et al., 2005),
a process of off-line dosing tests. Jar testing involves taking raw water samples and
applying different quantities of coagulant to each sample. Each sample is then assessed
for water quality and the dosage that produces the best result for water quality will be
used as the dosing rate. The WTP operators should adjust the required coagulant dosage
in conjunction with changes of incoming raw water qualities which often occurs any
time.
Other method of controlling the coagulant dosage is using the Streaming Current
Detector (SCD) which measures the residual charge on colloidal colour and turbidity
particles in the water. As these colloidal particles have a negative charge and the
2

coagulant ions have a positive charge, the amount of coagulant added dictates the
magnitude and sign of the electrical charge (Evans et al., 1998). The system controls
this net charge at a set point which has been shown by jar testing to provide close to
optimum coagulation under a certain range of raw water conditions. However, the
disadvantages associated with the SCD method are its high operational cost and its lack
of adaptation to various types of raw water qualities (Valentine et al., 1999).
1.2 Problem Statement
To date, almost all the WTPs in Malaysia still use conventional method such as
jar test in order to determine the required coagulant dosage. This method is expensive,
time-consuming and does not enable responses to changes in raw water quality in real
time. Since the raw water parameters like turbidity, pH, and colour change over time,
plant operators have to repeat the jar test to determine the required coagulant dosage at
any time. Conducting too often jar test consume a lot of chemicals for testing, contribute
to higher electricity bills and also require an experienced manpower to obtain good
results in determining the required coagulant dosage.
One way to understand the relationships between raw water parameters and the
optimum coagulant dosage required is through deriving mathematical models and
equations. However, determining an exact mathematical model is very difficult because
the relationships are very complex and highly non-linear. Therefore, a different type or
method of modeling is necessary rather than conventional mathematical modeling. The
artificial neural network (ANN) modeling is a method which is applicable to problems
in which the cause-effect relationships are complex, non-linear and no mathematical
formula exists, such as the case with determining the optimum coagulant dosage. If
3

enough data that represent all aspects of the problem domain is available, a model can
successfully be developed (Tupas, 2000).
Once the model is successfully developed, it can serve as a potential tool to
determine the optimal coagulant dosage replacing the existing methods. The optimized
model can be implemented online by integrating the existing control system available in
many treatment plants such as the Supervisory Control and Data Acquisition (SCADA)
system. Moreover, applying this method will not only provide better coagulant control
but will initiate advance action if changes of the incoming raw water qualities into the
treatment plant occur. In addition to the quickness and convenience of using the ANN
model for real-time application, the model could also be useful in operator training by
simulating possible scenarios in which the operator would learn the results of various
treatment options. All of these various uses show the tremendous benefits of developing
and utilizing an ANN model in WTP operations, particularly in determining optimum
coagulant dosage instead of relying only to conventional method of jar testing.
In this research, the ANN models are used to model the required alum dosing of
a privatized WTP which belong to the State Water Supply Department of Sabah
Government. The developed models will enable the plant operators to obtain the
required alum dosages and to predict the treated water parameters easily within a short
period of time. In addition, the models of some treated water quality parameters such as
turbidity, colour, pH and aluminum residue are also developed so that the plant
operators can gain better understanding of the relationship between raw water qualities,
applied alum dosage, and treated water qualities.
4

1.3 Research Objectives
The primary goal of this research is to develop the ANN models for coagulant
dosage and treated water qualities determination for the Segama WTP. Besides
obtaining the primary objective, this research also aims to achieve the following
objectives:
1. To study the characteristics and pattern of the raw water parameters in the
Segama WTP.
2. To find the appropriate input-output selection used in the ANN models
development.
3. To find the best neural network architecture for the process inverse model in the
prediction of coagulant dosage and the process models in the prediction of
treated water quality parameters.
4. To evaluate the performance of the process inverse neural network model after
the elimination of some less significant input parameters via stepwise regression
analysis.
5. To evaluate the performance of multiple inputs multiple outputs (MIMO)
networks as compared to multiple inputs single output (MISO) networks.
1.4 Overview of the Thesis
The thesis is organized into five chapters which covers the literature review,
methodology, results and discussion as well as conclusions and recommendations.
Chapter One gives an outline of the whole thesis which includes the background
of the water treatment industry and its challenges in producing safe drinking water. The
problem statement portrays the problem faced and the needs of the current research. The
5
6
research objectives specify the aims of the study to obtain the optimum neural network
architectures for the process inverse and process models.
Chapter Two provides the general description of a WTP as well as the case study
area of the Segama WTP. Some important water quality parameters together with the
coagulation process and its current control methods in WTP are also included. A
detailed discussion of the ANN includes the characteristics of the ANN, the design of
the ANN models and ANN’s application are covered in this section. A review of
previous studies as well as the nature of the current work using the ANN in the drinking
water industries is also included.
Chapter Three describes the methodology applied in the neural network models
development. Data preparation and analysis is outlined in this chapter. Lastly, this
chapter also provides details of the neural network model development which includes
the significant input-output determination and characteristics of the ANN applied for
modeling coagulant dosage and treated water qualities in the Segama WTP.
Chapter Four presents the results and discussion of the research. The results of
the data analysis are presented with the inclusion of some raw water patterns and
characteristics, data preparation and input-output selection for the appropriate models.
The results of the process inverse model and the process models are also discussed in
detailed in this chapter.
Finally, Chapter Five summarizes the results obtained in the present study along
with the conclusions and recommendations for future study based on the overall results
obtained.

CHAPTER 2
LITERATURE REVIEW
2.1 General Description of a Water Treatment Plant (WTP)
Water treatment is a well known process that has been used for many years.
However, contrary to most industrial processes in which the quality of the input raw
material is under control, the quality of a given raw water source may fluctuate due to
natural perturbations. Therefore, raw water is treated differently in different WTPs
depending on the quality of the water which enters the plant. Regular water treatment
processes require coagulation, flocculation, sedimentation, filtration, and disinfection
processes in order to reach safe drinking water quality standards. Other processes such
as softening, and fluoridation, may be required depending on the quality of the water
source.
In the coagulation and flocculation processes, the coagulant and other chemicals
are added to the water in order to form heavier and sticky particles, called “floc”, which
attracts dirt and other particles suspended in the water. Then, during the sedimentation
process, the heavy particles (floc) settle to the bottom of the sedimentation tanks and the
clear water moves to the filtration tanks.
In the filtration process, the clarified water passes through filters, some made of
layers of sand, gravel, and charcoal, which help to remove even smaller particles.
Finally, in the disinfection process, a small amount of chlorine is added to kill any
bacteria or microorganisms that might still exist in the water. The treated water is then
placed in a holding tank in order to increase the retention time of the disinfection
process and then pumped into an elevated reservoir prior to its distribution. Figure 2.1
shows the processes involved in a conventional water treatment plant.
7
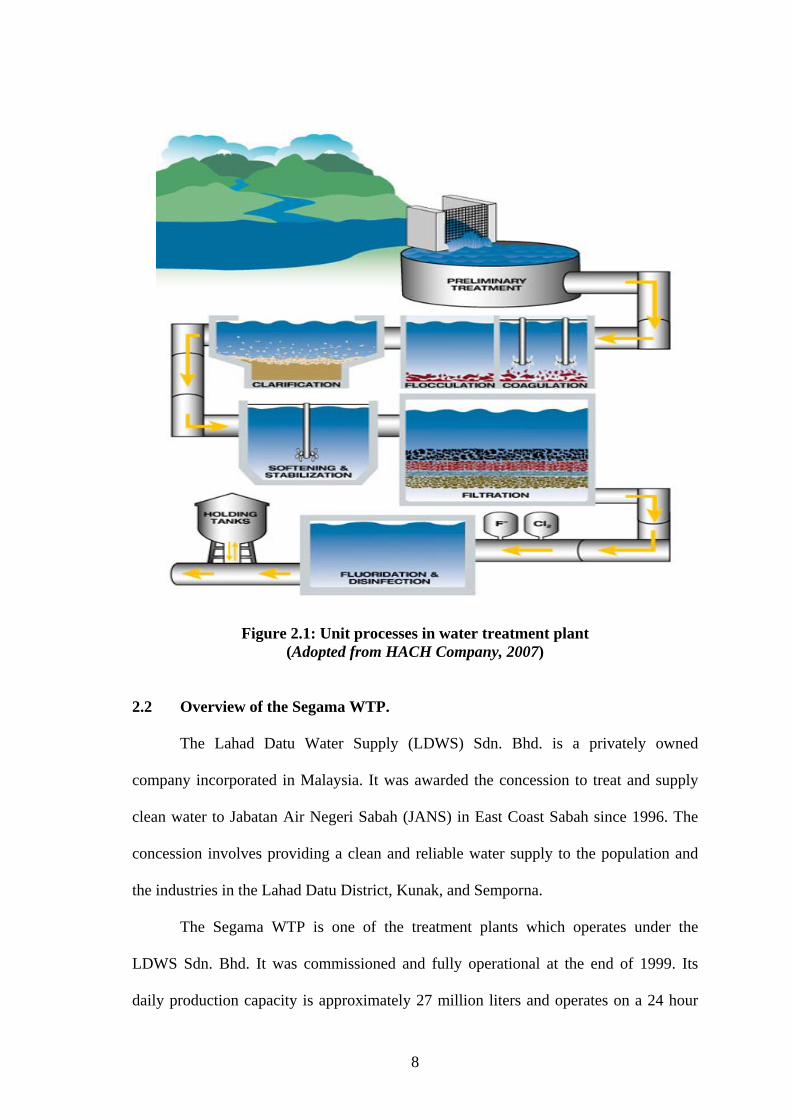
Figure 2.1: Unit processes in water treatment plant (Adopted from HACH Company, 2007)
2.2 Overview of the Segama WTP.
The Lahad Datu Water Supply (LDWS) Sdn. Bhd. is a privately owned
company incorporated in Malaysia. It was awarded the concession to treat and supply
clean water to Jabatan Air Negeri Sabah (JANS) in East Coast Sabah since 1996. The
concession involves providing a clean and reliable water supply to the population and
the industries in the Lahad Datu District, Kunak, and Semporna.
The Segama WTP is one of the treatment plants which operates under the
LDWS Sdn. Bhd. It was commissioned and fully operational at the end of 1999. Its
daily production capacity is approximately 27 million liters and operates on a 24 hour
8

basis in order to serve a population of about 130,000 in the Lahad Datu District. The
raw water for the treatment plant is extracted from the Segama River, Lahad Datu,
located approximately one km from the treatment plant area and it is pumped through a
750 mm diameter pipeline to the treatment plant.
Before entering the treatment plant, pre-lime is added to the raw water for pH
adjustment so that an optimum pH of 5.0 to 7.0 can be reached for alum to coagulate
efficiently. In the treatment plant, the raw water is treated via aeration through a cascade
aerator in order to oxidize unwanted gasses and metals such as manganese in order to
remove the odour. The aerated water then flows into a mixing chamber where alum is
added to promote coagulation and flocculation. At the same time, a rapid mixer in the
mixing chamber ensures the proper mixing of alum. The aeration and alum addition
points are shown in Plate 2.1.
Plate 2.1: Aeration process and chemical addition (With permission from the Segama WTP)
The raw water then flows into four units of flocculation tanks through a
manually operated inlet penstock. The flocculation tanks are divided into three stages
which reduce the velocity of the water flow from 0.27 m/s to 0.075 m/s in order to
9

enable bigger size of flocs formation. This is illustrated in Plate 2.2. The flocculation
tanks, consist of High Density Polyethylene (HDPE) baffles placed perpendicular to the
direction of the flow in a gradually increasing distance.
Plate 2.2: Three stages of baffles type flocculation tank (With permission from the Segama WTP)
The raw water from the flocculation tanks, which is by now full of big size flocs,
enters the bottom compartment of the four units of the lovo type sedimentation tanks
and rise up into the upper compartment to overflow into the settled water channel over
‘finger’ weirs as shown in Plate 2.3. Most of the flocculated particles will settle into the
lower compartment. The settlement of the bigger flocs size in the lower compartment of
the sedimentation tank will then be discharged by opening the plug scour valve at
intervals. The retention time of the sedimentation tank is about 2 hours and 30 minutes.
10

Plate 2.3: ‘Finger’ weirs colleting clarified water in sedimentation tank (With permission from the Segama WTP)
The clarified water from the sedimentation tank is added with lime for pH
correction and flows evenly into six units of rapid gravity filters where filtration process
takes place. The filtration tank is illustrated in Plate 2.4. The filtration media used in the
rapid gravity filtration system are layers of fine and coarse sand which is filled to a
maximum height of 1 meter.
Plate 2.4: Rapid gravity filtration tank (With permission from the Segama WTP)
11

In the next step, the filtered water flows through a 600 mm diameter pipeline
into the clear water tank, which is divided into two compartments; a holding tank and a
treated water tank. The treated water is disinfected by using chlorine; this takes place in
the holding tank before it is pumped into a balancing reservoir and ready to be
distributed. With the advancement of the technology, the Segama WTP control center is
occupied with a SCADA system in order to control, acquire data, monitor and display
the status of various equipments and process parameters in the water treatment
processes.
2.3 Water Quality
Water quality is used to describe water of a good quality. In general, it depends
on what the water is going to be used for. The most polluted water can fulfill all criteria
for a hydropower system but will completely fail if it is used for drinking purposes.
Water quality varies from place to place and from time to time even in a
particular river system. It is dependent on many factors, both natural and mostly from
the influence of human activities. The water quality is basically the result of pure water
plus other parameters such as minerals that exist in the water (Jesper, 2004). Rain water
is pure but when it reaches the earth, its quality is affected by the soils, rocks, and
vegetation over and through which it passes. These parameters may come from many
sources: daily human activities or from environment processes such as the effects of
different weathers on soils and rocks, biological processes, or from the atmosphere.
The Sabah Water Supply Department (JANS) has to ensure that the treated water
qualities reach the water consumers in accordance to the standard of World Health
Organization’s (WHO). The treated water quality standard for JANS is shown in Table
2.1.
12
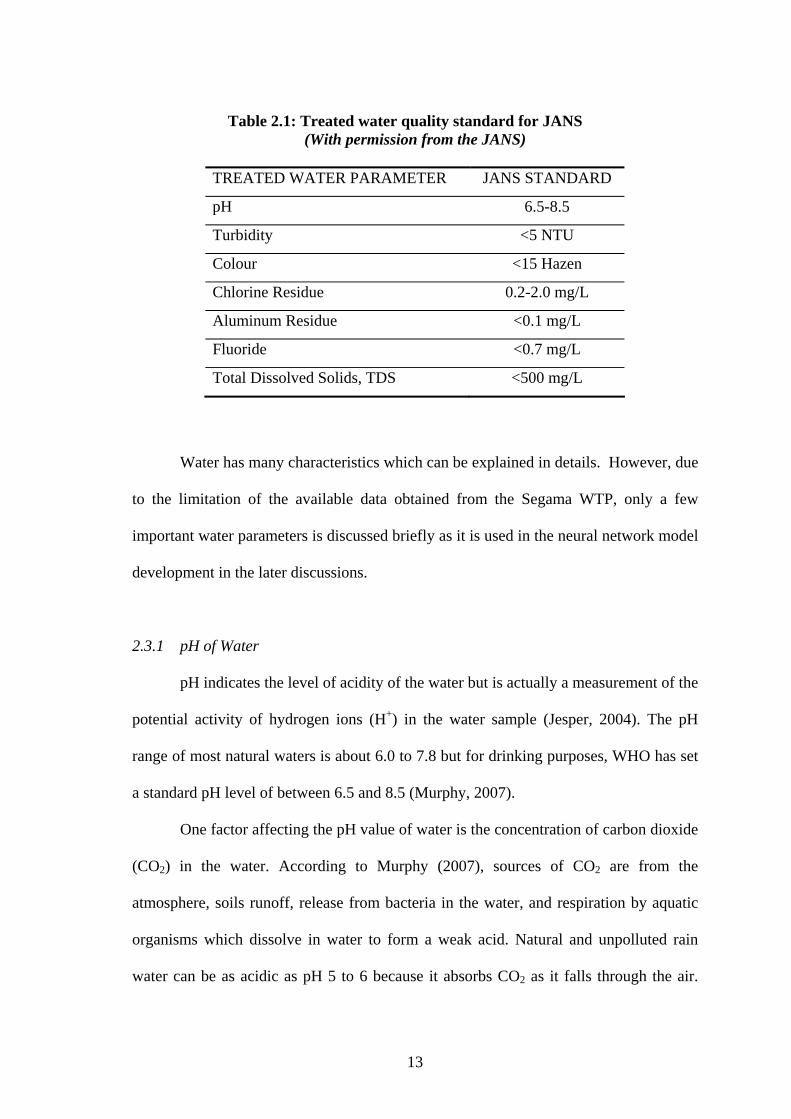
Table 2.1: Treated water quality standard for JANS
(With permission from the JANS)
TREATED WATER PARAMETER JANS STANDARD
pH 6.5-8.5
Turbidity <5 NTU
Colour <15 Hazen
Chlorine Residue 0.2-2.0 mg/L
Aluminum Residue <0.1 mg/L
Fluoride <0.7 mg/L
Total Dissolved Solids, TDS <500 mg/L
Water has many characteristics which can be explained in details. However, due
to the limitation of the available data obtained from the Segama WTP, only a few
important water parameters is discussed briefly as it is used in the neural network model
development in the later discussions.
2.3.1 pH of Water
pH indicates the level of acidity of the water but is actually a measurement of the
potential activity of hydrogen ions (H+) in the water sample (Jesper, 2004). The pH
range of most natural waters is about 6.0 to 7.8 but for drinking purposes, WHO has set
a standard pH level of between 6.5 and 8.5 (Murphy, 2007).
One factor affecting the pH value of water is the concentration of carbon dioxide
(CO2) in the water. According to Murphy (2007), sources of CO2 are from the
atmosphere, soils runoff, release from bacteria in the water, and respiration by aquatic
organisms which dissolve in water to form a weak acid. Natural and unpolluted rain
water can be as acidic as pH 5 to 6 because it absorbs CO2 as it falls through the air.
13

Since plants consume CO2 during the day and release it during the night, pH levels in
water can change from daytime to night (Jesper, 2004).
In addition, air pollution from car exhaust and power plant emissions increases
the concentrations of nitrogen oxides (NO2, NO3) and sulfur dioxide (SO2) in the air.
These pollutants travel from one place to another, and react in the atmosphere to form
nitric acid (HNO3) and sulfuric acid (H2SO4) (Murphy, 2007). These acids can have an
effect on the pH of streams by combining with moisture in the air and falling to the
earth as acid rain.
2.3.1 Turbidity
Turbidity is the optical property of a water sample which causes light to be
scattered and absorbed rather than transmitted in a straight line through the sample; it is
a measure of the cloudiness of the water. The ability of light to pass through water
depends on how much suspended material is present in the water (Jesper, 2004). The
turbidity may be caused by large amounts of clay, silt, sawdust, wood ash,
microorganisms, and plant fibers. Such particles can cause tastes, carry bacteria and
plant nutrients, and can cause the chlorine in the disinfection process to be less effective
by adsorption and inactivation of the chlorine, or by protection of the bacteria (Judith et
al., 2001). The flow rate of a water body is a primary factor influencing turbidity level.
High flow rate of water can carry more particles and larger-sized sediment which causes
higher turbidity level (Murphy, 2007).
In general, turbidity will increase significantly during and after a rainfall, which
causes sediment to be carried into the stream (Behar, 1997). Heavy rains can pick up
sand, silt, clay, and organic particles from the land and carry it to surface water. Soil
14

erosion from buildings and road constructions, logging, and mining activities also can
contribute to the increasing level of turbidity.
The effluents and wastes from residential areas also add suspended solids and
organic materials into a stream. The wastewater may contain food residue, human
wastes, and other solid materials that have been thrown out into the drains. Furthermore,
when plants and animals which are present in a water body die and decay, suspended
organic particles are released and this can contribute to turbidity (Jesper, 2004).
2.3.1 Colour
The colour of the stream water is an indication of its source and it can provide
important information about the water quality. According to Jesper (2004), the overall
colour of the water may indicate the soil and bedrock types (e.g. red- red sandstone),
unnaturally high concentrations of compounds such as iron (red), too much algae
(green), or the presence of dyes and other chemicals in the water. Darker coloured
waters absorb more of the sun's heat and will raise water temperature. The colour may
also result from the contamination of the water source by industrial effluents and may
be the first indication of hazardous water source pollution.
The visible colour of water is the result of the amount and character of the
dissolved and fine particulate matter present. Naturally occurring minerals such as iron
hydroxides, and organic compounds such as humic acids, give water what is called
‘true’ colour (APHA, 1995). ‘Apparent’ colour, measured in Hazen Units (HU),
includes not only colour due to dissolved substances but also that caused by suspended
material. Natural waters can range from less than 5 HU in very clear waters to more
than 300 HU in muddy water (Judith et al., 2001).
15

The colour of water is an aesthetic parameter and treatment is given to remove
or reduce it in order to produce water that will have an acceptable appearance to
customers. An aesthetic objective of < 15 HU has been set by WHO for colour in
drinking water (Judith et al., 2001). It is very necessary to treat this parameter as colour
values above 15 HU can be detected in a glass of water by most water consumers. The
removal of excess colour in coagulation process, prior to chlorination process will
reduce the production of trihalomethanes (disinfection by-products) which will lead to
cancer problem (Milot et al., 2002)
2.3.1 Alkalinity
Alkalinity is not a pollutant; it is a total measure of the substances in the water
that have "acid-neutralizing" ability which does not refer to the pH but to the ability of
water to resist changes in the pH. Water with low alkalinity is liable to changes in pH
while water with high alkalinity is able to resist major shifts in pH (Murphy, 2007).
Alkalinity is important for fish and aquatic life because it protects and buffers
against pH changes and makes water less vulnerable to acid rain. The main sources of
natural alkalinity are limestone which can contain carbonate, bicarbonate, and
hydroxide compounds (Jesper, 2004).
2.3.1 Total Solids
Total solids refer to suspended or dissolved matters in water or wastewater and
are related to both specific conductance and turbidity. It includes both the total
suspended solids (TSS), and the total dissolved solids (TDS). According to Murphy,
(2007), TSS includes a wide variety of materials such as silt, decaying plant and animal
matter, industrial wastes, and sewage while TDS may include carbonate, bicarbonate,
16

chloride, sulfate, phosphate, nitrate, calcium, magnesium, sodium, organic ions, and
other ions. High concentrations of both TSS and TDS may also reduce water clarity,
contribute to a decrease in photosynthesis, combine with toxic compounds and heavy
metals, and lead to an increase in water temperature.
2.3.1 Aluminum Residue
Aluminum exists naturally in some waters but it is also comes from coagulant
like aluminum sulphate (alum) which is used by water treatment plants to remove
colloidal particles, colour and bacteria. The use of alum in the purification of water may
introduce hazards in some individuals, particularly when it is present in high
concentration. Water with higher levels of aluminum residue may induce
encephalopathy (degenerative brain disease) and dementia in patients with kidney
disease undergoing dialysis (Milichap, 1995).
WTPs usually control the treated water to a slightly alkaline condition, i.e. pH
between 7.0 and 8.0. As a result of alkaline conditions, aluminum precipitates as fine
solid particles which are then filtered out through sand filters in filtration process.
However after some times, sand filters become less efficient for particles as small as 4
to 5 microns and therefore fine particles will escape through it and become aluminum
residue.
2.4 Coagulation Process
Almost all water source particularly surface water contains both dissolved and
suspended particles. The suspended particles may vary in term of its source,
composition charge, particle size, shape and density. The correct design of a coagulation
process and the selection of appropriate coagulants are based upon the understanding of
17

interactions between these factors. The key of effective coagulation and flocculation is
an understanding of how individual colloids interact with each other. Turbidity particles
range from about 0.01 to 100 microns in size. Larger colloidal sizes are relatively easy
to settle or to be filtered while the smaller the sizes, from 0.01 to 5 microns will make
the settling times slower and they may easily escape filtration (Ravina, 1993).
(a) (b)
Figure 2.2: Interaction between (a) charged and (b) uncharged particles (Adopted from Ravina, 1993)
Figure 2.2 shows the behavior of colloids in water is strongly influenced by their
electrokinetic charge. Since the suspended particles are having the same negative
charge, they will repel when they come close each other (Figure 2.2-a) and remain in
suspension rather than clump together and settle out of the water. As a result, charged
colloids tend to remain discrete, dispersed, and in suspension. On the other hand, if the
charge is significantly reduced or eliminated, then the colloids will gather together
(Figure 2.2-b). Initially the colloids will form small groups, then larger groups and
finally into visible floc particles which settle rapidly and filtered easily.
The coagulation process is done by adding coagulant (a highly ionic salt of
positively charged) to the water and allow for mixing to occur in vessels like in
18

flocculation chamber as shown in Plate 2.2. Most often, aluminum sulphate or alum
(Al2(SO4)3.18H2O) will be used in WTPs. Optimum pH conditions for alum coagulation
are generally in the range of about 5.0 to 7.0, while the pH range of most natural waters
is from about 6.0 to 7.8. Therefore, some of the alum dose is actually being used solely
to lower the pH to its optimum value. When aluminum sulphate is added to water,
hydrous oxides of aluminum are formed. The simplest form of these hydrous oxides is
aluminum hydroxide; Al(OH)3 which is an insoluble precipitate. However, several more
complex, positively charged soluble ions are also formed which include Al6(OH)15+3,
Al7(OH)17+4 and Al8(OH)20
+4 (Ravina, 1993).
These insoluble precipitates will electrochemically attracts the negative charged
of solids and colloidal particles, thus removing undesirable turbidity, colour and organic
matter in the form of solid precipitates called flocs. The solid precipitate is removed by
allowing it to settle to the bottom of the sedimentation tank and then periodically it will
be discharged as sludge. In general, poor raw water qualities which contain higher
concentrations of contaminants in the water, require larger amount of coagulant dosage.
Good coagulation control is essential for maintaining satisfactory treated water
qualities and economic plant operation. As a result of improper coagulant dosage, too
much of it may ensure treatment targets are achieved but this will lead to high cost in
relation to excess coagulant dosage and extra sludge waste produced. Too little of
coagulant dosage will cause poor performance of treated water and problems in the
subsequent processes such as filtration and disinfection.
19

2.5 Existing Coagulation Control
2.5.1 Jar Test
Conventional method of controlling coagulant dosage relies very much on
manual method called jar test. Plate 2.6 shows the apparatus of conducting a jar test,
owned by Segama WTP. A lab assistant which is normally supervised by a plant
chemist will carry out the jar test, in order to aid plant operator in determining the
required coagulant dosage into the plant. The testing involves taking a raw water
samples and splitting it into 5 to 6 separate samples. Similar kind and concentrations of
chemicals in the actual plant prior to the flocculation process will be applied into the
samples.
Plate 2.5: Jar testing apparatus
(With permission from the Segama WTP)
In the Segama WTP, different quantities of coagulant are injected into each of
the sample and then stirred, typically by rapid stirring followed by a more gentle stirring
in order to simulate conditions in the treatment plant. After stirring, the sample is left
for a short time before visually deciding which coagulant dosage has produced the best
20

floc. Based on this finding, a recommended coagulant dosage is prescribed and the
agreed value is introduced into the process. Only under extremely differing conditions
and with the plant chemist’s advice would this dosage be altered before a new set of jar
tests are carried out.
Jar tests are expensive and time-consuming; it can take up to 30 to 45 minutes to
get the results of the required alum dosage. Consequently, jar test are generally carried
out periodically which means that the tests are reactive rather than proactive as alum
dosages are changed in response to the occurrence of water quality problems (Baxter et
al., 2001). Furthermore, as a result of the long duration to conduct jar test, they cannot
be used to respond to rapid changes in raw water qualities (Joo et al., 2000), and thus
are not suitable for real-time control (Yu et al., 2000). In practice, jar test are normally
carried out during the plant operator's shift and when the clarified water quality begins
to degrade. Therefore, this method only provides a snapshot of influent water qualities
and is unable to represent the dynamics in the full-scale WTP system.
2.5.2 Streaming Current Detector
Another method of controlling the coagulant dosage is by using the Streaming
Current Detector (SCD) which measures the residual charge on colloidal colour and
turbidity particles in the water. Lamrini et al. (2005) explained the SCD measures of the
electrical current generated between two electrodes by charged ions in a water sample.
The ions are hydraulically sheared from free colloidal particles by a motor-driven
plunger. Sheared ions carried two electrodes and the result is an alternating streaming
current which is proportional to the net charge density of the water. The net charge
density depends on the excess positive or negative ions present in the water after
21

coagulation. Experiments have shown that there exists a correlation between SCD
output and measured zeta potentials.
The disadvantages of the SCD method are its high operational cost and its lack
of adaptation to various types of raw water qualities (Valentine et al., 1999). In addition,
this method is not an exact quantitative model which explains the functions and its
limited efficiency for raw water quality of having a pH of more than 8 (Lamrini et al.,
2005). Even though the SCD is generally adopted as a continuous monitoring method to
determine the required coagulant dosage, Dentel (1995) pointed out that the output of
the SCD sometimes exhibits a contradictory result for the coagulation activation.
2.6 Artificial Neural Network (ANN)
2.6.1 Overview of ANN Modeling
The ANN modeling technique is a kind of artificial intelligence (AI) application
that simulates the human brain's problem solving processes and this is illustrated in
Figure 2.3. Just as humans apply knowledge gained from past experience to new
problems or situations, a neural network takes previously solved examples, looks for
patterns in these examples, learns these patterns and develops the ability to correctly
classify new patterns. In addition, the neural network has the ability to resemble human
characteristics in problem-solving that is difficult to simulate using the logical,
analytical techniques of expert system and standard software technologies (Hussain,
1999; Daosud et al., 2005).
22

Figure 2.3: From human brain to artificial neural network (Adopted from Strugholtz, 2006)
ANNs are capable of self-organization and learning; concepts and patterns can
be extracted directly from historical data without any complex mathematical formulas or
algorithms. Generally, ANNs can be applied to various kinds of problems such as
pattern classification, clustering and categorization, function approximation, prediction
and forecasting, optimization, associative memory, and process control (Jain et al.,
1996).
The ANN technique has several advantages over conventional modeling
approaches that makes it especially applicable to the current study. As mentioned
before, the ANN approach does not require complex mathematical algorithms, only
knowledge of the factors governing the process is needed. In the water treatment
industry, many uncertainties exist because of the complex physical and chemical
reactions involved among the water parameters. Conventional modeling techniques
require mathematical algorithms to describe these uncertainties whereas a neural
network simply learns the process based on historical data (Stanley et al., 1998).
Therefore, no fundamental equations governing the system need to be derived in the
WTP as this would be impossible due to poor process understanding. Furthermore, in
most of the WTPs, there is a lot of recorded data which can be applied in the model
development.
23

Any changes in the process or unit operation of the WTP, which would make a
conventional model invalid, can be incorporated into the ANN models following a brief
period of retraining. More importantly, the ANN models are able to handle the
nonlinearity characteristics of the input parameters. In water treatment processes, many
of the raw water quality parameters may vary even on an hourly basis in which
statistical models that assume a linear structure are not able to cope. All the features of
the ANNs allow them to be incorporated into the real-time process control of the WTP
operations.
Another benefit of the ANN technique is it is a quick and responsive tool
because once the historical data has been computed, the ANN models can be developed
and applied in real-time water treatment processes. Advances in computing power have
also minimized the time required to develop models, as well as the time required to re-
train models to incorporate new data and to reflect process modifications (Baxter et al.,
2001). In the drinking water treatment, process modifications occur frequently and the
ability to quickly modify with the process changes is another benefit of using the ANN.
The characteristic that really makes ANNs different from other conventional
statistical methods is its ability to self-organize or learn. This feature allows ANNs to
produce correct or nearly correct responses when presented with partially incorrect or
incomplete stimulus, and to generalize rules from the training cases and apply these to
new cases (Garret et al., 1992). The network is able to produce the best output
according to training examples when new input vectors are presented to the network,
and it is fault-tolerant where the system is still able to perform well even when there
are errors within the network (Tupas, 2000). This means that mostly correct answers are
produced even though data presented to the network is incomplete. Finally, since the
ANN models are developed using full scale and real operational data, the scale up
24