DEVELOPMENT OF MICROCOMPARTMENTALIZATION USING ...
192
DEVELOPMENT OF MICROCOMPARTMENTALIZATION USING MACROMOLECULES AND LIQUID-LIQUID INTERFACES by Taisuke Kojima A dissertation submitted in partial fulfillment of the requirements for the degree of Doctor of Philosophy (Macromolecular Science and Engineering) in The University of Michigan 2016 Doctoral Committee: Professor Shuichi Takayama, Chair Professor Joerg Lahann Professor Nicholas A. Kotov Professor Richard Robertson Associate Professor Anish Tuteja
Transcript of DEVELOPMENT OF MICROCOMPARTMENTALIZATION USING ...

DEVELOPMENT OF MICROCOMPARTMENTALIZATION USING
MACROMOLECULES AND LIQUID-LIQUID INTERFACES
by
Taisuke Kojima
A dissertation submitted in partial fulfillment of the requirements for the degree of
Doctor of Philosophy (Macromolecular Science and Engineering)
in The University of Michigan 2016
Doctoral Committee:
Professor Shuichi Takayama, Chair Professor Joerg Lahann Professor Nicholas A. Kotov Professor Richard Robertson Associate Professor Anish Tuteja

© Taisuke Kojima All Rights Reserved
2016

ii
To those who have taught me joy of life and science.

iii
ACKNOWLEDGEMENTS
I would like to acknowledge my advisor, Professor Shuichi Takayama, for your patience and
generosity to allow me to try whatever I have wanted through my Ph.D. course. Without your
support, I could not survive as a researcher as well as a foreign graduate student in a place where
I have never experienced and imagined before.
I would like to appreciate the rest of the committee members, Dr. Joerg Lahann, Dr. Nicholas A.
Kotov, Dr. Richard Robertson, Dr. Anish Tuteja, for your suggestions and inputs. Each project
described herein could not be completed without you.
I would like to thank former and current members of Takayama lab. Especially, I would like to
mention Arlyne Simon and Priyan Weerappuli who have continuously supported my Ph.D. life.
You are my best friends ever.
I would like to recognize my Swedish collaborators: Dr. Jonas Tegenfeldt who supported my
research internship in Lund and Dr. Per-Åke Albertsson who shared your research history as the
living god of ATPSs. It was my dream to conduct research in Sweden since I worked with
Sweden-originated biosensors in my bachelor and master degree.
I would like to give my deep appreciation to Lili Tang, Li-ting Chang, Tomoko Savina, and
Mayurachat Ning Gulari. I cannot thank enough to you all for your sincere support as spiritual
moms.

iv
I would like to express my sincere gratitude to my parents, Masako and Iwao Kojima. Your
dedication to me is incredible. With your love, I can survive wherever I go.
I would like to sincerely appreciate my dear, Marisa Chandavimol, who dared to come all the
way to cold Michigan and supported me through your dedication.
Finally, I would like to express my deep love to the wild animals in Michigan, especially deer,
geese, gophers, skanks, squirrels, and turkeys around the campus. Over three generations, they
could heel my bitter feelings whenever I get depressed. Without them, I could not survive in
Michigan winter over 4 years.

v
Table of Contents
Dedication ....................................................................................................................................... ii
Acknowledgements ........................................................................................................................ iii
List of Figures ................................................................................................................................ ix
List of Schemes ............................................................................................................................. xii
Abstract ........................................................................................................................................ xiii
Chapters
1. Introduction: Construction of micro-scale chemical and biological assay platforms
through microfabrication and microcompartmentalization ................................................... 1
1.1. The Miniaturization of The Reactors .........................................................................1
1.2. PDMS-Templated Surface Modification: Top-Down Approach to Microreactors ...2
1.3. Microcompartmentalizaiton via Self-Assembly: Bottom-Up Approach to
Microbioreactors ........................................................................................................4
1.4. Liquid-in-Liquid Separation in Aqueous Two-Phase Systems and Complex
Coacervation ...............................................................................................................5

vi
1.5. Microcompartmentalizaiton at The Liquid-Liquid Interfaces by Combined Top-
Down and Bottom-Up Techniques .............................................................................7
1.6. Dissertation Overview ................................................................................................9
1.7. References ................................................................................................................10
2. Patchy Surfaces Stabilize Dextran-Polyethylene Glycol Aqueous Two-Phase System
Liquid Patterns ................................................................................................................................. 14
2.1. Introduction ..............................................................................................................15
2.2. Materials and Methods .............................................................................................16
2.3. Results and Discussion .............................................................................................20
2.4. Conclusions ..............................................................................................................25
2.5. References ................................................................................................................44
3. Surface-Templated Hydrogel Patterns Prompt Matrix-Dependent Migration of Breast
Cancer Cells towards Chemokine-Secreting Cells ................................................................. 47
3.1. Introduction ..............................................................................................................48
3.2. Materials and Methods .............................................................................................50
3.3. Results ......................................................................................................................55
3.4. Discussion ................................................................................................................61
3.5. Conclusions ..............................................................................................................64

vii
3.6. References ................................................................................................................77
4. Microscale Determination of Aqueous Two Phase System Binodals by Droplet
Dehydration in Oil ........................................................................................................................... 82
4.1. Introduction ..............................................................................................................83
4.2. Materials and Methods .............................................................................................85
4.3. Results and Discussion .............................................................................................88
4.4. Conclusions ..............................................................................................................90
4.5. References ..............................................................................................................108
5. Shrinking Microdroplets Assists Metamorphoses of The Nanoparticle Assemblies ..... 110
5.1. Introduction ............................................................................................................111
5.2. Materials and Methods ...........................................................................................112
5.3. Results and Discussion ...........................................................................................117
5.4. Conclusions ............................................................................................................122
5.5. References ..............................................................................................................139
6. Spatio-temporally Regulated Enzyme Reactions in Membrane-Free Compartments
Formed in An Aqueous Three Phase System .......................................................................... 142
6.1. Introduction ............................................................................................................144
6.2. Materials and Methods ...........................................................................................145

viii
6.3. Results and Discussion ...........................................................................................150
6.4. Conclusions ............................................................................................................156
6.5. References ..............................................................................................................168
7. Conclusions and Future Directions ........................................................................................... 171
7.1. Conclusions ............................................................................................................171
7.2. Future Directions ....................................................................................................176

ix
List of Figures
Figure 2.1. Fluorescent Measurement of Chemically Modified PDMS Surfaces ....................30
Figure 2.2. XPS Analyses of Chemically Modified PDMS Surfaces ......................................31
Figure 2.3. Contact Angle Measurements of Surfaces at Water-Air Interface ........................32
Figure 2.4. Contact Angle Measurements of Surfaces at DEX-PEG Interface ........................33
Figure 2.5. Sliding and Hysteresis Measurements of Surfaces at DEX-PEG Interface ...........34
Figure 2.6. DEX Solution “M” Patterns in 3.2% DEX – 2.5% PEG System ..........................35
Figure 2.7. DEX Solution Lines Formed on Surface-Modified Square Patches ......................36
Figure 2.8. Arbitrary DEX Solution Patterns in 3.2% DEX – 2.5% PEG System ...................37
Figure 2.9. Fluorescent Measurement of Chemically Deactivated PDMS Surfaces ...............38
Figure 2.10. Contact Angle Measurements: Young’s Equation .................................................39
Figure 2.11. DEX Solution “U” Patterns in 3.2% DEX – 2.5% PEG System ...........................40
Figure 2.12. Patchy Surface Designs ..........................................................................................41
Figure 2.13. Surface Adhesion and Gap Effects on DEX Solution Line Stability .....................42
Figure 2.14. Pinning and Spreading of Arbitrary DEX Solution Patterns .................................43
Figure 3.1. Patterning of Hydrogels on A Cell-Repellent Surface ...........................................65
Figure 3.2. Surface Characterization of PAA-Coated PDMS ..................................................66
Figure 3.3. Migration Assay of CXCR4+ Cells in 3D Gel Matrix ..........................................67
Figure 3.4. Computational Modeling of CXCL12-β Gradients ...............................................68
Figure 3.5. Binding Assay of CXCL12 Isoforms in Different Gel Matrices ...........................69
Figure 3.6. Migratory Comparison of CXCL12 Isoforms in The Presence of Matrigel ..........70
Figure 3.7. HBME Cells in The Patterned Hydrogel Droplets ...............................................71
Figure 3.8. Surface Topography of Intact and Oxidized PAA-Coated PDMS ........................72

x
Figure 3.9. Soluble Factors to Inhibit Migration in The Patterned Hydrogel System .............73
Figure 3.10. Migration Assay of CXCR4-CXCL12 with Large Spacing ..................................74
Figure 3.11. Varied Simulation Parameters for The CXCL12 Diffusion Profiles .....................75
Figure 3.12. Multiplex Gel Patterning in Air .............................................................................76
Figure 4.1. Shapes of Droplets of PBS Solution in Soybean Oil .............................................94
Figure 4.2. Time-Lapse Droplet Shrinking of a PBS Soltuion ................................................95
Figure 4.3. Phase Separation at The Binodal Point of 10K DEX – 8K PEG System ..............96
Figure 4.4. Binodal Points in DEX-PEG System Determined by Dehydration .......................97
Figure 4.5. Binodal Points in DEX-PVA System and PEG-PVA System ...............................98
Figure 4.6. Binodal Points in BSA-PEG System .....................................................................99
Figure 4.7. Binodal Points in DEX-PEG System Determined by Dilution ............................100
Figure 4.8. Time-Lapse Droplet Images in 10K DEX – 8K PEG System .............................101
Figure 4.9. The Uncertainty of Binodal Points in 10K DEX – 8K PEG System ...................102
Figure 4.10. Binodal Points for a 500K DEX – 35K PEG System ..........................................103
Figure 4.11. Fitted Binodal Curves in DEX-PVA System and PEG-PVA System .................104
Figure 4.12. Fitted Binodal Curves in BSA-PEG System .......................................................105
Figure 4.13. Magnified Phase Contrast Images of Droplets Before and At Binodal Point .....106
Figure 4.14. Phase Separation at Binodal Point in 66K BSA – 35K PEG System ..................107
Figure 5.1. Time-Lapse Droplet Shrinking of CdTe Suspension ...........................................124
Figure 5.2. SEM Images of CdTe Assemblies .......................................................................125
Figure 5.3. AFM Images of The CdTe Assemblies Collected at Day-3 ................................126
Figure 5.4. TEM Images of The CdTe Assemblies Collected at Day-3 ................................127
Figure 5.5. EDX Images of The CdTe Assemblies Collected at Day-3 .................................128
Figure 5.6. Confocal Microscopy Images of The CdTe Assemblies Collected at Day-3 ......129
Figure 5.7. SEM Images of CdTe Assemblies at Day3 with The Oil Constituents ..............130
Figure 5.8. SEM Images of CdTe Assemblies in The Presence of Salt and Light .................131
Figure 5.9. SEM Images of The CdTe Assemblies by the 100-Fold High Concentration .....132

xi
Figure 5.10. EDX Spectra of The CdTe Assemblies Collected at Day-3 ................................133
Figure 5.11. Fluorescent Spectra of The CdTe Assemblies Collected at Day-3 ......................134
Figure 5.12. A Computation Model of Droplet Dehydation in Soybean Oil ...........................135
Figure 5.13. A Computation Model of Droplet Dehydation in Hexadecane ...........................136
Figure 5.14. SEM Images of The NPs Droplets Irradiated at Different Time Points ..............137
Figure 5.15. Reconfigured 3D Z-Stack Images of The CdTe Droplets ...................................138
Figure 6.1. Patterning of ATP-PDDA Coacervates in 10%DEX – 10% PEG System ..........158
Figure 6.2. Ionic Strength-Driven Degradation of ATP-PDDA Coacervates ........................159
Figure 6.3. GOx-HRP-Mediated Cascade Reaction ...............................................................160
Figure 6.4. Cascade Reaction Behavior Upon Droplet Isolation and Coalescence ...............161
Figure 6.5. Dextranase-Mediated DEX Degradation Assay ..................................................162
Figure 6.6. UV/VIS Spectra of ATP-PDDA Coacertvate Suspension ...................................163
Figure 6.7. Wetting Behavior of ATP-PDDA Coacervates ...................................................164
Figure 6.8. Multi-Patterning of ATP-PDDA Coacervates Containing Food Colorings ........165
Figure 6.9. pH and Ionic Strength Effect on ATP-PDDA Coacervates .................................166
Figure 6.10. Time-lapse GOx Partitioning into ATP-PDDA Coacervates .............................167

xii
List of Schemes
Scheme 2.1. Chemical Modification of PDMS ..........................................................................27
Scheme 2.2. Two-Face Chemical Modification of PDMS .........................................................28
Scheme 2.3. Microchannel-Guided Surface Modification of PDMS .........................................29
Scheme 4.1. Determination of ATPS Binodal Curves by Dilution and Concentration ..............92
Scheme 4.2. Droplet Shrinking in Oil on A Dish Surface and FC40 Oil Surface ......................93

xiii
ABSTRACT
Development of Microcompartmentalization Using Macromolecules and Liquid-Liquid
Interfaces
by
Taisuke Kojima
Compartmentalization combined with regulated exchange and release of biomaterials is the key biological function. At the subcellular level, organelles sequester enzymes and substrates for storage while processing and releasing on demand. At the organism level, appropriate cellular compartmentalization gives rise to tissue organization and higher order function. Man-made bioreaction compartmentalization typically relies on micro-reactors constructed with glass, silicon, hard plastic, or amiphiphilic molecular walls. Reactors with such physical barriers, in return for excellent compartmentalization, lack amenability to molecular and cellular release and exchange as seen in the body. This thesis describes the engineering of multi-compartment bioreactors that utilize stable reagent partitioning within immiscible aqueous solutions. The all aqueous compartmentalization scheme, when combined with a micropatterned surface that pins the liquid-liquid interfaces, enable versatile direct printing of arbitrary multi-compartment bioreactor networks. Additionally, the lack of physical barriers at the liquid-liquid interface between the different aqueous compartments allows use of phase-altering chemicals to trigger rapid and selective mixing of materials between compartments in ways not possible with conventional miroreactors. Specific examples demonstrated include a compartmentalized cascade reaction that utilizes glucose and oxygen as nutrients to catalzye the production of different colored dyes within microcompartments and the localization-enhanced degradation of the microcompartments with a polysaccharide-degrading enzyme. In a separate strategy, a shrinking microreactor platform was created using oil dehydration. These shrinking bioreactors were utilized for micro-scale ATPS phase diagram determination and also adopted for micro-scale self-assembly of CdTe nanoparticles. Finally, surface-templated hydrogel micropatterning was used to compartmentalize cancer cells as well as limit diffusion of chemoattractants. This platform revealed the importance of extracellular matrix-mediated capture and localization of chemoattractants in triggering cancer cell migration that lead to a breakdown of cellular compartmentalization, tissue dis-organization and cancer metastasis. In addition to the specific demonstrations and biological insights obtained, the described macromolecular phase-separation microreactor platforms are versatile in configuration possibilities, particularly when combined with microfabrication technologies, and amenable to further explore materials science and biomedical engineering applications.

1
Chapter 1
Introduction: Construction of micro-scale chemical and biological assay platforms through
microfabrication and microcompartmentalization
1.1 The miniaturization of the reactors
The scale of reactions determines the amount of products and the cost of materials and processes.
It is important to determine the reaction scale based on needs. At the industrial level, batch
reactors and continuous reactors are exploited to mass produce chemicals for commercial
purposes1 in which the type of the reactors is carefully selected based on the thermodynamics
and kinetics of the chemical reactions involved.2 At the laboratory level, smaller scale reactors
such as flasks are commonly used to perform chemical reactions for research purposes. However,
when one has to challenge chemical or biological questions with small quantity of materials, the
reactor scale must be further miniaturized.
Meanwhile it is often challenging to build up scalable reaction platforms because reaction
conditions vary depending on the scale of the reactor.3 Owing to the development of
microtechnologies associated with microelectromechanical systems (MEMS)4, microscale
reactors (microreactors) made of rigid materials such as silicon, quartz, metals, polymers,
ceramics, and glass have also become available.5, 6 Despite their size, microreactors can be
2
highly scaled through repeating unit processes and numbering-up multiple microreactors in
parallel. Importantly, this type of scale up can be performed without further optimization of
reaction conditions.7-9 Interestingly, when the reactor size becomes smaller than a millimeter,
emergent properties arise: for example, rapid heat exchange and diffusion-based mixing.10, 11
These properties enable fast and efficient synthesis, process, separation, analysis, and detection,
and lead to the rapid development of micro total analysis systems (µTAS).12-14 The associated
technologies often overlap with the field of biomedical MEMS (Bio-MEMS) and lab-on-a-chip
(LOC).15
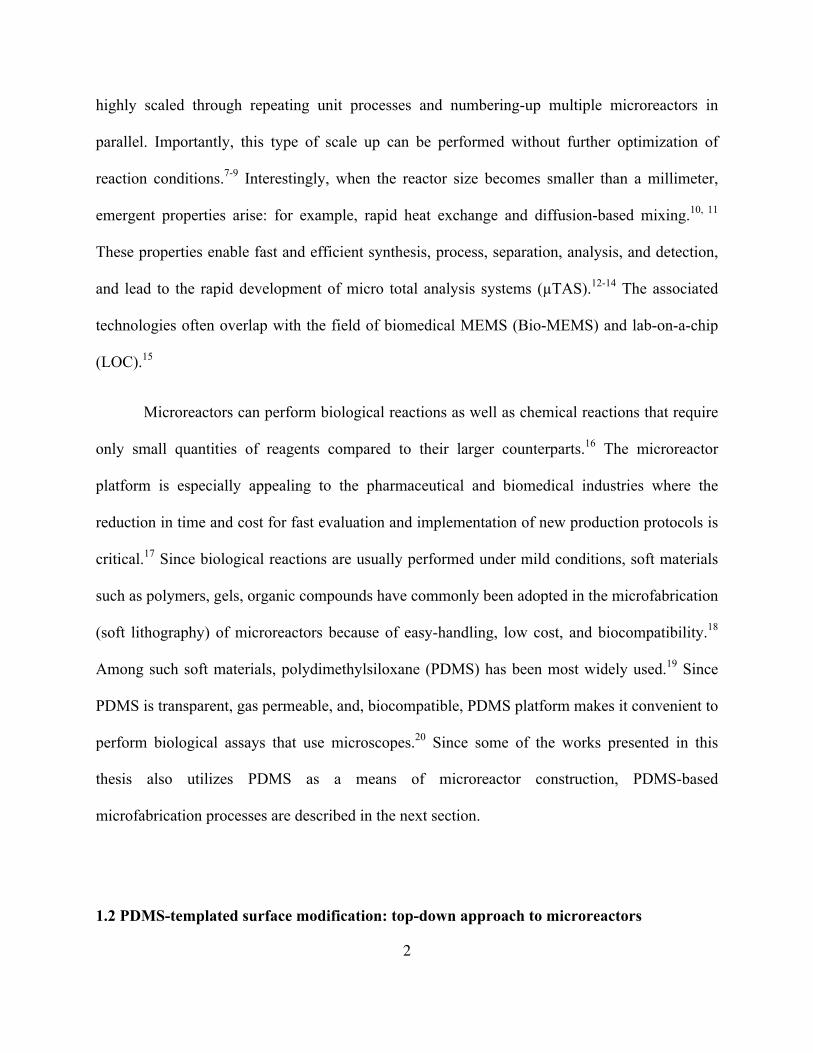
Microreactors can perform biological reactions as well as chemical reactions that require
only small quantities of reagents compared to their larger counterparts.16 The microreactor
platform is especially appealing to the pharmaceutical and biomedical industries where the
reduction in time and cost for fast evaluation and implementation of new production protocols is
critical.17 Since biological reactions are usually performed under mild conditions, soft materials
such as polymers, gels, organic compounds have commonly been adopted in the microfabrication
(soft lithography) of microreactors because of easy-handling, low cost, and biocompatibility.18
Among such soft materials, polydimethylsiloxane (PDMS) has been most widely used.19 Since
PDMS is transparent, gas permeable, and, biocompatible, PDMS platform makes it convenient to
perform biological assays that use microscopes.20 Since some of the works presented in this
thesis also utilizes PDMS as a means of microreactor construction, PDMS-based
microfabrication processes are described in the next section.
1.2 PDMS-templated surface modification: top-down approach to microreactors

3
PDMS-based soft lithography creates embossed or bas-relief microstructures by means of mold,
stamp, and mask.21 Briefly, the master can be made as follows. SU-8, a negative photoresist
polymer is spin coated on a Si wafer and is polymerized through UV exposure with a photo mask
containing designed patterns. The unexposed SU-8 resist is developed and the designed
microstructures are left behind on the wafer surface. PDMS masks with the inverse micropatterns
are replicated from the master for the subsequent procedures. PDMS molds can create
microchannels when bound to another substrate. A flow system using the microchannels (also
known as microfluidics) is the most common platform among PDMS-based microreactors.
PDMS stamps can transfer materials to a substrate with the specific geometry that can be utilized
to study effects of the surface geometry upon cell proliferation.22
In this thesis, PDMS masks are exploited for surface modification of substrates where the
detailed protocols are described in the related chapters. Surface modification can introduce
surface energy heterogeneity, wet the specific geometries and locations, and thereby provide
surface scaffolds to construct the reactor arrays.23 In fact, surface modification has been
exploited to pattern milli-to-femto liter solutions to run high-throughput biological assays on
various surfaces.24 In general, there are two types of surface modification: chemical and
physical.25 Chemical modification involves surface oxidation by plasma oxidation, gamma / UV
irradiation in order to alter wettability of defined surface regions. Physical modification
introduces surface microstructures such as micropillars and microwells in order to sustain
aqueous solutions.
PDMS-based soft lithography enables both chemical and physical modifications for
biological assays on a PDMS-coated surface.26 PDMS-based microreactors provide a versatile

4
opportunity to explore and interrogate biological processes and a few examples are demonstrated
in this thesis. This approach, which is referred to as a “top-down” approach, is one where
microreactors are produces by scaling down large scale reaction platforms. This approach is
presented, furthermore, in contrast to the “bottom-up” approach, where microreactors are
constructed by the assembly of small-scale parts such as molecules.
1.3 Microcompartmentalization via self-assembly: bottom-up approach to microbioreactors
The top-down microfabrication relies on light- and machine-assisted technology where the
fabrication scale is diffraction-limited and instrumental precision-dependent. On the other hand,
bottom-up technologies can build up microreactors from the molecular level via self-assembly.
Self-assembly is a spontaneous phenomenon where the molecular balance between attraction and
repulsion dictates the resulting process.27 Self-assembly can be categorized into four types28:
static, dynamic, templated, and biological. This work handles mainly static self-assembly where
the system at global and local equilibrium dissipates no energy. Such examples are amphiphilic
vesicle assembly, protein assembly, and colloidal particle assembly. Among biological systems,
the eukaryotic cells (diameter: 10 - 100 µm), embody various biomolecules in their micro-scale
compartments (diameter: 1 - 10 µm) such as nucleus and organelles.29 The cells use such self-
assembled microcompartments to control spatiotemporal metabolic and replicating processes
where the compartmentalized substances are processed at the desired timing and location. Hence
the cells can be considered as multi-functional microreactors.
The superstructures formed via molecular self-assembly can serve as cell-mimetic
reactors that perform chemical and biological reactions.30 Those reactors can be categorized into

5
two types: membrane-bound31 or membrane-free32 constructs. Membrane-bound architectures
such as liposome33 and polymersome34 have water-filled lumen segregated by a semipermeable
barrier and separate inside from outside. They have structural similarity with the living cells
made of lipid bilayer membranes that enable selective flux of substances. Although the
physically closed microenvironment enables long term encapsulation of substances, it often
requires chemical gradient formation or membrane transporter to incorporate energy and
materials into their structures.35 In contrast, membrane-free constructs such as water-oil system36
are more primitive and flexible for energy and materials uptake. Recently, aqueous two-phase
systems and complex coacervation in water-water systems37 have been demonstrated as
emerging membrane-free constructs and discovered in the living cell compartments.38 Those
systems are described in the next section.
1.4 Liquid-in-liquid separation in aqueous two-phase systems and complex coacervation
An aqueous two-phase system (ATPS) comprises two different polymers, a polymer and a
kosmotropic salt, or a chaotropic salt and a kosmotropic salt in solution, and phase separates
when those constituents are mixed at appropriate concentrations at a particular temperature.39
Although those constituents are hydrophilic in general, a slight difference in hydrophobicity
among them becomes prominent at sufficiently high concentrations and, consequently, causes
liquid-liquid phase separation where the individual phases are enriched with one of the two
components. This phenomenon was first discovered by Martius Beijerinck in 1896 when he
observed immiscibility of aqueous solutions of agar against starch and gelatin.40 A field of ATPS
research was expanded to a separation technique by Per-Åke Albertsson in 1956.41

6
Meanwhile, there is another liquid-liquid phase separation when oppositely charged
polyelectrolytes at sufficiently high concentrations form polyion complex in solution.42 Similar
to ATPSs, the two-phase comprises polyion complex-rich and -depleted phases. This
phenomenon is referred to as complex coacervation. Coacervation iteself was first proposed by
H.G. Bungenberg de Jong43 in 1929 while it was widely propagated by Alexander Oparin and
J.B.S. Haldane44 in 1936. Although the underlying mechanisms of phase formation are different
between ATPSs and complex coacervation, given the resulting liquid-liquid phase separation,
this thesis considers complex coaervation as a part of ATPSs.
Theoretical approaches to understand the underlying mechanisms of neutral polymer
ATPSs have been developed using theoretical45 and computational46 models where enthalpic and
entropic contributions of each component in the systems are considered. However, they are not
sufficiently precise to predict phase diagrams of the systems without empirical data. Hence
empirical approaches are often required to determine critical concentrations based on the various
parameters: polymer molecular weights, salt concentrations, temperature, and pH. Specifically in
ATPSs, the resulting phase diagram is a binodal curve, which delineates the concentrations of
each polymer /salt in solution and determines the formation of a single or two-phase system.
ATPSs have two unique characteristics: low interfacial tension and molecular
partitioning.47 First, interfacial tension of the systems is in the range of 1 - 50 µN/m, 1000 -
10000 magnitude lower than that of air-water or oil-water systems (10 - 70 mN/m). The low
interfacial tension is especially beneficial for preservation of active biological materials because
the high interfacial tension at air-water or oil-water interfaces can denature their native structures
and lose their functions. Second, molecules present in those systems can selectively be

7
partitioned into one phase over the other phase based on the following properties: molecular
composition, molecular weight, size, surface charge, hydrophobicity, chirality, etc. The
molecular partitioning can be tailored by those physicochemical properties of the phase
components.
Based on the above two characteristics, ATPSs have been utilized for separation and
purification of biological materials. Researchers have shown various biomolecular separation
(recovery) from a mixture of contaminants.48 Although ATPS-based separation techniques have
been developed since 1970s, other separation technologies have advanced and competed with the
ATPS-based techniques, which offsets relative advantages of ATPS-separation. However,
recently, new biomedical applications using ATPSs have been explored and demonstrated. For
example, ATPSs enable site-specific reagent delivery on patterned cells49, crosstalk-free
multiplex enzyme-linked immuno sorbent assay50, 51, rapid preparation of cell membrane sheets52
while complex coacervation grants the direct delivery of reagents to single cells53 and micro-
scale organ development54. Since ATPS separation techniques often deal with laboratory scale
sample volume, it is desired to miniaturize the experimental systems for practical and
economical purposes. The miniaturized ATPS-based platforms would have great potential for
biomedical applications.
1.5 Microcompartmentalization at the liquid-liquid interfaces by combined top-down and
bottom-up techniques.
While the number of publication using PDMS-based bioassay platforms in engineering field, the
number of publication using the platforms in biological field have been significantly low and

8
stagnant.55 One of the reasons is that the fabrication and operation of the platforms involves
expensive and tedious processes. A simple yet versatile platform to interrogate biological
questions that conventional systems fail to address is in great demand.
PDMS-based soft lithography together with liquid-liquid systems has the potentials to
create unique reaction platforms that are not simple scale-down of bulk reaction systems. Fore
example, surface-patterned microreactors may suffer denaturation of biological molecules and
evaporation of solvents at an air-liquid interface. Those drawbacks may lead to inaccurate and
misleading outputs from the biological reactions. One potential synergy is that the designed
geometries on PDMS surface fabricated by soft lithography can provide micro-scale scaffolds at
the liquid-liquid interfaces.
As is the case with chemical reactions, the conventional microreactors may also lack the
flexibility and require laborious fabrication and deep expertise. If microreactors are succinctly
constructed at liquid-liquid interfaces, it can circumvent such drawbacks and provide robust and
unique platforms for biological assays. The microreactors at the liquid-liquid interfaces enable
rapid and selective mass exchange and diffusion with small quantity of reagents, provide robust
and reliable reaction platforms, and open new doors to explore functional material processes and
biological assays that conventional approaches fail to achieve. In this thesis, combined top-down
and bottom-up microcompartmentalization is explored and implemented in order to create novel
microreactors at liquid-liquid interfaces with easy operation. This thesis sheds light on the
ATPS-based biomedical applications and provides platforms to the interdisciplinary fields such
as chemistry, material science, and biology.

9
1.6 Dissertation Overview
This work is divided into seven individual chapters where unique microcompartmentalization at
liquid-liquid interfaces is demonstrated by combined top-down and bottom-up technologies.
Chapter 2 describes surface micropatterning of ATPSs on chemically modified-PDMS surfaces
and underlying principles of liquid-in-liquid patterning. Chapter 3 demonstrates autonomous
chemogradients formation and resulting cancer cell migration using a gel-in-gel micropatterning
technique. Chapter 4 develops a shrinking microreactor platform using oil dehydration for ATPS
binodal determination and Chapter 5 exploits the technology for unique self-assembly of CdTe
nanoparticles. Chapter 6 establishes a hybrid system of an ATPS and complex coacervation for
membrane-free microreactors and performs bioreactions. Chapter 7 summarizes the work
presented in this thesis and provides future direction of the research.

10
1.7 References
1. Froment, G. F.; Bischoff, K. B.; De Wilde, J., Chemical Reactor Analysis and Design. Wiley New York: 1990.
2. Hill, C. G.; Root, T. W., Introduction to Chemical Engineering Kinetics and Reactor Design. John Wiley & Sons: 2014.
3. Laird, T., Industrial Process Scale-Up. Org. Process Res. Dev. 2014, 18, 560-560.
4. Moreau, W. M., Semiconductor Lithography: Principals and Materials. Plenum Press: 1988.
5. Watts, P.; Wiles, C., Recent Advances in Synthetic Micro Reaction Technology. Chem. Commun. 2007, 443-467.
6. Ehrfeld, W.; Hessel, V.; Haverkamp, V., Microreactors. Wiley Online Library: 2000.
7. Roberge, D. M.; Gottsponer, M.; Eyholzer, M.; Kockmann, N., Industrial Design, Scale-up, and Use of Microreactors. Chim. Oggi. - Chem. Today 2009, 7, 8-11.
8. Petschacher, C.; Eitzlmayr, A.; Besenhard, M.; Wagner, J.; Barthelmes, J.; Bernkop-Schnürch, A.; Khinast, J. G.; Zimmer, A., Thinking Continuously: A Microreactor for The Production and Scale-Up of Biodegradable, Self-Assembled Nanoparticles. Polym. Chem. 2013, 4, 2342-2352.
9. Kockmann, N.; Gottsponer, M.; Roberge, D. M., Scale-up Concept of Single-Channel Microreactors from Process Development to Industrial Production. Chem. Eng. J. 2011, 167, 718-726.
10. Burns, J.; Ramshaw, C., Development of a microreactor for chemical production. Chem. Eng. Res. Des. 1999, 77, 206-211.
11. Squires, T. M.; Quake, S. R., Microfluidics: Fluid Physics at The Nanoliter Scale. Rev. Mod. Phys. 2005, 77, 977.
12. Reyes, D. R.; Iossifidis, D.; Auroux, P.-A.; Manz, A., Micro Total Analysis Systems. 1. Introduction, Theory, and Technology. Anal. Chem. 2002, 74, 2623-2636.
13. Auroux, P.-A.; Iossifidis, D.; Reyes, D. R.; Manz, A., Micro Total Analysis Systems. 2. Analytical Standard Operations and Applications. Anal. Chem. 2002, 74, 2637-2652.
14. Arora, A.; Simone, G.; Salieb-Beugelaar, G. B.; Kim, J. T.; Manz, A., Latest Developments in Micro Total Analysis Systems. Anal. Chem. 2010, 82, 4830-4847.
15. Saliterman, S., Fundamentals of BioMEMS and Medical Microdevices. SPIE Press: 2006; Vol. 153.

11
16. Šalić , A.; Tušek, A.; Zelić , B., Application of Microreactors in Medicine and Biomedicine. J. Appl. Biomed. 2012, 10, 137-153.
17. Watts, P., Microreactors for Drug Discovery: The Importance of Integrating Chemical Synthesis with Real-Time Analytical Detection. Anal. Bioanal. Chem. 2005, 382, 865-867.
18. Xia, Y.; Whitesides, G. M., Soft Lithography. Annu. Rev. Mater. Sci. 1998, 28, 153-184.
19. McDonald, J. C.; Whitesides, G. M., Poly (dimethylsiloxane) as A Material for Fabricating Microfluidic Devices. Acc. Chem. Res. 2002, 35, 491-499.
20. Qin, D.; Xia, Y.; Rogers, J. A.; Jackman, R. J.; Zhao, X.-M.; Whitesides, G. M., Microsystem Technology in Chemistry and Life Science. Top. Curr. Chem. 1998, 194, 1-20.
21. Weibel, D. B.; DiLuzio, W. R.; Whitesides, G. M., Microfabrication Meets Microbiology. Nat. Rev. Microbiol. 2007, 5, 209-218.
22. Chen, C. S.; Mrksich, M.; Huang, S.; Whitesides, G. M.; Ingber, D. E., Geometric Control of Cell Life and Death. Science 1997, 276, 1425-1428.
23. Ueda, E.; Levkin, P. A., Emerging Applications of Superhydrophilic‐Superhydrophobic Micropatterns. Adv. Mater. 2013, 25, 1234-1247.
24. Chiu, D. T.; Lorenz, R. M., Chemistry and Biology in Femtoliter and Picoliter Volume Droplets. Acc. Chem. Res. 2009, 42, 649-658.
25. Adamson, A. W.; Gast, A. P., Physical Chemistry of Surfaces. 6th ed.; John Wiley & Sons, Inc.: 1997.
26. Whitesides, G. M.; Ostuni, E.; Takayama, S.; Jiang, X.; Ingber, D. E., Soft Lithography in Biology and Biochemistry. Annu. Rev. Biomed. Eng. 2001, 3, 335-373.
27. Whitesides, G. M.; Boncheva, M., Beyond Molecules: Self-assembly of Mesoscopic and Macroscopic Components. Proc. Natl. Acad. Sci. 2002, 99, 4769-4774.
28. Whitesides, G. M.; Grzybowski, B., Self-Assembly at All Scales. Science 2002, 295, 2418-2421.
29. Phillips, R.; Kondev, J.; Theriot, J.; Garcia, H., Physical Biology of The Cell. 2nd ed.; Garland Science: 2012.
30. Walde, P.; Umakoshi, H.; Stano, P.; Mavelli, F., Emergent Properties Arising from The Assembly of Amphiphiles. Artificial Vesicle Membranes as Reaction Promoters and Regulators. Chem. Commun. 2014, 50, 10177-10197.

12
31. Karlsson, M.; Davidson, M.; Karlsson, R.; Karlsson, A.; Bergenholtz, J.; Konkoli, Z.; Jesorka, A.; Lobovkina, T.; Hurtig, J.; Voinova, M., Biomimetic Nanoscale Reactors and Networks. Annu. Rev. Phys. Chem. 2004, 55, 613-649.
32. Li, M.; Huang, X.; Tang, T. D.; Mann, S., Synthetic Cellularity Based on Non-Lipid Micro-Compartments and Protocell Models. Curr. Opin. Chem. Biol. 2014, 22, 1-11.
33. Luisi, P. L.; Walde, P.; Oberholzer, T., Lipid Vesicles as Possible Intermediates in The Origin of Life. Curr. Opin. Colloid Interface Sci. 1999, 4, 33-39.
34. Kamat, N. P.; Katz, J. S.; Hammer, D. A., Engineering Polymersome Protocells. J. Phys. Chem. Lett. 2011, 2, 1612-1623.
35. Deamer, D. W.; Dworkin, J. P., Chemistry and Physics of Primitive Membranes. Top. Curr. Chem. 2005, 259, 1-27.
36. Yamada, A.; Barbaud, F.; Cinque, L.; Wang, L.; Zeng, Q.; Chen, Y.; Baigl, D., Oil Microsealing: A Robust Micro‐compartmentalization Method for On‐Chip Chemical and Biological Assays. Small 2010, 6, 2169-2175.
37. Aumiller Jr, W. M.; Davis, B. W.; Keating, C. D., Phase Separation as A possible Means of Nuclear Compartmentalization. Int. Rev. Cell. Mol. Biol. 2013, 109-149.
38. Brangwynne, C. P., Phase Transitions and Size Scaling of Membrane-Less Organelles. J. Cell. Biol. 2013, 203, 875-881.
39. Albertsson, P.-Å., Partition of Cell Particles and Macromolecules. 3rd ed.; Wiley New York: 1986.
40. Beijerinck, M., Parasiten und Infektionskrankenheiten Zentralbl. Bakteriol. 1896, 2, 697-699.
41. Albertsson, P.-Å., Chromatography and Partition of Cells and Cell Fragments. Nature 1956, 177, 771-774.
42. Van der Gucht, J.; Spruijt, E.; Lemmers, M.; Stuart, M. A. C., Polyelectrolyte Complexes: Bulk Phases and Colloidal Systems. J. Colloid Interface Sci. 2011, 361, 407-422.
43. Bungenberg de Jong, H.; Kruyt, H., Coacervation (Partial Miscibility in Colloid Systems). Proc. Sect. Sci. Kon. Akad. Wetensch. Amsterdam. 1929, 32, 849-856.
44. Lazcano, A., Historical Development of Origins Research. Cold Spring Harb. Perspect. Biol. 2010, 2, a002089.
45. Cabezas, H., Theory of Phase Formation in Aqueous Two-Phase Systems. J Chromatogr. B Biomed. Sci. Appl. 1996, 680, 3-30.

13
46. Burgess, D., Practical Analysis of Complex Coacervate Systems. J. Colloid Interface Sci. 1990, 140, 227-238.
47. Hatti-Kaul, R., Aqueous Two-Phase Systems: Methods and Protocols. Humana Press: 2000.
48. Raja, S.; Murty, V. R.; Thivaharan, V.; Rajasekar, V.; Ramesh, V., Aqueous Two Phase Systems for The Recovery of Biomolecules–A Review. Sci. Technol. 2011, 1, 7-16.
49. Tavana, H.; Jovic, A.; Mosadegh, B.; Lee, Q.; Liu, X.; Luker, K.; Luker, G.; Weiss, S.; Takayama, S., Nanolitre Liquid Patterning in Aqueous Environments for Spatially Defined Reagent Delivery to Mammalian Cells. Nat. Mater. 2009, 8, 736-741.
50. Frampton, J. P.; White, J. B.; Simon, A. B.; Tsuei, M.; Paczesny, S.; Takayama, S., Aqueous Two-Phase System Patterning of Detection Antibody Solutions for Cross-Reaction-Free Multiplex ELISA. Sci. Rep. 2014, 4.
51. White, J. B. Aqueous Two-Phase Systems for Next-Generation Biotechnological Assays. University of Michigan, 2013.
52. Frampton, J. P.; Leung, B. M.; Bingham, E. L.; Lesher‐Perez, S. C.; Wang, J. D.; Sarhan, H. T.; El‐Sayed, M. E.; Feinberg, S. E.; Takayama, S., Rapid Self‐Assembly of Macroscale Tissue Constructs at Biphasic Aqueous Interfaces. Adv. Funct. Mater. 2015, 25, 1694-1699.
53. Armstrong, J. P.; Olof, S. N.; Jakimowicz, M. D.; Hollander, A. P.; Mann, S.; Davis, S. A.; Miles, M. J.; Patil, A. J.; Perriman, A. W., Cell Paintballing Using Optically Targeted Coacervate Microdroplets. Chem. Sci. 2015, 6, 6106-6111.
54. Matthew, H. W.; Salley, S. O.; Peterson, W. D.; Klein, M. D., Complex Coacervate Microcapsules for Mammalian Cell Culture and Artificial Organ Development. Biotechnol. Progr. 1993, 9, 510-519.
55. Sackmann, E. K.; Fulton, A. L.; Beebe, D. J., The Present and Future Role of Microfluidics in Biomedical Research. Nature 2014, 507, 181-189.

14
Chapter 2
Patchy Surfaces Stabilize Dextran−Polyethylene Glycol Aqueous Two-Phase System Liquid
Patterns
This chapter interrogates surface chemistry effects to stably pattern aqueous two-phase system
(ATPS) droplets on chemically modified poly(dimethylsiloxane) (PDMS). Polyethylene glycol
(PEG) and dextran (DEX) are used as phase-forming polymers for the ATPS. PDMS surface
modifications studied include primary amine groups, carboxylic acid groups, and neutral
polymer surfaces. The PDMS surfaces were characterized by fluorescent measurement, water
and DEX contact angle measurements, and X-ray photoelectron spectroscopy (XPS) analysis to
confirm surface properties. While homogeneous surfaces of different functional groups affect
DEX droplet pinning somewhat, the most stable patterns were realized using surfaces with
chemical heterogeneity. Arbitrary DEX solution patterning was achieved on a chemically patchy
surface.

15
2.1 Introduction
An aqueous two-phase system (ATPS) is composed of two immiscible aqueous polymer
solutions, which forms two distinct aqueous phases. It has been widely developed as a molecular
separation technique1, 2, and recently, it has emerged as a useful tool for separating cells3,
biomolecules4-6, and nanoparticles.7 Among various phase-forming polymers, dextran (DEX) and
polyethylene glycol (PEG) are biocompatible polymers that can form stable ATPS over a wide
range of temperatures.1 As such, ATPSs formed with the two polymers have been widely utilized
for biomedical applications.8-13
An interesting and useful aspect of microscale DEX phase solution patterning over cell
monolayers immersed in a PEG phase, for purposes such as localized gene delivery, is that
despite immiscibility and presence of interfacial tension, the microscale patterns of DEX solution
become pinned into arbitrary shapes rather than balling up into a circular shape.14, 15 The DEX
solution patterns had sub-millimeter resolution and showed long term stability.
Initial attempts to utilize non-cellular surfaces such as micro-topographical features to
maintain DEX solution patterns failed9 and the requirements for stably maintaining DEX
solution patterns on a solid substrate submerged in the PEG phase has been unclear to date.
Development of a technique to retain DEX solution patterns on a non-cellular surface in the PEG
phase would be important both for advancing fundamental understanding of these systems as
well as for expanding ATPS patterning applications beyond cell surfaces.
Here we hypothesize that chemical heterogeneity as may occur on a cell monolayer
surface and associated surface-DEX solution interactions are essential to sustain DEX solution

16
patterns within a PEG phase solution. We chemically modify PDMS surfaces and compare DEX
solution pattern stability on the modified surface.
The PDMS surfaces were oxidized to anchor (3-aminopropyl)triethoxysilane (APTES)
and further covalently modified with PEG, carboxymethyl dextran (CM-DEX), and
diethylaminoethyl dextran (DEAE-DEX) by amine coupling through the well-known 1-ethyl-3-
[3-dimethylaminopropyl]carbodiimide hydrochloride (EDC) and N-hydroxysuccinimide (NHS)
coupling chemistry16, 17 at room temperature. We characterized the surfaces by fluorescent
measurement, contact angle measurement, and XPS spectroscopy and compared DEX solution
pattern stability on the surfaces in a PEG phase. We also validated if gaps on the modified
surface could influence DEX solution pattern stability and explored arbitrary DEX solution
patterning on a chemically patchy surface.
2.2 Materials and Methods
Materials
All chemicals and reagents were purchased from commercial sources: PDMS precursor (sylgard
184) and curing agent were from Dow Corning; SU-8 2025 and SU-8 developers were from
MicroChem; dimethyl sulfoxide anhydrous (DMSO), APTES, EDC, NHS, ethanol amine, Mw
35,000 PEG, Mw 500,000 DEX, and Mw 20,000 CM-DEX were from Sigma-Aldrich; Mw
500,000 DEAE-DEX was from AMRESCO; Mw 5000 PEG-NHS and Mw 5000 FITC-PEG-
NHS were from Nanocs; Mw 500,000 FITC-DEAE-DEX and Mw 20,000 FITC-CM-DEX were
from TdB; phosphate-buffered saline (PBS) buffer solution (pH 7.4) was from GE Health Care.

17
PDMS Fabrication
10:1 (w/w) degassed mixture of PDMS and a curing agent was poured on a plastic dish and
cured at 60 °C for at least 4 hours in the oven. A PDMS slab was peeled off from the dish. A
clean glass microscope slide was spin-coated with the same mixture and cured under the same
condition.
Microfabrication
Masters for partial modification were made by spin coating SU-8 onto a silicon wafer. SU-8-
coated wafers were then soft-baked (first step: 3 min, 65 °C; second step: 6 min, 95 °C), exposed,
post-baked (first step: 1 min, 65 °C; second step: 6 min, 95 °C), and developed to obtain 50 µm
thickness. After silanization, degassed PDMS was poured and cured on the masters. The PDMS
replica was peeled off from the master and physically bonded to a PDMS slab to form a
microchannel for partial chemical modification.
Surface Modification
The PDMS surface was coated with polymers through covalent bonding (Scheme 2.1). Oxidation
and APTES-derivitization of PDMS were carried out by the previously reported method (Scheme
2.1A and 2.1B).18 PEG, CM-DEX, and DEAE-DEX were covalently bound to the PDMS surface
by EDC/NHS coupling chemistry. PEG-NHS (30 mg, 6 mmol) or CM-DEX (30mg, 29 µmol)

18
dissolved in 1:1 mixture of 100 mg/mL EDC/NHS was incubated for 20 min to activate and
applied on the primary amine-terminated APTES surface for 1 hour followed by extensive wash
in water (Scheme 2.1C and 2.1D). For DEAE-DEX modification, the primary amine-terminated
surface was carboxylated by applying 1 mg/mL succinic anhydride in dry DMSO for 10 min
(Scheme 2.1E).19 The converted carboxyl surface was activated by the mixture of EDC/NHS for
20 min and washed in water.20 DEAE-DEX (30mg, 43 µmol) dissolved in 100 mM NaOH water
was incubated on the surface for 1 hour followed by extensive wash in water (Scheme 2.1F). All
modified surfaces were used in a day and discarded after use. For partial modification, the same
protocol was conducted within a microchannel.
Surface Characterizations
Equilibrated PEG and DEX solutions were prepared as described elsewhere.14, 15 A chemically
modified PDMS slab was punched out with a 6 mm-diameter biopsy punch (Miltex) and attached
on the bottom of a hand-made glass container (3cm x 3cm x 1.5cm). The container was used for
contact angle and sliding angle measurements of sessile DEX droplet in the PEG phase (Figure
2.10).
Contact Angle Measurement
Water contact angles in air (Figure 2.10A) and DEX solution contact angles in PEG phase
solutions (PEG-DEX w/w concentration: 2.5% - 3.2%, 2.5% - 15%, and 15% - 3.2%) (Figure
2.10B) were measured on bare PDMS, APTES-modified PDMS, PEG-modified PDMS, CM-
DEX-modified PDMS, and DEAE-DEX-modified PDMS by the sessile drop technique (2 µL of

19
water in air or 0.1 µL of DEX in 2mL PEG solution) using a goniometer and analyzed with
ImageJ. Three sets of measurements were averaged.
Sliding Angle Measurement
A glass container with a chemically modified PDMS at the bottom was filled with 2 mL PEG
solution and 0.1 µL of DEX in 3.2% DEX - 15% PEG system was dropped on the modified
surface. The container was attached to the goniometer and tilted until the DEX droplet started
sliding. Images were taken at that point and advancing, receding, and sliding angles were
analyzed by ImageJ. Three sets of measurements were averaged.
XPS Analysis
A chemically modified PDMS membrane was peeled off from a glass slide and the membrane
surface was measured by XPS (Kratos Axis Ultra XPS) with aluminum X-ray radiation source
15 kV and pass energy of 160 eV. Acquired XPS data were analyzed by CasaXPS.
Fluorescence Measurements of Surface Modifications
Bare PDMS surfaces were partially covered by taping before oxidation (Scheme 2.2). 1 mg of
FITC-PEG-NHS, FITC-CM-DEX, and FITC-DEAE-DEX were covalently bound to the surface
by the aforementioned method. Fluorescence was measured using a fluorescence microscope
(Nikon Eclipse TE 2000-U) and analyzed by NIS-elements software.
Analysis of ATPS droplets formed on surfaces patterned in shapes of alphabet letters
PDMS surface was modified in the shape of letters “U” and “M” using microchannels of the
corresponding shapes (Scheme 2.3A). The region outside the letters is a native PDMS surface. A

20
few µL of DEX (~ 5 µL) in 3.2% DEX - 2.5% PEG system was dispensed onto the surface
modified region (Scheme 2.3B) and images taken under a stereomicroscope (Nikon C-DSD115).
The same process was repeated with 0.01 mg/mL FITC-DEX and imaged by fluorescence
microscopy.
Analysis of formation of continuous ATPS droplet patterns on discontinuously patterned
surfaces
Five PDMS square regions (1.5 mm x 1.5 mm) with inter-square edge-to-edge distances of 100
µm, 300 µm, 500 µm, or 1 mm were prepared with either DEAE-DEX or CM-DEX modification
(Figure 2.12B). A few µL of DEX solution (~ 5 µL) was dispensed along the patterns using a 3.2%
DEX - 2.5% PEG system. Images were taken with a stereomicroscope.
Analysis of formation of arbitrary ATPS droplet patterns on a discontinuously patterned
surface
Arrays of PDMS square regions (1.0 mm x 1.0 mm) with inter-square edge-to-edge distances of
100 µm, 300 µm, 500 µm, or 1 mm were prepared with CM-DEX modification (Figure 2.12C).
A few µL of DEX solution (~ 7 µL) containing 0.01 mg/mL FITC-DEX was dispensed onto the
same surface along the arbitrary shapes of letters “L” and “U” using a 3.2% DEX - 2.5% PEG
system. Images were taken by fluorescence microscopy.
2.3 Results and Discussion
Modification of surfaces was confirmed by visualizing that only the chemically-modified left
side shows fluorescence (Figure 2.1 and Scheme 2.2). We observed almost no fluorescence when

21
100 mM ethanolamine (a deactivating agent21) was mixed with the EDC/NHS solutions during
the activation process, consistent with the notion that the fluorescence-inducing surface
modifications occur by amine coupling (Figure 2.9).
The chemically-modified surfaces were also analyzed by XPS for C1s, N1s and O1s
peaks as shown in Figure 2.2. The trends for the peaks of APTES-modified surface agreed well
with previously reported results.18 Briefly, the quantity of carbon atoms (C) decreased because
oxidation of bare PDMS surface replaced the methyl groups with hydroxyl groups. Meanwhile,
the quantities of nitrogen atom (N) and oxygen atom (O) increased as a result of the APTES
derivitization. C1s, N1s and O1s spectra for PEG, DEAE-DEX, and CM-DEX modified surfaces
showed shoulder peaks and differing binding energy shifts, according to changes in the polymer
backbone and side chains. These results indicate that the PDMS surface was successfully
modified.
Figure 2.3 shows results of water contact angle measurements. The measured contact
angles on bare PDMS22, APTES-modified18 and PEG-modified PDMS23 agreed well with
previously reported values. Young’s equation defines the general expression of contact angle
(Figure 2.10A) and illustrates that the contact angle decreases as the surface becomes hydrophilic.
The results revealed that the surface became more hydrophilic from bare PDMS, to APTES-
modified, PEG-modified, DEAE-DEX-modified, and CM-DEX-modified PDMS in that order.
DEX solution contact angle measurements performed in PEG phase solutions revealed similar
trends as shown in Figure 2.4.
The DEX solution contact angles measured in PEG solutions also follow Young’s
equation (Figure 2.10B). As either PEG or DEX concentrations in the phase forming solutions

22
increased, the DEX solution contact angles on the modified surfaces fluctuated due to changes in
the surface affinity difference (Figure 2.12A; γ1S - γ2S) whereas CM-DEX-modified PDMS
surface showed the highest affinity to the DEX phase in all cases. These results are consistent
with the fact that the DEX phase is more hydrophilic than the PEG phase, and therefore DEX
contact angles on the modified surfaces follow the trends observed in water contact angle
measurements.
These trends were further confirmed by sliding angle measurements as shown in Figure
2.5. CM-DEX-modified PDMS surfaces demonstrated the highest hysteresis and the largest
sliding angles among the five types of surfaces. A linear correlation was observed between the
hysteresis and sliding angle, reflecting the surface affinity. As a result, surface affinity to the
DEX phase increased from bare PDMS to APTES-modified, PEG-modified, DEAE-DEX-
modified, and CM-DEX-modified PDMS in that order.
We analyzed DEX solution pattern stability on chemically modified PDMS surfaces
when submerged in PEG phase solution (Figure 2.6 and Figure 2.11). First, we attempted DEX
solution patterning on uniformly chemically modified surfaces and observed patterns of DEX
round up within 1 min. We next created PDMS surfaces where only select regions were modified
with PEG, DEAE-DEX or CM-DEX (Scheme 2.3) and found that DEX solution patterns in PEG
solution could be retained for hours on the CM-DEX surface while DEX solution patterns on the
other surfaces rounded up or significantly deviated from its original pattern within 1 min (Figure
2.6A-C and Figure 2.11A-C). We reveal that use of a heterogeneously patterned surface together
with low interfacial tension PEG-DEX solutions is the key to maintain stable DEX solution
patterning. Thermodynamically speaking, the heterogeneously modified surface gives rise to

23
surface energy barriers that pin the contact line of the DEX solution.24 It has been theoretically25,
26 and empirically27 demonstrated that a solid surface with chemical gradients drives the motion
of a water droplet from hydrophobic surface to more hydrophilic sections due to different surface
energy states. We hypothesize that the DEX solution pattern stability arises from the difference
in affinity of the DEX solution for each surface (Figure 2.12A). Greater the DEX affinity
difference between surfaces, higher the surface energy barriers become.
To clearly visualize the patterns, we utilized fluorescent DEX solution on DEAE-DEX-
modified and CM-DEX-modified heterogeneous PDMS surfaces (Figure 2.6D and 6E). The
patterns on the CM-DEX-modified surface were sharp and stable while those on the DEAE-DEX
modified surface were stable but blurred (Figure 2.11D and 11E). As described previously, DEX
molecules demonstrated stronger affinity to the CM-DEX-modified surface than the DEAE-
DEX-modified surface. Consequently, there should be a higher surface energy barrier between
bare PDMS and CM-DEX-modified PDMS than with DEAE-DEX-modified PDMS. The result
is consistent with the aforementioned hypothesis.
Heterogeneous surfaces with defects or patchy surface patterning are known to influence
contact line pinning.28 To analyze such effects on ATPS solution patterning, we investigated how
discontinuous or patchy surface patterns influence DEX solution pattern stability within PEG
phase solutions (Figure 2. 12B and 12C). Figure 2.7 shows a DEX solution line created on
surfaces modified with discontinuous DEAE-DEX or CM-DEX surface patterns on a
background of native PDMS. The area fraction of defects (fd) is correlated to the distance
between the surface modified regions. As fd increases (that is, the gap between patchy patterns
increases), the DEX solution lines became unstable, resulting in partial collapse of the line

24
pattern. Interestingly, to prevent a DEX solution line pattern from breaking up into droplets, the
distance between modified surface patches needed to be smaller for the higher affinity CM-DEX
modified surfaces (critical fd = 0.096) compared to patchy patterns of DEAE-DEX (critical fd =
0.25). We assume that strong adhesion of a DEX solution on CM-DEX-modified surfaces may
tear off the DEX solution line easily in comparison with DEAE-DEX-modified surfaces (Figure
2.13A and 13B). As fd increases, the affinity imbalance between different regions of the DEX
solution line exerts a larger effect, resulting in instability and breakup of the solution line pattern
(Figure 2.13C and 13D).
When the CM-DEX-modified patches were arrayed in a grid with appropriate spacing
between patches, the same grid pattern could be used to create arbitrary DEX droplet patterns on
it (Figure 2.12C). The CM-DEX-modified grids with 100 µm inter-patch edge-to-edge distances
(fd = 0.14) successfully pinned the DEX phase solution in shapes of the letters “L” and “U” and
stably maintained the patterns (Figure 2.8A and 8B). In contrast, the droplet patterns created on
grids with inter-patch distances over 300 µm (fd = 0.35 - 0.69) could not maintain droplet shapes
and gradually collapsed (Figure 2.8C-F). The results consistent with the line pattern
measurements suggest that ATPS solution pinning rely on the area fraction of defects. The
contact line of the DEX phase solution moderately spread after dispensing onto the surface until
the forwarding contact line became pinned by surface discontinuity (Figure 2.14). Similar
phenomena of spreading and pinning have been observed upon patterning DEX solutions over
cell monolayers. This phenomena similar to wetting transition from the Cassie-Baxter state to the
Wentzel state at an air-liquid interface29 implies that the similar wetting transition mechanism
can be valid at a liquid-liquid interface.

25
2.4 Conclusions
Aqueous two phase system droplets on most surfaces, including topographically patterned but
chemically homogeneous surfaces,9 form rounded circular structures to minimize the surface
energy. Previously we demonstrated, however, that substrates coated with biological cells have
the ability to pin the contact lines enabling formation of ATPS droplets in arbitrary patterns.9,10
Inspired by the chemical heterogeneity of cell surfaces which display various functional
groups such as glycoproteins, globular proteins, and phospholipid heads,30 we developed non-
cellular topographically flat surfaces that also have a degree of chemical heterogeneity across
length scales of several hundreds of micrometers to millimeters.
While none of the surfaces that were homogenously modified, despite differences in
affinity for the DEX solution phase, could stabilize DEX solution patterns formed within a PEG
phase solution, a variety of patterned and discontinuous patchy surfaces could. Surfaces
patterned in the shape of letters were able to maintain DEX solution droplets in such shapes
indefinitely although with different sharpness of the features depending on affinity of that
surface to the DEX solutions.
More importantly, surfaces patterned with an array of small patches of modified surfaces
were able to maintain DEX solution droplets in the shape of a line that stably bridge multiple
patches as long as the distance between patches were below a critical distance. Such surface
patchiness successfully achieved arbitrary DEX solution patterns on the same underlying
substrate similar to how a surface with an array of cells is able to stably maintain DEX solution
patterns.

26
Our technique enables precise distance and dimension control of DEX solution patterns,
with potential applications to cell migration13, bacterial colonial communication10 and other
biomedical studies using DEX-PEG ATPS. Moreover, our technique can expand to other ATPS
such as PEG-salt systems and sheds light on the fundamental mechanism of contact line pinning
at liquid-liquid interfaces.

27
Scheme 2.1. A) O2 plasma treatment of PDMS, B) primary amine-derivitization of plasma-treated PDMS with APTES, C) PEG-derivitization of APTES-modified PDMS through amine coupling, D) CM-DEX-derivitization of APTES-modified PDMS through amine coupling, E) carboxylation of APTES-aminated PDMS with succinic anhydride, and F) DEAE-DEX-derivitization of carboxylated PDMS through amine coupling.

28
Scheme 2.2. A) Plasma treatment on the PDMS surface where the half right side is covered by taping, B) oxidized PDMS and bare PDMS surfaces, and C) chemical modification on the surfaces.

29
Scheme 2.3. A) Surface modification of PDMS within a microchannel and B) heterogeneous surface patterned by letter M.

30
Figure 2.1. Fluorescence measurement of chemically modified PDMS surfaces: A) FITC-PEG-modified PDMS, B) FITC-DEAE-DEX-modified PDMS and C) FITC-CM-DEX-modified PDMS prepared according to Scheme 2.1 and 2.2.

31
Figure 2.2. XPS analyses of chemically modified PDMS surfaces: A) C1s peaks, B) N1s peaks, and C) O1s peaks measured on the surfaces of bare PDMS (gray open circle), APTES-modified PDMS (magenta open square), PEG-modified PDMS (green closed rhombus), CM-DEX-modified PDMS (sky blue closed square), and DEAE-DEX-modified PDMS (blue closed circle).

32
Figure 2.3. Contact angle measurements of sessile water droplet in air on different surfaces: A) bare PDMS, B) APTES-modified PDMS, C) PEG-modified PDMS, D) DEAE-DEX-modified PDMS, and E) CM-DEX-modified PDMS.

33
Figure 2.4. Contact angle measurements of sessile DEX droplet in the PEG phase on bare PDMS, APTES-modified PDMS, PEG-modified PDMS, DEAE-DEX-modified PDMS, and CM-DEX-modified PDMS in differing DEX-PEG systems: A) 3.2% DEX – 2.5% PEG, B) 3.2% DEX – 15% PEG, and C) 15% DEX – 2.5% PEG.

34
Figure 2.5. Sliding angle and hysteresis measurements of sessile DEX droplet in the PEG phase on surfaces. Sliding angle as a function of contact angle hysteresis on bare PDMS, APTES-modified PDMS, PEG-modified PDMS, DEAE-DEX-modified PDMS, and CM-DEX-modified PDMS in 3.2% w/w DEX – 15% w/w PEG system.

35
Figure 2.6. DEX solution patterns in 3.2% w/w DEX – 2.5% w/w PEG system. The phase contrast images of letter “M” on A) bare PDMS, B) PEG-modified PDMS, and C) DEAE-DEX-modified PDMS, and the fluorescent images of letter M on D) DEAE-DEX-modified PDMS and E) CM-DEX-modified PDMS. The patterned surfaces were prepared according to Scheme 2.1 and 2.3. Scale bar 1 mm.

36
Figure 2.7. DEX phase solution lines formed on surface-modified square patches (1.5 millimeter long edges) with different inter-patch spacing analyzed with a 3.2% w/w DEX – 2.5% w/w PEG system. The DEX phase solution lines were drawn on DEAE-DEX-modified patches formed on a background of native PDMS with inter-patch edge-to-edge distances of A) 500 µm (the area fraction of defects: fd = 0.21) and B) 1 mm (fd = 0.35). Similarly, DEX phase solution lines were formed on CM-DEX-modified patches where inter-patch distances were C) 200 µm (fd = 0.096) and D) 300 µm (fd = 0.14). Black dots are markings used to locate surface modified patches and correlate to the rough positions, although they do not represent the actual chemically modified patch shape. Scale bar 1mm.

37
Figure 2.8. Arbitrary DEX phase solution patterns in a 3.2% w/w DEX – 2.5% w/w PEG system formed on surface-modified with square grids (1.0 millimeter long edges) that have different inter-patch spacing. The fluorescent DEX phase solution patterns of the letters “L” and “U” were drawn on CM-DEX-modified grids formed on a background of native PDMS with inter-patch edge-to-edge distances of A-B) 100 µm (fd = 0.14), C-D) 300 µm (fd = 0.35), and E-F) 1 mm (fd = 0.69). Scale bar 1mm.

38
Figure 2.9. Fluorescent measurement: A) FITC-PEG-modified PDMS, B) FITC-DEAE-DEX-modified PDMS, and C) FITC-CM-DEX-modified PDMS

39
Figure 2.10. Contact angle measurements: A) Contact angle measurement of sessile water droplet in air and B) contact angle measurement of sessile DEX droplet in PEG solution. γLV, γSL and γSV are the interfacial tension at the liquid-vapor, solid-liquid, and solid-vapor interfaces, respectively. Similarly, γ12, γ1S, and γ2S are the interfacial tension at the PEG-DEX, PEG-solid, and DEX-solid interfaces, respectively. C) Contact angle hysteresis measurement. θA, θB, and θS represent advancing angle, receding angle and sliding angle, respectively. Contact angle hysteresis is expressed as (θA - θB).

40
Figure 2.11. DEX patterns in 3.2% w/w DEX – 2.5% w/w PEG system. The phase contrast images of letter M on A) bare PDMS, B) PEG-modified PDMS, and C) DEAE-DEX-modified PDMS, and the fluorescent images of letter M on D) DEAE-DEX-modified PDMS and E) CM-DEX-modified PDMS. The patterned surfaces were prepared according to Scheme 2.1 and 2.3. Scale bar 1 mm.

41
Figure 2.12. Patchy surfaces used: A) DEX phase on discontinuously modified PDMS surface in the PEG phase. γ12 is the interfacial tension at the PEG-DEX and ∆γ is the surface energy barrier between modified PDMS surface and bare PDMS. B) An array of modified patches on a background of native PDMS. C) Arrays of CM-DEX-modified patches on a background of native PDMS. d represents the inter-patch edge-to-edge distance.

42
Figure 2.13. Surface adhesion and gap effects on DEX solution line stability. Enforcing surface affinity to DEX phase (A to B) or increasing the inter patch-to-patch distance (C to D) can break up a DEX solution line.

43
Figure 2.14. Spreading and pinning of arbitrary patterns after dispensing DEX solutions onto a CM-DEX-modified patchy surface. Initial shapes of DEX patterns (A and C) followed by spreading and pinning (B and D). Scale bar 1 mm.

44
2.5 References
1. Albertsson, P.-Å., Partition of Cell Particles and Macromolecules. 3rd ed.; John Wiley & Sons, Inc.: 1986.
2. Hatti-Kaul, R., Aqueous Two-Phase Systems: Methods and Protocols. Humana Press, Inc.: 2000.
3. Fang, Y.; Frampton, J. P.; Raghavan, S.; Sabahi-Kaviani, R.; Luker, G.; Deng, C. X.; Takayama, S., Rapid Generation of Multiplexed Cell Cocultures Using Acoustic Droplet Ejection Followed by Aqueous Two-Phase Exclusion Patterning. Tissue Eng. Part C 2012, 18, 647-657.
4. Keating, C. D., Aqueous Phase Separation as a Possible Route to Compartmentalization of Biological Molecules. Acc. Chem. Res. 2012.
5. Mashayekhi, F.; Chiu, R. Y.; Le, A. M.; Chao, F. C.; Wu, B. M.; Kamei, D. T., Enhancing the Lateral-Flow Immunoassay for Viral Detection using an Aqueous Two-Phase Micellar System. Anal. Bioanal. Chem. 2010, 398, 2955-2961.
6. Mashayekhi, F.; Meyer, A. S.; Shiigi, S. A.; Nguyen, V.; Kamei, D. T., Concentration of Mammalian Genomic DNA using Two-Phase Aqueous Micellar Systems. Biotechnol. Bioeng. 2009, 102, 1613-1623.
7. Akbulut, O.; Mace, C. R.; Martinez, R. V.; Kumar, A. A.; Nie, Z.; Patton, M. R.; Whitesides, G. M., Separation of Nanoparticles in Aqueous Multiphase Systems through Centrifugation. Nano Lett. 2012, 12, 4060-4064.
8. SooHoo, J. R.; Walker, G. M., Microfluidic Aqueous Two Phase System for Leukocyte Concentration from Whole Blood. Biomed. Microdevices 2009, 11, 323-329.
9. Frampton, J. P.; Fan, Z.; Simon, A.; Chen, D.; Deng, C. X.; Takayama, S., Aqueous Two-Phase System Patterning of Microbubbles: Localized Induction of Apoptosis in Sonoporated Cells. Adv. Funct. Mater. 2013, 23, 3420-3431.
10. Byun, C. K.; Hwang, H.; Choi, W. S.; Yaguchi, T.; Park, J.; Kim, D.; Mitchell, R. J.; Kim, T.; Cho, Y.-K.; Takayama, S., Productive Chemical Interaction between a Bacterial Microcolony Couple is Enhanced by Periodic Relocation. J. Am. Chem. Soc. 2013, 135, 2242-2247.
11. Strulson, C. A.; Molden, R. C.; Keating, C. D.; Bevilacqua, P. C., RNA Catalysis through Compartmentalization. Nat. Chem. 2012, 4, 941-946.
12. Yaguchi, T.; Lee, S.; Choi, W. S.; Kim, D.; Kim, T.; Mitchell, R. J.; Takayama, S., Micropatterning Bacterial Suspensions Using Aqueous Two Phase Systems. Analyst 2010, 135, 2848-2852.

45
13. Tavana, H.; Kaylan, K.; Bersano‚ÄêBegey, T.; Luker, K. E.; Luker, G. D.; Takayama, S., Rehydration of Polymeric, Aqueous, Biphasic System Facilitates High Throughput Cell Exclusion Patterning for Cell Migration Studies. Adv. Funct. Mater. 2011, 21, 2920-2926.
14. Tavana, H.; Jovic, A.; Mosadegh, B.; Lee, Q.; Liu, X.; Luker, K.; Luker, G.; Weiss, S.; Takayama, S., Nanoliter Liquid Patterning in Aqueous Environments for Spatially-Defined Reagent Delivery to Mammalian Cells. Nat. Mater. 2009, 8, 736-741.
15. Tavana, H.; Mosadegh, B.; Takayama, S., Polymeric Aqueous Biphasic Systems for Non-Contact Cell Printing on Cells: Engineering Heterocellular Embryonic Stem Cell Niches. Adv. Mater. 2010, 22, 2628-2631.
16. Caruso, F.; Rodda, E.; Furlong, D. N.; Niikura, K.; Okahata, Y., Quartz Crystal Microbalance Study of DNA Immobilization and Hybridization for Nucleic Acid Sensor Development. Anal. Chem. 1997, 69, 2043-2049.
17. Fischer, M. J. E., Amine Coupling through EDC/NHS: a Practical Approach. Methods Mol. Biol 2010, 627, 55-73.
18. Lee, N. Y.; Chung, B. H., Novel Poly (dimethylsiloxane) Bonding Strategy via Room Temperature ‚"Chemical Gluing". Langmuir 2009, 25, 3861-3866.
19. Jameson, D. M.; Wong, S. S., Chemistry of Protein and Nucleic Acid Cross-Linking and Conjugation. 2nd ed.; CRC Press: 2011.
20. Zhou, J.; Ellis, A. V.; Voelcker, N. H., Recent Developments in PDMS Surface Modification for Microfluidic Devices. Electrophoresis 2009, 31, 2-16.
21. Okahata, Y.; Kawase, M.; Niikura, K.; Ohtake, F.; Furusawa, H.; Ebara, Y., Kinetic Measurements of DNA Hybridization on an Oligonucleotide-Immobilized 27-MHz Quartz Crystal Microbalance. Anal. Chem. 1998, 70, 1288-1296.
22. Khorasani, M.; Mirzadeh, H.; Kermani, Z., Wettability of Porous Polydimethylsiloxane Surface: Morphology Study. Appl. Surf. Sci. 2005, 242, 339-345.
23. Pinto, S.; Alves, P.; Matos, C.; Santos, A.; Rodrigues, L.; Teixeira, J.; Gil, M., Poly (dimethyl siloxane) Surface Modification by Low Pressure Plasma to Improve Its Characteristics towards Biomedical Applications. Colloids Surf., B 2010, 81, 20-26.
24. Adamson, A. W.; Gast, A. P., Physical Chemistry of Surfaces. 6th ed.; John Wiley & Sons, Inc.: 1997.
25. Brochard, F., Motions of Droplets on Solid Surfaces Induced by Chemical or Thermal Gradients. Langmuir 1989, 5, 432-438.
26. Subramanian, R. S.; Moumen, N.; McLaughlin, J. B., Motion of a Drop on a Solid Surface Due to a Wettability Gradient. Langmuir 2005, 21, 11844-11849.

46
27. Chaudhury, M. K.; Whitesides, G. M., How to Make Water Run Uphill. Science 1992, 256, 1539-1541.
28. Nadkarni, G.; Garoff, S., An Investigation of Microscopic Aspects of Contact Angle Hysteresis: Pinning of the Contact Line on a Single Defect. Europhys. Lett. 2007, 20, 523.
29. Murakami, D.; Jinnai, H.; Takahara, A., Wetting transition from the Cassie–Baxter state to the Wenzel state on textured polymer surfaces. Langmuir 2014, 30, 2061-2067.
30. Alberts, B.; Johnson, A.; Lewis, J.; Raff, M.; Roberts, K.; Walter, P., Molecular Biology of the Cell. 5th ed.; Garland Science: 2012.

47
Chapter 3
Surface-templated hydrogel patterns prompt matrix-dependent migration of breast cancer
cells towards chemokine-secreting cells
This chapter describes a novel technique to fabricate spatially-defined cell-laden collagen
hydrogels, using patterned, non-adhesive polyacrylamide-coated polydimethylsiloxane (PDMS)
surfaces as a template. Precisely patterned embedded co-cultures of breast cancer cells and
chemokine-producing cells generated with this technique, revealed matrix- and chemokine
isoform-dependent migration of cancer cells. CXCL12 chemokine-secreting cells induce
significantly more chemotaxis of cancer cells when the 3D extracellular matrix includes
components that bind the secreted CXCL12 chemokines. Experimental observations using cells
that secrete CXCL12 isoforms with different matrix affinities together with computational
simulations show that stronger ligand-matrix interactions sharpen chemoattractant gradients,
leading to increased chemotaxis of the CXCL12 gradient-sensing CXCR4 receptor-expressing
(CXCR4+) cells patterned in the hydrogel. These results extend our recent report on CXCL12
isoform-dependent chemotaxis studies from 2D to 3D environments and additionally reveal the
important role of extracellular matrix composition. The developed technology is simple, versatile
and robust; and as chemoattractant-matrix interactions are common, the methods described here
should be broadly applicable for study of physiological migration of many different cell types in
response to a variety of chemoattractants.

48
3.1 Introduction
Gradient formation and sensing is a complicated process involved in many physiologic and
pathologic processes. Cells will change morphology and move toward a chemical gradient
depending on the shape, dynamics, and magnitude of the gradient.1 The simplest model of
gradient formation involves diffusion of soluble factors away from cells that secrete them.
However, in vivo there are two types of microenvironmental interactions that define gradient
formation and sensing: ligand-matrix, and ligand-cell. Several studies have demonstrated the
importance of complex gradient shape and dynamics in vivo, driven by ligand-matrix
interactions2, 3 and by active cell-dependent ligand scavenging.4 Hence, to properly model and
experimentally manipulate these complex chemotactic processes, we need experimental systems
that recreate these environmental influences on gradient formation.
Here we develop a technique that enables robust and versatile definition of in vitro multi-
cellular / microenvironment interactions, in physiologically-relevant 3D environments, and
utilize this technique to study the relationship between ligand-matrix and ligand-cell interactions
on migration of breast cancer cells. A few in vitro assays exist to recreate how ligand-matrix and
ligand-cell interactions collectively guide gradient formation. Transwells,5 hydrogels,6-10 and
microchannels,11-16 are typically used to spatially pattern cells, define morphogenetic and
chemotactic gradients, and monitor cell morphology and chemotaxis. Although these assays
isolate individual aspects of gradient formation and sensing, they fail to replicate how multiple
cell types and matrix interactions together define a gradient.
We previously developed an experimental source-sink system to replicate the formation
of defined soluble gradients between spatially-patterned cells that secrete ligands (source) and

49
cells that scavenge ligands (sink).17, 18 These previous studies capture the involvement of
multiple cell types in source-sink gradient formation and the role of ligand binding to the device-
and cell-surfaces. However, the relatively small surface area with limited amount of binding sites
available in this simple two-dimensional assay is not sufficient to address the potential influence
of ligand-matrix interactions, as compared to the in vivo situation in which 3D matrices provide a
significantly greater concentration of binding sites.
In this work, we develop a novel patterning system to spatially pattern cells within an
extracellular matrix (ECM), creating a model tissue-like environment for studies of directional
cell migration. There are several techniques to create desired hydrogel patterns, such as laser
lithography19-25 and microchannel-guides,26-28 that often require significant expertise, specialized
instruments and complicated processing. Our approach enables the precise positioning of
multiple cell types within a 3D matrix, using relatively simple tools and expertise that should be
accessible to most wet-labs. As a first application of this technology, we spatially pattern cells
engineered to secrete the α- and β- isoforms of the CXCL12 chemokine and CXCR4+ cells that
respond to CXCL12, while varying the composition of the surrounding matrix. Using this breast
cancer model system, we demonstrate (1) the ability to systematically control ligand-matrix
interactions via matrix composition; (2) the ability to spatially pattern multiple interacting cell
types within a 3D matrix; and (3) the effects of ligand-matrix interactions on gradient formation,
and on subsequent cell migration.

50
3.2 Materials and Methods
Unless otherwise stated, all chemicals and reagents for cell culture were purchased from Sigma-
Aldrich, fluorescent dyes from Invitrogen and all other equipment and materials from Fisher
Scientific.
3.2.1 Cell culture
MDA-MB-231 (231, ATCC) cells were primarily used for these experiments, and were cultured
in fully supplemented Dulbecco’s Modified Eagle Medium (DMEM, with 10% Fetal Bovine
Serum (FBS), 1% antibiotics-antimycotics). Some demonstration experiments were conducted
with NIH 3T3 murine fibroblasts (cultured in fully supplemented DMEM), and human bone
marrow endothelial cells (HBMECs, were a gift from Irma de Jong, cultured in fully
supplemented Endothelial Cell Growth media, EGM2, with 5% FBS; Lonza). Standard
trypsinization-based sub-culture protocols were used to passage cells prior to the experiment.
We previously described culture, lentiviral transduction, and migration of 231 cells expressing
CXCR4 towards 231 cells secreting CXCL12.17, 18 Briefly, we transduced 231 cells sequentially
with a CXCR4-GFP fusion29 and NLS-AcGFP to facilitate receptor-based migration and image-
based tracking of nuclei,18 respectively. We expressed CXCL12-isoforms fused to Gaussia
luciferase (GL) upstream of the fluorescent protein mCherry in a pLVX IRES vector, to facilitate
proportional fluorescence sorting for CXCL12-expressing cells.18
3.2.2 Preparation of PAA-coated PDMS surface
10:1 (w/w) degassed mixture of PDMS and a curing agent were diluted with toluene
(PDMS:toluene = 1:3). 12 mm diameter glass slides were dipped into the mixed solution and

51
baked at 120 °C for 30 min. 9:1 (v/v) mixture of prepolymer solution (18.9 w/w% acrylamide,
0.33 w/w% pluronic F108, and 80.77 w/w% water) and photoinitiator solution (0.3 w/w%
benzophenone and 99.7 w/w% 2-propanol) were added to the PDMS-coated slides and
polymerized under UV (CL-1000, UVP: 8W x 4min) followed by an extensive wash in water.30,
31 The PAA-coated PDMS slides were stored at ambient conditions and used for following
hydrogel patterning within a few days (Figure 3.1A).
3.2.3 Fabrication of oxidized patterns
The SU-8 master molds were fabricated by soft lithography. Detailed procedure for fabrication
of master molds can be found elsewhere.32 The PDMS replicas of patterns served as oxidation
stencils were placed in conformal contact with the PAA-coated PDMS slides and oxidized
(100W x 10 min).33 Oxidized PAA-coated PDMS slides were immediately used for hydrogel
patterning (Figure 3.1B).
3.2.4 Surface characterization
Water contact angles in air were measured on PDMS-coated slides and PAA-coated PDMS
slides before and after oxidation by the sessile drop technique (4 µL of water) using a
goniometer and analyzed with ImageJ. Data are expressed as a mean ± standard deviation (n =
3). Surface topography of PAA-coated PDMS slides oxidized through patterns was measured by
atomic force microscope in ScanAsyst mode (Veeco, Bruker) and analyzed with Nanoscope
(Veeco, Bruker).
3.2.5 Hydrogel patterning

52
2 mL of degassed PDMS was poured and cured into each well of a 6-well plate (Figure 3.1C).
Each PDMS well was punched along the shape of a 12 mm glass slide and each oxidized PAA-
coated PDMS slide was set at the bottom of the well. Trypsinized cells were mixed with
neutralized type I bovine collagen (BD Biosciences) to create a suspension of 10 million cells /
mL in 2 mg/mL of collagen.
For cell-free experiments, 1 µm diameter fluorescent beads (Sigma) were added to the
neutralized collagen solution. 6 µL of the collagen gel solution was dispensed over each adhesive
pattern and allowed to polymerize for 45 min in a humidified cell incubator (37 °C, 5% CO2).
250 µL of either 2.5 mg/mL neutralized collagen or 2.5 mg/mL neutralized collagen
supplemented with growth factor reduced matrigel (BD Biosciences: 61% laminin, 30% collagen
IV, 7% entacin, and 2% other proteins including proteoglycans) mixture of collagen gel and
matrigel solutions (75v/v% collagen I + 25v/v% marigel) was poured on each well and allowed
to polymerize for 1 hour in the humidified incubator. 2 mL of cell culture media were added to
each well and cultured at 37 °C. For observation of non-specific cellular movement, Latrunculin
(10µM) was added to the media in control samples to prevent actin polymerization and hence
migration.
3.2.6 Cell adhesion test
DMEM cell culture media containing MDA-MB-231 cells was cultured on tissue culture plastic,
PAA-coated PDMS or oxidized PAA-coated PDMS slides in a 24-well plate and incubated for
24 hours. Cell culture media was aspirated and samples were rinsed twice in PBS. 1 mL of 4%
paraformaldehyde solution was added to fix cells. Cellular actin cytoskeletal structures and the
cell nucleus were labeled with Phalloidin and Hoechst dyes, following protocols obtained from

53
the manufacturers. Images were collected with an epifluorescent microscope (TE-300, Nikon)
and analyzed with ImageJ to determine cell density and spread area, expressed as a mean ±
standard deviation (n = 6).
3.2.7 Modeling diffusion and binding kinetics
Finite element modelling of the diffusion and binding kinetics were conducted in COMSOL 4.2
(Burlington, MA), using a 1-D model geometry. Parameters for diffusion of CXCL12 (MW ≈ 10
kDa) were estimated based on the Stokes-Einstein equation relating hydrodynamic radius with
diffusion rate, and published values in the literature for diffusion of large molecules in
collagen.34 Flux of CXCL12 molecules at one end of the model was calculated based on the
estimated rate of CXCL12 production by cells18 and on the geometry of the hydrogel system. A
reaction-diffusion COMSOL module was used to simulate binding of the secreted soluble factors
to uniformly distributed binding sites, representing matrigel proteoglycans in the collagen matrix.
Kinetic binding parameters of CXCL12-α and CXCL12-β to matrigel proteoglycans were
estimated as being similar to the binding kinetics of CXCL12 isoforms to heparan sulfate.35
Results are reported as concentrations of soluble factors and as specific gradients across the
length-scale of an individual cell. The specific gradient was determined by dividing the
concentration difference across 50 µm by the average concentration over that distance.17
3.2.8 Binding assay of CXCL12 to different matrix coatings
We previously described and characterized the production and activity of CXCL12-isoforms
fused to Gaussia luciferase.18 Measurement of Gaussia luciferase activity allows quantitative
measurements of CXCL12 associated with cells, bound to extracellular matrix, and in cell
culture supernatants. We collected supernatants from 106 cells expressing secreted GL,

54
CXCL12-α-GL, CXCL12-β-GL, or GL-negative that were plated in 60 mm dishes. After cells
adhered in 10% FBS DMEM media overnight, cells were washed once in PBS, and media was
replenished with DMEM with 0.2% albumin (Probumin Media Grade, Millipore). After 24 hours
the supernatants were collected and imaged for GL activity and diluted in GL-negative cell
supernatants to normalize GL flux activity to that of the lowest condition.
Briefly, to measure GL flux, 1 µl of supernatant was queried in 1:1000 final dilution of
the GL-substrate coelanterazine brought to a total volume of 100 µl of PBS, as we have
described previously.18 We added 50 µl of the GL flux-normalized supernatants to 96 well tissue
culture plates that were pretreated with extracellular matrix (collagen, collagen and matrigel,
matrigel only, or untreated tissue culture). Pre-treatment was achieved by incubating the 96 well
plate with the appropriate solutions at 4 °C for 2 hours.
The low temperature prevented polymerization but allowed adsorption of both collagen
and matrigel components. Wells were then washed twice with PBS. Wells were grouped in
quadruplicate for each supernatant type and extracellular matrix (ECM) type for three
independent experimental setups. We incubated these plates for 30 minutes at 37°C to facilitate
binding to the ECM. To remove unbound GL-species, we aspirated medium; washed each well
in triplicate with an excess of PBS; and replaced medium with 50 µl of PBS per well. We imaged
each well with the same substrate and PBS volumes as above. All bioluminescence images were
acquired with the IVIS Lumina Series III (Caliper, LifeSciences), and data were analyzed with
Living Image 4.3.1
3.2.9 Chemotaxisis of MDA-MB-231 cells

55
CXCR4+ and source cells (secreted GL as GL, CXCL12-α-GL as CXCL12-a, and CXCL12-β-
GL as CXCL12-b) in mixture of collagen and matrigel matrix with 2 mL DMEM media were
incubated for 24 hours and imaged with a fluorescent microscope (TE-300, Nikon). The
representative leading cell-to-cell distance at day 0 and day 1 were each measured at five points
with ImageJ and expressed as a mean ± standard deviation (n = 6 for GL, n = 6 for CXCL12-a, n
= 6 for CXCL12-b, each in the presence of matrigel, n = 5 for CXCL12-b in the absence of
matrigel).
3.2.10 Statistical analysis
All statistics are reported as means ± standard deviation. ANOVA tests were performed using a
commercially-available software package (SigmaStat 3.5; Systat Software Inc., San Jose, CA),
using the Tukey test for post-hoc pairwise comparisons.
3.3 Results
3.3.1 Characterization of hydrogel patterns on PAA-coated PDMS
This system enables control of three parameters: spacing between groups of patterned cells, gel
composition, and cell type (Figure 3.1). PAA-coated PDMS slides were fabricated as described
(Figure 3.1A-C) and clusters of cells encapsulated in hydrogels were patterned adjacent to each
other with defined spacing (Figure 3.1D and Figure 3.7). The pattern-to-pattern distance was
controllable and hydrogel patterns were stable regardless of cell type and gel composition.
Obtaining successful patterns depends on carefully balancing topographic and surface chemistry

56
features of the patterned surface template, at the contact line between the hydrogel precursor
solution and the underlying substrate.
Surface chemical heterogeneity and physical topology are both known to define the
contact line at liquid-solid and liquid-liquid interface.32, 36 We characterized the surface
properties of PAA-coated PDMS by measuring the contact angle of sessile droplets, and AFM
topographical measurements. The contact angle measurement of native PDMS and PAA-coated
PDMS illustrates a dramatic reduction of contact angle before and after plasma oxidation (Figure
3.2A). While intact PAA-coated PDMS showed lower contact angle compared to native PDMS
due to the hydrophilic nature of PAA introduced on PDMS, both surfaces demonstrated similar
contact angles after oxidation.
Meanwhile, AFM measurement reveals distinct surface topology of patterned PAA-
coated PDMS (Figure 3.2B). A clear boundary at the edge of the pattern was observed and the
step was about 50 nm at the boundary. In contrast, there was no distinct difference between intact
and oxidized PAA-coated PDMS regions (Figure 3.8). We confirmed that either reducing
oxidation time or leaving substrates for a few days resulted in failure of hydrogel patterning (data
not shown), indicating that both surface chemistry and physical topography boundaries are
necessary to support the formation of stable hydrogel patterns. We note that the accuracy of the
patterning with 250 µm spacing was 246 ± 4.97 µm (n = 3) and the height of a droplet was 0.76
± 0.041 mm (n = 6). We examined the limitations where the minimum spacing is 100 µm and
minimum size of a pattern is 1.5 mm in diameter. Below these dimensions, oxidation and surface
treatment did not work properly and failed to sustain the droplet shape.

57
In addition to the ability to precisely pattern hydrogels, PAA serves as a non-adhesive
cell-repellent material,37 and prevents migration of the cells over the PAA surface. To confirm
this, the number of cells adhered to these surfaces were assessed using a standard cell-adhesion
test, and indicates that adhesion was virtually eliminated, as compared to tissue culture plastic
surfaces. Furthermore, cell spread area was also greatly reduced for the few adherent cells
(Figure 3.2C-G), indicating that cells cannot attach sufficiently to spread, and therefore migrate.
Cell adhesion and spreading were restored after oxidation of the PAA surface, but as this occurs
only within the regions of patterned cells and not in the region of migration between cell patterns,
these effects can be ignored in this migration assay. Hence, migrating cells are forced to interact
with the hydrogel matrix.
3.3.2 Migration rates depend on matrix composition and CXCL12 production
We first confirmed that cells could migrate through the patterned matrix by monitoring radial
movement of MBA-231 cells initially patterned in a single spot (Figure 3.9A). Radial dispersion
of cells can be attributed to both random movement and growth of 231 cells (~24 hour doubling
time). To confirm that soluble factors can be transported through the matrix, the cytoskeletal
disruption compound Latrunculin A was added to the culture and significantly suppressed radial
migration (Figure 3.9A-C). Confocal images of GL cells in collagen gel matrix at day3 indicates
most of the cells settled down on the surface with a 15 µm-thick cell layer in the presence of
latruncurin while the cells radially migrated through the gel matrix without latruncurin (data not
shown). We seeded 6 x 10⁴ cells / hydrogel-droplet in theory and, based on confocal imaging,
confirmed that over 99% (> 5.9 x 10⁴) of the cells settled down on the surface at t = 0. We also

58
observed the same trend for other cell types used in this work. It indicates that the observed cell
migration did not arise from the randomly distributed suspended cells in hydrogels. Thus we
assume that most cells settled down on the surface at t=0 whereas they start to migrate in 3D
over the course of time.
Next, to examine effects of cell-matrix and ligand-matrix interactions on cell migration in
hydrogel matrices, we patterned encapsulated CXCR4+ migrating cells adjacent to cells that
secrete its ligand, CXCL12-β, which we express as a fusion to Gaussia luciferase (GL).
CXCL12-β cells were used because the cells secrete the most chemokine compared to other
CXCL12-isoforms.18 In control experiments, we replaced the CXCL12-β source cells with cells
secreting GL unfused to a chemokine, which does not bind to CXCR4 or regulate signaling
through this receptor. To assess migration in this system, we measured the gap spacing between
the leading edge of the migrating and source cell populations after 24 hours and report the
measured gap closure as the migration distance (Figure 3.3A and B). CXCL12-β drove more
rapid migration than the GL control in the presence of matrigel. Without matrigel, migration rate
was non-significant for CXCL12-β as compared to the GL control. This suggests that gradient
generation and/or sensing of CXCL12-β requires interactions between CXCL12 and matrigel
components (Figure 3.3C).
3.3.3 Matrix binding generates steep CXCL12 gradients
We hypothesized that matrigel provides binding sites for CXCL12 factors, which influences the
formation of both soluble and bound gradients in the matrix. To evaluate the potential
contribution of ligand-matrix interactions in shaping the gradient, we used computational models

59
to simulate diffusion and diffusion with a matrix-binding component. In the diffusion model,
unbound CXCL12-β rapidly diffuses through the gel matrix, and generates a negligible specific
gradient to stimulate cell migration (Figure 3.4A). In contrast, ligand-matrix binding generates a
steep specific gradient of unbound CXCL12-β, albeit at lower concentrations (Figure 3.4B).
Bound gradients may have similar profiles, but cannot precede the soluble gradient as diffusion
across surfaces is well-established to be significantly less than diffusion through an aqueous
medium. These simulation results strongly indicate that interactions between the ligand and
matrix facilitates gradient shaping and presents a possible mechanism explaining the matrix-
dependent migratory differences observed in our chemotaxis experiments.
Additionally, our model suggests that when cell clusters are spaced more than 500 µm
apart, chemotaxis cannot occur within the 24 hour time-frame of the experiment, as steep
gradients cannot form across large distances rapidly enough. To confirm the importance of this
spacing, we doubled the spacing to 500 µm, and observed no significant migratory differences
prompted by GL-secreting cells and CXCL12-expressing cells in 24 hours (Figure 3.10). Hence,
the ability of our technique to position the cell clusters close to each other is crucial parameter in
observing these gradient-driven migratory responses.
3.3.4 Differential binding of CXCL12 isoforms to matrix components
To better understand the ligand-matrix interactions, we assessed the relative binding of
CXCL12-isoforms to various matrix components. We used Gaussia luciferase activity to
measure the relative binding of secreted GL or CXCL12-α and CXCL12-β fused to GL to wells
coated with collagen I alone, collagen I-matrigel mixture, and matrigel alone (Figure 3.5A). Note

60
that this measurement was conducted on the hydrogel-coated 2D well surface in contrast to other
measurements in 3D hydrogel system.
Collagen by itself provided no differential binding across all secreted factors (Figure
3.5B). However supplemented matrigel in collagen I caused a rank-order increase in binding, in
which GL < CXCL12-α < CXCL12-β. Differential binding was statistically higher with matrigel
by itself as compared to collagen only and the collagen-matrigel mixture. These findings suggest
that matrigel increases capacity for CXCL12 binding and indicate that ligand-matrix interactions
can be a dominant factor in shaping chemotactic gradients of CXCL12 isoforms. Furthermore,
this suggests that matrix-binding may provide a mechanism by which migration of CXCR4 cells
in response to different CXCL12-isoforms may be altered.
3.3.5 Gradients of CXCL12 isoforms affect migration rate
To further explore the hypothesis that matrix-binding effects generate migration-inducing
gradients, we compared the migration behavior in response to GL, CXCL12-α and CXCL12-β in
the presence of matrigel (Figure 3.6A). We observed significant differences in migration
associated with these secreted factors, in which the migration rate order is GL < CXCL12-α <
CXCL12-β. These results are consistent with the results from the binding assay of these
molecules to matrigel presented in section 3.2.8 and 3.3.4.
Simulations of gradient formation in the diffusive matrix-binding model revealed distinct
gradient dynamics for CXCL12 isoforms, based on the secretion rate and binding kinetics of the
isoforms (Figure 3.11). These simulations indicate that CXCR4-β gradients establish out from

61
the source more rapidly than CXCR4-α gradients (Figure 3.6B and C). Hence, in a relatively
short-term experiment, migratory cells are exposed to chemotaxis-inducing gradients for
different time periods, which likely explains the differences in migration observed between α and
β isoforms. While there may also be other effects of adding matrigel, such as altered gel
morphology or additional macromolecular crowding effects, taken together, our findings strongly
suggest that our model system is able to adequately explore the parameters involved in matrix-
sequestering gradient generation effects.
3.4 Discussion
We developed a novel patterning technique that exploits surface heterogeneity and cell-repellent
properties to precisely pattern hydrogels for studies of gradient formation and cell migration.
This system presents two core advantages over existing technologies for patterning cells: 1)
broad applicability to a variety of ECM compositions and cell types; and 2) facile patterning of
multiple cell types in defined geometric locations. We leverage our ability to pattern cell-laden
hydrogels of varying composition to determine that formation of gradients of CXCL12 isoforms
critically depends on ECM molecules for migration of CXCR4+ cells.
Our technology for patterning hydrogels relies on a simple surface patterning technology
that biases cells and ligands towards interactions with the hydrogel matrix rather than the rigid
substrate. By controlling relative surface energies between oxidized and native PAA-
functionalized PDMS, we create geometrically-defined hydrogel patterns while minimizing cell
interactions with the solid substrate. This patterning technique is simpler than channel-based or
laser lithography-based hydrogel patterning systems and provides more robust patterns than

62
liquid-liquid patterning techniques, such as aqueous two-phase systems.32, 38 Simple but robust
hydrogel patterning with our system decreases the barrier for adoption of 3D assays and
improves their flexibility for researchers. Moreover, given the biased interaction among
patterned cells, their secreted factors, and the hydrogel ECM, our system facilitates studies of the
role of matrix interactions in physiological settings.
Dysregulated composition and architecture of the extracellular matrix is a fundamental
hallmark of cancer. Perturbations in the extracellular matrix increase stiffness of the environment,
facilitate invasion of cancer cells along collagen fibrils, and enhance tumor growth.39 Less
recognized is that changes in ECM content in tumors augments the capacity of the
microenvironment to sequester growth factors in a way that increases local concentrations and
establishes chemotactic gradients in pancreatic40 and breast cancers.41, 42 For example, heparan
sulfate proteoglycans in tumors binds CXCL12 and other soluble chemokines to create a
chemotactic gradient that directs cell migration.43, 44 Our device enables facile control of
extracellular matrix environments to study how interactions between chemotactic molecules and
extracellular matrix molecules regulates magnitude of chemokine gradients and resultant cell
migration.
As a prime example of the interplay among migrating cells, cells secreting chemokines,
and different ECM, we investigated migration of CXCR4+ cells towards gradients of different
CXCL12-isoforms. We modulated the interaction between the CXCL12 and the ECM by
incorporating matrigel and expressing CXCL12 isoforms with different affinities for matrigel.
CXCL12-β, which has a higher affinity for matrigel than the α -isoform (Figure 3.5), drove
substantially higher migration of CXCR4+ cells. Our 3D hydrogel system revealed another

63
nuance of the source-sink model where CXCL12 gradient formation and sensing does not require
CXCL12 scavenging by receptor CXCR7 as previously reported.4, 5, 18, 45 We found that for some
CXCL12-isoforms, binding to the ECM may effectively form a gradient instead of CXCR7
ligand scavenging cells. Our system demonstrates how chemotactic phenotypes evolve
differently among cell types in hydrogels and may better recreate in vivo physiology.
To further investigate effects of different ligand-matrix interactions on gradient dynamics,
we developed a simple computational model of ligand diffusion away from cells secreting
CXCL12 isoforms and binding to the ECM. Owing to precisely patterned hydrogel matrix in 3D
and the large capacity for CXCL12 binding in the ECM, our computation and experimental
model indicates that ligand-matrix interactions replace the cell-scavenging sink required in the
previous 2D assay. It should be noted that we cannot decouple the individual contribution of
bound and free CXCL12 gradients, which is a limitation of this study. We assume that the
combination of bound and unbound gradients of CXCL12 drive CXCR4+ migration (haptotaxis
and chemotaxis, respectively). In the future work, bound gradients of CXCL12 can be generated
in the hydrogel matrix to selectively assess CXCL12-dependent haptotaxis of CXCR4+ cells.
This can be achieved through the use of 3D ECM engineering techniques to tether gradients of
molecules to the matrix.46-49
Our system’s flexibility extends to many different biological questions of how
multicellular interactions in 3D environments determine movement and morphogenesis, such as
in angiogenesis,50, 51 metastasis,52 and other processes53 that require multiple patterns and cell
populations. Here we use our system to analyze a tumor microenvironment to allow cell-
autonomous gradient formation and sensing of chemotactic molecules. Our results support the

64
idea that secreted signaling molecules interact with the ECM and direct cancer cell migration.
We also note that our ECM patterning technique is amenable to multiplexing for studies of
interactions between more than two cell-type or matrix combinations (Figure 3.12).
3.5 Conclusions
Patterns on a non-adhesive surface can serve as a template to create patterns of cell-laden
hydrogels with different gel compositions, cell types and soluble signals present. In this work,
spatially patterned hydrogel matrices revealed distinct chemotactic behavior of breast cancer
cells in response to production of the alpha and beta isoforms of the soluble signaling factor
CXCL12. Our computational models indicate that a steep gradient of CXCL12 forms as a result
of ligand-matrix binding interactions in reconstituted ECM, and predicts a lag-time in gradient
advancement between the CXCL12 isoforms. Our system establishes that autologous gradient
formation arises as a result of this interaction, without the presence of cells that scavenge
CXCL12. More broadly, our approach presents a simple alternative to generating
microstructured biomaterials for advanced migratory and morphogenetic studies that can be
easily adopted in a variety of wet-lab environments.

65
Figure 3.1. Patterning of hydrogels on a cell-repellent surface. (A) PAA was polymerized on PDMS-coated glass slides and oxidized along mask patterns. Hydrogel precursor solutions are added on oxidized regions and cured. Gel solution was overlaid the patterns and incubated for the measurement. (B) Top view illustration of a patterned slide. Whole slide 12 mm diameter and oxidized spot 4 mm diameter. (C) Side view illustration of the whole setup. (D) Fluorescent image of patterned collagen gels containing NIH3T3 cells overlaid by collagen gel with 400 µm pattern-to-pattern distance and fluorescent image of patterned collagen gels containing HBMEC cells overlaid by the mixed gel (60 v/v% matigel + 40 v/v% collagen gel) with 200 µm pattern-to-pattern distance. Scale bar 400 µm for NIH3T3 and 200 µm for HBMEC.

66
Figure 3.2. Surface characterization of PAA-coated PDMS. A) Contact angle values of water droplet on PDMS, oxidized PDMS, PAA-coated PDMS, and oxidized PAA-coated surface. (B) Surface topography of oxidized PAA-coated PDMS. (a) Height profile at the boundary and (b) highlighted section by white bar. (C-D) Cell adhesion test of MDA-MB-231 cells. (C) Cell density and (D) cell spread area of CXCL12-GL on TCP, PAA-coated PDMS, and oxidized PAA-coated PDMS. Images of a cell on (E) TCP, (F) PAA-coated PDMS, and (G) oxidized PAA-coated PDMS, respectively. Nucleus and cytosol were stained by blue and green, respectively. Scale bar 50 µm.

67
Figure 3.3. Migration assay of CXCR4 cells in 3D gel matrix. (A) Fluorescent images of CXCR4 (green) and GL (red) at day0 and day1. (B) Fluorescent images of CXCR4 (green) and CXCL12-β (red) at day0 and day1. Scale bar 250 µm. (E) Migration of CXCR4-CXCL12 at day 1 in the absence and presence of matrigel (**p <0.01 and ***p < 0.001).

68
Figure 3.4. Computational modeling of CXCL12-β gradients. Simulation of unbound CXCL12-β concentration as a function of distance and time and CXCL12-β specific gradient (defined as ∆C / Cavg / x across a 50 µm gap) as a function of distance and time in (A) diffusion only and (B) diffusion-matrix binding.

69
Figure 3.5. Binding assay of CXCL12 isoforms in different gel matrices. (A) Representative heat map of flux plotted on the same log. (B) Fold change of flux relative to tissue culture plastic (TCP) for CXCL12-α, CXCL12-β, and GL treated with collagen, collagen-matrigel, and matrigel. Values are plotted from one of three representative experiments as mean ± S.E.M. for quadruplicate wells. Statistical demarcations above a bar indicate pairwise comparison to all others in that group. The bar indicates individual pairwise differences (*p <0.05, **p <0.01, and ****p <0.0001).

70
Figure 3.6. Migratory comparison of CXCL12 isoforms in the presence of matrigel. (A) Migration assay of CXCR4-CXCL12 (GL, CXCL12- α, and CXCL12-β) at day1 in the presence of matrigel with 250 µm spacing (*p <0.05, **p <0.01, and ***p < 0.001). GL# represents the replication of the data in Figure 3.3C (+ matrigel / - CXCL12-β). (B-C) Computational simulation of unbound CXCL12-β and CXCL12-α gradient formation as a function of distance and time. Dotted line represents the spacing using between the patterned gels.

71
Figure 3.7. HBME cells in the patterned hydrogel droplets overlaid by matrigel with 200 µm spacing.

72
Figure 3.8. Surface topography of intact and oxidized PAA-coated PDMS. Surface height profile of (A) intact and (B) oxidized PAA-coated PDMS measured by AFM (Area 10 µm x 10 µm). Surfaces do not show significantly different topographies between the intact and oxidized regions.

73
Figure 3.9. Soluble factors can be used to inhibit migration of MDA-MB-231 cells in the patterned hydrogel system. Fluorescent images of GL-expressing cells in the (A) absence and (B) presence of Latrunculin (50 µM) at day4. White dotted line represents initial cell area at day0. (C) Comparison of spread area at day 4 reveals that migration was significantly inhibited by the presence of latrunculin. Area at day4 was normalized by area at day0 (***p <0.001). Scale bar 1 mm.

74
Figure 3.10. Migration assay of CXCR4-CXCL12 (GL, CXCL12- a, and CXCL12-b) at day1 within a matrigel-supplemented collagen matrix with 500 µm spacing. Migration values are expressed as a mean ± standard deviation (n = 3 for GL, n = 3 for CXCL12-a, n = 3 for CXCL12-b). In contrast to similar experiments conducted with spacings of 250 µm, no significant differences in migration were observed between the three cell types (p > 0.35).

75
Figure 3.11. Varied simulation parameters to identify the different diffusion profiles for α and β isoforms of CXCL12. The combination of increased secretion rates and altered Kon and Koff values results in significantly accelerated diffusion profiles over 24 hours between CXCL12-α and CXCL12-β.

76
Figure 3.12. Multiplex gel patterning in air. (A) Stitched fluorescent image of multiple hydrogels in air encapsulating fluorescent beads having different pattern-to-pattern distances (200 µm, 300 µm, 400 µm, and 500 µm). Scale bar 500 µm.

77
3.6 References
1. Kay, R. R.; Langridge, P.; Traynor, D.; Hoeller, O., Changing directions in the study of chemotaxis. Nat. Rev. Mol. Cell Biol. 2008, 9, 455-463.
2. Weber, M.; Hauschild, R.; Schwarz, J.; Moussion, C.; de Vries, I.; Legler, D. F.; Luther, S. A.; Bollenbach, T.; Sixt, M., Interstitial dendritic cell guidance by haptotactic chemokine gradients. Science 2013, 339, 328-332.
3. Fleury, M. E.; Boardman, K. C.; Swartz, M. A., Autologous morphogen gradients by subtle interstitial flow and matrix interactions. Biophys. J. 2006, 91, 113-121.
4. Dona, E.; Barry, J. D.; Valentin, G.; Quirin, C.; Khmelinskii, A.; Kunze, A.; Durdu, S.; Newton, L. R.; Fernandez-Minan, A.; Huber, W., Directional tissue migration through a self-generated chemokine gradient. Nature 2013, 503, 285-89.
5. Torisawa, Y.-s.; Mosadegh, B.; Cavnar, S. P.; Ho, M.; Takayama, S., Transwells with microstamped membranes produce micropatterned two-dimensional and three-dimensional co-cultures. Tissue Eng. PartC 2010, 17, 61-67.
6. Aubin, H.; Nichol, J. W.; Hutson, C. B.; Bae, H.; Sieminski, A. L.; Cropek, D. M.; Akhyari, P.; Khademhosseini, A., Directed 3D cell alignment and elongation in microengineered hydrogels. Biomaterials 2010, 31, 6941-6951.
7. Tang, X.; Ali, M. Y.; Saif, M. T. A., A novel technique for micro-patterning proteins and cells on polyacrylamide gels. Soft matter 2012, 8, 7197-7206.
8. Nelson, C. M.; VanDuijn, M. M.; Inman, J. L.; Fletcher, D. A.; Bissell, M. J., Tissue geometry determines sites of mammary branching morphogenesis in organotypic cultures. Science 2006, 314, 298-300.
9. Lee, G. Y.; Kenny, P. A.; Lee, E. H.; Bissell, M. J., Three-dimensional culture models of normal and malignant breast epithelial cells. Nat. methods 2007, 4, 359-365.
10. He, J.; Mao, M.; Liu, Y.; Shao, J.; Jin, Z.; Li, D., Fabrication of Nature-inspired microfluidic network for perfusable tissue constructs. Adv. Healthc. Mater. 2013, 2, 1108-1113.
11. Zervantonakis, I. K.; Hughes-Alford, S. K.; Charest, J. L.; Condeelis, J. S.; Gertler, F. B.; Kamm, R. D., Three-dimensional microfluidic model for tumor cell intravasation and endothelial barrier function. Proc. Natl. Acad. Sci. USA 2012, 109, 13515-13520.
12. Mosadegh, B.; Huang, C.; Park, J. W.; Shin, H. S.; Chung, B. G.; Hwang, S.-K.; Lee, K.-H.; Kim, H. J.; Brody, J.; Jeon, N. L., Generation of stable complex gradients across two-dimensional surfaces and three-dimensional gels. Langmuir 2007, 23, 10910-10912.

78
13. Saadi, W.; Rhee, S. W.; Lin, F.; Vahidi, B.; Chung, B. G.; Jeon, N. L., Generation of stable concentration gradients in 2D and 3D environments using a microfluidic ladder chamber. Biomed. Microdevices 2007, 9, 627-635.
14. Wang, S.-J.; Saadi, W.; Lin, F.; Minh-Canh Nguyen, C.; Li Jeon, N., Differential effects of EGF gradient profiles on MDA-MB-231 breast cancer cell chemotaxis. Exp. Cell. Res. 2004, 300, 180-189.
15. Barkefors, I.; Le Jan, S.; Jakobsson, L.; Hejll, E.; Carlson, G.; Johansson, H.; Jarvius, J.; Park, J. W.; Jeon, N. L.; Kreuger, J., Endothelial cell migration in stable gradients of vascular endothelial growth factor A and fibroblast growth factor 2 effects on chemotaxis and chemokinesis. J. Biol. Chem. 2008, 283, 13905-13912.
16. Mosadegh, B.; Saadi, W.; Wang, S. Ä.; Jeon, N. L., Epidermal growth factor promotes breast cancer cell chemotaxis in CXCL12 gradients. Biotechnol. Bioeng. 2008, 100, 1205-1213.
17. Torisawa, Y.-s.; Mosadegh, B.; Bersano-Begey, T.; Steele, J. M.; Luker, K. E.; Luker, G. D.; Takayama, S., Microfluidic platform for chemotaxis in gradients formed by CXCL12 source-sink cells. Integr. Biol. 2010, 2, 680-686.
18. Cavnar, S.; Ray, P.; Moudgil, P.; Chang, S.; Luker, K.; Linderman, J.; Takayama, S.; Luker, G., Microfluidic source-sink model reveals effects of biophysically distinct CXCL12 isoforms in breast cancer chemotaxis. Integr. Biol. 2014, 6, 564-576.
19. Wylie, R. G.; Ahsan, S.; Aizawa, Y.; Maxwell, K. L.; Morshead, C. M.; Shoichet, M. S., Spatially controlled simultaneous patterning of multiple growth factors in three-dimensional hydrogels. Nat. Mater. 2011, 10, 799-806.
20. Hoffmann, J. C.; West, J. L., Three-dimensional photolithographic micropatterning: a novel tool to probe the complexities of cell migration. Integr. Biol. 2013, 5, 817-827.
21. Mosiewicz, K. A.; Kolb, L.; van der Vlies, A. J.; Martino, M. M.; Lienemann, P. S.; Hubbell, J. A.; Ehrbar, M.; Lutolf, M. P., In situ cell manipulation through enzymatic hydrogel photopatterning. Nat. Mater. 2013, 12, 1072-1078.
22. Odawara, A.; Gotoh, M.; Suzuki, I., Control of neural network patterning using collagen gel photothermal etching. Lab Chip 2013, 13, 2040-2046.
23. Pregibon, D. C.; Toner, M.; Doyle, P. S., Magnetically and biologically active bead-patterned hydrogels. Langmuir 2006, 22, 5122-5128.
24. Akselrod, G.; Timp, W.; Mirsaidov, U.; Zhao, Q.; Li, C.; Timp, R.; Timp, K.; Matsudaira, P.; Timp, G., Laser-guided assembly of heterotypic three-dimensional living cell microarrays. Biophys. J. 2006, 91, 3465-3473.

79
25. Mirsaidov, U.; Scrimgeour, J.; Timp, W.; Beck, K.; Mir, M.; Matsudaira, P.; Timp, G., Live cell lithography: using optical tweezers to create synthetic tissue. Lab Chip 2008, 8, 2174-2181.
26. Eng, G.; Lee, B. W.; Parsa, H.; Chin, C. D.; Schneider, J.; Linkov, G.; Sia, S. K.; Vunjak-Novakovic, G., Assembly of complex cell microenvironments using geometrically docked hydrogel shapes. Proc. Natl. Acad. Sci. USA 2013, 110, 4551-4556.
27. Khademhosseini, A.; Langer, R., Microengineered hydrogels for tissue engineering. Biomaterials 2007, 28, 5087-5092.
28. Bong, K. W.; Bong, K. T.; Pregibon, D. C.; Doyle, P. S., Hydrodynamic focusing lithography. Angew. Chem. 2010, 122, 91-94.
29. Song, J. W.; Cavnar, S. P.; Walker, A. C.; Luker, K. E.; Gupta, M.; Tung, Y.-C.; Luker, G. D.; Takayama, S., Microfluidic endothelium for studying the intravascular adhesion of metastatic breast cancer cells. PLoS ONE 2009, 4, e5756.
30. Fiddes, L. K.; Chan, H. K. C.; Lau, B.; Kumacheva, E.; Wheeler, A. R., Durable, region-specific protein patterning in microfluidic channels. Biomaterials 2010, 31, 315-320.
31. Simmons, C. S.; Ribeiro, A. J.; Pruitt, B. L., Formation of composite polyacrylamide and silicone substrates for independent control of stiffness and strain. Lab Chip 2013, 13, 646-649.
32. Kojima, T.; Takayama, S., Patchy Surfaces Stabilize Dextran-Polyethylene Glycol Aqueous Two-Phase System Liquid Patterns. Langmuir 2013, 29, 5508-5514.
33. Folch, A.; Toner, M., Cellular micropatterns on biocompatible materials. Biotechnol. Progr. 1998, 14, 388-392.
34. Raghavan, S.; Shen, C. J.; Desai, R. A.; Sniadecki, N. J.; Nelson, C. M.; Chen, C. S., Decoupling diffusional from dimensional control of signaling in 3D culture reveals a role for myosin in tubulogenesis. J. Cell Sci. 2010, 123, 2877-2883.
35. Laguri, C.; Sadir, R.; Rueda, P.; Baleux, F.; Gans, P., renzana-Seisdedos, F., and Lortat-Jacob, H.(2007) The novel CXCL12gamma isoform encodes an unstructured cationic domain which regulates bioactivity and interaction with both glycosaminoglycans and CXCR4. PLoS ONE 2, e1110.
36. Adamson, A. W.; Gast, A. P., Physical Chemistry of Surfaces. 6th ed.; John Wiley & Sons, Inc.: 1997.
37. Chiang, E. N.; Dong, R.; Ober, C. K.; Baird, B. A., Cellular responses to patterned poly (acrylic acid) brushes. Langmuir 2011, 27, 7016-7023.

80
38. Tavana, H.; Jovic, A.; Mosadegh, B.; Lee, Q.; Liu, X.; Luker, K.; Luker, G.; Weiss, S.; Takayama, S., Nanoliter liquid patterning in aqueous environments for spatially-defined reagent delivery to mammalian cells. Nat. Mater. 2009, 8, 736-741.
39. Lu, P.; Weaver, V. M.; Werb, Z., The extracellular matrix: a dynamic niche in cancer progression. J. Cell Biol. 2012, 196, 395-406.
40. Koninger, J.; Giese, T.; di Mola, F. F.; Wente, M. N.; Esposito, I.; Bachem, M. G.; Giese, N. A.; Buchler, M. W.; Friess, H., Pancreatic tumor cells influence the composition of the extracellular matrix. Biochem. Biophys. Res. Commun. 2004, 322, 943-949.
41. Sasisekharan, R.; Shriver, Z.; Venkataraman, G.; Narayanasami, U., Roles of heparan-sulphate glycosaminoglycans in cancer. Nat. Rev. Cancer 2002, 2, 521-528.
42. Okolicsanyi, R. K.; van Wijnen, A. J.; Cool, S. M.; Stein, G. S.; Griffiths, L. R.; Haupt, L. M., Heparan sulfate proteoglycans and human breast cancer epithelial cell tumorigenicity. J. Cell. Biochem. 2013, 115, 967-76.
43. Kreuger, J.; Salmivirta, M.; Sturiale, L.; Gimenez-Gallego, G.; Lindahl, U., Sequence analysis of heparan sulfate epitopes with graded affinities for fibroblast growth factors 1 and 2. J. Biol. Chem. 2001, 276, 30744-30752.
44. Sadir, R.; Imberty, A.; Baleux, F. ß.; Lortat-Jacob, H., Heparan sulfate/heparin oligosaccharides protect stromal cell-derived factor-1 (SDF-1)/CXCL12 against proteolysis induced by CD26/dipeptidyl peptidase IV. J. Biol. Chem. 2004, 279, 43854-43860.
45. Dambly-Chaudiere, C.; Cubedo, N.; Ghysen, A., Control of cell migration in the development of the posterior lateral line: antagonistic interactions between the chemokine receptors CXCR4 and CXCR7/RDC1. BMC Dev. Biol. 2007, 7, 23.
46. Luhmann, T.; Hall, H., Cell guidance by 3D-gradients in hydrogel matrices: importance for biomedical applications. Materials 2009, 2, 1058-1083.
47. Luhmann, T.; Hanseler, P.; Grant, B.; Hall, H., The induction of cell alignment by covalently immobilized gradients of the 6th Ig-like domain of cell adhesion molecule L1 in 3D-fibrin matrices. Biomaterials 2009, 30, 4503-4512.
48. DeLong, S. A.; Moon, J. J.; West, J. L., Covalently immobilized gradients of bFGF on hydrogel scaffolds for directed cell migration. Biomaterials 2005, 26, 3227-3234.
49. Seidi, A.; Ramalingam, M.; Elloumi-Hannachi, I.; Ostrovidov, S.; Khademhosseini, A., Gradient biomaterials for soft-to-hard interface tissue engineering. Acta Biomater 2011, 7, 1441-1451.
50. Raghavan, S.; Nelson, C. M.; Baranski, J. D.; Lim, E.; Chen, C. S., Geometrically controlled endothelial tubulogenesis in micropatterned gels. Tissue Engineering PartA 2010, 16, 2255-2263.

81
51. Staton, C. A.; Reed, M. W.; Brown, N. J., A critical analysis of current in vitro and in vivo angiogenesis assays. Int. J. Exp. Pathol. 2009, 90, 195-221.
52. Sung, S.-Y.; Hsieh, C.-L.; Wu, D.; Chung, L. W.; Johnstone, P. A., Tumor microenvironment promotes cancer progression, metastasis, and therapeutic resistance. Curr. Prob. Cancer 2007, 31, 36-100.
53. Bhowmick, N. A.; Neilson, E. G.; Moses, H. L., Stromal fibroblasts in cancer initiation and progression. Nature 2004, 432, 332-337.

82
Chapter 4
Microscale Determination of Aqueous Two-Phase System Binodals by Droplet Dehydration
in Oil
This chapter analyzes the use of a dehydrating oil system to determine binodal curves of aqueous
two phase system (ATPS). Aqueous droplets containing phase-forming polymers are dehydrated
at the interface between two immiscible oils. The droplets shrink due to diffusion of water into
the oil phase while constantly maintaining a spherical shape. Upon sufficient dehydration, dilute
one-phase solutions of phase-forming polymers separate into two phases. Comparison of the
droplet diameter at this phase separation point and at the beginning allows facile calculation of
the concentration of polymers that determine the binodal curve. The miniaturized droplet
dehydration-based binodals obtained in this manner matched the binodals determined by the
conventional diluting method but using several orders of magnitude less sample volume (150 nL
droplets versus 10 mL vials).

83
4.1 Introduction
An aqueous two-phase system (ATPS) is composed of two immiscible polymer-based solutions,
which forms two distinct aqueous phases. It is widely developed as a macroscale molecular
separation technique.1 Recently, it has been utilized for microscale applications such as reagent,2
cell,3 micelle,4-6 microbubble,7 microdroplet,8 and bacteria micropatterning,9 as well as for
studies as a proto-cell model.10, 11 ATPSs can enhance chemical12, 13 and biological14, 15 reactions
by compartmentalizing molecules into one of the two phases. Having the phase diagram (binodal)
of the two polymers in ATPSs is critical for handling and understanding ATPSs. The
conventional method for determining the binodal of different ATPSs is to start with a
concentrated 2-phase solution, and then to dilute it gradually until the phase boundary disappears
(Scheme 4.1a). Generally, this requires large amounts of samples (on the order of grams of
polymer).16
This work describes a different approach where small amounts of dilute 1-phase solutions
are concentrated until 2-phases form. We validate the technique using commonly used polymer-
polymer ATPSs as well as an uncommon protein-polymer ATPS. Previous work has shown that
some organic oils like soybean oil with water-trapping groups can extract and entrap small
amounts of water from water-in-oil droplets containing solutes, leading to concentration of the
solutes.17 A series of quantitative analyses of dehydration of aqueous microdroplets in soybean
oil have been developed.18-20 A recent study has demonstrated reversible phase transitions of
microdroplets in PEG-DEX system.21 We hypothesize that dilute, single phase solutions of
ATPS-forming polymers can be dehydrated and concentrated in soybean oil to induce dynamic
phase separation and allow determination of the binodal using small amounts of materials.
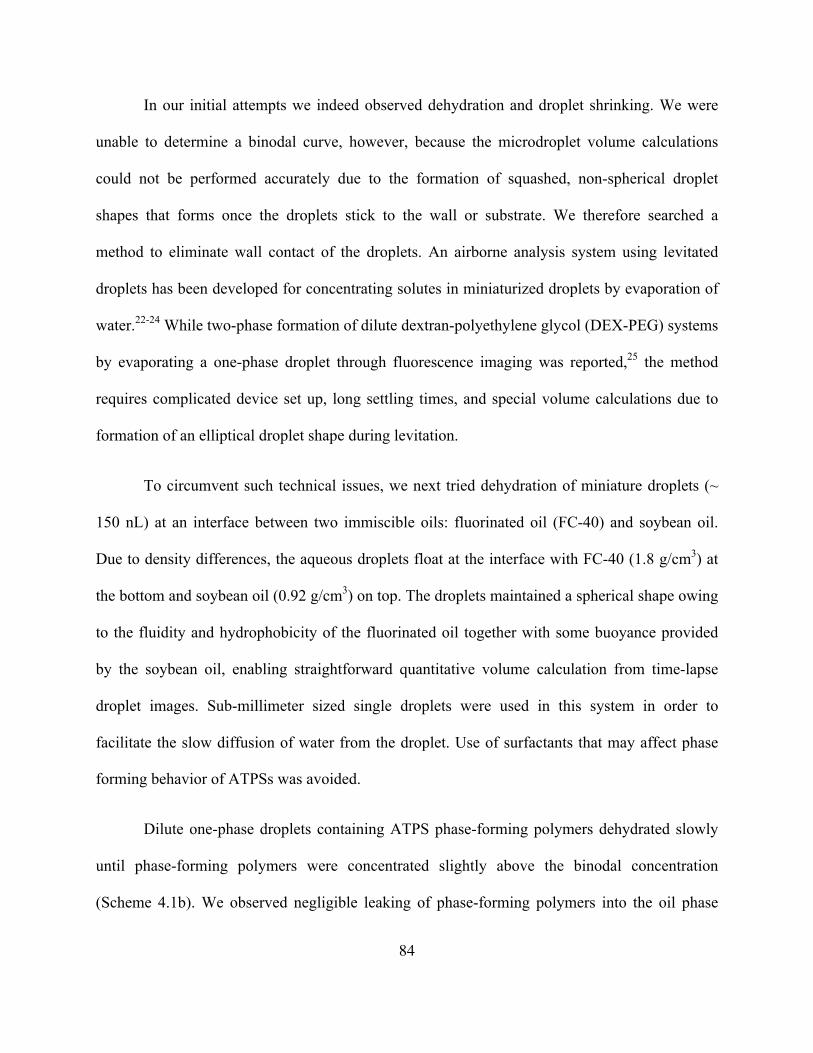
84
In our initial attempts we indeed observed dehydration and droplet shrinking. We were
unable to determine a binodal curve, however, because the microdroplet volume calculations
could not be performed accurately due to the formation of squashed, non-spherical droplet
shapes that forms once the droplets stick to the wall or substrate. We therefore searched a
method to eliminate wall contact of the droplets. An airborne analysis system using levitated
droplets has been developed for concentrating solutes in miniaturized droplets by evaporation of
water.22-24 While two-phase formation of dilute dextran-polyethylene glycol (DEX-PEG) systems
by evaporating a one-phase droplet through fluorescence imaging was reported,25 the method
requires complicated device set up, long settling times, and special volume calculations due to
formation of an elliptical droplet shape during levitation.
To circumvent such technical issues, we next tried dehydration of miniature droplets (~
150 nL) at an interface between two immiscible oils: fluorinated oil (FC-40) and soybean oil.
Due to density differences, the aqueous droplets float at the interface with FC-40 (1.8 g/cm3) at
the bottom and soybean oil (0.92 g/cm3) on top. The droplets maintained a spherical shape owing
to the fluidity and hydrophobicity of the fluorinated oil together with some buoyance provided
by the soybean oil, enabling straightforward quantitative volume calculation from time-lapse
droplet images. Sub-millimeter sized single droplets were used in this system in order to
facilitate the slow diffusion of water from the droplet. Use of surfactants that may affect phase
forming behavior of ATPSs was avoided.
Dilute one-phase droplets containing ATPS phase-forming polymers dehydrated slowly
until phase-forming polymers were concentrated slightly above the binodal concentration
(Scheme 4.1b). We observed negligible leaking of phase-forming polymers into the oil phase

85
because of their charged or polar nature. We used the microscale droplet dehydration method to
determine bionodal curves from one-phase solutions of PEG-DEX, DEX-polyvinyl alcohol
(PVA), PEG-PVA, and bovine serum albumin (BSA)-PEG systems. The method was validated
by comparison with binodal curves obtained by the conventional macroscale diluting method.
4.2 Materials and Methods
Experimental Section
Materials
All chemicals and reagents were purchased from commercial sources: Fluorinert FC-40, soybean
oil, Mw 10,000 and 500,000 DEX, Mw 8,000 and 35,000 PEG, and Mw 105,000 PVA were
from Sigma-Aldrich; Mw 66,000 BSA was from Millipore; Mw 10,000 and 40,000 rhodamine B
(RB)-PEG were from Nanocs; Mw 10,000 and 500,000 fluorescein isothiocyanate (FITC)-DEX
were from TdB Consultancy; 35 mm x 10 mm disposable petri dish was from Fisher Scientific;
phosphate-buffered saline (PBS) buffer solution (pH 7.4) was from GE Health Care.
Characterization
2.5 mL FC-40 and 3 mL soybean oil were poured into a petri dish. A droplet (~ 150 nL) was
released by a micropipette at FC-40-soybean oil interface. All measurements were conducted at
room temperature (25 °C). The initial volume of the droplet volume used in this work was one-
order of magnitude smaller (~ 150 nL) than the maximum volume soybean oil can absorb; 3 µL
of water can diffuse into 3 mL soybean oil in theory.

86
Contact Angle Measurement
Contact angles of PBS droplets in soybean oil on petri dish surface or FC-40-soybean oil
interface were measured by the sessile drop technique and analyzed with ImageJ. Three sets of
measurements were averaged.
Time-lapse Droplet Shrinking
PBS droplets at FC-40-soybean oil interface were continuously monitored. The cross section of
the droplet viewed from the bottom was measured using an optical microscope (Nikon Eclipse
TE 2000-U) and analyzed by ImageJ. Three sets of measurements were averaged.
Determination of ATPS Binodal Curve
40 w/w % 10k DEX, 20 w/w % 500k DEX, 50 w/w % 10k PEG, 20 w/w % 35k PEG, 20 w/w %
PVA, and 20 w/w % BSA dissolved in PBS solution were used as stock solutions. In the diluting
method, various solutions of phase-forming polymers (2 g in total) were diluted by PBS solution
down to binodal points where phase boundary disappears after a 3000 rpm x 20 min
centrifugation (Scheme 4.2a). Those points were fitted with the previously reported method26
using R. In the dehydrating method, the binodal solutions were further diluted (~ 2 times) and an
aliquot of the solutions (~ 150 nL) mixed with 0.001 w/w % FITC-DEX and/or RB-PEG was
dispensed at FC-40-soybean oil interface and dehydrated through the aforementioned protocol
(Scheme 4.2b). The binodal points were determined when phase separation became visually
apparent. Images were taken by an optical microscope in the fluorescence imaging mode and
analyzed by ImageJ.
Characterization of Dehydration of ATPS Droplets

87
The PEG-DEX binodal solutions prepared with the aforementioned dilution method were diluted
10, 20, 50, and 100 times. The binodal compositions were determined when phase separation
became visually apparent. Images were taken by an optical microscope in the fluorescence
imaging mode and analyzed by ImageJ.
Theoretical Section
We assume the diffusion of water in FC-40 is negligible due to low water solubility (<
0.0007 %v/v at 25 °C) compared to that of soybean oil (0.3 %v/v at 25 °C). As Baipayee et al.
previously described, we adopt a pseudo-steady-state mass diffusion model with radial symmetry
of PBS droplet shrinking. The rate of change of area, A, is given by:
dAdt
= −8πMwDw,o(Csat −Cref )
ρw (1)
Where Mw is the molecular weight of water, Dw,o is the diffusion coefficient of water in soybean
oil, ρw is the density of water, and Csat and Cref are the saturation concentration of water in oil
and the concentration far away from the droplet, respectively. The volume as a function of time
(t) is given by:
V = (Kt +V023 )
32 (2)
Where V0 is the initial volume and K is a constant given by,
K = −1289
⎛
⎝⎜
⎞
⎠⎟
13π23 MwDw,oCsat
ρw
⎛
⎝⎜
⎞
⎠⎟ (3)

88
It should be noted that it is very difficult to theoretically predict the shrinking rate and
concentration of droplets that include water-soluble polymers because of deviations due to water
sorption to those polymers. As we are focusing on the binodal concentration, we can simply
calculate concentration as:
Mb =V0Vb
⎛
⎝⎜
⎞
⎠⎟Mi (4)
Where Mi and Mb are the initial and binodal concentration and Vb is the volume when the
concentration reaches binodal concentration.
4.3 Results and Discussion
Figure 4.1 shows the results of the contact angle measurement of PBS droplets in soybean oil on
a dish surface and at an FC-40-soybean oil interface. The sub-millimeter sized droplets sank to
the bottom of the soybean oil layer within 1 min after releasing from a micropipette. The droplet
at the FC-40-soybean oil interface retains its spherical shape while the droplet released in
soybean oil spreads on the dish surface as expected. The difference in droplet shape likely arises
from the hydrophobic and fluid nature of the FC-40 surface. Importantly, the constant spherical
shape allows facile calculation of the surface area and volume change from the cross sectional
image of the droplet as shown in Scheme 4.1.
The surface area and volume of droplets of PBS solutions decreased over time due to the
diffusion of water into the soybean oil phase as shown in Figure 4.2. We confirmed the diffusion
of water in the sub-millimeter sized droplets followed a pseudo-steady-state mass diffusion

89
model during our measurement time scale (eq 1 and eq 2). Although the diffusion of water from
a sub-millimeter sized droplet of PBS solution in soybean oil was about 1 µm2/s, the same order
as a pure water droplet in soybean oil (5 µm2/s from ref 17), the rate of change in solute
concentration was five-orders of magnitude lower than the microdroplets due to the smaller
surface-to-volume ratio. We take advantage of this slow shrinking for determination of binodal
in ATPSs that requires quantitative volume change calculation from the initial droplet state to the
binodal droplet state.
Figure 4.3 shows ATPS phase formation upon dehydration of a 10k DEX – 8 k PEG
system. The solution was homogeneous below the binodal concentration (Figure 4.3a, c, and e).
However, two phases started to form once the concentration in the droplet approached the
binodal concentration (Figure 4.3b, d, and f). Since we assume only water diffuses into soybean
oil phase while other molecules retain in the droplet, we can calculate the binodal concentrations
from the images of droplets (eq 4). We defined the binodal state where the phase morphology
changed from the initial phase morphology (Figure 4.8a) upon dehydration (Figure 4.8b and c).
We confirmed accurate volume calculations up to 50 times condensation. Dehydration of
the droplets above 50 times condensation requires the droplets shrink down from sub-millimeter
to tens of micron. Although increases in concentration of over 1000 times are theoretically
plausible, the very small droplets that will need to be observed change concentrations so rapidly
that accurate binodal concentration determination becomes difficult. In practical implementations,
one often already knows the approximate binodal curve (e.g. for characterizing different batches
of known ATPS forming polymers). Even for unknown polymer combinations, one or two

90
approximate point along the binodal curve can be roughly measured first before a full binodal
curve determination.
Low Mw and high Mw PEG-DEX systems were validated as shown in Figure 4.4. The
uncertainty of this dehydrating method in determining the binodal curve is shown for low Mw
PEG-DEX system in Figure 4.9. Not unexpectedly, the binodal points were slightly above the
binodal curve determined by the diluting method. The true binodal curve is expected to be
between these two types of binodal curves determined. We also observed that the phase
morphology of the droplets far above binodal points differed depending on the polymer
composition (Figure 4.10). This robustness of forming ATPSs across different concentrations of
polymers shows that the dehydrating method is applicable for use in determining the binodal all
along the binodal curve and for various low Mw to high Mw PEG-DEX combinations. Although
we observed the binodal states using both phase contrast and fluorescent images for confirmation
purposes, the binodal states can be determined from phase contrast images alone (Figure 4.3d).
We next validated other ATPSs as shown in Figure 4.5. The binodal points determined by
phase contrast images agreed well with the binodal curves determined by the diluting method in
both DEX-PVA and PEG-PVA systems (Figure 4.13d and e). It indicates that this dehydrating
method is applicable to a wide range of ATPSs that use different synthetic polymers. We also
tested if this method is applicable to expensive molecules like natural proteins. Thus, we next
tested 66 k BSA – 35 k PEG system as shown in Figure 4.6. The binodal points agreed well with
the binodal curve obtained with conventional methods. We observed no conspicuous leaking of
BSA during our measurement time frame (~ 12 hours) and confirmed binodal states by both

91
phase contrast and fluorescent images (Figure 4.13f and 4.14). This result suggests that the
microscale dehydrating method is effective for polymer-protein ATPS systems as well.
The total amount of proteins used in the microscale dehydration method for binodal
determination is remarkably small (µg) compared to the conventional diluting method (g). Thus,
this method opens the ability to explore the suitability, as phase forming polymers, of a variety of
natural proteins, synthetic peptides, or nucleic acids that are usually limited and expensive.
4.4 Conclusions
We demonstrate a novel method for the determination of binodals of ATPSs using quantitative
analysis of dehydration of aqueous solution droplets in soybean oil. Water-soluble phase-forming
molecules in ATPSs typically have charges or polar groups, allowing them to be retained in the
aqueous rather than oil phase. Slow rate of diffusion of water with a constant spherical shape at
an FC-40-soybean oil interface allows easy volume change calculation over time and provides
quantitative determination of binodals. Although we utilized fluorescently labeled polymers in
some of the demonstrations, binodals are readily determined without fluorescent-tagged phase-
forming molecules in all cases studied. This method is envisioned to be particularly versatile for
analysis of ATPSs where the amounts of samples are limited (~ µg) and the diluting method,
which requires large amounts of the samples (g), cannot be used. The slow dehydration rate and
small droplet volumes is advantageous for careful observation of the phase separation
phenomenon close to the binodal as the process requires a certain amount of settling time for the
phases to separate.

92
Scheme 4.1. Determination of binodal curves by dilution and concentration: a) the conventional diluting technique defines the binodal point when an interface disappears (Point D) by diluting the concentrated two-phase solution (Point A). In contrast, b) the dehydrating technique defines the binodal point as the point at which two phases starts forming (Point D’) by dehydrating the dilute one-phase solution (Point E).

93
Scheme 4.2. Schematic image of droplet shrinking in soybean oil on: a) a petri dish surface, or b) an FC-40 oil surface.

94
Figure 4.1. Shapes of droplets of PBS solution in soybean oil on a) dish substrate and b) FC-40.

95
Figure 4.2. Time-lapse droplet shrinking of a PBS solution. a) The surface area of the droplets decreased linearly as a function of time. b) The volume of the droplets decreased exponentially as a function of time. Eq 1 (a) and eq 2 (b) were fitted into the plots (dotted line). Measurements were conducted at 25 °C. Scale bar 100 µm.

96
Figure 4.3. Phase separation at the binodal point of a 10k DEX - 8k PEG system induced by dehydration of water. The phase contrast images and magnified images at concentrations below the binodal point (a and c) and at the binodal point (b and d). Fluorescent images of DEX below the binodal point (e) and at the binodal point (f) are also shown. Measurements were conducted at 25 °C. Scale bar 100 µm.

97
Figure 4.4. Binodal points (closed square) in DEX-PEG system determined by the dehydrating method: a) 500k DEX – 35k PEG and b) 10k DEX – 8k PEG. The binodal curves (dotted curve line) determined by the diluting method (Figure 4.7). Measurements were conducted at 25 °C.

98
Figure 4.5. Binodal points (closed square) in DEX-PVA system and PEG-PVA system determined by the dehydrating method: a) 500k DEX – 105k PVA and b) 35k PEG – 105k PVA. The binodal curve (dotted curve line) determined by the diluting method (Figure 4.11). Measurements were conducted at 25 °C.

99
Figure 4.6. Binodal points (closed square) in 66k BSA – 35k PEG system determined by the dehydrating method. The binodal curve (dotted curve line) determined by the diluting method (Figure 4.12). Measurements were conducted at 25 °C.

100
Figure 4.7. Binodal points (open circle) in DEX-PEG system determined by the diluting technique: a) 500k DEX – 35k PEG and b) 10k DEX – 8k PEG. Those points were fitted (see ref 25) to obtain a binodal curve (dotted curve line). Measurements were conducted at 25 °C.

101
Figure 4.8. Time-lapse droplet images in 10k DEX – 8k PEG system determined by the dehydrating technique: a) before Binodal, b-c) on binodal, and d) completed phase separation. Phase contrast images (top) and merged fluorescent images (bottom) of DEX (green) and PEG (red). Measurements were conducted at 25 °C. Scale bar 50 µm.

102
Figure 4.9. The uncertainty of binodal points in 10k DEX – 8k PEG system determined by the dehydrating technique: three independent measurements (open square, diamond, and circle). Binodal curves determined by the dehydrating technique (solid line) and diluting technique (dotted line). Measurements were conducted at 25 °C.

103
Figure 4.10. Binodal points (closed square) for a 500k DEX – 35k PEG system determined by the dehydrating technique. Various initial concentrations of 1-phase DEX-PEG solution (open square) were tested. The merged fluorescent images of DEX (green) and PEG (red) after 24 hours of dehydration far above the critical points. Measurements were conducted at 25 °C.

104
Figure 4.11. Binodal points (open circle) and fitted binodal curves (dotted curve line) in DEX-PVA system and PEG-PVA system determined by the diluting technique: a) 500k DEX – 105k PVA and b) 35k PEG – 105k PVA. Measurements were conducted at 25 °C.

105
Figure 4.12. Binodal points (open circules) and fitted binodal curves (dotted curve line) in 66k BSA – 35k PEG system determined by the diluting technique. Measurements were conducted at 25 °C.

106
Figure 4.13. Magnified phase contrast images of droplets below and at binodal point. Droplets in 500k DEX – 105k PVA, 35k PEG – 105k PVA, and 66k BSA – 35k PEG systems below binodal point (a, b, and c), and at binodal point (d, e, and f), respectively. Measurements were conducted at 25 °C. Scale bar 50 µm.

107
Figure 4.14. Phase separation at binodal point in 66k BSA - 35k PEG system induced by dehydration of water. The phase contrast images, fluorescent images of BSA and PEG at below binodal point (a, c, and e) and at binodal point (b, d, and f), respectively. The merged fluorescent images of BSA (green) and PEG (red) below binodal point (g) and at binodal point (h). Measurements were conducted at 25 °C. Scale bar 100 µm.

108
4.5 References
1. Albertsson, P.-A., Partition of Cell Particles and Macromolecules. 3rd ed.; John Wiley & Sons, Inc.: 1986.
2. Tavana, H.; Jovic, A.; Mosadegh, B.; Lee, Q.; Liu, X.; Luker, K.; Luker, G.; Weiss, S.; Takayama, S., Nanoliter Liquid Patterning in Aqueous Environments for Spatially-Defined Reagent Delivery to Mammalian Cells. Nat. Mater. 2009, 8, 736-741.
3. Tavana, H.; Mosadegh, B.; Takayama, S., Polymeric Aqueous Biphasic Systems for Non-Contact Cell Printing on Cells: Engineering Heterocellular Embryonic Stem Cell Niches. Adv. Mater. 2010, 22, 2628-2631.
4. Kamei, D. T.; Wang, D. I.; Blankschtein, D., Fundamental Investigation of Protein Partitioning in Two-Phase Aqueous Mixed (nonionic/ionic) Micellar Systems. Langmuir 2002, 18, 3047-3057.
5. Mashayekhi, F.; Meyer, A. S.; Shiigi, S. A.; Nguyen, V.; Kamei, D. T., Concentration of Mammalian Genomic DNA using Two-Phase Aqueous Micellar Systems. Biotechnol. Bioeng. 2009, 102, 1613-1623.
6. Mashayekhi, F.; Chiu, R. Y.; Le, A. M.; Chao, F. C.; Wu, B. M.; Kamei, D. T., Enhancing the Lateral-Flow Immunoassay for Viral Detection using an Aqueous Two-Phase Micellar System. Anal. Bioanal. Chem. 2010, 398, 2955-2961.
7. Frampton, J. P.; Fan, Z.; Simon, A.; Chen, D.; Deng, C. X.; Takayama, S., Aqueous Two-Phase System Patterning of Microbubbles: Localized Induction of Apoptosis in Sonoporated Cells. Adv. Funct. Mater. 2013, 23, 3420-3431.
8. Hardt, S.; Hahn, T., Microfluidics with Aqueous Two-Phase Systems. Lab Chip 2012, 12, 434-442.
9. Byun, C. K.; Hwang, H.; Choi, W. S.; Yaguchi, T.; Park, J.; Kim, D.; Mitchell, R. J.; Kim, T.; Cho, Y.-K.; Takayama, S., Productive Chemical Interaction between a Bacterial Microcolony Couple is Enhanced by Periodic Relocation. J. Am. Chem. Soc. 2013, 135, 2242-2247.
10. Keating, C. D., Aqueous Phase Separation as a Possible Route to Compartmentalization of Biological Molecules. Acc. Chem. Res. 2012, 45, 2114-2124.
11. Koga, S.; Williams, D. S.; Perriman, A. W.; Mann, S., Peptide-Nucleotide Microdroplets as a Step towards a Membrane-Free Protocell Model. Nat. Chem. 2011, 3, 720-724.
12. Cacace, D.; Keating, C. D., Biocatalyzed Mineralization in an Aqueous Two-Phase System: Effect of Background Polymers and Enzyme Partitioning. J. Mater. Chem. B 2013, 1, 1794-1803.

109
13. Crosby, J.; Treadwell, T.; Hammerton, M.; Vasilakis, K.; Crump, M. P.; Williams, D. S.; Mann, S., Stabilization and Enhanced Reactivity of Actinorhodin Polyketide Synthase Minimal Complex in Polymer-Nucleotide Coacervate Droplets. Chem. Commun. 2012, 48, 11832-11834.
14. Strulson, C. A.; Molden, R. C.; Keating, C. D.; Bevilacqua, P. C., RNA Catalysis through Compartmentalization. Nat. Chem. 2012, 4, 941-946.
15. Li, P.; Banjade, S.; Cheng, H.-C.; Kim, S.; Chen, B.; Guo, L.; Llaguno, M.; Hollingsworth, J. V.; King, D. S.; Banani, S. F., Phase Transitions in the Assembly of Multivalent Signalling Proteins. Nature 2012, 483, 336-340.
16. Mace, C. R.; Akbulut, O.; Kumar, A. A.; Shapiro, N. D.; Derda, R.; Patton, M. R.; Whitesides, G. M., Aqueous Multiphase Systems of Polymers and Surfactants Provide Self-Assembling Step-Gradients in Density. J. Am. Chem. Soc. 2012, 134, 9094-9097.
17. He, M.; Sun, C.; Chiu, D. T., Concentrating Solutes and Nanoparticles within Individual Aqueous Microdroplets. Anal. Chem. 2004, 76, 1222-1227.
18. Bajpayee, A.; Edd, J. F.; Chang, A.; Toner, M., Concentration of Glycerol in Aqueous Microdroplets by Selective Removal of Water. Anal. Chem. 2010, 82, 1288-1291.
19. Eslami, F.; Elliott, J. A., Design of Microdrop Concentrating Processes. J. Phys. Chem. B 2013, 117, 2205-2214.
20. Wu, T.; Hirata, K.; Suzuki, H.; Xiang, R.; Tang, Z.; Yomo, T., Shrunk to Femtolitre: Tuning High-Throughput Monodisperse Water-in-Oil Droplet Arrays for Ultra-Small Micro-Reactors. Appl. Phys. Lett. 2012, 101, 074108.
21. Boreyko, J. B.; Mruetusatorn, P.; Retterer, S. T.; Collier, C. P., Aqueous Two-Phase Microdroplets with Reversible Phase Transitions. Lab Chip 2013, 13, 1295-1301.
22. Santesson, S.; Johansson, J.; Taylor, L. S.; Levander, I.; Fox, S.; Sepaniak, M.; Nilsson, S., Airborne Chemistry Coupled to Raman Spectroscopy. Anal. Chem. 2003, 75, 2177-2180.
23. Santesson, S.; Cedergren-Zeppezauer, E. S.; Johansson, T.; Laurell, T.; Nilsson, J.; Nilsson, S., Screening of Nucleation Conditions using Levitated Drops for Protein Crystallization. Anal. Chem. 2003, 75, 1733-1740.
24. Santesson, S.; Andersson, M.; Degerman, E.; Johansson, T.; Nilsson, J.; Nilsson, S., Airborne Cell Analysis. Anal. Chem. 2000, 72, 3412-3418.
25. Santesson, S.; Ramirez, I. B.-R.; Viberg, P.; Jergil, B.; Nilsson, S., Affinity Two-Phase Partitioning in Acoustically Levitated Drops. Anal. Chem. 2004, 76, 303-308.
26. Merchuk, J. C.; Andrews, B. A.; Asenjo, J. A., Aqueous Two-Phase Systems for Protein Separation: Studies on Phase Inversion. J. Chromatogr., B: Anal. Technol. Biomed. Life Sci. 1998, 711, 285-293.

110
Chapter 5
Shrinking Microdroplets Assists Metamorphoses of The Nanoparticle Assemblies
This chapter demonstrates self-assembly of cadmium telluride nanoparticles (CdTe NPs) in the
shrinking microenvironment described in Chapter 4. Terminal assemblies of nanoparticles are
particularly convenient for controlling the size and morphology of these superstructures. As most
techniques for controlling NP assembly have focused upon altering particle properties in static
bulk solutions, little attention has been paid to the alternation of micro-scale NP environment.
Here we report and characterize the spontaneous assembly of CdTe NPs within an aqueous
micro-droplet suspended in oil. The gradual diffusion of the aqueous solution into the
surrounding oil medium results in an overall shrinking of the microdroplet, and a concomitant
agglomeration of NPs into branched assemblies that evolve in size from ~50 µm to ~1000 µm.
Here, the fractal dimension of NP assemblies increases from ~1.7 to ~1.9 through dentritic
evolution. High surface-to-volume ratio of the microdroplet can efficiently absorb soybean oil
constituents and assist the dentritic evolution. The obtained NP dendrites can be further altered
morphologically by illumination with ambient light, resulting in their disassembly. The use of
this platform for the study of NP aggregation sheds light on the role of NP environment and
presents a unique opportunity to explore NP assembly along with chemical modification.

111
5.1 Introduction
Processes underlying the self-assembly of nanoparticles (NPs) can yield complex superstructures
comprised of semiconductor or metallic materials. 1, 2 Since the process is governed by inter-
particle attraction and repulsion,3, 4 these superstructures can be tailored by manipulating the
attractive and repulsive interactions. Modification of particle properties has been vigorously
studied for the manipulation of NP assemblies.5, 6 The formulation of surface stabilizers, and the
ratio of surface stabilizer to NPs, for example, can affect these interactions and the nature of the
resulting structures.7 Semiconductor NPs have received much attention in particular for being
central to flexible electronics and green energy devices. CdTe NPs were shown to form
assemblies with an exceptional variety of geometrical forms ranging from nanowires8 and sheets9,
to twisted helices10 depending upon the surface properties of the NPs. The manipulation of
assembly based on NP surface properties has less structural flexibility once assembled in static
bulk conditions and requires laborious NP synthesis every time the surface properties need to be
modified.
Meanwhile, alternation of the micro-scale environment can also affect the resulting
assemblies. Recent studies have also reported on techniques triggering self-assembly of
semiconductor NPs at liquid-liquid11-14 or air-substrate15-20 interfaces. Interestingly,
superstructures with highly branched21-23 and hedgehog-like24 morphologies obtained at these
interfaces revealed chemical and optical properties distinct from those recorded by more
traditional methods of assembly. Despite their advantages, these techniques often require the
careful control of experimental conditions, and yield assemblies that remain structurally
heterogeneous. The semiconductor materials with highly branched dentritic architecture are

112
expected to have larger surface area to collect the light and thus more efficient photo-harvesting
and photo-catalytic properties.22, 25-27 Given their morphology strongly affects their properties
and colloidal stability, improved yet simple structural control is needed.
Here, we describe adaptation of a slow and steady droplet dehydration system comprised
of aqueous droplets suspended in certain oils28-30 for the self-assembly of CdTe NPs controlled
by the liquid-liquid microenvironment. Our approach, requiring no external control of the
dehydration process, is simple and can easily be adapted for specific types of NPs. As a
preliminary demonstration of this method, water droplets containing CdTe NPs were placed in an
oil ‘bath’ where the droplets underwent a steady dehydration that resulted in the formation of
complex NP assemblies. We have observed dramatic changes in the morphology of NP
assemblies under different conditions, and have compared these assemblies to those produced by
similar processes in bulk. We characterize the structural and chemical properties of NPs,
simulate the NPs assembly in a droplet dehydrating condition, and alter the droplet environment
to trigger metamorphoses of the NPs assemblies.
5.2 Materials and Methods
Materials
All materials were purchased from commercial sources. Fluorinert FC-40, soybean oil,
hexadecane, deionized water, MeOH, NaOH, HCl, NaCl, thioglycolic acid (TGA) were from
Sigma-Aldrich; 35 mm x 10 mm disposable petri dishes were from Fisher Scientific; Grids with
ultra thin carbon film on holey carbon film support for transmission electron microscope (TEM)

113
measurement were from Ted Pella; Si wafers for atomic force microscope (AFM) and scanning
electron microscope (SEM) measurements were from University Wafer; Plain glass microscope
slides for confocal microscope measurement were from Corning; Al2Te3 was from CERAC Inc.
Preparation of CdTe NPs
An aqueous dispersion of CdTe NPs stabilized with TGA (TGA / Cd2+ = 1.2) was synthesized as
previously reported.31, 32 The orange-ish NP dispersion with a luminescence peak around 550 nm
was obtained. 100 µL of the CdTe NPs dispersion was precipitated by 100 µL of MeOH and
centrifuged for 30 min at 10,000 rpm. CdTe precipitates were resuspended in DI-water at pH 9
(titrated by addition of NaOH) at a final concentration around ~10 nM. 2.5 mL FC-40 and 3 mL
soybean oil (dehydrating oil) or hexadecane (inert oil) were poured into a petri dish. A droplet of
the CdTe NPs solution (~ 150 nL) was released by a micropipette at FC-40-soybean oil interface
or FC-40-hexadecane interface in the petri dish. The CdTe bulk solution and the water droplet
containing CdTe NPs were incubated at the room temperature (25 °C) under dark environment
for the following characterization.
Time-lapse microscopy of droplet shrinking
The water droplet containing CdTe NPs at FC-40-soybean oil or FC-40-hexadecane interface
was continuously monitored. The cross section of the droplet viewed from the bottom was
measured using an optical microscope (TE-300, Nikon) and analyzed by ImageJ. Three sets of

114
measurements were averaged and expressed as a mean ± standard deviation. The rate of change
of area, A, is given by Equation 1:
dAdt
= −8πMwDw,o(Csat −Cref )
ρw (1)
Where Mw is the molecular weight of water, Dw,o is the diffusion coefficient of water in soybean
oil, ρw is the density of water, and Csat and Cref are the saturation concentration of water in oil
and the concentration far away from the droplet, respectively. Detailed explanation can be found
elsewhere.28, 29
The droplet maintains spherical shape at FC40-soybean oil interface and thus we can estimate the
volume of the droplet from the optical image. We can simply calculate concentration as:
M f =V0Vf
⎛
⎝⎜⎜
⎞
⎠⎟⎟Mi (2)
Where Mi and Mf are the initial and final concentration and Vf is the volume when the shrinking
rate is significantly reduced at Day-3.
Computational modeling of NP concentration gradient formation during dehydration
The COMSOL multiphysics software package (v 5.1) was used to investigate and model regional
changes in NP concentration within the water droplet as a function of incubation time at the FC-
40-soybean oil interface. Simulated distribution data was generated and analyzed for the time
period ranging from 0 to 72 hours.

115
The fractal dimension of CdTe assemblies
The fractal dimensions were obtained by BoneJ (a free imageJ plugin) based on box-counting
method33 from the representative SEM images of the CdTe assemblies. Three sets of images
were averaged with standard deviation.
Characterization of CdTe assemblies
The bulk solution and water droplets containing CdTe NPs at FC-40-soybean oil interface or FC-
40-hexadecane interface were incubated under dark condition for 1-7 days and cast onto
substrates for AFM, confocal microscope, SEM, and TEM imaging.
AFM measurement
CdTe NPs assemblies at Day-3 cast onto Si wafers were imaged by AFM (Dimension Icon,
Veeco) in ScanAsyst mode and the images were processed by Nanoscope (Veeco).
SEM and EDX measurement
CdTe NPs assemblies at Day-1-7 cast onto Si wafers were analyzed by SEM (Nova 200
NanoLab, FEI) operated at 5-15 kV and the images were processed by ImageJ. Au deposition
was carried out prior to SEM imaging in order to increase phase contrast. For EDX measurement,
the CdTe assemblies were imaged and EDX spectra were collected without Au deposition. The
EDX spectra were analyzed by NOVA software.

116
TEM measurement
CdTe NPs assemblies at Day-3 cast onto TEM grids were imaged by TEM (JEOL 3011)
operated at 300kV including electron diffraction in the selected area and the images were
processed by ImageJ.
Confocal measurement
CdTe NPs assemblies at t = 0 and Day-3 cast onto glass slides were scanned by a confocal
microscope (Nikon-A1, Nikon) with 480 nm excitation wavelength and 540 nm emission
wavelength. Fluorescent spectra at the area of interest were collected by Lambda scanning with
480 nm excitation wavelength. For in situ droplet measurement, the water droplet in soybean oil
placed on the glass substrate (25 mm petridish with a glass slide on the bottom specialized for
confocal imaging) was continuously monitored and fluorescent spectra were collected by
Lambda scanning until Day-3.
External alternation of the NP microenrionment
Bulk NP assembly with soybean oil-derived additives
DI-water and soybean oil (water : oil = 4:1 and 1:4) were vigorously mixed and incubated for
phase separation over night. The water-phase was collected and used for the CdTe NPs
resuspension. DI-water solutions with glycerol (0.1 v/v%) or linoleic acid (0.1 v/v%) were used
for the NPs resuspension. The CdTe assemblies at Day-3 in the soluitons were imaged by SEM.
Compaction of CdTe assemblies by adding salts

117
The CdTe bulk solution was prepared with 500 mM NaCl solution (pH 9.0) and the droplets
from the bulk solution were incubated at FC-40-soybean oil interface and characterized by SEM.
De-assembly of CdTe assemblies by irradiating light
The droplets contacting CdTe NPs were exposed to the ambient light at Day-3 for 24 hours.
Additionally, the droplets were incubated at FC-40-soybean oil interface over 5 days when the
ambient light irradiated at Day-0, 2, 3, or 4. The assemblies were analyzed by SEM.
5.3 Results and Discussion
5.3.1 Dentritic NPs assemblies
Water droplets containing CdTe NPs shrink from dehydration at FC-40-soybean oil interface as a
function of time at a constant rate (1.4 µm2 / s) until t = 72 hours (Figure 5.1). The shrinking rate
is dramatically reduced (0.051 µm2 / s) after t = 72 hours. SEM images reveal a distinct evolution
of the CdTe NP assemblies over time (Figure 5.2). The NPs in the droplets evolve from compact
structures (compact dendrites) into extended and branched structures (extended dendrites) over
the course of three days (Figure 5.2A-C), while a majority of the NPs in the bulk solution form
the compact dendrites during the same three-day period (Figure 5.2E and F). The approximate
fractal dimension of the extended dentritic structures illustrate higher dimension (D = 1.9±0.04)
compared to the compact dentritic structures (D = 1.7±0.08). The extended dentritic structures
remain stably after Day-3, in a manner that coincides with the steep reduction of the shrinking
rate (Figure 5.2D). Meanwhile the NPs structure in the bulk solution shows no significant
morphological change throughout the experiment period (Figure 5.2G). We hypothesize that the

118
CdTe NPs complete the assembly at Day-3 and, as reported previously (ref 28-30), the resulting
structures inhibit the flux of water molecules at the droplet interface. Note that, as previously
reported (ref 10), the straight ribbons of the NPs in the bulk solution were observed when
increasing the NPs concentration up to 100-fold (Figure 5.9A). However, the high initial
concentration gave rise to random aggregation of the NPs in droplets at Day-3 (Figure 5.9B).
The concentration producing the straight ribbons may be too high for the dehydration system.
5.3.2 Concentration of NPs in the microdroplet
Simulation of the time-lapse concentration change of NPs in the droplet by COMSOL confirm
that the homogeneous distribution of NPs within the droplet at t = 0 (Figure 5.12A), verified
experimentally (Figure 5.15A), and the gradual concentration of particles over 72 hours (Figure
5.12B-C). After 72 hours, the NPs are predicted to completely occupy the droplet periphery
(Figure 5.12C). These observations are consistent with the in situ droplet imaging data (Figure
5.15B) and with the time point when droplet dehydration rate significantly dropped after 72
hours (Figure 5.1). In contrast, the simulation in hexadecane shows the homogeneous
distribution of NPs over 72 hours (Figure 5.13C). Given those results, we assumed at first that
the dentritic evolution was attributed to the increased CdTe NPs concentration due to
dehydration. We estimated the final concentration from the droplet image and it was about eight
times higher than the initial concentration (see Methods). To prove this assumption, the NPs
solution was adjusted to the higher concentration and the NPs droplet incubated at an FC-40-
hexadecane interface; the shrinking rate is 0.10 µm2 / s, one order of magnitude slower than the
shrinking rate for droplets in soybean oil (Fig 5.1: open circle). The NPs assemblies formed in

119
droplets dispersed in hexadecane mostly formed the compact dendrites (Figure 5.2H and I). The
result indicates that the dentritic evolution depends on the shrinking microenvironment rate
rather than solely on increased NP concentration.
5.3.3 Structural characterization of compact and extended CdTe dendrites
To understand the basis of these NPs assemblies, we characterized the assemblies by AFM, TEM,
EDX, and confocal imaging. AFM images reveal that the compact dendrites are ~10 µm in size
with ~1 µm height (Figure 5.3A) while the extended dendrites have ~10 µm core and mm-scale
branches with ~1 µm height (Figure 5.3B). TEM images of the dentritic structures show that the
compact and extended dendrites are composed of CdTe and CdS where the lattice spacing for
assembled NPs was 0.38 nm (CdTe) and 0.34 nm (CdS), respectively (Figure 5.4). Selected-area
electron diffraction (SAED) patterns of the dendrites demonstrate the presence of characteristic
diffraction patterns for both CdTe (111) (d = 0.74 nm) and (220) (d = 0.45 nm), and CdS (111)
(d = 0.66 nm) and (200) (d = 0.57 nm) planes. It should be noted that Te oxidation occurs in dark
environments and completes within 24 hours in the bulk solution, as previously reported (ref 10).
The exchange of Te and S from TGA would occur as Te oxidation proceeds. EDX data show that
the compact and extended dendrites are a mixture of CdTe and CdS where Cd : Te : S is 45 : 28 :
27 for the compact dendrite and 42 : 40 : 18 for the extended dendrites, respectively (Figure 5.5
and Figure 5.10). The data suggest that the compact dentritic assemblies have nearly the same
amount of Te and S whereas the dendrites have different amounts of the two chemical species.
The observed differential amount of Te and S can be explained by the fact that the total amount

120
of oxygen in the droplet solution is smaller than the amount in the bulk solution, which may
prevents Te oxidation during the dentritic evolution.
5.3.4 Optical characterization of compact and extended CdTe dendrites
In addition to the structural differences between the compact and extended dendrites, confocal
laser scanning microscopy and UV/VIS spectroscopy reveal distinct optical properties. The
assemblies in bulk and in the droplet individually retain the fluorescence (Figure 5.6). The
fluorescence spectrum of the extended dendrites exhibits a distinct blue shift (lem = 515 nm),
whereas the spectrum of the compact dendrite shows a slight red shift (lem = 555 nm) compared
to the as-prepared CdTe solution (lem = 550 nm) (Figure 5.11A). The previously reported NP
dentritic structures showed only red shift (ref 22 and 23) and, to the best of our knowledge, this
is the first observation of blue shifts in dentritic structures. Given that the compact dendrite that
has nearly equal amount to CdTe and CdS shows no blue shift, the different amounts of CdTe
and CdS along with the radially elongated assembly of the NPs may increase the interparticle
distance and weaken the electronic coupling among NPs, thus leading to the blue shift.
Additionally, we conducted in situ droplet imaging through Day-3 in soybean oil. At t = 0, the
droplet shows homogeneously distributed brightness, indicating that the CdTe NPs are well
dispersed (Figure 5.15A). Some structures appear and gradually grow in the droplet after Day-1
(Figure 5.15B). The fluorescent spectrum of the droplet exhibits significant blue shift after Day-1
(Figure 5.11B). The observed morphology change in the droplet coincident with the blue shift
after Day-1 is consistent with the observed dentritic evolution of the NPs in the droplet in
121
soybean oil. In contrast, such optical properties were not confirmed in the bulk NPs solution by
UV/Vis spectroscopy (Figure 5.11C).
5.3.5 Constituents of soybean oil transferred in a droplet affecting CdTe self-assembly
The nonadditivity of van der Waals attraction, electrostatic repulsion, hydrophobicity, and other
interactions controls collective behavior of NPs.34 We hypothesized that the nonadditivity might
somehow change upon dehydration where some constituents of soybean oil involve the transition
from compact to extended dendrites and performed bulk NPs assembly using water containing
soybean oil-derived constituents (Figure 5.7). The NPs assemblies collected in the water phase of
water-soybean oil mixtures (water : oil = 1:4 and 4:1) formed dendrites with residual oil spots
and extended as the oil proportion increased (Figure 5.7A and B). These data imply that oil
constituents transferred into the water phase may assist formation of extended dendrites. Next,
glycerol and linoleic acid, the main constituents of soybean oil, were added to DI-water and
incubated with the NPs. Interestingly, linoleic acid-containing solutions (0.1 v/v%) gave
transitional dendrites while glycerol-containing solutions (0.1 v/v%) resulted in dispersed NP
aggregates (Figure 5.7D and E). We assume that impurities such as dissolved fatty acids from
soybean oil may attach on the NP surface, hinder particle interactions by steric hindrance, and
help extension of the compact dendrites. We also observed that the dispersed microdroplets of
the oil or fatty acid in the water-phase limits uniform dentritic formation due to oil contamination.
We note that the shrinking microdroplet environment gradually increases the surface-to-volume
ratio that can facilitate the impurity absorption from soybean oil while minimizing oil
contamination and produce larger dendrites in contrast to the bulk water/oil mixture system.

122
5.3.6 Influence of interparticle interaction on CdTe self-assembly
Interparticle interaction is a key element that governs overall morphology of NP assembly and
alternation of the micro-scale NPs assembly environment can also affect the interaction. To study
the effect of the parameters on assembly, we hypothesize that (1) increased ionic strength may
reduce the interparticle repulsion – thereby shrinking the assembled NP structures; and (2) that
ambient light can alter the interparticle attraction by triggering photo-oxidation of the NP surface
during NP evolution. To change the interplay between NPs, we (1) added salts or (2) irradiated
the droplets with ambient light during NP evolution. SEM images in the presence of NaCl
illustrate compact assemblies in bulk and in droplets (Figure 5.8A). This result confirms that the
increased ionic strength triggered the shrinkage of the assemblies. Meanwhile, we irradiated with
ambient light at different time points (Figure 5.8B). We observed degradation of the dentritic
structures regardless of the timing when the irradiation was performed (Figure 5.14). We
hypothesize that ambient light causes surface oxidation of the NPs, which results in loss of the
TGA stabilizers, a concomitant increase in interparticle repulsion, and the ultimate disassembly
of structures. These findings together confirm that interparticle interaction parameters altered by
the NPs assembly environment influence NP evolution and dynamically change their
morphology.
5.4 Conclusions
In this work, soybean oil-mediated slow and continuous dehydration of CdTe NP-containing
droplets transformed compact dendrites into extended dendrites at Day-3. The dentritic structure
retained after Day-3 and showed uniform distribution. The dendrites have different chemical

123
properties and distinct optical properties compared with the NP assemblies in the bulk solution.
The dynamic morphological change of the CdTe assemblies appears to rely on a delicate balance
of interparticle interactions that evolve over time. Dissolved constituents of soybean oil in the
microdroplet may increase the interparticle repulsion and helps the dentritic evolution. Increasing
interparticle interactions by increasing ionic strength caused compaction of the assemblies
whereas reducing interparticle attraction by irradiation with light triggered NP dis-assembly. The
data demonstrate that the micro-scale NP environment can alter the NPs assembly patterns
without laborious particle modification. The experimental set up is simple and should be
adaptable for modulating the self-assembly of a large range of semiconductive NPs. The
semiconductive dendrites with high fractal dimension and large surface-area have potential as
light-harvesting materials. Metamorphoses of such NPs can be similarly examined while a
further study is necessary to utilize the assembled structures in droplets in photo-harvesting
application.

124
Figure 5.1. Time-lapse droplet shrinking of a DI-water solution containing CdTe. The droplets were monitored over 7 days in soybean oil (closed circle) and hexadecane (open circle), respectively. Equation 1 was fitted into the plots (dotted line). Scale bar 100 µm.

125
Figure 5.2. SEM images of CdTe assemblies. The droplets containing CdTe in soybean oil at (A) Day-1, (B) Day-2, (C) Day-3, and (D) Day-7. The bulk solution of CdTe at (E) Day-2, (F) Day-3, and (G) Day-7. The droplet containing CdTe in hexadecane at (H) Day-3 and (I) Day-5. Scale bar 10 µm.

126
Figure 5.3. AFM image of (A) the compact dendrite (15 µm x 15 µm) and (B) the extended dendrite (40 µm x 40 µm). Scale bar (A) 5 µm and (B) 10 µm.

127
Figure 5.4. TEM image of the CdTe assemblies collected at Day-3. The representative image of CdTe assembly (A) in bulk and (B) in droplets, (C) the lattice image of the extended dendrite, (D) the lattice distance of CdTe, (E) the lattice distance of CdS, and (F) SAED of the extended dendrite. Scale bar (A) and (B) 100 nm, and (C) 1 nm.

128
Figure 5.5. EDX image of (A) the compact dendrite and (B) the extended dendrite collected at Day-3. Scale bar 10 µm.

129
Figure 5.6. Confocal microscopy images of the (A) the compact dendrite and (B) the extended dendrite collected at Day-3. Scale bar 10 µm.

130
Figure 5.7. SEM images of the NPs assemblies at Day-3 with soybean oil constituents. The NPs assemblies collected from the water phase of water and soybean oil mixtures: water : oil = (A) 4 : 1 and (B) 1 : 4. The NPs assemblies collected from 0.1% glycerol and 0.1% linoleic acid. Scale bar 10 µm.
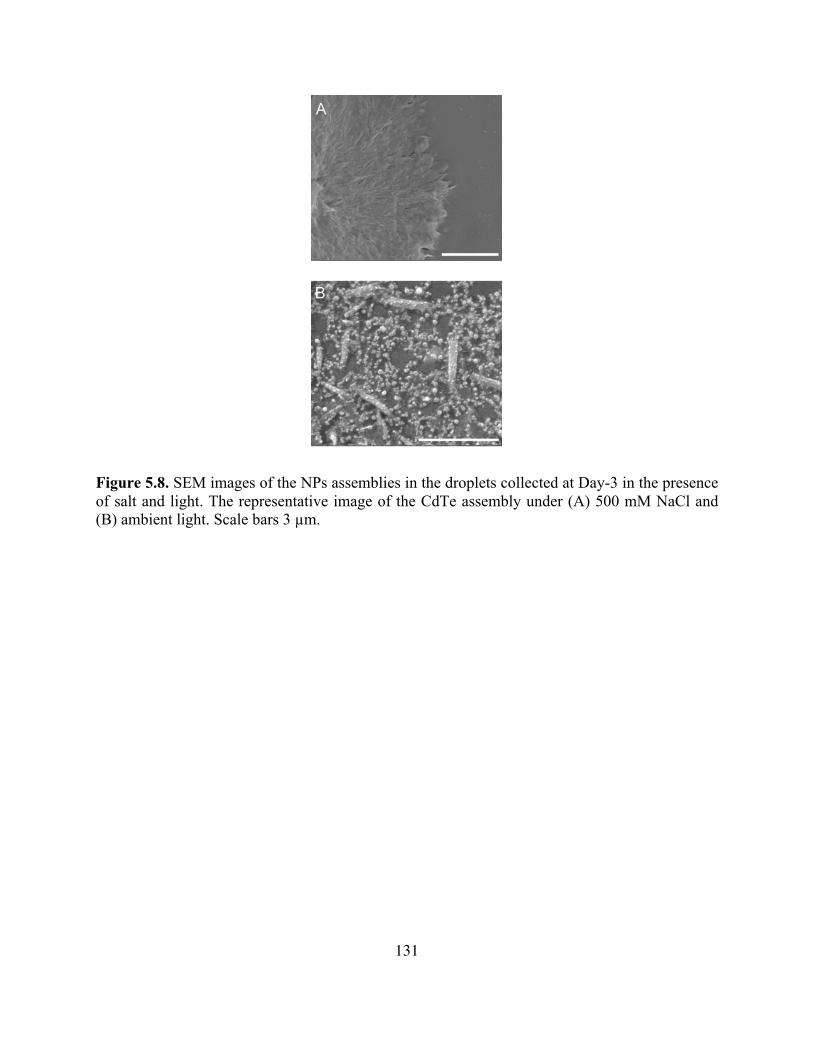
131
Figure 5.8. SEM images of the NPs assemblies in the droplets collected at Day-3 in the presence of salt and light. The representative image of the CdTe assembly under (A) 500 mM NaCl and (B) ambient light. Scale bars 3 µm.

132
Figure 5.9. SEM image of the CdTe assemblies prepared by the 100-fold high concentration: (A) bulk and (B) droplet solution at Day-3. Scale bar 5 µm.

133
Figure 5.10. EDX data of the CdTe assemblies collected at Day-3. (A) the compact dendrite and (B) the extended dendrite.

134
Figure 5.11. Fluorescent spectra of the CdTe assembled structures. (A) Lambda scanned spectra of the compact and extended dentritic structures collected at Day-3. Fluorescent spectra of (B) the droplet solution and (C) the bulk solution over three days.

135
Figure 5.12. A computational model of droplet dehydration in soybean oil at (A) t = 0, (B) t = 24 hrs, (C) t = 72 hrs.

136
Figure 5.13. A computational model of droplet dehydration in hexadecane at (A) t = 0, (B) t = 24 hrs, (C) t = 72 hrs.

137
Figure 5.14. SEM images of the NPs droplets irradiated at different time points over 5 days. (A) irradiated at Day-4, (B) irradiated at Day-3, (C) irradiated at Day-2, and (D) irradiated at Day-0. Scale bar 5 µm.

138
Figure 5.15. Reconfigured 3D z-stack images of the CdTe droplets dehydrated on a glass surface at (A) t = 0 and (B) t = Day-3. Scale bar 100 µm.

139
5.5 References
1. Nie, Z.; Petukhova, A.; Kumacheva, E., Properties and Emerging Applications of Self-Assembled Structures Made from Inorganic Nanoparticles. Nat. Nanotechnol. 2009, 5, 15-25.
2. Grzelczak, M.; Vermant, J.; Furst, E. M.; Liz-Marzán, L. M., Directed Self-Assembly of Nanoparticles. ACS Nano 2010, 4, 3591-3605.
3. Whitesides, G. M.; Grzybowski, B., Self-Assembly at All Scales. Science 2002, 295, 2418-2421.
4. Whitesides, G. M.; Boncheva, M., Beyond Molecules: Self-Assembly of Mesoscopic and Macroscopic Components. Proc. Natl. Acad. Sci. U. S. A. 2002, 99, 4769-4774.
5. Park, S. Y.; Lytton-Jean, A. K.; Lee, B.; Weigand, S.; Schatz, G. C.; Mirkin, C. A., DNA-Programmable Nanoparticle Crystallization. Nature 2008, 451, 553-556.
6. Kovalenko, M. V.; Scheele, M.; Talapin, D. V., Colloidal Nanocrystals with Molecular Metal Chalcogenide Surface Ligands. Science 2009, 324, 1417-1420.
7. Yaroslavov, A. A.; Sinani, V. A.; Efimova, A. A.; Yaroslavova, E. G.; Rakhnyanskaya, A. A.; Ermakov, Y. A.; Kotov, N. A., What is The Effective Charge of TGA-Stabilized CdTe Nanocolloids? J. Am. Chem. Soc. 2005, 127, 7322-7323.
8. Tang, Z.; Kotov, N. A.; Giersig, M., Spontaneous Organization of Single CdTe Nanoparticles into Luminescent Nanowires. Science 2002, 297, 237-240.
9. Tang, Z.; Zhang, Z.; Wang, Y.; Glotzer, S. C.; Kotov, N. A., Self-Assembly of CdTe Nanocrystals into Free-Floating Sheets. Science 2006, 314, 274-278.
10. Srivastava, S.; Santos, A.; Critchley, K.; Kim, K.-S.; Podsiadlo, P.; Sun, K.; Lee, J.; Xu, C.; Lilly, G. D.; Glotzer, S. C., Light-Controlled Self-Assembly of Semiconductor Nanoparticles into Twisted Ribbons. Science 2010, 327, 1355-1359.
11. Lin, Y.; Böker, A.; Skaff, H.; Cookson, D.; Dinsmore, A.; Emrick, T.; Russell, T. P., Nanoparticle Assembly at Fluid Interfaces: Structure and Dynamics. Langmuir 2005, 21, 191-194.
12. Lin, Y.; Skaff, H.; Emrick, T.; Dinsmore, A.; Russell, T., Nanoparticle Assembly and Transport at Liquid-Liquid Interfaces. Science 2003, 299, 226-229.
13. Duan, H.; Wang, D.; Kurth, D. G.; Möhwald, H., Directing Self-Assembly of Nanoparticles at Water/Oil Interfaces. Angew. Chem. Int. Ed. 2004, 43, 5639-5642.
14. Böker, A.; He, J.; Emrick, T.; Russell, T. P., Self-Assembly of Nanoparticles at Interfaces. Soft Matter 2007, 3, 1231-1248.

140
15. Brinker, C. J.; Lu, Y.; Sellinger, A.; Fan, H., Evaporation-Induced Self-Assembly: Nanostructures Made Easy. Adv. Mater. 1999, 11, 579-585.
16. Bigioni, T. P.; Lin, X.-M.; Nguyen, T. T.; Corwin, E. I.; Witten, T. A.; Jaeger, H. M., Kinetically Driven Self Assembly of Highly Ordered Nanoparticle Monolayers. Nat. Mater. 2006, 5, 265-270.
17. Chokprasombat, K.; Sirisathitkul, C.; Ratphonsan, P., Liquid-Air Interface Self-Assembly: A Facile Method to Fabricate Long-Range Nanoparticle Monolayers. Surf. Sci. 2014, 621, 162-167.
18. Pietra, F.; Rabouw, F. T.; Evers, W. H.; Byelov, D. V.; Petukhov, A. V.; Donegá, C. d. M.; Vanmaekelbergh, D., Semiconductor Nanorod Self-Assembly at The Liquid/Air Interface Studied by in situ GISAXS and ex situ TEM. Nano Lett. 2012, 12, 5515-5523.
19. Rabani, E.; Reichman, D. R.; Geissler, P. L.; Brus, L. E., Drying-Mediated Self-Assembly of Nanoparticles. Nature 2003, 426, 271-274.
20. Corno, J. A.; Stout, J.; Yang, R.; Gole, J. L., Diffusion-Controlled Self-Assembly and Dendrite Formation in Silver-Seeded Anatase Titania Nanospheres. J. Phys. Chem. C 2008, 112, 5439-5446.
21. Dong, W.; Li, X.; Shang, L.; Zheng, Y.; Wang, G.; Li, C., Controlled Synthesis and Self-Assembly of Dendrite Patterns of Fe3O4 Nanoparticles. Nanotechnology 2009, 20, 035601.
22. Sukhanova, A.; Baranov, A. V.; Perova, T. S.; Cohen, J. H.; Nabiev, I., Controlled Self-Assembly of Nanocrystals into Polycrystalline Fluorescent Dendrites with Energy-Transfer Properties. Angew. Chem. Int. Ed. 2006, 45, 2048-2052.
23. Sun, H.; Wei, H.; Zhang, H.; Ning, Y.; Tang, Y.; Zhai, F.; Yang, B., Self-Assembly of CdTe Nanoparticles into Dendrite Structure: A Microsensor to Hg2+. Langmuir 2010, 27, 1136-1142.
24. Bahng, J. H.; Yeom, B.; Wang, Y.; Tung, S. O.; Hoff, J. D.; Kotov, N., Anomalous Dispersions of "Hedgehog" Particles. Nature 2015, 517, 596-599.
25. Klar, T. A.; Franzl, T.; Rogach, A. L.; Feldmann, J., Super-Efficient Exciton Funneling in Layer-by-Layer Semiconductor Nanocrystal Structures. Adv. Mater. 2005, 17, 769-773.
26. Wargnier, R.; Baranov, A. V.; Maslov, V. G.; Stsiapura, V.; Artemyev, M.; Pluot, M.; Sukhanova, A.; Nabiev, I., Energy Transfer in Aqueous Solutions of Oppositely Charged CdSe/ZnS Core/Shell Quantum Dots and in Quantum Dot-Nanogold Assemblies. Nano Lett. 2004, 4, 451-457.
27. Li, J.; Cheng, Z.; Liu, M.; Zhang, M.; Hu, M.; Zhang, L.; Jiang, H.; Li, J., Electrospun Dendritic ZnO Nanofibers and Its Photocatalysis Application. J. Appl. Polym. Sci. 2015, 132.

141
28. Kojima, T.; Takayama, S., Microscale Determination of Aqueous Two Phase System Binodals by Droplet Dehydration in Oil. Anal. Chem. 2013, 85, 5213-5218.
29. He, M.; Sun, C.; Chiu, D. T., Concentrating Solutes and Nanoparticles within Individual Aqueous Microdroplets. Anal. Chem. 2004, 76, 1222-1227.
30. Bajpayee, A.; Edd, J. F.; Chang, A.; Toner, M., Concentration of Glycerol in Aqueous Microdroplets by Selective Removal of Water. Anal. Chem. 2010, 82, 1288-1291.
31. Rajh, T.; Micic, O. I.; Nozik, A. J., Synthesis and Characterization of Surface-Modified Colloidal Cadmium Telluride Quantum Dots. J. Phys. Chem. 1993, 97, 11999-12003.
32. Rogach, A.; Katsikas, L.; Kornowski, A.; Su, D.; Eychmüller, A.; Weller, H., Synthesis and Characterization of Thiol-Stabilized CdTe Nanocrystals. Ber. Bunsen-Ges. Phys. Chem. 1996, 100, 1772-1778.
33. Doube, M.; Ktosowski, M.; Arganda-Carreras, I.; Cordelières, F. P.; Dougherty, R. P.; Jackson, J. S.; Schmid, B.; Hutchinson, J. R.; Shefelbine, S. J., BoneJ: Free and Extensible Bone Image Analysis in ImageJ. Bone 2010, 47, 1076-1079.
34. Batista, C. A. S.; Larson, R. G.; Kotov, N. A., Nonadditivity of Nanoparticle Interactions. Science 2015, 350, 1242477.

142
Chapter 6
Spatio-temporally Regulated Enzyme Reactions in Membrane-Free Compartments
Formed in An Aqueous Three Phase System
Spatio-temporal compartmentalization of molecules and bioreactions is an important features of
cellular systems. While membrane-bounded multi-compartment bioreaction models are common,
much less work has explored the use of membrane-free multi-compartment systems. Given the
potential paucity of membrane forming and reorganizing molecules and mechanisms in the
primordial soup, formation of membrane-free multi-compartments and exploration of their use in
bioreactions and compartment reorganization may provide an alternative mechanism for the
evolution of primitive cells. Membrane-free multi-compartments may also have practical
applications in biosensing and reactions.
This chapter describes stable membrane-free multi-compartmentalization utilizing an
aqueous three phase system that combines a complex coacervate with a commonly used
polymeric aqueous two-phase system (ATPS). We hypothesized that complex coacervates made
of negatively charged adenosine triphosphate (ATP) and positively charged
poly(diallyldimethylammonium chloride) (PDDA) will form additional compartments within an
ATPS comprised of dextran (DEX) and polyethylene glycol (PEG) leading to formation of an
aqueous three phase system. Indeed, such systems efficiently formed stable, all-aqueous multi-
compartment systems. Importantly, the ATP-PDDA coacervates were able to stably partition a
variety of proteins and molecules within the aqueous three phase system. Furthermore, such
molecules “trapped” within different coacervate compartments could be merged by physical

143
relocation or the contents released on demand by changing the ionic strength (addition of salts),
which “dissolves” the coacervate phase. In both cases, the manipulations allow cascade reactions
to occur across originally separated compartments. Alternatively, treatment of the multi-
compartment aqueous three phase system with dextranase degraded the DEX phase leaving a
multi-compartment coacervate-PEG two phase system. While the demonstrations are simple and
not necessarily focused on ingredients from the primordial soup, we believe the spatio-temporal
regulation of reactions in non-membrane bounded multi-compartment systems are interesting
and warrant further investigation.

144
6.1 Introduction
The minimal living cell (protocell), a proposed precursor of modern cells, is described as a
single-compartment construct.1 While a single compartment can collect molecules to maintain
minimal cell activities, multi-compartment systems are important in regulating complex
biological processes with controlled timing and at desired locations.2 Models to emulate
protocell functions with a single compartment can be categorized into two types: membrane-
bounded3-6 and membrane-free7-9 constructs. In nature, eukaryotes10 and prokaryotes,11-13 a
variety of membrane-bounded and membrane-free microcompartments are known.
Recently, several studies14-17 describe synthetic membrane-bounded multi-compartment
systems capable of performing inter-compartment enzymatic cascade reactions. These artificial
microcompartments have great potentials as novel micro-reactors that package biomaterials for
therapeutic applications18 as well as perform multi-step enzymatic reactions.19 Such constructs,
however, have limitations in spatiotemporal control of reactions due to lack of compartment
localization and fusion capabilities. The compartment localization, dissociation, and fusion
capabilities are the core characteristics of the protocells.
In this work, we describe stable membrane-free multi-compartmentalization through a
hybrid platform of ATP-PDDA complex coacervation and DEX-PEG aqueous two-phase system
(ATPS). While DEX-PEG ATPS20, 21 and ATP-PDDA complex coacervation22, 23 have each been
separately demonstrated as single-compartment protocell models, a system that combines the two
types of system into one has not been utilized. Importantly, the resulting aqueous three phase
system can be reduced to a two phase system of DEX-PEG, by addition of salt, or of coacervate-
PEG by addition of dextranase triggering different reactions to occur across compartments.
145
First we evaluate the structural stability and molecular retention of the ATP-PDDA
coacervates in PEG-DEX system and ionic strength-mediated release of coacervate-encapsulated
substances into the DEX phase. Next we perform a two-enzyme cascade reaction that occurs
with substrate transport across compartments. Spatiotemporal control could also be performed
where reactions are triggered by coacervate coalescence. Another way reactions can be triggered
is to disintegrate compartmentalization by enzymatically degrading DEX. This is, to our
knowledge, the first demonstration of membrane-free multi-compartmentalization. Our robust
membrane-free system recapitulates multi-compartmentalization and provides a unique reactor
platform to explore spatiotemporal enzymatic reactions.
6.2 Materials and Methods
Dextran (Mw 500000), polyethylene glycol (Mw 35000), horse radish peroxidase (150 units/mg),
GOx (15 units/mg), dextranase (10 units/mg), fluorescein isothiocyanate, rhodamine B
isothiocyanate, Ampliflu Red, 2,2’-azino-bis(3-ethylbenzothiazoline-6-sulfonic acid)
diammonium salt, 3,3’-diaminobenzidine, MES, MOPS, NaOH, Pur-A-Lyzer Maxi dialysis kit
(Mwco 12000) were from Sigma-Aldrich. FITC-DEX (Mw 500000) was from TdB Consultancy
AB. Food colorings (blue, green, red, and yellow) were from ESCO Foods. 35 mm plastic dishes
with glass bottoms (No.0) were from MatTek Corp. 24-wll plates with flat bottom were from
Corning.
6.2.1 Preparation of ATP-PDDA coacervate and DEX-PEG ATPS

146
ATP (20 mM, pH 6, MES), PDDA (20 mM, pH 6, MES), and loading materials were mixed and
centrifuged at 5,000 rpm for 5 min. The supernatant was removed, and the remaining coacervate-
rich phase was kept at 4 °C and used within 1 day after preparation. Fixed formulation of an
ATPS was used: DEX (10 w/w%, 500 kDa) and PEG (10 w/w%, 35 kDa).
6.2.2 Printing and degrading of ATP-PDDA coacervates in DEX-PEG ATPS
1 µL of food coloring (red, yellow, green, and blue) was premixed in the preparation of
coacervates. 50 µL of DEX solution (10 w/w%, pH 6, MES) was placed on a plastic 24-well
plate (Corning Coaster) and 0.5 µL of the coacervate-rich phase was dispensed into the DEX
droplet. 500 µL of PEG solution (10 w/w%, pH 6, MES) or PEG-NaCl solution (10 w/w%, 250
mM NaCl, pH 6, MES) was added to the DEX solution for retention and release of the food
colorings, respectively. Time-lapse images were collected with a stereoscope (C-DSD115, Nikon)
at t = 0, 24, and 72 hrs for the retention measurement and at t = 0 - 35 min (every minute) and at
t = 1200 min for the release measurement.
6.2.3 Confocal imaging of ATP-PDDA coacervates in DEX-PEG ATPS
Rhodamine B at a final concentration of 1 µM was premixed during the preparation of
coacervates. 50 µL DEX droplet (10 w/w%, MES, pH 6) containing 1 mg/ml FITC-DEX was
placed in a glass-bottom dish (MatTek) and 0.5 µL of the coacervates was dropped off into the
DEX droplet. 500 µL of PEG solution was added to the dish right before the imaging.
Fluorescent Z-stack images were taken (Nikon-A1, Nikon) and processed by ImageJ (NIH).

147
6.2.4 Two-enzyme cascade reaction using ATPS-Complex Coacervate system
HRP (final concentration 0.1 mg/ml, pH 6, MES) and ABTS (final concentration 1 mg/ml, pH 6,
MES), DAB (final concentration 1 mg/ml, DMSO), οPD (final concentration 1mg/ml, DMSO)
or Ampliflu Red (final concentration 1 mg/ml, DMSO) were premixed in the preparation of the
coacervates, respectively. DEX solution (10 w/w%, pH 6, MES) containing GOx (final
concentration 0.1 mg/ml, pH 6, MES) was placed on a 24-well plate and 0.5 µL of the
coacervates were dispensed into the DEX solution. 500 µL of PEG solution (10 w/w%, pH 6,
MES) was added to the DEX solution. Glucose (final concentration 1 mM, pH 6, MES) was
added to the PEG solution followed by imaging with a stereoscope or epifluorescent microscope
(TE-300, Nikon).
6.2.5 Spontaneous GOx partitioning in the ATP-PDDA coacervate
0.5 µL of the blank coacervate or FITC-GOx-laden coacervate (final concentration 0.1 mg/ml)
was dispensed in 10 µL of DEX solution containing FITC-GOx (final concentration 1 mg/ml) or
DEX solution, respectively, and submerged in 500 µL of PEG solution. Brightfield and
fluorescent images were collected at t = 0 and 24 hrs.
6.2.6 Degradation of DEX phase by compartmentalized or redistributed dextranase

148
Dextranase (final concentration 0.1 mg/ml, pH 6, MES) was premixed in the preparation of
coacervates. 10 µL of 10% (w/w) DEX solution containing 1 µg/ml FITC-DEX was added to
each well in a 24-well plate. 0.5 µL of pure ATP-PDDA coacervates and dextranase-laden
coacervates were dispensed into the dextran droplet, respectively. 500 µL of 10% (w/w) PEG
solution (either dissolved in MES or MES with 165 mM NaCl) was added to each well. Time-
lapse images were taken by the epifluorescent microscope and the surface areas of DEX phase
were analyzed by ImageJ. The area values were averaged with three replicates and expressed as
mean with standard deviation.
6.2.7 Dextranase activity assay in the crowding microenvironment
Bulk dextranase activity was measured using the previously reported protocol24 : MES buffer
(pH 6) at 25 °C in the presence of 0 mM and 165 mM NaCl.
The bulk activity was also obtained using a conventional method25 and compared in the
presence/absence of 10 v/v% PEG.
6.2.8 Characterization of ATP-PDDA coacervates
Zeta potential measurements (ZetaSizer Nano ZSP, Malvern) were conducted on bulk solutions
of HRP, GOx, Dextranase, RITC-HRP, FITC-GOx, and RITC- Dextranase at a final
concentration of 0.1 mg/ml, respectively. For coacervate resuspension, 0.15 µL of the pure ATP-
PDDA coacervates or the enzyme-laden coacervates was resuspended in 1 mL MES buffer
solutions (pH 6).

149
6.2.9 pH and ionic strength influence on ATP-PDDA coacervates in DEX-PEG ATPS
50 µL of DEX solution (10 w/w%, pH 7, DI-water) was placed in each well within a plastic 24-
well plate and 0.5 µL of the coacervates was dispensed into the DEX droplet. 500 µL of PEG
solution (10 w/w%, pH 7, DI-water) or PEG-NaCl solution (10 w/w%, 250 mM NaCl, pH 7, DI-
water) was added to the DEX solution for pH and ionic strength, respectively. 50 µL of 1M HCl
was added to the PEG solution (final pH 1).
6.2.10 Enzyme modifications and partition coefficient determination
FITC-GOx and RITC-HRP and RITC-dextranase were modified using an extant protocol.26
Briefly, enzyme solutions (3 mL, 4 mg/ml, 100 mM Na2CO3, pH 8) mixed with 60 µL of a 2
mg/ml solution of FITC or RITC in DMSO were incubated overnight at 4 °C. The resulting
FITC-GOx, RITC-HRP, and RITC-dextranase were dialysed against 3 L of Na2CO3 (10 mM, pH
8).
Partition coefficient was determined by UV-Vis spectroscopy measurement (Shimazu).
Detailed procedure was reported elsewhere.23 Briefly, UV-Vis spectra of 10 mM PDDA
solutions containing RITC-HRP, FITC-GOx, and RITC-Dextranase at a final concentration of
0.1 mg/ml were collected. 10 mM ATP-PDDA solutions containing each enzyme at a final
concentration of 0.1 mg/ml were centrifuged and UV-Vis spectra of each supernatant were
collected. Based on extinction coefficient of FITC and RITC, the total mass of RITC-HRP, FITC,

150
GOx, and RITC-Dextranase in stock solution and supernatant was calculated from the spectra.
The partition coefficient, K, is given by Equation 1:
Kcoacervate/supernatant= Cc /Cs …(1)
Where Cc and Cs are the concentration of solute in coacervate-phase and supernatant-phase,
respectively. Conservation of mass applies to Equation 2:
C0V0 = CcVc +CsVs …(2)
The initial concentration: C0 and volume: V0 are known. The coacervate-phase volume: Vc the
supernatant-phase volume: Vs are approximately 0.5 (v/v)% and 99.5 (v/v)% of V0, respectively,
in a 10 mM ATP-PDDA system. Since Cs can be obtained by the UV/Vis absorbance spectra,
Kc/s can be determined accordingly.
6.3 Results and Discussion
6.3.1 Characterization of ATP-PDDA complex coacervates
We used ATP-PDDA complex coacervates at a final concentration of 10 mM in this work. We
confirmed that ATP4- : PDDA+ ratio was 1 : 4.2 based on UV-Vis spectroscopy measurement
(Figure 6.6) and the surface charge potential was +17 mV based on zeta potential measurements
(Table 6.1). The data were consistent with previously published values.23 The ATP-PDDA
coacervates isolated in resuspension showed more resistance to wetting a substrate compared to
the ATP-PDDA bulk phase (Figure 6.7), as previously reported.27 We assume that the
resuspending process washes out dissolved salts or impurities and increased interfacial stability

151
of the coacervate. Since the partitioning of DEX and PEG within an ATPS is based upon the
relative affinity of these compounds for water28; we assumed that ATP-PDDA coacervates, when
re-suspended within an ATPS, can co-exist in either phase without dissolving into either. We
assume that the resuspending process may alter the phase diagram of ATP-PDDA coacervates
and facilitate phase separation against the water-based solutions.
6.3.2 Patterning of ATP-PDDA coacervates in DEX-PEG ATPS
Single ATP-PDDA coacervate droplets loaded with rhodamine-B were dispensed by manual
pipetting into a 10% DEX – 10% PEG system. ATP-PDDA, DEX, and PEG phases showed
distinct boundaries (Figure 6.1A-B). To demonstrate multi-compartmentalization utilizing
multiple ATP-PDDA coacervates in the DEX-PEG system, we prepared ATP-PDDA
coacervates containing different food colorings and performed multi-printing of the individual
coacervate droplets into the PEG-DEX system. We note that food coloring are composed of a
combination of dyes such as brilliant blue, allura red, tartazine and each food coloring shows
different partitioning behavior. Since these dyes didn’t ostensibly diffuse out, we used them as a
visual proxy to locate ATP-PDDA coacervates (Figure 1C). The ATP-PDDA coacervates
retained their shape without mixing and sequestered the food colorings in the DEX – PEG
system for at least 48 hours (Figure 6.8A-C).
6.3.3 Ionic strength-driven degradation of ATP-PDDA coacervates in PEG-DEX ATPS

152
Complex coacervation is a charge-dependent phenomenon and is consequently susceptible to
changes in pH and ionic strength. In contrast, DEX-PEG ATPS is hydrophobicity-based and
more resistant to such changes (Figure 6.9). We exploited this property and increased ionic
strength to redistribute encapsulated substances upon coacervate degradation while maintaining
the DEX-PEG boundary. After addition of a PEG-NaCl solution, the ATP-PDDA coacervates
gradually expanded over a 5 min period (Figure 6.2A-B) and completely dissociated in 15 min
(Figure 6.2C). The food colorings were completely mixed while the DEX phase in the PEG-
NaCl phase remained intact for at least 1200 min (Figure 6.2D). The results reveal that
compartmentalized substances in the ATP-PDDA coacervates can be released at physiological
ionic strengths. The ionic strength-driven redistribution of compartmentalized biomolecules is a
more mild and versatile approach compared to pH change.
6.3.4 Two-enzyme cascade reaction in ATP-PDDA – DEX – PEG system
ATP-PDDA – DEX – PEG system is a membrane-free platform where small molecules like
nutrients can diffuse across the boundaries while macromolecules can be spatially sequestered.
To articulate this advantage, we demonstrated a cascade reaction commonly adopted in protocell
studies.29 ATP-PDDA coacervate droplets containing amplex red with or without (+/-) HRP was
dispensed into a DEX phase +/- GOx overlaid by a PEG phase +/- β-glucose. Fluorescent signal
from the ATP-PDDA coacervate was confirmed only when all essential components for the
reaction were present in the system (Figure 6.3A-D). We infer that glucose added in the PEG
phase diffuses into the DEX phase, where encapsulated GOx was able to catalyze its oxidation,
yielding hydrogen peroxide. This hydrogen peroxide then diffuses into the ATP-PDDA

153
coacervate phase where it initiates the HRP-catalyzed oxidation of compartmentalized amplex
red – yielding a fluorescent signal.
6.3.5 Compartmentalization of GOx in ATP-PDDA – DEX – PEG system
Since the relative partition coefficients and mobility of these products (glucose and hydrogen
peroxide) across the coacervate-DEX-PEG phases are practically difficult to measure, we
prepared FITC-GOx and RITC-HRP and observed fluorescent signal localization in the system
(Figure 6.10). FITC-GOx homogeneously distributed at the beginning while the dispensed
coacervate droplet immediately attracted FITC-GOx at the droplet interface at t = 0 and
encapsulated most of FITC-GOx in the droplet interior at t = 24 hrs (Figure 6.10A-C and E-G).
Meanwhile FITC-GOx pre-loaded in the coaervate droplet remained compartmentalized at t = 24
hrs (Figure 6.10D and H). We observed no cascade signal if GOx were pre-encapsulated in a
coacervate droplet separate from the HRP and substrate, indicating strong molecular partitioning
of the coacervate and requirement for proximity between enzymes and substrates. These data are
supported by the partition coefficients in the coacervate-rich phase over the coacervate-deficient
phase (Table 6.1). The zeta-potential data also indicate that GOx and HRP in suspension is
negatively charged, which can assist in its encapsulation within the coacervate phase without
diffusing out to other phases. These results provide strong evidence that our system spatially
compartmentalizes the enzymes while it allows nutrient diffusion across compartment
boundaries.

154
6.3.6 Spatiotemporal enzymatic cascade reactions using ATP-PDDA – DEX – PEG system
Multi-compartmentalization can also perform multiple reactions in defined spatial locations. In a
static system, where movement of reactants is dependent upon diffusion, such
compartmentalization also provides a considerable degree of temporal control. To demonstrate
this, we prepared three different substrates of HRP (ABTS, DAB, and οPD) as well as controls
and performed the same cascade reaction in our system. In the presence of glucose, colorimetric
signals were observed while, in the absence of glucose, no such signal was detected (Figure 6.4A
and B). No visible change was detected on the control coacervates. Interestingly, when we
isolated HRP and DAB individually, no colorimetric change was observed after an hour of
incubation (Figure 6.4C and D). In order to activate HRP substrates, HRP and its substrates
should be in close proximity due to radical formation. In contrast, when we manually overlaid
the droplets, the droplets spontaneously coalesced and turned red, indicating the reaction
completion in the coalesced droplet (Figure 6.4D). These results were also reproduced using
HRP and ABTS (data not shown). The spatial control of components is necessary for membrane-
bound constructs to perform enzyme-mediated cascade reactions.29, 30 The results illustrate that
our system allows flexible spatial manipulation of the coacervates and initiate enzymatic
reactions by coacervate coalescence at the desired time point.
6.3.7 DEX degradation assay by compartmentalized or released dextranase
Finally, to assess the compartmentalization influence on enzymatic performance, we prepared
RITC-labeled dextranase and compared time-lapse DEX degradation when dextranase
sequestered in ATP-PDDA coacervates was either retained or released. Note that we measured

155
dextranase activity using the reported method24 and confirmed in advance that the dextranase
activity remained same regardless of ionic strength change (Km = 2 x 10⁻⁵ M). RITC-dextranase
confined in the ATP-PDDA coacervate showed faster degradation (Figure 6.5A, D, and G)
compared with released RITC-dextranase (Figure 6.5B, E, and G). Negligible DEX degradation
was observed in the absence of dextranase (Figure 6.5C, F, and G). Additionally, we note that
the coacervate size was almost constant in the absence of the salts over 24 hours and the DEX
degradation was repeatable when new DEX molecules were supplied after complete degradation.
We suggest that dextranase confined in the ATP-PDDA coacervate continuously came to in
contact with DEX molecules during degradation assay and could constantly degrade DEX. In
contrast, dextranase released from the ATP-PDDA coacervate diffused into DEX and PEG phase
and had less chance to meet DEX molecules, resulting in slower degradation. The DEX
degradation showed different behavior depending on the distribution and location of dextranase.
Our data illustrate distinct spatiotemporal dextranase-mediated DEX degradation through multi-
compartmentalization.

156
6.4 Conclusions
We create and validate stable membrane-free multi-compartments by combining ATP-PDDA
coacervation and DEX-PEG ATPS. The ATP-PDDA coacervates resuspended in the DEX-PEG
system can either coexist or degrade depending on the ionic strength. The multiple ATP-PDDA
coacervates can retain compartmentalized substances in DEX-PEG system and release the
contents upon degradation. Moreover, the ATP-PDDA coacervates can process spatiotemporal
cascade reactions through membrane-free boundaries and initiate the reactions by coacervate
coalescence. Finally, the compartmentalization of dextranase isolated from the crowding
microenvironment allows stable DEX-degradation process. These characteristics, similar to the
living cell system, provide a unique platform that can potentially perform multi-step bioreactions
within a single vessel that currently require multiple reaction vessels. Since our system should be
open to other complex coacervation and ATPSs, the formulation of the system is tunable. For
example, one can use poly(acrilic acid) – PDDA system with negatively charged surfaces31
together with ATP-PDDA system with positively charged surfaces in other ATPSs in order to
tailor the desired molecular partitioning for the specific reactions. Moreover, our system can be
miniaturized by ATPS-related microtechniques such as micropattering32 and droplet
microfluidics33. Micropatterning of coacervates composed of heterogeneous species in various
ATPSs can expand to multi-compartmentalized reactors for various spatiotemporal reactions.

157
Table 6.1. Zeta-potential and partition coefficient values
Sample Zeta-potential (mv) Partition coefficient
(coacervate / supernatant)
ATP/PDDA 17.3
HRP -7.7
GOx -4.6
Dextranase -6.1
RITC-HRP -1.7 4.5 x 10³
FITC-GOx -1.5 1.3 x 10²
RITC-Dextranase -1.6 2.6 x 10²

158
Figure 6.1. Pattering of ATP-PDDA coacervates in a 10% DEX – 10% PEG system. A) transverse cross-section image and B) reconstructed 3D image of a rhodamine B-laden ATP-PDDA droplet (red) resuspended in a DEX droplet (green) in PEG phase. Red: rhodamine B and green: FITC-DEX. C) optical image of ATP-PDDA coacervates encapsulating food colorings (blue, red, yellow, and green). Scale bar (A-B) 500 µm and (C) 1 mm.

159
Figure 6.2. Ionic strength-driven degradation of ATP-PDDA coacervates encapsulating food colorings in a DEX – PEG system. Time-lapse images of the ATP-PDDA coacervates in DEX-PEG-NaCl phase at A) t = 0 min, B) 5 min, C) 15 min, and D) 1200 min. Scale bar 1 mm.

160
Figure 6.3. GOx-HRP-mediated cascade reaction occurring across ATP-PDDA, DEX, and PEG phases. A) β-glucose, GOx, and HRP present, B) GOx and HRP present, C) β-glucose and HRP present, and D) β-glucose and GOx present. Green: FITC-DEX, Red: catalyzed product. Scale bar 1 mm.

161
Figure 6.4. GOx-HRP-mediated cascade reaction upon isolation and coalescence of coacervates. GOx-suspended DEX phase was submerged by the PEG phase. HRP-ABTS-laden coacervate (top), blank coacervate (right), HRP-DAB-laden coacervate (bottom), and HRP-οPD-laden coacervate (left) were dispensed A) in the presence and B) in the absence of β-glucose at t = 1 hr. DAB-laden coacervate and HRP-laden coacervate were either isolated (bottom) or merged (top) in the presence of β-glucose in the PEG phase and incubated at (C) t = 0 and (D) t = 1 hr. Scale bar 1 mm.

162
Figure 6.5. Dextranase-mediated DEX degradation assay. Dextranase compartmentalized in the ATP-PDDA coacervate in the DEX-PEG system was either retained (A) t = 0 and D) t = 24 hrs) or released (B) t = 0 and E) t = 24 hrs). The ATP-PDDA in the absence of dextranase was incubated (C) t = 0 and F) t = 24hrs). G) The area of DEX phase was analyzed over 24 hrs. Green: FITC-DEX and red: RITC-dextranase. Scale bar 100 µm.

163
Figure 6.6. UV/VIS spectra of ATP-PDDA coacervate suspension before and after spin down.

164
Figure 6.7. Wetting behavior of ATP-PDDA coacervates prepared with 1mM FITC. (A) brightfield and (B) fluorescent images of ATP-PDDA coacervate suspension on a glass slide. (C) brightfield and (D) fluorescent images of ATP-PDDA resuspension on a glass slide. Scale bar 50 µm.

165
Figure 6.8. Patterning of multiple ATP-PDDA coacervates containing food colorings in a DEX-PEG system. Time-lapse images of the ATP-PDDA coacervates at A) t = 0, B) 24 hrs, and C) 48 hrs. Scale bar 1 mm.

166
Figure 6.9. pH and ionic strength sensitivity of ATP-PDDA coacervates in DEX-PEG ATPS. Single ATP-PDDA coacervate in a 10% DEX - 10% PEG system at (A) pH 7 and (B) pH 1, and PEG-250 mM NaCl addition at (C) t = 0 and (D) t = 10 min. Scale bar 1 mm.

167
Figure 6.10. Time-lapse GOx partitioning into ATP-PDDA coacervates. Brightfield images of FITC-GOx dispensed in the DEX phase (A) in the absence of the coacervate at t = 0 and in the presence of the coacervate at (B) t = 0 and (C) t = 24 hrs. (D) FITC-GOx pre-loaded in the coacervate at t = 24 hrs. (E-H) fluorescent images of (A-D). Scale bar 500 µm.

168
6.5 References
1. Oparin, A. I.; Morgulis, S., The Origin of Life. 2nd ed.; Dover Publications Inc.: 2003.
2. Monnard, P.-A.; Walde, P., Current Ideas about Prebiological Compartmentalization. Life 2015, 5, 1239-1263.
3. Walde, P.; Ichikawa, S., Enzymes Inside Lipid Vesicles: Preparation, Reactivity and Applications. Biomol. Eng 2001, 18, 143-177.
4. Kurihara, K.; Okura, Y.; Matsuo, M.; Toyota, T.; Suzuki, K.; Sugawara, T., A Recursive Vesicle-Based Model Protocell with A Primitive Model Cell Cycle. Nat. Commun. 2015, 6, 8352-1-7.
5. Kurihara, K.; Tamura, M.; Shohda, K.-i.; Toyota, T.; Suzuki, K.; Sugawara, T., Self-Reproduction of Supramolecular Giant Vesicles Combined with The Amplification of Encapsulated DNA. Nat. Chem. 2011, 3, 775-781.
6. Hanczyc, M. M.; Fujikawa, S. M.; Szostak, J. W., Experimental Models of Primitive Cellular Compartments: Encapsulation, Growth, and Division. Science 2003, 302, 618-622.
7. Ichihashi, N.; Usui, K.; Kazuta, Y.; Sunami, T.; Matsuura, T.; Yomo, T., Darwinian Evolution in A Translation-Coupled RNA Replication System within A Cell-Like Compartment. Nat. Commun. 2013, 4, 2494-1-7.
8. Aumiller Jr, W. M.; Davis, B. W.; Keating, C. D., Phase Separation As A possible Means of Nuclear Compartmentalization. Int. Rev. Cell Mol. Biol. 2013, 109-149.
9. Li, Z.; Zhang, Y.; Su, Y.; Ouyang, P.; Ge, J.; Liu, Z., Spatial Co-Localization of Multi-Enzymes by Inorganic Nanocrystal–Protein Complexes. Chem. Commun. 2014, 50, 12465-12468.
10. Evreinova, T.; Karnaukhov, W.; Mamontova, T.; Ivanizki, G., The Interaction of Biological Macromolecules in Coacervate Systems. J. Colloid Interface Sci. 1971, 36, 18-23.
11. Kerfeld, C. A.; Sawaya, M. R.; Tanaka, S.; Nguyen, C. V.; Phillips, M.; Beeby, M.; Yeates, T. O., Protein Structures Forming The Shell of Primitive Bacterial Organelles. Science 2005, 309, 936-938.
12. Chen, A. H.; Silver, P. A., Designing Biological Compartmentalization. Trends Cell Biol. 2012, 22, 662-670.
13. Brangwynne, C. P., Phase Transitions and Size Scaling of Membrane-Less Organelles. J. Cell Biol. 2013, 203, 875-881.
14. Peters, R. J.; Marguet, M.; Marais, S.; Fraaije, M. W.; van Hest, J.; Lecommandoux, S., Cascade Reactions in Multicompartmentalized Polymersomes. Angew. Chem. 2014, 126, 150-154.

169
15. Paleos, C. M.; Tsiourvas, D.; Sideratou, Z., Preparation of Multicompartment Lipid-Based Systems Based on Vesicle Interactions. Langmuir 2011, 28, 2337-2346.
16. Marguet, M.; Bonduelle, C.; Lecommandoux, S., Multicompartmentalized Polymeric Systems: Towards Biomimetic Cellular Structure and Function. Chem. Soc. Rev. 2013, 42, 512-529.
17. Elani, Y.; Law, R. V.; Ces, O., Vesicle-Based Artificial Cells as Chemical Microreactors with Spatially Segregated Reaction Pathways. Nat. Commun. 2014, 5, 5305-1-5.
18. Chang, T. M. S., Therapeutic Applications of Polymeric Artificial Cells. Nat. Rev. Drug Discov. 2005, 4, 221-235.
19. Zhang, Y.; Ruder, W. C.; LeDuc, P. R., Artificial Cells: Building Bioinspired Systems Using Small-Scale Biology. Trends Biotechnol. 2008, 26, 14-20.
20. Keating, C. D., Aqueous Phase Separation as A Possible Route to Compartmentalization of Biological Molecules. Acc. Chem. Res. 2012, 45, 2114-2124.
21. Cacace, D. N.; Keating, C. D., Biocatalyzed Mineralization in An Aqueous Two-Phase System: Effect of Background Polymers and Enzyme Partitioning. J. Mater. Chem. B 2013, 1, 1794-1803.
22. Koga, S.; Williams, D. S.; Perriman, A. W.; Mann, S., Peptide–Nucleotide Microdroplets as A Step towards A Membrane-Free Protocell Model. Nat. Chem. 2011, 3, 720-724.
23. Williams, D. S.; Koga, S.; Hak, C. R. C.; Majrekar, A.; Patil, A. J.; Perriman, A. W.; Mann, S., Polymer/Nucleotide Droplets as Bio-Inspired Functional Micro-Compartments. Soft Matter 2012, 8, 6004-6014.
24. Lai, D.; Frampton, J. P.; Tsuei, M.; Kao, A.; Takayama, S., Label-Free Direct Visual Analysis of Hydrolytic Enzyme Activity Using Aqueous Two-Phase System Droplet Phase Transitions. Anal. Chem. 2014, 86, 4052-4057.
25. Miller, G. L., Use of Dinitrosalicylic Acid Reagent for Determination of Reducing Sugar. Anal. Chem. 1959, 31, 426-428.
26. Williams, D. S.; Patil, A. J.; Mann, S., Spontaneous Structuration in Coacervate‐Based Protocells by Polyoxometalate‐Mediated Membrane Assembly. Small 2014, 10, 1830-1840.
27. Armstrong, J. P.; Olof, S. N.; Jakimowicz, M. D.; Hollander, A. P.; Mann, S.; Davis, S. A.; Miles, M. J.; Patil, A. J.; Perriman, A. W., Cell Paintballing Using Optically Targeted Coacervate Microdroplets. Chem. Sci. 2015, 6, 6106-6111.
28. Albertsson, P.-Å., Partition of Cell Particles and Macromolecules. 3rd ed.; Wiley New York etc.: 1986.

170
29. Huang, X.; Li, M.; Mann, S., Membrane-Mediated Cascade Reactions By Enzyme–Polymer Proteinosomes. Chem. Commun. 2014, 50, 6278-6280.
30. Vriezema, D. M.; Garcia, P. M.; Sancho Oltra, N.; Hatzakis, N. S.; Kuiper, S. M.; Nolte, R. J.; Rowan, A. E.; van Hest, J., Positional Assembly of Enzymes in Polymersome Nanoreactors for Cascade Reactions. Angew. Chem. 2007, 119, 7522-7526.
31. Fothergill, J.; Li, M.; Davis, S. A.; Cunningham, J. A.; Mann, S., Nanoparticle-Based Membrane Assembly and Silicification in Coacervate Microdroplets as a Route to Complex Colloidosomes. Langmuir 2014, 30, 14591-14596.
32. Kojima, T.; Takayama, S., Patchy Surfaces Stabilize Dextran–Polyethylene Glycol Aqueous Two-Phase System Liquid Patterns. Langmuir 2013, 29, 5508-5514.
33. Teh, S.-Y.; Lin, R.; Hung, L.-H.; Lee, A. P., Droplet Microfluidics. Lab Chip 2008, 8, 198-220.

171
Chapter 7
Conclusions and Future Directions
7.1 Conclusions
Development of functional materials and reliable disease diagnostics are both critical for human
welfare and rely on chemical and biological reactions. Such reactions need to be controlled in
space and time because spatial control determines reaction speed and scale while temporal
control regulates the reaction process. Since conventional reaction platforms often fail to possess
such spatiotemporal properties, novel platforms are greatly desired. Microreactors, especially
when performing multi-step reactions, require only a small quantity of sample and short time of
reaction assessment and has great advantages over the larger counterparts when materials and
duration of operation are limited. As such, microreactor platforms may be particularly appealing
to the pharmaceutical and biomedical industries where the reduction in time and cost for fast
evaluation and implementation of new production protocols is beneficial. In this thesis, a series
of unique microreactors that enable microcompartmentalization using macromolecules and
liquid-liquid interfaces were developed and demonstrated. The microreactors demonstrated based
on all-aqueous compartmentalization using liquid-liquid interfaces enable rapid and selective
mass exchange and diffusion with small quantity of reagents, provide robust and reliable reaction

172
platforms, and open new doors to explore functional material processes and biological assays
that conventional approaches using multiple reaction vessels fail to achieve. In this chapter,
conclusions of each chapter topic and future directions are described to aim for further material
and biomedical applications.
7.1.1 Micropatterning system: micro-scale DEX-PEG ATPS patterning
Deterministic ATPS patterning on a cell monolayer was previously demonstrated and envisioned
for use as a scaffold for ATPSs microreactor arrays on a non-cellular surface. However, the
underlying mechanism of generating stable ATPSs patterns on such surface was elusive. We
exploited the principle of surface modification at an air-water interface where introduced surface
heterogeneity wets the defined surface region and therefore modified PDMS surfaces with
various ATPS-related polymers in order to make surface energy gap in a DEX-PEG interface.
The key to successfully patterning DEX-PEG ATPS on the PDMS surfaces was to introduce a
sufficient surface energy gap in the defined region. Moreover, arbitrary ATPS patterns were
achieved by patchy modification with optimal patch-to-patch distance.
Surface modification has the great potential to confine ATPS solutions containing
biologic materials at the desired location and make ATPS microarrays on various surfaces for
bioassays. We later find that this system is also applicable to PEG-Salt ATPSs and expect that it
would be versatile to other ATPSs based on the universal principle of surface modification.

173
Since each ATPS has different molecular partitioning ability, future study may involve multiplex
micropatterning of ATPSs to confine different biomolecules under the same solution and
perform multiplexed reaction assays.
7.1.2 Micropatterning system: micro-scale hydrogel patterning
The manner of chemogradient formation in the microenvironment affects overall cell migration
that can lead to tumor growth and metastasis. We took advantage of the surface patterning
principles and developed a technique for cell-laden hydrogel micropatterning. A cell-repellent
surface was adopted together with micropatterned hydrogels where cells can only move through
the gel matrix without attaching the substrate surface. Two hydrogels containing CXCL12-
secreting cells and CXCR4-expressing cells, respectively, were micropatterned at the designed
distance and overlaid by other hydrogels. Migration of breast cancer cells was observed when an
optimal combination of gel type and isoform was utilized at an optimal gel-to-gel distance. The
simulation showed that the chemogradients of CXCL12-isoforms spatiotemporally form in the
3D embedded gel matrix under the appropriate condition. Additional work completed by our
group using oxygen beads revealed that the micropatterned hydrogels were hypoxic and oxygen
gradient also formed within the microenvironment.
Micropatterned hydrogels in this system can serve as a unique bioassay platform to assess
migratory behavior among the patterned cell populations. We later confirm that this system also
allows angiogenesis of endotherial cells from bone marrow where the distance control between
the patterned cell populations is critical. It indicates that this patterning format is beneficial to the
biological assays that require delicate spatial controls. Future research may involve multiplexed

174
hydrogel micropatterning for complex chemogradients formation, cell migration and
angiogenesis of different endothelial cell populations.
7.1.3 Oil dehydration system: micro-scale ATPS binodal determination
Determination of ATPS binodals requires a large amount of samples that restricts exploration of
biological ATPSs. We created a novel system using water-oil interfaces that enables microscale
determination of ATPS binodals. A water microdroplet was dehydrated at an FC40 - soybean oil
interface. Dilute phase-forming polymers suspended in a droplet were concentrated upon
dehydration and phase separated at the binodal point. Based on optical images of the droplet,
binodal concentrations were calculated and confirmed to be consistent with the binodals obtained
by a conventional method.
A unique shrinking microenvironment can precisely estimate phase diagrams of
conventional and biological ATPSs with a small quantity of samples and serve as a useful tool to
explore emerging ATPSs composed of biomolecules. We later observed that this system is
applicable to DNA-Histone H1 system with microgram quantity, implying the system is
compatible with hydrophobicity-based and charge-based ATPSs. Future direction may validate
DNA-, RNA-, and protein-based ATPSs using the platform where limited amount of samples are
expected.
7.1.4 Oil dehydration system: unique self-assembly of CdTe dendrites

175
The superstructures of semiconductive nanoparticles with large surface coverage via self-
assembly provide a variety of attractive applications such as solar cell materials with highly
efficient light-energy conversion. Droplet dehydration was exploited and served as a platform for
self-assembly of CdTe nanoparticles. The NPs assembled in the microdroplet evolved to dendric
structures as shrinking proceeded while the NPs in other static conditions formed arborized
structures. The simulation showed that the shrinking microenvironment created a concentration
gradient of the NPs inside the microdroplet that resulted in the unique dendric evolution. The
dendric structures showed large surface area and fractal dimension and illustrated distinct
chemical and optical properties in contrast to the counterpart.
A droplet dehydration format enables unique evolution of CdTe nanoparticle assembles
and sheds light on particle-assembly microenvironment. We believe that this shrinking platform
is applicable to other nanoparticles and feasible to construct unique superstructures that
conventional bulk conditions fail to produce. The next step is to develop a method to manipulate
the intact superstructures in a robust and highthroughput format for their practical use.
7.1.5 Multi-compartmentalization: novel liquid-liquid microcompartments
Living cells are comprised of multiple membrane-bound or membrane-free compartments that
enable the isolation and spatiotemporal regulation of biological processes. While some work has
been done to study membrane-bound compartments ex vivo; surprisingly little has been done to
study membrane-free multi-compartmentalization. A combined system of DEX-PEG ATPS and
ATP-PDDA complex coacervation was developed to create membrane-free multi-compartments
where ATP-PDDA coacervates, DEX phase, and PEG phase serve as analogues of organelles,

176
cytosol, and extracellular environment, respectively. ATP-PDDA coacervates could
compartmentalize various molecules and release the substances upon ionic strength change.
Multiplex two-enzyme cascade reactions were performed in the system and spatiotemporal
reactions were regulated by ATP-PDDA coacervate location and coalescence. DEX degradation
assay using dextranase revealed distinct reaction kinetics of compartmentalized dextranase
compared dextranase in suspension.
Our system supports the performance and study of complex reaction processes across
multiple micro-scale compartments. Adopted ATPSs are hydrophobic-based and charge-based,
not limited to DEX-PEG and ATP-PDDA systems, respectively. Based on the type of
biomolecules and reaction processes, the formulation of ATPSs can be modified and
implemented in the presented format. One potential future study is to express proteins in one
compartment, modify the protein in another compartment, and perform subsequent delivery to
extra environment by tuning ATPS formulations. Such system resembling the living cell system
enables in situ production of therapeutic proteins and represents a significant improvement over
conventional microreactors.
7.2 Future Directions
Even though the reactors described in this thesis represent unique platforms that are not simply
scaled-down from conventional reactors, where reactor sizes are approximately 100 µm – 1 mm
and where operation of the micro-reactor requires manual reagent handling, the presented
systems can be further improved in both scale and functionality.

177
7.2.1 Droplet microfluidics as a reaction platform
Droplet microfluidics is a direct and attractive approach to generate robust microreactors. T-
junction, flow focusing, and co-flowing geometries in a microfluidic device are commonly
adopted to pinch off microdroplets from a fluid stream in an oil-water system. The
microdroplets enable rapid and highthroughput bioassays such as single cell analysis, disease
detection, and PCR reaction in the individual droplets and process statistically sufficient amount
of data in a short time (1000 - 10000 droplets per second).
Moreover, droplet microfluidics has another prominent application: in situ microscale
hydrogel generation. Briefly, photo-crosslinkable polymer such as PEG-diacrylate is either
incorporated in the reagent solution or co-flowed with another polymer solution in a
microchannel, and crosslinked by in situ UV-exposure. The latter case, known as flow
lithography, has been exploited to create complex 3D shape microgels in a highthroughput
manner. The generated microgels enable encoding and decoding information in the complex
architectures. This platform is particularly useful for fabricating cell culture scaffolds or
diagnostic platforms.
7.2.2 Molecular crowding in microenvironments
Molecular crowding is another phenomenon to consider in a microreactor where macromolecules
are present. Macromolecules confined in the microenvironment are known to introduce volume
exclusion that can significantly alter the reaction kinetics of biological reactions relative to bulk

178
conditions. This phenomenon, named molecular crowding, can be seen in the interiors of living
cells where macromolecular species at the total concentration more than 100 mg/mL are packed
into tens of micrometer sized compartments occupying 20-30% of the total cell volume. The
crowding environment is known to enhance or deteriorate enzymatic activities depending on the
concentration and molecular weight of the crowding agents. The ability to interrogate the effect
of molecular crowding would be a non-trivial improvement over conventional bulk systems for
the modeling of sub-cellular biological reactions in vitro.
Microreactor platforms can provide a suitable opportunity to investigate molecular
crowding. Macromolecular ATPS and droplet microfluidic platforms, individually or in
combination, can be used to create such crowding within a given micro-environment. The
biological processes modeled in such a platform would provide novel insights to assess
molecular crowding. Our system described herein can be reconstituted in the automated and
miniaturized microdroplet system. Potential research direction is to combine those techniques
and phenomena to create novel microreactors for pharmaceutical and biomedical applications.