
Development of Methodology to Estimate the Fatigue … · Development of Methodology to Estimate...
8
ISSN: 2319-8753 International Journal of Innovative Research in Science, Engineering and Technology (An ISO 3297: 2007 Certified Organization) Vol. 2, Issue 12, December 2013 Copyright to IJIRSET www.ijirset.com 7184 Development of Methodology to Estimate the Fatigue Life of the Structure Roshan Dsouza 1 , Praveen M P 2 P. G. student, Department of Mechanical Engineering, EPCET, Bangalore, Karnataka, India 1 AssociateProfessor, Department of Mechanical Engineering, EPCET, Bangalore, Karnataka, India 2 Abstract: In this present study, a methodology is developed to estimate the fatigue life of the structure from acquired strain data for variable amplitude loading condition. The methodology is based on the nominal stress method and the method is used creating a software module. Rainflow cycle counting method is use to extract the cycles from the strain data. Then the Palmgren-Rule is utilized to calculate cumulative damage. In addition, the fatigue life of a cantilever aluminium plate under certain loading conditions is analysed. The results are compared with the professional fatigue analysis software "N-SOFT FATIMAS". Keywords: Fatigue, Stress Life, Variable Amplitude Loading, Life Estimation, Palmgren-miner Rule I. INTRODUCTION Fatigue is the process of progressive localized permanent structural change occurring in a material subjected to conditions that produce fluctuating stresses and strains at some point or points and that may culminate in cracks or complete fracture after a sufficient number of fluctuations. Fatigue life estimates are often needed in engineering design, specifically in analysing trial designs to ensure resistance to cracking. A similar need exists in the troubleshooting of cracking problems that appear in prototypes or service models of machines, vehicles, and structures. That is the reason that the predictive techniques are employed for applications ranging from initial sizing through prototype development and product verification.The failure analysis, prediction, and prevention are of critical importance to the designer to achieve a success. Fatigue design is one of the observed modes of mechanical failure in practice. For this reason, fatigue becomes an obvious design consideration for many structures, such as aircraft, bridges, railroad cars, automotive suspensions and vehicle frames. II. METHEDOLOGY Fig.1 Sequential steps in fatigue life calculation
Transcript of Development of Methodology to Estimate the Fatigue … · Development of Methodology to Estimate...
ISSN: 2319-8753
International Journal of Innovative Research in
Science, Engineering and Technology
(An ISO 3297: 2007 Certified Organization)
Vol. 2, Issue 12, December 2013
Copyright to IJIRSET www.ijirset.com 7184
Development of Methodology to Estimate the
Fatigue Life of the Structure Roshan Dsouza
1, Praveen M P
2
P. G. student, Department of Mechanical Engineering, EPCET, Bangalore, Karnataka, India1
AssociateProfessor, Department of Mechanical Engineering, EPCET, Bangalore, Karnataka, India2
Abstract: In this present study, a methodology is developed to estimate the fatigue life of the structure from acquired
strain data for variable amplitude loading condition. The methodology is based on the nominal stress method and the
method is used creating a software module. Rainflow cycle counting method is use to extract the cycles from the strain
data. Then the Palmgren-Rule is utilized to calculate cumulative damage. In addition, the fatigue life of a cantilever
aluminium plate under certain loading conditions is analysed. The results are compared with the professional fatigue
analysis software "N-SOFT FATIMAS".
Keywords: Fatigue, Stress Life, Variable Amplitude Loading, Life Estimation, Palmgren-miner Rule
I. INTRODUCTION
Fatigue is the process of progressive localized permanent structural change occurring in a material subjected to
conditions that produce fluctuating stresses and strains at some point or points and that may culminate in cracks or
complete fracture after a sufficient number of fluctuations. Fatigue life estimates are often needed in engineering design,
specifically in analysing trial designs to ensure resistance to cracking. A similar need exists in the troubleshooting of
cracking problems that appear in prototypes or service models of machines, vehicles, and structures. That is the reason
that the predictive techniques are employed for applications ranging from initial sizing through prototype development
and product verification.The failure analysis, prediction, and prevention are of critical importance to the designer to
achieve a success. Fatigue design is one of the observed modes of mechanical failure in practice. For this reason,
fatigue becomes an obvious design consideration for many structures, such as aircraft, bridges, railroad cars,
automotive suspensions and vehicle frames.
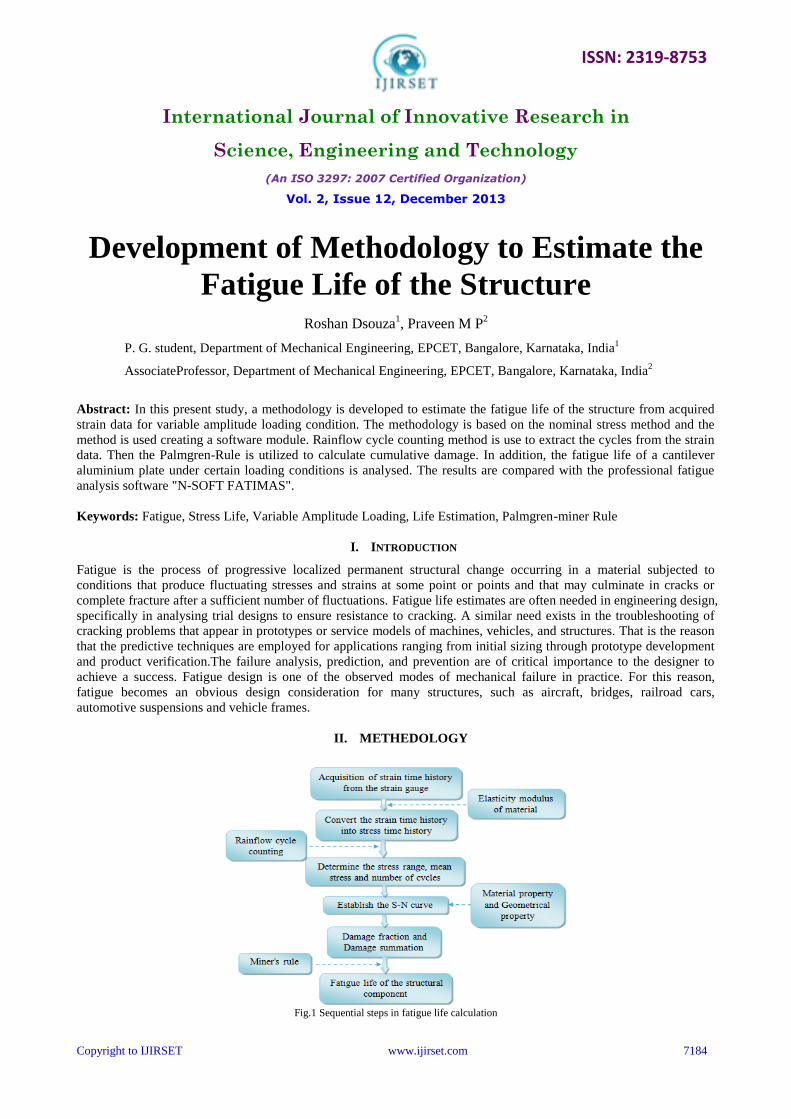
II. METHEDOLOGY
Fig.1 Sequential steps in fatigue life calculation
ISSN: 2319-8753
International Journal of Innovative Research in
Science, Engineering and Technology
(An ISO 3297: 2007 Certified Organization)
Vol. 2, Issue 12, December 2013
Copyright to IJIRSET www.ijirset.com 7185
The algorithm of this study is explained in the Fig.1.
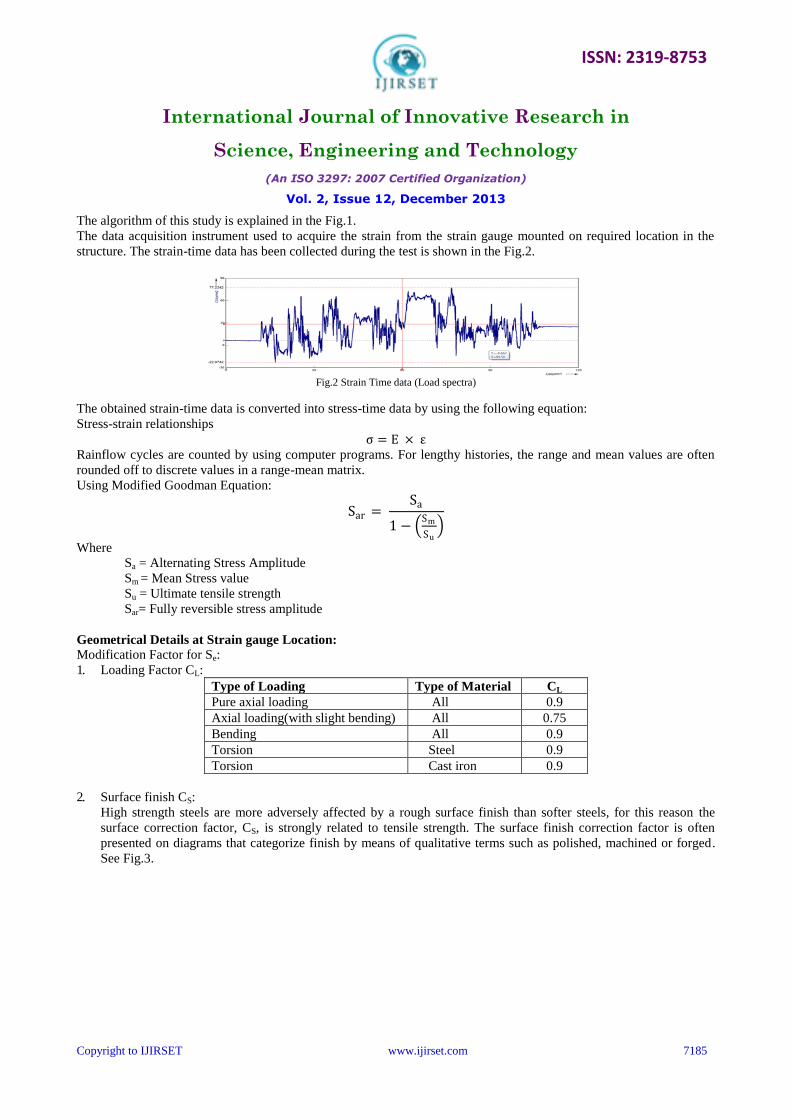
The data acquisition instrument used to acquire the strain from the strain gauge mounted on required location in the
structure. The strain-time data has been collected during the test is shown in the Fig.2.
Fig.2 Strain Time data (Load spectra)
The obtained strain-time data is converted into stress-time data by using the following equation:
Stress-strain relationships
σ = E × ε Rainflow cycles are counted by using computer programs. For lengthy histories, the range and mean values are often
rounded off to discrete values in a range-mean matrix.
Using Modified Goodman Equation:
Sar = Sa
1 − Sm
Su
Where
Sa = Alternating Stress Amplitude
Sm = Mean Stress value
Su = Ultimate tensile strength
Sar= Fully reversible stress amplitude
Geometrical Details at Strain gauge Location:
Modification Factor for Se:
1. Loading Factor CL:
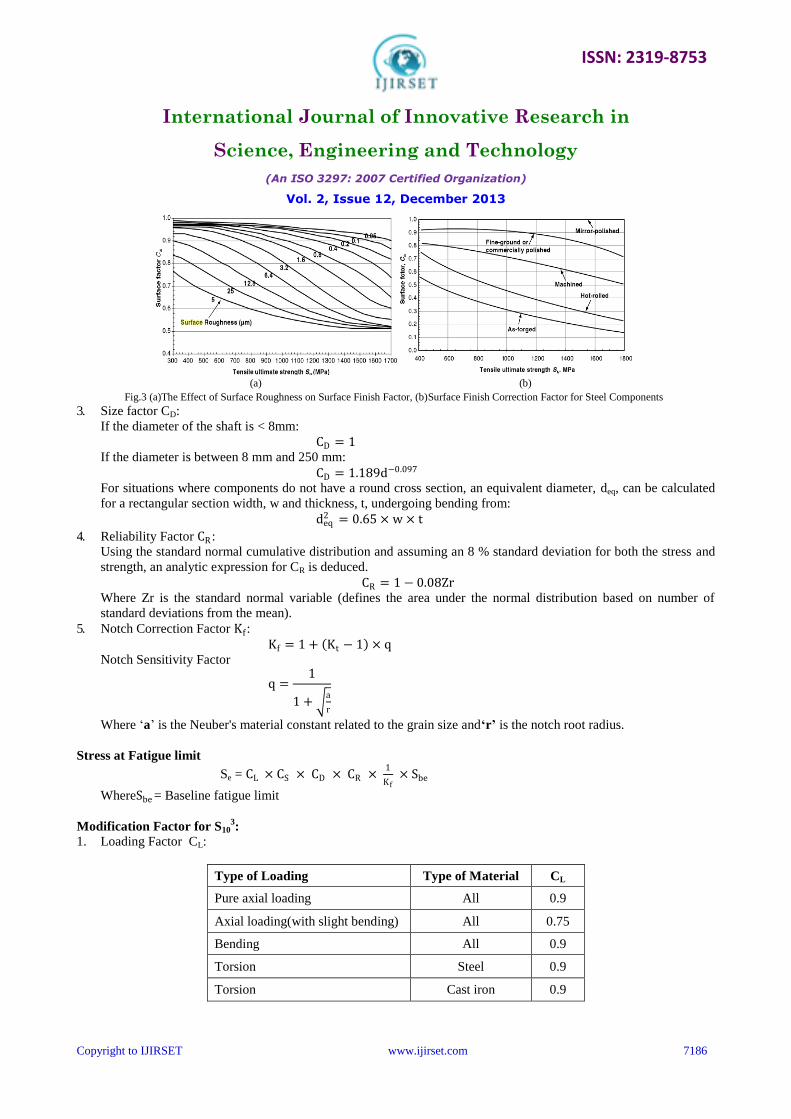
2. Surface finish CS:
High strength steels are more adversely affected by a rough surface finish than softer steels, for this reason the
surface correction factor, CS, is strongly related to tensile strength. The surface finish correction factor is often
presented on diagrams that categorize finish by means of qualitative terms such as polished, machined or forged.
See Fig.3.
Type of Loading Type of Material CL
Pure axial loading All 0.9
Axial loading(with slight bending) All 0.75
Bending All 0.9
Torsion Steel 0.9
Torsion Cast iron 0.9
ISSN: 2319-8753
International Journal of Innovative Research in
Science, Engineering and Technology
(An ISO 3297: 2007 Certified Organization)
Vol. 2, Issue 12, December 2013
Copyright to IJIRSET www.ijirset.com 7186
Fig.3 (a)The Effect of Surface Roughness on Surface Finish Factor, (b)Surface Finish Correction Factor for Steel Components
3. Size factor CD:
If the diameter of the shaft is < 8mm:
CD = 1
If the diameter is between 8 mm and 250 mm:
CD = 1.189d−0.097 For situations where components do not have a round cross section, an equivalent diameter, deq, can be calculated
for a rectangular section width, w and thickness, t, undergoing bending from:
deq2 = 0.65 × w × t
4. Reliability Factor CR :
Using the standard normal cumulative distribution and assuming an 8 % standard deviation for both the stress and
strength, an analytic expression for CR is deduced.
CR = 1 − 0.08Zr
Where Zr is the standard normal variable (defines the area under the normal distribution based on number of
standard deviations from the mean).
5. Notch Correction Factor Kf :
Kf = 1 + Kt − 1 × q
Notch Sensitivity Factor
q =1
1 + a
r
Where ‘a’ is the Neuber's material constant related to the grain size and‘r’ is the notch root radius.
Stress at Fatigue limit
Se = CL × CS × CD × CR × 1
Kf × Sbe
WhereSbe = Baseline fatigue limit
Modification Factor for S103:
1. Loading Factor CL:
Type of Loading Type of Material CL
Pure axial loading All 0.9
Axial loading(with slight bending) All 0.75
Bending All 0.9
Torsion Steel 0.9
Torsion Cast iron 0.9
(a) (b)
ISSN: 2319-8753
International Journal of Innovative Research in
Science, Engineering and Technology
(An ISO 3297: 2007 Certified Organization)
Vol. 2, Issue 12, December 2013
Copyright to IJIRSET www.ijirset.com 7187
2. Reliability Factor CR :
Using the standard normal cumulative distribution and assuming an 8 % standard deviation for both the stress and
strength, an analytic expression for CR is deduced.
CR = 1 − 0.08Zr
Where Zr is the standard normal variable (defines the area under the normal distribution based on number of
standard deviations from the mean).
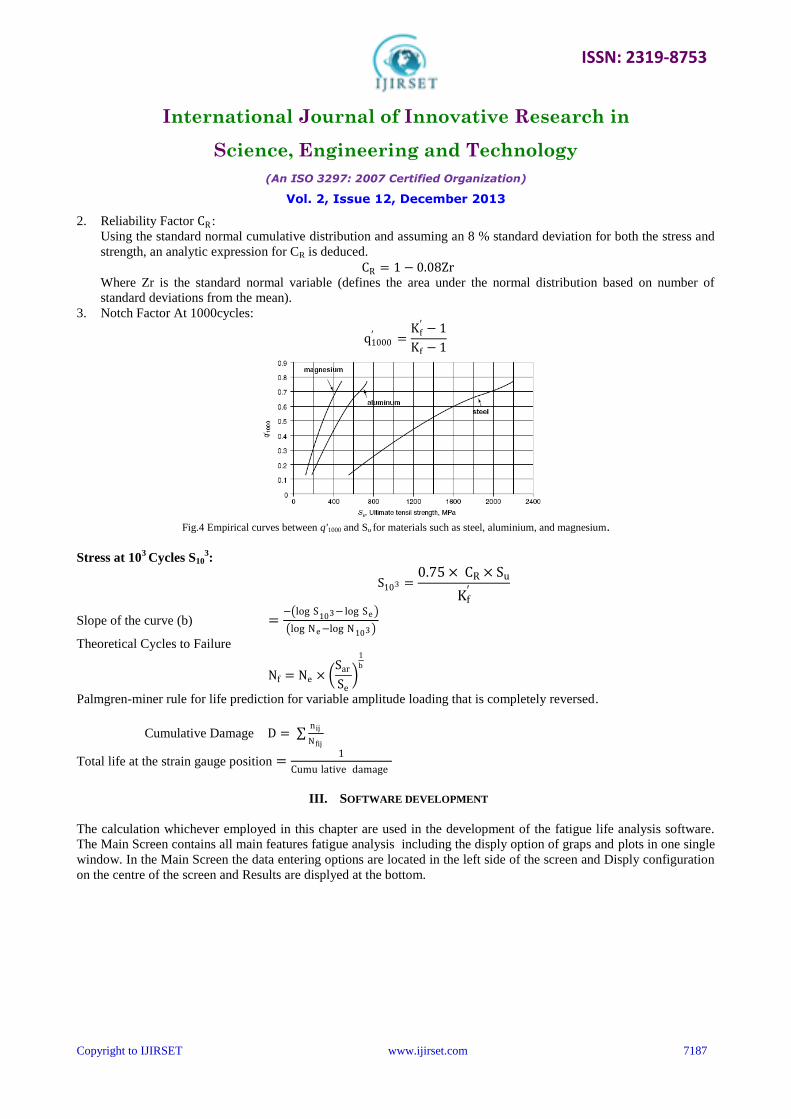
3. Notch Factor At 1000cycles:
q1000′ =
Kf′ − 1
Kf − 1
Fig.4 Empirical curves between q'1000 and Su for materials such as steel, aluminium, and magnesium.
Stress at 103 Cycles S10
3:
S103 =0.75 × CR × Su
Kf′
Slope of the curve (b) =− log S
103− log Se
log Ne−log N103
Theoretical Cycles to Failure
Nf = Ne × Sar
Se
1
b
Palmgren-miner rule for life prediction for variable amplitude loading that is completely reversed.
Cumulative Damage D = nij
Nfij
Total life at the strain gauge position =1
Cumu lative damage
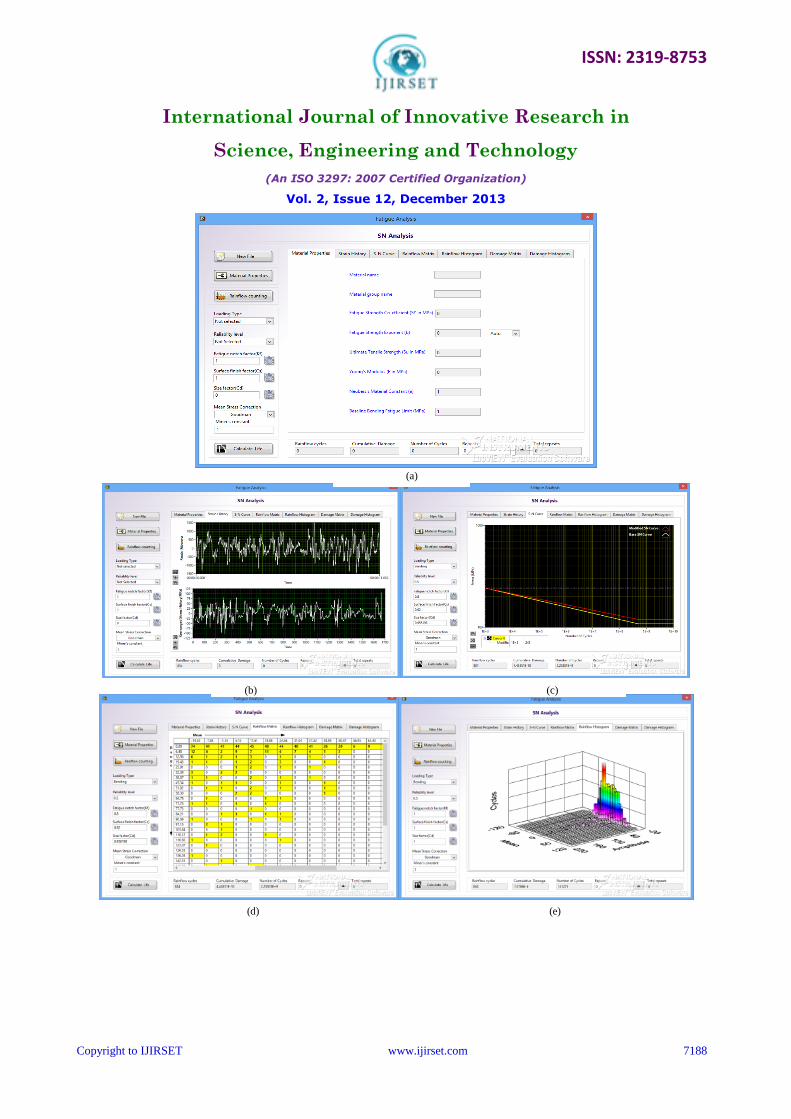
III. SOFTWARE DEVELOPMENT
The calculation whichever employed in this chapter are used in the development of the fatigue life analysis software.
The Main Screen contains all main features fatigue analysis including the disply option of graps and plots in one single
window. In the Main Screen the data entering options are located in the left side of the screen and Disply configuration
on the centre of the screen and Results are displyed at the bottom.
ISSN: 2319-8753
International Journal of Innovative Research in
Science, Engineering and Technology
(An ISO 3297: 2007 Certified Organization)
Vol. 2, Issue 12, December 2013
Copyright to IJIRSET www.ijirset.com 7188
(a)
(b) (c)
(d) (e)
ISSN: 2319-8753
International Journal of Innovative Research in
Science, Engineering and Technology
(An ISO 3297: 2007 Certified Organization)
Vol. 2, Issue 12, December 2013
Copyright to IJIRSET www.ijirset.com 7189
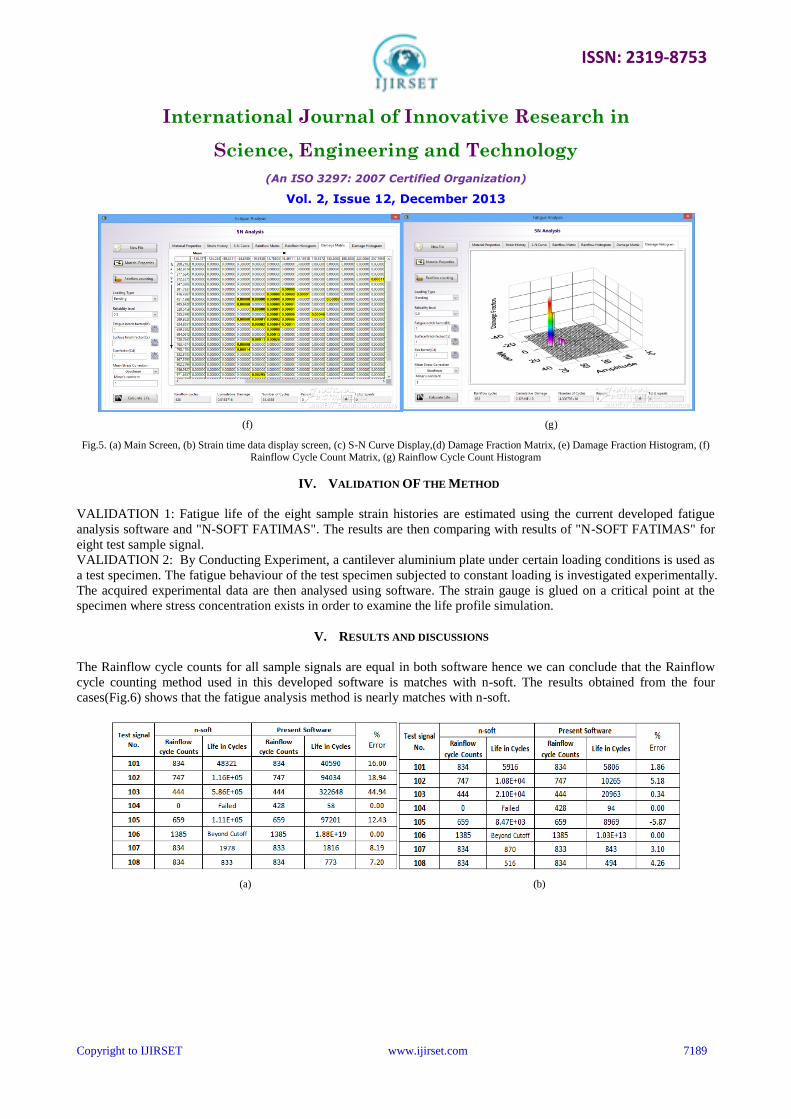
Fig.5. (a) Main Screen, (b) Strain time data display screen, (c) S-N Curve Display,(d) Damage Fraction Matrix, (e) Damage Fraction Histogram, (f) Rainflow Cycle Count Matrix, (g) Rainflow Cycle Count Histogram
IV. VALIDATION OF THE METHOD
VALIDATION 1: Fatigue life of the eight sample strain histories are estimated using the current developed fatigue
analysis software and "N-SOFT FATIMAS". The results are then comparing with results of "N-SOFT FATIMAS" for
eight test sample signal.
VALIDATION 2: By Conducting Experiment, a cantilever aluminium plate under certain loading conditions is used as
a test specimen. The fatigue behaviour of the test specimen subjected to constant loading is investigated experimentally.
The acquired experimental data are then analysed using software. The strain gauge is glued on a critical point at the
specimen where stress concentration exists in order to examine the life profile simulation.
V. RESULTS AND DISCUSSIONS
The Rainflow cycle counts for all sample signals are equal in both software hence we can conclude that the Rainflow
cycle counting method used in this developed software is matches with n-soft. The results obtained from the four
cases(Fig.6) shows that the fatigue analysis method is nearly matches with n-soft.
(f) (g)
(a) (b)
ISSN: 2319-8753
International Journal of Innovative Research in
Science, Engineering and Technology
(An ISO 3297: 2007 Certified Organization)
Vol. 2, Issue 12, December 2013
Copyright to IJIRSET www.ijirset.com 7190
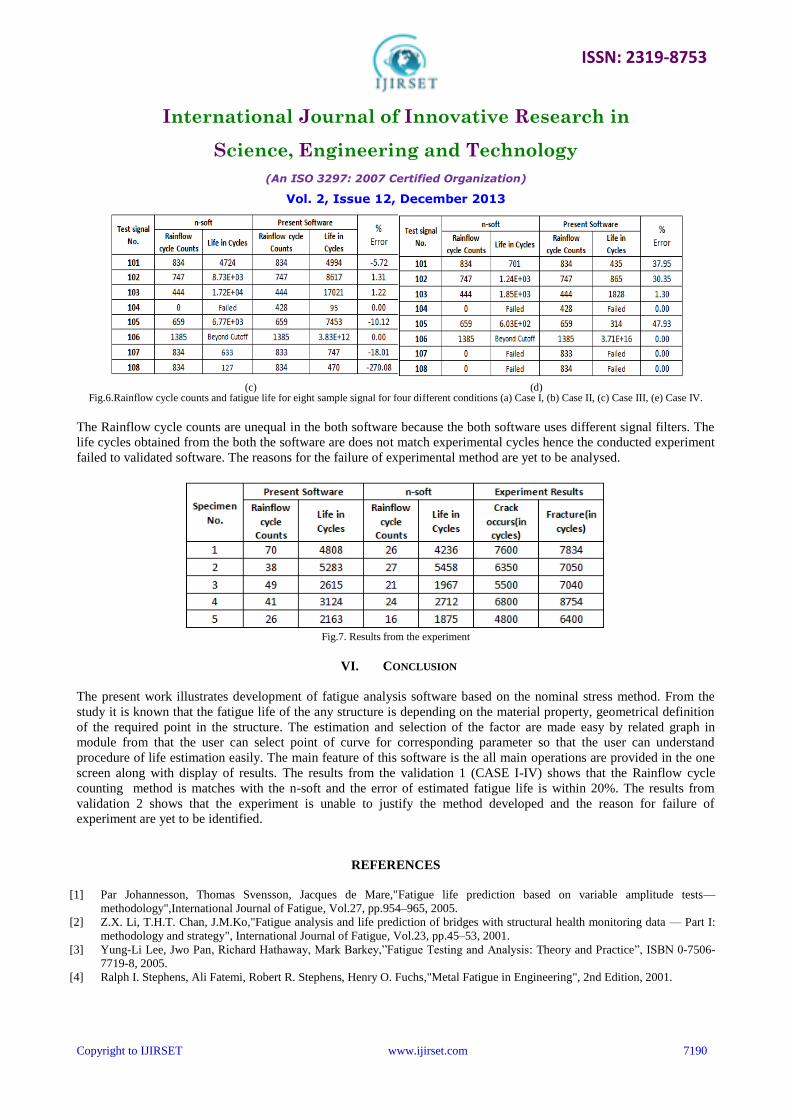
Fig.6.Rainflow cycle counts and fatigue life for eight sample signal for four different conditions (a) Case I, (b) Case II, (c) Case III, (e) Case IV.
The Rainflow cycle counts are unequal in the both software because the both software uses different signal filters. The
life cycles obtained from the both the software are does not match experimental cycles hence the conducted experiment
failed to validated software. The reasons for the failure of experimental method are yet to be analysed.
Fig.7. Results from the experiment
VI. CONCLUSION
The present work illustrates development of fatigue analysis software based on the nominal stress method. From the
study it is known that the fatigue life of the any structure is depending on the material property, geometrical definition
of the required point in the structure. The estimation and selection of the factor are made easy by related graph in
module from that the user can select point of curve for corresponding parameter so that the user can understand
procedure of life estimation easily. The main feature of this software is the all main operations are provided in the one
screen along with display of results. The results from the validation 1 (CASE I-IV) shows that the Rainflow cycle
counting method is matches with the n-soft and the error of estimated fatigue life is within 20%. The results from
validation 2 shows that the experiment is unable to justify the method developed and the reason for failure of
experiment are yet to be identified.
REFERENCES
[1] Par Johannesson, Thomas Svensson, Jacques de Mare,"Fatigue life prediction based on variable amplitude tests—
methodology",International Journal of Fatigue, Vol.27, pp.954–965, 2005.
[2] Z.X. Li, T.H.T. Chan, J.M.Ko,"Fatigue analysis and life prediction of bridges with structural health monitoring data — Part I:
methodology and strategy", International Journal of Fatigue, Vol.23, pp.45–53, 2001.
[3] Yung-Li Lee, Jwo Pan, Richard Hathaway, Mark Barkey,”Fatigue Testing and Analysis: Theory and Practice”, ISBN 0-7506-
7719-8, 2005.
[4] Ralph I. Stephens, Ali Fatemi, Robert R. Stephens, Henry O. Fuchs,"Metal Fatigue in Engineering", 2nd Edition, 2001.
(c) (d)

ISSN: 2319-8753
International Journal of Innovative Research in
Science, Engineering and Technology
(An ISO 3297: 2007 Certified Organization)
Vol. 2, Issue 12, December 2013
Copyright to IJIRSET www.ijirset.com 7191
BIOGRAPHY
Mr. Roshan Dsouza obtained his B.E Mechanical from Nitte Mahalinga Adyanthaya Memorial
Institute of Technology, Nitte in 2010 and is PG student (M Tech in Product Design &
Manufacturing) at East Point College of Engineering & Technology, Bangalore.
Mr. Praveen M P, Presently working as Associate Professor in East Point College of Engineering and
Technology, Bangalore. He did his M. tech in Computer Integrated Manufacturing from V.T.U,
Balgaum, Karnataka. He has published several papers in International Journals. His research area is
in Artificial Intelligence.


