Development of iron and zinc enriched mungbean ( Vigna ...
176
Development of iron and zinc enriched mungbean (Vigna radiata L.) cultivars with agronomic traits in consideration Renu Singh
Transcript of Development of iron and zinc enriched mungbean ( Vigna ...

Development of iron and zinc enriched mungbean (Vigna radiata L.) cultivars with
agronomic traits in consideration
Renu Singh

Thesis committee Promotor Prof. Dr R.G.F. Visser Professor of Plant Breeding Wageningen University Co-promotor Dr A.W. van Heusden Senior Scientist, Wageningen UR Plant Breeding Wageningen University and Research Centre Other members Prof. Dr M.A.J.S. van Boekel Wageningen University Prof. Dr P.C. Struik, Wageningen University Dr A. Melse-Boonstra, Wageningen University Dr J.C.M. Verhoef, Wageningen University This research was conducted under the auspices of the Graduate School Production Ecology & Resource Conservation.

Development of iron and zinc enriched mungbean (Vigna radiata L.) cultivars with
agronomic traits in consideration
Renu Singh
Thesis submitted in fulfillment of the requirements for the degree of doctor
at Wageningen University by the authority of the Rector Magnificus
Prof. Dr M.J. Kropff, in the presence of the
Thesis Committee appointed by the Academic Board to be defended in public
on Monday 30 September 2013 at 11 a.m. in the Aula.

4
Renu Singh Development of iron and zinc enriched mungbean (Vigna radiata L.) cultivars with agronomic traits in consideration 175 pages. PhD thesis, Wageningen University, Wageningen, NL (2013) With references, with summaries in Dutch, English and Hindi. ISBN 978-94-6173-684-0

5
Contents
Chapter 1 General Introduction
Chapter 2 Genetic improvement of mungbean (Vigna radiata L): Necessity to
increase the levels of the micronutrients iron and zinc. A review
Chapter 3 Genetic Diversity of Mungbean (Vigna radiata L.) in Northern India
Chapter 4 How Quality Traits of Mungbean can enhance Food Sovereignty
Chapter 5 Genetic variation and correlation studies between micronutrient (Fe
and Zn) content, protein content and some quantitative traits in
mungbean (Vigna. radiata L.)
Chapter 6 Differential response of mungbean (Vigna radiata L.) varieties to
changes in environmental conditions
Chapter 7 Towards Marker Assisted Breeding for Micronutrients (Fe and Zn) in
Mungbean
Chapter 8 General Discussion and Perspectives
References
Summary in English
Summary in Dutch
Summary in Hindi
Acknowledgements
About the author
List of publications
Education certificate

6

7
CHAPTER 1
General Introduction

8
Pulse crops are a cheap and rich source of protein, carbohydrates and micronutrients
and have a special position in Indian agriculture, because it is a vegetarian society.
They are particularly important for the part of the population in developing countries,
who can hardly afford to consume animal protein in adequate amounts. The large
number of vegetarians in India depend for a major part of their protein intake on
pulses. Pulses contain 20-25% protein on dry-seed basis, which is almost 2-3 times
higher as in cereals.
Pulses are grown on 68.3 million hectare and contribute 57.5 million tonnes to
the world’s food basket. India’s share is 35.2% of the area and 27.6% of the global
production. The production of pulses in India has declined during the last three
decades. As a result, per capita availability of pulses per day has progressively
declined from 60.7 g in 1951 to 35.9 g in 2000. Among the pulse crops, mungbean
(also known as green gram, moong dal, golden gram, chiroko, oregon pea, Chickasaw
pea, chickasono pea; Vigna radiata L.) is important and widely grown as a Kharif
crop (crops that are sown in the rainy season). The total area in the world where
mungbean is grown is 5.5 million hectare with a production of 2.5 to 3.0 million
metric tonnes, of the 5.5 million hectare 4 million hectare are in South Asian countries
with a production of about 1.75 million tons. India grows mungbean on 3.34 million
hectare with a production of about 1.06 million tonnes (average productivity of 317
kg/ha (Singh 2006)). In South Asia, the area under pulses has been decreasing from
27 to 24 million hectare from 1963-2003 although the production increased from 13.5
to 15 million tonnes (Jat et al. 2006; Figure 1).
Figure 1 Average annual growth rate in production (1985 to 2000) of mungbean
(V.radiata L.) in S. Asia

9
Following India, China is second in mungbean production with about 0.5
million hectare and some stable varieties (VC 1973A) of China have an average yield
of 2000 kg/hectare (Jat et al. 2006). In Thailand and the Philippines mungbean is the
most important grain legume, in Sri Lanka it is second and in India, Bangladesh,
Myanmar and Indonesia mungbean ranks third. It is also grown in parts of Africa,
America, Australia and Canada.
Centre of origin, domestication & dissemination
Mungbean belongs to genus Vigna, which includes about 150 species; 22 species are
native to India and 16 to Southeast Asia. However, the largest numbers of species are
from Africa. Mungbean is diploid (2n=2x=22) and has a small genome size i.e. 0.60
pg/1C (579 Mbp) (Somta and Srinives 2007). The primary centre of diversity for
mungbean is thought to be the central Asia region with India as the gene centre and
the probable centre of domestication and dissemination. It has been shown that
mungbean has been derived from a cross between wild V. radiata. var. sublobata
(Roxb.) and V. radiata var. radiata (Shanmugasundaram, 1988). A few closely related
species with their common names and origin are listed in Table 1.
Table 1 Some wild and cultivated species of Vigna with their common names and centres of origin
Species Common names Origin
V. aconitifolia (Jacq.) Moth bean South Asia
V. angularis (Wild) Red bean Northeast Asia
V. glabrescens (Marechal, Mascharpa & Stainier)
Dau Xanh Vo Xam Southeast Asia
V. mungo (L.) Hepper Urd bean, blackgram India
V. radiata (L.) Wilczek Mungbean, moong India
V. trilobata (L.) Verdc. Jungli bean South Asia
V. umbellate (Thunb.) Red bean Southeast Asia
A molecular study, using 19 SSR primers and over 415 cultivated (V. radiata
var. radiata), 189 wild accessions (V. radiata var. sublobata) and 11 intermediates
from different geographic locations revealed that mungbean had the highest diversity
in South Asia, supporting the view that the Indian sub-continent is the centre of
domestication for mungbean (Somta and Srinives 2007). The world vegetable Centre
in Asia (AVRDC) is established in 1971 and works also as the major centre for
genetic improvement of mungbean. It maintains about 5,900 accessions what is the

10
largest collection of mungbean germplasm in the world (Somta et al. 2009;
Shanmugasundaram et al. 2009).
Classification, description and the importance of mungbean
The taxonomic status of mungbean by Lambrides and Godwin 2007 is as follows:
Kingdom Plantae Family Fabaceae
Sub kingdom Tracheobionta (Vascular plants) Tribe Phaseoleae
Division Magnoliophyta (flowering plants) Genus Vigna
Class Magnoliopsida (Dicotyledons) Subgenus Ceratotropis
Subclass Rosidae Species Radiata
Order Fabales Subspecies Radiata
Plant characteristics
Mungbeans are annuals, medium to long in size (ranging from 30 to over 100 cm),
erect to sub-erect and highly branched. Leaves are trifoliate with long petioles. The
inflorescence occurs in clusters from five to twenty flowers, flowers are usually
yellow and have typical legume ‘butterfly’ floral morphology with a large standard
petal, two wing petals and two fused petals that form the keel, ten anthers and a single
style (Figure 2).
Figure 2 Mungbean leaf (left) and flower (right)
The plant starts flowering 30 to 45 days after sowing and continue flowering
for many weeks, resulting in non-uniformity in pod maturity. Pod length varies from 4
11
to 11 cm and contains more but smaller seeds (< 8.0 g/100) than black gram (Figure
3).
Figure 3 Mungbean pods (left) and seeds (right)
The pods are green in color and turn darker as they mature (Figure 4). Seeds
are greenish-yellow to blackish. The crop is self-pollinating and of short duration (55
to 90 days). Mungbean is fairly well adapted to sandy loam soils and dry conditions,
and can be grown in the warm season in tropical and sub-tropical regions where it can
tolerate even drought. Mungbean is in a symbiotic relationship with Rhizobium which
enables it to fix atmospheric nitrogen (Table 2)
Table 2 Estimates of the amount of nitrogen fixed by different legumes
Legume Species Nitrogen fixed* (kg/ha/yr) Source
Faba bean 82-174 Peoples & Griffiths, 2009
Lentil 60-110 Peoples & Griffiths, 2009
Field pea 85-166 Peoples & Griffiths, 2009
Urd bean 30-74 IIPR (http://www.iipr.res.in/mullarp.htm)
Mungbean 58-109 Singh & Singh, 2011
*locations have impact on the amount of nitrogen to be fix
Importance
Mungbean has its own importance in the rural economy (Figure 5). It is
nutritious and very popular because of its high digestibility and with hardly a
flatulence effect commonly associated with many grain legumes. Whole seeds can be
eaten after boiling, or split and made into dhal (thick soup). It is also used in various
fried and spiced dishes such as noodles and balls. For household consumption and

12
Mungbean Atmospheric nitrogen fixation
Increase soil fertility
Increased yield/less input of
fertilizers
Income Strengthening of the farmers
Grain/Seed
Protein Source in diet
Fodder
Selling to other villagers/market
Animals Manure
Figure 5 Socio-economic importance of Mungbean
selling the seeds are the most important, mungbean fetches a very good market price
and thus is good for farmers.
Figure 4 Mungbean plant in field with green (left) and fully mature (right) pods.
Dried seeds are sometimes used for animal feeding, particularly poultry.
Toasting or boiling is recommended to improve its nutritional value. The green
immature seed pods are occasionally eaten as a vegetable. Mungbean, being a short
duration crop, is used as a rotational crop or cover crop by farmers. The leaves and
stalks can be utilized for animal feeding.

13
Nutritional value
Mungbean has always been considered as a nutritional and healthy food. It can be
used in many forms from salads to soup or just as a vegetable. Sprouted seeds of
mungbean contain pure vitamins A, B, C, and E, and minerals such as iron, calcium
and phosphorous. On a dry-weight basis mungbean contains 22 to 28% protein, 1.0 to
1.5% fat, 3.5 to 4.5% fibre, 4.5 to 5.5% ash and 60 to 65% carbohydrate (annex I).
Mungbean is a good source of amino acids like aspartic acid, glutamic acid and it’s a
fairly good source of some essential amino acids like isoleucine, leucine, lysine,
phenylalanine (Lambrides and Godwin 2007). The sprouts are free of cholesterol. One
cup of mungbean sprouts contains approximately 80 kcal, 3 g of protein, 6 g
carbohydrates, 2 mg of iron and only 0.2 g of fat. Mungbean sprouts are also a rich
source of fibre, easily digestible and containing a high concentration of enzymes
facilitating the digestive process. Mungbean can be complemented with cereals.
Washing and chilling the raw mungbeans will reduce the risk of infection by harmful
bacteria while cooking will destroy bacteria.
Current status of molecular marker research in mungbean
In several South Asian countries like India, Sri-Lanka, Bangladesh and Pakistan
research on mungbean is being conducted (Vijayalakshmi et al. 2003). Recently,
attention has been focused on developing nutritionally enriched varieties. In order to
identify alleles of relevant genes in mungbean, genetic diversity within the available
germplasm needs to be studied. Genetic diversity studies in mungbean have been
carried out by Santalla et al. 1998; Lakhanpaul et al. 2000; Cheng and Yang. 2001;
Afzal et al. 2004 and Betal et al. 2004. High levels of polymorphisms were found by
using ISSRs, SSRs and RAPDs (Chattopadhyay et al. 2005; Gwag et al. 2006; Dieu
and Le, 2005; Lavanya et al. 2008). SSRs developed in other pulse crops like
common beans and cowpea can sometimes be used in mungbean. Similarly, RFLP
probes from common beans, cowpea and soybeans have been used in mungbean
research (Somta and Srinives 2007). Comparative genomics between V. radiata with
V. unguiculata and P.vulgaris showed that there were conserved blocks of
considerable size with some genes for important traits (Fatokun et al. 1993; Menacio-
Hautea et al. 1993). Six molecular linkage maps of mungbean using F2 or
recombinant inbred lines (RIL) were published. These maps differ in length (737.9-
1570 cM), number of markers (102-255 markers) and number of linkage groups

14
(Somta and Srinives 2007). In mungbean QTLs for major traits such as insect and
disease resistance (Lambridges et al. 1999) and seed related characters (Humphry et
al. 2005) have been identified. Mungbean yellow mosaic virus (MYMV) causes
yellowing of leaves in legumes including mungbean. It causes heavy losses.
Lambrides et al. 1999 used the BSA strategy to identify markers for MYMV in
mungbean. One RAPD marker (primer OPAJ 20) was found to be distantly linked to
the resistance gene. Further markers (ISSR & SCAR) linked to disease resistance in
black gram have potential for locating genes in mungbean (Somata et al. 2007). Maiti
et al. 2011 developed QTL for MYMV from consensus motifs resistance (R) genes
from other crops. QTL for Phytic acid (PAP), total P (TP) and inorganic P (IP) in
mungbean F2 population were identified (Sompong et al. 2012). In grain legumes
seed weight is one of the primary components for yield. In an F2 population of the
cross between VC3890 and TC1966, four QTLs were identified by Fatokun et al.
1992, these QTLs accounted for 49% of the trait variation. Phytic acid inhibits the
absorption of certain mineral micronutrients like Fe and Zn in cereals and legumes.
Seed derived dietary PA contributes the mineral micronutrients deficiency in humans.
In seeds of mungbean seven QTL were identified for P; two for PAP; four for IP and
one for TP. No QTLs for iron and zinc content are described yet in mungbean.
Identification of any molecular marker for high iron and zinc will allow Marker
Assisted Selection (MAS) for the improvement of these important micronutrients in
mungbean.
Scope and outline of thesis
In this thesis, efforts are made to analyze mungbean production and consumption in
India, to find agronomic and molecular diversity in the mungbean germplasm and to
develop recombinant inbred lines based on two crosses between one high and one low
micronutrient genotype. The following and selected crosses were used in the
experiment: BG39 X 2KM138 and SMH 99-1 X BDYR1.
Chapter 2 focuses on the mungbean quality traits with respect to production,
consumption, processing and nutritional which can enhance the food sovereignty
concept. For this objective combined effort was carried out by the TELFUN (Indian)
team. A survey of 100 farmers, 150 consumers, 100 processors and 116 rural women
were carried out individually by each team member. The results were interpreted
against the background of food sovereignty.

15
Chapter 3 gives a review about potential genetic improvement of mungbean in
regard to micronutrient levels. Micronutrient deficiency especially iron and zinc is
rising at an alarming rate throughout the world especially in women and children.
Therefore focus should be set on providing healthy food like legumes.
Chapter 4 presents an agronomic study carried over the mungbean germplasm
lines. An effort was made to see the variation in the germplasm lines in context to
maturity, yield, yellow mosaic virus resistance, micronutrients (iron and zinc) and
protein.
Chapter 5 introduces the requirement and limitations in the mungbean
production in the Indian society. Further genetic diversity analysis using AFLP’s and
ISSR was carried out in cultivars selected by farmers in varietal selection programme
and few other cultivars. For this objective, a combination of the conventional survey
strategy, participatory varietal selection, molecular markers and chemical analysis
was used.
Chapter 6 reports about the genotype and environment interaction studies with
a number of genotypes from the previous molecular experiment. In this chapter,
efforts were made to select the best lines with main emphasis on micronutrients.
Different doses of fertilizers and micronutrients were given and the allocation in the
plant was determined.
Chapter 7 describes genetic studies with iron and zinc content in the
individuals of the RIL population derived from two crosses i.e. BG39 X 2KM138 and
SMH99-1 X BDYR1. All individual lines were analyzed through chemical analysis
for iron and zinc content. A start was made with introducing molecular markers in
these populations.
Chapter 8 gives a general discussion about the results found in the different
experimental chapters and the importance of these findings for the mungbean
improvement programme are discussed. The path and stability analysis shows positive
genotypic and phenotypic studies in various characters. Further characters were
studied to see the direct and indirect effects (Gill et al. 1995; Maht and Mahto 1997;
Hassan et al. 1995). The correlation studies between micronutrients (fe & zn) shows a
positive corelation (r = 0.47). The results were supported by various studies in other
legumes and crops like Tryphone and Masolla 2010 in common bean, Thavarajah et

16
al. 2010 in lentils, Anandan et al. 2011 in rice, Velu et al. 2011 in wheat etc.. Further
molecular studies revealed moderate genetic variability. This is supported by Bhat et
al. 2005 study in mungbean genotypes. In GxE experiment, it was noticed that there
was variable pattern of response for different characters in different environments was
observed. Similar results were observed by Singh et al. 1990; Singh et al. 1991 and
Popalghat et al. 1999. An effort was made to initiate the molecular studies in RIL’s
population. The chemical analyses of RILs show a positive correlation between
micronutrients which was supported by Beebe et al. 2000; Guzman-Maldonado et al.
2003. In the last part, an overall impact of plant breeding, food sovereignty and
TELFUN in the Indian society was discussed along with the positive and negative
aspects of such interdisciplinary projects.
References
Afzal MA, Haque MM, Shamugasudaram S (2004) Random amplified polymorphic DNA (RAPD) analysis of selected mungbean (Vigna radiata L. Wilczek) cultivars. Asian Journal of Plant Science 3 (1): 20-24.
Anandan A, Rajiv G, Eswaran R, Prakash M (2011) Genotypic variation and relationships between quality traits and trace elements in traditional and improved rice (Oryza sativa L.) genotypes. Journal of Food Science 76: H122-H130.
Beebe S, Gonzalez A, Rengifo J (2000) Research on trace minerals in the common bean. Food and Nutrition Bulletin 21:387–391.
Betal IS, Chaowdhury PR, Kundu S, Raychaudhuri SS (2004) Estimation of genetic variability of Vigna radiata cultivars by RAPD analysis. Biologia Plantarum 48 (2) 205-209.
Chattopadhyay K, Ali MN, Sarkar HK, Mandal N, Battacharya S (2005) Diversity analysis by RAPD and ISSR markers among the selected mungbean (Vigna radiata L. Wilczek) genotypes. Indian Journal of Genetics and Plant Breeding 65 (3): 173-175.
Cheng XZ, Yang CV (2001) study on relationships among species in mungbean group using RAPD markers. Scientia Agricultura Sinica 34 (2) 216-218.
Dieu TMH, Le TB (2005) Genetic diversity of 57 mungbean cultivars (Vigna radiata L.) by RAPD. Cong nghe sinh hoc. 3 (1): 57-66.
Fatokun CA, Menancio-Hautea DI, Danesh D, Young ND (1992) Evidence for orthologous seed weight genes in cowpea and mung bean based on RFLP mapping.Genetics 132: 841–846.
Fatokun CA, Danesh D, Young ND, Stewart EL (1993) Molecular taxonomic relationship in the genus Vigna based on RFLP analysis. Theoretical Applied Genetics 86: 97-104.
Gill JS, Verma MM, Gumber RK, Balwant S (1995) Character association in mungbean lines derived from three interval crosses in mungbean. Crop Improvement 22 (2): 255-260.

17
Gwag JG, Chung HK, Lee JH, Ma KH, Dixit A, Park YK, Cho EG, Kim TS, Lee SH (2006) Characterization of new microsatellite markers in mungbean, Vigna radiata L. Molecular Ecology Notes 6 (4): 1132-1134.
Hassan MS, Siddique A, Malek MA (1995) Correlation studies on mungbean. Bangladesh Journal of Agriculture Research 20: 12-13.
Humphry M, Lambrides C, Chapman S, Aitken E, Imrie B, Lawn R, McIntyre C, Liu C (2005) Relationships between hard-seededness and seed weight in mungbean (Vigna radiata) assessed by QTL analysis. Plant Breeding 124: 292-298.
Indian Institute of Pulse Report (IIPR). AICRP MULLARP Mission (http://www.iipr.res.in/mullarp.htm )
Jat ML, Raj K, Gupta OE, Ortiz R (2006) Diversifying the intensive cereal cropping systems of the Indo-Ganges through horticulture. Chronica Horticultrae 46 (3): 16–20.
Lakhanpaul S, Chadha S, Bhat KV (2000) Radom amplified polymorphic DNA (RAPD) analysis in Indian mungbean (Vigna radiata (L.) Wilczek) cultivars. Genetica 109 227-234.
Lambrides CJ, Diatloff AL, Liu CJ, Imrie BC (1999) Proceedings of the 11th Australasian Plant Breeding Conference, Adelaide, Australia.
Lambrides CJ, Godwin ID (2007) School of Land and Food Sciences, Plant Improvement Group, The University of Queensland, St Lucia, QLD 4072, Australia (chapter mungbeans).
Lavanya GR, Srivastava J, Ranade SA (2008) Molecular assessment of genetic diversity in mung bean germplasm. Journal of genetics 87: 65–74.
Maht RN, Mahto JL (1997) Correlation and regression study in black gram for yield attributes under rainfed conditions. Environment and Ecology 15 (3): 556-558.
Maiti S, Basak J, Kundagrami S, Kundu A, Pal A (2011) Molecular marker-assisted genotyping of mungbean yellow mosaic India virus resistant germplasm of mungbean and urdbean. Molecular Biotechnology 47: 95-104.
Maldonado SHG, Martínez O, Acosta-Gallegos JA, Lara FG, Octavio Paredes-López (2003) Putative Quantitative Trait Loci for Physical and Chemical Components of Common Bean. Crop Science 43: 1029-1035
Menancio-Hautea D, Fatokun CA, Kumar L, Danesh D, Young ND (1993) Comparative genome analysis of mungbean (Vigna radiata (L.) Wilczek) and cowpea (V.unguiculata L.) using RFLP mapping data. Theoretical Applied Genetics 86: 797-810.
Popalghat GR, Patil JV, Deshmukh RB, Mhase LB (1999) Stability for yield and yield components in chickpea (Cicer arietinum L.). Legume Research 22:254-258.
People M, Griffiths J (2009) The legume story- how much nitrogen do legumes fix? Farming ahead, Khondinin group. June: 50-52.
Santalla M, Power JB, Dave MR (1998) Genetic diversity in mungbean germplasm revealed by RAPD markers. Plant Breeding 117 (5): 473-478.
Shanmugasundaram S (1988) A catalog of mungbean cultivars released around the World. AVRDC, Shanhua, Taiwan. 20.
Shanmugasundaram S, Keatinge JDH, Hughes JA (2009) The Mungbean Transformation, Diversifying Crops, Defeating Malnutrition. IFPRI Discussion Paper 00922, Supported by CGIAR.
Singh DP, Singh BB (2011) Breeding for tolerance to abiotic stresses in mungbean. Journal of Food Legumes 24(2): 83-90.

18
Singh J (2006) Country report for India (1). In Processing and utilization of legumes, ed. S. Shanmugasundaram. Tokyo, Japan: Asian Productivity Organization.
Singh G, Brar HS, Verma MM (1991) Genotype environment interaction and phenotypic stability in chickpea. Crop Improvement 18:135-140.
Singh KB, Williams PC, Nakkoul H (1990) Influence of growing season, location and planting time on some quality parameters of kabuli chickpea. Journal of the Science of Food and Agriculture 53: 429-441.
Sompong Utumporn, Somta Prakit, Raboy Victor, Srinives Peerasak (2012) Mapping of quantitative trait loci for phytic acid and phosphorus contents in seed and seedling of mungbean (Vigna radiata (L.) Wilczek). Breeding Science 62: 87–92.
Somta Prakit, Srinives Peerasak (2007) Genome Research in Mungbean [Vigna radiata (L.) Wilczek] and Blackgram [V. mungo (L.) Hepper] ScienceAsia 33 69-74 Supplement 1.
Somta P, Sommana W, Srinives P (2009) Molecular diverstity assessment of AVRDC- The World Vegetable Centre elite- parental mungbeans. Breeding Science 59: 149-157.
Thavarajah D, Thavarajah P, See Chai-Thiam, Vandenberg A (2010) Phytic acid and Fe and Zn concentration in lentil (Lens culinaris L.) seeds is influenced by temperature during seed filling period. Food Chemistry 122: 254-259.
Tryphone GM, Msolla SN (2010) Diversity of common bean (Phaseolus vulgaris L.) genotypes in iron and zinc contents under screen house conditions. African Journal of Agriculture Research 5 (8): 738-747.
Velu G, Ortiz-Monasterio I, Singh RP, Payne T (2011) Variation for grain micronutrients concentration in wheat core-collection accessions of diverse origin. Asian Journal of Crop Science 3: 43-48.
Vijayalakshmi P, Amirthaveni S, Devadas RP, Weinberger K, Tsou SCS, Shanmugasundaram S (2003) Enhanced bioavailability of iron from mungbeans and its effects on health of school hildren. AVRDC Technical Bulletin No. 30 Shanhua, Taiwan.

19
CHAPTER 2
Genetic improvement of mungbean (Vigna radiata L): Necessity to increase the levels of the micronutrients iron and zinc.
A review
Renu Singh, Adriaan W. van Heusden, Ram Kumar and Richard G.F. Visser
Part of this paper was published in National Journal of Plant Improvement: 2008, Volume 10 (2): 69-74.

20
Abstract
Mungbean [Vigna radiata (L.) R.Wilczek] is an important grain legume crop, grown
mainly in South Asian countries, which offers many nutritional and economic
benefits. Plant breeding and genetic engineering, have a great potential to increase
productivity in general and also to increase nutritional values in different plant parts
such as grains, roots and tubers. Mungbean is one of the crops that can be targeted for
improvement of micronutrient content. It is consumed in large parts of the developing
world, especially in Asia. Increasing the content of micronutrients is only useful if the
bioavailability of these micronutrients is good, this depends among others on the
concentration of inhibitors such as phytic acids (PA) and phenol compounds. This
review advocates the necessity of genetic improvement of mungbean, emphasizing on
increasing the levels of micronutrients, particularly iron and zinc through a multi-
disciplinary team approach including: genetic improvement, bioavailability and social
awareness. The monotonous consumption of cereals in vegetarian populations leads to
malnutrition and hence, overall deterioration in the health status of many people in the
developing world. Therefore, combining breeding with good processing methods and
making people aware about improved varieties available on the market further helps
in improving their health status.
Keywords: Genetic improvement, phytic acid, iron, mungbean, malnutrition,
multidiscipline, zinc.
21
Introduction
The global population, which reached 7 billion in 2012, is estimated to increase to 8.3
billion in 2020; the developing world contributes most to this increase (Miflin 2000).
Plant breeding effectively contributed in preventing massive starvation by increasing
the production of staple food such as rice and wheat during the green revolution in the
1960’s. However, this resulted in the negligence of breeding efforts in a large number
of other crops which are nutritionally important. Monotonous consumption of cereals,
in absence of, for instance animal tissue and pulses, leads to deterioration in the
overall nutritional status (Zimmermann and Hurrell 2002). According to the World
Health Organization (WHO 2008), more than 2 billion people worldwide, including
women, children, the middle-aged, and the elderly are suffering from vitamin and
mineral deficiencies, primarily iodine, iron, vitamin A and zinc (Allen et al. 2006).
For instance, two billion people - over 30 percent of the world’s population - are
anemic, mainly due to iron deficiency and this is still rising in an alarming rate among
poor women and children below the age of 5 (World hunger facts 2011). Iron
deficiency also leads to anemia that is already affecting over half a billion people
worldwide. Zn is also an important trace element and it is estimated that over 30% of
the world population has a Zn deficiency. Zn is required for functioning of immune
system, protein synthesis, cell reproduction and wound healing; furthermore it plays a
major role in fertility and conception. During the 20th century, conventional plant
breeding resulted in increased yields and harvest stability. Major research objectives
in the past few decades have concentrated on increasing resistance to environmental
stresses, pests and pathogens (Borlaug 2000; Zimmermann and Hurrell 2002). But
simply providing more food will not completely solve the problem of incomplete
diets, therefore focus should be set on the quality and diversity of crops (e.g., Munger
1988; Quebedeaux and Bliss 1988; Quebedeaux and Eisa 1990). Pulses are
nutritionally as well as economically very important to vegetarians and poor people
worldwide and efforts are being made for the development of high yielding varieties
of pulses such as mungbeans (Khattak et al. 2006). Despite, the nutritional importance
of mungbean [Vigna radiata (L.) R.Wilczek] limited research has been conducted to
further improve its nutritional properties. One solution to micronutrient deficiency in
the vegetarian diet could be higher consumption of pulses with enhanced levels of Fe
and Zn.

22
The genus Vigna is pantropical and includes about 170 species, 120 from
Africa, 22 from the Indian continent and Southeast Asia, and the rest from other parts
of the world. Mungbean, also known as green gram, belongs to the subgenus
Ceratotropis and is an important crop among legumes. Mungbean is diploid with
2n=22 and it has a small genome size of 0.60 pg/1C (579 Mbp) (Somta and Srinives
2007). In India, mungbean occupies about 3 million ha, with a production of 1.42
million tons (Singh and Ahlawat 2005; Table 1). The total production of dry beans
(including Phaseolus and Vigna spp.) was stagnant over the past 20 years except in
Nepal, Pakistan and Myanmar where production increased. In India, the consumption
pattern of mungbean depends strongly on income and price. Forty percent of all
households consume mungbeans and on average, households consume 110 g per
month. About 15% of the money spend to buy pulses is for buying mungbeans
(Vijayalakshmi et al. 2003).
Table 1 Area, yield and average growth rate of dry beans (including Phaseolus and Vigna spp.) in South Asian countries (2001)
Countries Area
(1000 ha)
Yield (kg/ha)
Annual growth rates
Area
(%)
Yield
(%)
Production
(%)
Bangladesh 84 680.4 -2.4 0.4 -2.0
India 7100 362.0 -1.1 0.6 -0.5
Nepal 39 693.0 3.1 0.6 3.7
Pakistan 219 476.7 2.4 -0.4 2.0
Sri Lanka 27 512.2 -1.1 -2.0 -3.1
South Asia 7,469 317.2 -1.0 0.6 -0.4
FAOSTAT, 2002
Growing mungbean improves the soil because it fixes atmospheric nitrogen
with the help of Rhizobium. This partially replaces the use of inorganic fertilizers
(Safdar et al. 2005). The benefits of legumes to soil nitrogen fertility have been
reported for various cropping systems (Ahmad et al. 2001). The economic impact of
mungbean as a nitrogen fixer was described by Arif and Malik (2009). They showed
that the highest gross and net benefits were achieved by intercropping mungbean and
groundnut.

23
As mungbean offers many nutritional and economic benefits and is a good
source of protein, breeding efforts should concentrate on enhancing micronutrient
levels (Fe and Zn). Therefore this review focuses on breeding crops particularly
mungbean, which relatively can prove helpful in solving the problem of iron and zinc
deficiency.
Nutritional importance of micronutrients (Fe and Zn) and proteins
Fe and Zn are essential nutrients for normal functioning of humans (Table 2). Their
concentrations can be too low due to insufficient uptake or insufficient bioavailability.
Bioavailability can be enhanced by specific promoters like ascorbate (vitamin C), β-
carotene (pro-vitamin A), protein cysteine and various organic and amino acids (Table
3).
Table 2 Some of the essential functions of micronutrients (Fe & Zn) in plants,
animals and humans
Elements Prevalence of Deficiency
Plant Animal and Human
Zinc High in developing world
i. Constituent of several enzymes
ii. Plays essential role in DNA transcription
iii. Maintains the integrity of membranes and is involved in pollen formation
iv. Regulating auxin synthesis and thus preventing diseases like “little leaf”.
v. As in animals, Zn-metalloenzymes, and Zn fingers play a role in plants
i. Functions as anti-oxidant and is involved in biochemical reactions
ii. Acts as catalyst for the enzymes involved in cell growth. It is important in metabolism of Vitamin A and collagen
iii. Essential for DNA function and involved in regulation of gene transcription
iv. Zn is essential in protein synthesis, cell division and growth.
v. Reproduction and neurological function.
vi. Zn-metalloenzymes and Zn-fingers play a role in folding of proteins
Iron 2 billion
i. Cytochromes and metalloenzymes.
ii. Necessary in photosynthesis,
iii. Involved in nitrogen metabolism as it is part of enzyme
i. Fe is a constituent of hemoglobin and myoglobin which are essential components for storing and diffusing oxygen
ii. Important for neurological functioning and

24
Source: Srivastava and Gupta (1996)
Table 3 Inhibitors and enhancers of iron and zinc bioavailability
Element RDA RNI UL SUL Inhibitors Enhancer
Fe (mg) 8.0-18.0 11.4 45.0 17.0
Phytate, tannins, oxalate, fiber, hemaglutinins
Phytoferritin, riboflavin, ascorbate,
b-carotene, cysteine, histidine, lysine, fumarate, malate, citrate
Zn (mg) 8.0-11.0 9.5 40.0 25.0
Phytate, tannins, fiber, hemaglutinins
Phytoferritin, riboflavin, ascorbate,
b-carotene, cysteine, histidine, lysine, fumarate, malate, citrate
Source: White & Broadley (2005). The US recommended daily allowances (RDA, or adequate intakes), the UK guidance daily reference nutrient intakes (RNI), the US tolerable upper intake levels (UL), and the UK guidance safe upper levels (SUL) for adults
Ironically, the spread of micronutrient deficiency is related to the spread of
high-yielding rice, wheat and maize varieties during the first phase of green
revolution. These varieties are generally low in micronutrients, but also have
displaced a variety of crops grown previously, such as pulses, vegetables and fruits
which used to prevent a lack of micronutrients (Roozendaal 1996). Micronutrient
malnutrition affects primarily the underprivileged population (Table 4) (Buyckx 1993;
Ramalingaswami 1995).
nitrogenase iv. Iron is also part of the
enzyme leg-heamoglobin (role in nitrogen fixation)
v. Prevents plants from severe physiological disorders like necrosis and chlorosis
vi. Heme is essential component of cytochrome protein and thus mediates redox reactions
development iii. Involved in redox reaction
and thus responsible for cellular growth

25
Table 4 Effect of micronutrient deficiency on human health at different stages of life.
Age Group/ Stage Effect over health
<5 i. High mortality rate ii. Low birth weight iii. Impaired mental development
5-11
i. Growth is stunted ii. Reduced mental growth iii. Less active & susceptible to diseases iv. Delayed sexual development
12-17
i. Physically and mentally less active ii. Delayed puberty in adolescents iii. May become anemic iv. Poor immune system
18-50 i. Anemic, sometimes reach to pernicious anemia stage ii. Give birth to low weight babies iii. Depression
>50 i. Retinal detachment ii. Susceptible to many diseases iii. Diminished wound healing
Source: Seres, ACC/SCN, 2000
Iron (Fe)
In humans the uptake and absorption of iron is complex and depends on many factors.
There are two forms of Fe in food: non-heme Fe and heme Fe. The heme Fe is mainly
present in animal tissue, has a high bioavailability and is weakly influenced by other
factors present in diets while the non-heme Fe comes from vegetables and legumes
and its absorption depends on various dietary components (Lopez and Martos 2004).
Many people in poor regions of the world consume low amounts of animal tissue and
rely almost entirely on non-heme Fe.
Breeding can play a vital role in lowering iron deficiency in the world by
increasing the concentration of these micronutrients in edible tissues. For example, a
rice variety has been developed with four times higher iron content than any normal
variety (Haas et al. 2005). A similar effort should be made in developing high-level
micronutrient legumes and seeds (Pennington and Young 1990). The combination
with high protein content is essential in fighting against protein energy malnutrition
(PEM) and micronutrient malnutrition.

26
Zinc (Zn)
Zinc is the second most abundant element in organisms. It stabilizes the structure of
the membranes and cellular components (http://www.ctds.info/zinc1.html) and it is an
essential component of a large number of Zn-dependent enzymes. It also plays a
major role in gene expression (Sandstrom 1997). Deficiency of Zn in human reduces
growth, sexual maturity and weakens the immune defense system (Prased 1996).
About 70% of Zn in the US diet is provided by animal products (Sanstead 1995).
However, in many parts of the developing world this is not the case, here most Zn is
provided by cereals and legume seeds.
However, these plants also have high concentrations of phytic acid, which is a
potent inhibitor of Zn absorption (Navert et al. 1985). Marginal Zn deficiency (10-12
mg/ day) in humans may be wide spread, but remains unnoticed because there is no
established clinical method for determining marginal Zn deficiency in humans (Endre
et al. 1990; Larsen 1997; Shrimpton 1993; Welch and Graham 2002).
Zn deficiency in plants can be caused by Zn deficiency in soils (Cakmak 2002;
Nube and Voortman 2006) and about 50% of the agricultural soil in India is Zn
deficient (Gupta 2005). Zn deficiency became more prevalent during the green
revolution which involved heavy use of soil for the cultivation of crops such as rice.
The lowest Zn concentrations in India are in the soils of Haryana and Madhya Pradesh
(Gupta 2005) and a correlation was observed between low soil Zn content and the
occurrence of human Zn deficiency (Pathak et al. 2003a). Low Zn level can be
overcome by adding Zn to the soil. It has been shown that Zn increase in the soil leads
to Zn increase in grains (Rengel et al. 1999). However, whether adding Zn in soils can
lead to enough increase in levels of Zn in the plants to prevent human Zn deficiency is
still questionable (Cakmak 2002; Welch, 2002; Slaton 2005a).
Micronutrients assimilation mechanisms in plants
Plants get their minerals from the soil. The process of micronutrient uptake,
accumulation and their regulation is a dynamic process that should avoid deficiency
or toxicity in the plant. This process is dependent on various factors like transporters
within the plant, genotype of the plant and the environment (soil). To start a
successful breeding program there is the necessity to understand physiological

27
mechanisms of micronutrient absorption, translocation, remobilization in leaves and
re-translocation into seeds.
About 80% of the Fe is stored in chloroplasts and this accumulation is
developmentally controlled. In roots some essential proteins and enzymes like leg-
hemoglobin and nitrogenase are required for iron accumulation (Kaiser et al. 2003).
Plants can also uptake elements in gaseous or ions forms through their stomata and
cuticles. Cations like Fe2+ can be absorbed by the plants in gaseous forms with the
help of ectodesmeta i.e. non-plasmic channels in the leaves (Prasad, 2007).
Zinc accumulation in plants
Two mechanisms are functionally active in heavy metal uptake (i) energy independent
non-metabolic uptake and (ii) energy dependent metabolic uptake. In the first
mechanism Zn is taken across the plasma membrane of root cells as Zn2+ or as a Zn-
phytosiderophore complex while in the second mechanism Zn uptake takes place
through calcium (Ca2+) channels using energy (ATP).
Along with these two mechanisms several transporter gene families play a role
in Zn+ uptake and accumulation. One of the most important is the ZIP family
(Palmgren et al. 2008). Other transporter families involved in Zn accumulation and
transport include P-type (Monchy et al. 2007), ATPase-HMA (ATP dependent High
metal accumulator), MATE (multi drug and toxic compound extrusion) (Durrett et al.
2007), OPT (oligo-peptide transporter). Besides these gene families, cation diffusion
facilitators (CDFs) or MTPs (metal transporter proteins) are involved in transport of
Zn+ from cytoplasm to the vacuoles and the endoplasmic reticulum. MTP1 is highly
expressed in both roots and shoots (Verbruggen et al. 2009). The CaCA (Ca2+/cation
antiporter) super-family is thought to play a role in Zn2+ vacuolar storage via Zn2+/H+
exchange (Shaul et al. 1999). ZIPs, MTPs, HMAs, CaCA, APCS had high expression
levels in those plants which hyper accumulate Zn2+ (White et al. 2009) and can be
targets for breeding.
Iron accumulation in plants
Iron, which is widely distributed in the lithosphere, is taken up by plants in two
different ways: mechanism I (non-graminacious species) and mechanism II (cereals
and grasses).

28
In mechanism I, the Fe3+ present in the soil is chelated by phenolic compounds
secreted by the roots; this reduces Fe3+ to Fe2+ with the enzyme, ferric reductase.
Further, IRTs (iron regulated transporters) help in Fe2+ uptake and IRT1 is the major
root plasma membrane transporter. Iron uptake is regulated by signals from the shoot
when there is an iron deficiency. The nature of these signals is still unknown (Vert et
al. 2003).
Once iron is taken up by roots using active roots transporters, it is translocated
via the xylem sap to aerial parts (Elizabeth and Jean, 2004). The flow of iron from
source to acceptor tissues via phloem sap and the sub-cellular distribution is poorly
understood and documented.
Seed is a store-house of food and nutrients and for obtaining high
micronutrient levels it is important to understand the overall signalling networks
involved in accumulation of these metals in the various organs and at different stages
of development (Curie and Brieat 2003).
Iron and zinc bioavailability and biofortification
Bioavailability of Fe & Zn in a vegetarian diet
Generally the vegetarian diet contains equal amounts of iron as a non-vegetarian diet
but in the vegetarian diet the micronutrients have a lower bio-availability (Hunt
2003). The chemical form (heme and non-heme) of iron is an important factor
affecting the iron availability of vegetarian diets (Table 5).
Table 5 Bioavailability of iron from different food sources
Diet Iron forms Bioavailability Reference
Red meat supply
10-12% of total iron is of heme form
15-40% Hunt and Roughead., 1999
Fish & Poultry Heme concentration lower than non-vegetarian diet
1-15% Monsen et al. 1978
Vegetarian diet Non-heme - Roughead and Hunt.,
2000
As legumes have good concentrations of Fe and Zn, their inclusion in diets is
desirable (Table 6). But some diets alter or enhance the bioavailability of
micronutrients because of anti-nutrients and promoters. Plant diets are high in

29
phytates (6-phosphoinositol) and polyphenols, such as tannins which inhibit
absorption of iron and zinc (Holm 2002). Phytic acid binds essential micronutrients
and also forms complexes with micronutrients of other foods during intestinal
digestion. These complexes are not absorbed and result in low bioavailability. The
concentration of these anti-nutrients varies greatly between varieties and is usually
high in seeds and grains. Low phytate mutants (lpa) are known in major crops and
legumes like rice (O. sativa L.), wheat (T. aestivum L.), common bean (P. vulgaris L.)
and soybean (Glycine max L.) (Thavarajah et al. 2010; Campion et al. 2009; Guttieri
et al. 2006; White and Broadley 2005). Lower levels of anti-nutrients indirectly
results in a higher bioavailability.
Zinc bioavailability in a vegetarian diet is lower. Food, rich in zinc and
protein, like legumes, whole grains etc. (Sandstrom et al. 1980) are needed despite
their high phytate content. Overall there is a positive zinc balance (Johnson and
Walker 1992; Hunt 2003).
Biofortification using plant breeding and biotechnology
In order to increase the concentration of micronutrients in edible tissue like seed, two
strategies can be employed i.e., application of mineral fertilization and improvement
in mobilization of these minerals in the soil. Micronutrients can be added to the soil or
sprayed on the leaves. For example, although there is a fair amount of Fe in soils little
is available and Zn, Fe and Mg compete for uptake (Neue et al. 1998; Lind et al.
2003; Berger et al. 2006). Therefore it is good to use Fe-chelates and Zn-chelates as
soil fertilizers. Especially in the case of high concentrations of phosphate in soils
because they strongly reduce Zn availability (Marschner 1995).

30
Table 6 Variation in concentration of micronutrients
Legume Fe (mg kg-1)
(max-min)*
Zn (mg kg-1)
(max-min)* References
Bean (P. vulgaris) 35-92 21-59 Islam et al. 2002
Pea (P. sativum) 23-105 16-107 Grusak and Cakmak 2005
Soybean (G. max) - 59-83 Raboy et al. 1984
Chickpea (C.
arientinum) 24-41 35-60 Haq et al. 2007
Mungbean (V. radiata) 15-92 15-38 This thesis
Lentils (L. culinaris L.) 114 65 Thavarajah et al. 2010
*range of concentration from minimum to maximum
Current status of mungbean research
The cereal-cereal based cropping system pushed mungbean production to more
marginal environments. Despite mungbean’s productivity and nutritional benefits, its
production was either stagnant or decreasing. Disadvantages of growing mungbeans
are lack of good quality seed, unfamiliarity with good management practices and
susceptibility to various diseases especially mungbean yellow mosaic virus (MYMV).
Furthermore growing mungbeans is labour-intensive and low-yielding. But nowadays
the potential of mungbean to supply protein and to provide farmers with an income-
generating opportunity are recognized (Shanmugasundaram 2006). The efforts are
now aimed at solving the major constraints limiting mungbean production and also to
improve its nutritional composition.
In several South Asian countries like India, Sri-Lanka, Bangladesh and
Pakistan research on mungbean is being conducted (Vijayalakshmi et al. 2003).
Recently, attention has been focused on developing nutritionally enriched varieties. In
order to identify beneficial alleles of relevant genes in mungbean, genetic diversity
within the available germplasm needs to be studied. Genetic diversity studies in
mungbean have been carried out by Santalla et al. 1998; Lakhanpaul et al. 2000;
Cheng and Yang 2001; Afzal and Shamugasudaram 2004 and Betal et al. 2004. High
levels of polymorphisms were found by Chattopadhyay et al. 2005 using ISSRs and
by Dieu and Le 2005 using RAPDs. Microsatellites (Gwag et al. 2006) gave similar

31
results. SSRs developed in other pulse crops like common beans and cowpea can be
used in mungbean. Similarly, RFLP probes from common beans, cowpea and
soybeans have been used in mungbean research (Somta and Srinives 2007).
Comparative genomics between V. radiata with V. unguiculata and P.vulgaris
showed that there were conserved blocks of considerable size with some genes for
important traits (Fatokun et al. 1993; Menacio-Hautea et al. 1993). Six molecular
linkage maps of mungbean using F2 or recombinant inbred lines (RILs) were
published. These maps differ in length (737.9-1570 cM), number of markers (102-255
markers) and number of linkage groups (Somta and Srinives 2007). In mungbean
QTLs for major traits such as insect and disease resistance (Lambridges et al. 1999)
and seed-related characters (Humphry et al. 2005) have been identified.
Current status of breeding efforts for increasing micronutrient content
Breeding for improved mineral content is quite complicated because the effects of
individual loci are small and difficult to identify (Maldonado et al. 2003). It was
shown in common beans that wild varieties can have a higher ability to accumulate
iron (71-280 mg kg-1 compared to a mean Fe content of 100 mg kg-1 in cultivated
varieties) and Zn (24-38mg kg-1 compared to 17 mg kg-1) (Maldonado et al. 2000).
Maldonado et al. (2003) did a QTL mapping study and identified QTLs for seed mass,
Fe, Zn, and Ca concentration. They identified two unlinked QTLs for iron content and
one for Zn content. The two QTLs associated with Fe content explained ~ 25% of
variance whereas Zn QTL explained 15% of the variance. Gelin et al. (2007) found a
QTL in a RIL population for Zn concentration and a marker assisted breeding
program resulted in an increase in Zn content by 11.7% resp. 15.3%. Zn content was
not associated with iron content and higher levels of Zn didn’t result in lower levels of
Fe. Recent studies show that higher Zn concentrations in the seed can be caused by
only of a single dominant gene (Singh and Westermann 2002; Cichy et al. 2005).
Improving seed Zn accumulation through plant breeding efforts should be possible.
Gelin et al. (2007) described a single QTL for seed Zn concentration which explained
17.8% of the variability. They developed a recombinant inbred population and found
the QTL responsible for improved Zn accumulation in bean to be located on linkage
group 9. In common bean the genetic variability can result in an 80% increase of the
iron content and 50% of the Zn content. No QTLs for iron and zinc content are
described yet in mungbean. Identification of any molecular marker for high iron and

32
zinc will allow marker assisted selection (MAS) for the improvement of these
important micronutrients in mungbean.
Beebe et al. (1999) found seven QTLs for iron content and QTLs for Zn
content on almost all chromosomes in common beans. Researchers at CIAT, found a
highly significant positive correlation of 0.52 between Fe and Zn concentration in
1000 accessions (Welch and Graham 2004). This positive correlation was confirmed
in ninety other genotypes (Tryphone and Masolla 2010). Thus, genetic factors for
increasing Fe and Zn might be pleiotropic or co-segregating. To understand the mode
of action of genes involved in the mineral uptake and cellular import and export and
intracellular sequestration these genes have to be identified and to be studied
thoroughly. With enough knowledge about the involved genes genetic modification
might also play a role in the future in increasing micronutrient content in edible parts
of the mungbean crop (Ghandilyan et al. 2006) for instance by over-expressing of
some of the key genes.
For both Fe and Zn seed concentrations in beans; there were significant
location and location x genotype effects, demonstrating that environments influence
the concentrations of Fe and Zn (Gregorio 2001; Beebe et al. 1999).
Status of Mungbeans: In developed world
In many parts of the developed world, mungbean is used in sprouted form as a salad
vegetable or for cooking purposes. The area of mungbean production in the developed
world is increasing day by day. Presently in USA it is 50,000 ha and in Australia
about 40,000 ha (Weinberger 2003). Extensive research is required on quality traits
such as sprouting quality and protein quantity. Mungbean research was initiated in
USA in early 1990s and later on more molecular and field work was started in
countries like Canada, India, Thailand, Australia, Japan, Taiwan etc. In countries like
Canada, there has been a constant interest in developing mungbean as a potential
pulse crop. Park and Anderson (1977) developed and evaluated mungbean cultivars
under Canadian conditions.
A multi-disciplinary team approach
Most of the research is now being concentrated in the area of increasing the
micronutrient content in the edible parts of plants species including grain legumes, but
other barriers like bioavailability of the micronutrients, impact of these high nutrients

33
varieties on humans, acceptability of a particular micronutrient dense crop etc. can
only be tackled in an interdisciplinary way. Phytic acid to iron (PA: Fe) molar ratio is
an index of iron bioavailability. Relatively high phytic acid to iron molar ratio results
in a low iron bioavailability and vice-versa (Karunaratne 2008). Thus,
breeding/molecular techniques should be used to lower the level of the anti-nutrients
like PA (Sandberg 2002).This strategy has already been used successfully in
improving the nutritional status of maize grown for animal feed. To increase the
acceptability of micronutrient enriched legumes attention should be given to its
sensory aspect. In India, a high yielding variety was rejected just because its taste was
not acceptable by the consumers (Shobha et al. 2006). So the taste should be
improved or people should get acquainted with other household processing methods
(resulting in a different taste). Improved techniques to prepare local dishes can also
improve iron and other nutrients bioavailability. Finally, the whole chain should be
studied to make the people aware about the benefits of mungbean.
In order to make farmers aware about the benefits of growing pulses, the
public sector should initiate extension and development programs which involve
stake-holders such as producers, processers, nutritionists. Figure 1 shows some
pictures of the effort that was made to aware farmers about the benefits of mungbean.
Farmers were also involved in development of a mungbean variety in the ongoing
project Telfun (www.telfun.info).
Figure 1 Involvement of farmers in mung bean development programme under project TELFUN (Source: www.telfun.info)
Maximum efficacy will occur when alliances are formed between breeders
improving the micronutrient content), food scientists and nutritionists, who can alter
the ratio of enhancers to inhibitors of bioavailability in recipes consumed, and the
social scientists will help in bringing awareness to the people about new techniques

34
and products available in the market. In this way the whole chain can be strengthened,
from on-farm research and development leading to empowering end-users, and
enhance the technology adaptation and utilization. It is important to recognize the
perspective of indigenous people which plays a significant role in acceptance of
varieties.
Conclusions and future perspectives
Although, very low amounts of micronutrients (Fe, Zn etc) are required in a diet, they
all play a very important role in human physiology. Plant breeding in general focuses
more on increasing yield and disease resistance. Now the time has come to improve
micronutrient concentrations in legumes. Developing cultivars with higher capacity to
accumulate Fe and Zn will contribute significantly to the improvement of the
micronutrient status of people. In order to achieve this objective scientists have to first
understand the genetics of high micronutrient traits and formulate a breeding strategy
for improving micronutrient density in the edible parts of the crops. Application of
modern techniques in the breeding process can fasten the process and thus helps in
achieving the objective. Secondly, investigations are required to check the
bioavailability of these micronutrients by modernizing the indigenous techniques
and/or developing new techniques. Thirdly how much these fortified legumes can
elevate Fe and Zn deficiency especially among women and children in the developing
world. Fourthly, socioeconomic studies with farmers, consumers and processors are
required to check the acceptance of the resulting products. And finally, the farmers
should be involved in the study so that, they can be updated from time to time about
new varieties and crop.
Conclusion:
The nutritional importance of legumes has to be recognized. Adequate genetic variation is present in the legume germplasm. High
micronutrient content is positively correlated with yield.
Anti-nutrient factors should be minimized to maximize the micronutrients
bioavailability.
Nutritional genomics and biotechnology research can complement
conventional breeding to improve breeding efficiency.
A combined effort involving a multidisciplinary approach and preferably in
different countries should lead to more nutritional balance of the people.

35
Acknowledgments:
I am grateful to Dr Manjula Bandara, crop diversification centre, agriculture and rural
development, South Alberta, for valuable additions and suggestions in this review.
This work is part of Telfun project (www.telfun.info).
References
ACC/SCN (2000) Fourth Report on the World Nutrition Situation, Geneva: ACC/SCN in collaboration with the International Food Policy Research Institute.
Afzal MA, Shamugasudaram S (2004) Random amplified polymorphic DNA (RAPD) analysis of selected mungbean (Vigna radiata L. Wilczek) cultivars. Asian Journal of Plant Science 3 (1): 20-24.
Ahmad T, Mahmood FY, Malik KA (2001) Residual effect of nitrogen fixed by mungbean and blackgram on subsequent rice and wheat crops. Australian Journal of Experimental Agriculture 41: 245–248
Allen L, Benoist B, Dary O, Hurrell R (2006) Guidelines on food fortification with micronutrients. World Health Organization and Food and Agricultural Organization of the United Nations. Geneva: World Health Organization.
Arif M, Malik MA (2009) Economic feasibility of proposed cropping patterns under different soil moisture regimes of Pothwar plateau. International Journal of Agricultural Biology 11 (1): 27–32.
Beebe S, Gonzalez AV, Rengifo J (1999) Research on trace minerals in common bean. Food and Nutrition Bulletin 21 (4): 387-391.
Berger J, Ninh NX, Khan NC, Nhien NV, Lien DK, Trung NQ, Khoi HH (2006) Efficacy of combined iron and Zn supplementation on micronutrient status and growth in Vietnamese infants. European Journal of Clinical Nutrition. 60: 443-454.
Betal IS, Chaowdhury PR, Kundu S, Raychaudhuri SS (2004) Estimation of genetic variability of Vigna radiata cultivars by RAPD analysis. Biologia Plantarum 48 (2): 205-209.
Borlaug NE (2000) Ending world hunger. The promise of biotechnology and the threat of antiscience zealotry. Plant Physiology 124: 487-490.
Buyckx M (1993) The international community’s commitment to combating micronutrient deficiencies. Food Nutrition and Agriculture 7: 2–7.
Cakmak I (2002) Plant nutrition research: Priorities to meet human needs for food in sustainable ways. Plant and Soil 247: 3-24.
Campion BS, Doria F, Tagliabue E, Galasso G, Fileppi IM (2009) Isolation and characterisation of an LPA (low phytic acid) mutant in common bean (Phaseolus vulgaris L.). Theoretical and Applied Genetics 118 (6): 1211–1221.

36
Chattopadhyay K, Ali MN, Sarkar HK, Mandal N, Battacharya S (2005) Diversity analysis by RAPD and ISSR markers among the selected mungbean (Vigna radiata L. Wilczek) genotypes. Indian Journal of Genetics & Plant Breeding 65 (3): 173-175.
Cheng XZ, Yang CV (2001) Study on relationships among species in mungbean group using RAPD markers. Scientia Agricultura Sinica 34 (2): 216-218.
Cichy KA, Forster S, Grafton KF, Hasfield GL (2005) Inheritance of seed Zn Accumulation in navy bean. Crop Science 45: 864-870.
Curie C, Brieat JF (2003) Iron transport and signaling in plants. Annual Review of Plant Biology 183–206.
Dieu TMH, Le TB (2005) Genetic diversity of 57 mungbean cultivars (Vigna radiata L.) by RAPD. Cong nghe sinh hoc. 3 (1): 57-66
Durrett TP, Gassmann W, Rogers EE (2007) The FRD3-mediated efflux of citrate into the root vasculature is necessary for efficient iron translocation. Plant Physiology 144: 197–205.
Elizabeth CT, Jean FC (2004) Plant ferritin and non-heme iron nutrition in humans, HarvestPlus Technical Monograph 1, Washington DC and Cali: International food policy research institute and CIAT.
Endre L, Beck FWJ, Prasad AS (1990) The role of Zn in human health. Journal of Trace Elements Experimental Medicine 3: 337–375.
FAOSTAT (2002) FAOSTAT on-line. Rome: United Nations Food and Agriculture Organization.
Fatokun CA, Danesh D, Young ND, Stewart EL (1993) Molecular taxonomic relationship in the genus Vigna based on RFLP analysis. Theoretical and Applied Genetics 86: 97-104.
Gelin JR, Forster S, Grafton KF, McClean PE, Rojas-Cifuentes GA (2007) Analysis of Seed Zn and Other Minerals in a Recombinant Inbred Population of Navy Bean (Phaseolus vulgaris L.). Crop Science 47: 1361-1366.
Ghandilyan A, Vreugdenhill D, Mark G, Aarts M (2006) Progress in the genetic understanding of plant iron and Zn nutrition. Physiologia Plantarum 126: 407–417.
Gregorio GB (2001) Symposium “Plant Breeding: A New Tool for Fighting Micronutrient Malnutrition” given at the Experimental Biology 2001 meeting, Orlando, Florida, on April 1, 2001. International Food Policy Research Institute, Washington, DC.
Grusak MA, Cakmak I (2005) Methods to improve the crop-delivery of minerals to humans and livestock. In Plant nutritional genomics. Edited by M.R. Broadley and P.J. White. Blackwell Publishing, Oxford. 265-286.
Gupta AP (2005) Micronutrient status and fertilizer use scenario in India. Journal of Trace Elements in Medicine and Biology 18: 325-331.
Guttieri MJ, Peterson KM, Souza EJ (2006) Agronomic performance of low phytic acid wheat. Crop Science 46 (6): 2623–2629.
Gwag JG, Chung HK, Lee JH, Ma KH, Dixit A, Park YK, Cho EG, Kim TS, Lee SH (2006) Characterization of new microsatellite markers in mungbean, Vigna radiata L. Molecular Ecology Notes 6 (4): 1132-1134.
37
Haas JD, Beard JL, Murray-Kolb AM, Felix A, Gregorio G (2005) Iron bio fortified rice improves the iron stores of non-anaemics Filipino women. Journal of Nutrition 135: 2823-2830.
Haq MZ, Shaid I, Ahmed S, Imran M, Niaz A, Bhanger MI (2007) Nutritional and compositional study of Desi chickpea (Cicer arietinum L.) cultivars grown in Punjab, Pakistan. Food Chemistry 105: 1357-63.
Holm PB (2002) Transgenic approaches in commonly consumed cereals to improve iron and zinc content and bioavailability. Journal of Nutrition 132: 514–516.
Humphry M, Lambrides C, Chapman S, Aitken E, Imrie B, Lawn R, McIntyre C, Liu C (2005) Relationships between hard-seededness and seed weight in mungbean (Vigna radiata) assessed by QTL analysis. Plant Breeding 124: 292-298.
Hunt JR (2003) Bioavailability of iron, zinc, and other trace minerals from vegetarian diets. American Journal of Clinical Nutrition 78(Suppl): 633S-639S.
Hunt JR, Roughead ZK (1999) Non-heme-iron absorption, fecal ferritin excretion, and blood indexes of iron status in women consuming controlled lacto-ovovegetarian diets for 8 wk. American Journal of Clinical Nutrition 69: 944–52.
Islam FMA, Basford KE, Jara C, Redden RJ, Beebe SE (2002) Seed compositional and disease resistance differences among gene pools in cultivated common bean. Genetic Resources and Crop Evolution 49: 285–293.
Johnson JM, Walker PM (1992) Zinc and iron utilization in young women consuming a beef-based diet. Journal of the American Dietetic Association. 92:1474–1478.
Kaiser BN, Moreau S, Castelli J, Thomson R, Lambert A, Bogliolo S, Puppo A, Day DA (2003) The soybean NRAMP homologue, GmDMT1, is a symbiotic divalent metal transporter capable of ferrous iron transport. Plant Journal 35: 295–304.
Karunaratne AM, Amerasinghe PH, Sadagopa R, Sandstead VM, Perera HH (2008) Zn, Iron and Phytic Acid levels of some popular foods consumed by rural children in Sri Lanka. Journal of Food Composition and Analysis 21: 481-488.
Khattak GSS, Ashraf M, Saeed I, Alam B (2006) A new yielding mungbean (Vigna radiate (L.) Wilczek) variety “Ramzan” for the agro climatic conditions of NWFP. Pakistan Journal of Botany 38 (2): 301-310.
Lakhanpaul S, Chadha S, Bhat KV (2000) Radom amplified polymorphic DNA (RAPD) analysis in Indian mungbean (Vigna radiata (L.) Wilczek) cultivars. Genetica 109: 227-234.
Lambrides CJ, Diatloff AL, Liu CJ, Imrie BC (1999) Proceedings of the 11th Australasian Plant Breeding Conference, Adelaide, Australia.
Larsen T (1997) Erythrocyte membrane enzymes as indicators of zinc status, In Trace Elements in Man and Animals – 9. Proceedings of the Ninth International Symposium on Trace Elements in Man and Animals. Eds. PWF. National Research Council of Canada, Ottawa 105–106.
Lind T, Lonnerdal B, Stenlund H, Ismail D, Seswandhana R, Ekstrom EC, Persson LA (2003) A community-based randomized controlled trial of iron and zinc supplementation in Indonesian infants: interactions between iron and zinc. American Journal of Clinical Nutrition 77: 883-890.
Lopez MA, Martos FC (2004) Iron availability: an updated review. International Journal of Food Sciences and Nutrition 55: 597–606.

38
Maldonado Guzman SH, Acosta-Gallegos J, Paredes-López O (2000) Protein and mineral content of a novel collection of wild and weedy common bean (Phaseolus vulgaris L). Journal of the Science of Food and Agriculture 80: 1874–1881.
Maldonado SHG, Martínez O, Acosta-Gallegos JA, Lara FG, Octavio PL (2003) Putative Quantitative Trait Loci for Physical and Chemical Components of Common Bean. Crop Science 43: 1029-1035
Marschner H (1995) Mineral Nutrition of Higher Plants, Academic Press, London.
Menancio-Hautea D, Fatokun CA, Kumar L, Danesh D, Young ND (1993) Comparative genome analysis of mungbean (Vigna radiata (L.) Wilczek) and cowpea (V.unguiculata L.) using RFLP mapping data. Theoretical and Applied Genetics 86: 797-810.
Miflin B (2000) Crop biotechnology. Where now? Plant Physiology 123: 17-28.
Monchy S, Benotmane MA, Janssen P, Vallaeys T, Taghavi S, van der Lelie D, Mergeay M (2007) Plasmids pMOL28 and pMOL30 of Cupriavidus metallidurans are specialized in the maximal viable response to heavy metals. Journal of Bacteriology 189: 7417–7425.
Monsen ER, Hallberg L, Layrisse M (1978) Estimation of available dietary iron. American Journal of Clinical Nutrition 31:134–41.
Munger HM (1988) Adaptation and breeding of vegetable crops for improved human health. In: B. Quebedeaux and F.A. Bliss (eds.). Horticulture and human health. Prentice Hall, Englewood, N.J. 177–184.
Navert B, Sandstrom B, Cederblad A (1985) Reduction of the phytate content of bran by leavening in bread and its effect on zinc absorption in man. British Journal of Nutrition 53: 47-53.
Neue HU, Quijano C, Senadhira D, Setter T (1998) Strategies for dealing with micronutrient disorders and salinity in lowland rice systems, Field Crops Research 56: 139-155.
Nube M, Voortman RL (2006) Simultaneously addressing micronutrient deficiencies in soils, crops, animal and human nutrition: opportunities for higher yields and better health Stichting Onderzoek Wereldvoedselvoorziening van de Vrije Universiteit. Centre for World Food Studies. Staff Working Paper (September).
Palmgren MG, Clemens S, Williams LE, Krämer U, Borg S, Schjørring JK, Sanders D (2008) Zinc biofortification of cereals: problems and solutions. Trends in Plant Science 13: 464–473.
Park SJ, Anderson TR (1977) AC Harosprout mungbean. Canadian Journal of Plant Science 77: 111-112.
Pathak P, Kapil U, Kapoor SK, Dwivedi SN, Singh R (2003a) Magnitude of zinc deficiency among nulliparous nonpregnant women in a rural community of Haryana State, India, Food and Nutrition Bulletin 24: 368-371.
Pennington JAT, Young B (1990) Iron, zinc, copper, manganese, selenium, and iodine in foods from the United States total diet study. Journal of Food Composition Analysis 3: 166-184.
Prasad MNV (2007). Plant-mineral: macro-and micro nutrients, uptake, functions, deficiency and toxicity symptoms.
Prased AS (1996) Zinc deficiency in women, infants and children American Journal of Clinical Nutrition 15: 113-120.

39
Quebedeaux B, Bliss FA (1988) Horticulture and human health. Contributions of fruits and vegetables. Proc. 1st Intl. Symp. Hort.and human health. Prentice Hall, Englewood, N.J.
Quebedeaux B, Eisa HM (1990) Horticulture and human health. Contributions of fruits and vegetables. Proc. 2nd Intl. Symp. Hort. and Human Health. HortScience. 25: 1473–1532.
Raboy V, Dickinson DB, Below FE (1984) Variation in Seed Total Phosphorus, Phytic Acid, Zinc, Calcium, Magnesium, and Protein among Lines of Glycine max and G. soja. Crop Science 24 (3): 431-434.
Ramalingaswami V (1995) New global perspectives on overcoming malnutrition. The American Journal of Clinical Nutrition 61: 259–263.
Rengel Z, Batten GD, Crowley DE (1999) Agronomic approaches for improving the micronutrient density in edible portions of field crops. Field Crops Research 60: 27-40.
Roozendaal Gerda van (1996) Enhancing the Nutritional Qualities of Crops: A second Green Revolution? By in biotechnology and development monitor no-29 Dec.
Roughead ZK, Hunt JR (2000) Adaptation in iron absorption: iron supplementation reduces non-heme-iron but not heme-iron absorption from food. The American Journal of Clinical Nutrition 72:982–989.
Safdar AM, Riffat A, Sohail S (2005) Enhancing water use efficiency, Nitrogen fixation capacity of mashbean and soil profile nitrate content with phosphorous and potassium application. Pakistan Journal Agronomy 4: 340–344.
Sandberg AS (2002) Bioavailability of minerals in legumes. British Journal of Nutrition 3: S 281-285.
Sandstrom B (1997) Bioavailability of zinc. European Journal Clinical Nutrition 51: S17-S19.
Sandstrom BA, Cederblad B, Bjorn-Rasmussen AE (1980) Zinc absorption from composite meals, I: the significance of wheat extraction rate, zinc, calcium, and protein content in meals based on bread. The American Journal of Clinical Nutrition 33:739–45.
Sanstead HH (1995) Is zinc deficiency a public health problem? Nutrition 11: 87-92.
Santalla M, Power JB, Dave MR (1998) Genetic diversity in mungbean germplasm revealed by RAPD markers. Plant Breeding 117 (5): 473-478.
Shanmugasundaram S (2006) Improving income and nutrition by incorporating mungbean in cereal fallows in the Indo-Gangetic Plains of South Asia, Proceedings of the final workshop and planning meeting, Punjab Agricultural University, Ludhiana, Punjab, India, May 27–31 2004. AVRDC Publication No. 06-682. 342. Shanhua, Taiwan
Shaul O, Hilgemann DW, de-Almeida-Engler J, Van Montagu M, Inzé D, Galili G (1999) Cloning and characterization of a novel Mg(2+)/H(+) exchanger. EMBO Journal 18: 3973–3980.
Shobha RN, Manish KP, Prasad GSV, Sudharshan I (2006) Historical significance, grain quality features and precision breeding for improvement of export quality basmati varieties in India. Indian Journal Crop Science 1 (1-2): 29-41.
Shrimpton R (1993) Zinc deficiency – is it widespread but under recognized? SCN News 9: 24–27.

40
Singh DP, Ahlawat IPS (2005) Greengram and blackgram improvement in India: past, present and future prospects. Indian Journal Agricultural Science 75: 243–50.
Singh SP, Westermann DT (2002) A single dominant gene controlling resistance to soil zinc deficiency in common bean. Crop Science 42: 1071–1074.
Slaton NA, Gbur EE, Wilson CE, Norman RJ (2005a) Rice response to granular zinc sources varying in water soluble zinc. Soil Science Society of American Journal 69: 443-452.
Somta Prakit, Peerasak Srinives (2007) Genome Research in Mungbean [Vigna radiata (L.) Wilczek] and Blackgram [V. mungo (L.) Hepper] Science Asia 33: 69-74 Supplement 1.
Srivastava PC, Gupta UC (1996) Trace Elements in Crop Production. Science Publishers, Enfi eld.
Thavarajah D, Thavarajah P, See Chai-Thiam, Vandenberg A (2010) Phytic acid and Fe and Zn concentration in lentil (Lens culinaris L.) seeds is influenced by temperature during seed filling period. Food Chemistry 122: 254-259.
Tryphone GM, Msolla SN (2010) Diversity of common bean (Phaseolus vulgaris L.) genotypes in iron and zinc contents under screen house conditions. African Journal of Agricultural Research 5 (8): 738-747.
Verbruggen N, Hermans C, Schat H (2009) Molecular mechanisms of metal hyper accumulation in plants. New Phytologist 181: 759-776.
Vert G, Briat JF, Curie C (2003) Dual regulation of the Arabidopsis high-affinity root iron uptake system by local and long-distance signals. Plant Physiology 132: 796–804.
Vijayalakshmi P, Amirthaveni S, Devadas RP, Weinberger K, Tsou SCS, Shanmugasundaram S (2003) Enhanced bioavailability of iron from mungbeans and its effects on health of school children. AVRDC Technical Bulletin No. 30 Shanhua, Taiwan
Welch RM (2002) The impact of mineral nutrients in food crops on global human health. Plant and Soil 247: 83-90.
Welch Ross M, Graham RD (2002) Breeding crops for enhanced micronutrient content. Plant and Soil 245: 205–214.
Welch Ross M, Graham RD (2004) Breeding for micronutrients in staple food crops from a human nutrition perspective. Journal of Experimental Botany 55 (396): 353-364.
Weinberger K (2003) Impact analysis on mungbean research in south and south-east Asia. AVRDC Processing No. 99.9117.5, Shanhua, Taiwan
White PJ, Broadley MR (2005) Biofortifying crops with essential mineral elements. Trends in Plant Science 10 (12).
White PJ, Broadley MR (2009) Biofortification of crops with seven mineral elements often lacking in human diets – iron, zinc, copper, calcium, magnesium, selenium and iodine. New Phytologist 182: 49–84.
World Health Organization (WHO) (2008) http://www.who.int/ith/en/
World Hunger Facts: 2011. Why Are People Hungry? World Hunger Education. http://www.worldhunger.org/articles/Learn/world%20hunger%20facts%202002.ht
Zimmermann MB, Hurrell RF (2002) Improving iron, zinc and vitamin A nutrition through plant biotechnology. Current Opinion in Biotechnology 13: 142–145.

41
CHAPTER 3
Genetic Diversity of Mungbean (Vigna radiata L.) in Northern India
Renu Singha,b*, Adriaan W. van Heusdena, Ram Kumarb, Richard G.F. Vissera and Ram C
Yadavc
Ecology of Food and Nutrition: 2013, Volume 52 (2): 148-162

42
Abstract
Mungbean (Vigna radiata L.) is one of the most important pulses in Indian
agriculture. This paper describes the importance of participatory varietal selection in
the development of suitable varieties of mungbean. With participatory varietal
selection farmers have selected varieties with good agronomical traits. A conventional
survey strategy, in combination with participatory varietal selection, molecular
markers and chemical analysis was used. The genetic diversity in the selected
genotypes was studied using 22 inter simple sequence repeat (iSSR) primer sets which
showed a genetic diversity ranging from 65 to 87 percent. The selected mungbean
genotypes had only a moderate amount of iron (1.76 - 6.58 mg/100g) and zinc (1.54 -
3.81 mg/100g). Farmer’s preference, resistance levels and micronutrient contents
must be considered while designing future breeding programs.
Keywords: mungbean, diversity, inter simple sequence repeat, micronutrients,
participatory varietal selection

43
Introduction
Mungbean is a widely grown food grain legume in the developing world. It is
cultivated almost in all seasons (Feb-April; April-June; June-Sept & July-Sept.)
somewhere in India. It is thought to have its primary centre of diversity in the Indian
subcontinent (de Candolle 1884; Vavilov 1926) with maximum diversity in the upper
Western Ghats and Deccan hills and the Indo-Gangetic plains. From the standpoint of
production, dry beans including mungbean (19.7 mt), field pea (10.4 mt), chickpea
(9.7 mt), cowpea (5.7 mt), lentil (3.6 mt) and pigeon pea (3.5 mt) are the most
important pulses (Murleedhar et al. 2013). The major mungbean growing states are
Orissa, Maharashtra, Andhra Pradesh, Rajasthan, Madhya Pradesh, Bihar, Karnataka,
Uttar Pradesh and Haryana. Out of the sixteen essential nutrients, seven are classified
as micronutrients or trace elements. Two of these, iron and zinc play a vital role in
human, animal and plant health and development. Mungbean is an important food
crop for vegetarians, being a major source of protein. It contains 25-31 percent of
crude protein (Anwar et al. 2007), 4-6mg/100g of iron (Vijayalakshmi et al. 2001),
1486-1570 KJ/100 g of energy, and 1-5 percent crude fibre (Shanmugasundaram
2002). Resource-poor farmers grow mungbean because it only requires moderate
irrigation and other inputs. Mungbeans restore soil fertility through symbiotic
nitrogen fixation (Ashraf et al. 2003) and can withstand high temperatures (average
35.3°C).
In order to feed the increasing population of the world the green revolution
played a very important role. It prevented the world from massive starvation by
raising the production of staple food crops (wheat & rice). The downside was that the
green revolution has also lead to lower intake of micronutrients. Despite the fact that
this can be compensated by eating more legumes the production and productivity of a
legume like mungbean in India is static and the per capita availability has even
declined over the past decades (IASRI 1999; DOES 2000; Vijayalakshmi et al. 2003).
This decline is a major concern and difficult to understand since mungbean is for
growers profitable and for the consumers nutritious and potentially rich in minerals.
Abiotic and biotic stresses limit mungbean production in India. One of the
main biotic stresses is mungbean yellow mosaic virus (MYMV) this virus can inflict
heavy yield losses (30-70%) (Maiti et al. 2011). Farmers try to get good seeds from
private companies and government agencies. Different mungbean varieties are often

44
mixed and the impact of MYMV on individual homozygous genotypes is not well
understood. An assessment of the genetic diversity of pulses is an important first step
in a program to improve crop yield.
The objective of the present study were: (i) to understand the indigenous
knowledge of farmers in respect to mungbean yellow mosaic virus (MYMV) and
other related traits and what role it plays in participatory varietal selection (PVS), (ii)
to analyse the genetic diversity and range of the concentration in mineral
micronutrients (Fe & Zn) of the genotypes selected by the farmers.
Material and Methods
The district of Hisar in the Haryana state was selected for the study (Figure 1). There
are three growing seasons for mungbeans in Haryana, kharif (July to September) is
the most preferred season for the farmers as monsoon favours a good yield.
Figure 1 Location of the district Hisar within Haryana state used for the survey study
Due to the high level of local biodiversity the Hisar district in Haryana state
was selected for our study. The district falls under the hot-arid western plane eco-
region. Two major mungbean producing blocks of Hisar were selected, and from
these blocks two villages, Mangali and Dhiktana (one each from a block) were
selected because of the production-consumption pattern of mungbean (Table 1).

45
Table 1 Production, area and volume of mungbean in Hisar and Haryana
Area ( x103 Hectares) Production ( x103 Tonnes) Yield (kg/ha) 03-04 04-05 05-06 03-04 04-05 05-06 03-04 04-05 05-06
Hisar 4.7 11.5 8.3 1.2 2.3 3.3 256 196 400
Haryana 18.3 25.2 16.0 2.8 4.0 6.1 159 158 384 Source: Statistical Abstract of Haryana, Director of Agriculture, Haryana, 2003, 2004, 2005 and 2006.
Sampling and data analysis
Diagnostic survey
A questionnaire (appendix I) was prepared and used for primary data collection. From
two selected villages, a random sample of 100 farmers who were actively involved in
farming, were selected. For the follow-up stage survey twenty active farmers were
selected (ten from each village) and invited on the research field area at the pulse
research station, Department of Plant Breeding, Chaudhary Charan Singh Haryana
Agricultural University, Hisar, India for evaluation of advance genotypes during the
kharif season 2008.
Genetic diversity: Level of virus resistance and markers
The genotypes selected by the farmers at the research fields were morphologically
characterized at university experimental farms in Hisar. Hisar has a latitude of
29o10’N, longitude of 75o46’E and altitude 215.2 m above sea level and falls in the
semi-tropical region of the Western Zone of India. The experiment was conducted in
the kharif (July to September) season 2008, in a Random Block Design with spacing
of 40 cm between rows and 15 cm between plants within the row. About two weeks
before harvesting, the level of mungbean yellow mosaic virus (MYMV) damage was
scored on a scale from 1 (completely resistant) to 9 (completely susceptible) (Singh et
al. 1992).
The genetic diversity was determined in the selected genotypes using 22 inter
simple sequence repeat primer sets at Wageningen UR Plant Breeding, the
Netherlands. Leaves from 3-5 week old seedlings were collected and immediately
stored at -80oC until DNA isolation. Leaf tissue from each individual was ground to a
fine powder using two grinding beads in a Shatter-box and total genomic DNA was
extracted and treated with RNAse and Proteinase K (Raeder and Baroda 1985).

46
Concentrations were determined with ethidium bromide staining of gels and
comparing with samples with a known DNA concentration.
Mineral (Fe and Zn) Analysis
Two gram of seeds was taken randomly from each variety, washed with sterile water
and before grinding dried in an oven for 2 days at 45°C. Mineral analysis (Fe and Zn)
was done on powdered sample using atomic absorption spectroscopy (AAS). Sample
preparation for AAS involved digesting 1 g flour with nitric/perchloric acid (5 ml of a
2:1 mixture of 65 percent nitric acid (HNO3) and 70 percent per-chloric acid (HClO4))
for 2 h followed by a heat treatment for 2 h and re-suspension in 25 ml of de-ionized
water. The resulting samples were analysed in a mass spectrometer with acetylene
flame (Lindsay and Norvell 1978).
Statistical Analysis
The survey data were analysed by using frequency, percentage and rank. Statistical
software SAS (for survey/field data) & SPSS 12.0 (chemical analysis) was used to
examine interrelationships and frequencies while for the molecular data, the ISSR
bands were scored as present (1) or absent (0), each of which was treated as an
independent character while, faint bands were not considered for final scoring.
Molecular weights of the bands were estimated by using the Gene Ruler 1 kb DNA
ladder (MBI Fermentas, UK). Data analyses were performed using the NTSYS-pc
2.01b (Numerical Taxonomy and Multivariate Analysis System, Applied Biostatistics
Inc. 1986–1997, Rohlf 1990). The SIMQUAL program was used to calculate the
Jaccard’s coefficient, a common estimator of genetic identity and was calculated as
follows:
Jaccard’s coefficient = NAB / (NAB + NA + NB)
Where NAB is the number of bands shared by samples, NA represents amplified
fragments in sample A, and NB represents fragments in sample B. Similarity matrices
based on these indices were calculated. Similarity matrices were utilized to construct
the UPGMA (unweighted pair group method with arithmetic average) dendrogram.
Marker index was calculated in order to characterize the capacity of each primer to
detect polymorphic loci among the genotypes. It is the sum total of the polymorphism

47
information content (PIC) values of all the markers produced by a particular primer.
PIC value was calculated using the formula:
PIC = 1-Σpi 2,
Where, pi is the frequency of the ith allele (Muthuswamy et al. 2008).
Results and Discussion
Farmer’s perspective in relation to mungbean - A survey study
All the farmers were male and literate, middle-aged and experienced. Majority of
them were in the age group of 30-45 (Figure 2).
010203040506070
0-15 15-30 30-45 45-60 60-Onwards
Age Groups
%
Figure 2 Percentage distribution of farmers on basis of age (N= 100)
About 50 percent of the farmers from Mangali and Dhiktana villages thought
that yield and the lack of mungbean yellow mosaic virus (MYMV) resistance were
the major limiting factors in the choice to grow mungbeans. Majority of the farmers
(>80 percent) in both villages were willing to take advice from regional agricultural
institutes reflecting their willingness to incorporate better farming techniques. Only
few farmers considered the lack of drought resistance, uniform maturating etc. to be
the most important factors not to grow mungbean (Table 2).

48
Table 2 Benefits and constraints of mungbean as assessed by 100 farmers in two
villages (Mangali, Dhiktana) in the Hisar district.
Observations of agronomic traits by farmers during field visit
Participatory Varietal Selection (PVS) was used to identify the selection criteria of
farmers and to evaluate advanced varieties after 50% pod development (Figure 3). By
seeing the farmer’s personal interest and funding limitations, only twenty farmers (ten
from each village) were invited for the PVS at the research fields. In informal
discussions the farmers expressed their opinion, identified important target traits and
made selections on the basis of these traits (Table 3). Farmers prefer medium height
varieties and long sized pods. This is directly related to the number of seeds (yield).
Medium sized seeds are preferred because large seeds take more cooking time and are
therefore not popular.
Variable Description Response (N= 100)
Market value Good
Average Poor
33 67 -
Household use Frequently used
Less frequent use
35 65
Used as rotational crop Yes No
18 82
Impact on soil health Good impact
Average impact Poor impact
16 84 -
Drought resistance required Yes No
12 88
Is MYMV susceptibility a major constraint
Yes No
40 60
Low yield is a limiting factor Yes No
48 52
Scientific assistance required Yes No
88 12

49
Figure 3 Involvement of farmers in mungbean development program
Table 3 Perception of farmers on quality traits of mungbeans (N= 20)
Characteristic Category Farmer’s Preferences (N=20)
Frequency %
Plant height Tall Medium Dwarf
2 14 4
10 70 20
Plant growth Vigorous in growth Not vigorous
4 16
20 80
Pod length Long Medium Dwarf
12 4 4
60 20 20
Disease resistant Yes (MYMV, leaf curl) No (MYMV, leaf curl)
20 -
100 -
Size of seed Large seeded Medium seeded Small seeded
2 15 3
10 75 15
Color of seed Yellow Green Light green
- 17 3
- 85 15
Pod Maturity Uniform Non- uniform
20 -
100 -
Number of seeds/pod
5-6 6-7 8-9
- 7 13
- 35 65
Yield and quality were considered the most important agronomic traits. The
yield of the selected varieties is given in Table 4. On average, the varieties which
were selected by the farmers had a yield minimum of about 1000 kg/hectare (kg/ha).
Mungbean Yellow Mosaic Virus (MYMV) is a limiting factor and on basis of their
experience, the farmers selected some genotypes which were more or less tolerant to
MYMV (Table 4). Farmers identify the disease in the early stages of plant
development. Farmers prefer early maturing mungbean varieties (~ 65 days) so that

50
they can incorporate it in rice-wheat system and grow three crops in a year. This is
the most profitable and simultaneously the mungbean production improves soil
fertility which is good for wheat production.
Table 4 Top five varieties selected on basis of Participatory Varietal Selection
Varieties Preferred Characteristics
Maturity Duration (Days)
Potential Yield (kg/ha)**
Comments Rank
Zn±S.E+
mg/100g
Fe±S.E+
mg/100g
MH 125 (Basanti)
Shiny green attractive seeds Medium sized MYMV resistant (3)* Tall variety (80-90 cm)
65 1500
Suitable for both autumn and spring cultivation
I 2.3±0.2 3.3±0.1
MH 318
Shiny green attractive seeds, Medium sized MYMV resistant (3)* Dwarf variety (60-65 cm)
59 1420
(2300)**
Start maturing after 55 days
II 3.2±0.12
5.0±0.8
MH 421 (Bharpai)
Shiny green attractive seeds Medium sized MYMV resistant (2)* Dwarf variety (60-65 cm)
60 1500
(2300)**
Start maturing after 55 days
III 2.7±0.1 3.8±0.1
MH 215 (Sattya)
Shiny green attractive seeds, MYMV resistant (4)* Medium height (70- 80 cm)
67 1650 Suitable for autumn season
IV
2.4±0.2
3.3±0.1
MH 96-1 (Muskan)
Shiny green attractive seeds Small sized seed MYMV resistant (4)* Tall variety (80-90 cm)
77- 80 1200
-
V 4.6±0.2++ 5.5±0.2++
* Score of MYMV on 1-9 Scale (1= resistant & 9= susceptible). **The yield varies with change in inputs and climate. Above yield is average yield. ** If a second flush of flowering is allowed the yield goes up to 2300 kg./ha; Name in parenthesis are the local names. +, ++from appendix I chapter 5
The genetic diversity of thirty varieties including those selected by farmers
was determined with 22 ISSR primer sets. This was a subset of 32 primer sets that
were tried out. The same genotypes were analysed for mineral micronutrient (Fe &
Zn) content (Table 5). The seed iron content varied from 1.76 ± 0.11 mg/100g to 6.58
± 0.21 while, zinc content ranged from 1.54±0.29 mg/100g to 3.81 ± 0.41 mg/100g.

51
Table 5 Origin (if known) and micronutrient content of 30 mungbean varieties
S.No. Genotypes Origin Mean value of
Zn ± S.E mg/100g
Fe ± S.E mg/100g
1 ML-803 Ludhiana (Punjab) 3.8 ± 0.4 5.3 ± 1.2
2 MH-125* Hissar (Haryana) 2.3 ± 0.2 3.3 ± 0.1 3 ML-5 nn 2.4 ± 0.3 2.8 ± 0.1 4 ML-735 Ludhiana (Punjab) 2.8 ± 0.1 6.6 ± 0.2 5 2KM 112 IARI (New Delhi) 2.7 ± 0.2 4.5 ± 0.6 6 ML-1108 nn 2.2 ± 0.1 3.8 ± 0.4 7 MI-3580 nn 2.4 ± 0.1 4.3 ± 1.1 8 ML-839 Ludhiana (Punjab) 1.8 ± 0.2 3.2 ± 0.4 9 L-24-2 Ludhiana (Punjab) 1.7 ± 0.2 1.9 ± 0.1
10 MH-421* Hissar (Haryana) 2.7 ± 0.1 3.8 ± 0.1 11 2KM-139 Hissar (Haryana) 1.8 ± 0.1 2.9 ± 0.1
12 2KM 135 Sri Ganganagar (Rajasthan)
2.9 ± 0.1 3.2 ± 0.1
13 SMH-99-2 Hissar (Haryana) 2.5 ± 0.1 3.0 ± 0.1 14 2 KM-107 ?? 2.1 ± 0.1 3.9 ± 0.5 15 BG-39 ?? 2.6 ± 0.2 6.0 ± 0.4 16 ML-818 Ludhiana (Punjab) 3.2 ± 0.1 4.5 ± 0.4 17 ML-406 Ludhiana (Punjab) 1.5 ± 0.3 2.5 ± 0.4 18 2KM-151 Pant Nagar (Uttrakand) 2.0 ± 0.2 4.0 ± 0.2 19 2KM 155 ?? 2.9 ± 0.23 4.5 ± 0.9 20 2KM-138 Hissar (Haryana) 2.0 ± 0.5 2.4 ± 0.2 21 MH3-18* Hissar (Haryana) 3.2 ± 0.12 5.0 ± 0.8 22 MH-124 Hissar (Haryana) 2.0 ± 0.1 3.0 ± 0.6 23 ASHA Hissar (Haryana) 2.4 ± 0.2 4.1 ± 0.4 24 MH-215* Hissar (Haryana) 2.4 ± 0.2 3.3 ± 0.1 25 SMH-99-DULL B Hissar (Haryana) 3.1 ± 0.1 3.9 ± 0.1
26 PDM-9-249 IIPR Kanpur (Uttar Pradesh)
1.8 ± 0.2 2.6 ± 0.1
27 ML-759 Ludhiana (Punjab) 1.6 ± 0.1 2.6 ± 0.1 28 M 395 Ludhiana (Punjab) 1.6 ± 0.1 1.8 ± 0.1 29 PMB-14 Ludhiana (Punjab) 1.6 ± 0.2 2.0 ± 0.1 30 ML-506 Ludhiana (Punjab) 2.3 ± 0.1 4.8 ± 1.5
*selected genotypes (top 4) in PVS by farmers along with the advance mungbean material
Molecular Characterization
The criteria for selecting primer pairs were the quality of amplification and the
presence of polymorphisms among the cultivars used for primer survey. Figure 4 is a
representative ISSR pattern. A total of 200 amplification products were obtained of
which 63.4 percent were polymorphic in the set of 30 mungbean genotypes. The
genetic similarity ranged from 0.65-0.87. This shows the considerable amount of

52
genetic diversity in the mungbean genotypes. ISSR techniques have been previously
used in estimating the genetic relationships in genus Vigna (Ajibade et al. 2000) and
in several other crops (Souframanien 2004). The mean PIC value is 0.218 and the
highest and lowest PIC values are 0.67 (UBC820) and 0.05 (UBC864, UBC895)
respectively (Table 6).
Figure 4 An ISSR pattern in mungbean (UBC821). Lane 1 & 32 are marker lanes.

53
Table 6 List of 22 primers and amplification products in 30 genotypes of mungbean
Marker Primer sequence Total no. of
amplification products
No. of polymorphic
products
Percentage of polymorphism
PIC value
UBC820 GTGTGTGTGTGTGTGTC 2 1 50 0.67 UBC836 AGAGAGAGAGAGAGAGYA 6 4 66.6 0.39 UBC821 GTGTGTGTGTGTGTGTA 5 4 80 0.63 UBC844 CTCTCTCTCTCTCTCTRC 4 1 25 0.59
IS 61 GAGAGAGAGAGAGAGAT 4 2 50 0.28 IS 65 AGAGAGAGAGAGAGAGT 4 2 50 0.17
UBC811 GAGAGAGAGAGAGAGAC 3 1 33.3 0.24 IS 63 AGAGAGAGAGAGAGAGC 3 1 33.3 0.26
UBC849 GTGTGTGTGTGTGTGTYA 4 2 50 0.07 UBC855 ACACACACACACACACYT 3 1 33.3 0.12
UBC857 ACACACACACACACACYG 7 4 57.1 0.07 UBC848 CACACACACACACACARG 7 5 71.4 0.11 UBC846 GAGAGAGAGAGAGAGAA 5 4 85.7 0.09 UBC864 ATGATGATGATGATGATG 7 6 85.7 0.05 UBC880 GGAGAGGAGAGGAGA 6 4 66.6 0.17 UBC812 GAGAGAGAGAGAGAGAA 3 1 33.3 0.31 UBC862 AGCAGCAGCAGCAGCAGC 3 1 33.3 0.06 URP 6F GGCAAGCTGGTGGGAGGTAC 10 8 80 0.12 UBC835 AGAGAGAGAGAGAGAGYC 5 4 96 0.14 UBC859 TGTGTGTGTGTGTGTGRC 4 2 50 0.08 UBC895 AGGTCGCGGCCGCNNNNNNAT 7 6 85.7 0.05 URP 13R TACATCGCAAGTGACACACC 6 4 66.6 0.13
Total 108 68 Average per primer 4.91 58.31 0.218
Jaccard’s similarity coefficient values were calculated and the diversity ranged
from 0.65 to 0.87 with an average of 0.76. The UPGMA dendrogram (Figure 5) shows
that four mung bean varieties are not in the main cluster (cluster I). This main cluster
is divided in three subclusters: a, b and c. Three of the four preferred genotypes by
farmers (based on visible traits) are in cluster I-a and the remaining one in I-b. In
group I-a the varieties were mostly early maturing, dwarf varieties with resistance to
MYMV while in group I-a early maturating, medium sized genotypes with a moderate
resistance to MYMV are present.

54
*selected genotypes (top 4) in PVS by farmers along with the advance mungbean material
Figure 5 Dendrogram of genetic relationships of the thirty genotypes based on ISSR
Conclusion
The data presented show the importance of the perspective of farmers in relation to
production. According to Bunders et al. (1996), farmers should be considered an
important research partner because of their indigenous knowledge and capacity to
innovate. Genotypes selected by farmers possesses most preferred quality traits; early
maturing, MYMV disease resistance, high yield, shiny, green, medium sized, high
protein and iron content grains. They have capacity to utilize available genetic
resources to manage disease resistance and also they are aware of the integrated

55
management approaches to control MYMV. Farmers can be helpful in participatory
technology development especially breeding (Quaye et. al. 2011). Since farmers tend
to save seeds, it is not sufficient to release varieties which meet the desires of farmers,
but also to train them in how to maintain quality in seed conservation (Bains et al.
2004).
The chemical studies show the variation for iron and zinc content in the
selected germplasm. As genotypes vary in their nutritional components it is important
to incorporate this knowledge in a breeding programme to breed varieties that contain
high levels of micronutrients along with high potential yield and MYMV resistance
and other preferences from farmers. Future research should consider the following
important four aspects before designing any interdisciplinary programme. First,
farmers preferences, second, correlation between micronutrients and yield, third
association between the mineral concentration and anti-nutrients while the fourth is
the bioavailability of these micronutrients.
Acknowledgments:
I am grateful to Dr Neelam R. Yadav, Senior Scientist, Department of Biotechnology
& Molecular Biology, College of Basic Sciences, CCS HAU, Hisar, for valuable
suggestions and guidance in the molecular work of this article.
References
Ajibade SR, Weeden NF, Michite S (2000) Inter simple sequence repeat analysis of genetic relationships in the genus Vigna. Euphytica 111(1): 47-55.
Anwar F, Latif S, Przybylski R, Sultana B, Asraf M (2007) Chemical composition and antioxidant activity of seeds of different cultivars of mungbean. Journal of Food Science 72 (7): 503-510.
Ashraf M, Mueen-ud-din M, Warraich NH (2003) Production efficiency of mungbean as affected by seed inoculation and NPK application. International Journal Agriculture and Biology 5:179-180.
Bains TS, Brar JS, Singh G, Sekhon HS, Kooner BS (2004) Status of production and distribution of mungbean seed in different cropping seasons. In: Shanmugasundaram, S. (Ed.). 2006. Improving income and nutrition by incorporating mungbean in cereal fallows in the Indo-Gangetic Plains of South Asia DFID mungbean project for 2002-2004. Proceedings of the final workshop and final meeting, Punjab Agricultural University, Ludhiana, Punjab, India, 27-31 May 2004. AVDRC– The World Vegetable Centre, Publication No. 06-682.
Bunders J, HaverKort B, Hiemstra W (1996) Biotechnology: Building on farmers’ knowledge. Macmillan Education Ltd. London and Basingstoke.

56
De Candolle AP (1884) Origin of cultivated plants. Kegan Paul, Trench, London.
DOES (2000) Directorate of Economics and Statistics, Ministry of Agriculture, Government of India. New Delhi. Agricultural Statistics at a Glance.
IASRI (1999) Indian Agricultural Statistics Research Institute (IASRI), Agricultural research data book, New Delhi.
Lindsay WL, Norvell WR (1978) Development of DTPA soil test for zinc, iron manganese and copper. Soil Science Society of America Journal 42:421-428.
Maiti S, Basak J, Kundagrami S, Kundu A, Pal A (2011) Molecular marker-assisted genotyping of mungbean yellow mosaic India virus resistant germplasms of mungbean and urdbean. Molecular Biotechnology 47(2): 95-104.
Murleedhar A, Chaturvedi SK, Mishra N (2013) Quality seed maintenance of pulses in view of resource conservation agriculture. Indian Institute of Pulses Research, Kanpur
Muthuswamy S, Kanagarajan S, Ponnuswamy S (2008) Efficiency of RAPD and ISSR markers system in accessing genetic variation of rice bean (Vigna umbellata) landraces. Electronic Journal of Biotechnology 11 (3): 1-10
Quaye W, Adofo K, Buckman ES, Frempong G, Jongerden J, Ruivenkamp, G (2011) A socio-economic assessment of cowpea diversity on the Ghanaian market: implications for breeding. International Journal of Consumer Studies 1-9.
Raeder U, Baroda P (1985) Rapid preparation of DNA from filamentous fungi. Letters in Applied Microbiology 1: 17–20.
Rohlf FJ (1990) NTSYS -pc. Numerical taxonomy and multivariate analysis system. Exeter Software, New York.
Shanmugasundaram S (2002) Improving income and nutrition by incorporating mungbean in cereal-fallows in the Indo-Gangetic Plains of South Asia—an overview. Paper presented in the Planning Workshop of the DFID/Mungbean Project, 23–25 May 2002, Andhra Pradesh, India.
Singh G, Sharma YR, Kaur L (1992) Methods of rating mungbean yellow mosaic virus in mungbean and urdbean. Plant Disease Research 7 (1): 1-6
Souframanien, J. and Gopalakrishna, T. 2004. A comparative analysis of genetic diversity in black gram genotypes using RAPD and ISSR markers. Theoretical and Applied Genetics, 109: 1687-1693.
Statistical abstracts of Haryana 2003, 2004, 2005 & 2006. Annual reports Nehru library, CCS HAU, Hisar.
Vavilov NI (1926) Studies on the origin of cultivated plants. Inst. Bot. Appl. et d’ Amelior. des Plantes. State Press, Leningrad. (In Russian and English).
Vijayalakshmi P, Amirthaveni M, Devadas RP (2001) Possibilities of increasing bioavailability of iron from mungbean and study on the effects of its supplementation on children and women. Project Report. Coimbatore, India: Avinashilingam Institute for Home Science and Higher Education for Women.
Vijayalakshmi P, Amirthaveni S, Devadas RP, Weinberger K, Tsou SCS, Shanmugasundaram S (2003) Enhanced bioavailability of iron from mungbean and its effects on health of school children. Asian Vegetable Research and Development Centre. Shanhua, Tainan, Taiwan 741, Republic of China (ROC). Technical Bulletin No. 30:3.

57
Appendix I
Questions (part I & II) for the appraisal study of the mungbean agronomical, breeding, and MYMV situation in Hissar, Haryana.
Part I: General questions related to principle crops with emphasis on mungbean.
1. What are the principle crops that you cultivate?
Cereals ….. Legumes …. Fruits ….. Flowers ……. Other ……
(If mungbean is mentioned, ask the following
2. If mungbean, what benefits do you get from this crop?
3. Are there other benefits you can derive from this crop but not getting now?
Why is it so?
4. What varieties do you have and how do you use them for your farming activities?
5. What special characteristics do they have?
6. To what extent has the environment affected your cultivation of the crop?
7. Are there any undesirable traits you find with these desired varieties?
(If low productivity is mentioned then ask)
8. Can you let us know the main cause of low productivity of mungbean?
Biotic stress …… abiotic stress …. Soil ….. No irrigation ……
Earliness …… No good quality seed ………
No technical assistance …….. More than one mentioned before ……
Others (specify) ………..
9. Mungbean yield is severely constrained by?
a. low yield b. Mungbean yellow mosaic virus (MYMV)

58
c. lack of better variety
Part II: As mungbean yellow mosaic virus (MYMV) is one of the most important causes of crop loss in mungbean, therefore few questions related to MYMV are as follows:
1. Considering the items of question 10, you rank the two more important reasons of the low productivity of mungbean?
a …………………….. b ……………………..
2. Do you know, what is the cause of MYMV?
Yes ………………….. No ……………………
3. Where do you find the MYMV on the mungbean plant?
Stems ……. Pots …… Leaves ….. Seeds …… Others ……….
4. Do you know how to identify MYMV resistant varieties?
Yes ………………….. No ……………………
If yes, How ……….
5. Do you know how to bread MYMV resistant mungbean varieties?
Yes ………………….. No ……………………
6. Do you know how to manage the MYMV of mungbean?
a. Good mungbean variety
b. Pesticides
c. Integrated pest management (IPM)
d. Others
e. No management f MYMV

59
7. Do you have any other characteristics you would want to be in your desired varieties?
8. What are the challenges you encounter in your cultivation of the crop beside MYMV?
9. Are there any hopes for you to overcome these challenges by yourself?

60

61
CHAPTER 4
How Quality Traits of Mungbean can enhance Food Sovereignty
Shweta Singh1, Renu Singh2, Pradeep Kumar Dahiya3, Varsha Rani4,
M.A.J.S. van Boekel5
1Critical Technology Construction, Social Sciences Group, Wageningen University, 2Laboratory of Plant Breeding, Wageningen University, 3Product Design & Quality Management, Wageningen University, 4Laboratory of Human Nutrition, Wageningen University, 5Project co-ordinator, Product Design & Quality Management, Wageningen University, The Netherlands

62
Abstract
The study was conducted in 2007 in the Hisar district, Haryana India by an
interdisciplinary team of a social scientist, a plant breeder, a food technologist and a
nutritionist. The local perspective (farmers, consumers and processors) was given
utmost importance in defining quality traits for mungbean in relation to food
sovereignty. The results show that farmers prefer high yielding, early maturing and
mungbean mosaic virus (MYMV) resistant varieties. Consumers prefer shiny, green,
medium sized beans with a short cooking time and a good storability. Processors
prefer shiny, green beans with a good soaking capacity and consistency. As mungbean
cultivar MH 125 (Basanti) possesses most of the preferred quality traits (table 4,
chapter 3) the use of MH 125 should be promoted along with training in, how to
maintain seed quality and what the best processing methods are.
Keywords: Quality, Mungbean, Local perspective, Food sovereignty

63
Introduction
India is the largest producer and consumer of pulses in the world. According to FAO
2008, India produces about 25 % and consumes 27 % of the global production.
Among pulses, mungbean (Vigna radiata), also known as green gram is one of the
most important crops in India and it is widely cultivated throughout the country.
Resource poor farmers produce mungbean because it only requires moderate
irrigation and other inputs. It also restores soil fertility through symbiotic nitrogen
fixation and it is a suitable crop for dry land and it can withstand high (average 35 °C)
temperatures. Mungbean is important for the vegetarian population of the country,
being a major source of protein. It contains 25-31 % of crude protein (Anwar et al.
2007), 4-6 mg/100 g of iron (Vijayalakshmi et al. 2001), 355-375 Kcal /100 g of
energy, and 1-5 % crude fibre (Shanmugasundaram 2004).
Despite its importance and the large numbers of varieties and agro techniques,
the production and productivity of mungbean in India is static and the per capita
availability has even declined over the past decades (IASRI1999; DOES 2000;
Vijayalakshmi et al. 2003). This is a major concern since mungbean is nutritious and
potentially rich in minerals. Minerals like iron and zinc are important and anaemia
due to iron deficiency is a serious threat. In India the occurrence of anaemia is
approximately 74 % in children below 3 years, 85 % in expectant mothers and 90 %
among adolescent girls of 10-16 years (MOHFW 1998-1999; ICMR 2001; Sharma
2003). In 2007 a survey was conducted on the prevalence of iron deficiency anaemia
in relation to dietary intake pattern of local communities in Hisar-1 and Barwala block
of Haryana state (Rani et al. 2009). Fifty eight percent of the school children in these
communities were anaemic of which 49 % lacked enough iron. The quality of food in
these communities was poor, particularly low iron bioavailability which ranged
between 3.1 - 4.6 % in comparison to healthy adult iron absorption i.e. 10 -15%. The
bioavailability of the micronutrients in food can change during processing and
storage. Interdisciplinary research linking plant properties, food technology,
nutritional characteristics and social sciences is needed in order to benefit as much as
possible of the consumption of mungbean.

64
Methodology
The study was conducted in year 2007 by an interdisciplinary team consisting of four
researchers in the field of plant, food, nutrition and social sciences. The researchers
have been working with farmers, food processors and consumers with the main
objective to apply the ‘Science in Society’ approach. Following this approach,
research into the enhancement of varieties from agronomic, processing, and nutrition
perspectives, has been done within local communities.
The research was executed in the Haryana state of India where a high level of
mungbean biodiversity is present and in which the Hisar district is an important
mungbean production area (Figure 1 and Table 1, chapter 3 (this thesis)). Two
representative major mungbean producing blocks of the district, i.e., Hisar-I and
Barwala, were selected for the study. Two villages, Mangali and Dhiktana were
selected from Hisar-I and Barwala blocks. One hundred farmers, 150 consumers, 100
processors and 116 rural women from each village were selected randomly for the
survey studies. While, for the participatory varietal selection (PVS) programme at the
research fields only actively participated farmers were invited. Data were obtained
through intensive observation and interaction with farmers, processors, and
consumers of mungbean using structured questionnaires (Appendix I, chapter 3).
Results have been interpreted against the background of food sovereignty.
Food sovereignty has been defined as the right of people and local communities to
define their own food and agriculture; to protect and regulate domestic agricultural
production and trade in order to achieve sustainable development objectives (People’s
Food Sovereignty Network 2004). We have identified definitions of quality from
different local perspectives (farmers, processors, consumers) to define one’s own
agriculture and understand their perceived needs for production, processing,
consumption, and nutritional aspects, which ultimately will be of significance to their
food sovereignty.
Our focus on production and consumption networks in two villages is in
conjunction with the conclusion. A synthesis report (2007) from the Nyeleni Forum
states that “the majority of the world’s food is still being produced or harvested at
relatively small scales by local communities, based on local knowledge, using locally
based technologies and locally available resources.”

65
Results
Mungbean quality preferences
Production
For the majority of farmers Mungbean Yellow Mosaic Virus (MYMV) and low yield
were the main constraints. After interviews and personal meetings with farmers, they
were invited to experimental sites where mungbean was grown. In order to involve
farmers in the selection procedure Participatory Varietal Selection (PVS) was carried
out to identify important target (quality) traits and to evaluate and comment on new
varieties. Twenty farmers from both villages were invited for informal discussions.
During such visits they expressed their opinion, identified important target traits and
made selections (Table 1).
Table 1 Most preferred quality traits by farmers in participatory varietal selection
No. Plant characteristics Comments
1 Plant height Medium height plants
2 Plant growth Less vigorous plants
3 Pod length Pods must be long so that it can contain more seeds
4 Disease resistant Disease resistance is one of the most preferred traits
5 Size of seed Medium sized seeds (short cooking time is a must for consumers)
6 Colour of seed There is a preference for green (better market acceptance)
7 Pod Maturity Pod maturation should be uniform so that as many as possible pods can be harvested at the same time (less labour cost )
8 Number of seeds/pod As many seeds as possible (higher yield)
Agronomic traits which were considered important by farmers were
Potential yield: The potential yield of mungbean without any disease pressure ranges
from 12 Q/ha to 23 Q/ha i.e. 100 kg/10,000 square meters (Table 2). Mungbean
Yellow Mosaic Virus (MYMV) is a limiting factor according to farmers since it
causes heavy yield loss, varying from 30 to 100 % (Nene, 1972). Farmers can identify
the disease in an early stage because infected plants are stunted in growth and usually
mature late. Such plants produce very few flowers and curled small pods and
consequently shrivelled seeds. Farmers could select lines which were more or less

66
resistant to MYMV (Table 2). A short duration of the growing season is another
important factor which influences the preference of farmers. Farmers preferred early
maturing mungbean varieties (~ 65 days) so that they can incorporate it in a rice-
wheat system and grow all three crops in a year. An additional advantage is that
mungbean production prior to wheat production improves soil fertility as mungbean
fixes atmospheric nitrogen.
Table 2 Top five varieties selected on basis of participatory varietal election*
Varieties
i. MH 125 (Basanti)
ii. MH 215 (Sattya)
iii. MH 318
iv. MH 421 (Bharpai)
v. MH 96-1 (Muskan)
*table 4, chapter 3 (this thesis)
Mungbean is eaten separately or in combination with cereals. After saltening
and sweetening mungbeans are eaten as dhal (thick spiced soup), while mung pudding
called ‘halwa’ and ‘ladoo’ is commonly served as dessert on festivals and other
special occasions. Rural consumers prefer non broken, medium sized mungbeans with
a shiny, green colour, and without traces of disease (Table 3). Furthermore, a short
cooking time is highly appreciated. Consumers knew that shiny, green coloured and
medium sized mungbeans have a shorter cooking time compared to the light green
small sized mungbeans. Sixty six percent of the rural consumers cooked mungbeans
without soaking, sprouting and fermentation.
Table 3 Consumers’ preferences for quality traits of mungbean (N=300)
Attributes N* (%)
Shiny, green, medium sized 297 99
Short cooking time 270 90
Storability 180 60
* Multiple responses possible

67
Storability is another important quality trait of mungbeans for a majority of
the consumers (60 %), mungbean is seasonally produced (mainly during kharif season
July–September) but consumed throughout the year. After harvest mungbeans are
solar dried for 8-10 hours to prevent insect infestation and then stored in mud bins,
metal drums or gunny bags. Mud bins are cylindrical in shape and made of clay mixed
with straw and animal dung, or from mud and bricks. Metal drums are cylindrical
vessels made of iron sheets whereas gunny bags are made of jute. Activated charcoal,
ash and sand are also used as endogenous method by the rural people to check insect
infestation. Activated charcoal fills the space in between the grains thus making hard
for insects to get enough oxygen while ash and sand scratches the outer skin of the
insects resulting in water loss from the body of insects. The study revealed that the
majority (90 %) of the consumers understood and preferred quality mungbeans.
Processing
It is also important to know the preferences of processors (Table 4). The size of the
grains is important for processing and the majority (87 %) of the processors preferred
medium sized grains for sprouting because the water soaking capacity of medium
sized mungbean is higher. Whole mungbean dhal made from medium sized grains has
a better consistency. Another trait is the colour because this directly relates to the
colour of mungbean products. Processors prefer mostly a dark green colour of most of
their products such as whole mungbean dhal, split mungbean dhal and whole
mungbean ladoo. Yellow colour of split mungbean grains is preferred for dishes such
as split dehulled mungbean dhal and mungbean bhalle.
Table 4 Influence of the quality parameters of mungbean on product quality Quality Parameters Influence on Products’ Quality
Size Consistency (dhal, a mildly thick stew prepared with mungbean)
Colour Colour (dhal, bhalle-mungbean dumplings )
Texture Consistency of mungbean products (dhals)
Moisture Consistency and appearance of products ( mung dhal namkeen- salty crisp snacks)
Surface shininess (appearance)
Appearance of mungbean products (halwa and burfi- sweet dish), mungbean sprouts)

68
Texture is another important characteristic of mungbean products. More
brittle grains take less time to cook and were more easily processed into various
mungbean products. Moreover, brittle grains give a better consistency of the products
particularly in three types of dhals; whole, split and split dehulled mungbean dhal.
Surface shininess of mungbeans is important for the appearance of mungbean
products such as mungbean sweets like halwa and burfi. Similarly, shiny grains were
preferred in case of dhals and mungbean sprouts. Too much moisture is not good in
processing most of the mungbean products. For different products different
characteristics are wanted (Table 5); soaking and cooking time (dhals), grinding,
soaking and cooking (halwa), soaking and frying time (namkeen), consistency of
mungbean paste (dahi bhale, pakore), grinding and fermentation time (wadi),
germination time (sprouts), drying period (papad). Sensory characteristics of some of
the mungbean products is influenced by the quality of mungbean grains. Most
important sensory parameters for the products are: consistency (Mungbean dhal),
color, texture (halwa), taste and texture (ladoo, papad and namkeen), texture (dahi
bhale), consistency (khichadi), texture (wadi), appearance and texture (sprouts).
Table 5 Different mungbean products along with their description
Mungbean Food Products Description
Whole Dhal Thick spiced soup of whole mungbean grain
Split Dhal Thick spiced soup of split mungbean grain
Split dehulled Dhal Thick spiced soup of split dehulled mungbean grain
Whole Ladoo Round yellow sweet made from whole mungbean flour
Split dehulled Ladoo Round sweet made from split dehulled mungbean
Burfi Sweet made of dehusked mungbean paste
Halwa Sweet pudding made of split dehulled mungbean paste
Namkeen Fried split dehulled mungbean spiced snack
Papad Spiced snack of mungbean dough sheets made after roasting
Bhalle Fermented dehuked mungbean roundels
Pakore Fried dehuked mungbean roundels
Wadi Fermented and dried mungbean paste
Kichari Mungbean cooked with rice
Sprouts Germinated whole mungbean

69
Nutrition
Two hundred and thirty two women were asked for their quality preferences of
mungbean (Table 6). More than 70 % of the women preferred a mungbean variety
that is rich in protein content and therefore healthy. Sixty four of the women preferred
a mungbean variety rich in iron content that keeps their body away from weaknesses.
Further, the majority of women (85 %) desired a mungbean variety of which the
nutritional compounds are well absorbed and with no or a low level of antinutrients.
Table 6 Rural women’ perception for nutrition quality traits of mungbean; N=232
*Multiple responses
The five mungbean varieties grown on agricultural farm of Chaudhary Charan
Singh Haryana Agricultural University, Hisar were nutritionally analysed (Table 7).
Phytic acid to iron (PA: Fe) molar ratio is an index of iron bioavailability. Relatively
high phytic acid to iron molar ratio results in a low iron bioavailability and vice-versa
(Karunaratne, 2008). The PA: Fe molar ratio among these five varieties ranged from
12.5 to 16.9, which means a good iron bioavailability.
Description for variety preference in local language
N* (%) Inference
A variety that can help to maintain their body healthy
169 73 Food rich in protein like mungbean was preferred by the rural women
A variety that can keep weakness away from their body
148 64
They knew about the benefits of mungbean and preferred to have mungbean dhal in their diet
Is soaking of legumes prior to cooking good or not?
197 85
They knew soaking prior to cooking is good as it removes antinutrients and also reduces cooking time. Thus effort should be made to make a cultivar less in antinutrients

70
Table 7 Content of protein, mineral micronutrients, phytic acid and polyphenols in selected mungbean varieties.
Variety Protein (g/100g)
Zinc (mg/100g)
Iron (mg/100g)
Phytic acid (mg/100g)
Poly-phenols (mg/100g)
PA: Fe molar ratio
MH 96-1 (Muskan)
24.20 + 0.30 4.60 + 0.17 5.52 + 0.15 880 + 18.8 265 + 10.2 13.48
MH 125 (Basanti)
24.39 + 0.71 4.42 + 0.88 5.63 + 0.61 832 + 10.6 294 + 9.22 12.50
MH 215 (Sattya)
24.30 + 0.22 3.78 + 1.19 4.43 +1.12 890 + 10.0 207 + 8.57 16.99
MH-318 24.02 + 0.44 4.43 + 0.18 5.11 + 0.20 1043 + 13.05 264.96 + 10.00
17.27
MH 421 (Bharpai)
24.68 + 0.77 4.52 + 0.34 5.43 + 0.27 855 + 12.4 237 + 7.46 13.32
Values are mean SD of three independent determinations
Discussion
Significance of quality in food sovereignty
The data presented in this article show an unique perspective of local people on the
meaning of quality of food (mungbean). Defining the desired traits of mungbean from
a perspective of production, processing and consumption is a modest but important
step in developing food sovereignty. In fact, the definition of problems and
challenges, from a local perspective, is necessary for developing a research agenda
needed for food sovereignty. This implies that farmers should play a role in research.
By virtue of their creativity, their capacity to innovate, and their knowledge, they
should be viewed as an valuable source of information (Bunders et al. 1996).
Farmers have a preference for early maturing mungbean varieties that are
MYMV resistant and better yielding. The MH 125 Basanti variety scores high for
these preferences: disease resistance (MYMV), high yield (1500 Q/ha) and early
maturing (65 days). Since farmers tend to save seeds for sowing, it is not sufficient to
release good varieties but also to train farmers in good seed conservation (Bains et al.
2004).
This study reveals that consumers’ knowledge and traditional practices play a
critical role in their perception of mungbean quality traits. Consumers prefer shiny,

71
green coloured and medium sized varieties. The MH 125 Basanti variety has the
preferred quality traits. The beans are shiny, green and medium sized and have a short
cooking time. Rural consumers just cook the mungbeans, it is important to train them
with other methods of processing such as soaking, fermentation and sprouting to
maintain a sufficient intake of mungbean. Consumers also prefer a longer storability
of mungbean. Mungbean is consumed throughout the year and is susceptible to insect
infestation. The processing technology of milling can increase storability.
Shiny, green and medium sized varieties are preferred by processors. These
varieties have good water soaking capacity, better processing properties and their
products have a good appearance and colour. The MH 125 Basanti variety also
possesses the preferred characteristics for processors.
For breeding new good varieties of mungbean it is desirable to determine
which variables of a variety influence the quality of the product. Apart from that it
needs to be determined what the effect is of the different processing methods on
sensory properties. The MH 125 mungbean variety is a good candidate to do sensory
studies with local consumers or sensory experts with products made with this variety.
The behaviour of the MH 125 Basanti variety in different processing steps needed to
prepare different mungbean products needs also to be investigated.
Nutritional perceptions of local people in their food (mungbean) are important
since their nutritional status is poor (Rani et al. 2009). The local people indicated their
wish for high protein, high iron and less anti-nutrients containing mungbean varieties.
The MH 125 Basanti variety contains relatively high protein (24.39 g/100g), iron
(5.63 mg/100g) and zinc (4.42 mg/100g). The PA:Fe molar ratio of 12.50 indicates a
good iron bioavailability. The use of the MH 125 Basanti variety in local diets will
most likely improve iron and other nutritional status of local people.
Conclusion
Local people define their own quality traits of mungbean and needs of production,
processing, consumption, and nutrition which may contribute in developing new
mungbean varieties. MH 125 Basanti variety of mungbean possesses most preferred
quality traits and incorporation of MH 125 Basanti variety might satisfy the local
needs of production, processing, consumption and nutrition. Further quality
improvements in MH 125 Basanti variety through production, processing and

72
consumption would help food sovereignty. It is needed that the characteristics of MH
125 Basanti in different processing methods are investigated to determine the effect of
the variety on quality of mungbean products. For their food sovereignty local people
need also to be trained to maintain and use quality seeds for future mungbean
cultivations.
Acknowledgements
This research is funded by the Interdisciplinary Research and Education Fund
(INREF) of Wageningen University (WUR). The Department of Biotechnology
(DBT) of the Government of India provided partial funding for this research. The
authors thank the scientific supervision team who help in making questionnaire and
facilitating in fields; Prof. Dr. G. Ruivenkamp, Dr. J. Jongerden (Critical Technology
Construction, Social Sciences Group) and Dr. S. Kaushik (Extension Education), Dr.
A.W. van Heusden (Plant Breeding) and Dr. R.K. Yadav (Plant Breeding) , Dr. I.D.
Brouwer (Human Nutrition) and Dr. S. Jood (Foods & Nutrition). We also thank Dr.
M.J.R. Nout (Food Microbiology) for his valuable additions and suggestions in this
article.
References Anwar F, Latif S, Przybylski R., Sultana B, Asraf M (2007) Chemical composition and
antioxidant activity of seeds of different cultivars of mungbean. Journal of Food Science 72 (7): 503-510.
Bains TS, Brar JS, Singh Gurdip, Sekhon HS, Kooner BS (2004). Status of production and distribution of mungbean seed in different cropping seasons. In: Shanmugasundaram, S. (Ed.). 2006. Improving income and nutrition by incorporating mungbean in cereal fallows in the Indo-Gangetic Plains of South Asia DFID mungbean project for 2002-2004. Proceedings of the final workshop and final meeting, Punjab Agricultural University, Ludhiana, Punjab, India, 27-31 May 2004. AVDRC– The World Vegetable Centre, Publication No. 06-682.
Bunders J, Bertus H, Wim H (1996) Biotechnology: Building on farmers’ knowledge. Macmillan Education Ltd. London and Basingstoke.
DOES (2000) Directorate of Economics and Statistics, Ministry of Agriculture, Government of India. New Delhi. Agricultural Statistics at a Glance.
Food and Agriculture Organization of the United Nations (FAO) (2008) “FAOSTAT.” http://apps.fao.org/default.htm. Accessed: October 2008.
IASRI (1999) Indian Agricultural Statistics Research Institute (IASRI), Agricultural research data book, New Delhi.
ICMR (2001) Indian Council of Medical Research. Micronutrient deficiency disorders in 16 districts of India. Part I. Report of an ICMR Task Force Study-District Nutrition Project. New Delhi.

73
Karunaratne AM, Amerasinghe PH, Sadagopa Ramanujam VM, Sandstead HH, Perera PAJ (2008) Zinc, iron and phytic acid levels of some popular foods consumed by rural children in Sri Lanka. Journal of Food Composition and Analysis 21: 481– 488.
MOHFW (1998-1999) Ministry of Health and Family Welfare. Key findings. National Family Health Survey -2. Mumbai, MOHFW, Government of India/International Institute of Population Studies.
Nene YL (1972) A survey of viral diseases of pulse crops in Uttar Pradesh, G.B. Pant University Agriculture and Technology., Pantnagar, Research Bulletein No. 4.
People's Food Sovereignty Network (2004) Beijing Declaration from NGO/CSO Regional Consultation: From Agenda to Action' Follow-up to the NGO/CSO Forum for Food Sovereignty. www.peoplesfoodsovereignty.org/statements/new/23.htm
Rani V, Brouwer Inge, Khetarpaul N, Zimmerman MB (2009) Iron status and associated factors in rural school going children (5-8 years) of Haryana state, India., Abstract Book Wageningen Nutritional Sciences Forum March 4–6, 2009 European Journal of Clinical Nutrition 63 (3S):20
Sharma KK (2003) Improving bioavaibility of iron in Indian diets through food–based approaches for the control of iron deficiency anaemia. Food Nutrition and Agriculture (FAO) Alimentation 32: 51-61.
Shanmugasundaram S (2004) Improving income and nutrition by incorporating mungbean in cereal fallows in the Indo-Gangetic plains of south Asia. Proceedings of the final workshop and meetings, 27-31 May 2004. Punjab Agricultural University, Punjab India.
Synthesis Report: Nyeleni (2007) Forum for Food Sovereignty, February 23 - 27, 2007, Selingue, Mali, March 2007. http://www.nyeleni2007.org/; Accessed: November 2008.
Vijayalakshmi PM, Amirthaveni S, Devadas RP (2001) Possibilities of increasing bioavailability of iron from mungbean and study on the effects of its supplementation on Children and Women. Project Report, Coimbatore. India: Avinashilingam Institute for Home Science and Higher Education for Women.
Vijayalakshmi P, Amirthaveni S, Devadas RP, Weinberger K, Tsou SCS, Shanmugasundaram S (2003) Enhanced bioavailability of iron from mungbean and its effects on health of school children. Asian Vegetable Research and Development Centre. Shanhua, Tainan, Taiwan 741, Republic of China (ROC). Technical Bulletin No. 30: 32.

74

75
CHAPTER 5
Genetic variation and correlation studies between micronutrient (Fe
& Zn) content, protein content and some quantitative traits in
mungbean (V. radiata L.)
Renu Singh, Richard G.F. Visser, Ram Kumar and Adriaan W. van Heusden

76
Abstract
Mungbean can effectively contribute to the alleviation of iron, zinc and protein
malnutrition as it is a source of micronutrients and protein. To achieve a faster
improvement of the current bad situation it would help tremendously to improve
mungbean cultivars which are even richer in micronutrients and protein. However in
most breeding programmes to date most attention is being directed towards yield.
Breeding mungbean for enhanced grain nutrients is still in its start-up phase. The
present study was carried out to assess genetic variation for both quantitative as well
qualitative traits. The correlation between important traits such as yield and high Fe,
Zn and protein content was calculated. A positive correlation was found between iron
and zinc content (r = 0.47) and no significant correlations were observed with yield.
Breeding a cultivar which is nutritionally improved along with high yield seems
therefore possible. A few promising cultivars with high micronutrient contents,
protein content and overall yield were identified. These cultivars can be used in
specific breeding programs aiming at nutrient-rich high yielding cultivars.
Keywords: Correlation, iron, mungbean, protein, quality traits, quantitative traits.

77
Introduction
Mungbean or greengram (Vigna radiata L) is one of the most important food legumes
of the genus Vigna. Especially for the vegetarian population it is a good source of
protein, carbohydrates, vitamins and minerals (Adel et al. 1980; Amarteifio and
Moholo 1998). Proteins of grain legumes are rich in lysine and threonine but poor in
methionine and tryptophan. In order to increase the nutritional value of meal, grain
legumes should be eaten together with cereals. Regular consumption of pulses is an
excellent method to overcome malnutrition, especially among growing children,
pregnant women and nourishing mothers.
In developing countries cereal grains and food legumes are the primary source
of calcium, iron and zinc but their intake nowadays is not high enough. Studies have
shown that in developing nations 26% of the population is anaemic, while this is 10%
and 11% in Europe and the US respectively. Studies by Barclay et al. (1996) and
Rosado et al. (1992, 2007) have shown that anaemia is mainly caused by iron
deficiency. Forty per cent of iron intake is coming from legumes and cereals. Besides
iron, zinc is also an essential micronutrient for normal growth, appetite and immunity.
It is an essential component of more than one hundred enzymes involved in digestion,
metabolism and wound healing (Stauffer 1999). While iron deficiency has long been
considered a major nutritional problem, zinc deficiency has only recently been
recognized as a public health problem (Ranum 1999).
To start a breeding program to improve mungbean, variation is required for
yield but also for iron and zinc content and other quantitative traits. Knowledge
regarding the availability of such variation, the genetic background causing
differences and response to different environmental conditions is important.
The majority of the breeding research has had its emphasis on yield and
resistance against biotic and abiotic stress while little attention has been paid to
nutritional value. It is known that concentrations of micronutrients vary in tissue or
seed between cultivars and that this variation is partially genetically determined.
Literature shows comparable ranges of mineral concentrations in most leguminous
crop seeds like in common bean, peas, chickpeas, lentils etc. (Islam et al. 2002;
Grusak and Cakmak 2005; Haq et al. 2007; Thavarajah et al. 2010). In the light of
such variation in related leguminous crops a study was done to search for variation in

78
mungbean (V. radiata L.). As for the producers (farmers) quantitative traits such as
yield are of more importance the correlation was studied between some of these
quantitative traits and micronutrient and protein content. Besides correlation studies to
assess the direct and indirect contribution of the individual components towards other
traits a path co-efficient analysis was carried out. Correlations among the variables
were estimated to know the association, if any, among the variables. Association in
terms of direction as well as magnitude. These correlations were used in path analysis
to know the direct and indirect contribution of each independent variable (days to
maturity, number of branches per plant etc.) towards dependent variables (like e.g.
seed yield). The direction and magnitude of direct and indirect contribution of
independent variables to seed yield helps in selecting the important variables for seed
yield.
The overall objective of this study is to obtain better yielding cultivars with a
considerable content of micronutrients and proteins. The availability of such cultivars
will improve the status of the people depending on mungbean as the major source of
protein and micronutrients.
Material and Methods
Plant materials
The experimental material comprised of ninety two elite mungbean cultivars along
with three controls i.e. MH-215, MH-318 and MH-421 (appendix I). These cultivars
were provided by the Pulses Section, Department of Plant Breeding, CCS HAU, Hisar
(India).
Field trials and experimental design
The material was grown in two different years (July to September 2007 and 2008) at
the university experimental farms of Hisar. Hisar is geographically situated at latitude
29o10’N, longitude 75o46’E and altitude 215.2 m above sea level and falls in the
semi-tropical region of the Western Zone of India. The overall weather data during
the course of experiment (2007, 2008 like temperature (maximum/minimum), relative
humidity, rainfall, bright sunshine hours) was collected with the help of the
meteorological observatory of the Department of Meteorology, CCS HAU, Hisar
(appendix II; Figure A, B).
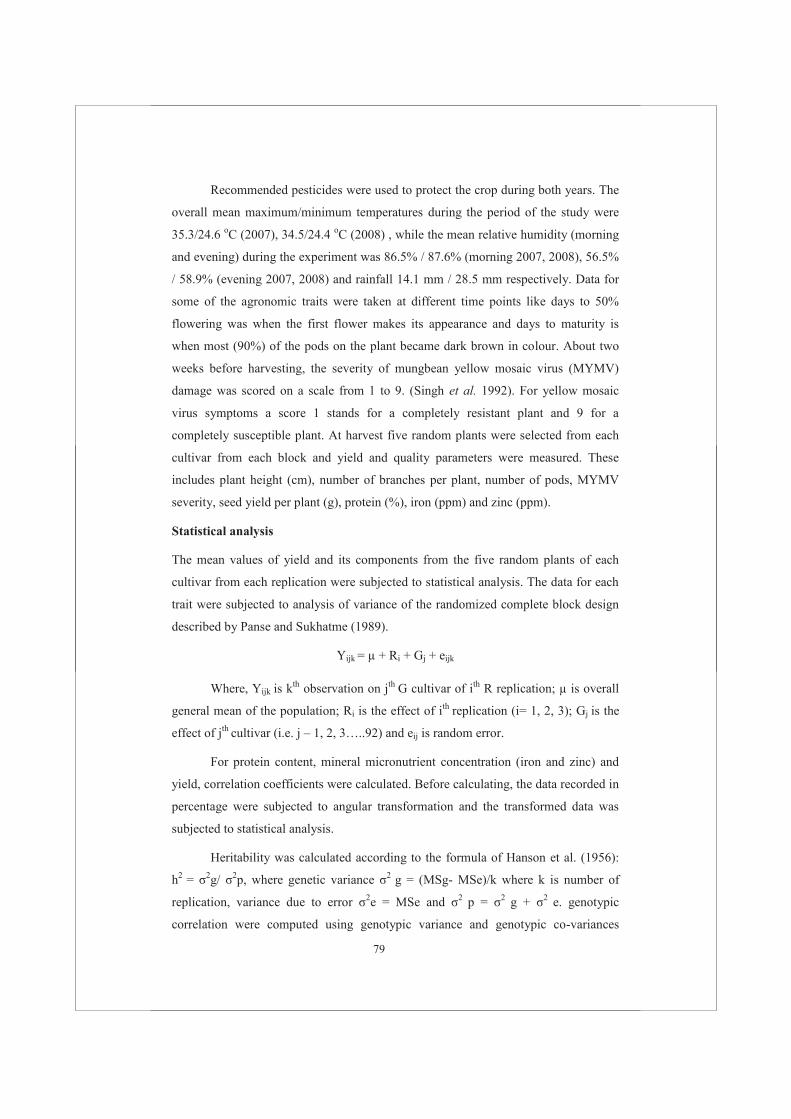
79
Recommended pesticides were used to protect the crop during both years. The
overall mean maximum/minimum temperatures during the period of the study were
35.3/24.6 oC (2007), 34.5/24.4 oC (2008) , while the mean relative humidity (morning
and evening) during the experiment was 86.5% / 87.6% (morning 2007, 2008), 56.5%
/ 58.9% (evening 2007, 2008) and rainfall 14.1 mm / 28.5 mm respectively. Data for
some of the agronomic traits were taken at different time points like days to 50%
flowering was when the first flower makes its appearance and days to maturity is
when most (90%) of the pods on the plant became dark brown in colour. About two
weeks before harvesting, the severity of mungbean yellow mosaic virus (MYMV)
damage was scored on a scale from 1 to 9. (Singh et al. 1992). For yellow mosaic
virus symptoms a score 1 stands for a completely resistant plant and 9 for a
completely susceptible plant. At harvest five random plants were selected from each
cultivar from each block and yield and quality parameters were measured. These
includes plant height (cm), number of branches per plant, number of pods, MYMV
severity, seed yield per plant (g), protein (%), iron (ppm) and zinc (ppm).
Statistical analysis
The mean values of yield and its components from the five random plants of each
cultivar from each replication were subjected to statistical analysis. The data for each
trait were subjected to analysis of variance of the randomized complete block design
described by Panse and Sukhatme (1989).
Yijk = μ + Ri + Gj + eijk
Where, Yijk is kth observation on jth G cultivar of ith R replication; μ is overall
general mean of the population; Ri is the effect of ith replication (i= 1, 2, 3); Gj is the
effect of jth cultivar (i.e. j – 1, 2, 3…..92) and eij is random error.
For protein content, mineral micronutrient concentration (iron and zinc) and
yield, correlation coefficients were calculated. Before calculating, the data recorded in
percentage were subjected to angular transformation and the transformed data was
subjected to statistical analysis.
Heritability was calculated according to the formula of Hanson et al. (1956):
h2 = σ2g/ σ2p, where genetic variance σ2 g = (MSg- MSe)/k where k is number of
replication, variance due to error σ2e = MSe and σ2 p = σ2 g + σ2 e. genotypic
correlation were computed using genotypic variance and genotypic co-variances

80
obtained from the analysis of variance and co-variance in a manner used for
heritability estimation as described by Becker (1975). To estimate the inter-
relationships among the variables and their contribution to yield performance the data
was subjected to correlation coefficient and path coefficient analysis (Dewey and Lu
1969).
Genetic diversity was determined following Mahalanobis’s (1936) generalized
distance (D2) extended by Rao (1952). Clustering of genotypes was done according to
Tocher’s method (Rao 1952) and Principal Component Analysis for graphical
representation of the genotypes. Since, Mahalanobis’s (1936) played a fundamental
and important role in statistics and data analysis, therefore this model is used in the
present study. Different clusters were further arranged in order to their relative
distance from each other and thus used to calculate inter and intra cluster distances.
Average intra- and inter-cluster D2 values were estimated using the formula: ΣD21/n,
where ΣD21 is the sum of distances between all possible combinations (n) of
mungbean cultivars included in a cluster. Significance of the squared distances for
each cluster was tested against the tabulated X2 values at P degree of freedom at 5%
probability level, where P represents the number of characters used for clustering
genotypes. The intra-cluster distance was calculated to see the genetic diversity
among the genotypes of different groups while the inter-cluster distance is used to see
the divergence between the genotypes of a same group. Selection of parents from the
highly divergent clusters is expected to manifest high heterosis and also wide
variability in genetic architecture.
Mineral and Protein Analyses
A sub-sample of 2 g seeds were picked at random from the bulk seed harvest of each
cultivar and washed with sterile water and then dried in an oven for 2 days at 45°C
before grinding. Mineral analysis was then implemented on powdered sample using
atomic absorption spectroscopy (AAS). Sample preparation for AAS involved
digesting of 1 g flour with nitric/per-chloric acid (5 ml of a 2:1 mixture of 65% nitric
acid (HNO3) and 70% per-chloric acid (HClO4)) for 2 h followed by a heat treatment
for 2 h and re-suspension in 25 ml of de-ionized water. The resulting samples were
analysed in a mass spectrometer with acetylene flame (Lindsay and Norvell 1978).
While total nitrogen was determined using the Kjeldahl method (Pearson 1973) and
protein content was calculated using conversion factors 6.25 (Altschul 1958) i.e.

81
Crude protein content (%) = nitrogen (%) X 6.2. The data of mineral micronutrient
and protein means along with their standard error are presented in appendix I.
Results
Correlation and path analysis
All analysed traits are complex and influenced by several interdependent traits.
Therefore selection for particular traits will not be effective unless the other traits
influencing it directly and indirectly are taken into consideration. Therefore for all the
seven traits the genotypic and phenotypic correlation coefficients were calculated
(Table 1).
Table 1 Heritability (in parenthesis), Genotypic (rG), phenotypic correlation (rP) and
environmental (rE) correlations among the six agronomic traits in mungbean
(V.radiata L.)
Traits r DM
(0.106) PH
(0.452) BPP
(0.207) PPP
(0.219) MYMV (0.581)
SYP (0.243)
DF G 0.503** 0.087 0.353** 0.075 0.190 -0.217 P 0.238* 0.076 0.176 -0.032 0.114 -0.094 E 0.056 0.064 0.094 -0.096 0.023 -0.021
DM G -0.030 0.077 0.126 -0.013 -0.095 P -0.042 0.067 0.098 -0.011 -0.008 E -0.053 0.064 0.086 -0.010 0.032
PH G 0.401** 0.169 -0.186 0.009 P 0.199 0.142 -0.132 -0.027 E 0.095 0.133 -0.053 -0.055
BPP G 0.418** 0.157 0.242* P 0.407** 0.065 0.238* E 0.404 0.009 0.237
PPP
G -0.261* 0.873** P -0.124 0.169
E -0.029 0.520
MYMV G -0.324** P -0.157 E -0.035
DF= Days to 50% flowering, DM= Days to maturity; PH= Plant height (cm); BPP= No. of branches/plant; PPP= No. of pods/plant, MYMV score (1-9); SYP= Seed yield/plant (g). *Significance at 5%; **Significance at 1%
The estimates of the genotypic correlation (rG) are generally higher than those
of the phenotypic correlation (rP). Number of branches/plant and pods/plant have a

82
high genotypic correlation with seed yield/plant which shows the reliability of these
traits in determining yield potential in mungbean.
Days to maturity genotypically and phenotypically correlated to days to
flowering. Similarly, number of branches/plant showed a positive and high
phenotypic and genotypic correlation with number of pods/plant. Since the pods were
on the branches, the relationship between number of pods and branches was not
unexpected. Another expected correlation was the negative correlation between seed
yield and disease symptoms.
The direct and indirect effects of different traits on yield are presented in
Table 2. Path coefficient analysis showed that the number of pods per plant had the
largest direct effect (0.5456) with an indirect effect through reduction of branches per
plant. Branches/plant (0.0884) also had a positive direct effect on seed yield with its
largest indirect effect through days to maturity. Table 2 shows that day to maturity,
number of branches and pods per plant have a direct positive effect on seed yield.
Table 2 Path coefficient analysis showing direct (diagonal) and indirect effects of
seven traits in mungbean (V. radiata L.)
Traits Direct effect on seed yield
Indirect effect on seed yield through DF DM PH BPP PPP MYMV
DF -0.491 - 0.0494 -0.0101 0.0196 -0.0068 -0.0097 DM 0.1589 -
0.0153 - -0.0056 0.0204 0.0732 0.0128
PH -0.1001 -0.0049
0.0089 - 0.0199 0.0828 0.0180
BPP 0.0884 -0.0109
0.0366 -0.0226 - 0.2265 -0.0025
PPP 0.5456 0.0006 0.0213 -0.0152 0.367 - 0.0163 MYMV -0.1208 -
0.0039 -
0.0168 0.0149 0.0019 -0.0737 -
*Significance at 5%; **Significance at 1%; Residual effect = 0.7623
Genetic Diversity
The success of any crop improvement depends on the amount of diversity available in
the crop. To know the spectrum of diversity, the assessment of divergence in the
cultivar is essential. Knowledge about genetic variability and genetic divergence are
of great value as they play a vital role in selecting the right parents for a successful
breeding programme. As mentioned earlier Mahalanobis D2 was used to access the

83
diversity in population and clustering of genotypes was done according to Tocher’s
method (Rao 1952). Bhatt (1973) concluded that the application of D2 statistics to
study diversity and to choose parents is a more efficient method compared to
choosing the parents based on eco-geography diversity.
Mahalanobis generalized distance (D2) analysis-cluster analysis
The distance between two cultivars is calculated as the sum of squares of the
difference between the mean of all the seven measured traits. The distances were used
for the final grouping. Since each cultivar is compared to 91 other cultivars 4186 D2
values were obtained for 92 cultivars including the 3 controls MH 215, MH 318 and
MH 421.
Clustering pattern of cultivars
Treating the estimated D2 values as the square of the generalized distance, 92 cultivars
were grouped into 5 clusters following the method suggested by Tocher (Rao 1952).
Clustering of genotypes was done based on the generalized distance (D2) values using
Tocher’s method as described by Singh and Chaudhary (1985). Of these five clusters,
cluster II had the highest number of cultivars (34) while cluster III is the smallest with
only two cultivars (Table 3).
Table 3 Distribution of 92 mungbean cultivars into different clusters
Cluster
I 23 PMB-14, SMH-991-A, T-44, L-24-2, M-169, MH-318, MH-421, ML-515, ML-776, PDM-9-249, PLM-176, PLM-18, 2KM-151, 2KM-155, 2KM-161, AMP-36-10, AMP-36-4, ASHA, BDYR-2, CH-1355, CH-2103, GP182, GP32
II 34
2KM-111, 2KM-112, 2KM-114, 2KM-116, 2KM-117, 2KM-135, 2KM-139, 2KMH-52, BDYR-1, BG-39, GANGA-8, GP149, GP150, GP248, GP69, GP78, GP861, PLM-62, PLM-65, SMH-991-D, SMH-99-2, SMH993A, HUM7, IC-39574, LM-10, M-1361B, MH-125, MH-98-1, ML-1108, ML-682, ML-759, ML-818, Muskan, P-105
III 2 GP181, GP68B
IV 5 SMH-99-3D, PM-827, ML-5, M-395, HUM-1
V 28
MH419, MH961, MI3580, ML194, ML406, ML506. ML735, ML803, ML839, PLM116, SM99-1, SMH99-4, SML-668, MH 2-15, 2KM-107, 2KM-115, 2KM-138, AMP-36-1, CoGG-90, GP196, GP86, IC103196, IC39595, KM-92-11, M-516, M-605, MH-124, MH-215
Ninety two mungbean genotypes were grouped into five different clusters
using clustering technique. A two dimensional scatter diagram was constructed using
first canonical variable on X axis and second canonical variable on Y axis, reflecting

84
the relative position of the genotypes (Figure 1). As per scatter diagram the genotypes
were apparently distributed into 5 groups.
Figure 1 Scatter diagram presenting relationship among 92 mungbean cultivars as revealed by two dimensional plot along with cluster centres.
From the figure it can be seen that in cluster 1 there is more variability than in
clusters 2 and cluster 5. Clusters 1 and 2 mainly comprise of early maturing cultivars.
Cluster 3 comprise of tall cultivars with higher number of branches and yield per plant
while cluster 2 and 5 had cultivars which show resistance to MYMV.
Intra- and intercluster average D2 values and their relationship between clusters
The intra- and intercluster average value D2 among the mungbean cultivars is shown
in Table 4. Cluster III has the minimum intra cluster value (7.69) indicating that
cultivars within the cluster were similar. While cluster IV showed the maximum intra
cluster D2 value (11.86), followed by cluster I (11.22) and cluster II (8.12) revealing
the existence of diverse genotypes that fell in these clusters. The average intercluster
value D2 ranged from 19.29 to 48.68, this indicates that, cultivars included in clusters
are genetically diverse and may give rise to high heterotic response.

85
Table 4 Average intra (diagonal) and intercluster D2 values of mungbean cultivars
Cluster 1 2 3 4 5
1 11.22 22.27 48.68 40.34 22.92
2 8.12 26.91 22.89 19.29
3 7.69 26.76 40.76
4 11.86 21.37
5 7.83
The intercluster values represent the amount of diversity present among
clusters, cluster 1 and cluster 3 show maximum intercluster distances (Table 4).
Cluster 1 mostly includes short cultivars (< 60 cm) with fewer branches per plant
while in cluster 3 the tall cultivars (> 100 cm) with high number branches per plant
are grouped. In both clusters the cultivars took more than 65 days to mature.
Cluster means
Mean values, range, standard deviation and coefficient of variance were calculated for
each character (Table 5) along with the cluster means of the five clusters (Table 6).
Table 5 Range, mean with standard error and coefficient of variance for each
character based on the agronomic traits in ninety two cultivars of mungbean (Vigna
radiata L.)
Traits DF DM NBP NPP PH MYMV SYP
Range 37-51 53-69 1.66-3.8 10.5-66.5 50.7-117 2-9 0.5-14.6
Mean ±
S.E
42.1±
0.28
61.8 ±
0.35
2.57 ±
0.04
39.38 ±
1.13
75.76 ±
1.27
5.02 ±
0.16
4.79
± 0.23
C.V. 6.29 5.48 16.53 27.55 16.08 2.22 45.99
Table 5 shows a coefficient of variation and range for four traits i.e., number
of branches/plant, number of pods/plant, plant height and yield/plant. Coefficient of
variation shows the degree of variation available in the genotypes for a particular trait.
Thus, for these traits heritability estimates along with the coefficient of variation will
help in improvement through selection. Table 6 represents the overall mean values

86
along with their ranking for each cluster on the basis of the two year average
performance.
Table 6 The mean value of seven traits in five clusters of 92 mungbean cultivars.
Cluster No. of
cultivars
Character DF DM PH NBP NPP SYP MYMV
1 23 42.04 (4) 61.71 (4) 62.22 (5) 2.29 (5) 29.78 (5) 3.63 (4) 5.47 (1)
2 34 41.96 (5) 61.24 (5) 83.90 (3) 2.56 (4) 34.89 (4) 3.82 (3) 4.88 (3)
3 2 42.92 (2) 66.34 (1) 110.27 (1) 3.01 (1) 35.95 (3) 3.59 (5) 5.00 (2)
4 5 43.33 (1) 61.87 (3) 93.01 (2) 2.85 (2) 55.55 (1) 7.32 (1) 5.00 (2)
5 28 42.32 (3) 62.23 (2) 72.39 (4) 2.73 (3) 50.10 (2) 6.53 (2) 4.82 (4)
Value in parenthesis represents the ranking for each character among five clusters
Micronutrient content and their correlation with seed yield
The mean concentration (± standard error) of Fe, Zn concentration and protein content
in the 92 cultivars of mungbean was determined (Figure 2). The seed protein content
varied from 21.1% to 30.0% with a mean of 24.9 ± 0.2, the seed zinc concentration
varies from 1.54 mg/kg to 3.85 mg/100g with a mean of 2.63 ± 0.1 and the seed iron
concentration ranged from 1.59 mg/100g to 9.29 mg/100g with a mean of 4.03
mg/100g ± 0.1.
A considerable variation for protein content was found. Out of ninety two
cultivars eight (2KM-107, 2KM-138, BDYR-1, GP-68B, ML-818, ML-803, ML-735
and GP-78) have quite high concentrations (> 28%) of protein. Six cultivars had seed
Zn concentrations of more than 3.50 mg/100g. The highest values were observed in
M-1361 B from Punjab (India) followed by KM-92-11 and GP-86 (Haryana). The top
ranking cultivars for iron and zinc content were further used to study cultivar X
environment (GXE) interactions in Chapter V of this thesis. Sixteen cultivars had seed
Fe concentrations of more than 5.00 mg/100g (with KM-92-11 and MH-98-1 as the
highest).

87
Figure 2 Seed yield, protein & Fe and Zn micronutrients content in 92 mungbean (Vigna radiata L.) cultivars.
Coefficients of variation (CV) show that the variability was high for iron, zinc
and seed yield. Therefore, heritability along with the CV provides an opportunity to
select materials with high mineral nutrient content. The correlation coefficient among
the few important agronomic traits, protein and mineral content were analysed and
data was presented in Table 7. A significant positive correlation was found between
seed yield and number of pods and between seed yield and number branches per plant
correlation coefficients (r) of 0.656 and 0.201 respectively. Negative associations
were seen between seed yield and days to 50% flowering, days to maturity, protein
and zinc content.
25
SYP (g)
15
Zn (mg/100g)
5
Pr (%) Fe (mg/100g)
30
10
20
0
Mean: 4.03 25.23 2.63 4.79
CV: 33.44 8.39 22.88 45.99
h2: 0.259 0.986 0.727 0.243
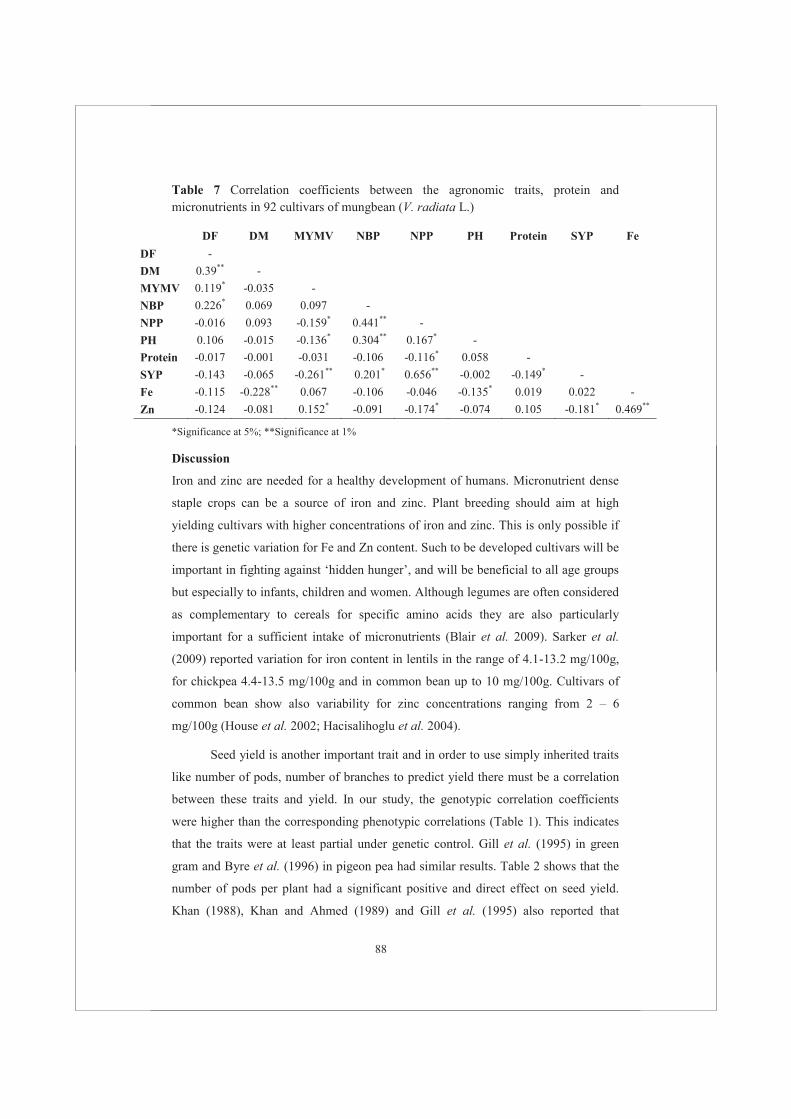
88
Table 7 Correlation coefficients between the agronomic traits, protein and micronutrients in 92 cultivars of mungbean (V. radiata L.)
DF DM MYMV NBP NPP PH Protein SYP Fe
DF -
DM 0.39** -
MYMV 0.119* -0.035 -
NBP 0.226* 0.069 0.097 -
NPP -0.016 0.093 -0.159* 0.441** -
PH 0.106 -0.015 -0.136* 0.304** 0.167* -
Protein -0.017 -0.001 -0.031 -0.106 -0.116* 0.058 -
SYP -0.143 -0.065 -0.261** 0.201* 0.656** -0.002 -0.149* -
Fe -0.115 -0.228** 0.067 -0.106 -0.046 -0.135* 0.019 0.022 -
Zn -0.124 -0.081 0.152* -0.091 -0.174* -0.074 0.105 -0.181* 0.469**
*Significance at 5%; **Significance at 1%
Discussion
Iron and zinc are needed for a healthy development of humans. Micronutrient dense
staple crops can be a source of iron and zinc. Plant breeding should aim at high
yielding cultivars with higher concentrations of iron and zinc. This is only possible if
there is genetic variation for Fe and Zn content. Such to be developed cultivars will be
important in fighting against ‘hidden hunger’, and will be beneficial to all age groups
but especially to infants, children and women. Although legumes are often considered
as complementary to cereals for specific amino acids they are also particularly
important for a sufficient intake of micronutrients (Blair et al. 2009). Sarker et al.
(2009) reported variation for iron content in lentils in the range of 4.1-13.2 mg/100g,
for chickpea 4.4-13.5 mg/100g and in common bean up to 10 mg/100g. Cultivars of
common bean show also variability for zinc concentrations ranging from 2 – 6
mg/100g (House et al. 2002; Hacisalihoglu et al. 2004).
Seed yield is another important trait and in order to use simply inherited traits
like number of pods, number of branches to predict yield there must be a correlation
between these traits and yield. In our study, the genotypic correlation coefficients
were higher than the corresponding phenotypic correlations (Table 1). This indicates
that the traits were at least partial under genetic control. Gill et al. (1995) in green
gram and Byre et al. (1996) in pigeon pea had similar results. Table 2 shows that the
number of pods per plant had a significant positive and direct effect on seed yield.
Khan (1988), Khan and Ahmed (1989) and Gill et al. (1995) also reported that

89
selection for high number of pods per mungbean plant leads to higher yield. The
number of branches/plant had also a significant positive genotypic and phenotypic
correlation with pods/plant and therefore with yield. This has also been reported in
green gram (Khan 1988; Maht and Mahto 1997) and black gram (Santha and
Veluswamy 1997). The information derived from the correlation coefficients can be
augmented by partitioning correlation into direct and indirect effects by path analysis.
Yield is a complex character and the result of diverse and interrelated developmental
processes. To get the highest possible yield traits like maturity, number of branches
and pods per plant are traits which have to be selected for. Shansuzzaman et al. 1983;
Singh et al. 1995; Gartan and Sood 1996; Paul et al. 1996 and Santha and Veluswamy
1997, observed similar results in mungbean, black gram and pigeon pea.
The cluster analysis grouped the ninety two cultivars into five clusters (Table
3). The mungbean cultivars show hardly variation for days to 50% flowering and days
to harvest but show considerable variation for traits like pods per plant, plant height
and seed yield. Clusters 2 and 5 include cultivars higher in yield and more MYMV
resistant. Table 6 shows that the cultivars of Cluster 1 are early maturing, dwarf
cultivars with medium to low yield whereas cluster 2, includes cultivars which are
early maturing but with medium length and with medium disease resistance and yield.
Cluster 3 comprises only of two cultivars which are late maturing, tall, low yielding
with maximum branching. Cluster 4 comprises of medium to tall cultivars with high
yield and takes about sixty two days (medium) to mature while Cluster 5 comprises
dwarf resistant cultivars with high yield.
Data for micronutrients show a considerable range for both micronutrients in
the mungbean cultivars. Among the micronutrients and protein content, a significant
positive correlation was found between Fe and Zn (r = 0.469). These results imply
that a high Fe content can be accompanied by high Zn content. Both these
micronutrients exhibit a low but positive correlation with protein content (r (Fe) =
0.019; r (Zn) = 0.105). This was consistent with findings of Tryphone and Masolla
(2010) in common bean, Thavarajah et al. (2010) in lentils, Dixon et al. (2000) in
maize, Anandan et al. (2011) in rice, Velu et al. (2011) wheat etc. In our study a non-
significant correlation was observed between micronutrient content and yield, making
it possible to develop cultivars with high micronutrient concentrations in combination
with high yield. To obtain the potential highest yield of a particular cultivar there

90
should be no disease pressure. Mungbean yellow mosaic virus (MYMV) is the most
treat in mungbean cultivation therefore it is important to screen for the highest
possible levels of resistance to MYMV. A number of potential mungbean cultivars for
further breeding are listed in Table 8.
Table 8 Potential mungbean cultivars for further breeding
Cultivars Potential
Yield (kg/ha)* Maturity Duration
(Days) Characteristics
MH 125 1500 65 Shiny green attractive seed, Medium sized, MYMV resistant
MH 215 1650 67 Shiny green attractive seeds, MYMV resistant
MH 318 1420 (2300)** 59 Shiny green attractive seeds, Medium sized, Dwarf cultivar, MYMV resistant
MH 421 1500 (2300)** 60 Shiny green attractive seeds, Medium sized, Dwarf cultivar, MYMV resistant
MH 96-1 1200 77- 80 Shiny green attractive seeds, Small sized seed, MYMV resistant
* The yield varies with change in inputs and climate. Above yield is average yield. ** If a second flush of flowering is allowed the yield goes up to 2300 kg
The top ten cultivars with a combination of high yield and high micronutrient
content are listed in Table 9. These cultivars can be used in cultivar x environment
studies, in breeding programs and/or may be the parents in the generation of mapping
studies in order to do genetic studies and to find quantitative trait loci (QTL) for
Fe/Zn content, protein content and high yield (Chapter VI).

91
Table 9 Selected mungbean cultivars with high micronutrient content and their
protein content and yield
S.No. Cultivar Fe (mg/100g) Zn
(mg/100g) Protein
(%) Yield/plant
(g) 1 KM-92-11 9.22 3.57 22.7 6.2
2 ML-776 7.27 3.32 23.6 2.9
3 MH-98-1 7.07 2.92 25.4 4.3
4 CoGG902 6.75 3.13 26.2 5.1
5 ML-735 6.58 2.82 28.1 8.8
6 PM-827 6.14 2.72 21.8 5.2
7 BG-39 6.02 2.64 26.2 2.6
8 GP-149 6.02 2.85 22.4 4.3
9 GP-182 5.71 3.34 22.7 1.7
10 ML-515 5.65 3.35 22.7 1.9
Before including micronutrient content in a breeding programme it is
important to consider whether micronutrient content is influenced by different
environments (Genotype x Environment), and differences in cultural practices.
Potential associations with anti-nutritional factors (ANFs) such as tannins, saponins,
phytates, lectins etc. These ANFs are the potent inhibitors of iron and zinc (Enneking
and Wink 2000). Therefore these ANF should also be considered while planning
experiment. The present study will help in making choices in the conversation of
genetic resources and in choosing the best possible cultivars for future breeding
programmes.
References
Anandan A, Rajiv G, Eswaran R, Prakash M (2011) Genotypic Variation and Relationships between Quality Traits and Trace Elements in Traditional and Improved Rice (Oryza sativa L.) Cultivars. Journal of Food Science 76 (4): 122-130.
Adel A , Shehata Y, Mohammed Thannoun A (1980) Chemical and amino acid composition of Iraqi mung beans. Z. Lebensm. Unters. Forsch 171: 360-362.
Altschul A (1958) Processed Plant Protein Foodstuffs, Edition 1958 Academic Press, New York, N.Y.
Amarteifio JO, Moholo D (1998) The Chemical Composition of Four Legumes Consumed in Botswana. Journal of Food Composition & Analysis 11 (4): 329-332.

92
Barclay DV, Heredia L, Gil-Ramos J, Montalvo MM, Lozano R, Mena M, Dirren H (1996) Nutritional status of institutionalized elderly in Ecuador. Arch Latinoam Nutrition 46:122-127.
Becker WA (1975) Manual of quantitative genetics 3rd edition. Students Book Corporation Rullman, Washington, USA.
Bhatt GM (1973) Comparison of various methods of selecting parents for hybridization in common wheat. Australian Journal of Agriculture Research 24: 457-467.
Blair MW, Giraldo MC, Buendía HF, Tovar E, Duque MC, Beebe SE (2009) Microsatellite marker diversity in common bean (Phaseolus vulgaris L.). Theoretical and Applied Genetics 113: 100-109.
Byre Gowda M, Shambulinggappa KG, Shanthala J, Chandran Prakasn J (1996) Relationship among quantitative traits and its implication in breeding for yield in pigeonpea. Mysore Journal of Agriculture Sciences 30: 64-68.
Dewey DR, Lu KH (1959) A correlation and path coefficient analysis of components of crested wheatgrass seed production. Agronomy Journal 51: 515–518.
Dixon BM, Khing GJ, Menkir A, Dixon A (2000) Genetic variation in total carotene, iron and zinc contents of maize and cassava cultivars. Food Nutrition Bulletin 21: 419-422.
Enneking D, Wink M (2000) Towards the elimination of anti-nutritional factors in grain legumes. Linking research and marketing opportunities for pulses in the 21st Century. Kluwer Academic Publishers 671-683.
Velu G, Ortiz-Monasterio I, Singh RP, Payne T (2011) Variation for Grain Micronutrients Concentration in Wheat Core-collection Accessions of Diverse Origin. Asian Journal of Crop Science 3 (1): 43-48.
Gartan SL, Sood BC (1996) Relative contribution of various yield components in urd bean. Indian Journal of Pulses Research. 9(1): 11-13.
Gill JS, Verma MM, Gumber RK, Balwant S (1995) Character association in mungbean lines derived from three interval crosses in mungbean. Crop Improvement 22 (2): 255-260
Grusak MA, Cakmak I (2005) Methods to improve the crop delivery of minerals to humans and livestock. In: MR Broadley, PJ White (eds) Plant Nutritional Genomics. CRC Press, Boca Raton 265–286.
Hacisalihoglu G, Osturk L, Cakmak I, Welch RM, Kochian L (2004) Genotypic variation in common bean in response to zinc deficiency in calcareous soil. Plant Soil 259:71–83.
Haq Zia Ul- M, Iqbal S, Ahmad S, Imran M, Niaz A, Bhanger MI (2007) Nutritional and compositional study of Desi chickpea (Cicer arietinum L.) cultivars grown in Punjab, Pakistan. Food Chemistry 105: 1357-1363.
House WA, Welch RM, Beebe S, Cheng Z (2002) Potential for increasing the amounts of bio-available zinc in dry beans through plant breeding. Journal of the Science of Food and Agriculture 82:1452–1457.
Islam FMA, Basford KE, Jara C, Redden RJ, Beebe SE (2002) Seed compositional and disease resistance differences among gene pools in cultivated common bean. Genetic Resources and Crop Evolution 49: 285–293.
Khan IA (1988) Path coefficient analysis of yield attributes in mungbean. Legume Research 11 (1): 41-43.
Khan IA, Ahmed R (1989) Relationship of yield and its component characters in mungbean. Legume Research 12 (4): 173-176.

93
Lindsay WL, Norvell WR (1978) Development of DTPA soil test for zinc, iron manganese and copper. Soil Science Society of America Journal 42: 421-428.
Mahalanobis PC (1936) On the generalized distance in statistics, Proceedings National Institute of Science, India. 12: 49-55.
Maht RN, Mahto JL (1997) Correlation and regression study in black gram for yield attributes under rainfed conditions. Environment and Ecology 15 (3): 556-558.
Panse VG, Sukhatme PV (1989) Statistical methods for agricultural Workers. Publication and Information division, Indian Council of Agricultural Research.
Paul PR, Singh RM, Raina R (1996) Character association and path coefficient analysis in hybrid pigeonpea. Madras Agricultural Journal 83 (1): 34-37.
Pearson D (1973) Laboratory techniques in food analysis. , John Wiley & Sons, London.
Rao CR (1952) Advanced statistical methods in biometrical research. John Wiley & Sons, Inc. New York
Ranum P (1999) Zinc enrichment of cereal staples. Cereal Foods World 44: 604-605.
Rosado JL, Loapez P, Morales M, Munaoz E, Allen LH (1992) Bioavailability of energy, nitrogen, fat, zinc, iron and calcium from rural and urban Mexican diets. British Journal of Nutrition 68:45-58.
Rosado JL, Lopez P, Morales M, Munoz E, Allen LH (2007) Bioavailability of energy, nitrogen, fat, zinc, iron and calcium from rural and urban Mexican diets. Nutrition 68: 45-58.
Santha S, Veluswamy P (1997) Character association and path analysis in black gram. Madras Agricultural Journal 84 (11/12): 678-681.
Sarker A, Aydogan A, Chandra S, Kharrat M, Sabaghpour SH (2009) Genetic enhancement for yield and stability. p. 102–120. In W. Erskine, F Muehlbauer, A Sarker, B Sharma (ed.) the lentil: botany, production and uses. Cab Int., Wallingford, UK.
Shansuzzaman KM, Khan MRH, Saikh MAQ (1983) Genetic variability and character association in mungbean (Vigna radita L). Bangladesh Journal of Agriculture Research 8: 1-5.
Singh RK, Chaudhary BD (1985) Biometrical Methods in Quantitative Genetics Analysis (Rev. ed.). Kalyani Publishers, New Delhi- Ludhiana. 78.
Singh IS, Hue NTN, Gupta AK (1995) Association and cuase and effect analysis in some F2 populations of green gram. Legume Reesrach 18 (3/4): 137-142.
Singh G, Sharma YR, Kaur L (1992) Methods of rating mungbean yellow mosaic virus in mungbean and urdbean. Plant Disease Research 7 (1): 1-6.
Stauffer JE (1999) Nutraceuticals. Cereal Foods World 44:115-117.
Thavarajah D, Thavarajah P, See Chai-Thiam, Vandenberg A (2010) Phytic acid and Fe and Zn concentration in lentil (Lens culinaris L.) seeds is influenced by temperature during seed filling period. Food Chemistry 122: 254-259.
Tryphone GM, Msolla SN (2010) Diversity of common bean (Phaseolus vulgaris L.) cultivars in iron and zinc contents under screen house conditions. African Journal of Agriculture Research 5 (8): 738-747.

94
Appendix I
List of 92 cultivars of mungbean varieties with their origin, zinc, iron and protein content.
V.No Cultivars Origin
Mean value of
Zn ± S.E mg/100g
Fe ± S.E mg/100g
Protein ± S.E %
SYP ± S.E g
1 2KM-107 - 2.107
± 0.009 3.877
± 0.484 28.067 ± 0.030
4.812 ± 1.389
2 2KM-111 Ludhiana 3.270
± 0.031 4.667
± 0.447 26.227 ± 0.056
3.383 ±0.818
3 2KM-112 IARI 2.680
± 0.210 4.467
± 0.592 21.360 ± 0.248
2.070 ±0.709
4 2KM-114 IARI 3.653
± 0.035 4.437
± 0.066 23.497 ± 0.092
3.989 ±1.461
5 2KM-115 Sri Ganganagar
2.033 ± 0.041
2.760 ± 0.211
26.173 ± 0.050
7.554 ±2.072
6 2KM-116 Ludhiana 2.333
± 0.127 3.510
± 0.012 21.780 ± 0.127
5.458 ±1.056
7 2KM-117 Varanasi 2.917
± 0.018 4.000
± 0.632 23.327 ± 0.161
4.701 ±0.963
8 2KM135 Sri Ganganagar
2.947 ± 0.041
3.243 ± 0.100
27.127 ± 0.066
3.943 ±0.891
9 2KM-138 Hisar 2.040
± 0.477 2.393
± 0.185 28.090 ± 0.040
6.586 ±2.280
10 2KM-139 Hisar 1.757
± 0.144 2.917
± 0.079 27.133 ± 0.049
2.164 ±0.545
11 2KM-151 Pant Nagar 2.040
± 0.231 4.017
± 0.181 26.273 ± 0.062
5.159 ±1.047
12 2KM-155 Ludhiana 2.943
± 0.288 4.537
± 0.872 27.133 ± 0.049
4.145 ±0.563
13 2KM-161 Ludhiana 1.820
± 0.288 3.053
± 0.028 26.153 ± 0.069
2.862 ±1.110
14 2KMH-52 Hisar 2.510
± 0.012 3.703
± 0.057 23.653 ± 0.064
4.602 ±0.793
15 AMP-36-10 Hisar 2.443
± 0.299 2.653
± 0.274 23.610 ± 0.012
5.679 ±2.099
16 AMP-36-18 Hisar 2.350
± 0.062 2.680
± 0.121 22.670 ± 0.046
9.585 ±3.089
17 AMP-36-4 Hisar 2.380
± 0.076 2.570
± 0.111 25.227 ± 0.111
5.588 ±1.324
18 ASHA Hisar 2.363
± 0.177 4.117
± 0.351 25.370 ± 0.026
3.422 ±0.890
19 BDYR-1 Bangladesh 2.503
± 0.052 4.527
± 0.113 28.550 ± 0.282
4.363 ±1.045
20 BDYR-2 Bangladesh 2.490
± 0.095 4.660 ± 0.70
22.670 ± 0.046
6.441 ±1.780

95
21 BG-39 - 2.640
± 0.191 6.023
± 0.405 26.200 ± 0.036
2.643 ±1.026
22 CH1355 - 3.450
± 0.131 3.860
± 0.061 24.503 ± 0.012
0.533 ±0.255
23 CH2103 - 3.130
± 0.064 4.620
± 0.488 26.250 ± 0.035
0.565 ±0.160
24 CoGG902 - 3.133
± 0.050 6.750
± 2.902 26.217 ± 0.018
5.091 ±1.016
25 GANGA-8 Sri Ganganagar
2.837 ± 0.636
2.390 ± 0.604
25.383 ± 0.003
2.934 ±0.771
26 GP-149 Varanasi 2.853
± 0.081 6.017
± 1.523 22.367 ± 0.209
4.255 ±0.589
27 GP-150 - 3.273
± 0.027 3.603
± 0.314 24.440 ± 0.060
4.040 ±0.812
28 GP-181 Hisar 3.560
± 0.040 4.923
± 0.369 21.770 ± 0.059
4.192 ±1.0101
29 GP-182 Hisar 3.340
± 0.036 5.713
± 1.988 22.723 ± 0.018
1.742 ±0.609
30 GP-196 Hisar 2.743
± 0.116 4.440
± 0.301 26.263 ± 0.024
4.437 ±1.184
31 GP-248 - 2.157
± 0.037 3.117
± 0.112 27.117 ± 0.058
5.529 ±1.469
32 GP-32 - 2.903
± 0.369 4.627
± 0.470 22.717 ± 0.024
2.032 ±0.269
33 GP-68B - 2.753
± 0.035 5.097
± 0.871 28.093 ± 0.069
2.979 ±0.361
34 GP-69 Hisar 3.287
± 0.015 3.260
± 0.546 24.513 ± 0.015
4.756 ±0.542
35 GP-78 Hisar 3.070
± 0.025 4.600
± 0.226 30.003 ± 0.450
5.604 ±0.232
36 GP-86 Hisar 3.570
± 0.032 3.890
± 0.767 23.577 ± 0.035
5.554 ±0.691
37 GP-86-1 Hisar 3.290
± 0.046 4.830
± 1.182 24.510 ± 0.017
4.093 ±1.251
38 HUM-1 Varanasi 2.010
± 0.115 1.597
± 0.234 25.327 ± 0.027
4.545 ±0.685
39 HUM-7 Varanasi 2.210
± 0.017 2.707
± 0.250 25.277 ± 0.129
5.615 ±1.881
40 IC103196 NBPGR 2.550
± 0.035 5.253
± 1.840 24.510 ± 0.017
4.313 ±1.748
41 IC39574 NBPGR 3.363
± 0.059 4.060
± 0.464 21.797 ± 0.056
2.949 ±0.858
42 IC39595 NBPGR 2.287
± 0.018 4.950
± 0.955 24.510 ± 0.012
5.865 ±1.380
43 KM-92-11 - 3.570
± 0.049 9.223
± 1.747 22.673 ± 0.113
6.218 ±1.387
44 L-24-2 Ludhiana 1.723
± 0.241 1.920
± 0.142 21.820 ± 0.035
2.197 ±0.109

96
45 LM-10 Ludhiana 2.927
± 0.074 3.473
± 0.263 24.487 ± 0.015
4.168 ±0.675
46 M-1361B Ludhiana 3.853
± 0.043 5.107
± 1.112 26.220 ± 0.046
4.925 ±0.808
47 M-169 Kanpur 2.057
± 0.027 3.833
± 0.276 25.390 ± 0.199
5.033 ±0.651
48 M-395 Ludhiana 1.607
± 0.045 1.757
± 0.111 22.670 ± 0.053
5.401 ±0.688
49 M-516 Kanpur 1.910
± 0.085 2.253
± 0.168 21.777 ± 0.055
6.423 ±0.960
50 M-605 - 2.257
± 0.035 3.007
± 0.294 26.297 ± 0.101
6.031 ±1.250
51 MH-124 Hisar 1.957
± 0.039 3.047
± 0.641 23.610 ± 0.012
6.671 ±1.612
52 MH-125 Hisar 2.323
± 0.184 3.267
± 0.135 26.217 ± 0.018
5.520 ±0.763
53 MH-215 Hisar 2.433
± 0.219 3.283
± 0.133 21.057 ± 0.033
5.723 ±1.167
54 MH-318 Hisar 3.153
± 0.178 5.022
± 0.768 23.554 ± 0.052
7.707 ±1.600
55 MH-419 Hisar 2.550
± 0.136 3.790
± 0.583 23.637 ± 0.058
8.850 ±0.261
56 MH-421 Hisar 2.725
± 0.083 3.803
± 0.058 25.325 ± 0.036
5.939 ±0.706
57 MH-96-1 Hisar 2.263
± 0.098 3.113
± 0.227 24.457 ± 0.035
6.655 ±1.687
58 MH-98-1 Hisar 2.923
± 0.072 7.097
± 3.820 25.440 ± 0.119
4.299 ±0.774
59 MI-3580 - 2.393
± 0.043 4.257
± 1.054 27.133 ± 0.043
6.845 ±2.003
60 ML-1108 - 2.227
± 0.046 3.760
± 0.394 23.550 ± 0.044
4.346 ±0.645
61 ML-194 Ludhiana 3.050
± 0.031 4.407
± 1.176 22.640 ± 0.078
6.909 ±1.231
62 ML-406 Ludhiana 1.537
± 0.290 2.523
± 0.361 21.830 ± 0.036
5.035 ±1.278
63 ML-5 - 2.413
± 0.280 2.780
± 0.096 27.153 ± 0.034
6.812 ±1.505
64 ML-506 Ludhiana 2.267
± 0.026 4.800
± 1.481 24.457 ± 0.035
4.765 ±1.218
65 ML-515 Ludhiana 3.350
± 0.061 5.650
± 1.005 22.730 ± 0.053
1.992 ±0.467
66 ML-682 Ludhiana 3.189
± 0.146 3.303
± 0.108 25.627 ± 0.135
3.463 ±0.985
67 ML-735 Ludhiana 2.820
± 0.080 6.580
± 0.206 28.053 ± 0.034
8.765 ±1.295
68 ML-759 Ludhiana 1.560
± 0.076 2.643
± 0.071 25.283 ± 0.128
2.460 ±0.671

97
69 ML-776 Ludhiana 3.323
± 0.384 7.270
± 1.939 23.587 ± 0.026
2.926 ±0.760
70 ML-803 Ludhiana 3.807
± 0.414 5.340
± 1.158 28.060 ± 0.032
5.695 ±0.424
71 ML-818 Ludhiana 3.187
± 0.096 4.470
± 0.354 29.743 ± 0.041
2.510 ±0.242
72 ML-839 Ludhiana 1.827
± 0.299 3.237
± 0.364 23.600 ± 0.021
7.571 ±1.553
73 Muskan - 2.057
± 0.029 2.717
± 0.044 24.357 ± 0.163
4.383 ±0.760
74 P-105 IIPR Kanpur 2.753
± 0.064 3.160
± 0.518 26.210 ± 0.023
2.935 ±0.588
75 PDM-9249 IIPR Kanpur 1.833
± 0.215 2.557
± 0.128 25.327 ± 0.027
4.629 ±1.413
76 PLM-116 Ludhiana 3.647
± 0.095 5.180
± 1.061 25.363 ± 0.038
4.717 ±1.046
77 PLM-176 Ludhiana 3.533
± 0.286 5.073
± 0.826 27.140 ± 0.036
3.550 ±0.683
78 PLM-18 Ludhiana 3.250
± 0.035 4.473
± 1.360 25.340 ± 0.026
1.457 ±0.759
79 PLM-62 Ludhiana 1.830
± 0.099 3.403
± 0.255 25.330 ± 0.026
1.096 ±0.360
80 PLM-65 Ludhiana 2.713
± 0.015 4.387
± 0.688 23.603 ± 0.018
2.983 ±1.147
81 PM-827 - 2.717
± 0.015 6.140
± 1.050 21.823 ± 0.032
5.235 ±1.490
82 PMB-14 Ludhiana 1.603
± 0.243 2.023
± 0.052 23.533 ± 0.058
1.783 ±0.243
83 SM-99-1 Hisar 2.183
± 0.068 4.843
± 1.342 21.830 ± 0.026
7.395 ±1.210
84 SMH-99-1A Hisar 3.143
± 0.331 3.973
± 0.339 28.103 ± 0.062
3.761 ±1.049
85 SMH-99-
1DB Hisar
3.110 ± 0.058
3.910 ± 0.120
27.133 ± 0.043
2.977 ±0.594
86 SMH-99-2 Hisar 2.487
± 0.015 3.020
± 0.100 25.483 ± 1.637
3.438 ±0.702
87 SMH-99-3A Hisar 1.697
± 0.316 3.403
± 0.299 25.210 ± 0.098
4.426 ±0.966
88 SMH-99-3D Hisar 1.657
± 0.156 2.243
± 0.054 21.590 ± 0.195
14.578 ±2.632
89 SMH-99-4 Hisar 2.743
± 0.138 3.173
± 0.097 27.190 ± 0.038
6.346 ±1.425
90 SML-668 Ludhiana 2.268
± 0.260 4.012
± 0.587 23.538 ± 0.095
8.827 ±1.983
91 Satya Hisar 2.468
± 0.102 4.060
± 0.346 21.132 ± 0.043
9.537 ±1.919
92 T-44 - 3.177
± 0.032 4.643
± 0.527 26.220 ± 0.021
4.509 ±1.023

98
Appendix II
Figure A Mean weekly meteorological data during crop growing season (Kharif -2007) recorded at the experimental station, CCS HAU, Hisar.
Figure B Mean weekly meteorological data during crop growing season (Kharif -2008) recorded at the experimental station, CCS HAU, Hisar.

99
CHAPTER 6
Differential response of mungbean (Vigna radiata L.) varieties to
changes in environmental conditions
Renu Singh, Ram Kumar, Richard G.F. Visser and Adriaan W. van Heusden

100
Abstract
One of the benefits of mungbean are its nutritional properties. Of the seven essential
micronutrients, especially iron and zinc play a vital role in human and animal health.
Breeding for varieties with a potential high concentration of micronutrients should be
complemented with studies of environmental effects on the accumulation of
micronutrients in seeds. GxE interactions were studied for plant height, number of
pods and branches per plant, seed yield, iron and zinc seed content. Our major
emphasis was to see the effect of iron and zinc supplementation on seed micronutrient
content and other agronomic traits. Therefore, to study different compositions of the
soil, six artificial conditions with different levels of micronutrients were created. Soil
supplemented with ZnSO4 or with ZnSO4 and 0.5% FeSO4 was beneficial for
agronomic traits but not favourable for iron and zinc content of seeds. The main
effects and interactions were statistically significant different. Three stability
parameters (Mean, bi and S2di) were calculated. No genotypes were found where the
seed yield was not influenced by changes in environmental conditions.
Keywords: environmental index, GxE, Genotype x Fertilisation, micronutrients,
stability.

101
Introduction
Mungbean is a widely grown food grain legume in the developing world. Mungbeans
are locally grown and available for the local people. In India, there is always
production in one state or the other. Dry beans, including mungbean (19.7 million
tonnes (mt), field pea (10.4 mt), chickpea (9.7 mt), cowpea (5.7 mt), lentil (3.6 mt)
and pigeon pea (3.5 mt), are important crops (FAO, 2010). The majority of population
in India is vegetarian therefore dry beans and especially mungbean is a major
replacement of animal proteins and micronutrients. Iron and zinc play a very
important and vital role in the health and development of animals, humans and plants,
therefore increasing their content in seed will may prove helpful in combatting
micronutrient deficiency in a vegetarian society.
Major constraints in breeding pulses such as mungbean are the high genotype
x environment (GxE) interactions and the low genetic diversity in the primary gene
pool (Jitendra et al. 2011). Several other studies (Patil et al. 1996; Tiwari et al. 2000;
Mehla et al. 2000) showed large GxE interactions which make it necessary to test new
varieties over a large number of environments. Mather and Jinks (1982), Mukai
(1988), and Wu and O’Malley (1998) describe two types of environmental variation:
(1) micro environmental effects which can’t easily be identified or predicted (e.g.,
year-to-year variation in rainfall, drought conditions, extent of insect damage) and (2)
macro environmental variances which are known (e.g., soil type, management
practices, controlled temperatures etc.). According to these investigators, the GxE
interaction can only be estimated for the macro environmental effects. Breeding
programs should aim at genotypes that perform well under as many conditions as
possible. Therefore testing new varieties under varying local growing conditions is of
utmost importance. Besides it is important to know the available germplasm and to
know the relationship between different accessions; landraces and cultivars (see
Chapter 3). Therefore in order to test the performance of the selected mungbean
cultivars to the different soil types, a total of six artificial soil environments were
created. These artificially created environments made it possibility to study the
stability of mungbean cultivars for micronutrient content (iron and zinc) and
important agronomic traits like yield.

102
Material and Methods
Plant material
The experiments were conducted with thirty elite genotypes growing in six different
artificial soil types. The genotypes were selected on the basis of contrasts in
micronutrient content and agronomic performance (Chapter 3, Table 5 & Chapter 5,
this thesis) in 2007 and 2008.
Field trials and experimental design
Six different field environments were created at the pulses station, CCS HAU, Hisar,
located at latitude of 29o10’N, longitude of 75o46’E and altitude 215.2 m above sea
level. The experiment was conducted in the kharif (July to September) 2009, in a
Random Block Design with spacing of 40 cm between rows and 15 cm between
plants within the row. The different environments were created by adding different
doses of micronutrients and fertilizer to the soil (Table 1). The recommended dose of
fertilizers (RDF) was added in all soils. Single Super Phosphate (SSP) and zinc were
added according to the recommendations of an experienced agronomist. Chelated iron
can be applied directly as a foliar spray (Figure 1) to enhance uptake.
Table 1 Details of artificial field environments
Environment Genotypes No. of replications Fertilizer doses
E1 30 3 RDF
E2 30 3 RDF + 0.5% FeSO4
E3 30 3 RDF + SSP
E4 30 3 RDF + SSP + 0.5% FeSO4
E5 30 3 RDF + SSP + ZnSO4
E6 30 3 RDF + SSP + ZnSO4 + 0.5%
FeSO4
RDF (Recommended dose of fertilizer) = 20 kg N/ha; 40 kg P2O5/ha; Fe = Foliar Spray (FeSO4; 0.5%); Zn (ZnSO4) = direct to soil (25kg/ha); SSP (Single Super Phosphate, Ca (H2OP4)2.H2O) = contains 16% water soluble P2O5, 12% sulphur & 21% calcium.

103
An optimal supply of nitrogen (20 kg/hectare) ensures an optimal uptake of
potassium as well as phosphorus, iron, zinc etc. (Ranade 2011). The mean
maximum/minimum temperature during the period of the study was 36.1/24.8 ˚C,
while the mean relative humidity was 81.7% (morning)/51.1% (evening). The soil of
the present experimental field is from the Indo-Gangetic alluvium and is in texture
loamy sand.
Before adding any fertilizer to the experimental fields, the physical-chemical
characteristics of the soil were measured (Table 2). Soil samples were taken from 6 to
8 inches under the surface (the aerobic zone where most root growth and nutrient
exchange happens). In total five samples were taken (from four corners and one from
the centre of the field). Each sample was approximately equal in size and placed in a
clean plastic bucket and mixed thoroughly and sends to the soil testing laboratory of
the department of soil, CCS HAU, Hisar.
After foliar spray of iron (Figure 1) and soil supplementation with ZnSO4 and
RDF, in the middle of the growth season samples of soil were again analyzed.
Figure 1 Mungbean plant stage at which micronutrients were added.
To measure mungbean yield some yield related traits were measured. Five random
plants were tested per row and plant height (cm), number of pods/plant, number of
branches per plant, seed yield/plant (g) were measured. Along with these parameters,
the iron and zinc content of the seed samples grown under different environments
were analyzed.

104
Stability analysis
Statistical analysis was carried out with software OPStat
(http://www.hau.ernet.in/link/spas.htm). The data for each trait were subjected to
analysis of variance using the general linear model for RBD design. The appropriate
‘F’ values were obtained for testing the significance of genotypes against error mean
square in accordance with the following model: Yij = m + ai + bj +eij where, m is
general mean, ai is ith treatment level, bj is jth replication level and eij is random error
associated with treatment for jth block.
The mean values for different traits of all thirty genotypes in six environments
as well as pooled over environments were used for analysis of variance for phenotypic
stability. The stability parameters of individual genotype were computed, using an
analytical approach suggested by Eberhart and Russell (1966). The model used in this
approach is as follows: Yij = μi +biIj + δij where, Yij is the variety mean of the ith
genotype at the jth environment; μi is mean of the ith genotype over all environments;
bi is regression coefficient that measures the response of the ith genotype to varying
environments; Ij is the environmental index obtained as the mean of the genotype at
the jth environments minus the grand mean of overall genotypes and environments and
δij is the deviation from regression of the ith variety at the jth environment.
Results
The data in Table 2 show, that the loamy sandy soil of the experimental field is
alkaline, low in available nitrogen (appendix I), medium in Fe, phosphorus,
potassium, sulphur and Zn.
Table 2 Analysis of soil physicochemical characteristics.
Soil characteristics Macronutrients (ppm)
pH Texture Nitrogen (N) Phosphorus (P) Potassium (K)
7.80 loamy sandy
72 1.4 12.4
Micronutrient (ppm) primary (Fe, Zn, Mn & Cu) and secondary (S) Fe Zn Mn Cu S
Before supple-mentation and sowing
24.0 1.10 8.32 1.18 16.25
After supple-mentation (mid stage)
8.40 0.86 2.87 0.58 600.0
After harvest 5.05 2.02 1.39 0.44 520.0
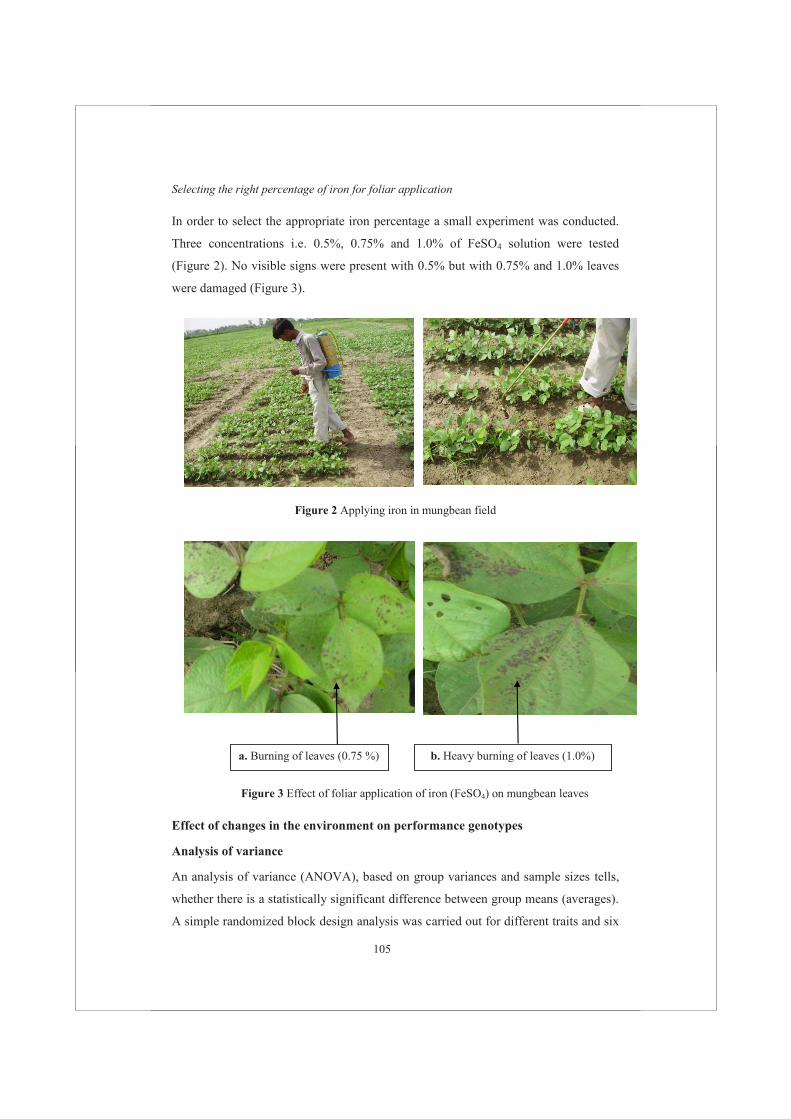
105
Selecting the right percentage of iron for foliar application
In order to select the appropriate iron percentage a small experiment was conducted.
Three concentrations i.e. 0.5%, 0.75% and 1.0% of FeSO4 solution were tested
(Figure 2). No visible signs were present with 0.5% but with 0.75% and 1.0% leaves
were damaged (Figure 3).
Figure 2 Applying iron in mungbean field
Figure 3 Effect of foliar application of iron (FeSO4) on mungbean leaves
Effect of changes in the environment on performance genotypes
Analysis of variance
An analysis of variance (ANOVA), based on group variances and sample sizes tells,
whether there is a statistically significant difference between group means (averages).
A simple randomized block design analysis was carried out for different traits and six
b. Heavy burning of leaves (1.0%) a. Burning of leaves (0.75 %)

106
soil environments. ANOVA for different traits in all the environments was carried out
to test the significance of phenotypic differences i.e. to see the presence of significant
variation for a trait in different environments. In order to test the significance, F
values were calculated by using the factor mean sum square against error mean square
and further significance was tested against the tabulated values. It is evident from
Table 3 that mean squares due to genotypes were significant in all the environments
for all traits except for plant height which was non-significant in E2. The critical
difference values showed that enough sufficient genetic variation was present for
most of the traits.
Table 3 Analysis of variance for six traits in mungbean under six different environmental conditions
Source of variation
d.f Environments PH*** NPP NBP SYP Fe Zn
Factor Block 2
E 1 30.56** 0.01 11.85 4.01 0.89 9.68**
E 2 5.28 0.14 0.36 1.34 38.13** 3.84**
E 3 1.06 0.16 7.79 1.23 34.70** 5.22**
E 4 23.15** 0.03 7.04 0.20 10.52** 0.23
E 5 16.06* 0.01 3.68 1.33 32.99** 0.23**
E 6 0.30 0.02 6.80 10.96* 11.18** 4.87**
Factor Genotype 29
E 1 268.68** 0.75** 148.35** 85.01** 3.18** 0.71**
E 2 290.88 0.58** 133.79** 75.89** 31.01** 12.16**
E 3 235.34** 0.73** 106.09** 113.15** 30.54** 2.17**
E 4 239.55** 1.02** 52.06** 76.12** 13.79** 1.35**
E 5 241.57** 0.61** 44.42** 60.53** 92.62** 1.35**
E 6 287.59** 1.29** 204.62** 126.36** 35.43** 36.91**
Error 58
E 1 4.07 0.08 10.62 2.65 1.09 0.33
E 2 2.81 0.07 4.86 1.31 1.17 0.07
E 3 4.38 0.09 3.47 1.19 1.25 0.12
E 4 3.63 0.09 6.56 0.88 10.17 0.04
E 5 5.46 0.06 2.69 1.28 1.16 0.04
E 6 1.09 0.035 2.89 1.67 0.57 0.17
CD+ (5%)
E 1 4.69 0.67 7.59 3.79 2.45 1.34
E 2 3.90 0.61 5.13 2.66 2.51 0.60
E 3 4.87 0.71 4.33 2.53 2.61 0.82
E 4 4.43 0.69 5.96 2.19 7.42 0.39
E 5 5.41 0.58 3.79 2.63 2.51 0.39
E 6 2.43 0.44 3.96 3.01 1.76 0.95
**Significant at P=0.01; * Significant at P= 0.05seeds; +CD=critical difference which depends on the MSE & the sample sizes; ***PH: Plant Height (cm), NBP: number of braches/plant, NPP: number of pods/plant, SYP: seed yield, Fe; iron seed content, Zn: zinc seed content

107
Estimation of environmental index (Ij) - grading of environments
The performance of a particular variety is the result of its genetic constitution and the
environment in which it grows. In order to see which environment causes poor, fair or
optimal growing conditions an environmental index can be estimated. The
environmental index shows the suitability of an environment for the expression of a
certain trait. The estimates of environmental index for all the six environments and
traits are expressed as deviation from the mean of all the genotypes at a given location
from the overall mean (Table 4).
Table 4 Environmental index of six traits of mungbean
Environment Fertilizer doses PH* NBP NPP SYP Fe Zn
E1 RDF 10.02 0.15 5.93 1.89 -1.23 -0.34
E2 RDF + 0.5% FeSO4 2.62 0.08 2.47 0.63 -0.47 0.87
E3 RDF + SSP -1.28 0.11 -0.77 0.39 -0.61 0.24
E4 RDF + SSP+ 0.5% FeSO4 -3.17 0.24 -0.44 0.81 -1.55 -0.74
E5 RDF + SSP + ZnSO4 -2.37 -0.28 -3.81 -2.01 4.13 -0.75
E6 RDF + SSP + ZnSO4 + 0.5% FeSO4 -5.81 -0.29 -3.36 -0.44 -0.26 0.72
*PH: Plant Height (cm), NBP: number of braches/plant, NPP: number of pods/plant, SYP: seed yield, Fe; iron content in seed, Zn: zinc content in seed
A high environmental index shows the presence of negative GxE interaction
and vice versa. Therefore, considering plant height, the environmental index Ij was
highest in E1 and lowest in E6 meaning that E6 was the most favourable environment
for plant height followed by E4, E5, E3 and E2. While the most unfavourable
environment for this trait is E1. This might be because of the fact that in all other
environments the soil was nutrient rich. For number of branches per plant, E6 and E5
are the most favourable environments, while the most unfavourable was E4.
For iron content, conditions in environment E5, the environment supplemented
with only ZnSO4, were not good. In E5 the Zn uptake is good but this condition was
not different from the E4 results. On the basis of Ij values, the E5 and E6
environments are favourable for most of the traits but not for iron and zinc content.

108
Stability analysis
It is known that genotypes performing well under a particular environment may or
may not perform well in other environments. It is therefore useful to study genotypes
in different circumstances. The pooled analysis of variance shows that the mean
squares due to genotypes were highly significant when tested against the pooled error
(Table 5). This shows the presence of considerable variability among the genotypes
for all traits. The model of Eberhart and Russell (1966) was used to calculate the
magnitude of linear and non-linear components of variation, which provide
information on predictable and unpredictable sources of variations. Highly significant
mean squares due to environment plus genotype x environment (E + GxE) for all the
traits suggest the presence of considerable interactions of genotypes with
environmental conditions. Highly significant variances due to the environment
(linear) indicate that mimicking environments by changing fertilizer doses is
effective.
Table 5 Stability analysis of variance for different traits (Eberhart and Russell 1966)
Source of variation d.f. PH*** NBP NPP SYP Fe Zn
Genotypes (G) 29 340.9**++ 0.8**++ 90.3**++ 79.3**++ 14.7**++ 3.1**
Environment (E) 5 949.6**++ 1.6**++ 407.2**++ 54.1**+ 129.7**++ 15.2**++
G x E 145 36.1 0.2** 27.9** 19.9** 10.8**++ 3.1**
Environments + (G x E) 150 66.5**++ 0.2**++ 40.6**++ 21.1** 14.8**++ 3.4**
E (linear) 1 4747.9**++ 7.9**++ 2036.1**++ 270.2**++ 648.5**++ 76.1**++
G (linear) x E 29 57.1***++ 0.3**+ 36.2** 24.7** 25.9**++ 4.2**+
Pooled deviation 120 29.8** 0.15** 24.9** 18.1** 6.9** 2.7**
Pooled error 348 3.6 0.07 5.2 1.5 2.6 0.1
*, ** = Significant mean square against pooled error at 5% and 1% probability level respectively
+, ++ = Significant mean square against pooled deviation at 5% and 1% probability level respectively
***PH: Plant Height (cm), NBP: number of braches/plant, NPP: number of pods/plant, SYP: seed yield, Fe; iron seed content, Zn: zinc seed content

109
Further partitioning of the GxE interaction into linear and non-linear (pooled
deviation) components showed that both these components were significant for all the
traits when tested against the pooled error. When the linear component of GxE
interaction was compared with the pooled deviation (non-linear component) it was
significantly different for plant height, number of branches per plant and for iron and
zinc content in the seeds. The results indicate that the differences among genotypes
will further be used to estimate the (bi) values. When the pooled deviation is highly
significant it indicates that part of the variation of the genotypes is unpredictable. For
two traits i.e. number of branches per plant and seed yield per plant, pooled deviations
of mean squares was not significant suggesting that only predictable responses will be
found for these traits.
From Table 5, it is clear that significant differences among genotypes,
environments and interactions are detected for all studied traits. These results revealed
that the mungbean genotypes responded differently to the different environmental
conditions. For Fe and Zn this is obvious because all the environments have a
different status of iron and zinc. The predictability of response to Fe and Zn content in
soil will decide whether a particular genotype can accumulate more of these
micronutrients or not. These aspects are given in table 8 and discussed hereafter.
Estimation of stability parameters for individual genotypes
Because overall GxE interactions were found to be significant, the next test can be to
identify genotypes, which are less variable under different environmental conditions.
Many models have been developed to identify stable genotypes but for the present
study the Eberhart and Russell (1966) model was used. According to this model, a
variety is stable when regression coefficient (bi) is equal to one and the deviation
from regression (S²di) is as close to zero as possible with a high mean performance.
The above two measures of assessing the stability of genotype mean regression
coefficient (bi) and the mean square deviation (S²di) were used in assessing the
stability of thirty genotypes (Appendix II, III & IV).
Plant height
The stability parameters (Appendix II) show that five genotypes had a significant bi
and that all thirty genotypes had a significant S2di. The performance of genotypes

110
with a significant bi value can be predicted across environments. Both linear as non-
linear components of the interactions were observed for five genotypes. The
remaining twenty five genotypes had only the non-linear component as only their S2di
was significant. This means that the response in plant height across the environments
cannot be predicted for these genotypes.
Number of branches per plant
The regression analysis of individual genotypes (Appendix II) shows that six
genotypes (MH-125, 2KM-135, ML-406, 2KM-155, MH 215 and ML-506) had non-
significant bi and S2di values indicating the absence of GxE interactions for this
character. One genotype, ML-759, had significant values for bi and S2di meaning both
linear and non-linear components of GxE interaction. One genotype (PDM-9-249) has
a significant bi and no significant S2di which shows presence of only linear portion of
GxE interaction and therefore its performance can be predicted. Among the thirty
genotypes (see chapter 3), only seven were found to be stable across the environments
while the other 23 genotypes, with significant S2di, were unstable in different
environments. Only two genotypes, MH-125 and PDM-9-249 show above average
response (bi < 1.0) and were found to be stable in favourable environments i.e.
environments supplemented with proper irrigation, spray and fertilizers. Two
genotypes, ML-406 & ML-506, show below average response (bi>1.0) and were
stable in poor environments while the other three i.e. 2KM-135, 2KM-155 and MH-
215 were found to be stable in all types of environments.
Number of pods per plant
The test of significance for GxE interaction namely bi for individual genotypes with
respect to number of pods per plant showed no linear component of GxE for one
genotype: PDM-9-249 (Appendix 3). Twenty nine genotypes had a non-linear
component showing that these genotypes are unstable and their response can’t be
predicted across different environments.
Seed yield per plant
Individual analysis of the behaviour of thirty genotypes (Appendix III) show that all
the thirty genotypes show significant S2di values, indicating their unpredictable
behaviour across environments.

111
Iron content in seed
For iron content (Appendix IV) both stability values were significant in two
genotypes, MI-3580 & 2KM-139 and only significant bi values were found in eleven
genotypes. For these eleven genotypes the GxE interaction was linear and the
performance of these genotypes can be predicted across the environments. Nothing
could be predicted for MI-3580 and 2KM-139
Twelve genotypes were found unstable as their S2di (2 with both bi & S2di and
10 with only S2di) were significant whereas the remaining 18 were found to be stable.
Out of the eighteen stable genotypes, ten genotypes show above average response (bi
>1.0) meaning good performance in favourable environments while the remaining 8
show average response and found to be stable across all kind of environments.
Zinc content in seed
For zinc content both stability parameters of two genotypes (2KM-138 and PDM-9-
249) were non-significant therefore no GxE interactions in these genotypes (Appendix
IV). Significant bi and S2di values were found in KM-107 and ASHA while in ML-
818 only the bi was significant. Twenty seven genotypes had a significant S2di value,
indicating that their response can’t be predicted across the environments. Only three
genotypes namely ML-818, 2KM-138 & PDM-9-249 were found to be stable with an
average response (bi = 1).
Stability parameters for individual genotypes
Once the interactions were found to be significant, the next test was to identify stable
genotypes, which interact less with differences in circumstances. A variety is said to
be stable when the regression coefficient (bi) is equal to one, deviation from
regression (S²di) as close to zero as possible and a high mean performance. The linear
regression (bi) could simply be regarded as the measure of response of a particular
genotype and if it is of greater than one then the genotypes is sensitive to
environmental changes but adopted to favourable environments. If it is lower than one
it indicates above average stability. If this stability is accompanied by a high mean
value, the genotype is said to be better adapted to widely differing conditions. On the
other hand, deviation around the regression line is considered as a better measure of
stability. With respect to the non-linear component of the GxE interaction, the

112
genotype with the lowest standard deviation will be the most stable and vice-versa.
The results of present study on stability parameter are discussed below (Table 6).
Table 6 Distribution of different genotypes on basis of different stability parameters for six traits in mungbean (V. radiata L)
Character
Predictable Unpredictable
Both bi and¯S2di
non-significant
Only bi
significant
Both bi and ¯S2di
significant
Only ¯S2di
significant
PH - - 5 25
NBPP 6 1 1 22
NPPP - 1 - 29
SYPP - - - 30
Fe content 7 9 2 12
Zn content 2 1 2 25
For seed yield no genotype was found to be stable across different
environments but for iron content the performance of eleven genotypes could be
predicted across environments. For MH-125 and ML-5 both bi and ¯S2di were non-
significant therefore they are stable but their performance cannot be predicted. For
zinc content only one genotype’s performance namely ML-818 could be predicted.
The distribution of different stable genotypes for two traits i.e. iron and zinc
content in seeds on basis of the three stability parameters (X, bi and S2di ) are
presented in table 7; thirteen genotypes were found to be stable across the different
treatments for iron content in seeds while only one genotype was stable for zinc
content.

113
Table 7 Grouping of stable genotypes for iron and zinc content on basis of the three
stability parameters
Iron content in seeds of mungbean
Zinc content in seeds of mungbean
Environment conditions
Xi ≥ X
bi > 1.0
S2di = +
ML-1108, SMH-99-2, 2KM-138*, MH-124*, PDM-9-249,ML-759 (6, 13, 20*, 22*, 26, 27)
- Good for favourable environment conditions
Xi ≥ X
bi = 1.0
S2di = +
ML-5*, 2KM-112, 2KM-135*, MH-215*, SMH-99-B (3*,5, 12* 24* 25)
- Good for all type of environments
Xi ≥ X
bi < 1.0
S2di = +
MH-125*, ML-839*, MH-421*, ML-406*, MH-318*, M-395*, PMB-14* (2* 8* 10* 17* 21* 28* 29*)
ML-818 (16) Good for poor environments
+ = non-significant; * = Xi < X; X = average mean; bi= regression coefficient; ¯S2di= mean square deviation from the regression
Discussion
The genotypes studied in this chapter were selected from the first experiment based
on per se performance, chemical analysis and diversity. Thirty genotypes were
selected belonging to four separate clusters (Chapter 3 and 5). Analysis of variance of
quantitative traits showed highly significant differences among the genotypes among
all environments. This indicated that the chosen genotypes had sufficient variability.
The pooled analysis of variance showed that mean sums of squares (MSS) due to
genotypes were highly significant for all the traits indicating enough variation. The
MSS due to environmental conditions were also significant for almost all the traits
indicating the validity of conducting an experiment as we did in artificial
environments. The interactions were significant for almost all traits indicating
considerable interaction between genotypes and environments for the expression of
traits. The MSS due to environment + (genotype x environment) and environment
(linear) was significant for all the traits indicating that environmental effects are
additive. The linear component of GxE interaction was also significant for all the
traits under study indicating a significant role of the linear response of the genotypes

114
to environmental changes. Singh et al. (1993), Singh and Kumar (1994) and
Popalghat et al. (1999) also reported differential ranking in their studies in chickpea.
The pooled deviation was also found significant for all the traits indicating that the
non-linear component of GxE interaction was predominant. Similarly, joint
regression analysis reveals that MSS due to genotype was significant and thus
supports that there is presence of significant variation among the genotypes for all
traits under study. Both heterogeneity between regression (GxE interaction linear) and
remainder (non-linear) was found significant for all the traits when tested against the
pooled error. It indicates that prediction will depend upon the relative magnitude of
these two measures. Further, the prediction will be more reliable when only
heterogeneity between regressions is significant against the remainder (Samuel et al.
1970). Therefore, in the present study a prediction for plant height, iron and zinc
content in seeds of mungbean will be reliable.
Soil analyses during the course of experiment showed some expected and
unexpected results. The uptake of copper can be explained by the fact that manganese
helps in uptake of copper while after harvest the zinc concentration in the soil was
found to be higher as before sowing which may be thought of that excess amount of
iron results in decrease in zinc uptake (Ranade 2011) along with Cu presence which
also reduces the availability of Zn. Sulphur concentration in soil after harvest had a
thirty times higher concentration in comparison to the initial stage analysis which was
thought to be caused by super sulphate, which was added in the soil during the course
of experiment. An environmental index reveals the favourability/adaptability of an
environment at a particular location. Breese (1969) pointed out that the estimates of
the environmental index can provide the basis for the identifying the favourable
environments for the expression of maximum potential of the genotype. As in the
present study two major aspects were in consideration i.e. micronutrient (Fe and Zn)
and yield and its attributes. Therefore, on basis of the results presented in Table 5, for
yield and its related traits environment 1(E1) was found to be the most unfavourable.
This may be related to the fact that this environment is not provided with single super
phosphate which promotes the absorption of minerals from the soil. The second most
unfavourable environment was E2 for all the traits except for iron content in seed.
SSP was also not added in this environment which may be the reason for poor yield
and its attributes. Adding SSP was found to be very important for pulses. Zinc uptake

115
become lower after foliar spray of iron. For iron uptake E5 and E6 were unfavourable
probably because of the added excess amount of ZnSO4 which hinders the iron uptake
(Ranade and Malvi 2011).
For yield E6 and E5, where both SSP and micronutrients were added, were
found to be the most optimal. For iron content the most favourable environment was
E4, which was expected as this environment SSP was added along with foliar spray of
FeSO4 and no excess of ZnSO4. For zinc content E5 was the most favourable.
Environment 6 is good for yield micronutrient uptake is lower showing that excess of
micronutrients hinder their uptake (Ranade and Malvi 2011). In our study and in other
studies it was noticed that there was a variable pattern of response for the different
traits in different environments (Singh et al. 1990; Singh et al. 1991; Popalghat et al.
1999).
GxE limits the progress of crop improvement beyond the breeders’ station.
Nutritional quality of food legumes are subjected to variation caused by different
environmental conditions. Dixon et al. (1991) define GxE interaction as the change in
a cultivars relative performance over environments, resulting from differential
response of the cultivar, to various edaphic, climatic and biotic factors. In the present
study differential genotypic responses across the different created environments
showed that the cultivars differ in response across different environments and thus
this can complicate the evaluation and selection of cultivars for any specific purpose
or trait like in the present study. This study shows the importance of studying the GxE
interaction in mungbean improvement programs.
References
Ashraf M, Mueen-ud-din M, Warraich NH (2003) Production efficiency of mungbean as affected by seed inoculation and NPK application. International Journal Agriculture and Biology 5:179-180.
Breese EL (1969) The measurement of significance of genotype x environmental interaction in grasses. Heredity 24: 26-44.
Eberhart SA, Russell WA (1966) Stability parameters for comparing varieties. Crop Science 6: 36-40.
Jitendra K, Arbind KC, Ramesh KS, Aditya Pratap (2011) Towards marker-assisted selection in pulses: a review. Plant Breeding 130: 297-313.

116
Mehla IS, Waldia RS, Dahiya SS (2000) Phenotypic stability for some cooking quality attributes among kabuli chickpea (Cicer arietinum L.) genotypes. Journal of Genetics and Breeding 54: 293-297.
Mukai T (1988) Genotype-environment interaction in relation to the maintenance of genetic variability in populations of Drosophila melanogaster. Proceedings of the 2nd International Conference on Quantitative Genetics (Editors: B. S. Weir, E. J. Eisen, M. M. Goodman, and G. Namkoong): 21-31.
Mather K, Jinks JL (1982) Biometrical Genetics. Chapman and Hall Ltd., London.
Patil VS, Deshmukh RB, Patil JV (1996) Genetic analysis of quantitative characters in mungbean. Indian Journal of Pulses Research 9: 132-136.
Popalghat GR, Patil JV, Deshmukh RB, Mhase LB (1999) Stability for yield and yield components in chickpea (Cicer arietinum L.). Legume Research 22:254-258.
Ranade UM (2011) Interaction of micronutrients with major nutrients with special reference to potassium. Karnataka Journal of Agricultural Sciences 24 (1):106-109.
Samuel CJA, Hill J, Breese EJ, Davis A (1970) Assessing and predicting environment response in Lolium preme. Journal of Agriculture Science 75: 1-19.
Singh O, Kumar S (1994) Phenotypic stability of yield and related characters in desi gram (Cicer arietinum L.). Indian Journal of Agricultural Science 64:815-820.
Singh KB, Bejiga G, Malhotra RS (1993) Genotype–environment interactions for protein content in chickpea. Journal of the Science of Food and Agriculture 63:87–90.
Singh G, Brar HS, Verma MM (1991) Genotype environment interaction and phenotypic stability in chickpea. Crop Improvement 18:135-140.
Singh KB, Williams PC, Nakkoul H (1990) Influence of growing season, location and planting time on some quality parameters of kabuli chickpea. Journal of the Science of Food and Agriculture 53: 429-441.
Tiwari S, Dwivedi VK, Tiwari S (2000) Stability studies in chickpea. Annals of Agricultural Research 21 (1): 114 - 118.
Wu RL, OíMalley DM (1998) Nonlinear genotypic response to macro- and microenvironments. Theoretical and Applied Genetics 96: 669-675.

117
Appendix I
Limits for different macro and micronutrients in soil.
Macro/Micronutrient Low Medium High
N <250 kg/ha 250-500 >500
P <10 10-20 >20
K <125 125-300 >300
S <10 10-20 >20
Zn 0.6 ppm - -
Cu 0.2 ppm - -
Fe 4.5 ppm - -
Mn 2.5 ppm - -

118
Appendix II
Estimates of stability parameters (Eberhart and Russell, 1966) for plant height and number of branches.
V.No Plant Height Number of branches per plant
Varieties Mean bi=1+ βi S2di Mean bi=1+ βi S2di
1 ML-803 48.9 0.84 44.82** 2.6 2.97 0.17**
2 MH-125 70.1 0.25* 8.09** 1.9 1.78 0.01
3 ML-5 75.5 0.88 66.87** 2.6 1.81 0.08**
4 ML-735 60.7 0.679 20.87** 2.0 1.65 0.04*
5 2KM 112 62.1 0.63 2.21* 2.2 0.29 0.04*
6 ML-1108 64.8 0.56 10.97** 2.5 1.75 0.19**
7 MI-3580 62.6 1.04 9.54** 1.7 0.55 0.07**
8 ML-839 61.1 1.24 57.33** 1.9 2.29 0.07**
9 L-24-2 71.6 1.07 10.07** 1.9 2.04 0.04*
10 MH-421 59.6 0.21* 8.55** 1.8 0.24 0.21**
11 2KM-139 75.9 0.28 21.82** 2.5 1.79 0.37**
12 2KM 135 70.5 1.01 23.42** 2.0 0.24 0.02
13 SMH-99-2 76.8 0.60 26.31** 2.8 0.85 0.14**
14 2 KM-107 63.8 0.29 40.82** 1.9 1.46 0.52**
15 BG-39 66.4 1.07 26.45** 2.1 0.19 0.10**
16 ML-818 72.2 0.43 27.29** 2.1 0.38 0.18**
17 ML-406 67.8 1.68 53.73** 2.5 -0.59 0.01
18 2KM-151 52.9 0.23 75.04** 1.7 0.73 0.07**
19 2KM 155 57.3 1.79 33.89** 2.1 0.32 0.01
20 2KM-138 66.2 1.14 13.34** 1.9 -0.82 0.17**
21 MH3-18 54.4 0.79 19.34** 2.3 -0.69 0.12**
22 MH-124 66.9 0.49* 3.65** 1.9 1.33 0.11**
23 ASHA 68.2 1.05 28.73** 2.3 0.35 0.06**
24 MH-215 63.6 1.07 7.42** 2.4 0.82 0.03
25 SMH-99-DULL B
79.1 1.94 112.73** 2.8 0.50 0.46**
26 PDM-9-249 66.8 1.46 12.66** 2.2 2.08* 0.01
27 ML-759 66.8 2.64 61.84** 2.4 2.87* 0.08**
28 M 395 69.8 1.81* 5.49** 2.4 1.58 0.15**
29 PMB-14 50.4 1.06 10.26** 2.9 1.26 0.08**
30 ML-506 63.4 1.83* 11.55** 3.1 -0.01 0.0
Mean 65.2 1.000 2.263 1.000
S.E (+) 2.44 0.434 0.17 0.740
*Significant at P= 0.05

119
Appendix III
Estimates of stability parameters (Eberhart and Russell, 1966) for number of pods and seed yield per plant in mungbean seeds
V.No Number of pods per plant Seed Yield per plant
Varieties Mean bi=1+ βi ¯S2di Mean bi=1+ βi ¯S2di
1 ML-803 24.206 1.5486 67.850** 19.6 4.767 50.711**
2 MH-125 19.439 0.6266 7.808** 17.239 2.319 14.28**
3 ML-5 19.767 0.9433 6.159** 15.511 1.487 20.38**
4 ML-735 19.467 2.0925 16.863** 19.183 1.777 36.439**
5 2KM 112 17.817 0.4259 13.469** 15.072 0.800 28.532**
6 ML-1108 19.006 1.425 6.710** 14.65 1.661 21.437**
7 MI-3580 18.844 1.3197 14.11** 16.594 2.935 5.419**
8 ML-839 16.639 1.4375 3.0682* 13.994 3.624 10.78**
9 L-24-2 16.611 1.4559 20.972** 12.744 0.984 25.689**
10 MH-421 16.428 1.0676 17.562** 13.706 1.149 13.430**
11 2KM-139 19.683 0.463 12.864** 14.328 -0.308 7.593**
12 2KM 135 17.333 1.4707 170.188** 7.783 -0.581 8.833**
13 SMH-99-2 17.189 0.3429 23.141** 9.994 -0.537 7.427**
14 2 KM-107 11.9 0.0385 16.378** 8.95 0.479 5.684**
15 BG-39 16.622 1.0802 18.937** 11.2 -0.168 8.530**
16 ML-818 16.344 0.6801 5.148** 15.178 0.865 8.872**
17 ML-406 28.144 -0.6261 121.406** 18.978 -2.265 33.579**
18 2KM-151 13.189 0.5225 12.095** 14.117 -0.589 11.223**
19 2KM 155 13.944 1.1047 10.860** 11.372 0.995 9.834**
20 2KM-138 17.617 0.0074 13.556** 16.139 -2.168 6.136**
21 MH3-18 18.989 0.479 3.5976* 19.267 0.127 10.816**
22 MH-124 15.1 0.4724 8.981** 16 -0.771 13.296**
23 ASHA 18.778 1.36 6.285** 16.061 0.898 8.672**
24 MH-215 19.572 0.6465 8.874** 15.8 -0.939 22.086**
25 SMH-99-DULL B 23.789 2.25 16.185** 16.094 2.975 23.536**
26 PDM-9-249 21.372 2.7962* 23.337 18.178 2.502 38.429**
27 ML-759 14.161 1.5862 3.644* 8.756 2.868 10.109**
28 M 395 20.256 1.3538 13.089** 14.017 2.247 8.444**
29 PMB-14 15.206 0.1693 17.730** 11.611 0.709 46.251**
30 ML-506 28.85 1.4602 16.276** 24.267 2.159 11.733**
Mean 18.542 1.000 14.879 1.000
S.E (+) 2.23 0.607 1.90 1.418
*Significant at P= 0.05
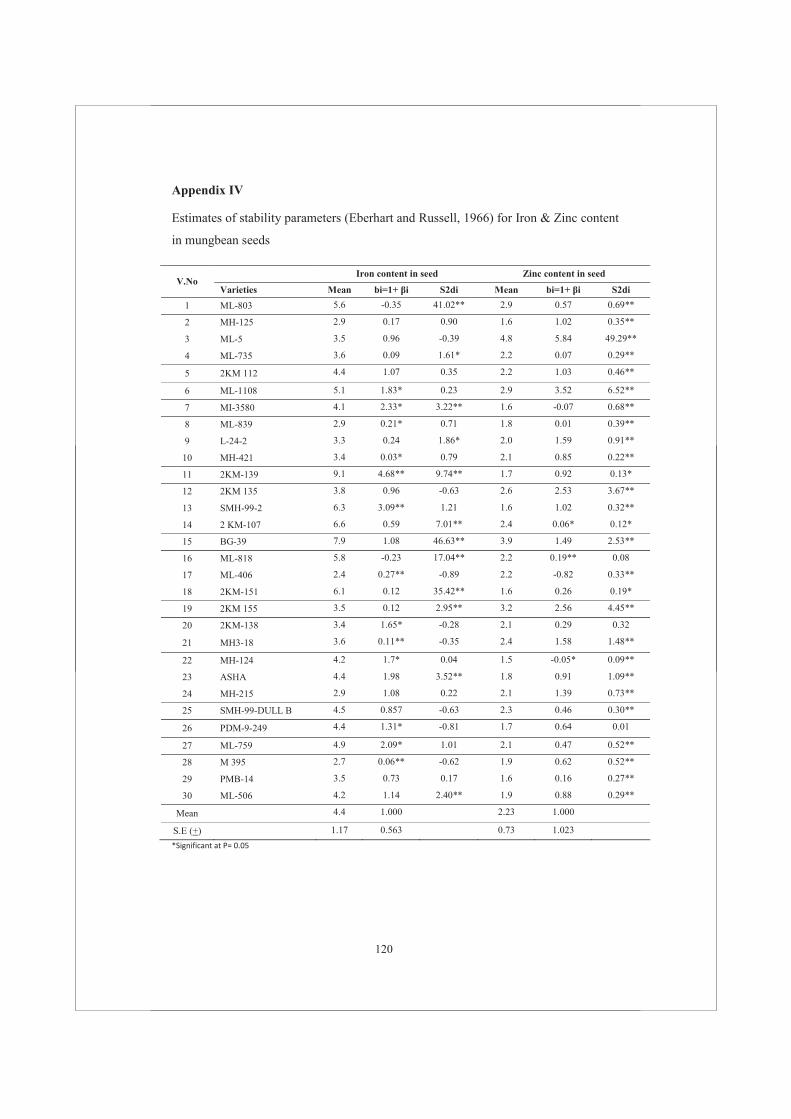
120
Appendix IV
Estimates of stability parameters (Eberhart and Russell, 1966) for Iron & Zinc content
in mungbean seeds
V.No Iron content in seed Zinc content in seed
Varieties Mean bi=1+ βi S2di Mean bi=1+ βi S2di
1 ML-803 5.6 -0.35 41.02** 2.9 0.57 0.69**
2 MH-125 2.9 0.17 0.90 1.6 1.02 0.35**
3 ML-5 3.5 0.96 -0.39 4.8 5.84 49.29**
4 ML-735 3.6 0.09 1.61* 2.2 0.07 0.29**
5 2KM 112 4.4 1.07 0.35 2.2 1.03 0.46**
6 ML-1108 5.1 1.83* 0.23 2.9 3.52 6.52**
7 MI-3580 4.1 2.33* 3.22** 1.6 -0.07 0.68**
8 ML-839 2.9 0.21* 0.71 1.8 0.01 0.39**
9 L-24-2 3.3 0.24 1.86* 2.0 1.59 0.91**
10 MH-421 3.4 0.03* 0.79 2.1 0.85 0.22**
11 2KM-139 9.1 4.68** 9.74** 1.7 0.92 0.13*
12 2KM 135 3.8 0.96 -0.63 2.6 2.53 3.67**
13 SMH-99-2 6.3 3.09** 1.21 1.6 1.02 0.32**
14 2 KM-107 6.6 0.59 7.01** 2.4 0.06* 0.12*
15 BG-39 7.9 1.08 46.63** 3.9 1.49 2.53**
16 ML-818 5.8 -0.23 17.04** 2.2 0.19** 0.08
17 ML-406 2.4 0.27** -0.89 2.2 -0.82 0.33**
18 2KM-151 6.1 0.12 35.42** 1.6 0.26 0.19*
19 2KM 155 3.5 0.12 2.95** 3.2 2.56 4.45**
20 2KM-138 3.4 1.65* -0.28 2.1 0.29 0.32
21 MH3-18 3.6 0.11** -0.35 2.4 1.58 1.48**
22 MH-124 4.2 1.7* 0.04 1.5 -0.05* 0.09**
23 ASHA 4.4 1.98 3.52** 1.8 0.91 1.09**
24 MH-215 2.9 1.08 0.22 2.1 1.39 0.73**
25 SMH-99-DULL B 4.5 0.857 -0.63 2.3 0.46 0.30**
26 PDM-9-249 4.4 1.31* -0.81 1.7 0.64 0.01
27 ML-759 4.9 2.09* 1.01 2.1 0.47 0.52**
28 M 395 2.7 0.06** -0.62 1.9 0.62 0.52**
29 PMB-14 3.5 0.73 0.17 1.6 0.16 0.27**
30 ML-506 4.2 1.14 2.40** 1.9 0.88 0.29**
Mean 4.4 1.000 2.23 1.000
S.E (+) 1.17 0.563 0.73 1.023
*Significant at P= 0.05

121
CHAPTER 7
Towards Marker Assisted Breeding for Micronutrients (Fe and Zn) in Mungbean
Renu Singh, Ram Kumar, Ram C. Yadav, Richard G.F. Visser and Adriaan W. van Heusden

122
Abstract
Mineral micronutrient deficiency affects women and preschool children in every part
of the world. One of the methods to mitigate micronutrient deficiency is to breed for
food crop cultivars with higher levels of micronutrients. In mungbean a start has been
made to do this. A molecular study was started in order to identify those chromosomal
regions harbouring genes that play a role in the potential level of micronutrients in the
plant. For this purpose two different recombinant inbred line populations (RILs) were
made, 120 RILs per population were obtained after crossing contrasting parents and
repeatedly selfing (single seed descent) until the F6 population. These RILs were
phenotyped for micronutrient content and a start was made with genotyping. The
content of iron and zinc varied between individuals of the populations: In cross 1 from
1.7 to 5.9 mg/100g (for Fe) and 2.0 to 3.8 mg/100g (for Zn). In cross 2: 2.1 to 8.2
mg/100g (Fe) and 1.0 to 8.4 mg/100g (Zn). In both crosses transgressive segregation
was observed. Chemical analysis of the RILs showed as expected a positive
correlation between iron and zinc content, however unfortunately in the marker
analysis no significant association between the markers and the phenotypic traits was
found in the RIL populations. A limited number of markers were run over 30 different
cultivars where links to the micronutrient contents were found. One marker explaining
21% of the difference in iron content and 28 of the difference in the zinc content and
another marker explaining 24 % of the difference in zinc content.
Keywords: Amplified fragment length polymorphism (AFLP), micronutrients,
mungbean, recombinant inbred lines (RILs)

123
Introduction
Mungbean (Vigna radiata L.) also called green gram is one of the principal legumes
and is a very nutritive crop. The seeds are used for human consumption, the plant as
fodder for livestock and green manure. The seeds contain 25 to 28% protein, 1.0 to
1.5 % fats, 3.5 to 4.5% fibre, 60 to 65% carbohydrates and are rich in lysine, ascorbic
acid, potassium, iron, phosphorus and calcium (Lambrides and Godwin 2007).
Moreover, its seeds are more palatable, nutritive and digestible and non-flatulent in
comparison to other pulses (Sadeghipour et al. 2010). Thus, mungbean is nature’s gift
to man in general and to children, pregnant or lactating women and the elderly people
especially. It has the potential to be used as an economic food supplement to fight
malnutrition. India is the largest producer and consumer of pulses in the world. In
India, mungbean is grown on an area of 2.92 million ha, with a production of 1.42
million ton (486 kg/ha, Dixit 2005). As it is one of the major sources of protein and
mineral micronutrients it is often traded and consumed locally.
Micronutrient malnutrition, and particularly Fe and Zn deficiencies (the so
called ‘hidden hunger’), affects over three billion people worldwide, mostly in
developing countries (Welch and Graham 2004). Fortification of food is one step in
combating these deficiencies but this is not always possible, for instance adding iron
doesn’t result in a stable product and makes the product unpalatable. To increase the
concentration in the edible portions of crop plants it is necessary to incorporate
micronutrient content in breeding programs.
Mungbean germplasm screening revealed genetic variation for the content of
iron and zinc (ranging from 1.6–9.2 mg/100 g Fe and 1.5- 3.9 mg/100 mg Zn
respectively). Iron and zinc concentrations in the seeds tend to be correlated (r = 0.47;
this thesis Chapter 3), making it possible to screen for high concentrations of both.
The content is substantially influenced by genotype (G) x environment (E)
interactions. Recombinant Inbred Lines (RILs) make it possible to screen for high
iron and zinc concentrations under different conditions and make it possible to screen
for associations between DNA markers and high concentrations (Quantitative Trait
Loci). These markers later on can be used in marker assisted selection (MAS) and in
this way make the breeding more efficient. Mineral accumulation in higher plants
appears to be under control of many genes (Blair et al. 2009). In Arabidopsis thaliana

124
seed mineral accumulation was found to be quantitative and associated with various
candidate genes, like for example 21 genes involved in ion homeostasis (Ding et al
2010).
As mungbean is primarily used as a food, extensive research is being done on
seed quality traits such as size, shape, colour, hard-seededness, protein quality and
quantity ( Humphry et al. 2005; Lambrides and Godwin 2007) along with agronomic
traits like drought resistance (Sholihin and Hautea 2002), virus resistance (notably
MYMV) (Anjum et al. 2010). For micronutrient content several studies were
conducted in common bean, peas, chickpeas, lentils etc. (Islam et al. 2002; Grusak
and Cakmak 2005; Haq et al. 2007; Thavarajah et al. 2010) but till this date, not much
effort has been made to locate genes/QTLs responsible for micronutrients in
mungbean. With this in mind, the goals of this study were: (a) to choose the best
parents to create mapping populations (recombinant inbred lines - RILs), (b) to
determine the level of iron and zinc in the individuals of these RIL populations and
(c) to analyse the segregation patterns of iron and zinc concentration in these RILs.
After this it could be decided whether a more extensive QTL-mapping study will be a
feasible follow up.
Materials and methods
Plant materials
120 Recombinant inbred lines (F6 RILs) obtained from a cross between BG 39 X
2KM 138 and 120 recombinant inbred lines from SMH 99-1 X BDYR1 were made
through single seed descent (SSD) at the pulses research field, CCS HAU, Hisar
(India). The parents used in both the crosses were contrasting in their micronutrient
(Fe & Zn) content and agronomic characters (Table 1). The diversity analysis
(Chapter 3 and 5 of this thesis) showed that the selected parents fall in different
clusters. The 30 selected cultivars are the same as in Chapter 3, Table 4)

125
Table 1 Micronutrient content in RIL parents
No. Crosses Genotype Characters Cluster No.*
Cross 1 BG39 X 2KM138
BG39 High in Fe (6.0 mg/100 g),
medium in Zn (2.6 mg/100 g) II
2KM138 Low in Fe (<2.4 mg/100 g), low
in Zn (<2.0 mg/100 g) V
Cross 2 SMH99-1 X
BDYR1 SMH99-1
Medium in Fe (<3.9 mg/100 g), high in Zn (>3.1 g/100 mg)
I
BDYR1 High in Fe (>4.5 mg/100 g),
medium in Zn (>2.5mg/100 g) II
*Chapter 3 and 5 (this thesis)
Experimental design and mineral analysis
120 recombinant inbred lines (RILs) of both crosses were sown in a randomized block
design (RBD). Sowing was done in July 2010 and ten seeds of each RIL were sown in
a four meter row, 45 cm apart with intra-spacing of 10 cm, CCS HAU, Hissar. Trials
were managed with recommended fertilization rates and the plots were hand
harvested to avoid any contamination. Each plant was threshed separately in a bag and
used for chemical analysis. Phenotyping Fe and Zn content measurements were done
using atomic absorption (AAS) analysis and was based on nitric/per-chloric acid
digestion. Briefly, 1 g of each sample was acid digested with 5 ml of a 2:1 mixture of
65% nitric acid (HNO3) and 70% per-chloric acid (HClO4) in a 50 ml Taylor digestion
tube for 2 h followed by a heat treatment of 200 oC for 2 h and a re-suspension in 25
ml of deionised water. With sample read on atomic absorption (Perkin Elmer
Aanalyst 400 atomic absorption spectrophotometer) in the Shree Balaji Test Lab
(SBTL).
Statistical analysis: Phenotypic/Chemical data
The phenotypic data obtained for iron and zinc content was analysed using t test (t =
¯X - μ/ s/√n). Where, s= standard deviation of the sample, n= number of observations,
¯X = sample mean & μ = parent mean. Mean and range among the RILs in
comparison with parents and correlation coefficients (r) among these traits were also

126
estimated using the pooled data over environments (PE). The computation for the data
was performed using the software package SAS.
Molecular marker analysis
Young leaves from 3 - 5 weeks-old seedlings were collected and immediately stored
at -80oC. The DNA isolation and molecular work was carried out at Wageningen-UR
Plant Breeding, the Netherlands. Leaf tissue from each individual was ground to a
fine powder using two grinding beads in a Shatter-box and total genomic DNA was
extracted using 96 well plate automated DNA isolation machine (according to
KingFisher® 96 manual; Thermo Labsystems). In the buffer solution RNAse and
Proteinase K were added. The DNA concentration was estimated after gel
electrophoresis by comparing with known λ DNA concentration standards. The Li-
Cor AFLP Kit was used according to the recommendations of the manufacturer
(Invitrogen). 100 ng DNA was digested with restriction enzymes EcoRI and MseI and
enzyme adapters were ligated to the digested DNA. The Restriction Ligation buffer
(10mM Tris.HAc pH 7.5, 10mM MgAc, 50mM KAc, 5mM DTT, 50 ng/μl BSA) was
suitable for both enzymes. After 10x dilution of the primary template in Tris-EDTA
buffer the pre-amplification of the template was performed to generate the secondary
template DNA that can be used in selective amplification. The selective amplification
of restriction fragments was done with colour labelled primers with in total six
selective nucleotides (Table 2). After selective amplification 5 μl of the reaction
product was mixed with an equal volume formamide–loading buffer (98%
formamide, 10mM EDTA pH 8.0 and 0.1% Bromo-phenol blue). The total mixture
was carefully mixed and heated for 5 minutes at 94oC in a hot-block and then quickly
cooled on ice. From the 10 μl, 8 μl was loaded on a 6% denaturing polyacrylamide
gel 1XTBE buffer. Li-Cor 4300 S DNA analyser.

127
Table 2 Primer combinations used to screen for the highest level of polymorphisms.
EcoRI MseIPrimers +0 Primers +05'-GACTGCGTACCAATTCNNN-3' 5'-GATGAGTCCTGAGTAANNN-3'Primers +1 A-3 Primers +1 E01 A-3 M02 C-3Primers +3E31 AAA-3 M47 CAA-3E32 AAC-3 M48 CAC-3E35 ACA-3 M49 CAG-3E36 ACC-3 M50 CAT-3E37 ACG-3 M51 CCA-3E40 AGC-3 M52 CCC-3E45 ATG-3 M53 CCG-3
M54 CCT-3M55 CGA-3M56 CGC-3M57 CGG-3M58 CGT-3M59 CTA-3M60 CTC-3M61 CTG-3M62 CTT-3
Marker-Trait associations.
The software programs JoinMap® 4.1 (Van Ooijen 2011) were used to calculate
linkage between markers and MapQTL® 6 (Van Ooijen 2009) was used to determine
significant associations between markers and phenotypic traits.
To find markers related to iron and zinc content in the 30 cultivars, an uni-
variate linear regression method was used.
Results
Phenotypic data analysis
The values of the individual lines in the RIL population in cross 1 ranged for iron
from 1.7 mg/100g to 5.9 mg/100g and for zinc 2.0 mg/100g to 3.8 mg/100g while for
cross 2 the range for iron is 2.1 mg/100g to 8.2 mg/100g and for zinc 1.0 mg/100g to
8.4 mg/100g (Table 3). A significant positive correlation was found between iron and
zinc concentrations (r = 0.47) (Table 3). Frequency distribution of the pooled data for
both the traits revealed in several cases transgressive segregation both on the negative
and positive side (Table 3). Distributions in classes of the Fe and Zn content in both
crosses are shown in Figure 1 (A-D).

128
Table 3 Mean, range, standard deviation and correlation coefficients for iron and zinc in mungbean (Vigna radiata L).
Traits Recombinant inbred lines
Parents Mean* Mean Range St. Deviation Cross I- Fe 4.2 (6.0 and 2.4) 3.2 1.7 – 5.9 0.56 Cross I- Zn 2.3(2.6 and 2.0) 2.9 2.0 – 3.8 0.32 Cross II- Fe 4.3(3.9 and 4.5) 4.1 2.1 – 8.2 1.05
Cross II- Zn
2.8(3.1 and 2.5) 2.9 1.0 – 8.4 0.78
Pearson’s Correlation Coefficient** Fe Zn
Fe 1.000 0.038 0.0 0.474
* Between brackets the values of the two parents; **overall correlation between iron and zinc
(A) (B)
(C) (D) Figure 1 A. Distribution of Fe content in RIL population in cross 1; B. Distribution of Zn content in RIL population of cross 1; C. Distribution of Fe content in RIL population of cross 2; D. Distribution of Zn content in RIL population cross 2; Arrows show the parental values.
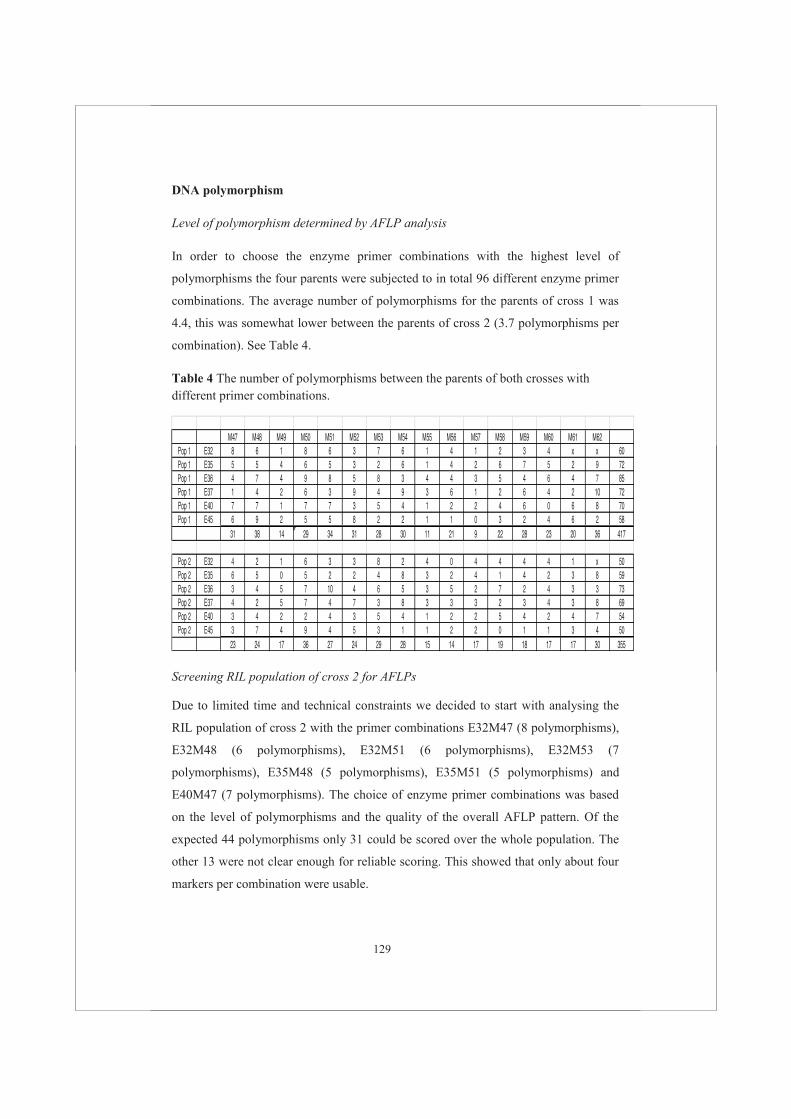
129
DNA polymorphism
Level of polymorphism determined by AFLP analysis
In order to choose the enzyme primer combinations with the highest level of
polymorphisms the four parents were subjected to in total 96 different enzyme primer
combinations. The average number of polymorphisms for the parents of cross 1 was
4.4, this was somewhat lower between the parents of cross 2 (3.7 polymorphisms per
combination). See Table 4.
Table 4 The number of polymorphisms between the parents of both crosses with different primer combinations.
M47 M48 M49 M50 M51 M52 M53 M54 M55 M56 M57 M58 M59 M60 M61 M62Pop 1 E32 8 6 1 8 6 3 7 6 1 4 1 2 3 4 x x 60Pop 1 E35 5 5 4 6 5 3 2 6 1 4 2 6 7 5 2 9 72Pop 1 E36 4 7 4 9 8 5 8 3 4 4 3 5 4 6 4 7 85Pop 1 E37 1 4 2 6 3 9 4 9 3 6 1 2 6 4 2 10 72Pop 1 E40 7 7 1 7 7 3 5 4 1 2 2 4 6 0 6 8 70Pop 1 E45 6 9 2 5 5 8 2 2 1 1 0 3 2 4 6 2 58
31 38 14 29 34 31 28 30 11 21 9 22 28 23 20 36 417
Pop 2 E32 4 2 1 6 3 3 8 2 4 0 4 4 4 4 1 x 50Pop 2 E35 6 5 0 5 2 2 4 8 3 2 4 1 4 2 3 8 59Pop 2 E36 3 4 5 7 10 4 6 5 3 5 2 7 2 4 3 3 73Pop 2 E37 4 2 5 7 4 7 3 8 3 3 3 2 3 4 3 8 69Pop 2 E40 3 4 2 2 4 3 5 4 1 2 2 5 4 2 4 7 54Pop 2 E45 3 7 4 9 4 5 3 1 1 2 2 0 1 1 3 4 50
23 24 17 36 27 24 29 28 15 14 17 19 18 17 17 30 355
Screening RIL population of cross 2 for AFLPs
Due to limited time and technical constraints we decided to start with analysing the
RIL population of cross 2 with the primer combinations E32M47 (8 polymorphisms),
E32M48 (6 polymorphisms), E32M51 (6 polymorphisms), E32M53 (7
polymorphisms), E35M48 (5 polymorphisms), E35M51 (5 polymorphisms) and
E40M47 (7 polymorphisms). The choice of enzyme primer combinations was based
on the level of polymorphisms and the quality of the overall AFLP pattern. Of the
expected 44 polymorphisms only 31 could be scored over the whole population. The
other 13 were not clear enough for reliable scoring. This showed that only about four
markers per combination were usable.

130
Mapping studies
The 31 segregating markers were used to calculate linkages between markers.
Mungbean is diploid (2n=2x=22) and has a small genome size i.e. 0.60 pg/1C (579
Mbp) (Somta and Srinives 2007). With the software package JoinMap® 4.1 (Van
Ooijen 2006) seven linkage groups were found and six unlinked markers. Most
linkage groups were small (2 markers in 2 cM, 3 markers in 3 cM, 3 markers in 17
cM, 2 markers in 16 cM and 2 markers in 10 cM) but a few were formed by more
markers (9 markers in 61 cM and 4 markers in 25 cM). The linkage groups with more
than 2 markers are depicted in Figure 2. Fourteen markers had a significant skewed
segregation, four towards parent 1 and ten towards parent 2.
E32M51-M1270.0E35M48-M1583.4E32M51-M3276.5E32M47-M2548.1
E32M47-M43916.2
E32M51-M26235.6
E32M47-M31649.6
E32M51-M20759.2
E32M51-M17563.5
LG1
E32M48-M1820.0
E32M48-M26110.7
E35M51-M7018.2
E35M51-M7324.7
LG2
E32M47-M2120.0
E32M53-M22213.5
E32M53-M10618.0
LG3
E32M48-M1630.0E32M47-M2782.0E32M48-M1403.2
LG4
Figure 2 Four Linkage Groups with more than two markers based on the RIL population of
cross 2
QTL analysis
All individual markers and the two traits were used for calculating marker-trait
associations. The software package MapQTL6 (Van Ooijen 2009) was used to
determine significant associations between markers and phenotypic traits. No
significant or putative associations were found.

131
Association mapping
The 30 cultivars (Chapter 3, Table 4)were also genotyped with nine AFLP primer
combinations (E32M51, E35M50, E35M48, E37M50, E35M59, E35M62,
E32M47,E32M48, E32M49), in total 192 AFLP markers were present in part of the
cultivars, an univariate linear regression resulted in the identification of one AFLP
marker that was linked to a higher iron content. Twelve cultivars have this marker and
eighteen not and the cultivars were divided over the phylogenetic tree. Genotypes
with the marker (E32M48 M140) have an average Fe content of 4.1 mg/100g and the
group without the marker had on average 3.4 mg/100g Fe content; this marker
explains 21% of the variance and is present in genotypes 1, 2, 4, 7, 10, 11, 17, 19, 22,
23, 24, 30 (Chapter 3, Table 5). Due to the correlation of Fe and Zn content it was not
unexpected that this marker was also associated with Zn content, and explained 28%
of the variance. Another marker (E35M50 M204) explained 24% of the variance in
Zn content.
Discussion
The main question we addressed in this chapter was: can we find DNA markers linked
to genes that have a role in mineral uptake and can cause differences in the level of
uptake. To find these markers or even the genes themselves is of utmost importance in
starting a breeding program aimed at higher levels of micronutrients (biofortification).
To start such a mapping study good mapping populations and a good DNA marker
system are needed. Recombinant Inbred Lines are in principle homozygous and make
it possible to harvest as many genetical identical seeds as needed. In other words they
are a permanent resource for testing and repeating experiments. This is particularly
useful in studying the effects of different environments (i.e. soil conditions) on the
level of Fe and Zn in leaves and seeds. We created two different RIL populations with
parents differing in a number of characteristics especially Fe and Zn concentration.
The results showed a 2-3 fold difference in concentrations between individual lines
and also some transgressive segregation was seen (values higher than the values of the
parent with the highest value). In general the results showed that also in mungbean it
is possible to breed for new cultivars with high micronutrient content. Studies in other
pulses have shown similar results (Blair et al. 2009; Cichy et al. 2009;
Khoshgoftarmanesh et al. 2010). Our results showed a positive or no correlation in
mungbean between Fe and Zn content. This makes it possible to breed for new

132
varieties high in both; similar observations have been reported in literature (Beebe et
al. 2000; Guzman-Maldonado et al. 2003). The uptake of both might be under control
of similar mechanisms (Blair et al. 2009).
To allow efficient breeding for good mungbean cultivars with high levels of
Fe and Zn it is important that the tools are available that allow this. Since over 20
years Marker Assisted Selection has been such a tool in many crops (Babu et al. 2004;
Sean May et al. 2010). Two steps are of importance: identification of marker trait
associations and later using this information in molecular breeding programs. The
molecular marker technology has been changing rapidly the last few years; due to
rapid changes in efficiency of sequence technology it is possible to find enough
polymorphisms. Regrettably, when we had to analyse our RIL populations we only
had access to the AFLP technology, a marker system that can be used in mapping
populations without prior knowledge. It turned out that only few scorable markers
could be generated by this technology in our populations and we were forced to stop
before we had gathered enough marker data to make high density linkage maps that
would make it possible to look for marker trait associations. With our limited data set
we didn’t find any marker trait associations. However, in genotyping the 30 cultivars
two markers were identified linked to genes underlying the difference in Fe and/or Zn.
Genetic studies are needed to show that these markers are linked or not.
We hope that in the near future our mapping populations will be of use in
combination with modern sequence based marker technology such as described in
Viquez Zamora et al. (2013). Highly likely genotyping by sequencing will also be an
affordable option in the near future (Elshire et al. 2011). These methods will highly
probable lead to markers linked to the genes playing a role in micronutrient levels in
mungbean. This will give mungbean a role in solving the problem of the hidden
hunger.
References
Anjum T, Gupta KS, Datta S (2010) Mapping of Mungbean Yellow Mosaic India Virus (MYMIV) and powdery mildew resistant gene in black gram [Vigna mungo(L.) Hepper]. Electronic Journal of Plant Breeding 1: 1148-1152.
Babu R, Sudha K. Nair, Prasanna BM, Gupta HS (2004) Integrating marker-assisted selection in crop breeding – Prospects and challenges. Current Science 87 (5): 607-619.

133
Beebe S, Gonzalez A, Rengifo J (2000) Research on trace minerals in the common bean. Food and Nutrition Bulletin 21:387–391.
Blair MW, Giraldo MC, Buendía HF, Tovar E, Duque MC, Beebe SE (2009) Microsatellite marker diversity in common bean (Phaseolus vulgaris L.) Theoretical and Applied Genetics 113: 100-109.
Cichy KA, Caldas GV, Snapp SS, Blair MW (2009) QTL analysis of seed iron, zinc and phosphorus levels in an Andean bean population. Crop Science 49 (5): 1742-1750.
Ding Guangda,Mei Yang, Yifan Hu, Yuan Liao, Lei Shi, Fangsen Xu, Jinling Meng
(2010) Quantitative trait loci affecting seed mineral concentrations in Brassica napus grown with contrasting phosphorus supplies. Annals of Botany 105(7): 1221–1234.
Dixit GP (2005) Project Coordinators Report. Annual Group Meet (kharif, 2005). Indian Inst. Pulses Res., Kanpur.
Elshire RJ, Glaubitz JC, Sun Q, Poland JA, Kawamoto K. (2011) A Robust, Simple Genotyping-by-Sequencing (GBS) Approach for High Diversity Species. PLoS ONE 6 (5): e19379. doi:10.1371/journal.pone.0019379.
Grusak MA, Cakmak I (2005) Methods to improve the crop delivery of minerals to humans and livestock. In: MR Broadley, PJ White (eds) Plant Nutritional Genomics. CRC Press, Boca Raton, 265–286.
Haq Zia Ul-M, Iqbal S, Ahmad S, Imran M, Niaz A, Bhanger MI (2007) Nutritional and compositional study of Desi chickpea (Cicer arietinum L.) cultivars grown in Punjab, Pakistan. Food Chemistry 105: 1357-1363.
Humphry M, Lambrides C, Chapman S, Aitken E, Imrie B, Lawn R, McIntyre C, Liu C (2005) Relationships between hard-seededness and seed weight in mungbean (Vigna radiata) assessed by QTL analysis. Plant Breeding 124: 292-298.
Islam FMA, Basford KE, Jara C, Redden RJ, Beebe SE (2002) Seed compositional and disease resistance differences among gene pools in cultivated common bean. Genetic Resource and Crop Evolution 49: 285–293.
Khoshgoftarmanesh AH, Schulin R, Chaney RL, Daneshbaksh B, Afyuni M (2010) Micronutrient efficient genotypes for crop yield and nutritional quality in sustainable agriculture. A review. Agronomy Sustainable Development 30: 83-107.
Lambrides CJ, Godwin I D (2007) School of Land and Food Sciences, Plant Improvement Group, The University of Queensland, St Lucia, QLD 4072, Australia (chapter mungbeans).
Maldonado-Salvador H Guzmán, Octavio Martínez, Jorge A. Acosta-Gallegos, Fidel Guevara-Lara, Octavio Paredes-López (2003) Putative Quantitative Trait Loci for Physical and Chemical Components of Common Bean. Crop Science 43: 1029-1035.
Sadeghipour O, Monem R, Tajali AA (2010) Production of Mungbean (Vigna radiata L.) as affected by nitrogen and phosphorus fertilizer application. Journal of Applied Science 10: 843-847.
Sean Mayes, Florian Stadler, Gracia Ribas-Vargas, Shraani Basu, Festo Massawe, Aurelie Bonin, Chiew Foan Chin, Neil Graham, Martin bRoadley, Andrzejkilian, Jeremy Roberts, John Fouikes, Sayed Azam Ali (2010) Marker-assisted breeding in

134
crops: wheat and bambara groundnut as two contrasting examples of progress. Academia.edu (http://www.academia.edu/2124771/Markerassisted_breeding_in_crops_wheat_and_bambara_groundnut_as_two_contrasting_examples_of_progress).
Sholihin, Hautea DM (2002) Molecular mapping of drought resistance in mungbean (Vigna radiata): 2: QTL linked to drought resistance. Journal of Biotechnology Pertanian 7: 55-61
Somta Prakit, Srinives Peerasak (2007) Genome Research in Mungbean [Vigna radiata (L.) Wilczek] and Blackgram [V. mungo (L.) Hepper]. Science Asia 33: 69-74 Supplement 1.
Thavarajah D, Thavarajah P, See Chai-Thiam, Vandenberg A (2010) Phytic acid and Fe and Zn concentration in lentil (Lens culinaris L.) seeds is influenced by temperature during seed filling period. Food Chemistry 122: 254-259.
Van Ooijen (2006) JoinMap ® 4, Software for the calculation of genetic linkage maps in experimental populations. Kyazma B.V., Wageningen, Netherlands.
Víquez-Zamora, Ben Vosman, Henri van de Geest, Arnaud Bovy, Richard G.F. Visser, Richard Finkers, Adriaan W. van Heusden (2013) Tomato breeding in the genomics era: Insights from a SNP array. Marcela BMC Genomics 14:354.
Welch RM, Graham RD (2004) Breeding for micronutrients in staple food crops from a human nutrition perspective. Journal of Experimental Botany 55 (396): 353-364.

135
CHAPTER 8
General Discussion and Perspectives

136
In the given framework the step to reconnect food production with food consumption
and nutrition was taken into account. In this thesis an effort was made to strengthen
the local mungbean food networks by exploring and studying mungbean production in
the north Indian region and also studying the associated mungbean production
constraints along with its germplasm diversity and micronutrient content. The specific
objectives of this thesis were:
i. Determining the major constraints, limitations and preferences of producers
(Chapter 3).
ii. Characterising the eating habits of consumers especially in the context of
mungbean and its iron, zinc and protein content (Chapter 4).
iii. Assessing the diversity in the available germplasm with emphasis on yield and
related traits along with micronutrient iron and zinc concentrations (Chapter
5).
iv. Assessing the effects of different environments on selected cultivars for their
mineral micronutrients (Chapter 6).
v. Mungbean recombinant inbred lines were developed and assessed for their
iron and zinc content. A start was made to develop tools for marker assisted
breeding (Chapter 7).
The main objective of this general discussion is to describe the major outcome
of this thesis and to reflect on it. In addition, the effect and contribution of this study
to the goals of the “Tailoring Food Sciences to Endogenous Patterns of Local Food
Supply for Future Nutrition” (TELFUN) project along with overall impact of this
project is discussed. In the end perspectives and recommendations for future research
are given.
Study area and sampling methods
The interdisciplinary Indian TELFUN team carried out a survey on the production and
consumption of mungbean in Haryana, India in local food networks. First of all a
coordinated network survey was performed in the Hisar district of Haryana state.
These regions are important mungbean producing areas in Haryana (Chapter 3, Table
1). In the Hisar district two villages (Mangali and Dhiktana) were selected on basis of
the importance of mungbean production, the presence of school feeding programmes

137
and the accessibility of the area from the university to the villages. A majority of the
farmers of this selected area produces mungbean, in a large or small scale and thus all
the actors of the mungbean food networks could be found, namely farmers,
processors, consumers and traders. Very often the actors played interchangeable roles
for example, simultaneously acting as a farmer, processor and consumer. The
presence of a school with children of 6 to 8 years was essential for the study of the
human nutritionist. The school feeding programme allowed the investigation of part
of the TELFUN programme in a controlled environment, i.e. the effect of mungbean
foods on the health of school going children. Twenty farmers (ten in each village)
actively involved in mungbean cultivation were selected after identification of the
major constraints and limitations in mungbean production during the focus group
discussions. Details about the farmers’ visits are given in Chapter 3 and 4. The main
objective of this survey was to make the team aware about the production, processing,
consumption and trade of mungbean at a small scale level.
The survey showed that farmers prefer growing mungbean mostly in marginal
areas as it is not a staple crop in this region. Also, mungbean was associated with a
severe disease problem, namely mungbean yellow mosaic virus (MYMV) infection
which results in 30-100% loss of the crop (Nene 1972). Farmers had in general poor
knowledge about the health benefits of eating mungbean. When the farmers were
invited for selection of desirable cultivars in the field, a majority of them selected
only the resistant cultivars with high yield potential. These farmer selected cultivars
were later on included in further experiments (diversity and chemical analysis).
Selected advanced cultivars were provided to the food science researcher and the
nutritionist of TELFUN team for their experiments and one best genotype for mid-day
school feeding programme. This thesis on mungbean production doesn’t include the
entire North-Indian region such as Uttar Pradesh, one of the biggest mungbean
producers in the region. Nevertheless, we believe that our findings apply to the entire
mungbean growing region because of the fundamental nature of our investigations.
Role of mungbean in alleviation of the nutritional deficiencies
According to World hunger facts 2011, two billion people are anaemic, suffering from
protein and energy malnutrition. These health problems are increasing at an alarming
rate and appropriate action is required. Micronutrient malnutrition has been addressed
through food fortification, dietary supplementation and biofortification of staple

138
crops, but to date such programs have had limited success. The major limitations
involved in such programmes are; the costs involved in research (lack of public
funds), limited or poor regulatory compliance, rural populations with limited access to
processed foods, low intakes (small serve sizes) and low bioavailability of
micronutrients. Mungbean has always been considered as a good supplier of protein
and energy amongst the vegetarian population of India. Though mungbean is a well-
known food legume particularly in South East Asia, and its nutritional value has long
been recognised, its popularity has not improved with many farmers because of the
relatively low yields that have been obtained, partly due to its susceptibility to pests
and diseases. The mineral micronutrient of several legume crops along with staple
food grains were studied by a number of researchers. Cultivars of common beans
show variability for iron concentrations ranging from 3.0 to 12.0 mg/100 g and zinc
concentrations ranging from 2.0 to 6.0 mg/100 g (Blair et al. 2009). Micronutrient
analysis was also carried out in lentils which showed iron concentrations from 7.3 to
9.0 mg/100 g and zinc concentrations ranging from 4.4 to 5.4 mg/100 g (Thavarajah
et al. 2011). Similar studies in mungbean germplasm show a range for iron content
varying from 1.6 to 9.3 mg/100g with a mean of 4.0 mg/100g and for zinc from 1.5 to
3.9 mg/100g with a mean of 2.6 mg/100g. However, recombinant inbred lines in the
present studies showed a range of iron from 1.7 – 8.2 mg/100g and zinc ranges from
1.0 to 8.4 mg/100g in individuals of both crosses. For the RIL analysis the parents
should have a maximum diversity. However, utmost care has to be taken with respect
to other characters like susceptibility to prevalent diseases, days to maturity and yield
of the parents for the success of the experiments in the field.
Different aspects of mungbean study and research
One of the benefits of studying mungbean was that unlike rice which is polished
before eating (resulting in a significant loss of nutrients), mungbean is usually
consumed without such treatments, thus conserving all its nutritional content. For any
programme aimed at supplying extra nutrients a few things must be kept in mind.
Firstly, what is the amount of food that is consumed; secondly what is the level of
micronutrient content present in the food and thirdly what is the bioavailability of the
micronutrients. In case of iron deficiency, three possible ways at different levels can
be used to solve the problem, supplementation by adding available iron supplements
to the diet, biofortification by breeding for higher levels of micronutrients and finally

139
enhancing bioavailability by reducing the presence of chelating agents in the food.
Biofortification is one of the cheapest methods for increasing the micronutrient
availability to the human population through crop breeding programmes. Success of a
breeding programme mainly depends on the genetic variation for the trait of interest
and a good method to incorporate the trait in a breeding program. These approaches
can improve the nutritional level and as a consequence also the health of the people
who consume it. Therefore, in the framework of TELFUN, mungbean germplasm was
evaluated for two main attributes i.e. yield and level of mineral micronutrients (iron
and zinc). We found appreciable variation for the micronutrient and protein levels
(Chapter 5). But in order to use mungbean in solving the problem relating to mineral
malnutrition this variation must be explored further to increase mineral content in
eatable parts (seed) of the plant. No genotype showed stability for a given trait across
different soil conditions. But a significant positive correlation between the levels of
iron and zinc was found which showed a ray of hope to further improve mungbean for
micronutrient content. A negative correlation was found between yield and protein
content however this was non-significant. On the other hand a positive correlation
was present between micronutrients and yield. Thus there is a possibility to explore
mungbean in elevating the problem of mineral micronutrient deficiency. Similar
results were also reported in other crops such as wheat, rice, maize, beans, cassava
etc. (Graham et al. 2001). A logical next step was to study the inheritance underlying
the differences in levels of iron and zinc. In this way genes with an active role in iron
absorption, translocation and accumulation are targeted and their chromosomal
locations should be as far as possible be determined. Also genes with an effect on
bioavailability should be further studied. Overall the interests of different actors in the
chain i.e. from producer to processor to consumer should be considered in order to
identify applicable solutions. And a more sustainable production of nutritious and
healthy food must be the goal, but breeding for higher trace mineral density in seeds
should not have a yield penalty. That this can be complex is exemplified by a study in
which it was shown that high levels of minerals in seeds resulted in a lower yield but
in more resistance to disease and abiotic stresses (Bouis 2003). Here the potential
yield (without biotic and abiotic stress) is lower but there is a positive effect on the
realized yield and thus no economic loss to poor farmers.

140
It was already known that variation in the content of micronutrients can be
different due to climatic conditions. Therefore a stability study was an important
aspect to appreciate the real value of the variation of iron and zinc content in
mungbean. The accumulation of micronutrients is a complex process and till date it
was not very well understood. Nutrient absorption, translocation and redistribution are
tightly controlled and many barriers do not allow plants to accumulate nutrients
beyond the limit which is toxic to plant tissues. The first barrier is the rhizosphere
which allows the root to absorb micronutrients from the soil. The presence of
micronutrients in seeds thus also depends on environmental conditions (soil and
spraying) and therefore we studied this aspect in TELFUN. A differential response of
genotypes to different environments/soils (genotype environment interactions; G X E)
makes it more problematic to identify those genotypes capable of accumulating the
highest levels of nutrients. Significant differences in grain Fe & Zn levels along with
significant G X E were observed in grains of various crops (Gregorio 2002; Oikeh et
al. 2004; Jiang Li-Na et al. 2010). The development of genotypes with a wide
adaptability has long been a universal goal for breeders. One of the objectives of the
present study was to understand the nature and magnitude of the GxE interaction
(Chapter 6) for micronutrients. Different conditions were created and the condition
named environment 6 was supplemented with single super phosphate along with iron
and zinc which favours yield and other agronomic traits was found. For iron,
environment 4 was found to be favourable as this environment was supplemented
with foliar spray of FeSO4 and with no supply of ZnSO4 which otherwise hinders iron
absorption while for zinc, environment 5 was the most favourable. This environment
was supplemented with ZnSO4 along with SSP, this helps in better zinc absorption
from the soil. The farmers should therefore be advised to apply these nutrients
through fertilizer application on the basis of soil tests.
In GxE experiments, only few cultivars show a predictable response for the
seed iron content while for zinc prediction this was not possible. The most promising
genotypes can be potentially utilized in breeding programs in which the micronutrient
and protein levels are selectable traits. Negative correlations could be broken for
economic benefits through conventional or novel breeding techniques. Besides,
nutritional advantages such cultivars can have other benefits such as a root system
with better capacity to tap subsoil water. Increase in the micronutrient content in the

141
soil or by spraying, results in higher levels in the mungbean plants and subsequently
in plant foods (seed). These results are in accordance with experiments carried out in
related crops like soybean, cowpea etc. (Soheil Kobraee et al. 2013). The survey
showed that mungbean is one of the favourite legumes consumed in the community
and therefore this was a promising crop to investigate. The micronutrient levels in the
plant are important but even more important are the way of processing of the
mungbeans and subsequently the bio-availability in different recipes. Research in
genetic modification of plants to increase the uptake of nutrients holds promising
possibilities. For long term solutions to micronutrient deficiencies, it is really
beneficial to improve the nutritional quality of grains through genetic modification
and improved agricultural practices. Transgenic approaches were used in
biofortifying staple crops like high β‐carotene ‘golden rice’ grain, high ferritin‐Fe rice
grain. Efforts were also carried out in developing transgenic improved beans, maize,
wheat and cassava. But many such transgenic crops were no success as masses were
not aware about the benefits and even if they knew there was a low public acceptance.
Developing micronutrient enriched plant foods with better yield and protein using
traditional plant breeding methods in combination with Marker Assisted Breeding will
be more acceptable to the masses. For farmer acceptance productivity must be
maintained or increased. Thus in our opinion molecular assisted breeding must take
the lead in solving the problem of mineral malnutrition and along with this, improved
agronomic practices appropriate for improved yield and quality must be followed by
farmers. For this, fertilizer application based on soil tests need to be popularised.
Molecular marker technology
Mungbean is a self-pollinating diploid plant with 2n = 2x = 22 chromosomes and a
genome size of 515 Mb/1C (Parida et al. 1990). Genomic studies in this crop are
lagging far behind other legume crops and not many markers were specifically
developed for mungbean. RFLPs from soybean and common bean were used
extensively in mungbean mapping studies (Somta and Srinives 2007). A limited
number of SSRs were developed for mungbean (Miyagi et al. 2004; Gwag et al.
2006). Sithichoke et al. (2009) used high throughput genome shotgun sequencing
techniques and identified 1,493 SSR motifs that could be used as potential molecular
markers. These markers could prove useful in germplasm analysis, assessing genetic
diversity and linkage mapping of mungbean. Further knowledge of the extent of

142
genetic diversity is useful for the utilization and preservation of genetic resources. In
case of mungbean low to moderate genetic diversity was observed (Lavanya et al.
2008; Datta et al. 2012). Fast and cost-effective assessment of genetic diversity
between genotypes can be determined using phenotypic variation and/or molecular
markers. Morphological characteristics alone are inadequate because interactions
between the genotype and environmental factors might influence the expression of the
morphological differences. In contrast to morphological characters, molecular
markers based on differences in DNA sequences are more reliable, independent of
environmental conditions and virtually unlimited in number (Agarwal et al. 2008). To
perform a genetic study in mungbean with respect to iron and zinc two Recombinant
Inbred Line (RIL) populations were made by repeated selfing and single seed descent.
An inventory of the level of amplified fragment length polymorphisms (AFLP) was
made and this turned out to be too low to obtain within the framework of the project a
medium- or even high density genetic linkage map. Recent advances in marker
technology (such as sequence based Single Nucleotide Polymorphism identification)
will very likely make it possible to use these two Recombinant Inbred Line
populations in the near future for mapping studies in order to identify marker trait
associations. For future studies efforts should also be made to make crosses in
between more diverse parents with respect to mineral micronutrients. In the present
study the variation between the parents selected was considerable for iron i.e. 2.4 - 6.0
mg/100g but for Zn the value was 2.0 - 3.0 mg/100g which was not diverse. This was
because agronomic traits were also considered in the present studies. Therefore it was
suggested that if working for mineral micronutrients more diverse and contrasting
parents have to be selected in order to find marker trait associations.
The interdisciplinary approach to improve local mungbean food networks
TELFUN was an interdisciplinary and comparative research programme designed to
investigate how production of local food crops is linked to the nutritional status of the
resource poor in order to stimulate food sovereignty. The overall objective of
TELFUN was to investigate whether food sovereignty can be achieved by taking into
account the preferences of farmers, processors and consumers and the best ways to
produce crops and process them in food products.
Food sovereignty is supposed to grow from household to community to
regional and finally to the national level. Food sovereignty (anna swaraj) is the right

143
and freedom to grow diverse (production) and nutritious food (consumers) and the
right to have access to save healthy adequate and affordable food (market).
TELFUN used collaborative and combined approaches involving four
disciplines with an overall objective of producing a nutritionally rich crop which
upgrades the nutritional status of the masses. In order to fulfil this objective an effort
was made to study and access production, processing, consumption pattern of the
locally grown and acceptable crop. The role of plant breeding research was to
contribute to selection and evaluation of the mungbean germplasm for the most
preferred agronomic traits, micronutrient levels and protein concentration. In this
thesis, the research focussed on mungbean based production and factors influencing
micronutrient levels. Participatory varietal selection (PVS) gives awareness of the
views and expectations of farmers and also reflects the knowledge of farmers.
Farmer’s knowledge was defined as the capability of a farmer to co-ordinate and
moulds a wide range of social-technical growth factors within the specific local
networks towards desired outcomes. The farmer’s knowledge involves the art of
developing agriculture within local conditions and to rebalance growth factors
towards the local conditions. A related term used for this is ‘indigenous knowledge’
(Scoones and Thompson 1994). Therefore the agronomic evaluation was carried out
according to the constraints and demands of the farmers as told in the initial stage
survey. The germplasm was assessed for variation in micronutrient content, but in
conventional breeding it is difficult to incorporate iron and zinc content as a selectable
trait. Therefore an attempt was made to find molecular markers associated to high
levels of the micronutrients. Regrettably this was not achieved in the timeframe of the
project. The cultivars with the highest concentrations were used by the food science
and nutrition researchers to develop affordable processing techniques in order to
improve the bioavailability of the micronutrients. GxE showed that mungbean
cultivars somewhat adapted to various ecological zones which can be further used in
designing future experiments and programmes. The interdisciplinary approach of this
project allowed us a better appraisal of the needs of local farmers and challenges
related to the local networks of mungbean. The inter-discipline together provides
more holistic evaluation of the case to be studied. Thus inter-discipline cohort ensures
in overall improvement of nutritional and social status of the people of selected area.

144
Our study objective was to improve the nutritional status of the resource poor-
people (farmer) using a local crop (mungbean). Our interdisciplinary project had some
strong points but also some weaknesses. One of the major strong points of this project
was to have the same goal and objectives. This keeps the whole team focused but time
limitations and limited interdisciplinary activities restricted the researchers. Time to
time all the four researchers tried to share their research experiments and information
but less inter-experimental activities didn’t allow us to plan more interdisciplinary
work together. Besides that an independent PhD project also demands a specific depth
often reducing the available time for interdisciplinary activities. Further interactions
with other disciplines were also limited because of personal workloads and time
constraints. Even then efforts were made to maximize possible interdisciplinary
interactions and exchange of knowledge. For micronutrient deficiency studies food
scientists and nutritional researchers used the selected cultivars provided by the
breeder. The main achievement of TELFUN is that it tried to identify the problem
related to mineral micronutrient deficiencies in the selected research area of the study
and also making a step to solve this problem by targeting different actors (producers,
consumers and processors) in the mungbean chain.
Future recommendations and perspectives
Yield and micronutrient stable cultivars will work
According to the view point of farmers the major trait is yield for any crop. Therefore
new traits such as higher micronutrient content should be combined with high yield to
even have a chance that farmers choose the improved cultivars. It would be optimal
that these cultivars behave optimal in different environments and climatic conditions
(trait stability across different environments). For this, cultivars should be tested over
many generations and in as many as possible environments.
Bioavailability of micronutrients
Enriching micronutrient content alone will not solve the problem of micronutrient
deficiency completely. Another important aspect must be considered and research
should also be focussed on bioavailability of these micronutrients inside the body.
Application of fertilizers in the deficient soil is also an important aspect.
Micronutrient rich varieties should be resistant to prevalent diseases especially

145
MYMV besides and be higher in yield. There are many other factors (enhancers,
promoters, inhibitors etc.) involved in the bioavailability of these micronutrients.
Therefore the nutritionist and processor can work along with the breeder to develop a
scientific chain of research and also make aware the masses about the basic
techniques to enhance the bioavailability of these micronutrients.
Interdisciplinary projects
TELFUN was designed to deliver interdisciplinary research yielding PhD theses in
different fields. But such projects need to be further examined to achieve better
productivity. There was only some level of interaction among the scientists and
disciplines. There was an active participation with the local supervisor in conducting
the field researches but there were only limited interactions between the different
disciplines of the same research group. These interactions should have been more
scheduled and more regular. Furthermore certain disciplines like breeding and food
processing were supposed to give some deliverables to the team and this
interdependence of researches limited the whole interdisciplinary approach. Moreover
this puts extra pressure on certain disciplines. Therefore interdisciplinary projects
must be designed in a manner that every discipline involved in the project should
equally contribute. If this is not the case then there is no added value of the other
disciplines and independent disciplinary researches might be more beneficial. This
might for instance already be achieved by conducting the whole programme over a
longer time period and let the different subprojects start at the most favourable
moments relative to each other.
Concluding remarks
The micronutrient content in many accessions of the mungbean germplasm was
determined for the first time. Besides this genetic diversity and GxE interaction study
with relation to the mineral micronutrients uncovered options for improvement in
mungbean. Along with these descriptive analyses an effort was made to study
molecular trait association with regard to iron and zinc in mungbean. For the first time
in mungbean any initiative in this area was taken up and thus this study may prove
helpful in designing future research related to legumes especially mungbean and
micronutrients. Also the variation with respect to micronutrients in mungbean
cultivars can be further used in future experiments and crop improvement programme.

146
Farmers were well adapted to this crop and they prefer to grow mungbean as it
is a short duration crop and very well fits in the rain fed as well as in rice-wheat based
system. However, a poor yield due to MYMV disease warrants the development of
resistant cultivars. Moreover it offers a good market price because people prefer to
have mungbean in their diet in different forms. Mungbean can act as one of the target
crops to alleviate the problem of malnutrition in the Indian Haryana region, since
wheat, rice and millets are the staple food crops and food legumes are the major
protein source for the vegetarian population. Mungbean is one of the food legumes
which are part of the diet of the population and therefore enriching mungbean with
mineral micronutrients will partly help in solving the problem. In the target area,
mungbean is an important food legume crop as it increases soil fertility and it is a
short duration crop. The short growing season makes it possible to grow mungbean as
rain fed crop in kharif season and between wheat and rice growing seasons during the
summer in irrigated areas.
References
Agarwal Milee, Shrivastava Neeta, Padh Harish (2008) Advances in molecular marker techniques and their applications in plant sciences. Plant Cell Reports 27:617–631.
Blair MW, Giraldo MC, Buendía HF, Tovar E, Duque MC, Beebe SE (2009) Microsatellite marker diversity in common bean (Phaseolus vulgaris L.). Theoretical and Applied Genetics 113: 100-109.
Bouis Howarth E, Bruce M Chassy, James O. Ochanda (2003) Genetically Modified Foods for Human Health and Nutrition. Trends in Food Science & Technology 14 (5-8): 191-209.
Datta S, Gangwar S, Kumar Shiv, Gupta S, Rai R, Kaashyap M, Singh P, Chaturvedi SK, Singh BB, Nadarajan N (2012) Genetic Diversity in Selected Indian Mungbean [Vigna radiata (L.) Wilczek] Cultivars Using RAPD Markers. American Journal of Plant Sciences 3 (8): 1085-1091.
Graham RD, Welch RM, Bouis HE (2001) Addressing micronutrient malnutrition through enhancing the nutritional quality of staple foods: principles, perspectives and knowledge gaps. Advances in Agronomy 70: 77–142.
Gregorio GB (2002) Symposium “Plant Breeding: A New Tool for Fighting Micronutrient Malnutrition” given at the Experimental Biology 2001 meeting, Orlando, Florida, on April 1, 2002. International Food Policy Research Institute, Washington, DC.
Gwag JG, Chung WK, Chung HK, Lee JH, Ma KH, Dixit A, Park YJ, Cho EG, Kim TS, Lee SH (2006) Characterization of new microsatellite markers in mung bean, Vigna radiata (L.). Molecular Ecology Notes 6:1132-1134.
Jiang Li-Na, Hao Bao-Zhen, Zhanng Dai-Jing, Shao Yun, Li Chun-Xi (2010) Genotypic and environmental differences in grain contents of Zn, Fe, Mn and Cu and how they relate to wheat yield. Chinese Journal of Eco-Agriculture 18(5): 982−987.

147
Lavanya GR, Srivastava J, Ranade SA (2008) Molecular assessment of genetic diversity in mung bean germplasm. Journal of Genetics 87: 65–74.
Miyagi M, Humphry M, Ma ZY, Lambrides CJ, Bateson M, Liu CJ (2004) Construction of bacterial artificial chromosome libraries and their application in developing PCR-based markers closely linked to a major locus conditioning bruchid resistance in mungbean (Vigna radiata L. Wilczek). Theoretical and Applied Genetics 110: 151–156.
Nene YL (1972) A survey of viral diseases of pulse crops in Uttar Pradesh, G.B. Pant University Agriculture and Technology, Pantnagar, Research Bulletin No. 4.
Oikeh S, Menkir A, Maziya-Dixon B (2004) Assessment of iron bioavailability from twenty elite late-maturing tropical maize varieties using an in vitro digestion Caco-2 cell model. Journal of the Science of Food and Agriculture 84: 1202-1206.
Parida A, Raina SN, Narayan RKJ (1990) Quantitative DNA variation between and within chromosome complements of Vigna species (Fabaceae). Genetica 82:125-133.
Scoones I, Thompson J (1994) Beyond Farmer First - Rural People's Knowledge, Agricultural Research and Extension Practice. Intermediate Technology Publications Ltd (ITP), London.
Sithichoke Tangphatsornruang, Prakit Somta, Pichahpuk Uthaipaisanwong, Juntima Chanprasert, Duangjai Sangsrakru, Worapa Seehalak, Warunee Sommanas, Somvong Tragoonrung, Peerasak Srinives (2009) Characterization of microsatellites and gene contents from genome shotgun sequences of mungbean (Vigna radiata (L.) Wilczek). BMC Plant Biology 9:137-147.
Soheil Kobraee, Ghorban NoorMohamadi, Hosein HeidariSharifAbad, Farokh DarvishKajori, Babak Delkhosh (2013) Micronutrients Distribution in Soybean Plant with Zn, Fe, and Mn Application. Annual Review & Research in Biology 3(2): 83-91.
Somta Prakit and Srinives Peerasak (2007) Genome Research in Mungbean [Vigna radiata (L.) Wilczek] and Blackgram [V. mungo (L.) Hepper]. ScienceAsia 33 (1): 69-74.
Sylvester O Oikeh, Abebe Menkir, Bussie Maziya-Dixon, Ross M Welch, Raymond P Glahn (2004) Assessment of iron bioavailability from twenty elite late maturing tropical maize varieties using an in vitro digestion/Caco-2 cell model. Journal of the Science of Food and Agriculture 84:1202–1206.
Thavarajah D, Thavarajah P, Wejesuriya A, Rutzke M, Glahn R, Combs Jr GF, Vandenberg (2011) The potential of lentil (Lens culinaris L.) as a whole food for increased selenium, iron, and zinc intake: Preliminary results from a three year study. Euphytica 180 (1): 123-128.
World Hunger Facts (2011) Why Are People Hungry? World Hunger Education. http://www.worldhunger.org/articles/Learn/world%20hunger%20facts%202002.ht

148

149
SUMMARY

150
Malnutrition in India, particularly among women, children and adolescents is an
emergency that needs immediate attention in this fast growing and developing
country. Micronutrient deficiencies are threatening public health in India more and
more. Deficiencies of micronutrients drastically affect growth, metabolism and
reproductive phase in humans as it does in plants and animals. Cereal and pulse based
Indian diets are qualitatively deficient in micronutrients such as iron, calcium, vitamin
A and zinc. This is due to a low intake of income-elastic protective foods such as
pulses, vegetables, fruits, and foods of animal origin. It is presumed that if we restore
the geographical connection between food production and consumption in local food
networks it will help in solving this nutritional problem in India. This offers new
opportunities to tailor science & technology to location specific patterns of food
production and consumption, which may lead to environmentally and socially
sustainable agriculture. Despite global pressure (including from science and
technology) to focus agricultural cultivation on a limited number of food crops, still
many so-called orphan crops like mungbean do exist and are cultivated in location-
specific crop rotation systems. Particularly, the seed legumes are of major nutritional
importance, especially in developing countries, because they have high protein
contents of good biological value. Out of the total sales of mungbean, about half of
the sales are within the village which clearly establishes the need for development of
infrastructure and facilities at the village level to serve the interests of the farm
households. Moreover, it is also necessary to shift the focus of development from the
urban market centres (largely developed) to the rural market centres. Linking
breeding, nutrition, processing and standardisation of food products, may be designed
within the experimental framework of empowering poor farmers. Hence, tailoring
plant, food and social sciences to empower local mungbean production and
consumption patterns has been designed as an interdisciplinary program of plant
breeding, food technology, human nutrition and sociology of science and technology.
Thus the ‘Tailoring Food Sciences to Endogenous Patterns of Local Food Supply for
Future Nutrition’ (TELFUN) project aimed to help people in selecting their own way
of local food production, processing and consumption of the best suited local food.
The main objective is to strengthen “The Science in Society” approach by remodeling
participatory research and development and the general aim of TELFUN was to attune

151
disciplinary research objectives within an interdisciplinary framework to enhance
food sovereignty and to improve mungbean based production and consumption patter
in selected research area (Haryana, India). As an example our research focused on
further improving one of the potential nutritional crops, namely mungbean. The
present work emphasizes on mungbean in general and especially on the available
micronutrient variation in the mungbean germplasm. The mungbean (green gram),
Vigna radiata (L.) Wilczek is native to the Indian subcontinent. They are warm
season annuals, highly branched and having trifoliate leaves like the other legumes.
Seeds of mungbean are small, ovoid in shape, and green in color. Mungbean seeds are
high in protein (21%–28%), calcium, phosphorus and certain vitamins. Moreover they
are easily digested and they replace scarce animal protein in human diets in vegetarian
populations of the world. The selected area of research centres contain a high level of
local biodiversity and are the locations for domestication of mungbean. This legume
has co-evolved with their natural ecosystems and is well-adapted to withstand the
local biotic and abiotic stresses. This will help in enabling the reconnection of the
cultivation of the mungbean with their natural environments. Moreover, as
domestication has taken place by local farmers during many centuries, they have
accumulated local endogenous knowledge, which is very relevant for local food
networks (www.telfun.info). Thus to explore the potential mungbean network, the
present thesis set its objectives. They were: i) identification of the major constraints,
limitations and preferences of producer’s with regard to mungbean, ii) assessing the
diversity in the available germplasm and assessing the effects of different
environments on selected cultivars for their mineral micronutrients and iii) to make a
start to develop tools for marker assisted breeding with regard to iron and zinc.
Initially a literature study was carried out to know as much as possible about
the selected crop (mungbean). Thus in Chapter 2, an effort was made to study the
necessity of genetic improvement of mungbean emphasizing on increasing the levels
of iron and zinc through a multi-disciplinary team approach including genetic
improvement, bioavailability and social awareness. In the review paper information
was gathered about the role of iron, zinc and protein content at different stages of life
in humans. Their role in plant and animal development was mentioned. Besides this,
the bioavailability aspect was also touched upon and thus it was found that combining

152
breeding with good processing methods and making people aware about improved
varieties available on the market further helps in improving their health status.
In Chapter 3, genetic diversity among selected cultivars of mungbean was
estimated using ISSR and analysis shows moderate genetic diversity ranging from 65
to 87 percent among the selected cultivars. From the interdisciplinary point (Chapter
4) of view a joint venture involving a survey of the selected research area was carried
out. From the breeding aspect major constraints and limitations in the mungbean
production were investigated. Field surveys revealed that disease resistance and low
yield of the mungbean cultivars were the major hindrance in its production. From the
nutritionist survey it was revealed that school going children in the selected locale
were anaemic in varying degrees. A combined effort was made to distribute the high
yielding, disease resistance and nutritionally superior cultivars to local farmers.
In Chapter 5 ninety two mungbean cultivars were selected and screened for
their agronomic performance in the research fields along with the chemical estimation
of iron and zinc content. On basis of a biodiversity analysis, the cultivars were
grouped into 5 clusters. The highest numbers of cultivars (thirty four) grouped in
cluster II, this group comprises cultivars which show early maturity and resistance to
the virus disease Mungbean Yellow Mosaic Virus. Chemical analysis showed a fair
range of micronutrient and protein variation (range for Fe = 1.6 to 9.3 mg/100g; for
Zn = 1.5 to 3.9 mg/100g and Protein = 21.1 to 30 per cent). Fe and Zn content showed
a positive correlation (r= 0.469). Heritabilities for individual traits were calculated
and for iron and zinc the values came out to be h2 = 0.259 and 0.727 respectively. The
values show that further selection for higher contents is possible as both show fair
heritability values and selection of one trait indirectly helps in selection for higher
values of the other trait. On the basis of the screening thirty cultivars were selected
and the performance and stability of iron and zinc concentrations in different
environmental conditions were estimated. As mungbean shows in general high
genotype x environment interactions, this was investigated for Fe and Zn and
described in Chapter 6. For iron content, GxE interaction was linear for eleven
cultivars and the Fe content of these cultivars could be more or less predicted across
different environments; this was for Zn content hardly the case. A soil environment
supplemented with all the nutrients i.e. single superphosphate, iron and zinc along
with the recommended dosage of fertilizers was found to have a positive effect on the

153
seed yield per plant. This shows that iron and zinc play a role in increasing the seed
yield of mungbeans.
Chapter 7 focuses on finding DNA markers to be used in marker assisted
breeding in mungbean a start was made. Contrasting parents were chosen and crosses
were made (BG39 X 2KM138 and SMH99-1 X BDYR1), after five generations of
single seed descent the RIL’s were assessed chemically for iron and zinc content. The
level of amplified fragment polymorphisms (AFLP) was determined but this level was
too low to make it feasible to generate within the framework of the TELFUN program
enough markers to make a high density linkage map. A chemical analysis of the RILs
shows as expected a positive correlation between iron and zinc content (r = 0.474).
The content of iron and zinc varied between individuals of the populations: Cross 1:
1.7 to 5.9 mg/100g (Fe), 2.0 to 3.8 mg/100g (Zn); Cross 2: 2.1 to 8.2 mg/100g (Fe),
1.0 to 8.4 mg/100g (Zn), and these values show transgressive segregation. For QTL
analysis, marker trait association was done with the limited number of markers but no
significant association between the markers and the phenotypic traits was found.
Finally, in Chapter 8, all the findings were integrated and an effort was made
to see the applicability of our results and to study the possibility in alleviating the
micronutrient deficiencies prevailing in the selected area. The breeding contribution
to the interdisciplinary approach of the TELFUN programme was discussed together
with future research possibilities.

154

155
SAMENVATTING

156
Ondervoeding is in India, vooral bij vrouwen, kinderen en adolescenten een groot
probleem. Deze ondervoeding vraagt om onmiddellijk aandacht in dit snel groeiende
en zich ontwikkelende land. Het tekort aan micronutriënten bedreigt de
volksgezondheid in India meer en meer. Deze tekorten bedreigen bij zowel mensen
als planten groei, metabolisme en het vermogen zich voort te planten. De op granen
en peulvruchten gebaseerde Indiase diëten hebben vaak te lage concentraties aan
micronutriënten zoals ijzer, calcium, vitamine A en zink. Dit komt doordat deze
diëten te weinig onderdelen, zoals peulvruchten, groenten, fruit en vlees bevatten met
hogere concentraties micronutriënten. Het idee is dat als in lokale voedselnetwerken
de geografische banden tussen voedselproductie en voedselconsumptie hersteld
worden bovengenoemd voedselprobleem opgelost zou kunnen worden. Deze aanname
creëert ook nieuwe mogelijkheden om wetenschap en technologie af te stemmen op
lokale specifieke patronen van voedselproductie en consumptie, wat kan leiden tot een
milieuvriendelijke en sociale, duurzame landbouw. Ondanks een wereldwijde druk
(mede door wetenschap en technologie) om te focussen op een landbouw met maar
een paar grote gewassen, zijn er ook nog steeds kleine gewassen zoals mungbeans die
verbouwd worden in locatie-specifieke rotatie systemen. Vooral peulvruchten hebben
een hoge voedingswaarde (o.a. eiwit) en zijn daarom belangrijk in
ontwikkelingslanden. De helft van de geproduceerde mungbeans wordt lokaal, binnen
het dorp verkocht. Dit geeft duidelijk aan dat er, in het belang van de boerengezinnen,
een behoefte is aan infrastructuur in de dorpen. Daarom is het nodig de focus te
verschuiven van stedelijke markten (met een hoog organisatieniveau) naar meer
landelijke, lokale markten. De koppeling van plantenveredeling, voeding,
voedselbereiding en het standaardiseren van voedselproducten kan een rol spelen
binnen een experimentele raamwerk dat bedoeld is om arme boeren meer
mogelijkheden te bieden. Daarom is een interdisciplinair project geformuleerd waarin
plantenveredeling, voedseltechnologie, humane voeding en sociale wetenschappen
samen werken om meer kansen te bieden aan lokale mungbean productie en
consumptie. De ‘Tailoring Food Sciences to Endogenous Patterns of Local Food
Supply for Future Nutrition’ (TELFUN) project was bedoeld om mensen te helpen de
keus te maken hoe ze lokaal het meest geschikte eten kunnen produceren, bereiden en
consumeren. Het belangrijkste doel is de aanpak “Wetenschap in de Samenleving”
te versterken door een andere benadering van participatief onderzoek en
ontwikkeling. Het algemene doel van TELFUN was om de disciplinaire

157
onderzoeksdoelen in overeenstemming te brengen met het interdisciplinaire netwerk
om op deze manier zowel voedselsoevereiniteit als mungbean productie en
consumptie te bevorderen in een geselecteerd gebied (Haryana, India). Ons onderzoek
was gericht op het veredelen van mungbean in het algemeen maar speciaal gericht op
hogere concentraties van micronutriënten.
De mungbean (ook wel green gram), Vigna radiata (L.) Wilczek heeft als
centrum van herkomst het Indiase subcontinent. Het zijn eenjarige planten die goed
kunnen groeien tijdens het warme seizoen. Mungbean is sterk vertakt en heeft kleine
zaden die eivormig en groen zijn. De zaden hebben een hoog gehalte aan eiwitten
(21%–28%), calcium, fosfor en bepaalde vitaminen. Ze worden gemakkelijk verteerd
en kunnen een vervanging zijn voor dierlijke eiwitten in het dieet van vegetariërs. Het
door ons geselecteerde onderzoeksgebied heeft veel mungbean diversiteit en ook veel
van de domesticatie van mungbean heeft hier plaats gevonden. Mungbean is
geëvolueerd met de plaatselijke ecosystemen en is goed aangepast om de lokale
biotische en abiotische stressfactoren te kunnen weerstaan. Dit maakt het mogelijk om
mungbean te verbouwen in zijn natuurlijke omgeving. Bovendien hebben lokale
boeren gedurende het eeuwenlange proces van domesticatie veel kennis over
mungbean gekregen wat erg belangrijk is voor het opzetten van lokale voedsel
netwerken (www.telfun.info). Om het potentiele mungbean netwerk verder te
onderzoeken, heeft dit proefschrift de volgende doelen gesteld. Deze waren: i)
identificeren van de belangrijkste beperkingen en voorkeuren van de producenten met
betrekking tot mungbean, ii) bepalen van de diversiteit in de aanwezige genenpool en
het bestuderen van het effect van verschillende omgevingen op geselecteerde rassen
met betrekking tot de concentratie van micronutriënten en iii) het in gang zetten van
het ontwikkelingen van methodologiën voor marker gestuurde selectie op ijzer en
zink gehalte.
Om te beginnen is een literatuuronderzoek uitgevoerd om de aanwezige kennis
over mungbean in kaart te brengen. In Hoofdstuk 2, is de noodzaak bestudeerd om
mungbean te veredelen op een hoger ijzer- en zinkgehalte. Een multidisciplinaire
aanpak, waar naast een genetisch verbeterde mungbean ook gekeken werd naar
biologische beschikbaarheid en de sociale aspecten, moet laten zien of dit kan leiden
tot hogere ijzer en zinkconcentraties in mensen. In het overzichtsartikel wordt ook de
rol beschreven van ijzer, zink en eiwitten in de verschillende levensfases van mensen.

158
Hun rol tijdens de ontwikkeling van dieren en planten wordt behandeld. Hoge
concentraties in mungbean in combinatie met verbeterde verwerkingsmethodes en een
goede biologische beschikbaarheid kunnen, als er een besef is bij de consument dat er
betere variëteiten op de markt aanwezig zijn, helpen in het verbeteren van de
gezondheid.
In Hoofdstuk 3, wordt de genetische diversiteit geschat in een selectie van
variëteitens. Dit werd bepaald op basis van de gevonden verschillen in de
amplificatiepatronen van ISSR markers, de analyse laat een genetische diversiteit zien
tussen de 65 en 87%. Vanuit het interdisciplinaire gezichtspunt (Hoofdstuk 4) is
gemeenschappelijk een enquête uitgevoerd in de gekozen regio. Voor het
veredelingsaspect werden de voornaamste verplichtingen en beperkingen onderzocht.
Dit veldonderzoek liet zien dat ziekteresistentie en lage opbrengst van mungbeans de
grootste problemen veroorzaken in de productie. De voeding studie liet zien dat onder
schoolgaande kinderen in het gebied verschillende mate van bloedarmoede
voorkwam. Gezamenlijk werden een aantal mungbean variëteiten met hoge
opbrengsten, resistentie tegen ziekte en qua voedingswaarde superieur gedistribueerd
onder boeren.
In Hoofdstuk 5 zijn 92 mungbean variëteiten geselecteerd en gescreend in de
onderzoeksvelden op hun landbouwkundige eigenschappen en tevens is hun ijzer en
zink gehalte gemeten. De biodiversiteitsanalyse verdeelde de variëteiten in vijf
groepen. De meeste variëteiten waren aanwezig in groep II, deze groep bestaat uit
vroege variëteiten met een resistentie tegen Mungbean Yellow Mosaic Virus. De
chemische analyse toonde een redelijke hoeveelheid variatie aan voor micronutriënt-
en eiwitconcentratie (Fe 1.6 – 9.3 mg/100 g; Zn 1.5 – 3.9 mg/100g en eiwit 21.1 tot
30 procent). Fe en Zn gehalte zijn positief gecorreleerd (r=0.469). De
erfelijkheidsgraden (h2) voor de individuele eigenschappen waren respectievelijk
0.259 en 0.727. De waarden laten zien dat selectie op de hoogst mogelijke waarden
mogelijk is en dat door te selecteren op een eigenschap indirect ook een selectie is op
de andere eigenschap. Gebaseerd op de screening werden 30 variëteiten geselecteerd
voor verdere studies. In Hoofdstuk 6 werden ijzer en zink concentraties en de
stabiliteit ervan bepaald onder verschillende condities. Met betrekking tot het
ijzergehalte was het bij elf variëteiten mogelijk het ijzergehalte in verschillende
omgevingen te voorspellen, voor het zinkgehalte was dit voor bijna geen variëteit het

159
geval. Een bodem met aanbevolen bemesting maar ook gesupplementeerd met
bestanddelen zoals superfosfaat, ijzer en zink had een positief effect op de
zaadopbrengst. Dit toont aan dat ijzer en zink een rol spelen in het verhogen van de
zaadopbrengst in mungbeans. In Hoofdstuk 7 wordt beschreven hoe de eerste stappen
gezet zijn om DNA merkers te vinden die gebruikt kunnen worden in merker
gestuurde veredeling. Ouders met contrasterende eigenschappen werden gekozen en
onderling gekruist (BG39 X 2KM138 en SMH99-1 X BDYR1), na vijf generaties
single seed descent zijn van de Recombinant Inteelt Lijnen (RIL) ijzer- en zinkgehalte
bepaald. Er is ook bepaald hoe gemakkelijk het is voldoende moleculaire merkers
(amplified fragment length polymorphisms, AFLPs) te vinden. Helaas bleek het
binnen het raamwerk van TELFUN onmogelijk voldoende merkerdata te genereren.
Een chemische analyse van de RILs liet de verwachte positieve correlatie tussen ijzer-
en zinkconcentratie zien (r=0.474). Het gehalte ijzer en zink varieerde tussen de
individuele lijnen van de populaties. Kruising 1: 1.7 tot 5.9 mg/100g (Fe), 2.0 tot 3.8
mg/100g (Zn); Kruising 2: 2.1 tot 8.2 mg/100g (Fe), 1.0 tot 8.4 mg/100g (Zn),
transgressieve segregatie werd gevonden. Een QTL analyse, uitgevoerd om
associaties tussen eigenschappen en merkers te vinden, leverde helaas geen resultaat
op.
Tenslotte zijn in Hoofdstuk 8 alle resultaten geïntegreerd en is de
toepasbaarheid van de resultaten besproken. Wat zijn de mogelijkheden de bestaande
micronutriëntentekorten in ons onderzoeksgebied te verminderen. De bijdrage van de
veredeling aan de multidisciplinaire aanpak van het TELFUN programma wordt
bediscussieerd samen met mogelijk toekomstig onderzoek.

160

161
llkjka'k

162
Hkkjr esa dqiks"k.k fo'ks"k :i ls efgykvksa] cPpksa] fd'kksjksa ds chp vkikrdkyhu fLFkfr
gSA ftls fodkl'khy ns'kksa esa rRdkyhu /;ku nsus dh t:jr gSA Hkkjr esa lw{e iks"kd
rRoksa dh deh vf/kd ls vf/kd lkoZtfud LokLF; dks /kedh ns jgh gSA lw{e rRoksa
dh deh euq"; dh o`f)] p;kip; vkSj iztuu dks izHkkfor djrs gSa oSlk gh izHkko
i'kqvksa vkSj isM+ksa ij gksrk gSA vukt vkSj ukMh vk/kkfjr Hkkjrh; vkgkj esa yksgk]
dSfY'k;e] foVkfeu , vkSj ftad tSls lw{e iks"kd rRoksa dh xq.kkRed deh gSA ;g
nkysa] lfCt;ka] Qy vkSj tkuoj ewy ds [kk| inkFkZ ds :i esa vk; ykspnkj
lwj{kkRed [kk| inkFkks± dh de ek=k [kkus ds dkj.k gSA ;g ekuk x;k gS fd ;fn
ge LFkkuh; [kk| uSVodZ esa [kk| mRiknu vkSj [kir ds chp HkkSxksfyd lEcU/k cgky
dj nsa rks blls Hkkjr esa iks"k.k dh leL;k dks gy djus esa enn feysxhA ;g [kk|
mRiknu vkSj [kir ds LFkku fof'k"V ds fy, [kk| foKku vkSj izk|ksfxdh ds fy, u,
volj iznku djrk gSA tksfd i;kZoj.k o lkekftd :i ls LFkk;h d̀f"k dks tUe ns
ldrh gSA [kk| Qlyksa dh lhfer la[;k ij d`f"k [ksrh /;ku dsfUnzr djus ds oSf'od
ncko ¼foKku vkSj izk|ksfxd lfgr½ ds ckotwn ewax dh rjg vHkh Hkh dbZ rFkkdfFkr
vukFk Qlysa ekStwn gSa vkSj LFkku fo'ks"k Qly pØ O;oLFkk esa [ksrh dh tkrh gSA
fo'ks"k :i ls cht] Qfy;ka fodkl'khy ns'kksa esa izeq[k iks"kd egRo ds gSa D;ksafd os
vPNk tSfod ewY; ds mPp izksVhu ;qDr gSaA ewax dh dqy fcØh esa ls vk/kh fcØh xkao
ds Hkhrj gh gksrh gS tksfd Li"V :i ls [ksr ifjokjksa ds fgrksa dh lsok djus ds fy,
xkao Lrj ij cqfu;knh <kaps vkSj lqfo/kkvksa ds fodkl dh t:jr dks LFkkfir djrk
gSA blds vykok 'kgjh cktkj dsUnzksa ¼ekSVs rkSj ij fodflr½ ls xzkeh.k cktkj dsUnzksa
ds fodkl ij /;ku dsfUnzr djus dh vko';drk gSA [kk| mRiknksa dh iztuu] iks"k.k]
izlaLdj.k vkSj ekudhdj.k tksM+us] xjhc fdlkuksa dks l'kDr cukus dh iz;ksxkRed
<kaps ds Hkhrj rS;kj fd;k tk ldrk gSA vr% LFkkuh; ewax mRiknu o [kir ds rjhdksa
ds l'kfDrdj.k ds fy, ikS/kk iztuu] [kk| izk|ksfxdh] ekuo iks"k.k vkSj foKku vkSj
izk|ksfxdh ds lekt'kkL= ds ,d vUr%fo"k; dk;ZØe ds :i esa fMtkbZu fd;k x;k
gSA [kk| foKku ekxZn'kZu&Hkfo"; iks"k.k ds fy, LFkkuh; [kk|kiwfrZ ds LFkkuh; rjhds
ifj;kstuk dk y{; yksxksa ds fy, Lo;a [kk| mRiknu] izlaLdj.k vkSj miHkksx ds fy,
loksZÙke LFkkuh; [kk| Qlyksa dk p;u djuk gSA

163
bldk eq[; mís'; vUr%fo"k; <kaps ds Hkhrj vuq'kklukRed vuqla/kku mís';ksa
ds vuwdwy Hkkxhnkjh] vuqla/kku vkSj fodkl vkSj telfun ds lkekU; mís';
remodeling }kjk lekt esa foKku n`f"Vdks.k dks etcwr djus ds fy,] [kk|
laizHkqrk dks c<+kus ds fy, p;fur vuqla/kku {ks= ¼gfj;k.kk] Hkkjr½ ewax vk/kkfjr
mRiknu vkSj [kir rjhdksa esa lq/kkj djukA
,d mnkgj.k ds :i esa gekjs vuqla/kku ewax Qly esa laHkkfor iks"k.k lq/kkj
ykus ij tksj fn;k x;k A orZeku dk;Z esa lkekU; :i ls ewax ij vkSj fo'ks"k :i ls
ewax teZIykte esa miyC/k lw{e iks"kd rRoksa dh fHkUurk ij tksj nsrh gSA ewax chu
¼gjk puk½] foXuk jsfM;kVk ¼,y½ foytSd Hkkjrh; miegk}hi ds ewy fuoklh gS aA ;g
vR;f/kd Vguhnkj vkSj vU; Qfy;ka rjg frifÙk;ka ifr;ksa okyh xeZ ekSle dh okf"kZd
Qly gSA ewax ds cht NksVs vkdkj esa v.Mkdkj] gjs jax ds gSaA ewax cht esa mPp
izksVhu dh ek=k gS ¼¼21&28 izfr'kr½] dSfY'k;e] QkLQksjl vkSj dqN foVkfeu vkfn Hkh
gSaA blds vykok ewax vklkuh ls iprk gS vkSj nqfu;k dh 'kkdkgkjh vkcknh esa ekuo
vkgkj esa nqyZHk i'kq izksVhu dh txg ys jgk gSA vuqla/kku dsUnzksa esa ls p;fur {ks= ds
LFkkuh; tSo fofo/krk dk ,d mPp Lrj gksrk gSA vkSj ewax dks ?kjsywdj.k ds LFkku jgs
;g nyguh Qly izkd`frd ikfjfLFkfrd vUrj ds lkFk feydj fodflr dh xbZ gS
vkSj LFkkuh; tSfod vkSj vtSfod ruko dks >syus ds fy, vPNh rjg ls vuqdwy gSA
blls izkd`frd okrkoj.k ds lkFk ewax dh [ksrh ds iquZlEcU/k dks l{ke djus esa enn
feysxhA blds vykok lfn;ksa ls ewax dk ?kjsywdj.k gksus ls LFkkuh; fdlkuksa us ewax
dk LFkkuh; Kku lafpr dj fy;k gSA tksfd LFkkuh; [kk| uSVodZ
¼www.telfun.info½ ds fy, cgqr izklafxd gSA bl izdkj laHkkfor ewax uSVodZ dk
irk yxkus ds fy, orZeku fFklhl vius fuEufyf[kr mís';ksa ds fy, fu/kkZfjr fd;k
x;k gS os gSa &
1- ewax Qly dks ysdj mRiknd izeq[k ck/kkvksa] lhekvksa vkSj izkFkfedrkvksa dh
igpku djukA
2- miyC/k teZIykTe esa fofo/krk dk vkdyu djus vkSj muds [kfut iks"kd vkSj
p;fur fdLeksa ij vyx&vyx okrkoj.k ds izHkko dk vkdyu

164
3- ewax esa ftad o ykSg lEcfU/kr ekdZj lgk;rk izkIr iztuu midj.k fodflr
djus ds fy,
izkjEHk esa ,d lkfgR; v/;;u p;fur Qly ewax ds ckjs esa ftruk lEHko gks
ldk irk fd;k x;kA bl izdkj vv/;k; 2 esa ,d iz;kl fd;k x;k ftlesa
vuqokaf'kd lq/kkj] tSo miyC/krk vkSj lkekftd tkx:drk lfgr cgq vuq'kkLukRed
Vhe ds n`f"Vdks.k ds ek/;e ls ykSg vkSj ftad ds Lrj dks c<+kus ij cy ds
vuqokaf'kd lq/kkj dh vko';drk dk v/;;u fd;k x;kA leh{kk isij tkudkjh esa
ekuo ds thou ds fofHkUu pj.kksa esa ykSg] ftad vkSj izksVhu dh Hkwfedk ds ckjs esa
tkudkjh bdV~Bk dh xbZA ikS/kksa vkSj tkuojksa ds fodkl esa mudh Hkwfedk dk mYys[k
fd;k x;kA blds vykok 'kjhj esa miyC/krk ¼ck;ksvosysfcfyVh½ ds igyw dks Hkh Nqvk
vkSj ;g ik;k fd izlaLdj.k fof/k;ksa ds lkFk iztuu ds la;kstu vkSj cktkj esa
miyC/k mUur fdLeksa ds ckjs esa yksxksa dks tkx:d cukus ds vkxs muds LokLF; dh
fLFkfr esa lq/kkj ykus esa enn djrk gSA
vv/;k; 3 esa ewax dh p;fur fdLeksa ds cht vkuqokaf'kd fofo/krk ISSR ¼vkb,l,lvkj½ vkSj fo'ys"k.k iz;ksx ls vuqekfur dh xbZ tksfd p;fur fdLeksa ds
chp 665&87 izfr'kr rd e/;e vkuqokaf'kd fofo/krk dk irk pyrk gSA vUr%fo"k;
fcUnw ¼¼v/;k; 4½ ls p;fur vuqla/kku {ks= ds ,d losZ{k.k dk la;qDr miØe fd;k
x;kA iztuu ds igyw ls ewax mRiknu esa izeq[k ck/kkvksa vkSj lhekvksa dh tkap dh
xbZA {ks= losZ{k.k ls irk pyk fd jksx izfrjks/k vkSj de mit ewax ds mRiknu esa
izeq[k ck/kk FksA iks"k.k losZ{k.k ls ;g irk pyk fd ,d p;fur LFkkuh; {ks= ds Ldwyh
cPpksa esa [kwu dh fHkUu fHkUu deh ikbZ xbZA LFkkuh; fdlkuksa dks vf/kd mit] jksx
izfrjks/kh] csgrj iks"k.k nsus okyh ewax dh dYVhokj ckaVus dk ,d la;qDr iz;kl fd;k
x;kA
vv/;k; 5 esa ewax dh 992 dYVhokj dk [ksrh ds fy, p;u fd;k x;k vkSj ykSg
rFkk ftad lkexzh dh jklk;fud vkdyu ds lkFk vuqla/kku ds {ks= esa muds d`f"k
izn'kZu ds fy, tkap dhA ,d tSo fofo/krk ds fo'ys"k.k ds vk/kkj ij] [ksrh dks ikap
lewgksa esa ckaVk x;kA [ksrh esa lcls vf/kd la[;k ¼pkSarhl½ dyLVj f}rh; esa oxhZd`r
fd;k gS] bl lewg esa tYnh ifjiDork vkSj ihyk ekstsd fo"kk.kq ¼YMV½ ds fy,

165
izfrjks/k fn[kkA jklk;fud fo'ys"k.k esa lw{e iks"kd rRo vkSj izksVhu fHkUurk dh ,d
mfpr lhek dk irk pyk ¼¼ykSg 1-6&9-3 feyhxzke@100 xzke ds fy, lhek] ftad ds
fy, 1-5&3-9 feyhxzke@100 xzke vkSj izksVhu 21-1&30 izfr'kr½A ykSg vkSj ftad
lkexzh us ,d ldkjkRed lglEcU/k ¼¼fu 0-469½ n'kkZ;kA O;fDrxr xq.k ds fy,
gSfjVsfcfyVh dh x.kuk dh vkSj ykSg rFkk ftad ds fy, h2 eku ¾ 0-259 vkSj 0-727
Øe'k% ik;k x;kA gSfjVsfcfyVh ds eku esa n'kkZ;k fd fu"i{k vuqokaf'kdrk ewY;ksa vkSj
,d fo'ks"krk dk p;u nksuksa ijks{k :i ls vU; fo'ks"krk ds mPp ewY;ksa ds p;u esa
enn djrk gSA vkSj mPp lkexzh ds fy, vkxs p;u lEHko gSA LØhfuax ds vk/kkj ij
30 fdLeksa dk p;u fd;k x;k vkSj fofHkUu I;kZoj.kh; fLFkfr;ksa esa ykSg o ftad dh
lkanzrk dk izn'kZu vkSj fLFkjrk dk vuqeku yxk;k x;kA
lkekU; mPp ftuksVkbZi ,oa i;kZoj.k bUVjsDlu esa irk pyk] ykSg vkSj ftad
ds fy, tkap dh xbZ tksfd vv/;k; 6 esa of.kZr gSA ykSg lkexzh ds fy, ftuksVkbZi ,oa
I;kZoj.k bUVjsDlku 11 dYVhokj ds fy, js[kh; Fkk vkSj bu fdLeksa dh ykSg lkexzh
de ;k T;knk vyx okrkoj.k esa Hkfo";ok.kh gks ldrk gSA ;g 'kk;n gh ftad lkexzh
ds fy, dgk tk ldrk FkkA ,d feV~Vh I;kZoj.k ,dy vf/kHkkLoh; ;kfu lHkh iks"kd
rRoksa ds lkFk iwjd] moZjdksa dh flQkfj'k dh [kqjkd ds lkFk ykSg vkSj ftad la;=
izfr mit ij ,d lekjkRed izHkko ik;k x;k FkkA ;g ykSg vkSj ftad ewax ds cht
dh mit c<+kus esa Hkwfedk fuHkkrs gSaA
vv/;k; 7 ewax esa ekdZj lgk;rk iztuu bLrseky djus ds fy, Mh,u, ekdZj
[kkstus ij dsfUnzr gSA fo"ke ekrk firk dks pquk x;k vkSj ,d cht oa'k dh ikap
ihf<+;ksa vkjvkbZ,y ¼¼RILs½ ds ykSg vkSj ftad lkexzh ds fy, jklk;fud ewY;kadu
fd;k x;kA o BG39 x 2KM138 vkSj SMH99-1 x BDYR1 dk ØkWl
cuk;k x;kA izof/kZr VqdM+k cgq:irkvksa ¼¼AFLP½ dk Lrj fu/kkZfjr fd;k x;k ysfdu
bl Lrj ij ,d mPp ?kuRo fyadst uD'kk cukus ds fy, TELFUN dk;ZØe dkQh
ekdZjksa ds <kaps ds Hkhrj mRiUu djus ds fy, ;g laHko cukus ds fy, cgqr de FkkA
RILs dk jklk;fud fo';ys"k.k ds :i esa ykSg vkSj ftad lkexzh ¼¼fu- ¾ -474½ ds
chp ,d ldkjkRed lEcU/k ik;k x;kA vkcknh ds O;fDr;ksa ds chp fofHkUu ykSg vkSj
ftad dh lkexzh ØkWl 11 ykSg & 1-7&5-9 feyhxzke@100 xzke ] 2-0&3-9

166
ffeyhxzke@100 xzke ¼ftad½] ØkWl 2 ykSg & 2-1&8-2 feyhxzke@100 xzke] 8-4
feyhxzke@100 xzke fftad esa mRØkeh vyxko fn[kkA QTL ds fo'ys"k.k ds fy,]
ekdZj fo'ks"krk la?k ekdZjksa dh lhfer la[;k ds lkFk fd;k x;k ysfdu ekdZjksa vkSj
izk:ih y{k.k ds chp dksbZ egRoiw.kZ lEcU/k ugha ik;k x;kA
vUr esa vv/;k; 8 esa lHkh fu"d"kks± dks ,dhd`r fd;k x;k vkSj gekjs ifj.kkeksa
dh ifj;ksftrk dks ns[kus ds fy, vkSj p;fur {ks= esa izpfyr lw{e iks"kd rRoksa dh
deh dks lekIr djus dh laHkkouk dk v/;;u djus ds fy, ,d iz;kl fd;k x;k
FkkA TELFUN dk;ZØe ds vUr%fo"k; n`f"Vdks.k esa iztuu ;ksxnku o Hkfo"; esa
vuqla/kku laHkkoukvksa dh ppkZ dh xbZA

167
ACKNOWLEDGEMENTS
On the accomplishment of the present study I would like to take this opportunity to express
my deepest sense of gratitude and words of appreciation towards those, who made this thesis
possible. During this PhD both at Wageningen UR Plant Breeding and CCS HAU, Hisar in
India, several people deserve my deepest sense of gratitude for their countless support and
guidance.
My utmost gratitude goes to my advisors in Netherlands & India especially, Dr. Sjaak
van Heusden and Dr. Ram Kumar for their kindness, support, patience and most of all,
guidance in various laboratory and field experiments. Dr. Sjaak, I am sincerely thankful for
all scientific inputs from PhD project proposal development and help in writing the PhD
thesis. I will never forget your smiling and relaxed face and also all your support and patience
over my writing skills. Dr. Ram Kumar, I sincerely appreciate your permanent availability,
your meticulous support, scientific guidance and the big fights we share which really
motivated me to work hard during my PhD study.
This is the time when I show my respect and thanks to my advisors, whose support
and guidance made my thesis work possible. Sincere thanks are extended to my supervisor
Dr. Ram C Yadav and promotor Prof. Dr. Richard Visser, for serving on my thesis, devoting
their precious time and suggestions which indeed helped improve myself during the course of
this PhD.
I wish to express my warm and sincere thanks to Dr. Neelam Khetrapaul and Dr.
Neelam R Yadav, professors at CCS HAU allowing me to join Telfun program. Both of you
are a source of inspiration and motivation for me not only during this PhD but throughout my
entire life. Thank you very much for being there. I also want to extend my gratitude to Dr. K.
S. Khokhar Vice-Chancellor, Dr. Kriplani, X-Vice-Chancellor, Dr. R.S. Dalal, X-registrar
(CCS HAU) for their kindness, and most of all, for their support throughout the course of
PhD study.
I am deeply indebted to my Telfun supervisors Prof. Dr. Tiny van Boekel, Dr. Sudesh
Jood, Dr. Rajbala Grewal, Prof. Dr. Guido Ruivenkamp, Dr. Joost Jongerden, Dr. Sushma
Kaushik, Dr. Nishi Sethi, Dr. Rob Nout, Dr. Anita Linnemann and Dr. Ben Vosman for their
guidance and friendship.
My sincere gratitude go to Dr. R P Singh, Dr. R S Malik, Dr. B P S Malik, Dr. Rajesh
Yadav, Dr. Dhanda, Dr. Behl, Dr. Ashok Chabbra, Dr. Ram Niwas, Dr. Veerendra Hooda, Dr
Mina, Dr. O P Sheoran and Dr. Jogendra Singh for being always available to help for
scientific discussions, statistical analysis and valuable advises. I want to pay my special

168
thanks to Dr. Jhorar, for without his timely help and support my thesis would not be at this
point. I want to extend my gratefulness to Dr. Majula Bandara and Dr. Vashista, for their
guidance, friendship and suggestions which indeed helped in improving myself.
I gratefully acknowledge the financial support of the Department Biotechnology,
India (DBT) and INREF, Netherlands for providing scholarship and research funds for my
PhD study. The financial and logistics supports of Wageningen UR-Plant Breeding is
gratefully acknowledged.
My sincere thanks to Fien Meijer, Petra van den Berg, Irma Straatman, Koen
Pelgrom, Annie Marchal and Arjun Negi for always being kind and helpful in and out of
laboratory related and non-related issues. It is a pleasure to convey my gratitude to all my
colleagues and friends of Telfun project especially, Dr. Yann Madode, Saurabh K Srivastava,
Dr Aparna Tiwari, Maria Vasco and Alvaro Monteros. I sincerely appreciate the friendly and
brotherly love which I got from Kwadwo Adofo. He was always there with all his blessings
and moral support.
Let me extend my special regards to my Indian friends who have been very
supportive throughout my PhD especially, Dr. Aarti Sharma, Dr. OP Chahar, Sonia Jhandai,
Dr. Poonam Sharma, Richa, Dr. Urvashi, Sonika, Basanti, Tulika and many others who are
not named here. I am also thankful to my two close friends Kanta Dahiya and Manju Bazard
who helped me in my laboratory and field experiments. I also owe my thanks to my family-
in-laws for giving support and passion. My sincere respect and gratitude to my father-in- law
Ch. Mohinder Singh Sangwan for giving me moral support whenever I needed.
Dear Brother Col. Satpal Singh, a special thanks for your valuable guidance and
suggestions which you kept on giving me whenever I needed. And this time, your help in
writing the propositions is highly appreciated. Dearest sis Shashi, today I got a platform to
express my feelings that you are not only a sweet sister but one of the strongest emotional
support to me not only during this PhD but throughout of my life. Beyond that you are a
mentor, your patience and continued encouragement throughout the PhD research were
formidable and drive to my success. It is the time when I will not forget my brother-in-law
Ch. Bijender Singh and my two sweet and naughty nephews, Aaditya and Pranav who really
bring smile on my face even in the stressed situations. Thank you very much for being there. I
also want to extend my love and appreciation to my child Koen (Ranjeev Singh) who helped
me throughout the PhD writing phase by not making me fall ill even for a single day. He
added colours to my life when I am going through the boring phase of thesis writing.
My deepest gratitude to my beloved husband Dr. Pramil Sangwan, who has been very
supportive throughout my PhD research helping me in my field experiments and writing of
PhD thesis. He is always there for me in my happy and depressed times. He sincerely
deserves my gratitude for putting up with my various moods, for making sure I was taking

169
care of myself and for simply being there for me. He never complained during this whole
tenure and always acts as a motivational force for me to complete this thesis. I want to
express my respect and deep love for my father (late) Ch. Kewal Singh Boora, for his all-time
support, love and care which I got from him. I am indebted for that and it is the time today
that I am able to fulfil his one dream. I extend my respect and gratitude to my mother Smt.
Krishna for her continued encouragements and emotional support which I need during this
course of time. Without which this PhD thesis will not be possible. It is to my beloved parents
and husband that I dedicate this work and thesis.

170
ABOUT THE AUTHOR
Curriculum Vitae
Renu Singh was born in Hisar, Haryana, India on 12th
December 1982. After completing secondary school at
Campus School in Hisar, she started the bachelors
programme from Kurukshetra University, India. During
her graduation she also actively participated in the NCC
services and honoured by the college colour and she was
selected as the best cadet. After successfully completing
her graduation she enrolled in the Master programme in
the Department of Biotechnology and Molecular Biology
at the CCS HAU, Hisar. She completed a Master’s thesis
in regeneration studies in female papaya plant (Carica
papaya L.). During her masters research she standardized
the protocol for sterilization and regeneration for papaya. She evaluated different growth
regulators on the vegetative regeneration of female papaya plant using different explants.
During her graduation and masters degrees she was awarded with the merit certificate and
scholarship respectively. In March 2006, Renu obtained her master’s degree afterwards she
got a scholarship from Department of Biotechnology, India for industrial training. She joined
Pepsi Co. Channo, Punjab as a trainee. Here, she learnt various techniques which were helpful
to her in advancement of career. After successfully completing her training in April 2007 she
started with a PhD project at Wageningen UR Plant Breeding, Wageningen University. The
PhD project was funded partly by INREF and DBT, India. During her PhD she critically
reviewed the micronutrient research status in pulse crops. She evaluated mungbean
germplasm for its major agronomic traits like disease, yield and maturity. She estimated
genetic diversity study in mungbean using AFLP and ISSR. Besides she carried out AFLP
and chemical analysis of RIL’s in order to identify markers for iron and zinc. During the
course of her PhD she successfully cleared the national eligibility test and represented her
work at national and international level. Since July 2013, she is employed as Assistant
Professor (Biotechnology) at the JCDM College, JCDV, Sirsa, India.

171
List of publications
Renu Singh, Adriaan W. van Heusden, Ram Kumar, Richard G.F. Visser and Ram C Yadav.
2013. Genetic diversity of mungbean (Vigna radiata L.) in iron and zinc content as impacted
by farmers varietal selection in northern India. Ecology of Food & Nutrition. 52: 148-162.
Renu Singh, Ram C. Yadav and Neelam R. Yadav. 2011. Effectiveness of different
Sterilization Treatments in Combating Contamination Problem in Papaya (Carica papaya L.).
Indian Horticulture Journal. 1(1):29-31.
Kanta Rani, Renu Singh and Pushpa Kharab. 2011. Effect of plant growth regulators on
Periwinkle (Catharanthus roseus L.) G. Don using leaves, hypocotyls and epicotyl as
explants. Environment & Ecology. 29 (3A):1291-1295.
Renu Singh, Pushpa Kharab and Kanta Rani. 2011. Rapid Micropropagation and Callus
Induction of Catharanthus roseus in Vitro Using Different Explants. World Journal of
Agricultural Sciences. 7 (6):699-704
Renu Singh, Ram C. Yadav and Neelam R. Yadav. 2010. Effect of growth regulators on in
vitro plant regeneration of female papaya using shoot tip as an explant. Indian Journal
Horticulture 67: 51-54.
Ram Kumar and Renu Singh. 2008. “Improvement in mungbean: present scenario and future
challenges”. National. Journal of Plant Improvement. 10 (2): 69-74.
Renu Singh, Ram C. Yadav and Neelam R. Yadav. 2009. Effect of growth regulators on in
vitro plant regeneration of female papaya using axillary bud as an explant. Journal of Applied
Horticulture. 11 (1): 50-53.
Renu Singh, Ram C. Yadav and Neelam R. Yadav. 2008. In vitro regeneration from mature
female papaya plant cv. selection 1. National Journal of Plant Improvement. 10 (1): 1-4.
Renu Singh, Adriaan W. van Heusden & Ram C Yadav. A comparative genetic diversity
analysis in mungbean (Vigna radiata L.) using ISSR & AFLP. ”. Accepted in African Journal
of Biotechnology
Renu Singh, Ram C. Yadav and Neelam R. Yadav. Effectiveness of different sterilization
treatments in combating contamination problem in papaya (Carica papaya L.). Accepted in
Research Journal of Agricultural Sciences

172
Abstracts
Renu Singh, Ram Kumar, Adriaan W. van Heusden, Richard G.F. Visser and Ram C Yadav.
2011. Breeding of mungbean for micronutrients: a solution to combat mineral malnutrition.
5th TELFUN workshop, Benin, 24th – 28th October’ 2011 Cotonou, Benin
Renu Singh, Sjaak van Heusden, Ram Kumar and R.C.Yadav. 2010. Effect of micronutrients
application on the uptake of iron and zinc in mungbean (Vigna radiata L.), paper presented at
“Legumes for global health, legume crops and products for food, feed and environmental
benefits” IFLRC V & AEP VII - April 26-30, 2010 - Antalya, TURKEY (Poster presentation)
Renu Singh, Sjaak van Heusden, R.C.Yadav and Ram Kumar. 2010. Molecular
characterization of elite genotype of mungbean (Vigna radiata L.) using AFLP. Abstract in
Indo-US bilateral workshop on plant genomics improvement with reference to biotic and
abiotic stress, 25 -27, February, 2010. (oral presentation)
Renu Singh, Ram Kumar, Adriaan W. van Heusden, Richard G.F. Visser and Ram C Yadav.
2010. Development of high iron and zinc enriched mungbean variety with other traits in
consideration. Fourth international workshop- TELFUN. 2-6, February, 2010. Accra, Ghana
(oral presentation)
Renu Singh, Ram Kumar, R.C Yadav and Sjaak van Heusden. 2009 Genetic diversity for
micronutrients (Fe & Zn) and protein content in mungbean (Vigna radiata L. Wilczek)
cultivars. Accepted at International Conference on “Current trends in biotechnology &
Implication in agriculture” 19-21, February, 2009. Modipur, Meerut - (Oral Presentation)
Renu Singh, Ram Kumar, R.C.Yadav and Sjaak van Heusden. 2009. Assessment of genetic
variation for iron and zinc among mungbean (Vigna radiata L. Wilczek) germplasm lines.
Accepted at International Conference on “ Grain legumes: Quality Improvement , Value
Addiction and Trade” 14-16, February, 2009. IIPR, Kanpur Feb. 14-16, (Poster presentation).
Renu Singh, R.C.Yadav, Ram Kumar and Sjaak van Heusden 2008 Assessment of genetic
relatedness among mungbean (Vigna radiata L.) Cultivars using RAPD and Conventional
Plant breeding methods. Abstract in NLS March 15-17. CPB, Hissar, India (Oral
Presentation)
Renu Singh, Ram Kumar and Sjaak van Heusden. 2007. Evaluation of farmer’s knowledge
and the differences in the level of Zn and Fe content in mungbean (Vigna radiata L.).
Abstract in NLS Nov.3-5. IIPR, Kanpur India (Poster Presentation).

173
Education Certificate
Education Statement of the Graduate School: Production Ecology and Resource Conservation Issued to: Renu Singh Date: 30 May 2013 Group: Plant Breeding, Wageningen University
Courses Year
1. Start-up phase Writing of project proposal
o Development of iron and zinc enriched mungbean (Vigna radiata L.) cultivar with agronomic traits in consideration
Review of literature o Genetic improvement of mungbean (Vigna radiata L): necessity to increase the
levels of the micronutrients iron and zinc: a review
2007
2007
Subtotal Start-up Phase 10.5 credits*
2. Scientific Exposure
International symposia, workshops and conferences o National conference; oral presentation; Hisar, India o International conference; Kanpur, India o International conference; oral presentation; Meerut, India o International conference; Hisar, India o International conference; Antalya, Turkey
Discussion groups / local seminars / other scientific meetings o Excursion to the Zeeuwse Vlegel in Zeeland: an example of sovereign wheat
production; integrated and environmental friendly production of wheat processes locally to supply local bakeries that produce bread and pastries locally appreciated: history, activities and challenges; TEL, Zeeland, the Netherlands
o Lecture by Dr. Niel Koning and Wilhelmina Quaye (MSc): food sovereignty: origins, meaning and relation with other dicourses
o Lecture by Prof. Dr. Han Wiskerke: technologies for suitable food networks do locality matter?
TELFUN Research Group: yearly meeting of one week Laboratory training and working visits
o Selection of the mungbean cultivar against MYMV having high nutritional status (Zn and Fe); CCS HAU
o Molecular marker techniques on mungbean cultivar; CCS HAU
2008 2009 2009 2009 2010
2008
2008
2008
2007-2010
2007
2008 Subtotal Scientific Exposure 14.6 credits*
3. In-Depth Studies o Multivariate analysis; PE&RC, WUR o Statistics for life science; WUR
Deficiency, refresh, brush-up courses o Basic of plant breeding; Department of Plant Breeding, COA, CCS HAU
2008 2007
2010

174
Subtotal In-Depth Studies 6.0 credits * 4. Personal Development Skill training courses
o Introduction to EndNote; WUR o EndNote advance; WUR o Technique for writing and presenting scientific paper; WUR o Presentation skills; WUR
Organisation of PhD students day/week o PE&RC PhD Weekend, o PE&RC PhD Day
2007 2007 2007 2008
2008 2011
Subtotal Personal Development 5.2 credits*
TOTAL NUMBER OF CREDIT POINTS* 36.3 Herewith the Graduate School declares that the PhD candidate has complied with the educational requirements set by the Educational Committee of PE&RC which comprises of a minimum total of 32 credits. *A credit represents a normative study load of 28 hours of study.

175
Cover design and layout: by Renu Singh
Front and back cover picture represents disease resistant, early maturing, dwarf mungbean cultivar.