Development of Inclusive Markets in Agriculture and Trade ... · DEVELOPMENT OF INCLUSIVE MARKETS...
56
Development of Inclusive Markets in Agriculture and Trade (DIMAT) Value Chain Analysis (VCA) of the Coffee Sub-sector in Uganda
Transcript of Development of Inclusive Markets in Agriculture and Trade ... · DEVELOPMENT OF INCLUSIVE MARKETS...
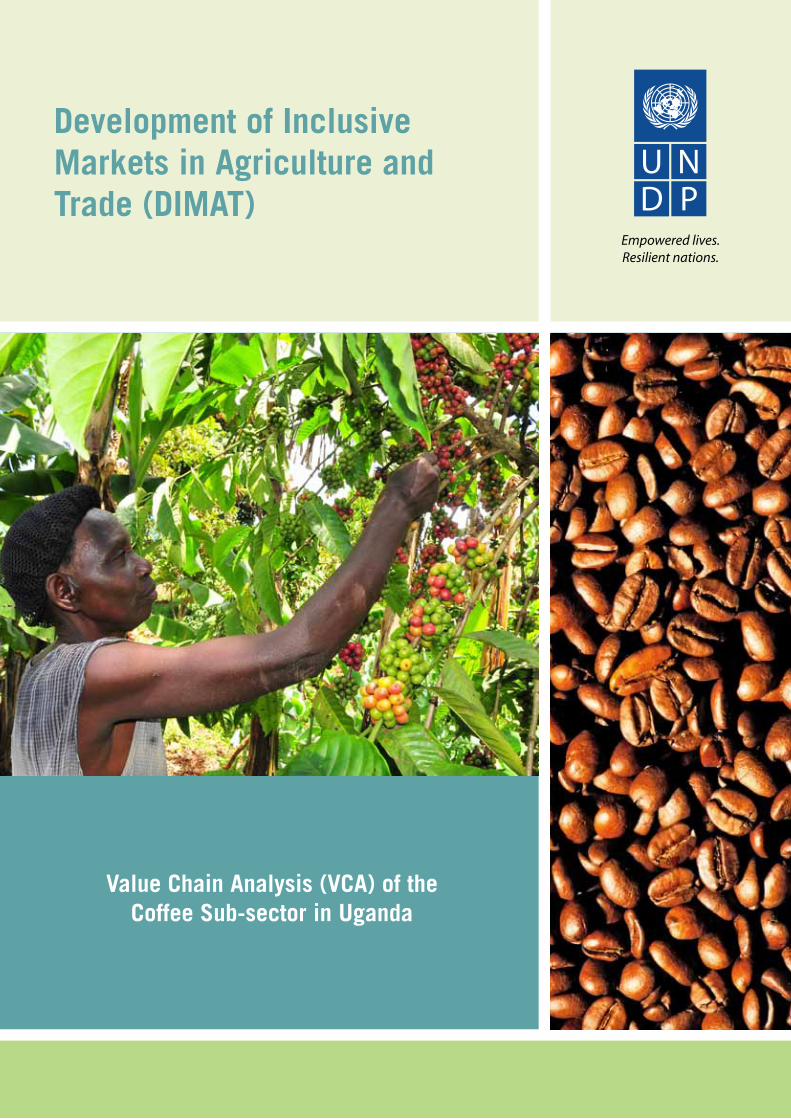
Development of Inclusive Markets in Agriculture and Trade (DIMAT)
Value Chain Analysis (VCA) of the Coffee Sub-sector in Uganda

“Given the importance of coffee in Uganda,
it is necessary to understand the
situation of the coffee sub-sector in the
country in terms of production, marketing
and consumption”

The Market and Nature of Coffee Value Chains in Uganda
Development of Inclusive Markets in Agriculture and Trade (DIMAT) Project
December, 2012
About DIMATDevelopment of Inclusive Markets in Agriculture and Trade (DIMAT) in Uganda is a project supported by the United Nations Development Program (UNDP) and the Government of Uganda (GoU). Enterprise Uganda (EUg) is the implementing partner while Kilimo Trust (KT) and Private Sector Development Companies (PSDCs) are the Responsible Parties (RPs) for the project. The aim of the project is to contribute to Programme 2 of the Uganda’s Agriculture Development Strategy Investment Plan (DSIP) – in relation to enhancing “Market Access and Value Addition”. The project is focuses on building strong business linkages and inclusive business approaches to link small and medium scale producers and enterprises to profitable markets at national, regional and global levels.
About this ReportThe value chain study was conducted between July and December, 2012. The report was developed using both secondary literature and primary data gathered from various coffee growing and trading districts of Uganda. The report provides a background of the DIMAT project, the purpose of the VCA, the methodology applied, the status of the sector and the value chain characteristics of demand and supply, the characteristics of the coffee value chain actors, processes, services, relationships and key partners. It also highlights the constraints the actors face and the opportunities available within the value chain. It then presents conclusions and recommendations of strategic interventions for the project, regarding entry points to the coffee value chain in Uganda.
AcknowledgementAvailability of data and information related to agriculture is a huge problem in Uganda. Therefore the authors would like to thank all the organizations, private companies and individuals who provided data and information that went into developing this report.
All photography is used with permission from Food And Agriculture Organisation, Matthias Mugisha and Shutterstock Images.
DisclaimerThe views and conclusions contained in this report are entirely those of the authors and do not necessarily reflect the policy and views of UNDP, GoU or Kilimo Trust.

DEVELOPMENT OF INCLUSIVE MARKETS IN AGRICULTURE AND TRADE (DIMAT) i
Coffee, is the second largest valued commodity in international trade, and the most widely traded tropical agricultural commodity after petroleum. Trade in coffee is dominated by Latin America and Caribbean countries which
account for about 57% of world exports while African countries account for about 14%, mainly of the Robusta type. In Uganda, which is the 2nd largest exporter of coffee in Africa, coffee is an important cash crop that supports over 3.5 million families at all levels of the value chain especially for income security and contributes to between 20 - 30% of foreign exchange earnings.
Given the importance of coffee in Uganda, this study was carried out to disentangle the micro, meso and macro level factors influencing the coffee value chain in Uganda so as to guide the development of a detailed project design, if coffee is selected as a key commodity for intervention by the DIMAT Project, as well as any interventions targeting the sector.
Over the last 5 years, coffee production has decreased by about 5% while land under cultivation has increased by 23%. This decrease in coffee productivity is attributed to a combination of factors such as pests and diseases, unpredictable weather conditions, volatile market prices and poor agricultural practices especially with regard to use of improved planting materials. The acreage under coffee production ranges from 0.1ha to 12 ha per household with an average of 0.5 ha. Robusta is the major grown variety.
Inputs used for coffee production include land, labour, seed, herbicides, pesticides and fertilizers. For instance, seedlings from research and development organisations are supplied to UCDA that multiplies them and later supplies them to private agro-input dealers, local coffee nurseries, NAADS and District Farmers’ Organizations. Other inputs are supplied by farmers or their family members and/or NGOs.
Regarding production and processing, farmers on average harvest 0.5Kg of coffee per tree, compared to the research station yield of 2 – 3kg per tree per season. This is due to minimal application of Good Agricultural Practices (GAP). About 40% of farmers sell hulled coffee beans instead of the un-hulled kiboko coffee because of the slightly higher price. A few producer organisations/co-operative unions have their own hullers and are able to integrate production and hulling, while the majority of producers outsource the hulling service.
Arabica Coffee is usually wet processed, while most Robusta coffee is dry processed. In addition to primary processing at farm level, there are about 26 independent wet processors in Uganda. The processed coffee is then transported to exporters or export grading factories for secondary processing which transforms the clean coffee into the various coffee grades that meet the international standards.
Nearly all the produced coffee is sold at the farm-gate with key marketing outlets being cooperative unions, village collectors, brokers/agents, exporters and coffee processors. Local traders (popularly known as middlemen and/or assemblers) purchase from individual farmers and farmer groups. Most of these traders sell to other big traders in major trading towns. However, traders often fail to get the required quantities and quality of coffee. For example, in 2011, traders fell short by 22% of the amount of coffee they had planned to trade. Almost all coffee trading activities in Uganda end in Kampala as over 95% of the coffee traded within the country goes to the export market through Kampala. Consumption of coffee in Uganda is generally low with an estimated per capita consumption of 0.25Kg/Yr. Although the local markets are under developed, per capita consumption has increased slightly over the past few years.
EXECUTIVE SUMMARY

DEVELOPMENT OF INCLUSIVE MARKETS IN AGRICULTURE AND TRADE (DIMAT)ii
VALUE CHAIN ANALYSIS (VCA) OF THE COFFEE SUb-SECTOR IN UGANDA
Men and women are employed in the various stages of the value chain although some activities such as weeding are carried out mainly by women while land preparation, pruning and marketing are dominated by men. There is minimum youth involvement in the coffee value chain largely due to inadequate access to productive assets especially land and start-up capital and a general negative attitude towards agricultural activities in perennial commodities, which are perceived as slow income generating crops.
Although coffee farmers fetch a high value share of the final retail price compared to other actors in the chain, the margins are low (125 UGX/Kg of red cherries sold) compared to traders and exporters, who, although they have a much lower value share of the retail price, deal in big volumes of coffee throughout the year. Coffee retailers (coffee shops that serve the beverage) receive a gross added value of 199,000UGX/Kg of ground coffee. These figures may not be directly comparable since farmers deal in red cherries, while retailers deal in ground coffee and the conversion ratio of red cherries to ground coffee has not been accounted for, neither have all the costs incurred in producing a cup of coffee been fully factored. However, this is an indication of the degree of increase in value when commodities are transformed through processing.
Coffee value chain is largely controlled by co-operative unions. These unions have managed to establish strong institutional linkages from input supply to exporting. Producer organizations and individual producers have horizontal relationships with the co-operative unions where they deliver their coffee beans. In addition, since some of the unions are also involved in primary processing, the strong linkages are often extended to the wet and hull processors of the raw dry coffee beans. Vertical linkages can be seen in the form of channels where coffee is delivered up the chain by middlemen, other than co-operative unions.
The weak linkages in the coffee value chain are mostly in the by-products sub-value chain. The most common coffee by-product is the husk that comes from the hulled coffee. This product is normally used as a warmer in poultry sheds, source of heating in cement manufacturing companies and as mulch in banana plantations but, the suppliers and buyers have not established long term relationships. Coffee value chain actors are also receiving different support services along the chain in the form of finance (mainly loans and savings), extension, inputs and market information. The leading agricultural financial service providers are small and medium financial institutions although there is a significant percentage of traders providing these services inform of pre-finance to suppliers. Large commercial banks are lagging behind in financing agriculture in general.
The coffee value chain is also supported by several policies including: Agriculture Sector Development Strategy and Investment Plan (DSIP), Uganda coffee plan, Uganda National Coffee Regulations Statute1994 and the draft National Coffee Strategy. The sub-sector has also attracted support from various development partners, although more support is needed in the structuring of the chain, enforcing quality, developing storage facilities, combating the coffee wilt disease, and organizing marketing by producer enterprises.
It is very important to note that the majority of farmers accused traders of contributing largely to the poor quality of traded coffee. This is because the traders are known for buying all grades of coffee at the same low price, whether it is moulded, premature or discoloured. This is a disincentive to the producers for there is no premium price for quality. Even though the coffee sold by the traders is subjected to grading at the exporter level, the price at this level is good enough and compensates for the rejected beans for up to 55% of rejected beans.Therefore, since the trader role is central to the value chain, all interventions must integrate the traders in taking a major role in quality assurance.
The study recommends that, interventions in the coffee value chain should aim to improve, replicate or upscale value chain models that can integrate large number of producers. In the short term, this can be achieved by directly linking them to off-takers that have strong linkages with big international importers and/or growing specialty markets for green coffee. There is also need to enhance initiatives for increasing coffee consumption at national and regional levels, with the aim of penetrating the market of established brands of value-added coffee products produced in Uganda. In the medium term, the study proposes strengthening multi-actor platforms for advocacy. It also recommends driving the agenda of inclusive development and growth in the sector through key areas of sustainable coffee production and increasing productivity. In the long term, the study proposes a strategy to re-orient the overall long term performance of the sub-sector towards greater competitiveness among other global players. At the same time, this strategy will aim at increasing the long term demand and consumption of locally developed and produced value-added coffee products that target the changing tastes and demographics of the national and regional population

DEVELOPMENT OF INCLUSIVE MARKETS IN AGRICULTURE AND TRADE (DIMAT) iii
1 INTRODUCTION 1
1.1 Situation Analysis 1
1.1.1 Coffee Production, Marketing and Consumption 1
1.1.2 Objectives of the Study 1
2 METHODOLOGY 3
2.1 Value Chain and SWOT Analyses 3
2.2 Data Needs and Sources 3
2.3 Sampling and Data Collection 4
2.4 Data analysis 5
3 RESULTS AND DISCUSSIONS 7
3.1 Coffee Production and Supply in Uganda 7
3.2 Coffee Marketing and Consumption in Uganda 7
3.3 Coffee Exports and Imports in Uganda 9
3.4 Functional Analysis of Coffee Value Chain 10
3.4.1 Mapping of Coffee Value Chain in Uganda 10
3.4.2 Identification of technical functions of Coffee value chain actors 12
3.4.3 Quantification of Physical flows in the Coffee value chain 14
3.4.4 Employment in the Coffee Value Chain 16
3.5 Financia Analysis of Coffee Value Chain 17
3.5.1 Estimation of shares of value 17
3.6 Linkage of Coffee Value Chain with Meso and Macro-level Institutions 19
3.6.1 Horizontal and Vertical Linkages of Micro-level Coffee Value Chain actors 19
3.6.2 Linkages between Micro-level Coffee Value Chain Actors and Service Providers 20
3.6.3 Willingness of actors to Participate in Formal Business Linkages 23
3.7 Macro Level - Coffee Value Chain Supporting Policies and Institutions 25
3.7.1 Interventions by Macro-level Coffee Value Chain Actors 25
4 CONCLUSIONS 31
4.1 Lessons from Coffee Situation and Value Chain Analysis 31
4.2 SWOT Analysis 31
4.2.1 Strengths 31
4.2.2 Weaknesses 32
4.2.3 Opportunities 32
4.2.4 Threats 32
5 RECOMMENDATIONS 33
5.1 Preliminary Outlines of Potential Interventions 33
5.1.1 Proposed Short Term Interventions 33
5.1.2 Proposed Medium Term Interventions 33
5.1.3 Proposed Long Term Intervention 33
REFERENCES 37
APPENDIX 1: DETAILED LIST OF CONSTRAINTS AND OPPORTUNITIES AS IDENTIFIED bY STAKEHOLDERS INTERVIEWED 38
APPENDIX 2: RECOMMENDATIONS AND SUGGESTED INTERVENTIONS MADE bY STAKEHOLDERS 40
APPENDIX 3: PRODUCER ENTERPRISES WILLING TO ENTER INTO CONTRACTUAL AGREEMENTS 42
APPENDIX 4: INVENTORY OF EXPORTERS AND bUYERS OF UGANDA’S COFFEE 43
TAbLE OF CONTENTS

DEVELOPMENT OF INCLUSIVE MARKETS IN AGRICULTURE AND TRADE (DIMAT)iv
ACP Africa CaribCoffee Pacific
AgGDP Agricultural Gross Domestic Product
AGRA Alliance for a Green Revolution in Africa
ASERECA Association for Strengthening Agricultural Research in Eastern and Central Africa
ATAAS Agriculture Technology and Agribusiness Advisory Services
BCtA Business Call to Action
BDS Business Development Service
BMO Business Membership Organizations
CIAT International Centre for Tropical Agriculture
COMESA Common Market for Eastern and Southern Africa
CSO Civil Society Organization
CORI Coffee Research Institute
DANIDA Danish International Development Agency
DIMAT Development of Inclusive Markets for Agriculture and Trade
DRC Democratic Republic of Congo
DSIP Development Strategy Investment Plan
EAC East African Community
FAO Food and Agriculture Organization
FDI Foreign Direct Investment
FG Producers Group
FY Financial Year
GDP Gross Domestic Product
GoU Government of Uganda
Ha Hectare
IDO International Development Organization
IFAD International Fund for Agricultural Development
IFFPRI International Food Policy Research Institute
ITC International Trade Centre
JICA Japan International Cooperation Agency
KRC Kabarole Research and Resource Centre
KT Kilimo Trust
LEAD Livelihoods and Enterprises for Agricultural Development
MAAIF Ministry of Agriculture, Animal Industry and Fisheries
MDI Microfinance Deposit-taking Institution
MEPE Mini-estates and Processing Enterprises
MSME Micro, Small and Medium Enterprise
MT Metric Tons
NAADS National Agricultural Advisory Development Services
NAP National Agricultural Policy
NARO National Agricultural Research Organization
NGO Non-Governmental Organization
PABRA Pan-Africa Coffee Research Alliance
LIST OF ACRONYMS & AbbREVIATIONS

DEVELOPMENT OF INCLUSIVE MARKETS IN AGRICULTURE AND TRADE (DIMAT) v
VALUE CHAIN ANALYSIS (VCA) OF THE COFFEE SUb-SECTOR IN UGANDA
PMA Plan for the Modernization of Agriculture
RIC-NET Rwenzori InformationCentre Network
R&D Research and Development
SACCO Savings and Credit Cooperative Society
SMS Short Message Service
SSA Sub-Saharan Africa
SWOT Strengths, Weakness, Opportunities, and Threats
UBOS Uganda National Bureau of Statistics
UEPB Uganda Export Promotion Board
UGX Uganda Shillings
UIA Uganda Investment Authority
UNADA Uganda National Agro-Input Dealers Association
UNBS Uganda National Bureau of Standards
UNDP United Nations Development Programme
UNFFE Uganda National Farmers Federation
USAID United States Agency for International Development
USDA United States Department of Agriculture
VCA Value Chain Analysis
VSLA Village Savings and Loan Association
WFP World Food Programme
WRS Warehouse Receipt Systems


DEVELOPMENT OF INCLUSIVE MARKETS IN AGRICULTURE AND TRADE (DIMAT) 1
1.1 Situation AnalysisThis subsection gives a preview of coffee production, marketing and consumption globally and in Africa. The aim is to provide the reader with basic information on the supply and demand of coffee and build a case for a value chain mapping and analysis in Uganda.
1.1.1 Coffee Production, Marketing and ConsumptionNearly 8.3 million MT of coffee were produced in year 2011/12 globally from over 50 countries in the world (USDA, 2012). This production is projected to increase by 7.5% in the year 2012/13. The projected increase is attributed to increased production in Brazil and Vietnam which will account for half of the expected global increase as a result of the biennial production cycles. Leading countries in the production of coffee are: Brazil, Vietnam, Indonesia, Colombia and Ethiopia.
Coffee is the second largest valued commodity in international trade and the most widely traded tropical agricultural commodity after petroleum. The trade is dominated by Latin America and Caribbean countries that account for about 57% of world exports while African countries account for about 14% mainly of the Robusta type. Brazil alone accounted for 24% of the total export, Vietnam 15% and Colombia 6% in 2011 (ITC, 2012). Other leading exporters include Germany and Indonesia. The major markets for coffee and their market share in 2011 were; USA (20%), Germany (16%), Italy (7%), Japan (6%) and France (5%). In Africa, Algeria is the leading coffee importer (1%) (ITC, 2012).
In Africa, coffee is mainly produced in Ethiopia, Uganda, Ivory Coast, Madagascar, Angola, Cameroon, DRC, Sierra Leone, Kenya, Zimbabwe and Zambia. The leading producer in Africa, Ethiopia produced 378,000 MT in 2011/12 almost twice that of ganda (ICO, 2012). In these countries, coffee is considered as a major commodity that supports majority of rural households.
It is estimated that the Coffee production in Uganda for the year 2011 was 199,800 MT (3.3 million 60kg bags) (ICO, 2012; GAIN, 2010).It is an important cash crop that supports over 3.5 million families at all levels of the value chain contributing to income security. It also contributes between 20 - 30% of the foreign exchange earnings (UCDA, 2012). Producers sell about 99% of the coffee they produce compared to 98% reported in 1999/00 (PMA, 2008).
1.1.2 Objectives of the Study The situation analysis has demonstrated the importance of coffee both as an income security crop and as a commodity that can be used to enhance the economy of Uganda. Given its importance, understanding the coffee value chain in Uganda with an aim of upgrading it is paramount. Such an understanding would be with respect to production, marketing and consumption. It would also be important to have information on the players in the value chain, as well as identify the constraints and opportunities for the different players. Understanding the policies and institutional frameworks guiding the operations of the coffee sub-sector is also important for they determine the smooth operation and competitiveness of the chain. It is against this background that this study was carried out to aid in understanding the value chain. Using the value chain and the SWOT analyses approaches, the study was carried out in key coffee producing and and trading districts of Uganda. .
7. The specific objectives of this study were to:
• Compile and assess baseline information with respect to the coffee sub-sector.
• Undertake a coffee value chain analysis with the aim of mapping the main characteristics of the value chain.
• Identify and examine constraints and opportunities within the coffee value chain.
• Identify the underlying policies, institutional and infrastructural issues that affect competitiveness of the chain.
• Identify any bilateral partners, NGOs, facilitating organizations and private sector players within the value chain and their specific regions of operations.
• Identify the potential for upgrading the coffee value chain.
1. INTRODUCTION


DEVELOPMENT OF INCLUSIVE MARKETS IN AGRICULTURE AND TRADE (DIMAT) 3
2.1 Value Chain and SWOT AnalysesThis study employed the value chain analysis and SWOT analysis approaches to achieve its objectives. The value chain approach is an accounting framework which uses both the functional and economic analysis (at market prices) of an identified value chain (FAO, 2005). The functional analysis was used to define the actors (agents) in the value chain while the financial analysis was used to analyze the financial returns for the different value chain actors.
In the functional analysis, different agents in the chain and the roles they play in the chain were identified. The functional analysis involved: a) identification and quantification of the physical flows along the chain, b) identification of the technical functions of the players, and c) identification of the agents.
The financial analysis of the value chain is a data intensive approach which involves identification of the inputs used in a particular activity in a value chain as well as the resulting output(s) and attaching monitory value to them. The aim of financial analysis was to determine whether: a) every agent was generating a surplus, b) the surplus was adequate to ensure sustainability of the agents’ activities, c) the surplus was a sufficient, acceptable return on investment, d) the value chain was profitable, e) there were winners and losers in the chain, and f) the prices between agents correctly reflected production costs.
The internal and external situation analysis produced large amount of information, while the SWOT analysis served as an interpretative filter to reduce the information to a manageable quantity of key issues. The SWOT analysis classified the internal aspects as strengths or weaknesses and the external situational factors as opportunities or threats. Strengths served as a foundation for building a competitive advantage by value chain actors, whilst weaknesses as those that hinder it. By understanding these four aspects of the coffee value chain, actors can better leverage their strengths, correct their weaknesses, capitalize on golden opportunities and mitigate potentially threats.
2.2 Data Needs and SourcesThe key sources of data for this study were primary and secondary level data. The main sources of secondary data that were specific to coffee included surveys from Civil Society Organizations (CSOs), Uganda Coffee Development Authority (UCDA), Food and Agriculture Organization (FAO), International Coffee Organisation (ICO), COMESA, International Trade Centre reports, Uganda Bureau of Statistics, MAAIF, Business Membership Organizations (BMOs), development agencies and past value chain analysis (VCA) studies.
More specifically, the following information on the coffee sub-sector in Uganda was assembled from secondary data: a) global, regional and national structure of demand for raw and processed coffee, b) production and trade volumes and trends in the past 10 years, c) inputs and products’ prices and trends in the past 5 years, d) key drivers of demand of coffee products globally, regionally and nationally and how these affect market shares of key industry players, e) data on the relationship between commodity sector contributions and broader macroeconomic indicators (GDP, inflation, employment, foreign earnings and tax revenues); e) potential public and private sector players (including market leaders) that may influence coffee of trade, f) underlying policies, institutional and infrastructural issues that affect the competitiveness of the coffee value chain, and g)the current and planned investments and priorities of government and development agencies in the sector.
The following primary data specific to coffee sub-sector were collected:
a) Costs, production, sales volumes, values and margins.
b) Types of facilities and services offered, loan were available for the sector as well as the terms and conditions for access and levels of lending to arable farming, processing and marketing. These were collected from finance institutions.
c) Support services to coffee value chain, trade volumes, storage facilities, constraints and opportunities. These data were collected from traders and trader associations. Some of these traders were lead firms/market off-takers and their data further included demanded volumes from suppliers, volume projections, pricing mechanisms, willingness to enter into contractual arrangements with other actors and operators along the value chain and conditions for these contractual agreements.
2. METHODOLOGY
DEVELOPMENT OF INCLUSIVE MARKETS IN AGRICULTURE AND TRADE (DIMAT)4
VALUE CHAIN ANALYSIS (VCA) OF THE COFFEE SUb-SECTOR IN UGANDA
d) Value chain support institutions like market information providers, input suppliers, technology providers also provided data on nature of services they provide, their target recipients, the constraints they face and any unexplored opportunities.
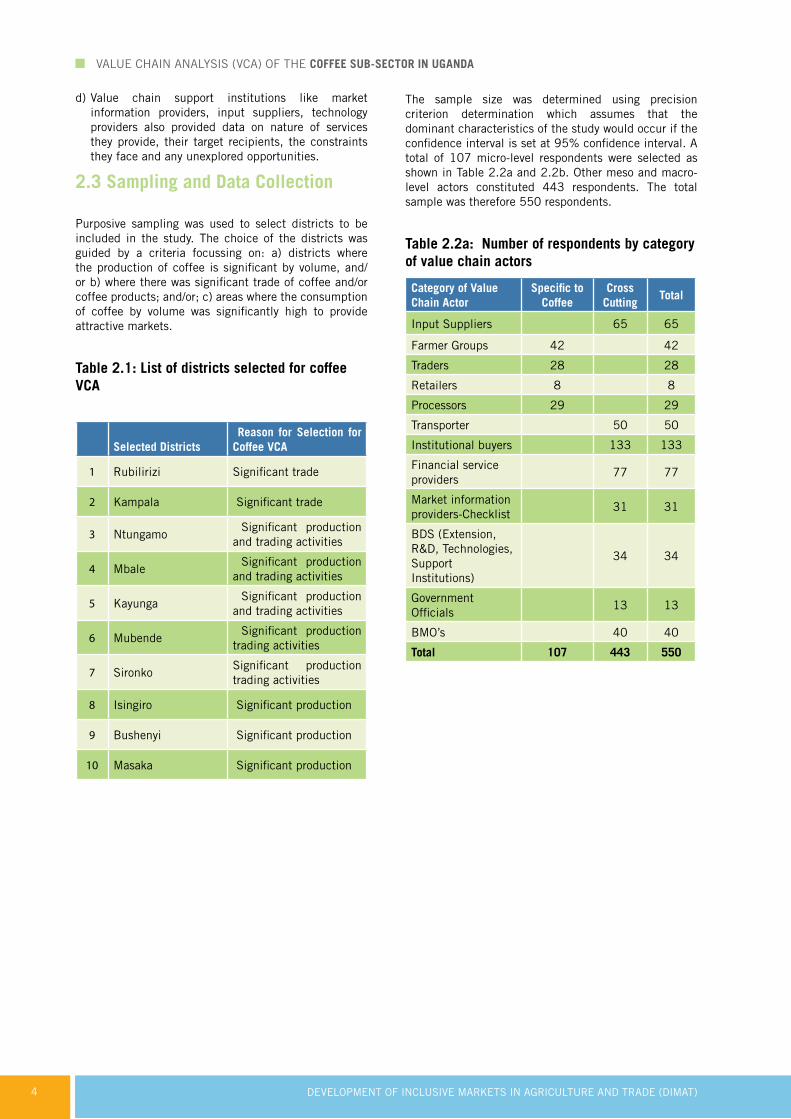
2.3 Sampling and Data Collection
Purposive sampling was used to select districts to be included in the study. The choice of the districts was guided by a criteria focussing on: a) districts where the production of coffee is significant by volume, and/or b) where there was significant trade of coffee and/or coffee products; and/or; c) areas where the consumption of coffee by volume was significantly high to provide attractive markets.
Table 2.1: List of districts selected for coffee VCA
Selected Districts Reason for Selection for Coffee VCA
1 Rubilirizi Significant trade
2 Kampala Significant trade
3 Ntungamo Significant production and trading activities
4 Mbale Significant production and trading activities
5 Kayunga Significant production and trading activities
6 Mubende Significant production trading activities
7 SironkoSignificant production trading activities
8 Isingiro Significant production
9 Bushenyi Significant production
10 Masaka Significant production
The sample size was determined using precision criterion determination which assumes that the dominant characteristics of the study would occur if the confidence interval is set at 95% confidence interval. A total of 107 micro-level respondents were selected as shown in Table 2.2a and 2.2b. Other meso and macro-level actors constituted 443 respondents. The total sample was therefore 550 respondents.
Table 2.2a: Number of respondents by category of value chain actors
Category of Value Chain Actor
Specific to Coffee
Cross Cutting
Total
Input Suppliers 65 65
Farmer Groups 42 42
Traders 28 28
Retailers 8 8
Processors 29 29
Transporter 50 50
Institutional buyers 133 133
Financial service providers
77 77
Market information providers-Checklist
31 31
BDS (Extension, R&D, Technologies, Support Institutions)
34 34
Government Officials
13 13
BMO’s 40 40
Total 107 443 550
DEVELOPMENT OF INCLUSIVE MARKETS IN AGRICULTURE AND TRADE (DIMAT) 5
VALUE CHAIN ANALYSIS (VCA) OF THE COFFEE SUb-SECTOR IN UGANDA
“No one can understand the truth until he drinks of coffee’s frothy goodness.” - Sheik Abd-al-Kadir
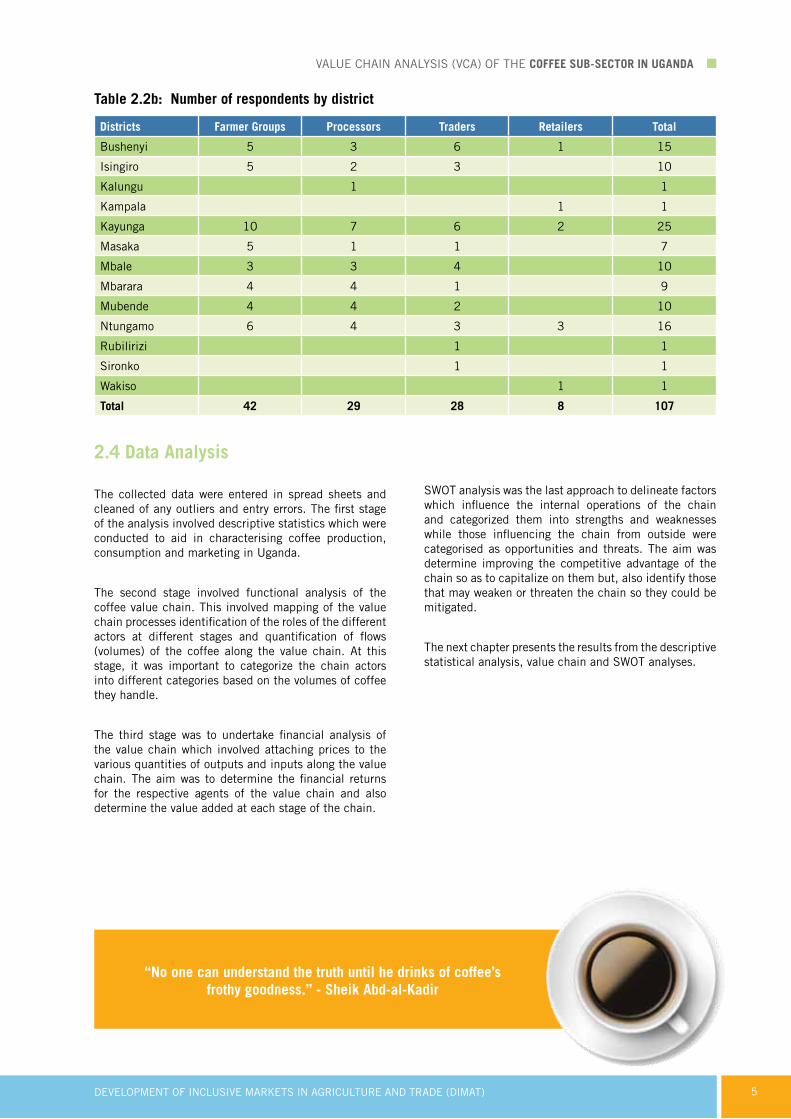
Table 2.2b: Number of respondents by district
Districts Farmer Groups Processors Traders Retailers Total
Bushenyi 5 3 6 1 15
Isingiro 5 2 3 10
Kalungu 1 1
Kampala 1 1
Kayunga 10 7 6 2 25
Masaka 5 1 1 7
Mbale 3 3 4 10
Mbarara 4 4 1 9
Mubende 4 4 2 10
Ntungamo 6 4 3 3 16
Rubilirizi 1 1
Sironko 1 1
Wakiso 1 1
Total 42 29 28 8 107
2.4 Data Analysis
The collected data were entered in spread sheets and cleaned of any outliers and entry errors. The first stage of the analysis involved descriptive statistics which were conducted to aid in characterising coffee production, consumption and marketing in Uganda.
The second stage involved functional analysis of the coffee value chain. This involved mapping of the value chain processes identification of the roles of the different actors at different stages and quantification of flows (volumes) of the coffee along the value chain. At this stage, it was important to categorize the chain actors into different categories based on the volumes of coffee they handle.
The third stage was to undertake financial analysis of the value chain which involved attaching prices to the various quantities of outputs and inputs along the value chain. The aim was to determine the financial returns for the respective agents of the value chain and also determine the value added at each stage of the chain.
SWOT analysis was the last approach to delineate factors which influence the internal operations of the chain and categorized them into strengths and weaknesses while those influencing the chain from outside were categorised as opportunities and threats. The aim was determine improving the competitive advantage of the chain so as to capitalize on them but, also identify those that may weaken or threaten the chain so they could be mitigated.
The next chapter presents the results from the descriptive statistical analysis, value chain and SWOT analyses.


DEVELOPMENT OF INCLUSIVE MARKETS IN AGRICULTURE AND TRADE (DIMAT) 7
3.1 Coffee Production and Supply in Uganda
Production of coffee in Uganda has been increasing rapidly (Figure 3.1). Though coffee production is on an increasing trend, over the last 5 years, the volume produced has decreased by about 5% by volume while land under cultivation has increased by 23% (USDA, 2012; FAOSTAT, 2012). The decrease in coffee productivity, despite the increase in production, is attributed to factors such as pests and diseases, unpredictable weather conditions, volatile market prices, low yielding varieties and loss of Uganda’s global market share (World Bank, 2011). For instance, Robusta coffee has been largely destroyed by coffee wilt disease affecting over 50% of both young and old Robusta coffee trees since 1993 (World Bank, 2011).
Among the farmer groups interviewed, the acreage under coffee production ranged from 0.1 ha to 12 ha per household with an average of 0.5 ha. Eighty percent (80%) of the coffee grown in Uganda is Robusta.
Figure 3.1: Coffee production and Area harvested in Uganda, Source: USDA, 2012
2007/08 2008/09 2009/10 2010/11 2011/12
Year
2206 2007 2008 2009 2010
Year
209 196
172193
200
179
157
123
154162
3039
4939 38
220
285
345320
270
Prod
ucti
on V
olum
e (’0
00 M
T)
Are
a ha
rves
ted
('000
Ha)
Total Robusta Arabica Area Harvested (’000 Ha)
Figure 3.1 (a): Trends of co�ee production in Uganda 2007/08 - 2011/12 (USDA, 2012)
Figure 3.1 (b): Trends in area harvested under co�ee production, 2006 - 2010 (FAOSTAT, 2012)
3. RESULTS AND DISCUSSIONS
Robusta coffee is grown in the low altitude areas of Central, Eastern, Western and South Eastern Uganda of about 1,200 meters above sea level. Arabica coffee on the other hand is grown in the highland areas on the slopes of Mt. Elgon in the East and Mt. Rwenzori and Mt. Muhavuura in the South Western region, with Kapchorwa, Mbale and Nebbi districts being the major districts where Arabica is grown.
3.2 Coffee Marketing and Consumption in Uganda
Coffee trade in Uganda involves local traders (popularly known as middlemen and/or assemblers) who purchase from individual farmers and farmer groups. The coffee is then sold to medium and large scale traders and exporters. The price of coffee and coffee products is set through competitive market forces (as mentioned by 52% of traders) while the buyer determines the price in other instances.

DEVELOPMENT OF INCLUSIVE MARKETS IN AGRICULTURE AND TRADE (DIMAT)8
VALUE CHAIN ANALYSIS (VCA) OF THE COFFEE SUb-SECTOR IN UGANDA
Figure 3.2: Source of coffee by Traders
Regarding the supply of coffee, traders often fail to get the required quantity and quality of coffee. For example, in 2011, they fell short by 22% of the amount of coffee they had planned to trade in (Figure 3.3a) with the most frequently stated reasons being unreliable supply from farmers and fellow traders, and low harvested volumes. Other reasons for the supply gap include limited working capital and high volume losses due to poor quality supply.
Fig 3.3a: Expected and Actual Supply Figure 3.3b: Causes of supply deficit
Category of supplier
18 18
Perc
enta
ge
of tr
ader
s
Reasons for de�cit
66
57
9
90
70
20
7650
25
138
4
Volu
me
(MT)
Perce
ntag
e of r
epon
dent
s
DEVELOPMENT OF INCLUSIVE MARKETS IN AGRICULTURE AND TRADE (DIMAT) 9
VALUE CHAIN ANALYSIS (VCA) OF THE COFFEE SUb-SECTOR IN UGANDA
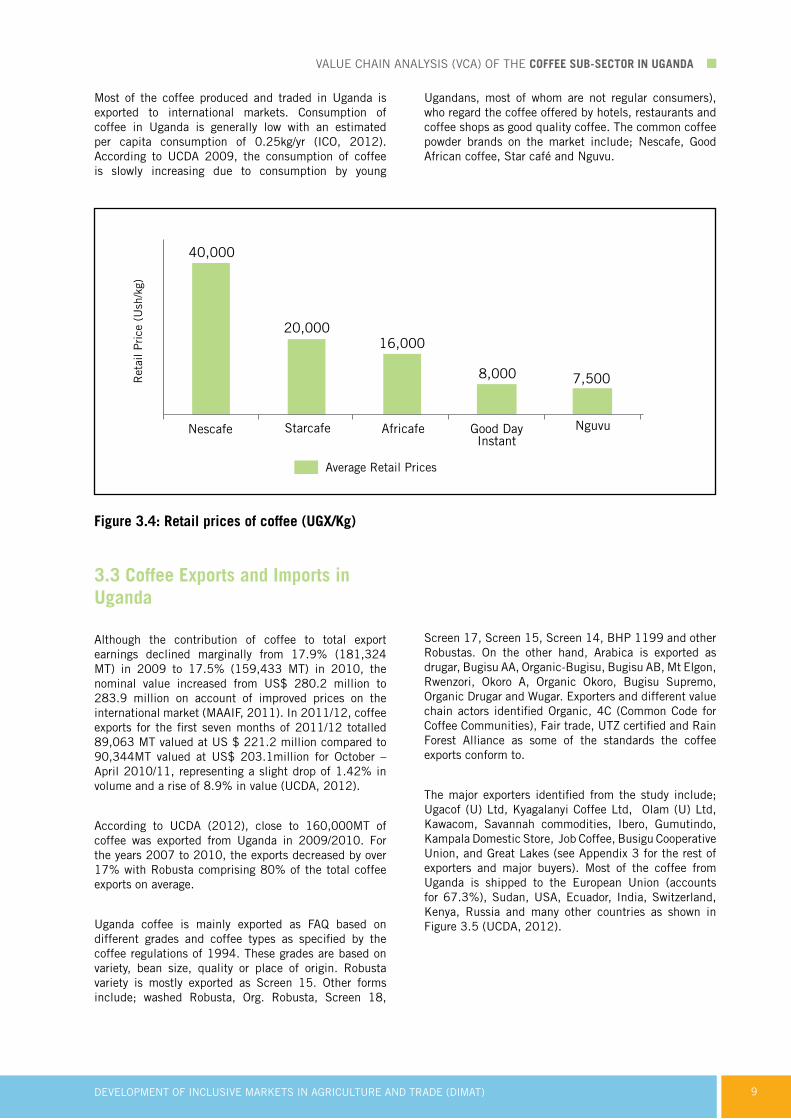
Most of the coffee produced and traded in Uganda is exported to international markets. Consumption of coffee in Uganda is generally low with an estimated per capita consumption of 0.25kg/yr (ICO, 2012). According to UCDA 2009, the consumption of coffee is slowly increasing due to consumption by young
Ugandans, most of whom are not regular consumers), who regard the coffee offered by hotels, restaurants and coffee shops as good quality coffee. The common coffee powder brands on the market include; Nescafe, Good African coffee, Star café and Nguvu.
Figure 3.4: Retail prices of coffee (UGX/Kg)
3.3 Coffee Exports and Imports in Uganda
Although the contribution of coffee to total export earnings declined marginally from 17.9% (181,324 MT) in 2009 to 17.5% (159,433 MT) in 2010, the nominal value increased from US$ 280.2 million to 283.9 million on account of improved prices on the international market (MAAIF, 2011). In 2011/12, coffee exports for the first seven months of 2011/12 totalled 89,063 MT valued at US $ 221.2 million compared to 90,344MT valued at US$ 203.1million for October – April 2010/11, representing a slight drop of 1.42% in volume and a rise of 8.9% in value (UCDA, 2012).
According to UCDA (2012), close to 160,000MT of coffee was exported from Uganda in 2009/2010. For the years 2007 to 2010, the exports decreased by over 17% with Robusta comprising 80% of the total coffee exports on average.
Uganda coffee is mainly exported as FAQ based on different grades and coffee types as specified by the coffee regulations of 1994. These grades are based on variety, bean size, quality or place of origin. Robusta variety is mostly exported as Screen 15. Other forms include; washed Robusta, Org. Robusta, Screen 18,
Screen 17, Screen 15, Screen 14, BHP 1199 and other Robustas. On the other hand, Arabica is exported as drugar, Bugisu AA, Organic-Bugisu, Bugisu AB, Mt Elgon, Rwenzori, Okoro A, Organic Okoro, Bugisu Supremo, Organic Drugar and Wugar. Exporters and different value chain actors identified Organic, 4C (Common Code for Coffee Communities), Fair trade, UTZ certified and Rain Forest Alliance as some of the standards the coffee exports conform to.
The major exporters identified from the study include; Ugacof (U) Ltd, Kyagalanyi Coffee Ltd, Olam (U) Ltd, Kawacom, Savannah commodities, Ibero, Gumutindo, Kampala Domestic Store, Job Coffee, Busigu Cooperative Union, and Great Lakes (see Appendix 3 for the rest of exporters and major buyers). Most of the coffee from Uganda is shipped to the European Union (accounts for 67.3%), Sudan, USA, Ecuador, India, Switzerland, Kenya, Russia and many other countries as shown in Figure 3.5 (UCDA, 2012).

DEVELOPMENT OF INCLUSIVE MARKETS IN AGRICULTURE AND TRADE (DIMAT)10
VALUE CHAIN ANALYSIS (VCA) OF THE COFFEE SUb-SECTOR IN UGANDA
Figure 3.5: Coffee export volumes and main destinations
Regarding imports, coffee imports to Uganda are negligible with no recorded formal data published to explain the demand and characteristics of these imports. Though not formally recorded, Uganda imports Arabica coffee from DRC, Rwanda and Burundi, and most of this is eventually re-exported.
3.4 Functional Analysis of Coffee Value Chain
3.4.1 Mapping of Coffee Value Chain in Uganda
The first step of the functional analysis is mapping of the actors in the coffee value chain. Figures 3.6 show the key interrelated and structured processes that enable coffee as a finished product reach the final consumer.
151162
67
20
3 2 2 15
Importing Country
Figure 3.5 (a): Uganda’s coffee export volumes - trends (UCDA, 2011)
Figure 3.5 (b): Main destinations of Uganda’s coffee exports in July 2012 (UCDA, 2012)
Volu
me
(’000
MT)
“Coffee should be black as hell, strong as death and as sweet as love.
~- Turkish proverb

DEVELOPMENT OF INCLUSIVE MARKETS IN AGRICULTURE AND TRADE (DIMAT) 11
VALUE CHAIN ANALYSIS (VCA) OF THE COFFEE SUb-SECTOR IN UGANDA
Figure 3.6: Coffee value chain core processes map

DEVELOPMENT OF INCLUSIVE MARKETS IN AGRICULTURE AND TRADE (DIMAT)12
VALUE CHAIN ANALYSIS (VCA) OF THE COFFEE SUb-SECTOR IN UGANDA
3.4.2 Identification of technical functions of Coffee value chain actors
Figure 3.7 Technical functions of actors
The different stages of the coffee value chain in Uganda, the function at each stage, the agents playing the different roles and the outputs at the different stages of the chain were identified and mapped (Figures 3.6 and 3.7). The value chain actors comprise of input providers, producers, assemblers, processors and traders, who sell to consumers.
Input suppliers: The sources of inputs for coffee production include: research and development institutions, which supply seedlings to UCDA that in turn multiplies them and supplies them to private agro-input dealers, local coffee nurseries, ACEs, NAADS and District Farmers’ Organizations. The coffee seedlings usually supplied by local nurseries are Robusta clonal cuttings and Robusta clonal elite.
Other inputs are supplied either by the private sector or NGOs. Private sector service providers are organized under the umbrella organization, Uganda National Agro-Input Dealers Association (UNADA), which has a total of about 2,200 members spread across the country. NGOs that supply seedlings are particularly common in northern and eastern Uganda. The major buyers of coffee seedlings are individual farmers who account for 53% of the buyers. Other buyers of seedlings are: farmer groups (23%), institutions (12%) and NAADS (12%).
For more efficient and profitable operations, input
suppliers reported that they had particular information needs like understanding the size, location and requirements of the market for inputs and the coffee beans, as well as more understanding of good agricultural practices for coffee production.
The study noted that most input suppliers are located in Kampala and other up-country towns. They mostly supply farm implements, coffee seedlings, fertilizers and pesticides for use in the coffee farms. They also provide after sale services such as training on product usage and offer some extension services to the coffee producers.
Producers: Mostly coffee is produced by smallholders who have an average of 0.4 ha and harvest about 0.5kg/tree. Approximately 80% of these farmers grow the traditional Robusta coffee, which requires less inputs compared to improved Robusta varieties like clonal elite and clonal cuttings. It should be noted that some farmers still get their seedlings from own bushes and own gardens.
The main inputs in coffee production are land, labour, seed, herbicides, pesticides and fertilizers. Most of the labour used in coffee farms are manual especially at harvest time when the coffee berries are picked by hand.
Among the activities and functions undertaken by the technologies collectively, marketing was the most dominant, followed by access to inputs, production,

DEVELOPMENT OF INCLUSIVE MARKETS IN AGRICULTURE AND TRADE (DIMAT) 13
VALUE CHAIN ANALYSIS (VCA) OF THE COFFEE SUb-SECTOR IN UGANDA
access to capacity building trainings, access to credit, primary processing of coffee (milling/wet processing), storage and social support to group members.
Producers usually undertake wet processing by outsourcing the services of hullers. Some producer organisations/co-operative unions have their own hullers and are able to integrate production and hulling. The producer organisations and/or cooperatives are also involved in bulking of coffee to facilitate collective marketing.
Nearly all the produced coffee is sold at farm gate since it is a major source of income for 1.32 million smallholder households (MAAIF, 2010). At the farm-level, several marketing outlets were identified. These are: selling coffee to cooperative unions, village collectors, brokers/agents, exporters and coffee processors. Most farmers sell coffee within their districts and neighbouring districts. Virtually all harvested coffee is sold (99%) and majority of interviewed farmer groups (52%) sell their coffee in semi-processed form commonly referred to as Fair Average Quality (FAQ) while 48% of the farmer groups sell it in raw form, commonly referred to as “kiboko”. For example, in Mubende, farmer business entities sell FAQ directly to the exporters after hulling thus eliminating middlemen. Farmer groups and cooperatives not only sell their coffee within the major producing and trading districts in the country but also to export markets such as the European Union, Sudan, Switzerland and USA (UCDA, 2011). Examples of such cooperatives include Gumutindo, Bugisu cooperative and ACPCU.
Rural traders/brokers or company agents: They provide the brokerage function between farmers, coffee exporting companies and processors/ traders thus termed as the middle men of the value chain and are a vital source of information to actors on either side of the chain. They often advise the big traders, processors or exporting companies on when sufficient stocks have been bulked in order to arrange for transportation.
They are based at the villages and purchase coffee cherries or Kiboko on behalf of the green coffee traders. Another set of traders/brokers is usually stationed at the hullers, waiting to buy farmers’ milled coffee. Brokers are usually paid on commission, which ranges from 20 UGX/Kg to 50 UGX/Kg. These rural traders also buy coffee cherries, dry them before taking them to the hullers from whom they out-source the hulling services. They also buy dried coffee cherries from farmers and then sell to exporters (35%) and other big traders (13%). The exporting companies then sell directly to export markets.
Traders were noted as the biggest drivers of poor quality, as reported by the majority of coffee farmers and some experts in a validation workshop for this report. This is because they are mainly driven by volumes, and not quality. They often buy premature coffee beans, poorly dried cherries, and have poor storage facilities, which
further deteriorate the quality of the beans. When the coffee beans are received by the big exporters, who have grading facilities, over 50% of the beans are rejected on account of poor quality. The farmers, especially members of ACEs, said that the traders do not pay much attention to the quality because the price they receive for the beans almost doubles the farm-gate price, and the profits they make are still very attractive and compensate for the rejected coffee beans. This practice has also been reported to encourage stealing and selling of raw coffee beans from farmers’ gardens, as well as low attention to quality by a number of farmers, due to lack of incentives for production of good quality coffee, making the farmer the biggest loser in the value chain.
On the other hand, the farmers involved in production of sustainable coffee seem to have better incentives for producing better quality coffee due to the different incentives in place e.g. free washing facilities, collection centres, training in good agricultural practices, premium prices for premium quality in some instances, fair trade benefits and bonuses at the end of the year. All these have driven production of better quality coffee, although despite the high investment by processors in this production of premium quality, about 30% of the harvested coffee is still side sold to other traders and processors, who have not invested in the incentive system.
Processors: Coffee is either dry or wet processed. According to World Bank, 2011, there are about 26 independent wet processors in Uganda. Wet processing involves cherry separation, pulping and washing. The mucilage layer is removed by bio-chemical enzyme activity through controlled fermentation to give ‘fully washed’ coffee. It can also be removed mechanically using a mechanical mucilage remover. Some producers are wet processing at farm level thus, presenting an opportunity for increased vertical integration and better prices for the farmers.
Dry processing involves drying and hulling which results in clean dry coffee beans referred to as FAQ (Fair Average Quality). According to World Bank, 2011, there are about 369 hullers in Uganda. Coffee processing equipment owned by processors include hullers, mixers and sieving machines. The average installed capacity for these machines is 28MT/day. However, the processors are currently able to process 11MT/day of coffee representing 39% capacity utilization. The main causes of such low utilization are power disruption and low coffee supply.
Coffee (Kiboko or cherries) is processed to FAQ, parchment or by products such as BHP or husks used as manure and a source of heating energy for other industries. The FAQ coffee is then transported to exporters or export grading factories for secondary processing. Secondary processing, also known as export grading transforms the clean coffee (FAQ) into the various coffee grades that meet the international standards. The process involves

DEVELOPMENT OF INCLUSIVE MARKETS IN AGRICULTURE AND TRADE (DIMAT)14
VALUE CHAIN ANALYSIS (VCA) OF THE COFFEE SUb-SECTOR IN UGANDA
cleaning FAQ, drying the coffee if wet (moisture content over 13 %) and then size grading using perforated screens to the desired size. The sorted beans are then gravimetrically sorted to have uniform specific density before bagging off and loading into containers for transportation to major export markets through the port of Mombasa. This is done by export grading factories (UCA, 2012). There are about 19 of them in Uganda (World Bank, 2011).
Traders (bulk buyers, wholesalers, retailers): A total of 28 coffee traders were interviewed from 10 districts. They included rural traders/village collectors, big town traders or export companies. They purchase most of the coffee directly from farmers. They are mostly based in the districts of production, urban areas like Kampala or in upcountry towns. Small-scale traders operate from farm to farm, or from town to town, with larger traders purchasing from these small traders and processing the coffee either at private mills (for a fee) or at mills they own. It is estimated that there are approximately 6,000 middlemen/traders, ranging from very small to medium-sized, operating in the supply chain (World Bank 2011).
The coffee traders sell 74% of their coffee to exporters, 35% to big traders and 13% to local processors or roasters. Exporters are the “pull” in the coffee value chain since almost all the coffee produced in Uganda ends in the export market. Retailers in the coffee value chain include retail outlets distributing coffee: coffee shops, supermarkets, open markets, grocery shops, cafes, hotels and restaurants. Identified local roasters include Star café, Good African coffee, Wangolo processors, Gayaza coffee roasters and packers Ltd, Kakinzi farm and general works, Dimo Investment company, Zigoti coffee works Ltd, and Nguvu. Cafes, hotels and restaurants serve ready-to-drink coffee.
Exporters: There are about 42 registered coffee exporting companies in Uganda which are subsidiaries of large coffee multinational companies such as Abaco International, Olam International, Bernard Rothfros and Eco Agro-industrialists. Some of the major exporting companies include; UGACOF, Kawacom, Kyagalanyi, Savannah, Gumutindo, Busigu cooperative union, Great Lakes and Ibero.
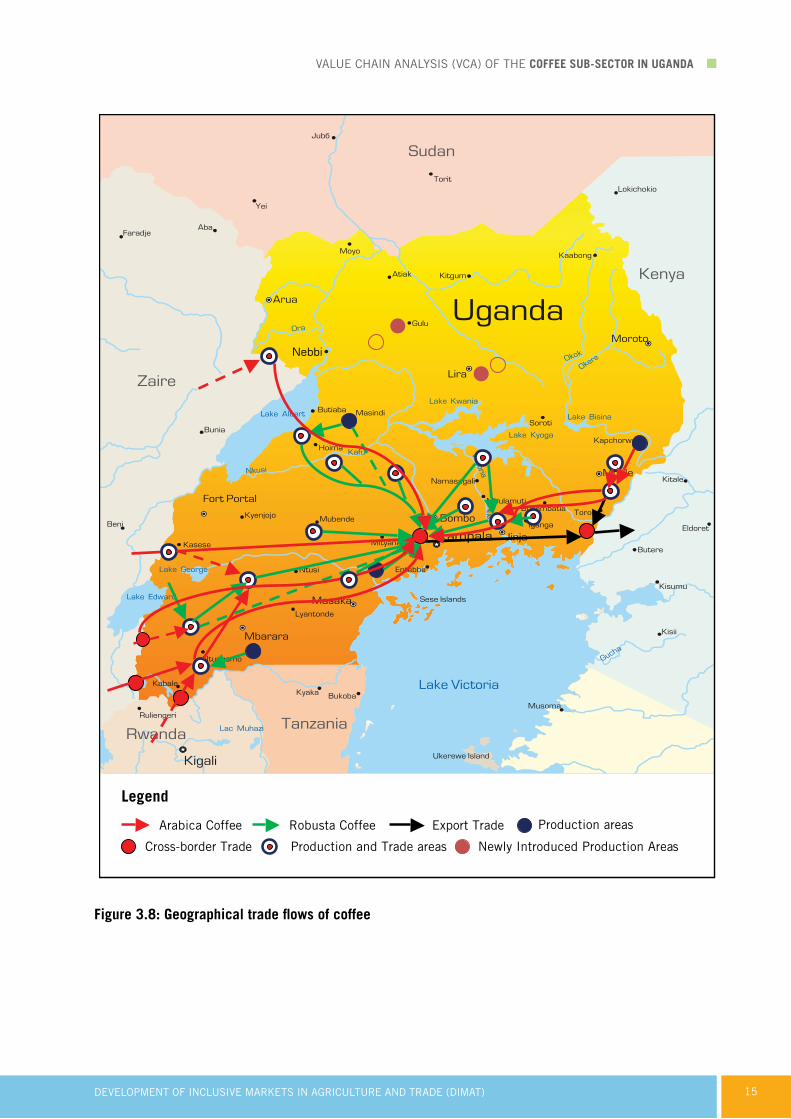
3.4.3 Trade flows in the coffee value chain
The main coffee producing areas in Uganda are Central, Eastern and Western parts of the country. Coffee trading takes place in almost all the major urban centres in these coffee-growing areas (Figure 3.8). However, because most of the planting activity has taken place over the last two years, there is little participation of the northern region in the coffee trade flows as reflected in the map. The West Nile region produces Arabica coffee.
Almost all coffee trading activities in Uganda end in Kampala as over 95% of the coffee traded within the country goes to the export market through Kampala. This is because, a majority of exporters and key transport and export facilitation infrastructure and services are located in Kampala. However, some arabica coffee, particularly from Mbale is exported through other routes. The following being the key trade towns: Jinja, Iganga, Mbale, Masaka, Bushenyi, Luweero, Mbarara, Ntungamo, Kasese, Kayunga, Mityana and Mubende.
In major towns and urban centres in the coffee producing areas, trade is mostly driven by the existence of primary processing facilities (hulleries) that hull cherry coffee (Kiboko) into the highly marketable Fair Average Quality (FAQ). Traders, brokers, and agents of exporters then buy the FAQ coffee from farmers and owners of these hulleries and transport it to other major towns or Kampala for secondary processing into clean graded coffee and exporting.
Significant production and trade in Arabica coffee takes place in Eastern Uganda around Mbale. Kasese, Kanungu, Rukungiri and Nebbi districts are also trade hubs for coffee. Some Arabica coffee comes from the DRC through Nebbi, Kasese, Kabale and Kanungu to Kampala. The trade of robusta coffee represented in green on the map is 80% of the total coffee produced in the country, while that of Arabica in red represent 20%. Figure 3.8 shows the geographical trade flows of coffee from different districts in Uganda.
DEVELOPMENT OF INCLUSIVE MARKETS IN AGRICULTURE AND TRADE (DIMAT) 15
VALUE CHAIN ANALYSIS (VCA) OF THE COFFEE SUb-SECTOR IN UGANDA
Figure 3.8: Geographical trade flows of coffee
Legend
Arabica Coffee Export Trade Robusta Coffee Production areas
Cross-border Trade Newly Introduced Production Areas Production and Trade areas
Nebbi

DEVELOPMENT OF INCLUSIVE MARKETS IN AGRICULTURE AND TRADE (DIMAT)16
VALUE CHAIN ANALYSIS (VCA) OF THE COFFEE SUb-SECTOR IN UGANDA
3.4.4 Employment in the coffee value chain
Generally, farmers reported that both men and women were involved in all activities including marketing of coffee. Among the major farm activities, the biggest percentage of respondents (89.7%) reported harvesting as the main activity conducted by men and women. The activity that was most reported as was weeding. Marketing, pruning, fertilizer application and land preparation were reported as male dominated activities with only an average of 4% of respondents considering them as purely done by women.
“The morning cup of coffee has an exhilaration about it which the cheering influence of the afternoon or evening cup of tea
cannot be expected to reproduce”~Oliver Wendell Holmes, Sr., “Over the Teacups,” 1891
The study also found out that there is little youth involvement in the production of coffee. This has been largely attributed to the fact that youth prefer quicker income generating activities. This seems to be exacerbated by inadequate access to productive assets like land, which is critical for production of such a perennial crop. They therefore usually opt for crops like maize, which take shorter periods and are more suitable for leased land.
Figure 3.9: Workload distribution by gender in coffee production and marketing
Men constitute majority of the workforce in the chain. Their control is evidenced in the managerial positions, where by the average ratio of women to men in processing and trading are approximately 2:5 and 3:5 respectively. The only employment level which has more women than men is the casual labour at processing level. In this level, women are clearly the majority, with the average ratio of women to men standing at 4:1

DEVELOPMENT OF INCLUSIVE MARKETS IN AGRICULTURE AND TRADE (DIMAT) 17
VALUE CHAIN ANALYSIS (VCA) OF THE COFFEE SUb-SECTOR IN UGANDA
Figure 3.10: Levels of employment along the Coffee value chain
3.5 Financial Analysis of Coffee Value Chain
The value shares of the different chain actors were determined in order to determine price distribution along the chain. Secondly, market price was attached to the different activities, inputs and outputs and the gross value for each agent along the value chain was estimated. The aim was to determine the value added and how much of it accrued to each agent.
3.5.1 Estimation of shares of value
The coffee prices received depict the value at each node of the chain. The case presented below is just one of the scenarios taking into account only two traders (the village collector and the exporter). This may differ where there are more than two traders. The Kiboko/FAQ value chain shows that the exporters sell the FAQ at an average price of 5,580 UGX/Kg to the importers in Europe. The price distribution has been calculated based on the
export price. The exporter buys the FAQ coffee from the traders at 4,700 UGX/Kg. Expressing the share of the margin received by the exporter as a ratio of the export price, the exporters share of value is 16%. The village collector is responsible for hulling and transporting the coffee which justifies the share value of 39% (Figure 3.11). The processors (hullers) do not appear in this share of value because they are usually only offering the hulling services.
DEVELOPMENT OF INCLUSIVE MARKETS IN AGRICULTURE AND TRADE (DIMAT)18
VALUE CHAIN ANALYSIS (VCA) OF THE COFFEE SUb-SECTOR IN UGANDA
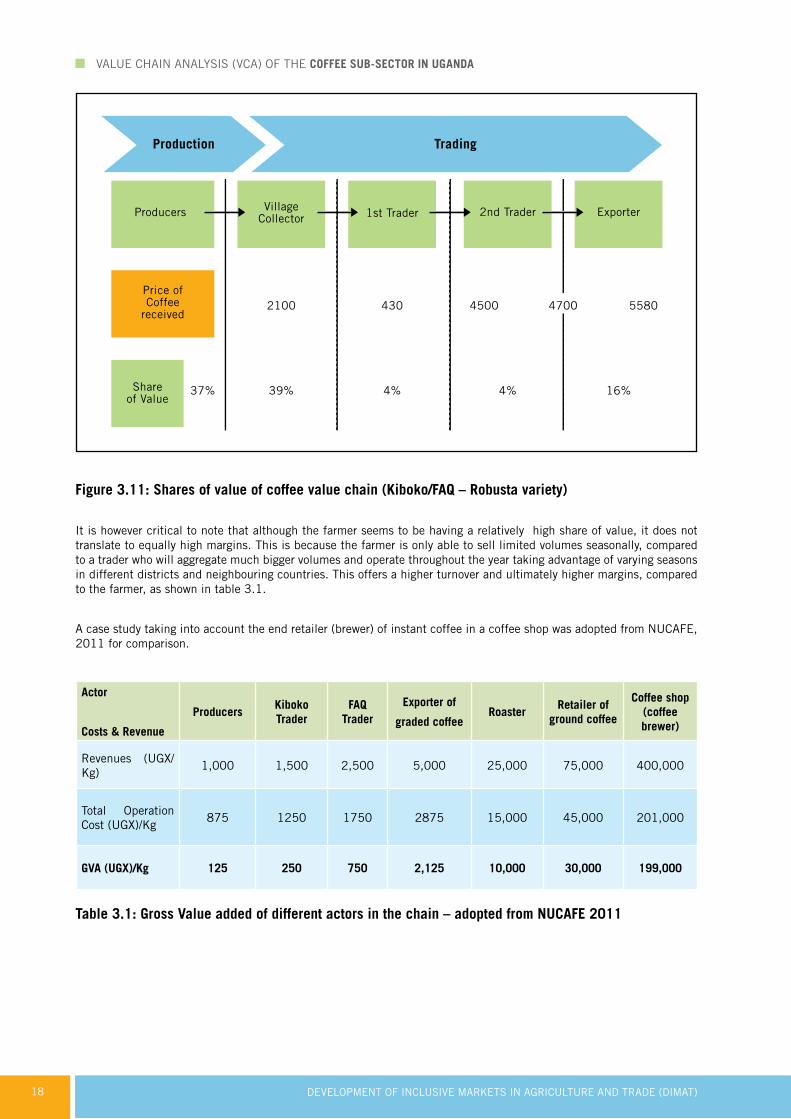
Figure 3.11: Shares of value of coffee value chain (Kiboko/FAQ – Robusta variety)
It is however critical to note that although the farmer seems to be having a relatively high share of value, it does not translate to equally high margins. This is because the farmer is only able to sell limited volumes seasonally, compared to a trader who will aggregate much bigger volumes and operate throughout the year taking advantage of varying seasons in different districts and neighbouring countries. This offers a higher turnover and ultimately higher margins, compared to the farmer, as shown in table 3.1.
A case study taking into account the end retailer (brewer) of instant coffee in a coffee shop was adopted from NUCAFE, 2011 for comparison.
Actor
Costs & Revenue
ProducersKiboko Trader
FAQ Trader
Exporter of
graded coffeeRoaster
Retailer of ground coffee
Coffee shop (coffee brewer)
Revenues (UGX/Kg)
1,000 1,500 2,500 5,000 25,000 75,000 400,000
Total Operation Cost (UGX)/Kg
875 1250 1750 2875 15,000 45,000 201,000
GVA (UGX)/Kg 125 250 750 2,125 10,000 30,000 199,000
Table 3.1: Gross Value added of different actors in the chain – adopted from NUCAFE 2011
DEVELOPMENT OF INCLUSIVE MARKETS IN AGRICULTURE AND TRADE (DIMAT) 19
VALUE CHAIN ANALYSIS (VCA) OF THE COFFEE SUb-SECTOR IN UGANDA
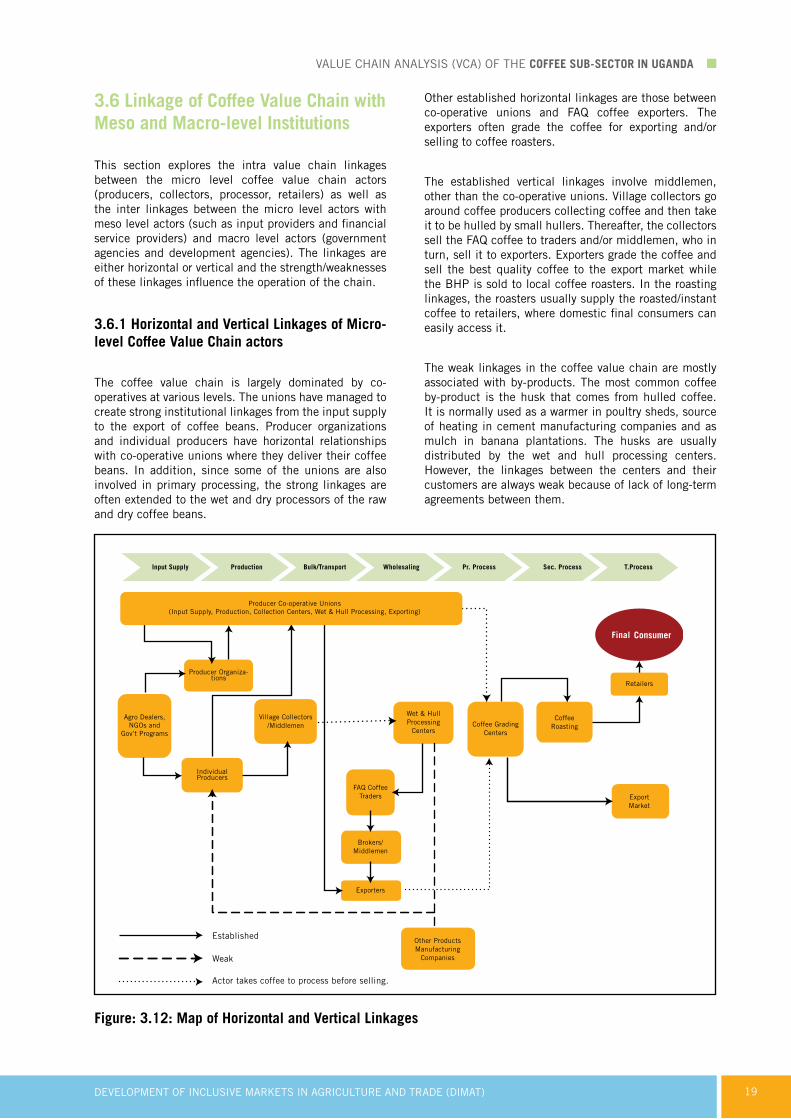
3.6 Linkage of Coffee Value Chain with Meso and Macro-level Institutions
This section explores the intra value chain linkages between the micro level coffee value chain actors (producers, collectors, processor, retailers) as well as the inter linkages between the micro level actors with meso level actors (such as input providers and financial service providers) and macro level actors (government agencies and development agencies). The linkages are either horizontal or vertical and the strength/weaknesses of these linkages influence the operation of the chain.
3.6.1 Horizontal and Vertical Linkages of Micro-level Coffee Value Chain actors
The coffee value chain is largely dominated by co-operatives at various levels. The unions have managed to create strong institutional linkages from the input supply to the export of coffee beans. Producer organizations and individual producers have horizontal relationships with co-operative unions where they deliver their coffee beans. In addition, since some of the unions are also involved in primary processing, the strong linkages are often extended to the wet and dry processors of the raw and dry coffee beans.
Other established horizontal linkages are those between co-operative unions and FAQ coffee exporters. The exporters often grade the coffee for exporting and/or selling to coffee roasters.
The established vertical linkages involve middlemen, other than the co-operative unions. Village collectors go around coffee producers collecting coffee and then take it to be hulled by small hullers. Thereafter, the collectors sell the FAQ coffee to traders and/or middlemen, who in turn, sell it to exporters. Exporters grade the coffee and sell the best quality coffee to the export market while the BHP is sold to local coffee roasters. In the roasting linkages, the roasters usually supply the roasted/instant coffee to retailers, where domestic final consumers can easily access it.
The weak linkages in the coffee value chain are mostly associated with by-products. The most common coffee by-product is the husk that comes from hulled coffee. It is normally used as a warmer in poultry sheds, source of heating in cement manufacturing companies and as mulch in banana plantations. The husks are usually distributed by the wet and hull processing centers. However, the linkages between the centers and their customers are always weak because of lack of long-term agreements between them.
Consumer
Figure: 3.12: Map of Horizontal and Vertical Linkages

DEVELOPMENT OF INCLUSIVE MARKETS IN AGRICULTURE AND TRADE (DIMAT)20
VALUE CHAIN ANALYSIS (VCA) OF THE COFFEE SUb-SECTOR IN UGANDA
3.6.2 Linkages between Micro-level Coffee Value Chain Actors and Service Providers
Coffee value chain actors receive different support services along the chain in the form of finance, extension, inputs, and market information.
Financial service providers: A total of 77 different types of financial service providers consisting of commercial banks, SACCOs, microfinance institutions, VSLAs, Credit institution tierII, International Development Organizations (IDO), MDIs, NGOs and risk capital
providers were interviewed. Ninety six percent indicated that they offer financial products and services within the agricultural sector. In terms of numbers of providers of financial services to the coffee value chain actors, SACCOs took the lead at 38%, followed by commercial banks at 27%, Microfinance institutions at 20% and VSLAs at 10 %.
Figure 3.13: Map of value chain services
Notably, the financial service providers that are taking lead in agricultural financing are mainly MFIs and SACCOs. There is also a significant percentage of these services being provided by traders (pre-financing to farmers and fellow traders) while large commercial banks are lagging behind in financing agriculture. However, compared to commodities like beans, cassava and rice, which are the commodities targeted by the DIMAT project, the coffee sector receives the highest share of financial services (22%) because of its status as a cash crop, high returns from its sales and the ready market. In addition, farmers
who cultivate coffee usually have sufficient collateral because they own their land. The level of organisation in the chain is incentive enough to the financial service providers to trust the actors.
Actors in the coffee value chain also get finance in form of advance payment from some processors and traders who pay in advance either in cash or in-kind (inputs) to producers. The finance advance is deducted from the value of the coffee delivered.

DEVELOPMENT OF INCLUSIVE MARKETS IN AGRICULTURE AND TRADE (DIMAT) 21
VALUE CHAIN ANALYSIS (VCA) OF THE COFFEE SUb-SECTOR IN UGANDA
The main products and services offered by the financial service providers are loans which were categorized as agricultural, asset, business, microfinance, group, land title processing and animal traction loans. They also provide products such as savings accounts, commodity financing, working capital, financing towards agricultural production and livestock production enhancement, input supplies and trainings in agriculture specifically offered by the VSLAS.
Most of the providers of financial services indicated that they prefer lending to individuals rather than groups because: i) it is easy to manage individuals, ii) loans and accounts are operated on individual basis, and iii) most bank policies require collateral most of which is personal property.
Market Information Providers: A total of 29 market information service providers were interviewed and the findings showed that majority of them were private companies including radio stations. Government agencies and NGOs are also involved in providing market information. Where as most market information providers are not commodity specific, some like the Uganda Coffee Development Authority (UCDA) deal specifically with coffee.
Perc
enta
ge o
f res
pond
ents
Figure 3.14: Categories of the coffee VC financial service providers (by number)
The common types of information provided cover commodities and inputs prices (83% of providers), coffee quality requirements, market locations (local and international), areas of demand locally and internationally and a few on consumer preferences. The major clients for the market information providers were producer groups, individual farmers and traders. The information is packaged in the form of printed materials, posters, fliers, SMS, talk-shows, magazines and audio tapes translated into local languages.
The most popular modes of delivering information were field visits, pre-recorded radio programs, SMS, Radio/TV talk-shows and field visits to groups (Figure 3.17). The SMS system which costs between UGX 50 to UGX 220 per text was handy in delivering information on prices of coffee (both local and international) because of the high level of penetration of mobile phones. For example, the Uganda Coffee Development Authority (UCDA) has a system that is capable of delivering local and international prices of coffee daily via SMS. A client needs to send the words ‘coffee international prices’ or ‘coffee local prices’ to ‘7197’ to get an instant response to the requested prices. This service applies to all mobile networks in Uganda. A single SMS, in the case of UCDA, costs UGX 220.

DEVELOPMENT OF INCLUSIVE MARKETS IN AGRICULTURE AND TRADE (DIMAT)22
VALUE CHAIN ANALYSIS (VCA) OF THE COFFEE SUb-SECTOR IN UGANDA
Figure 3.15: Mode of delivery of information
The major sources of information for the market information providers include major markets, internet, government departments and other market information providers. Government departments mentioned to be sources of information include: NaCCRI, NARO, NAADS (district commercial offices), UEPB and Uganda Investment Authority (UIA). Most of the information from these organizations is obtained from their websites or through the various workshops they organize. Market information providers have contacts in the major markets who update them with the current information on prices, demand and supply.
Technological and business Development Service (T&bDS) Providers: The NGOs dominate the provision of BDS (60%) compared to 17% by government organizations. The rest of the BDS are provided by business enterprises such as FIT Uganda and Agrinet. The focus of services provided by the 52 BDS actors was R&D, technological advice and extension and agronomic extension. There were only 4% of BDS providers dealing with issues structure development of structured trade such as Warehouse Receipt Systems (WRS).
36%
28%
14%
14% 8%
Field Visits
Mobile Phone/SMS
Group Trainings
Electronic Mas Media
Internet (Websites)
The National Agricultural Research Organisation (NARO) provides several technologies through (CORI). For Robusta coffee, the Coffee Research Institute (CORI) developed new clonal varieties do deal with coffee wilt disease (CWD) problem; investigations on crop management practices including intercropping coffee with annual crops and banana inter-cropping systems; and integrated weed management and use of organic fertilizers. CORI has also developed soil fertility improvement packages using locally available organic fertilizers. It has also recommended new approaches for weed management/control for large-scale robusta coffee production. For Arabica coffee, CORI evaluates of new introductions, yield improvement coupled with resistance to coffee berry disease (CBD), leaf rust, and quality. Other services include the modification of chemical control procedures for pests to reduce costs, improvement of soil fertility and crop management.
Improved varieties
Fertilizer application
Soil conseervation practices
Intergrated pest management
Co�ee processing
Improved farm tools/ equipment
Irrigation
Imrpoved storage facilities
30%
28%
16%
12%
7% 4%
2%1%
Figure 3.16: Technologies applied in coffee production

DEVELOPMENT OF INCLUSIVE MARKETS IN AGRICULTURE AND TRADE (DIMAT) 23
VALUE CHAIN ANALYSIS (VCA) OF THE COFFEE SUb-SECTOR IN UGANDA
The major technologies applied by farmers in coffee production were: improved coffee varieties (30%) in an attempt to increase productivity: fertilizer (28%), soil conservation practices (16%), integrated pest management practises (12%) and use of improved storage facilities (only 1%). Farmers irrigate their seedlings. .
3.6.3 Willingness to enter into Formal business Linkages
Eighty four percent (84%) of the interviewed farmer groups did not have contracts with buyers. This was attributed to: i) lack of interested contract buyers ii) farmer groups not trusting the buyers iii) availability of a ready market for coffee and iv) low production volumes by the farmer groups which makes it difficult for them to meet the required volumes by the potential contract buyers. Other factors were price fluctuations of coffee which greatly affects farmers when the contract price goes below the on-going market price, and sheer lack of interest by farmer groups to enter into contract.
For farmers with existing contracts, access to ready market, ability to meet the quality requirement of most buyers and access to financial advance for production (pre-financing) were the main incentives for their current engagement in contractual arrangements with their buyers.
For the farmer groups with contracts (83%), the terms in such contracts included contract price of 2,600 UGX/Kg of “Kiboko coffee” and 4,700 UGX/Kg of FAQ coffee. In terms of quality, the farmer groups were required to supply coffee that is well sorted, brown in colour and well dried (not exceeding 14% moisture content). The contracts are seasonal.
For farmers with no contracts, 65.8% were willing to enter into contracts with buyers (Appendix 1). This is an opportunity for buyers to lower their operational costs and time involved in sourcing of coffee. The farmer groups would also benefit by securing a ready market for their coffee.
Thirty percent (30%) of the traders had contracts with suppliers which had a maximum duration of one year. The conditions considered before awarding a contract included: i) ability to supply required volumes (40%), ii) favourable prices to both parties in the contract(40%) and iii) good quality (20%) coffee.
Figure 3.19: Aspects considered by traders before awarding contracts to suppliers
Aspects

DEVELOPMENT OF INCLUSIVE MARKETS IN AGRICULTURE AND TRADE (DIMAT)24
VALUE CHAIN ANALYSIS (VCA) OF THE COFFEE SUb-SECTOR IN UGANDA
Only 5 of the 16 interviewed traders were willing to enter into new contractual arrangements with suppliers. These traders include Ndiwalana coffee factory, Ntungamo Coffee Traders, Twesigye Traders and NUCAFE. Most of these traders are willing to provide loans to suppliers, sensitise farmers on quality and provide technical support to farmers.
Reasons cited by traders for their unwillingness to enter into contracts include: losses if market prices drop below the contract prices which are normally fixed during signing of the contract, suppliers do not respect agreements, do not supply on time and do not supply the right quantities. Other reasons included risk of farmers dishonouring their contracts due to delayed payments and limited capital for pre-financing. In order to address the current short comings of contracts, 67% of respondents suggested stabilisation of prices as an important factor.
Only 18% of the interviewed processors indicated that they have formal contract with suppliers. The processors have contracts with farmer groups, traders and few individual farmers. Fifty percent (50) of these contracts are seasonal with the length of other contracts varying
from six months to one year. Majority (82%) of the processors are not in any kind of formal agreements with suppliers. Seventy nine percent of these respondents still prefer not to enter into contractual arrangements with suppliers due to: lack of transparency, the risks involved and lack of seriousness by the suppliers.
The processors willing to enter into contracts expressed their desire to have strong linkages in order to function properly. They were willing to advance part of the payments to suppliers when needed as well as pay the balance promptly upon delivery. In turn, they emphasized the need for the suppliers to produce good quality coffee. They also insisted on introducing mechanisms whereby, suppliers especially farmers, would not be held liable in case of harsh weather conditions which may negatively affect their anticipated yields.
In addition, they indicated they were willing to enter into contracts only with organized farmer groups (68%) and well established individual farmers (28%). The rest of the processors suggested traders and middlemen as the best players to partner with in such linkages. The willing processors were keen to bringing both direct and in-kind contributions to the linkages.
52%25%
8%
15%
Provide advance loans
Provide inputs
Provide equipments
Pay membership fees
Figure 3.18 a: Financial direct contribution by processors
Figure 3.18 b: In kind contribution by processors willing to enter into contractual agreements with farmers
62%
10%
15%
13%Advise on Quality Assurance
Share Market Information
Provide Extension Services
Provide Technical Assistance

DEVELOPMENT OF INCLUSIVE MARKETS IN AGRICULTURE AND TRADE (DIMAT) 25
VALUE CHAIN ANALYSIS (VCA) OF THE COFFEE SUb-SECTOR IN UGANDA
The conditions set for awarding contracts depend on the agreement between the two parties. Usually, price, quality and quantity are the main determinants. Price is by far the biggest determining factor and the minimum price is always set depending on the market projections. The maximum price is always driven by the prevailing market price at the time of selling. Conditions stipulated in the contracts can also involve exchange of services between the parties. About 40% of the respondents suggested that crop financing, training, monitoring and evaluation are some of the services which could be included in the agreements.
3.7 Macro Level - Coffee Value Chain Supporting Policies and Institutions
The Uganda’s Coffee Plan aims at commercial multiplication of traits resistant to coffee wilt disease, improve Robusta coffee yields, establish a quality rating system for Robusta coffee so that Ugandan coffee can penetrate the specialty coffee market, and putting in place, practices that will enable producers to take economic advantage of the standards of specialty coffee.
Uganda National Coffee Regulations Statute1994: Interventions in the coffee sub-sector aim to support the realization of the objectives of coffee production, processing and marketing in Uganda as outlined in the Coffee Regulations Statute, 1994. This statute aims at ensuring proper registration of coffee buyers, processors and exporters; stipulates the provisions relating to registration and quality control in the coffee sub-sector and regulates coffee prices and ensure optimum running of the coffee sub-sector in Uganda. The important pillars of the Coffee Regulations Statute are: formalization of internal trade of coffee, regulation of coffee prices in the country, export trade in coffee and quality control of coffee products.
The National Coffee Strategy: UCDA is in the process of drafting a national coffee strategy and coffee policy to harmonize all interventions in the sector.
3.7.1 Interventions by Macro-level Coffee Value Chain Actors
Besides linkages between micro and meso-level actors, the coffee value chain is supported by other organizations at the macro-level. These organizations have different roles and responsibilities including from technology development, dissemination, production, processing, transporting and marketing. These include bilateral partners, NGOs, government ministries and related agencies and private sector organisations including business development service providers.
These organizations have programs/projects operating at the various stages of the value chain such as production, bulking, processing and marketing. Some of them e.g. the Uganda Coffee Farmers Alliance engage in more than one function along the coffee value chain. In addition, Uganda Coffee Development Authority focuses on improving quality standards and marketing of the coffee produced in Uganda, but also provides support in the enforcement of the Uganda Coffee Regulations, 1994 and the current policy framework guiding the sub-sector. Others such as USAID, DANIDA, the European Union and the Netherlands Government have been providing support towards revamping and boosting the coffee sub-sector in Uganda.
bilateral Organizations: The following is a brief description of some of the bilateral organizations and/or their programs directed to supporting the coffee sub-sector:
a) Uganda Feed the Future (FTF) Strategy 2011 – 2015: This is a strategy funded by USAID, World Bank, DANIDA and the European Union. The value chains targeted by FTF for investment are coffee, maize and beans. The strategy is multi-faceted and it focuses on: support policy reform in the agriculture sector and trade, support capacity of key public and private sector institutions at national and district level, investment in research to develop disease resistant varieties of improve quality of coffee production at farm level; and build capacity of farmer organizations to enter into contractual agreements with buyers, access finance and purchase inputs.

DEVELOPMENT OF INCLUSIVE MARKETS IN AGRICULTURE AND TRADE (DIMAT)26
VALUE CHAIN ANALYSIS (VCA) OF THE COFFEE SUb-SECTOR IN UGANDA
b) The Netherlands Trust Fund Coffee Project in collaboration with ITC, NUCAFE, UCDA and UEPb: This project is funded by the Netherlands Government and aims at: improving the effectiveness of umbrella institutions and farmers’ organizations, and improving access to support services for the coffee sub-sector and enhance its competitiveness in the EU market.
c) European Union and bill and Melinda Gates Foundation boost to Coffee Farmers Project: This project is co-funded by the European Union and BMGF in collaboration with USAID and DANIDA. It aims at boosting Robusta coffee production in Uganda including the development of coffee wilt resistant varieties. The funding is also intended to strengthen the Uganda Coffee farmers Alliance.
d) USAID- Livelihoods and Enterprises for Agricultural Development Project (LEAD): This project is funded by USAID and aims at utilizing existing business development service providers to train coffee farmers achieve specific certifications. In addition, the existing BDS providers will be used to train coffee barristas, roasters and cuppers. The project also aims at re-introducing coffee production in Kitgum and Gulu districts.
e) Agriculture Productivity Enhancement Programme (APEP- USAID)
This program is funded by USAID and aims at increasing and expanding coffee demonstration sites where farmers could have practical demonstration of Good Agricultural Practices in coffee production. In addition, the project aims at training farmers on quality improvement and agronomic practices.
f) AbI Trust/USAID: ABI Trust provides support to coffee sector development programs especially in areas of production, post-harvest and processing (ITC, 2012).
g) COMESA/Lion Assurance: This is a pilot project in Lira on how to insure the coffee sector in Uganda.
Other programs and organizations supporting the coffee sub-sector include: ASARECA (develops cost effective technologies for staking of coffee, management of insect pests and diseases and soil fertility), VEDCO, CFC and DFI.
Figure 3.19: Map of organizations undertaking interventions in the coffee sub-sector

DEVELOPMENT OF INCLUSIVE MARKETS IN AGRICULTURE AND TRADE (DIMAT) 27
VALUE CHAIN ANALYSIS (VCA) OF THE COFFEE SUb-SECTOR IN UGANDA
Public institutions: Several public institutions collaborate to support coffee development. These include: MAAIF which offers overall guidance and policy direction and the Uganda Coffee Development Authority, formed by statutory mandate in 1991. It is tasked with the enforcement of the Coffee Regulations 1994 as well as promoting and overseeing the development of the coffee industry through research, quality assurance and improved marketing of coffee nationally, regionally and internationally. Other public institutions include the Coffee Research Centre, Uganda Export Promotions Board, NAADS (extension and advisory services), UCDA and CORI. The roles of some of these organizations are discussed below.
a) UCDA, the Uganda Coffee Development Authority is a major player in the coffee Value Chain. It promotes and oversees the coffee industry as a whole by developing research and controlling the quality and improving the marketing of coffee. UCDA has also rolled out Northern Uganda Coffee project that saw the introduction of coffee in the north (Gulu, Nwoya, Amuru, Lamwo, Lira, Kole, Oyam and Dokolo districts). It is also planning to distribute over 2 million and 20 million coffee seedlings countrywide in the next one and five years, respectively.
b) CORI, the Coffee Research Institute (CORI) conducts research necessary to solve priority constraints that limit the production of coffee in Uganda. The Institute is part of NARO which, along with the donors, are the main sources of its funding. The institute aims at solving priority constraints that limit the production, productivity and marketing of coffee. Other institutes include CIAT, Kawanda Agricultural Research Institute and NaCCRI.
c) bMOs: Most coffee value chain actors are members of business organizations (table 3.2) that act as the apex bodies. These BMOs mainly advocate for a favourable policy environment for their members. Below is a list of identified BMO’s in the coffee sub sector:
i) NUCAFE: Founded as Uganda Coffee Farmers Association, but changed its name to NUCAFE. It aims at establishing a sustainable and profitable farmer operated organization for the benefit of coffee farmers
ii) Uganda Coffee Trade Federation: Protects, promotes and safeguards the business interests of persons engaged in the coffee trade and industry e.g. growers, processors, agents, brokers, roasters and exporters, and any other persons connected to the industry
iii) Uganda Coffee Roasters Association: Represents the interest of coffee roasters who supply the local market. Uganda consumes 100,000 bags per annum which is equivalent to 3% of the coffee produced.
d) Uganda Coffee Trader Federation (UCTF): this is funded by its members and it protects, promotes and safeguards the business interests of persons engaged in the coffee trade and industry e.g. growers, processors, agents, brokers, roasters, or exporters; and persons connected with the industry in Uganda.
Table 3.2: bMOS that support the coffee sector
bMO’s
1. Uganda Coffee Roasters Association 2. National Union of Coffee Agribusinesses and Farm Enterprises (NUCAFE)
3. Uganda Coffee Trader Federation 4. Union Export Services
5. Gumutindo Cooperative Union 6. Bugishu Cooperative Union
7. Good Coffee Traders Association 8. Good African Coffee- wet coffee promoters
9. Ankole Coffee Cooperative 10. Masaka Coffee Campaign Platform
11. Kaweri Coffee Farmers Alliance 12. Abadeyanda Cooperative Society
13. Banyankole Kwetarana Union 14. Kanywa Twekembe Cooperative Society
15. Kingo Farmers Cooperative Society 16. Magala Tugenda Mumaso Co-operative Society
17. Kawonawo Growers Co-operative Society 18. Buyore Produce and Marketing Co-operative Society
19. Coffee Marketing Board 20. UNADA
21. Uganda Coffee farmers Association 22. African Fine Coffee Association

DEVELOPMENT OF INCLUSIVE MARKETS IN AGRICULTURE AND TRADE (DIMAT)28
VALUE CHAIN ANALYSIS (VCA) OF THE COFFEE SUb-SECTOR IN UGANDA
Private sector organizations: Some of the private sector organizations that support the coffee sub-sector include NOGAMU (National Organic Agricultural Movement of Uganda) - whose objective is to promote organic farming through training, development of standards and promotion (both local and international). Specifically, NOGAMU promotes and facilitates organic coffee export in Uganda.
In spite of the presence of different meso and macro-level actors supporting the coffee value chain, there are still gaps in interventions as shown in Table 3.3.
Table 3.3: Gaps on existing interventions
Activity
Agency Rese
arch
Inpu
ts
Prod
uctio
n
Prim
ary
Proc
essi
ng
Trad
ing
&
brok
erag
e
biz/
Fin
Serv
ices
Seco
ndar
y &
Expo
rtin
g
(Gre
en C
offe
e)
Tert
iary
Proc
essi
ng
(Roa
sted
&
Inst
ant c
offe
e)
Dist
ribu
ting
&
Reta
iling
Cons
umin
g
NOGAMU ü üü üü
USAID üü üüü üü üü üüü üü
FTA üüü üüü üü üüü
World Bank
EU/BMGF üü üüü
DUTCH ü üüü üüü üü üü
DANIDA/
ABITRUSTüü üüü üüü üüü üüü
UCRA ü üüü üü üüü
ASERECA üüü üü üüü
UCDA üü üü üü üü ü üü üü üü
COMESA üüü
MAAIF üü üü ü
CORI üüü
UCTF ü üü üüü üüü
UCFA üü üüü ü
NUCAFE üü üüü üü üü üü
EAFCA ü üüü ü üü ü ü
“I orchestrate my mornings to the tune of coffee” ~Terri Guillemets

DEVELOPMENT OF INCLUSIVE MARKETS IN AGRICULTURE AND TRADE (DIMAT) 29
VALUE CHAIN ANALYSIS (VCA) OF THE COFFEE SUb-SECTOR IN UGANDA
The end markets part of the chain has less investment or interventions by the public sector. Here the main players are: NOGAMU and Fair Trade Africa who are mainly certification agencies, UCRA which is an association of Coffee Roasters and UCDA which is a regulator. Though coffee consumption is low in Uganda, there are considerable opportunities to increase coffee consumption in Uganda. These include the current efforts by UCDA and other companies to promote coffee consumption, potential of the EAC market, increasing urbanization and increasing range of coffee-based beverage products. Two possible interventions could be investing in developing the retailing of coffee products with opportunities targeting SMEs and products development, testing and promotion.
Interventions in BDS and Financial Services (FS) also seem to have few players. This may partly be due to the maturity of the chain where most of the traders and exporters can access financing and the existing inter-actor pre-financing mechanisms. However, access to finance for producers and access to longer term financing for the processors remain a challenge in the chain. There is scope for developing innovative products in both BDS and FS.
In spite of the serious problem of coffee wilt, there seems to be relatively low interventions at the inputs supply part of the chain. The opportunity here could be in developing sustainable input supply systems driven by both producers and other agri-based SMEs, or entrepreneurs to increase access to improved varieties and other inputs that can also impact productivity positively.
Many players at the production stage give attention to increased production and production practices with less emphasis on building producer institutions for economies of scale such as apex bodies, bulking, joint marketing, bulk procurement of inputs and services. This could be an opportunity for the project. There also seems to be few players in the coffee research part of the chain. Opportunities in this area should be explored.


DEVELOPMENT OF INCLUSIVE MARKETS IN AGRICULTURE AND TRADE (DIMAT) 31
4.1 Lessons from the coffee value chain analysis
Demand for coffee from Uganda remains stable inspite of the decreased export volumes recorded in the late 1990s and early 2000s. This demand is largely driven by the historical need to blend the Uganda coffee with coffee from other origins in a wide range of coffee blended products.
Local consumption of coffee has experienced very modest gains. An increasing share of the market of coffee products consumed is slightly increasing due to availability of value-added coffee products and brands produced in Uganda like Star Café and Good African Coffee brands. Penetration of these products into the EAC market is still at its nascent stages but, has promising results so far. Efforts to enhance these supply chains into the broad national and regional markets would enhance more diversification of the coffee products value chains. Increased consumption would further drive product development and other innovations.
The current value chain involves a relatively stable number of 5 – 7 core processes with a fairly well defined structure. However, this structure is still quite inefficient and leaves a number of opportunities unexploited, particularly enhanced productivity of the coffee farmers and the benefits of improved coffee quality. In particular, coffee quality is still affected at a number of nodes across the value chain, although a number of improvements have been noted.
There are emerging models of the chain that are being experimented and that have shown some promising results. An example is the Kaweeri Farmer Coffee Alliance project which has demonstrated that it is possible to shorten the chain by linking producers directly to exporters while increasing their productivity as well as enable them to vertically integrate and perform other value adding activities. Such models are worth experimenting for improvement, adoption and adaption with an aim to replicate.
Participation of youth in the sub-sector is on the decline. This is a worrying trend as coffee remains one of the key sectors contributing to the national economy. Coffee trees in Uganda are aging and producers as well and this poses a future challenge. However, there are opportunities for integrating the youth into the sector at different stages of the chain. The most notable stages are production and marketing of value-added coffee
4. CONCLUSIONS
products produced in Uganda. This way, not only will the employment opportunities provided by the sub-sector be exploited by the youth, but there are increased chances of entrepreneurial opportunities in the sector driven by this segment of the population. In addition, there are increased chances of this segment adopting coffee drinking in the long term and consumption driving the whole subsector.
With improved coffee varieties, the effects of the coffee wilt disease are lesser on the sub-sector. However, the disease is still one of the biggest challenges in the industry and will likely continue to be so in the medium term. With the impact of external factors on the coffee industry such as international price fluctuations, large volume coffee producers creating a supply glut, coffee wilt disease and climate change, a number of approaches have been adopted globally as well as at national level. However, to keep the whole sector focused on mitigating these risk factors and to increase the sector’s ability to respond effectively, a multi-stakeholder platform has been established to be an effective means of driving the development and growth agenda of the sector. Though still developing, this initiative has provided some evidence that it can be an effective tool to addressing strategic issues in the sector in an inclusive and collaborative way.
Weak linkages and low trust among core actors of the chain continue to prevail, reducing the opportunities to maximize profits and win-win business transactions across the value chain. This situation is particularly prevalent in the middle of the chain where large numbers of intermediaries play a key role driving coffee volumes across the chain. This is perhaps the single most source of inefficiency in the value chain and a key source of bad practices and value destroying activities
4.2 SWOT AnalysisThe study identified a number of strengths, weaknesses, opportunities and threats to the various actors along the coffee value chain as listed below.
4.2.1 Strengthsa) Coffee trade in Uganda is relatively better structured
than most commodities due to existence of support institutions and the ready export market.
b) Local brands are well established.
c) The chain has a critical mass of actors at most of the stages.

DEVELOPMENT OF INCLUSIVE MARKETS IN AGRICULTURE AND TRADE (DIMAT)32
VALUE CHAIN ANALYSIS (VCA) OF THE COFFEE SUb-SECTOR IN UGANDA
d) Availability/existence of proven technologies
e) Sector is attractive to private sector service providers e.g. transporters, insurance, finance, market information due to the associated returns to investment.
f) There exist proven models for structuring the value chain to maximize inclusiveness.
4.2.2 Weaknessesa) There is poor and inconsistent quality control of
coffee across the chain coupled with limited capacity to monitor and enforce quality standards
b) The productivity of coffee of 0.5 Kg/tree/season is still low compared to 2 – 3 kg per tree if the right agronomic practices are applied
c) There is limited access to improved planting materials
d) There is still inadequate supply of coffee to the traders
e) There is low local consumption of coffee and coffee products in Uganda and the East African region, leaving the coffee prices highly vulnerable to the global market prices
f) There is limited willingness for formal market linkages with farmers
g) Crop and weather Insurance are still highly demanded, but underdeveloped products due to high costs of investment and limited understanding by key actors and stakeholders
h) There is limited R&D capacity
i) There is inadequate appropriate financial products, especially for farmers and the big exporters of coffee
4.2.3 Opportunitiesa) Sustained demand for Ugandan coffee in importing
countries
b) Increasing consumption of coffee at national and regional level, albeit modest
c) Potential to capture a high proportion of the FOB Kampala price
d) On-going national level initiatives to grow more coffee
e) Growing segments of the specialty coffees especially UTZ, RFA, Fairtrade in importing countries
f) High availability of agricultural financing looking for investment (FDI, Equity investors, international/regional/development banks) in the organised Value Chain
g) Unexploited land and water resources with potential to produce more coffee especially in Northern Uganda
h) Availability of local fabricators, especially for processing equipment
i) Increasing alternative uses of coffee by-products from coffee husks and trees
4.2.4 Threatsa) Pests and diseases (e.g. coffee wilt disease, twig
borer etc.)
b) Fluctuating world coffee prices and unstable exchange rate regimes
c) Increased supply from large-volume producer countries e.g. Brazil and Vietnam
d) Inadequate infrastructure especially to effectively connect different VC actors located in different geographic areas
e) Unpredictable weather that affects productivity
f) Competition for land within high producing areas like the central region (competition with traditional crops and urbanisation) and
g) Low and reducing involvement of the youth in the subsector.
“I believe humans get a lot done, not because we’re smart, but because we have thumbs so we
can make coffee.”~Flash Rosenberg
DEVELOPMENT OF INCLUSIVE MARKETS IN AGRICULTURE AND TRADE (DIMAT) 33
5.1 Preliminary Outlines of Potential Interventions
Results from the SWOT analysis were used to identify potential areas of intervention as shown in the matrix of interventions (Table 5.1). These are classified into short term, medium term and long term interventions.
5.1.1 Proposed Short Term Interventions The interventions proposed for the short-term would be designed to enhance and to put into use the identified strengths in the coffee value chain in Uganda – so as to fully utilize opportunities available to the sub-sector.
There is need to improve, replicate or upscale value chain models that can integrate large numbers of organised producers. This can be achieved by directly linking them to off-takers that have strong linkages with big international importers and/or growing specialty markets for green coffee. The following are the proposed interventions to realise this.
a) Build capacity of producers to meet required quality and quantity requirements (Good Agricultural Practices [GAP], Farming as a Business [FaaB], adoption of VSLA/SILC models and upgrading of producer institutions).
b) Enhancement productivity: This will involve intensive and specialized extension services to coffee farmers on the best agronomic practices to improve coffee productivity. Agronomic and economic studies should be conducted to determine the highest productivity cropping system.
c) Enhance access to the right technologies for processing coffee as well as promotion of good processing and handling practices.
d) Enhance access to appropriate finance by providing incentives for financial institutions in collaboration with other service providers (e.g. collateral managers and meteorology agencies) to develop agricultural finance products to farmers, including insurance products. Banks and development finance institutions should be key targets in this endeavour, to ensure that products are conducive both to producers and exporters.
e) Enhance the nputs supply chain by ensuring the right planting materials e.g. through stronger collaboration with national research institutes and coffee seedling nursery entrepreneurs.
f) Avail regulatory services to producer groups to enable effective monitoring and enforcement of good practices
5. RECOMMENDATIONS
g) Enhance initiatives for increasing coffee consumption at national and regional levels, with the aim of improving market penetration of established brands of value-added coffee products produced in Uganda.
5.1.2 Proposed Medium Term InterventionsThe interventions proposed for the short to medium term would be designed to remove the identified weaknesses in the coffee value chain in Uganda – so as, again, to fully utilize opportunities available to the sub-sector. These interventions would also be designed to enhance and to put into use the identified strengths in the coffee value chain, so as to reduce and/or mitigate the effect of the threats to the coffee sub-sector
Multi-actor platforms for advocacy and driving the agenda for inclusive development and growth in the sector should be strengthened. Key areas of focus for these platforms should be in:
a) Supporting sustainable coffee production. This should be done while at the same time appreciating the potential adverse impacts of climate change on the subsector. The benefits of the coffee subsector are dependent on the stochastic form of biotic and abiotic constraints that could increase due to climate change. For full benefits to be realized in the sub-sector, Uganda should invest in adoption of climate change adaptation strategies to mitigate the negative effects of drought and floods.
b) Increasing production and productivity which could be done through control of coffee wilt disease, increased adoption of coffee in other areas and adoption of GAP and post-harvest handling practices.
c) Enhancing the development and dissemination of value-addition options for the sector and identifying investment opportunities for the industry.
d) Target long term competitiveness of the coffee sector vis a vis the global coffee industry through increased yields, quality, removal of trade barriers, increased access to appropriate finance.
5.1.3 Proposed Long Term InterventionThe interventions proposed for the long-term would be designed to remove the identified weaknesses in the coffee value chain in Uganda – so as, again, to reduce and/or mitigate the threats facing the sub-sector. The strategy is to re-orient the overall long term performance of the sub-sector towards greater competitiveness among other global players. At the same time it should aim at increasing the long term demand and consumption of locally developed and produced value-added coffee products that target the changing tastes and demographics of the national and regional population.

DEVELOPMENT OF INCLUSIVE MARKETS IN AGRICULTURE AND TRADE (DIMAT)34
VALUE CHAIN ANALYSIS (VCA) OF THE COFFEE SUb-SECTOR IN UGANDA
This will be achieved through enhancing public and private investments along the chain to drive future growth of the sub-sector in ways that upgrade the sub-sector to become globally competitive at all stages of the chain. Such investments would include:
a) Increase land under production through exploitation of irrigation and other technologies,
b) Enhance coffee research infrastructure and staffing,
c) Enhance infrastructure and services to support tertiary processing of coffee into products that are suitable for the regional market,
d) Enhance ‘last mile’ infrastructure supporting the sector across the chain and
e) Uptake competitive value addition practices at all levels of the value chain mainly by borrowing through, ‘learning-by-doing’, from other competitive countries with established and thriving coffee sub-sectors.

DEVELOPMENT OF INCLUSIVE MARKETS IN AGRICULTURE AND TRADE (DIMAT) 35
VALUE CHAIN ANALYSIS (VCA) OF THE COFFEE SUb-SECTOR IN UGANDA
Table 5.1: Matrix of Proposed Interventions
a) Sub-matrix of Strengths, Weaknesses and Opportunities
Factors INTERNAL to the Value Chain – (from Input Suppliers to Consumers)
Factors EXTERNAL to the Value Chain
STRENGTHS
a) The value chain has attracted support in development of various proven technologies e.g. through the establishment. center of excellence
b) Coffee is widely grown.c) Coffee keeps for long in
the ground.d) Coffee is cheaper than
its substitutes for both processing and consumption.
e) Coffee is a priority commodity in some regions e.g the Eastern and Northern region.
WEAKNESSES
a) Low quality standards of coffee products with respect to quality demanded by the market – ethanol and flour for industrial use (breweries)
b) High costs of operation along the chain especially investment costs for high quality processing
c) Inadequate availability of market information at users’ level, control of pests and diseases
d) Weak value chain institutions – low bulking, low access to markets
e) Unattractive economies of scale (production for processing due to competing uses for coffee)
f) High level of soil nutrient miningg) High prevalence of disease – brown
streak and low yielding varieties
OPPORTUNITIES
a) Processors (such as breweries and confectioneries) are keen to using coffee as a substitute.
b) High demand for coffee and its products in both Uganda and the export market
c) High potential for increasing coffee yield
d) Changing consumer preferences with urbanization and health conscious in the long term
Intervention Plan – Short Term (picking the low-hanging ripe fruits)
1. Expand the utilization of existing technologies, products and practices to exploit existing markets
2. Facilitate multiplication of improved Coffee varieties at community level
3. Strengthening market linkages between producers, traders, processors to ensure good quality of Coffee and Coffee products and their markets.
4. Formal lending to the Coffee marketing sector
Intervention Plan – Short - Medium Term (picking the low-hanging but not yet ripe fruits)
1. Develop more structured trade models e.g. contract farming to improve access to more non-traditional markets
2. Strengthen coffee value chain institutions such as BMOs to improve governance of the chain
3. Facilitate access to storage and post harvest handing systems to ensure quality of coffee products
“He was my cream, and I was his coffee -And when you poured us together, it was something”
~Josephine Baker

DEVELOPMENT OF INCLUSIVE MARKETS IN AGRICULTURE AND TRADE (DIMAT)36
VALUE CHAIN ANALYSIS (VCA) OF THE COFFEE SUb-SECTOR IN UGANDA
Factors INTERNAL to the Value Chain – (from Input Suppliers to Consumers)
Factors EXTERNAL to the Value Chain
STRENGTHS
f) The value chain has attracted support in development of various proven technologies e.g. through the establishment. center of excellence
g) Coffee is widely grown.h) Coffee keeps for long in
the ground.i) Coffee is cheaper than
its substitutes for both processing and consumption.
j) Coffee is a priority commodity in some regions e.g the Eastern and Northern region.
WEAKNESSES
d) Low quality standards of coffee products with respect to quality demanded by the market – ethanol and flour for industrial use (breweries)
e) High costs of operation along the chain especially investment costs for high quality processing
f) Inadequate availability of market information at users’ level, control of pests and diseases
g) Weak value chain institutions – low bulking, low access to markets
h) Unattractive economies of scale (production for processing due to competing uses for coffee)
i) High level of soil nutrient miningj) High prevalence of disease – brown
streak and low yielding varieties
THREATS
a) Attitude - Coffee is seen as a subsistence crop and is unattractive to private sector service providers e.g. banks and market information providers etc
b) Diseases are difficult to control
c) Flooding in high producing areas in the eastern region
d) Changing consumer preferences with urbanization in the short term
Intervention Plan –Medium Term (picking fruits high up the tree)
1) Strengthening of extension service provision to increase adoption of disease tolerant coffee varieties
2) Development of innovative and accessible financing models to encourage investment into the Coffee sub-sector
3) Development of mechanisms to deal with loods in prone areas including use of early warning systems.
Intervention Plan –LONG Term (grow new fruit tree)
1) Improvement of infrastructure like valley dams, roads to facilitate transportation of Coffee to urban markets, Strengthening of enforcement mechanisms for Coffee quality standards
2) Popularizing of alternative industrial uses of Coffee as a boost to production
b) Sub-matrix of Strengths, Weaknesses and Threats.

DEVELOPMENT OF INCLUSIVE MARKETS IN AGRICULTURE AND TRADE (DIMAT) 37
CHEMONICS 2010. Market Assessment and Baseline Study of Staple Foods: Country Report Uganda Chemonics & USAID.
CONSULT, C. 2007. Study to Strengthen the Marketing of Coffee Based on Building a Strong Value-Chain for the Coffee Industry in Uganda. National Planning Authority.
FAO 2004. The International Year of Coffee 2004. In: FAO (ed.). Rome: FAO.
FIT Uganda, 2006. Upland Coffee Sub Sector Study Report, Iganga district, Eastern Uganda
FIT 2011. Market Analysis Report 2011: Advancing Agribusiness in Uganda Through Knowledge. FIT Uganda.
Global Agricultural Information Network (2010); Uganda country Report, USDA 2010
GOU 2005. Focus on Wealth Creating: Sectors’ Approach to Growth and Prosperity.
Keyes, et al 2010:
KIJIMAL, Y., OTSUKA, K. & FAUTAKUCHI, K. 2008. The Development of Agricultural Markets in Sub-Saharan Africa: The Case of Coffee in Uganda.
MAAIF 2010. The Agricultural Sector Development Strategy and Investment Plan 2010/2011 -2014/15.
MAAIF. 2009. Uganda National Coffee Development Strategy. Entebbe: Ministry of Agriculture, Animal Industry and Fisheries.
MBEINE, E. & EBONG, J. 2006. Upland Coffee Sub-Sector Study Report, Iganga District, Eastern Uganda. FIT and VEDCO.
MUSIIME, O., TENYWA, M. M., MAJILIWA, M. J. G., LUFAFA, A., NANFUMBA, D., WASIGE, J., WOOMER, P. L. & KYONDA, M. 2005. Constraints to the Production of Coffee in Bugiri District. African Crop Science Journal, 7, 1495-1499.
NAADS 2005. Upland Coffee Production Manual. Kampala: NAADS.
NRI. & FOODNET 2002. Transaction Cost Analysis for Selected Agricultural Commodities: Study for the Plan for Modernisation of Agriculture. PMA.
ODOGOLA, W. 2006. Final Survey Report on the Status of Coffee Production, Processing and Marketing in Uganda. JICA.
OONYU, J. 2011. Upland Coffee Growing: A Potential Solution to Declining Crop Yields and the Degradation of the Doho Wetlands, Butaleja District, Uganda. African Journal of Agricultural Research, 6, 2774-2783.
OYEE, P. 2008. Upland Coffee Value Chain Finanacial Analysis. In: UGANDA, P. B. O. (ed.) Agriculture Finance Year Book 2008.
PMA 2009. Coffee Value Chains in the Acholi and Lango Sub-Regions. Kampala: Plan for the Modernisation of Agriculture Secretariat.
PMA 2011. Agricultural Financing Year Book 2010. Plan for the Modernisation of Agriculture & Bank of Uganda.
TRIAS 2012. Coffee Grain and Seed Sub Sector Analysis Report.
UBOS. & MAAIF. 2010. Uganda Census of Agriculture 2008/2009. Kampala: Uganda Bureau of Statistics and Ministry of Agriculture, Animal Industry and Fisheries.
UCDA, 2012. Coffee processing. [Online] Available at: < http://www.ugandacoffee.org/index.php?page&a=28> [Accessed 29 August 2012].
UEPB 2008. Cereal and Grain Value Added Products: Product Profile. Uganda Export Promotion Board.
USAID, 2008. Stabilization-Driven Value Chain Analysis of Coffee, Groundnuts and Maize in Northern Uganda
WFP, 2006. Restructuring Uganda Coffee Industry
World Bank, 2011. Ugandan Coffee Supply Chain Risk assessment. [Online] Available at: <http://www.agriskmanagementforum.org/sites/agriskmanagementforum.org/files/Documents/UgandaCoffeeSupply10-final-web.pdf> [Accessed 29 August 2012].
6. REFERENCES

DEVELOPMENT OF INCLUSIVE MARKETS IN AGRICULTURE AND TRADE (DIMAT)38
VALUE CHAIN ANALYSIS (VCA) OF THE COFFEE SUb-SECTOR IN UGANDA
APPENDIX 1: DETAILED LIST OF CONSTRAINTS AND OPPORTUNITIES AS IDENTIFIED bY STAKEHOLDERS INTERVIEWED
Opportunities
Inputs Suppliers Producers Village assemblers Processors Traders
Availability of new technologies
Conducive climatic conditions
Available financial services
Ready and rapidly growing market
High demand for coffee
Available financial services
Employing better processing technologies to boost their production
Good relations with farmers, especially where pre-financing is possible
A draft seed policy Unexploited land and water resources
Ability to offer competitive market prices to their suppliers
Available financial services
Developed seed trade- Existence of Uganda Seed Trade Association
The producers have a high level of control of the coffee products along the chain
Increasing demand for better quality coffee
Investing in coffee trading in the international markets
Ability to export coffee directly to the final buyers
East African common market presents a big opportunity
Constraints
Inputs Suppliers Producers Village assemblers Processors Traders
Lack of awareness of farmers about improved inputs
Pests and diseases, e.g. twig borers, CWD, etc
Inadequate storage facilities
Inadequate storage facilities
Unreliable/ untimely and limited supply from the suppliers
Unfavorable financial products
Limited access to ready markets Limited capacity to pre-
finance suppliers
Limited capacity to pre-finance suppliers
Price fluctuations
Adulterated products in the market which are cheap
Inadequate postharvest handling equipments such as tarpaulins for drying. In some cases, the available tarpaulins are used for covering the grains against rain, instead of used to dry coffee
Unreliable supply- unstructured trade
Inadequate drying facilities and technologies
Poor infrastructure especially roads
Low commitment to pre-financing
Poor harvesting practices, e.g. harvesting immature coffee
Inadequate drying facilities and technologies
Poor quality coffee suppliers which is either not dry enough or contain a lot of foreign materials
Limited supply of coffee varieties

DEVELOPMENT OF INCLUSIVE MARKETS IN AGRICULTURE AND TRADE (DIMAT) 39
VALUE CHAIN ANALYSIS (VCA) OF THE COFFEE SUb-SECTOR IN UGANDA
Constraints
Low buying/negotiation power of the farmers
Poor quality coffeeLow volumes supplied
High transport costs
Use of faulty weighing scales
Limited capacity to pre-finance suppliers
High operational costs
High competition from each other
Pcoffee fluctuation Limited collective marketing
High competition from each other
Limited business management skills, eg record keeping
High transport costs Inadequate grading facilities
Lack of enough working capital, which mainly caused by unfavourable financial products offered by lending institutions
Poor road infrastructure
Unfavourable financial products, e.g. long-term financing is limited to 5 years and it is associated with bureaucratic and politicized tendencies
For export traders, dollar volatility and scarcity is hindering their opportunity to exploit premium price coffee for FOB
Poor farming methods leading to low productivity
do not have labs to check the quality of the processed coffee
Erratic weather Conditions
Poor water management
Limited access to finance and unfavourable financial products, especially high interest rates
Limited access of improved inputs, especially seedlings
Limited access to specialized extension services and BDS
Weak organized farmer groups
Soil exhaustion

DEVELOPMENT OF INCLUSIVE MARKETS IN AGRICULTURE AND TRADE (DIMAT)40
VALUE CHAIN ANALYSIS (VCA) OF THE COFFEE SUb-SECTOR IN UGANDA
APPENDIX 2: RECOMMENDATIONS AND SUGGESTED INTERVENTIONS MADE bY STAKEHOLDERS
Producers•The major recommendations suggested by farmer groups to address the challenges that they are currently facing
include:
•Linking of farmers to financial or credit institutions (in order for them to be able to meet the necessary costs of production. For example, promotion of VSLAs model that has worked successfully in Nigeria and Uganda. In addition, there is a need to upgrade regional cooperatives, for example in Busia, Barclays bank has signed an MOU with some of the VSLAs, in which, members of these VSLAs can access bigger loans without collaterals.
•With regards to unfavourable financial products, policy framework needs to be developed to provide incentives to the banks to develop and provide agricultural finance to producers
•Training and capacity building of the farmers
•Provision of improved seeds and agrochemicals at a free or subsidized cost in an attempt to increase coffee productivity
•Provision of market information to the coffee farmers
•Government should intervene in the pricing of agriculture produce to ensure that farmers are not over exploited by the traders
•Supporting of farmers with drying materials such as tarpaulins in an attempt to lower postharvest losses
•Supporting of farmers with storage facilities as this would also aid in lowering the postharvest losses incurred
•Enabling farmer groups to access extension services throughout the growing season of coffee
•Government needs to provide subsidies to farmer
•Government to improve the poor road infrastructures especially in the rural areas
•Supporting farmers to access improved farm machinery
•Linking of farmers to good and reliable markets for their coffee
•Support farmers with irrigation facilities
•Buyers should pay in time for the coffee taken on credit
•Coffee traders should be given tax holidays by the government
•Linking coffee farmers to research institutions dealing in coffee to offer continued advice on coffee agronomic practices
•Organization of farmers into groups in order to access crop insurance. For example, UAP has worked well in Kenya using the same approach.
ProcessorsSeveral recommendations were given by the interviewed respondents. They include:
•Government should reduce taxes
•Coffee value chain Stakeholders should provide international market linkages
•Bank of Uganda should control borrowing interest rates
•Government should assist in importing improved seeds
•Government should leverage financial institutions to provide financial support to small and medium coffee processors
•Coffee value chain stakeholders should sensitize farmers on quality management
•There is a need to revive the development of finance institution to provide long-term finance
•UCDA and government should put a mechanism to ensure that all the processed coffee meet the set standards and requirements

DEVELOPMENT OF INCLUSIVE MARKETS IN AGRICULTURE AND TRADE (DIMAT) 41
VALUE CHAIN ANALYSIS (VCA) OF THE COFFEE SUb-SECTOR IN UGANDA
Traders•The traders gave the following recommendations
•Farmers should be trained on improved production and post harvest handling
•Government should regulate prices
•Repair roads
•Build modern storage facilities
•Regulations to sell to only registered traders
•Government should distribute more improved seedlings
•Financial support is needed in terms of grants or loans with low interest rate. Several financing models can be researched to give a light on setting a model that would work. For example, 70% of traders in Kagera use warehouse financing system.
•For the case of exporters, government should provide cheaper sources of dollar financing for onward lending through commercial banks
•Government should strengthen cooperatives
•Farmers be encouraged to grow more coffee
•Provide competitive market prices
•Create more markets
•Stabilize exchange rate for companies to engage in contractual arrangements
•Provision of tarpaulins and monitoring of their quality
•Reduction in cost of packaging materials
•More market developments outside Uganda
•Traders to form an association
RetailersSeveral interventions were recommended by the retailers in an attempt to boost coffee value chain. These recommendations are listed below:
•The need for government to regulate prices
•Stakeholders should step in to improve market information systems
•Farmers should be supported in growing more coffee using modern technologies
•More open markets should be created
•Financial institutions should introduce more affordable financial products
•Suppliers should build strong relationship with their customers

DEVELOPMENT OF INCLUSIVE MARKETS IN AGRICULTURE AND TRADE (DIMAT)42
VALUE CHAIN ANALYSIS (VCA) OF THE COFFEE SUb-SECTOR IN UGANDA
APPENDIX 3: PRODUCER ENTERPRISES WILLING TO ENTER INTO CONTRACTUAL AGREEMENTS
Producer entities willing to enter into contractual agreements with buyers
Farmer group Sub county District
Kanywa Twekembe Cooperative Society Buwunga Masaka
Kakyolu Cooperative Sacco Kalungu Masaka
Kyamamukaka Farmers Association Kyamamukaka Masaka
Kabonera Coffee Farmer Association Kabonera Masaka
Kingo Farmers Cooperative Society Lwengo Masaka
Rulengye Competent Development Group Bugamba/Rwampara Mbarara
Nabusondo POA Farmers Group Mubende
Kassanda Coffee Growers Company Ltd Kassanda Mubende
Kamaga Coffee Farmers Association Mubende
Bumbare 1 Tukwatanise Bumbaire Bushenyi
Kanyantama Twetungure Group Nyabubaare Bushenyi
Nyabubaare Farmers Association Nyabubaare Bushenyi
Kasambya Farmers Group Kangulumira Kayunga
Kyangukulwamukwama Kangulumira Kayunga
Magala Tugenda Mumaso Co-op Society Nazigo Kayunga
Tukoje Bukozi Kayunga Kayunga
Agali Awamu Farmers Group Nazigo Kayunga
Nazigo Farmers Association Nazigo Kayunga
Kawonawo Growers Co-op Society Nazigo Kayunga
Buyore Produce and Marketing Co-op Society Kayunga Kayunga
Kyabashenyi Bakyala Tukole Bwongyera Ntungamo
Bulusambu Ibikhisa Group Busoba Mbale
Makhai Miracle Farmers Group Busoba Mbale
Budwale Coffee Acup Budwale Mbale

DEVELOPMENT OF INCLUSIVE MARKETS IN AGRICULTURE AND TRADE (DIMAT) 43
VALUE CHAIN ANALYSIS (VCA) OF THE COFFEE SUb-SECTOR IN UGANDA
APPENDIX 4: INVENTORY OF EXPORTERS AND bUYERS OF UGANDA’S COFFEE
Ugacof (U) Ltd Abaco international
Kyagalanyi Coffee Ltd. Olam International
Olam (U) Ltd Sucafina
Kawacom (U) Ltd Ecom Agro industrial
Ibero (U) Ltd Bernhard Rothfos
Savannah Commodities Ltd. Volcafe
Job Coffee Ltd. Coex Coffee
Kampala Domestic Stores Aldwami
Great Lakes (U) Ltd. Icona Café
Panafric Impex Tata Coffee
Nakana Coffee Factory Strauss Commodities
Penform Trading company Ltd Socadec
Kamba Petroleum Coffee Services
Armajaro Coffee Exporters Ltd Armajaro
Kitasha Coffee Buyers Ltd Decotrade
Lakeland Holdings Ltd. Bercher
Ankole Coffee Producers Coop Supremo
Risala Ltd. Africa Tea and Coffee
LD Commodities Louis Dreyfus
Mbale Importers & Exporters Guzman
Gumutindo Hamburg Coffee
Wabulungu Multi-purpose
Kaweri Coffee Plantation Ltd
Bakwanye Trading Company Ltd
Coffee Services Ltd
Ankole Coffee Processors Ltd.
Bukonzo Joint Cooperative
Gatto Estates
Gatto Estates


“At trading level, local traders (popularly known as middlemen and/or assemblers) purchase from individual farmers and farmer groups. Most of these traders sell to other big traders in major trading towns.
However, traders often fail to get the required amount and quality of coffee”
United Nations Development ProgrammePlot 11, Yusuf Lule Road
P.O. Box 7184, Kampala, UgandaTelephone: +256 417 112 128 Fax: +256 414 344 801