Development of Fluency, Accuracy, and Complexity in...
35
Journal of Teaching Language Skills (JTLS) 35(4), Winter 2017, ISSN: 2008-8191 pp. 1-35 Development of Fluency, Accuracy, and Complexity in Productive Skills of EFL learners across Gender and Proficiency: A Chaos Complexity Approach Seyyed Taher Alavi PhD Student Urmia University [email protected] Karim Sadeghi Associate Professor Urmia University [email protected] Abstract This study was an attempt to investigate the developmental rate of fluency, accuracy and complexity among 12 EFL learners within the framework of chaos complexity theory. To carry out this study, 6 female and 6 male participants in two levels of proficiency (pre-and upper-intermediate) were put in two classes taught by the same teacher and following the same course. Every two months (for a period of four months) they were asked to write a narrative using the pictorial sequence of a story, and they were also asked to tell the same story orally after three days. Their productions were analyzed for fluency, accuracy and complexity (lexical and grammatical). The results, compared inter and inrta-individually, revealed that there was no common pattern of development among different learners with different proficiency or gender. A closer examination of the oral and written productions of these learners showed that the emergence of complexity, fluency, and accuracy could be seen as a system adapting to a changing context, in which the language resources of each individual were uniquely transformed through use and in which chaos, dynamicity, unpredictability, and self-organization were clearly observed in the participants’ productions. Keywords: chaos complexity, fluency, accuracy, complexity, proficiency, oral and written production Received: 12/11/2016 Accepted: 31/01/2017 Corresponding author
Transcript of Development of Fluency, Accuracy, and Complexity in...
Journal of Teaching Language Skills (JTLS) 35(4), Winter 2017, ISSN: 2008-8191
pp. 1-35
Development of Fluency, Accuracy, and Complexity in Productive Skills of EFL learners across Gender and
Proficiency: A Chaos Complexity Approach
Seyyed Taher Alavi PhD Student
Urmia University [email protected]
Karim Sadeghi Associate Professor Urmia University
Abstract
This study was an attempt to investigate the developmental rate of fluency, accuracy and complexity among 12 EFL learners within the framework of chaos complexity theory. To carry out this study, 6 female and 6 male participants in two levels of proficiency (pre-and upper-intermediate) were put in two classes taught by the same teacher and following the same course. Every two months (for a period of four months) they were asked to write a narrative using the pictorial sequence of a story, and they were also asked to tell the same story orally after three days. Their productions were analyzed for fluency, accuracy and complexity (lexical and grammatical). The results, compared inter and inrta-individually, revealed that there was no common pattern of development among different learners with different proficiency or gender. A closer examination of the oral and written productions of these learners showed that the emergence of complexity, fluency, and accuracy could be seen as a system adapting to a changing context, in which the language resources of each individual were uniquely transformed through use and in which chaos, dynamicity, unpredictability, and self-organization were clearly observed in the participants’ productions.
Keywords: chaos complexity, fluency, accuracy, complexity, proficiency, oral and written production
Received: 12/11/2016 Accepted: 31/01/2017 Corresponding author

Journal of Teaching Language Skills, 35(4), Winter 2017 2
Complex systems theory is a relatively new paradigm to understand systems behavior. It was originally developed in the fields of mathematics and physical sciences. Complex systems theory has also been widely proposed as an important new way to look at social and cognitive sciences, including language learning. Chaos complexity theory was introduced into the area of inquiry in applied linguistics by Diane Larsen-Freeman (1997) of the University of Michigan. The theory holds that all the constructs in the system of language learning are closely interlinked (directly or indirectly) and any small variation on any of these variables will lead to some changes in all the variables involved. This system is dynamic (meaning that it always changes its size and shape) and developmental. This system is always doing self-organization (putting itself into an order having received some changes due to some external effects). An important feature of the system concerns the way self-organization is practically realized. Steenbeek and van Geert (2015) argue that a salient part of the development is the increase in the order or structure. However, it is not easy to show the way this structure moves beyond the structure of the input (the teaching and learning environment). They also argue that poverty-of-the-stimulus is a strong support for the fact that language acquisition is a process of self-organization.
Larsen-Freeman and Cameron (2008) make an argument on the concept of complex saying that complex does not mean complicated. The big number of elements involved in one system does not make it complex. Rather it is the behavior of a complex system which results from the interaction of its components (p. 2). They further state that the interaction of elements in a complex system leads to the emergence of new behavior and self-organization. Because of the interactions among the elements, they act in response to the feedback they receive, which itself leads to change and adaptation. That is the reason why sometimes complex systems are also called adaptive systems.
As cited in Larsen-Freeman (1997, p. 142) theory is based on certain principles listed below.

DEVELOPMENT OF FLUENCY, ACCURACY 3
1) Dynamic or changing over time, process rather than state. 2) Complex or having many parts, constantly acting and interacting. 3) Nonlinear or effect is disproportionate to the cause. 4) Chaotic or a deep, coherent structure within apparent randomness. 5) Unpredictable or cannot forecast future states. 6) Sensitive to initial conditions or a tiny change can have a vast effect. 7) Open or energy/information can flow in or out. 8) Self-organizing or a structure/pattern emerges as components interact. 9) Feedback sensitive or feedback is incorporated into behavior. 10) Adaptive or optimizes itself according to environment. 11) Strange attractor or global pattern but unpredictable details. 12) Fractal or a pattern that repeats itself at different scales.
Assumptions behind developmental ladder and dynamic view Larsen-Freeman (2006, pp. 590-591) lists the following assumptions for the metaphor of developmental ladder in Second Language Acquisition (SLA). 1) SLA is a process of increasing conformity to a uniform target
language. 2) There are discrete stages through which learners traverse along the
way. 3) Progress can best be defined in terms of one dimension of one
subsystem. 4) Language is purely a cognitive resource. 5) Learners move through the process in a fairly consistent manner.
However, the dynamic view considers other assumptions as underlying complex, dynamic systems, which Larsen-Freeman (2006) introduces as the underlying principles in chaos complexity theory. First, language is not fixed, but is rather a dynamic system; language evolves and changes in the dynamics of language use between and among individuals. Second, although progress in SLA may be viewed as the degree to which a language learner’s interlanguage aligns with the target language, there will never be complete convergence between the two
Journal of Teaching Language Skills, 35(4), Winter 2017 4
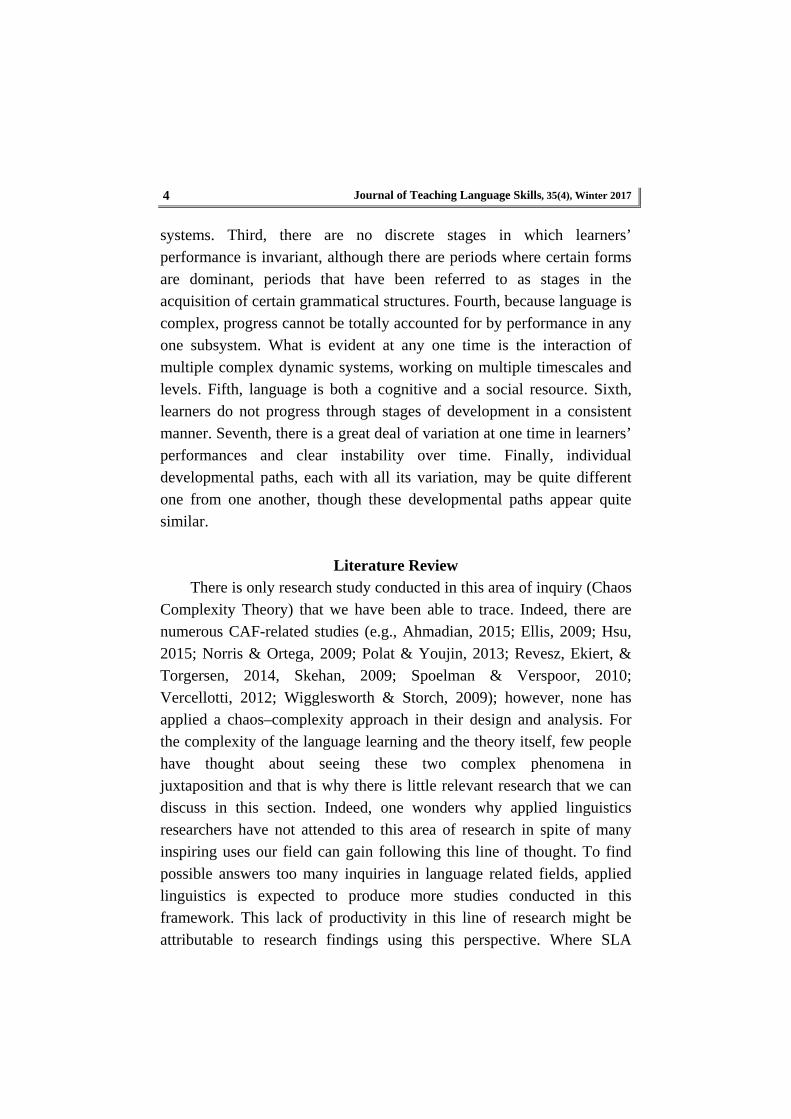
systems. Third, there are no discrete stages in which learners’ performance is invariant, although there are periods where certain forms are dominant, periods that have been referred to as stages in the acquisition of certain grammatical structures. Fourth, because language is complex, progress cannot be totally accounted for by performance in any one subsystem. What is evident at any one time is the interaction of multiple complex dynamic systems, working on multiple timescales and levels. Fifth, language is both a cognitive and a social resource. Sixth, learners do not progress through stages of development in a consistent manner. Seventh, there is a great deal of variation at one time in learners’ performances and clear instability over time. Finally, individual developmental paths, each with all its variation, may be quite different one from one another, though these developmental paths appear quite similar.
Literature Review There is only research study conducted in this area of inquiry (Chaos
Complexity Theory) that we have been able to trace. Indeed, there are numerous CAF-related studies (e.g., Ahmadian, 2015; Ellis, 2009; Hsu, 2015; Norris & Ortega, 2009; Polat & Youjin, 2013; Revesz, Ekiert, & Torgersen, 2014, Skehan, 2009; Spoelman & Verspoor, 2010; Vercellotti, 2012; Wigglesworth & Storch, 2009); however, none has applied a chaos–complexity approach in their design and analysis. For the complexity of the language learning and the theory itself, few people have thought about seeing these two complex phenomena in juxtaposition and that is why there is little relevant research that we can discuss in this section. Indeed, one wonders why applied linguistics researchers have not attended to this area of research in spite of many inspiring uses our field can gain following this line of thought. To find possible answers too many inquiries in language related fields, applied linguistics is expected to produce more studies conducted in this framework. This lack of productivity in this line of research might be attributable to research findings using this perspective. Where SLA
DEVELOPMENT OF FLUENCY, ACCURACY 5
researchers are normally after finding a pattern in the development of different learners’ language knowledge as well as issues of generalizability, this perspective is claiming an opposite view with no pattern and development in mind and aims for particularization. Principles in Chaos Complexity Theory are more likely to lead to new insights in our field if it is introduced into the current research paradigm in applied linguistics. It is high time we moved beyond the simple averaging (applied in most statistical operations as in t-test, ANOVA), which stops any further explorations into the data obtained from individual participants where many implicit features are hidden and usually are left unexplored in SLA.
Larsen-Freeman (2006), as a pioneer in this new approach of research that she herself introduced into applied linguistics, initiated a study where she explored the dynamic nature of development in the accuracy, fluency and complexity of five Chinese English as a Second Language (ESL) learners’ language repertoire in American context. Within the framework of dynamical description, she employed a time series design in her study where she checked the writing and speaking of the participants in six subsequent months within a repeated task. Her study revealed what she always emphasized in the assumptions of chaos complexity theory. The cases in her study showed fluctuations in their development without any pattern expected in predictable stages of developmental ladder model. Some participants’ accuracy developed more than that of the others, though they all were taking the same courses. Some participants’ fluency improved better than that of the other classmates and this was also observed in the complexity of the participants’ expressive skills. In sum, the quantitative analyses revealed that while overall the group was making progress, at least if progress is defined as becoming more fluent, accurate, and complex from a target-language perspective, each member of the group was following a somewhat different path. She argues that these differences in the fluency and accuracy of the participants can be accounted for within the framework of chaos complexity theory in that each individual is
Journal of Teaching Language Skills, 35(4), Winter 2017 6
following his /her own way of development. To further complement findings of the earlier studies, it is required to delve into the nature of this new approach focusing on different proficiency levels, and different genders in different contexts. As the focus of earlier SLA studies has been on seeking common patterns in development (which this new approach aims to refute), it is needed to explore how variance in gender, proficiency and context will substantiate earlier findings.
The following research questions were explored in this study: 1) Are there any significant differences in the development of fluency,
accuracy, grammatical complexity and lexical complexity in the oral production of upper/lower intermediate EFL learners across genders?
2) Are there any significant differences in the development of fluency, accuracy, grammatical complexity and lexical complexity in the written production of upper/lower intermediate EFL learners across genders?
Method For a dynamical description, it is desirable to use a time-series
design that is a series of observations of participants that are frequent enough to capture the relevant properties underlying the developmental process (Van Geert & Steenbeek, 2005). Following this basic design, we had the students perform the same task (orally and in written form) at different points in time.
Participants Our participants were 12 EFL learners (15 to 17 years old) in
different language institutes: 6 participants at the upper intermediate level (3 male and 3 female) and 6 participants at the pre-intermediate level (3 male and 3 female). A time series design was used to investigate the possible emergence and developmental patterns language learners with different proficiency and gender would follow.
A short description of participants’ profiles follows next (where abbreviations stand for their initials):

DEVELOPMENT OF FLUENCY, ACCURACY 7
Table 1
Participants’ Profiles Name Age Gender Proficiency
U-M M-M F-T L-M M-A A-S S-B R-A A-H-G A-GH M-R A-H
15 17 15 17 17 17 17 16 15 15 17 15
Female Female Female Female Female Female Male Male Male Male Male Male
Upper Intermediate Upper Intermediate Upper Intermediate Pre-Intermediate Pre-intermediate Pre-Intermediate Upper Intermediate Upper Intermediate Upper Intermediate Pre-Intermediate Pre-Intermediate Pre-Intermediate
Instruments Proficiency test. An institutional version of paper-based Test of
English as a Foreign Language (TOEFL) was given to all the participants prior to the study as a criterion to select homogeneous participants and to measure the learners’ English language proficiency. The test included a listening section with 30 items, a structure and written expression section with 40 items and a reading section with 30 items. Based on the result of the test, six upper and six lower intermediate level students, half from each gender category, checked against the (TOEFL Equivalency Table, 2016) and Table of levels (ESOL EXTRAS, 2016) were selected. The pre-intermediate participants’ TOEFL test scores ranged from 45 to 49 and upper intermediate ones ranged from 70 to 80 in IBT TOEFL test.
Written and oral task. Each participant was asked to write a story based on the pictorial sequence of events. The story, which had a romantic theme, was about Titanic ship. This story was chosen mainly due to the interest and familiarity of its context to the participants. As productive skills were the main concern of the study, both written and oral performances were elicited. That pictorial sequence of events was the same for all the participants. They did not consult a dictionary in

Journal of Teaching Language Skills, 35(4), Winter 2017 8
writing or telling the story. Three days after each writing session, they told the story using the same pictorial sequence of events orally. They were asked to perform the oral tasks three days later so that the effect of the written performance could not affect the oral performance and identical renderings in both performances would not be produced. This narrative was the same in each of the three times of assessment. Both renditions were untimed. Furthermore, the participants received no feedback on their performance. The rationale and logic behind using the same narrative was to compare the same idea units in three times of measurement and to investigate how these idea units developed over time.
Procedures
First a TOEFL test was administered to all the language learners (100 students, male and female) in all language institutes of the study city (Naghade) to select the intended number of homogeneous participants. TOEFL was used as an appropriate device for this case selection procedure on the assumption that it could distinguish candidates with beginner, middle and advanced proficiency levels. The participants’ language test results were checked against the (TOEFL Equivalency Table) for the equivalency of different test types. CBT and IBT TOEFL scores can be compared with each other using that table. Test results were checked against another table (ESOL EXTRAS, 2016) for the (pre- and upper) intermediate level pick up. This table clearly isolates the pre- and upper intermediate students from each other based on their TOEFL scores. As there was a study conducted by Larsen-Freeman (2007) on intermediate level students, and our interest in understanding whether there would be any interaction between development and proficiency level, pre- and upper intermediate students were selected in this study.
The selected pre- and upper intermediate participants were shown a pictorial sequence of events showing a story to write a narrative based on those pictures in January 2016. After three days, they were requested to tell the same story orally (which was recorded). After two months, the
DEVELOPMENT OF FLUENCY, ACCURACY 9
participants were asked to write a story about the same pictures once more. After three days, they were again asked to tell the same story orally. After two more months, in May, they were instructed to write a story about the same pictures once more and tell the story orally (after three days). This pattern of data elicitation made the inter-individual and intra-individual comparisons possible for the researchers.
This study was intended to trace the quantitative changes to the same idea units in the three productions of the participants within four months. At the end of the final measurement, all three measurements were arrayed side by side for each learner and explored the developmental process each learner had followed. Each learner’s productive language skills (speaking and writing) were measured through telling a story and writing the same story and were analyzed for the accuracy, grammatical, and vocabulary complexity, as well as fluency three times. The intra-individual variability aimed to check for the possible developmental changes in the individual learner’s production over time. The inter-individual variability aimed at comparing the development of each individuals’ production with that of the other individuals. While this study was in progress, the participating students attended their normal language classes (three ninety-minute sessions a week following communicative approach as a dominant method of instruction in that institute with Headway series (Soars, 2011) as the main textbooks) and the intervention did not interrupt in their normal language learning activities at their language schools. The participants had been attending that language institute for more than 3 successive years since the beginning of their language schooling in that institute.
Data Analysis The TOEFL tests (checked for the reliability using KR21 reliability)
were scored to select the intended group. The obtained data (oral and written) were transcribed and typed into word format in PC for the ease in data analysis (see Table 2 for a sample). As it was needed to track the traces of quantitative and qualitative development in the participants
Journal of Teaching Language Skills, 35(4), Winter 2017 10
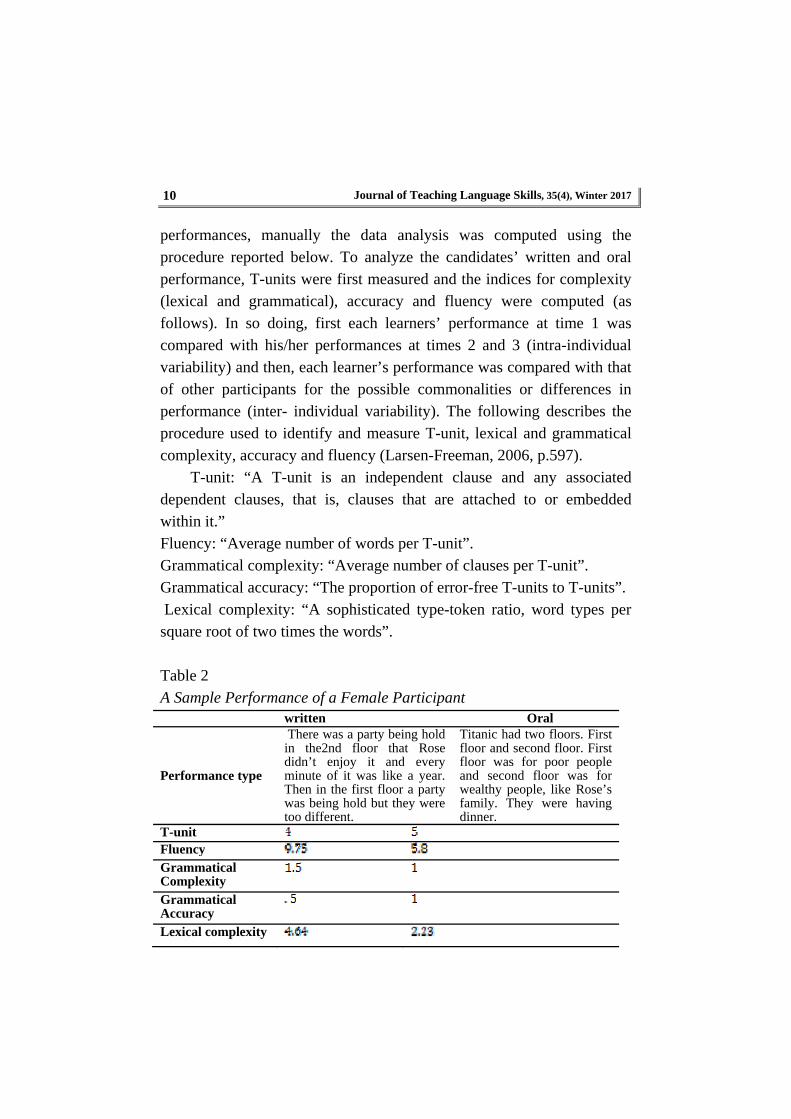
performances, manually the data analysis was computed using the procedure reported below. To analyze the candidates’ written and oral performance, T-units were first measured and the indices for complexity (lexical and grammatical), accuracy and fluency were computed (as follows). In so doing, first each learners’ performance at time 1 was compared with his/her performances at times 2 and 3 (intra-individual variability) and then, each learner’s performance was compared with that of other participants for the possible commonalities or differences in performance (inter- individual variability). The following describes the procedure used to identify and measure T-unit, lexical and grammatical complexity, accuracy and fluency (Larsen-Freeman, 2006, p.597).
T-unit: “A T-unit is an independent clause and any associated dependent clauses, that is, clauses that are attached to or embedded within it.” Fluency: “Average number of words per T-unit”. Grammatical complexity: “Average number of clauses per T-unit”. Grammatical accuracy: “The proportion of error-free T-units to T-units”. Lexical complexity: “A sophisticated type-token ratio, word types per square root of two times the words”. Table 2
A Sample Performance of a Female Participant written Oral
Performance type
There was a party being hold in the2nd floor that Rose didn’t enjoy it and every minute of it was like a year. Then in the first floor a party was being hold but they were too different.
Titanic had two floors. First floor and second floor. First floor was for poor people and second floor was for wealthy people, like Rose’s family. They were having dinner.
T-unit Fluency Grammatical Complexity
Grammatical Accuracy
Lexical complexity
DEVELOPMENT OF FLUENCY, ACCURACY 11
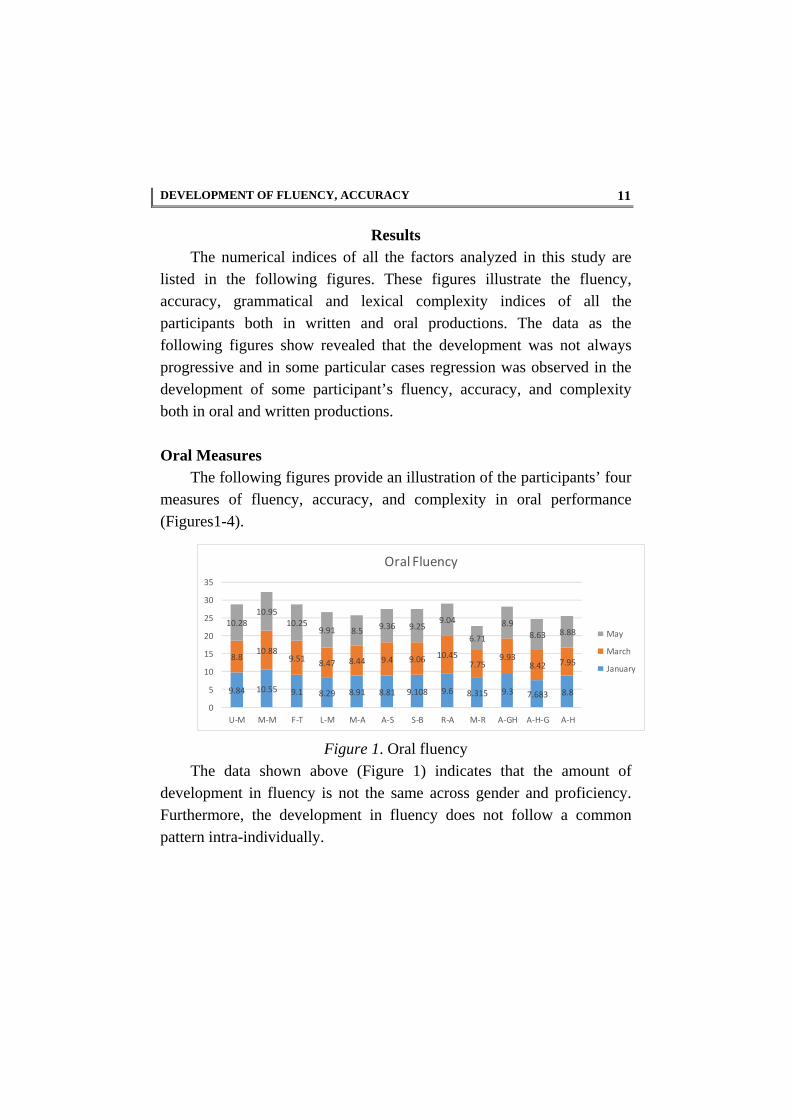
Results The numerical indices of all the factors analyzed in this study are
listed in the following figures. These figures illustrate the fluency, accuracy, grammatical and lexical complexity indices of all the participants both in written and oral productions. The data as the following figures show revealed that the development was not always progressive and in some particular cases regression was observed in the development of some participant’s fluency, accuracy, and complexity both in oral and written productions.
Oral Measures
The following figures provide an illustration of the participants’ four measures of fluency, accuracy, and complexity in oral performance (Figures1-4).
Figure 1. Oral fluency The data shown above (Figure 1) indicates that the amount of
development in fluency is not the same across gender and proficiency. Furthermore, the development in fluency does not follow a common pattern intra-individually.
9.84 10.55 9.1 8.29 8.91 8.81 9.108 9.6 8.315 9.3 7.683 8.8
8.810.88
9.518.47 8.44 9.4 9.06 10.45
7.759.93
8.42 7.95
10.2810.95
10.259.91 8.5 9.36 9.25
9.04
6.71
8.9
8.63 8.88
0
5
10
15
20
25
30
35
U‐M M‐M F‐T L‐M M‐A A‐S S‐B R‐A M‐R A‐GH A‐H‐G A‐H
Oral Fluency
May
March
January
Journal of Teaching Language Skills, 35(4), Winter 2017 12
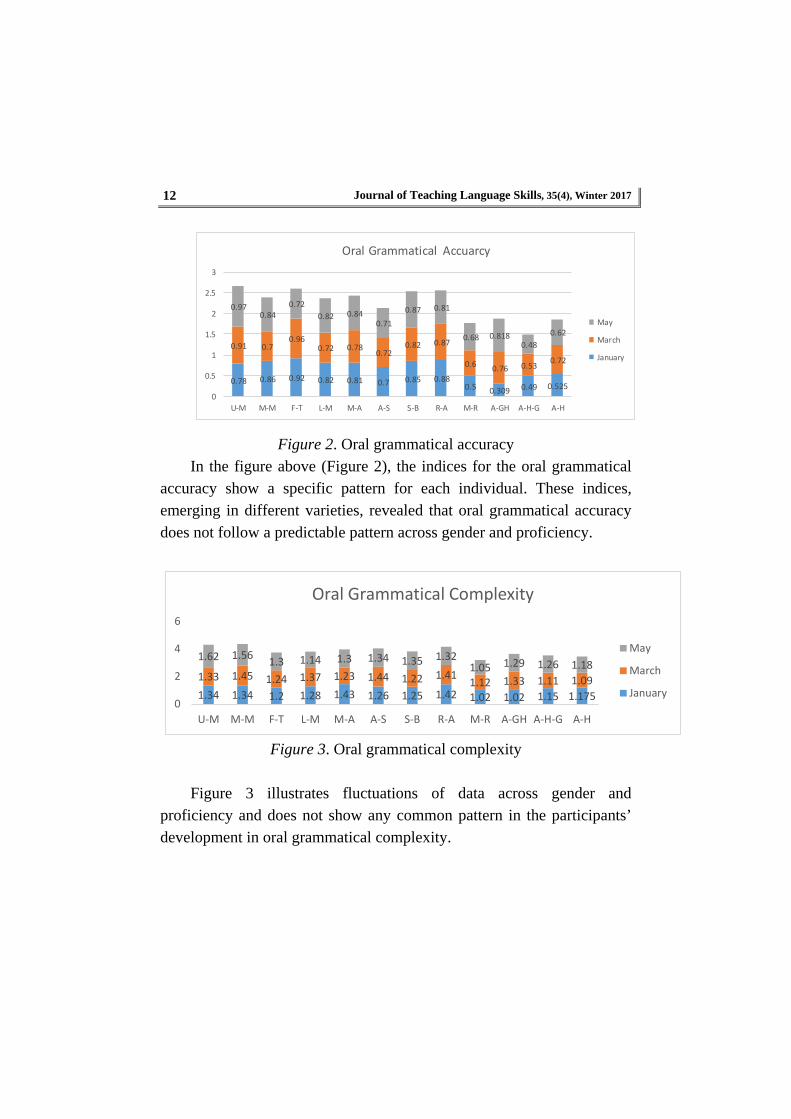
Figure 2. Oral grammatical accuracy In the figure above (Figure 2), the indices for the oral grammatical
accuracy show a specific pattern for each individual. These indices, emerging in different varieties, revealed that oral grammatical accuracy does not follow a predictable pattern across gender and proficiency.
1.34 1.34 1.2 1.28 1.43 1.26 1.25 1.42 1.02 1.02 1.15 1.175
1.33 1.45 1.24 1.37 1.23 1.44 1.22 1.411.12 1.33 1.11 1.09
1.62 1.561.3 1.14 1.3 1.34 1.35 1.32
1.05 1.29 1.26 1.18
0
2
4
6
U‐M M‐M F‐T L‐M M‐A A‐S S‐B R‐A M‐R A‐GH A‐H‐G A‐H
Oral Grammatical Complexity
May
March
January
Figure 3. Oral grammatical complexity
Figure 3 illustrates fluctuations of data across gender and proficiency and does not show any common pattern in the participants’ development in oral grammatical complexity.
0.78 0.86 0.92 0.82 0.81 0.7 0.85 0.880.5 0.309 0.49 0.525
0.91 0.70.96
0.72 0.780.72
0.82 0.87
0.60.76 0.53
0.72
0.970.84
0.72
0.82 0.840.71
0.87 0.81
0.68 0.8180.48
0.62
0
0.5
1
1.5
2
2.5
3
U‐M M‐M F‐T L‐M M‐A A‐S S‐B R‐A M‐R A‐GH A‐H‐G A‐H
Oral Grammatical Accuarcy
May
March
January
DEVELOPMENT OF FLUENCY, ACCURACY 13
6.51 6.6 5.3 3.78 5.2 6.4 4.73 5.4 5.01 4.32 4.28 4.29
5.76 4.51 7.06 7.5 6.397.38
5.25 5.62 5.84 4.99 4.78 4.97
5.96 5.5 4.95 5.73 5.95
5.5 4.91 5.184.1 3.38 4.05
0
5
10
15
20
U‐M M‐M F‐T L‐M M‐A A‐S S‐B R‐A M‐R A‐GH A‐H‐G A‐H
Oral Lexical Complexity
May
March
January
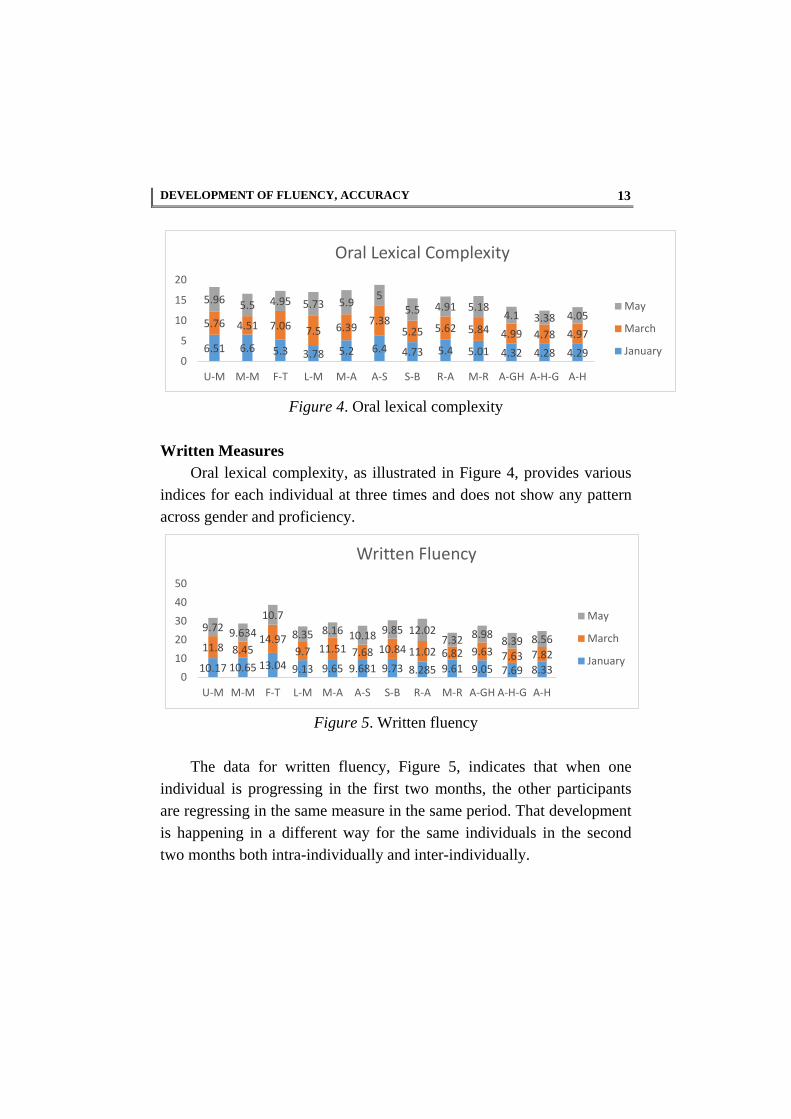
Figure 4. Oral lexical complexity
Written Measures
Oral lexical complexity, as illustrated in Figure 4, provides various indices for each individual at three times and does not show any pattern across gender and proficiency.
10.17 10.65 13.04 9.13 9.65 9.681 9.73 8.285 9.61 9.05 7.69 8.33
11.8 8.4514.97
9.7 11.51 7.68 10.84 11.02 6.82 9.63 7.63 7.82
9.72 9.634
10.7
8.35 8.16 10.18 9.85 12.027.32 8.98
8.39 8.56
0
10
20
30
40
50
U‐M M‐M F‐T L‐M M‐A A‐S S‐B R‐A M‐R A‐GH A‐H‐G A‐H
Written Fluency
May
March
January
Figure 5. Written fluency
The data for written fluency, Figure 5, indicates that when one individual is progressing in the first two months, the other participants are regressing in the same measure in the same period. That development is happening in a different way for the same individuals in the second two months both intra-individually and inter-individually.
Journal of Teaching Language Skills, 35(4), Winter 2017 14
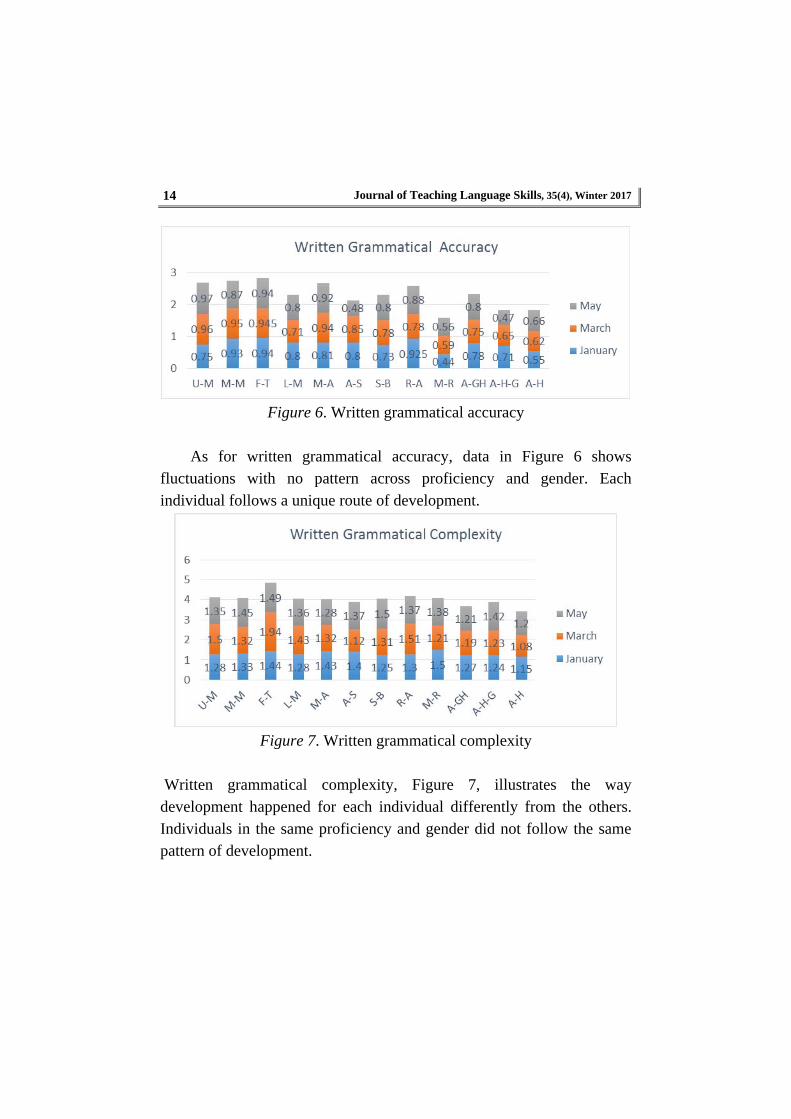
Figure 6. Written grammatical accuracy
As for written grammatical accuracy, data in Figure 6 shows
fluctuations with no pattern across proficiency and gender. Each individual follows a unique route of development.
Figure 7. Written grammatical complexity
Written grammatical complexity, Figure 7, illustrates the way development happened for each individual differently from the others. Individuals in the same proficiency and gender did not follow the same pattern of development.

DEVELOPMENT OF FLUENCY, ACCURACY 15
Figure 8. Written lexical complexity
Oral and written data (Intra and Inter individual compression)
An inter and intra-individual comparison of numerical values within the above figures (for example, written lexical complexity index (figure 8) for U-M moves in a regressive pattern from 6.67 to 6.52 and 4.98 over time. This index for S-B is 6, 6.91 and 6.55 over the same time reveals that a common pattern of development, which SLA research is looking for, is much difficult to find due to the individual differences and other reasons (discussed below). Fluctuations of data in any measure (written fluency index for U-M is 10.17, 11.8, 9.72 and for S-B it is 9.73, 10.84, 9.85; written grammatical accuracy index for U-M is .75, .96, .97 and for S-B it is .73, .78, .8; written grammatical complexity for U-M is 1.28, 1.5, 1.35 and for S-B it is 1.25, 1.31, 1.5; written lexical complexity index for U-M is 6.67, 6.52, 4.98 and for S-B it is 6, 6.91, 6.55), progress/regressing shapes in the measures and the amount of these differences, prohibit any conclusive pattern for each group across gender and proficiency (for example, U-M follows the pattern of regressing within four months in written grammatical complexity; S-B progresses in the first two months and regresses later in the same measure; L-M follows the pattern of progressing and regressing over time; A-H regresses and progresses in the same measure over the same time).

Journal of Teaching Language Skills, 35(4), Winter 2017 16
Patterns. In the following section the graphic representations provided in the figures (9-10) illustrate the way each participant’s pattern differs from the other participants.
Figure 9. Graphic representations of the patterns participants make in oral performance in all measures
DEVELOPMENT OF FLUENCY, ACCURACY 17
In the graphic representations above (Figure 9), complete oral profiles of each participant in all measures in oral narratives are illustrated and the shape of the graphs shows different developmental patterns for each participant, where development does not seem to support any universal pattern for the intermediate participants. Comparing the developmental pattern of the upper/lower intermediate female/male participants above, no similarity is observed in the pattern of development. Hence, it can be concluded that across gender and proficiency a common pattern of development is not substantiated. Each individual follows a different unique pattern of development, which is specific for him/herself.
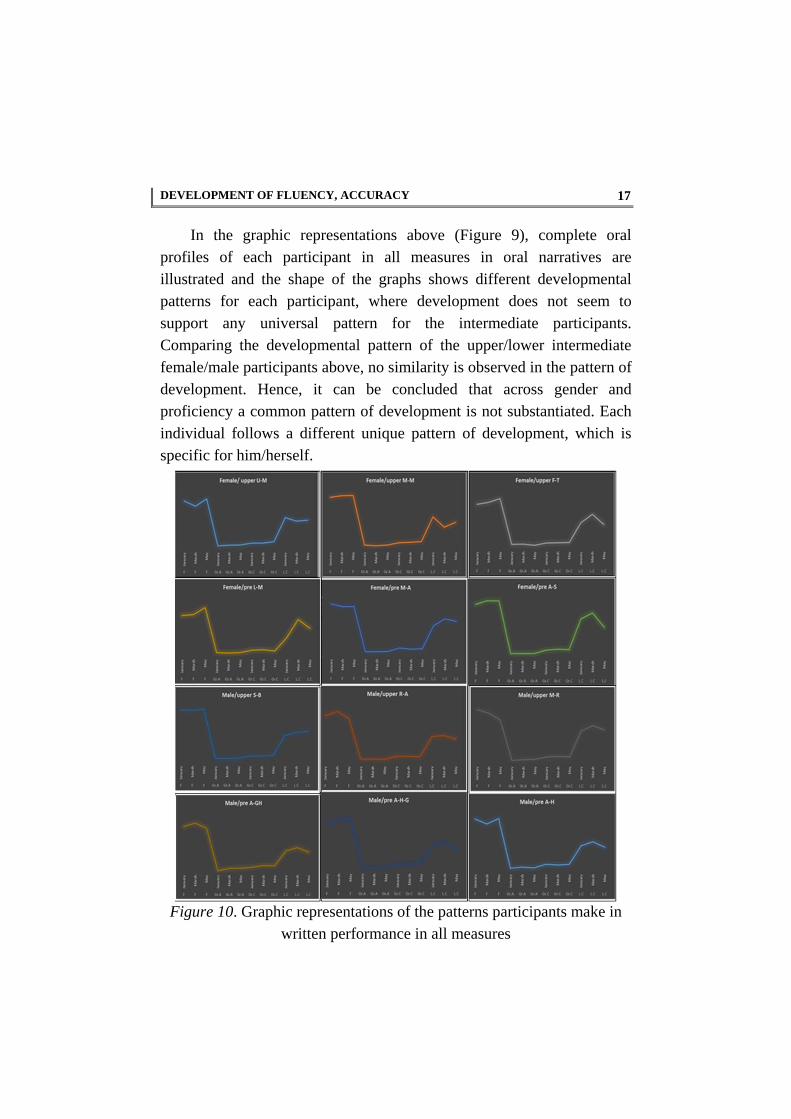
Figure 10. Graphic representations of the patterns participants make in written performance in all measures

Journal of Teaching Language Skills, 35(4), Winter 2017 18
Graphic representations, Figure 10, show different shapes in written performances for each individual in all measures. Developmental patterns, which each individual is following, reflect the uniqueness and specificity which was observed in figure 9 for the oral patterns as well. These patterns, which were illustrated for inter-individual comparisons, can clearly verify that development is situation specific and that there is no universal pattern for participants across gender or proficiency.
Inter-individual Comparison. In the following section, which are graphically illustrated, each individual is going to be compared with the other participants with similar proficiency or age level.
Figure 11. Inter-individual variation over time for three participants
(female upper intermediate) on four indices using written data As it is shown in the figure 11, M-M and F-T are regressing and progressing pattern in fluency, U-M regressing and progressing in that measure over four months. This pattern is different for each individual in the other three measures.

DEVELOPMENT OF FLUENCY, ACCURACY 19
‐1.5
‐1
‐0.5
0
0.5
1
1.5
2
FLUENCY
FLUENCY
FLUENCY
GRAM
MATIC
AL
ACCURACY
GRAM
MATIC
AL
ACCURACY
GRAM
MATIC
AL
ACCURACY
GRAM
MATIC
AL
COM
PLEXITY
GRAM
MATIC
AL
COM
PLEXITY
GRAM
MATIC
AL
COM
PLEXITY
LEXICAL
COM
PLEXITY
LEXICAL
COM
PLEXITY
LEXICAL
COM
PLEXITY
J A N U A R YM A R C H M A Y J A N U A R YM A R C H M A Y J A N U A R YM A R C H M A Y J A N U A R YM A R C H M A Y
Z score
M a l e U p pe r I n t e rmi d ia te Pa rti c i pa n ts Co mpa re d
S‐B
R‐A
M‐R
‐1.5
‐1
‐0.5
0
0.5
1
1.5
2
2.5
FLUENCY
FLUENCY
FLUENCY
GRAMMATIC
AL
ACCURACY
GRAMMATIC
AL
ACCURACY
GRAMMATIC
AL
ACCURACY
GRAMMATIC
AL
COMPLEXITY
GRAMMATIC
AL
COMPLEXITY
GRAMMATIC
AL
COMPLEXITY
LEXIC
AL
COMPLEXITY
LEXIC
AL
COMPLEXITY
LEXIC
AL
COMPLEXITY
J AN U AR YMAR C H MAY J ANUAR YMAR C H MAY J ANUAR YMAR C H MAY J ANUAR YMAR C H MAY
Z Score
Fema l e L ower I nte rmi di ate Pa rt ici pants Compa red
L‐M
M‐A
A‐S
Figure 12. Inter-individual variation over time for three participants (female lower intermediate) on four indices using written data
In Figure 12, participants L-M and M-A are following the pattern of
progressing in the first two months and regressing in the second two months in fluency. However, this pattern for A-S is always progressing in the same measure over time. In the other three measures, this figure displays different patterns for each individual as well.
Figure 13. Inter-individual variation over time for three participants (male upper intermediate) on four indices using written data
Participant S-A develops his fluency in the first two months but in
the second two months his fluency regresses. This pattern is always progressing for R-A and the participant M-R’s fluency regresses first and
Journal of Teaching Language Skills, 35(4), Winter 2017 20
progresses in the second two months. These chaotic patterns are clearly observed in Figure 13 for the other three measures as well.
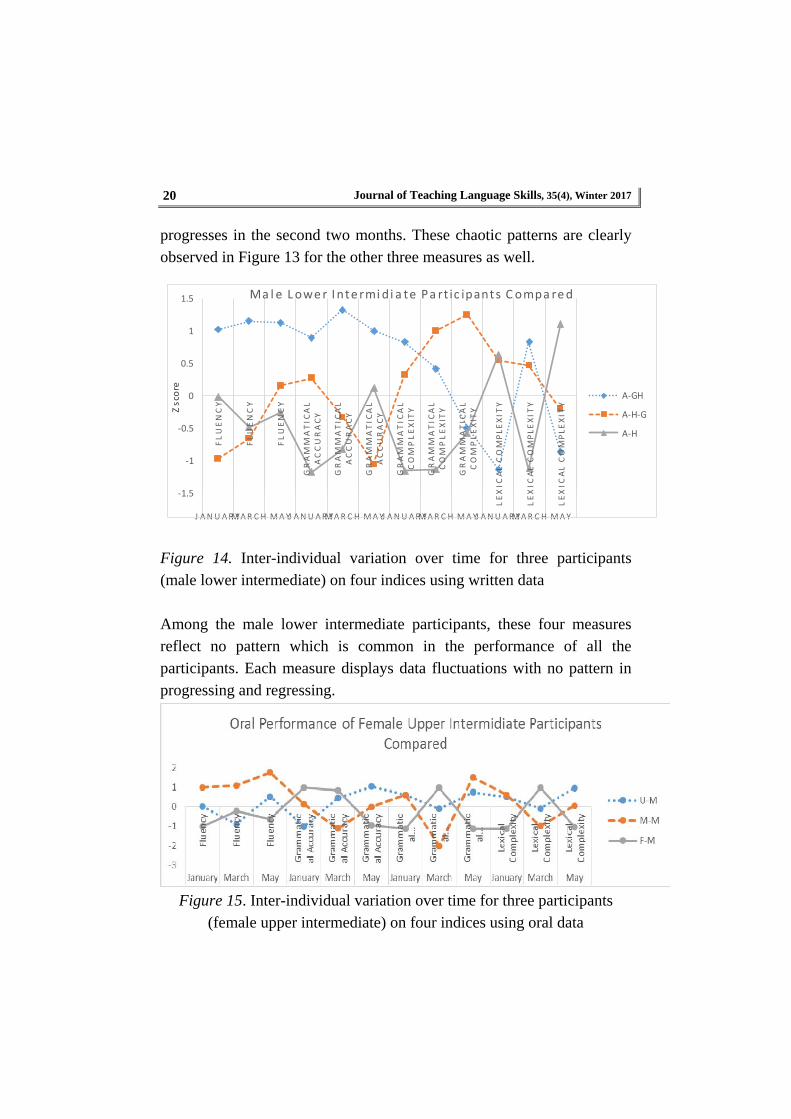
Figure 14. Inter-individual variation over time for three participants (male lower intermediate) on four indices using written data Among the male lower intermediate participants, these four measures reflect no pattern which is common in the performance of all the participants. Each measure displays data fluctuations with no pattern in progressing and regressing.
Figure 15. Inter-individual variation over time for three participants
(female upper intermediate) on four indices using oral data
‐1.5
‐1
‐0.5
0
0.5
1
1.5
FLUENCY
FLUENCY
FLUENCY
GRAMMATIC
AL
ACCURACY
GRAMMATIC
AL
ACCURACY
GRAMMATIC
AL
ACCURACY
GRAMMATIC
AL
COMPLEXITY
GRAMMATIC
AL
COMPLEXITY
GRAMMATIC
AL
COMPLEXITY
LEXIC
AL COMPLEXIT
Y
LEXIC
AL COMPLEXIT
Y
LEXIC
AL COMPLEXIT
Y
J ANU AR YMAR C H MAYJ ANU AR YMAR C H MAYJ ANU AR YMAR C H MAYJ ANU AR YMAR C H MAY
Z score
Ma l e Lower I nte rmi di a te Pa rt ic ipants Compa red
A‐GH
A‐H‐G
A‐H
DEVELOPMENT OF FLUENCY, ACCURACY 21
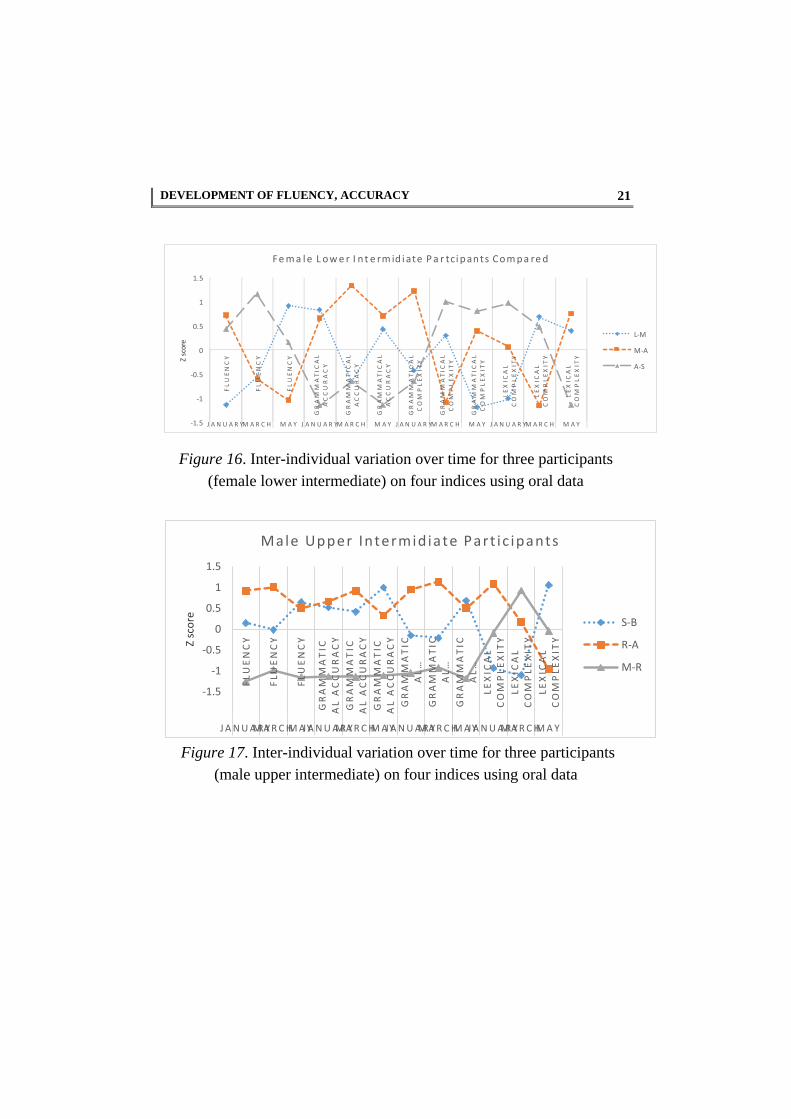
Figure 16. Inter-individual variation over time for three participants (female lower intermediate) on four indices using oral data
‐1.5
‐1
‐0.5
0
0.5
1
1.5
FLUENCY
FLUENCY
FLUENCY
GRAMMATIC
AL A
CCURACY
GRAMMATIC
AL A
CCURACY
GRAMMATIC
AL A
CCURACY
GRAMMATIC
AL …
GRAMMATIC
AL …
GRAMMATIC
AL …
LEXIC
AL
COMPLEXIT
Y
LEXIC
AL
COMPLEXIT
Y
LEXIC
AL
COMPLEXIT
Y
J A NUARYMARCHMAYJANUARYMARCHMAYJANUARYMARCHMAYJANUARYMARCHMAY
Z score
Male Upper Intermidiate Part ic ipants
S‐B
R‐A
M‐R
Figure 17. Inter-individual variation over time for three participants (male upper intermediate) on four indices using oral data
‐1.5
‐1
‐0.5
0
0.5
1
1.5
FLUENCY
FLUENCY
FLUENCY
GRAM
MATIC
AL
ACCURACY
GRAM
MATIC
AL
ACCURACY
GRAM
MATIC
AL
ACCURACY
GRAM
MATIC
AL
COM
PLEXIT
Y
GRAM
MATIC
AL
COM
PLEXIT
Y
GRAM
MATIC
AL
COM
PLEXIT
Y
LEXIC
AL
COM
PLEXIT
Y
LEXIC
AL
COM
PLEXIT
Y
LEXIC
AL
COM
PLEXIT
Y
J A N U A R YM A R C H M A Y J A N U A R YM A R C H M A Y J A N U A R YM A R C H M A Y J A N U A R YM A R C H M A Y
Z score
F ema le L owe r I n t e rm id i ate Pa r tci pants Compa red
L‐M
M‐A
A‐S

Journal of Teaching Language Skills, 35(4), Winter 2017 22
‐2
‐1
0
1
2
FLUENCY
FLUENCY
FLUENCY
GRAMMATIC
AL
ACCURACY
GRAMMATIC
AL
ACCURACY
GRAMMATIC
AL
ACCURACY
GRAMMATIC
AL
COMPLEXIT
Y
GRAMMATIC
AL
COMPLEXIT
Y
GRAMMATIC
AL
COMPLEXIT
Y
LEXIC
AL
COMPLEXIT
Y
LEXIC
AL
COMPLEXIT
Y
LEXIC
AL
COMPLEXIT
Y
J A NUARYMARCHMAYJANUARYMARCHMAYJANUARYMARCHMAYJANUARYMARCHMAY
Z score
Male Lower Intermidiate Part ic ipants Compared
A‐GH
A‐H‐G
A‐H
Figure 18. Inter-individual variation over time for three participants
(male lower intermediate) on four indices using oral data
As it was illustrated above, in the oral performances like the written ones, haphazard fluctuations of data prohibits drawing any conclusive patterns for each measure across gender and proficiency. Each participants’ oral performance follows its unique and specific pattern with no similarity to that of the other participants.
In the figures above, it was intended to compare all participants’ four indices with each other in the form of Z score, which makes comparability across different measures possible. Among these participants no correspondences were observed both in the path of development and in the rate /amount of progress /regress they make.
Averaging. In the graphic representation of averaging of all groups’ four indices illustrated next, no pattern can be claimed for development across proficiency and gender. The names of the groups are abbreviated next as follows:
DEVELOPMENT OF FLUENCY, ACCURACY 23
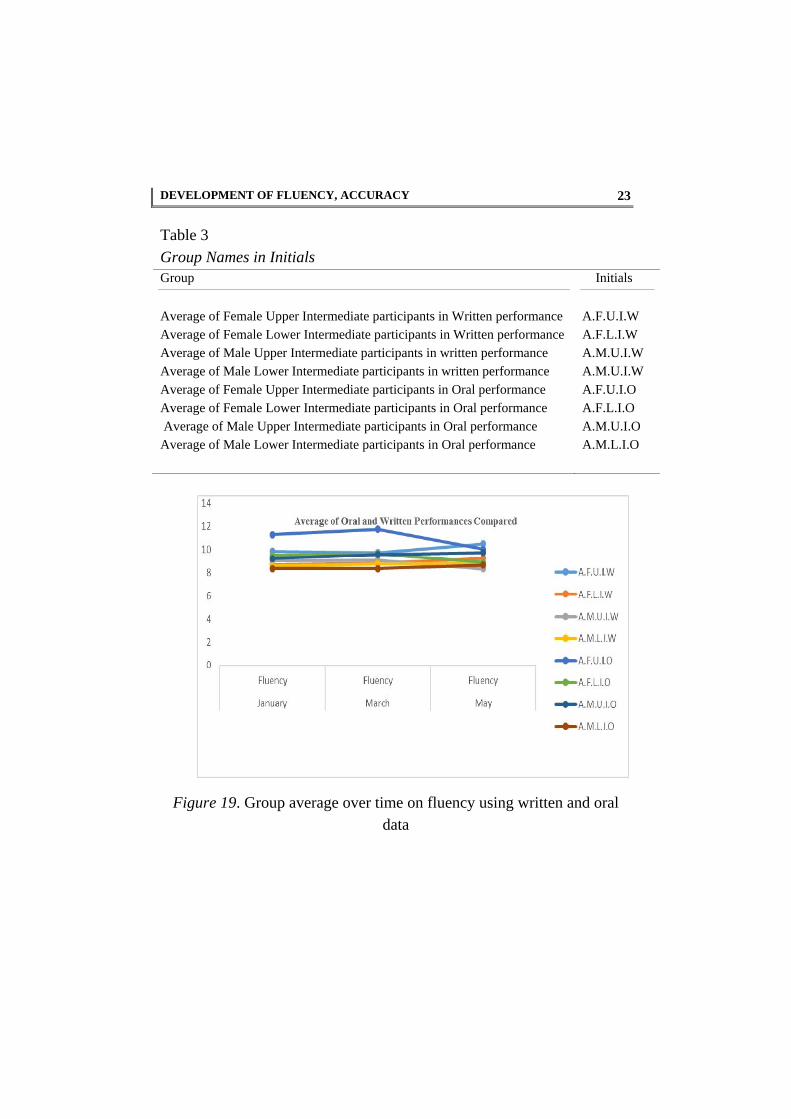
Table 3
Group Names in Initials Group
Average of Female Upper Intermediate participants in Written performance Average of Female Lower Intermediate participants in Written performance Average of Male Upper Intermediate participants in written performance Average of Male Lower Intermediate participants in written performance Average of Female Upper Intermediate participants in Oral performance Average of Female Lower Intermediate participants in Oral performance Average of Male Upper Intermediate participants in Oral performance Average of Male Lower Intermediate participants in Oral performance
Initials
A.F.U.I.W A.F.L.I.W A.M.U.I.W A.M.U.I.W A.F.U.I.O A.F.L.I.O A.M.U.I.O A.M.L.I.O
Figure 19. Group average over time on fluency using written and oral data

Journal of Teaching Language Skills, 35(4), Winter 2017 24
0
0.1
0.2
0.3
0.4
0.5
0.6
0.7
0.8
0.9
1
G R AMMAT I CA L AC CU RACY G R AMMAT I CA L AC CU RACY G R AMMAT I CA L AC CU RACY
J ANUAR Y MAR C H MAY
Avera g e of O ra l and Wri tten Pe rformances Compa red
A.F.U.I.W
A.F.L.I.W
A.M.U.I.W
A.M.L.I.W
A.F.U.I.O
A.F.L.I.O
A.M.U.I.O
A.M.L.I.O
Figure 20. Group average over time on grammatical accuracy using written and oral data
00.51
1.52
GRAMMAT I CA L COMPLE X I T Y
GRAMMAT I CA L COMPLEX I T Y
GRAMMAT I C A L COMPLEX I T Y
JANUARY MARCH MAY
Average of Oral and Written Performances Compared
A.F.U.I.W
A.F.L.I.W
A.M.U.I.W
A.M.L.I.W
Figure 21. Group average over time on grammatical complexity using written and oral data
DEVELOPMENT OF FLUENCY, ACCURACY 25
0
1
2
3
4
5
6
7
8
L E X I CA L COMPLEX I T Y
L E X I CA L COMPLEX I T Y
L E X I CA L COMPLEX I T Y
JANUARY MARCH MAY
Average of Oral and Written Performances Compared
A.F.U.I.W
A.F.L.I.W
A.M.U.I.W
A.M.L.I.W
A.F.U.I.O
A.F.L.I.O
A.M.U.I.O
A.M.L.I.O
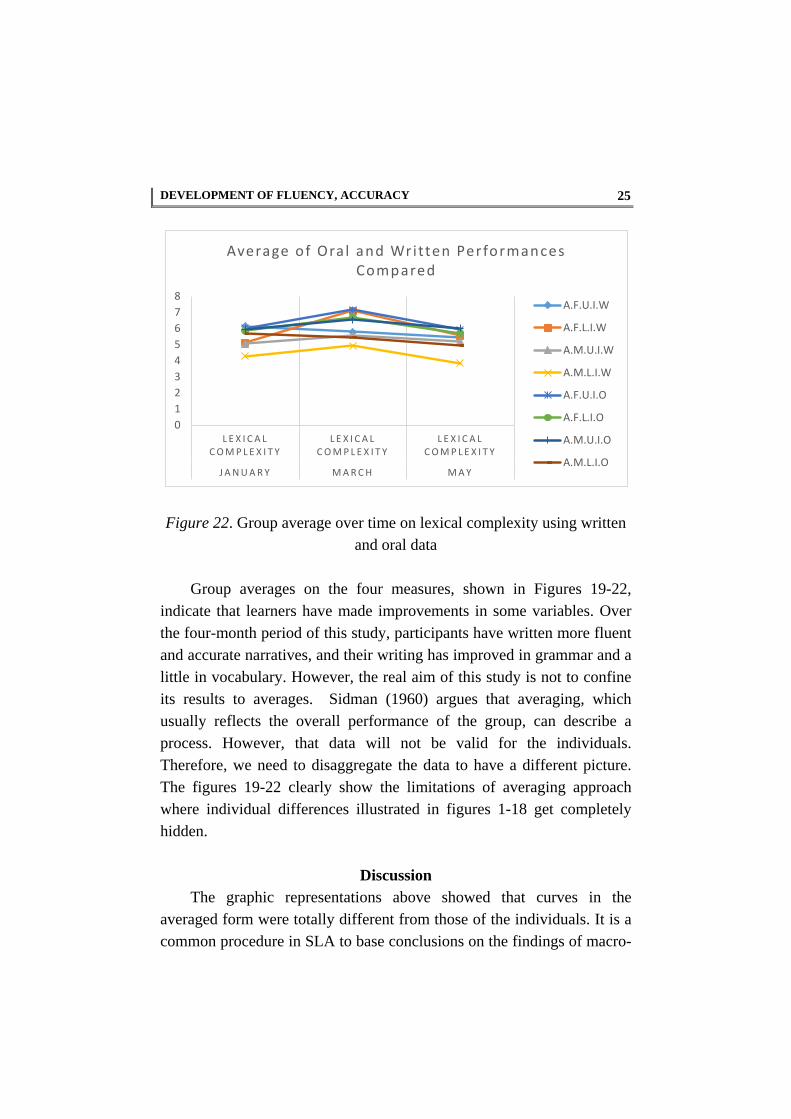
Figure 22. Group average over time on lexical complexity using written
and oral data
Group averages on the four measures, shown in Figures 19-22, indicate that learners have made improvements in some variables. Over the four-month period of this study, participants have written more fluent and accurate narratives, and their writing has improved in grammar and a little in vocabulary. However, the real aim of this study is not to confine its results to averages. Sidman (1960) argues that averaging, which usually reflects the overall performance of the group, can describe a process. However, that data will not be valid for the individuals. Therefore, we need to disaggregate the data to have a different picture. The figures 19-22 clearly show the limitations of averaging approach where individual differences illustrated in figures 1-18 get completely hidden.
Discussion The graphic representations above showed that curves in the
averaged form were totally different from those of the individuals. It is a common procedure in SLA to base conclusions on the findings of macro-
Journal of Teaching Language Skills, 35(4), Winter 2017 26
level group averages, if reliable differences are observed in the mean levels of performance. What is usually neglected in SLA is the analysis at the micro-level description; that is by looking in details at how individuals perform. As Thelen and Smith (1994) argue, analysis in the individuals and their behavioral changes is required in a dynamic or complex systems developmental approach.
Cross sectional and case study research, which we employed in the design of this study, are complementary, where the former provides the global structure and similarities across participants (Larsen-Freeman, 2006). Some scholars argue that using this procedure of analysis would reveal some points which chaos complexity is after, and it is there that variability in behaviors and dependency on the context are surfaced (van Dijk cited in Larsen-Freeman, 2006). de Bot et al. (2005, p. 24), doubting the general findings achieved in this course of research about the developmental patterns, invites researchers to reanalyze those stages of development closely enough, and believes that the new findings would be different. Tomasello (2000) states that it is more likely that these developments would be “pastiches of various kinds of item-based constructions” (p.76) rather than structures governed by rules.
Larsen-Freeman (2006) feels it is unclear whether these details are indicative of lasting development. She posits the following factors as possible causes of these differences: the fading of memory of the previous story; recent language experiences that influence the narrator’s telling; and changing opinions of the events as time passes. To this list, we can add the factor of different strategies, which learners might adopt in different performances while doing the same narrative in repeated tasks where the leaners consciously perform differently to produce a different narrative from the earlier ones.
Larsen-Freeman, as a pioneer in this paradigm of research, argues against the traditional view and sides with de Bot et al. (2005) trying to inform the researchers in SLA not to be confined to the results that are obtained from averaging the data. She mainly aims to shift the researcher’s orientation to be more meticulous to the micro-level features

DEVELOPMENT OF FLUENCY, ACCURACY 27
in any study, which she believes, contain lots of hidden points that have been left unexplored so far.
Regarding the generalizability of a case study research, drawing on Cohen et al. and LeCompte and Pressle’s (Cited in Wang Xi, 2016) viewpoints, one may conclude that a case study is generalizable to specific identifiable settings and subjects if needed attempts to balance the case’s uniqueness and generalizability are made. The data obtained in this study revealed some interesting new points which could confirm the main premise of chaos complexity theory by highlighting a plethora of differences in the participants’ performances in different measurements. Such an observation has already been introduced into this field through one study by Larsen-Freeman (2006). However, our study added some new points to the applied linguistics’ literature and chaos complexity theory literature. The study revealed that the principles of chaos complexity theory were applicable to our findings across gender and proficiency as well. Earlier studies had explored this theory among females in one particular proficiency in an American context, with Chinese language background, which showed the lack of common pattern among the participants’ language development. Our study showed that the variables of gender (male and female), proficiency (pre- and upper intermediate) and EFL context could not find any universal pattern in the language development of individuals. Even participants with the same gender and proficiency in the same EFL contexts could not make the same developmental pattern within these four months. The data also revealed that no progress or regressing can be predicted in the development of participants with the same level of proficiency and gender in the same EFL context.
The literature in this field (chaos complexity theory in applied linguistics) is not rich enough to pave the ground for the substantial discussion of our findings by linking ours to others. Therefore, we have to draw on the findings of these few studies for our discussion. The literature in the four measures (fluency, accuracy, complexity–grammatical and lexical) have not tried to focus on the way this theory

Journal of Teaching Language Skills, 35(4), Winter 2017 28
fits into that framework. Rather, they have tried to see how different strategies or variables lead to any possible changes in the amount of these measures where averaging has been the main index to decide on the effect of these variables on Complexity, Accuracy, and Fluency (CAF). The literature in CAF (Ahmadian, 2015; Ellis, 2009; Hsu, 2015; Norris & Ortega, 2009; Polat & Youjin, 2013; Revesz, Ekiert, & Torgersen, 2014; Skehan, 2009; Spoelman & Verspoor, 2010; Vercellotti, 2012; Wigglesworth & Storch, 2009) could not be included in our study because it was not in Chaos Complexity framework and could not be easily discussed in our study regarding their analysis in development in cross-sectional design. The only relevance that can be found for comparison and discussion is the results of these measures (CAF) that have turned out to be different in these studies before and after treatments. If these studies (cited above) in CAF have showed the effect of different tasks, strategies, and variables on these measures (generally averaging has been the main statistical measure for comparison) these changes are more likely to have been due to the contexts ‘effects which chaos complexity is trying to prove. If learners are doing differently in different contexts, attributing these differences in the measures in any treatment to the effects of those variables manipulated might be difficult to substantiate. With this in mind, we can predict that in any treatment a difference will transpire since the time and the context of the second measure (post-test) will differ. However, the amount and the direction of this difference will be decided by the variables ’effects. If the researchers of the already-conducted studies (cited above) on CAF reanalyze the data not using averaging, then the results would reveal some different finding in which the peculiarities of each individual’s performance might surface.
Regarding the principles of chaos complexity, in this part we will discuss each individually. As for unpredictability, the data revealed that the direction of development (progress/regressing) and the rate of this development were not possible to predict. As we noticed each individual was following his/her own unique way of development, which was

DEVELOPMENT OF FLUENCY, ACCURACY 29
totally different from those of the others, across gender and proficiency. Regarding the principle of chaos, which refers to the lack of pattern in the developmental process of language learning, results showed no pattern-based development among the individuals. Even in the averaging of the data, no solid and comprehensive conclusion can be made as to the pattern of development each group is following. What was important as one of the principles of chaos complexity theory was the principle of dynamicity that was clearly observed in the fluctuations of fluency, grammatical accuracy, grammatical complexity, and lexical complexity of all individuals. Regarding self-organization principle, we noticed in the quantitative analysis of A-G’s data (one of the participants) that in the first performance he incorrectly used the word ‘were’ in the sentence ‘she were’ and correctly used it in the ‘ship was’ and in the third performance he correctly used the word in ‘it was’, ‘he was’ and ‘the ship was’. One of the tenets of this approach refers to the discontinuity and bifurcations when the process is chaotic, that is the organism is free to explore new behaviors in response to task demands, as argued by Thelen (cited in Larsen-Freeman, 2006).
Principle of self-organization, which assumes that any small change causes the whole system to adapt itself to that newly made modification, making the system configure itself to a new form will be a big support to the unpredictability in the mechanism of the language system and its prospective model. This practically means that to the number of people in the world there will be different language system forms. Assuming this justification to be scientifically true will pave the ground to follow the concept of individual differences. This will be a big support to the sociocultural theory as well, which assumes that our society and situational contexts, where we live, will determine the development and emergence of our language and since no individual’s learning contexts equal that of the others, no human beings’ language system will be identically similar. Barbara Hawkins (2016) supporting sociocultural theory asserts that the development of higher-order processes (all cognitive abilities in language learning) are rooted in experience, in the
Journal of Teaching Language Skills, 35(4), Winter 2017 30
socially situated context present in all human activities. These differences in the performances of individuals, aside from the situational contexts different for each individual, can be attributed to the following reasons: learning contexts, individual differences, learning strategies, time for learning, and language aptitude. All these factors in juxtaposition can lead to different performances by each individual in different contexts.
Conclusions The main tenet of this paper is that we need a more dynamic view of
language and its learning. We need to find more from these small details that have largely been ignored in the earlier paradigm of research where averaging has been the only goal for the researcher, neglecting those individually different features which are normally left untouched and unexplored in traditional approaches to research. We need to take into account learners’ goals, intentions as well as the task characteristics which make up our contexts. If each context is reflecting a different view of the learners’ competence, then we need more multivariate analyses to help us sort this out. Chaos complexity theory, as argued above with all its building components, helps us look at SLA from a different perspective which is expected to provide more compelling and potentially more fruitful results.
This new approach of research takes into consideration all the elements engaged in the process of language development reflecting some new underlying mechanisms enacting in the language system. Confining the research in this field to the results of averaging, which generally trades off the individual differences (capabilities of one individual is traded off by the incapability of another individual) always conceals those nuance differences which more likely have some new implications for SLA. We conclude the discussion, letting Marchman and Thal (2005) make the point that:
Language learning can be viewed as a complex and dynamic process in which various components emerge at various levels, to various degrees, and at various times. Individual differences are a

DEVELOPMENT OF FLUENCY, ACCURACY 31
natural consequence of learning within such a framework because of the dynamic and multi-faceted nature of the emergent system. Slight differences in the relative rate, strength, or timing (chronotropic constraints) of the component achievements can result in relatively significant differences between individuals in behavioral outcomes . . . . Instead, from an emergentist view, children differ in language learning skill not because of domain-specific knowledge that they either have or don’t have, but because of variations in how and when the pieces of the process were put together during learning. (p.150)
Regarding the implications we can draw for applied linguistics and other interdisciplinary fields, we have to put emphasis on individual differences while exercising cross comparison in the classroom settings. If individual learners are doing differently in different contexts, placing learners into different proficiency levels based on their expressive skills in one particular situation might lead to a misleading conclusion. Referring back to the data analysis part where some lower intermediate participants outperformed the upper intermediate ones in accuracy, grammatical complexity, lexical complexity and fluency in some particular situations, then language testing might be cautiously dealing with the reports of each individual participant’s language performance. TOEFL or similar proficiency tests need to consider this fact for clearly reflecting a comprehensive language repertoire of each individual test taker. Providing a sound and an accurate report of an individual learner’s language knowledge, based on the findings of chaos complexity theory, requires meticulous investigations of each individual’s performance in different contexts and different tasks.
Language teachers should take every measure cautiously regarding the development of individual learners’ language knowledge, as this rate of development fluctuates over time as observed in this treatment. Development did not seem to follow a pace of always-in-progress pattern for any individual across gender and proficiency.
Journal of Teaching Language Skills, 35(4), Winter 2017 32
We did not notice the effect of practice effect in the performance of individuals since it was expected that each individual’s oral performance would be better compared to that of the written performance, which was conducted with three days interval. In some particular cases, the oral performance was lagging behind of the written one as far as the CAF analysis was concerned. It should be stated that oral and written skills are different as far as cognitive processing in the mind is concerned, accordingly, they are totally different skills and their comparisons should be treated cautiously. As far as psycholinguistics is concerned, conclusions are drawn regarding the nature of competence in the mind, which is the only underlying source for both of these productive skills. If performance is considered to be the manifestation of underlying competence, then each individual’s competence should be regarded as context specific which transforms itself to the peculiarities of any new context. It is the nature of dynamic systems to change shapes in any context. It is postulated that dynamicity in chaos complexity theory will impede any attempt to find the cause and effect relationships among different underlying components of language learning system. Hence, finding the real image of competence with all the components in interaction will be blurred. This bottom-up approach to the real image of competence in the mind will fail to clarify our understating about the components’ interactive model in competence, due to the fact that dynamicity will make the competence reshape itself in any situation (reconfiguration) and will appear in different interactive models in any setting.
Researchers are also recommended to move beyond the traditional paradigm of research, which follows the effect of one variable on the whole system of language learning, disregarding the fact that any small variation in any variable can cause modifications on the whole components in interaction. Furthermore, it will not be clearly evident whether that variable manipulated was the real immediate cause of that modification or whether there were other variables in between, which mediated that cause and effect relationship. Therefore, following the new
DEVELOPMENT OF FLUENCY, ACCURACY 33
paradigm, researches had better take all the variables in an interactive model into considerations in all sorts of cause and effect research so that their findings will gradually reveal the real model of language in general.
References Ahmadian, M. J. (2012). The effects of guided careful online planning on
complexity, accuracy and fluency in intermediate EFL learners’ oral production: The case of English articles. Language Teaching Research, 16(1), 129-149. Doi: 10.1177/1362168811425433.
Bot, K., Lowie, W., & Verspoor, M. (2005). Second language acquisition: An advanced resource book. Abingdon: Routledge.
Ellis, R., & Barkhuizen, G. (2005). Analyzing learner language (1st ed.). London: Oxford University Press.
Ellis, R. (2009). The differential effects of three types of task planning on the fluency, complexity, and accuracy in l2 oral production. Applied Linguistics, 30(4), 474-509. doi: 10.1093/applin/amp042.
Hawkins, B. (2016). Using sociocultural theory to examine the context(s) of language learning and teaching. Working papers in TESOL and applied linguistics. Retrieved September 26, 2016, from http://tesolal.columbia.edu/article/using-sociocultural-theory/
Hsu, H. (2015). The effect of task planning on l2 performance and l2 development in text-based synchronous computer-mediated communication. Applied Linguistics. doi: 10.1093/applin/amv032.
Larsen-Freeman, D. (1991). Second language acquisition research staking out territory. TESOL Quarterly, 25, 315-350.
Larsen-Freeman, D. (1997). Chaos/complexity science and second language acquisition. Applied Linguistics, 18, 141-165.
Larsen-Freeman, D. (2006). The emergence of complexity, fluency and accuracy in the oral and written production of five Chinese learners of English. Applied Linguistics, 27(4), 590-619.
Larsen-Freeman, D., & Cameron, L. (2008). Research methodology on language development from a complex systems perspective. The

Journal of Teaching Language Skills, 35(4), Winter 2017 34
Modern Language Journal, 92(2), 200-213. Doi: 10.1111/j.1540- 4781.2008.00714.x.s
Marchman, V., & Thal, D. (2005). Words and grammar. In M. Tomasello and D. Slobin (Eds), Beyond nature-nurture: Essays in honor of Elizabeth Bates, (pp. 224–226). Mahwah, NJ: Lawrence Erlbaum.
Norris, J., & Ortega, L. (2009). Towards an organic approach to investigating CAF in instructed SLA: The case of complexity. Applied Linguistics, 30(4), 555-578.
Polat, B., & Kim, Y. (2013). Dynamics of complexity and accuracy: A longitudinal case study of advanced untutored development. Applied Linguistics, 35(2), 1-25. doi:10.1093/applin/amt013.
Revesz, A., Ekiert, M., & Torgersen, E. (2014). The effects of complexity, accuracy, and fluency on communicative adequacy in oral task performance. Applied Linguistics. 37(6), 828-848. doi:10.1093/applin/amu069.
Sidman, M. (1960). Tactics of scientific research. New York: Basic Books, Inc. New York: Basic Books, Inc.
Skehan, P. (2009). Modelling second language performance: integrating complexity, accuracy, fluency, and lexis. Applied Linguistics, 30(4), 510-532.
Soars, L., & Soars, J. (2011). New Headway (4th Ed.). Oxford: Oxford University Press.
Soleimani, H., & Alavi, M. (2013). A dynamical system approach to research in second language acquisition. Journal of English Language Teaching and Learning, 5(11), 127- 143.
Spoelman, M., & Verspoor, M. (2010). Dynamic patterns in development of accuracy and complexity: A longitudinal case study in the acquisition of Finnish. Applied Linguistics, 31(4), 532-553.
Steenbeek, H. W., & Van Geert, P. (2005). A complexity and dynamic systems approach to development: Measurement, modeling and research. In K.W. Fischer, A. Battro and P. Lena (Eds.). Mind, Brain and Education. Cambridge: Cambridge University Press.
DEVELOPMENT OF FLUENCY, ACCURACY 35
Thelen, E., & Smith, L. (1994). A dynamic systems approach to the development of cognition and action. Cambridge, MA: MIT Press.
Tomasello, M. (2000). First steps toward a usage-based theory of language acquisition, Cognitive Linguistics, 11, 61-82.
TOEFL Equivalency Table. (2016, March). Retrieved from: http://secure.vec.bc.ca/toefl-equivalency-table.cfm
ESOL EXTRAS. (2016, March). Retrieved from: http://esolepacks.com/language-levels/
Vercellotti, L.M. (2012). Complexity, accuracy, and fluency as
properties of language performance: The development of the multiple subsystems over time and in relation\ to each other. Doctoral dissertation, Kenneth P. Dietrich School of Arts and Sciences. Retrieved from: file:///E:/system%20chaos%20complexity/Vercellotti_CAF_v3.pdf
Vercellotti, L.M. (2015). The development of complexity, accuracy, and fluency in second language performance: A longitudinal study. Applied Linguistics. doi: 10.1093/applin/amv002.
Wigglesworth, G., & Storch, N. (2009). Pair versus individual writing: Effects on fluency, complexity and accuracy. Language Testing, 26(3), 445-466. Doi: 10.1177/0265532209104670.
Xi, W. (2016). The discursive construction of intercultural understanding
in China: A case study of an international baccalaureate diploma program (Emerging perspectives on education in China). London: Rowman and Littlefield.