
Development of Fischer-Tropsch Catalysts for Gasified - DiVA Portal
103
Development of Fischer-Tropsch Catalysts for Gasified Biomass SARA LÖGDBERG Licentiate Thesis in Chemical Engineering Stockholm, Sweden 2007
Transcript of Development of Fischer-Tropsch Catalysts for Gasified - DiVA Portal
Development of Fischer-Tropsch Catalysts for Gasified Biomass
SARA LÖGDBERG
Licentiate Thesis in Chemical Engineering Stockholm, Sweden 2007

TRITA-CHE-Report 2007:36 KTH School of Chemical Science and Engineering ISSN 1654-1081 SE-100 44 Stockholm ISBN 978-91-7178-698-2 SWEDEN
© Sara Lögdberg, May 2007

Abstract In order to secure the energy supply to an increasing population and at the same time limit the damage to Earth, i.e. avoiding a fatal climate change as a result of anthropogenic emissions of greenhouse gases (primarily CO2), immediate action is necessary. This includes reducing the energy consumption, increasing the energy conversion efficiency, and using renewable energies. The transport sector is the one most dependent on fossil energy and it stands for a significant part of the energy consumption in the world. For instance, in EU-25 transportation stands for 30 % of the total final energy consumption and relies to 98 % on oil. Being the only renewable energy possible to convert into liquid fuels biomass, as a means for reducing the CO2 emissions from the transport sector, will play an important role in the near future. The conversion of biomass into transportation fuels is preferentially done via gasification followed by the fuel synthesis. The whole production chain from biomass to final fuel is very dependent on R&D, in order to become competitive with the fossil fuels. Fischer-Tropsch (FT) diesel made from biomass is a viable option for reducing the CO2 emissions from transportation since it may be blended with conventional diesel in any concentration. Furthermore, since its composition is almost the same as of petroleum-based diesel (although cleaner) the same distribution system and engines may be used, which facilitates its introduction on the market. This thesis presents the results of the laboratory work performed in 2003 – 2007 at the Department of Chemical Technology, KTH, and at the Department of Chemical Engineering, NTNU (the Norwegian University of Science and Technology) in Trondheim. Part of the work has been performed in close cooperation with the Department of Chemical and Biological Engineering at Chalmers University of Technology. All FT experiments were performed in a fixed-bed reactor at 210 ºC and 20 bar. Pure mixtures of H2, CO and N2 were used as feed to the reactor. Steam was also occasionally introduced. Selectivity to C5+ was used as a measure of the catalysts’ ability to grow long-chain hydrocarbons, which is desirable when diesel is the product aimed for. The first part of the thesis deals with the direct conversion of a H2-poor syngas, which is obtained upon gasification of biomass, into FT hydrocarbons. “H2-poor” means that the H2/CO ratio is lower than what is required by the stoichiometry (~ 2.1) of the FT synthesis (reaction 1). In order to increase the H2/CO ratio to the required one, internal water-gas-shift (WGS) is needed (reaction 2).
FT: CO + 2 H2 “-CH2-“ + H2O (1)
WGS: CO + H2O ↔ CO2 + H2 (2)
iii

The H2/CO usage ratio has been used as a measure for the internal WGS activity, it is defined as follows:
10023
/ 254242
COCCCCH SSxSxFSxCOHofratioUsage
−++= +−
where S is the selectivity (of total C-containing products), and the factor F indicates the number of H2 moles required for one CO mole to form the product (e.g. for producing high molecular weight n-paraffins, 2 moles of H2 per mole of CO are required). For the fraction C2 – C4, F will have different values depending on the selectivity to C2, C3 and C4, and it also depends on the olefin/paraffin ratios for those hydrocarbons. In order to reach the highest once-through conversion of the syngas, the H2/CO usage ratio should be equal to the inlet H2/CO ratio. The lower the usage ratio, the higher the relative WGS activity. The combined FT and WGS reactions with H2-poor syngas have been tested for 12 wt% Co and 12 wt% Co – 0.5 wt% Re catalysts supported on γ-Al2O3. It was found that with lower H2/CO ratios in the feed, the syngas conversion and the CH4 selectivity decreased, while the C5+ selectivity and olefin/paraffin ratio for C2-C4 increased slightly. The WGS activity was low for all catalysts, implying a H2/CO usage ratio close to the stoichiometric one (2.1), even for inlet H2/CO ratios of 1.5 and 1.0. By replacing 20 % of the Co by Fe in the Co catalyst referred to above (by co-impregnation) in order to achieve a 12 wt% bimetal loading on γ-Al2O3, a slightly lower usage ratio was obtainable (1.92) for an inlet ratio of 1.0 for dry conditions. Different Fe:Co ratios ranging from 100 % Fe to 100 % Co (12 wt% bimetal) were tested for an inlet H2/CO ratio of 1.0. The characterisation results indicated that Fe was enriched at the surface, hence covering the more FT-active Co sites, even at low percentage Fe. Not even upon significant replacement of Co by Fe (≥ 20 %) were the usage ratios for dry conditions lowered to any significant extent. The WGS reaction at the low temperature used could be boosted by addition of external water. However, since the catalysts with the highest WGS activity had surface enrichment of Fe, high water partial pressures negatively affect the FT rate and also lead to rapid deactivation by re-oxidation of the FT-active iron phases (iron carbides) or by sintering. Surprisingly, also the WGS activity rapidly deactivated at high partial pressures of water, although Fe3O4 is believed to be the WGS-active phase. Possibly, surface oxidation of Fe3O4 into γ-Fe2O3 may take place during these water-rich conditions. The WGS reaction (reaction 2) is thermodynamically favoured at low temperatures. However, the WGS kinetics over the tested catalysts is far too slow at the FT reaction temperature used in typical low-temperature FT (LTFT) applications, with diesel as the desired product.
iv

The second part of this thesis deals with the hydrocarbon selectivity over Co-based catalysts in the FT synthesis with stoichiometric H2/CO feed. An alternative catalyst preparation technique, the microemulsion (ME) technique, was used as a complement to the conventional incipient wetness (IW) impregnation. A great deal of effort was put into the development of the synthesis of Co particles of monodisperse size in a ME and the subsequent deposition of these onto a porous support material. By using the ME technique it was possible to prepare relatively small Co particles in a large-pore support such as TiO2, which is not an easy task using the conventional impregnation technique. With the prepared ME catalyst on TiO2 it was possible to study the effect of Co particle size on FT selectivity irrespective of the pore size of the support. It was found that, at least for Co particles larger than 10 nm, it is not the Co particle size that is the principal parameter determining the selectivity of a catalyst, but rather the physical and/or chemical properties of the support. Due to the smaller Co particle size (~ 12 nm) of the ME-TiO2 catalyst as compared to a corresponding IW catalyst (~ 26 nm) supported on TiO2, the FT activity of the former was 100 % higher as fresh catalyst. After 120 h on stream the ME catalyst still gave 60 % higher rate to C5+ (expressed as gC5+/gcat,h) compared to both an IW-TiO2 and an IW-γ-Al2O3 catalyst, all catalysts having the same composition (12 wt% Co, 0.5 wt% Re).
v

vi

Publications referred to in this thesis The following papers are appended at the end of the thesis. Paper I: Dewi Tristantini, Sara Lögdberg, Börje Gevert, Øyvind Borg, Anders Holmen, The effect of synthesis gas composition on the Fischer-Tropsch synthesis over Co/γ-Al2O3 and Co-Re/γ-Al2O3 catalysts, Fuel. Proc. Technol. (2007), In press Paper II: Sara Lögdberg, Dewi Tristantini, Øyvind Borg, Börje Gevert, Edd A. Blekkan, Anders Holmen, Hydrocarbon production via Fischer-Tropsch synthesis from H2-poor syngas over different Fe-Co/γ-Al2O3 bimetallic catalysts, Submitted to Appl. Catal. B (2007-05-05) Paper III: Sven Järås, Sara Lögdberg, Magali Boutonnet, Method for depositing metal particles on a support, European Patent Application Number EP07106863.9 Paper IV: Sara Lögdberg, Magali Boutonnet, Sven Järås, Study of the selectivity-governing parameters in the cobalt-catalysed Fischer-Tropsch reaction, In preparation
vii

viii

Other publications and presentations Other publications and conference contributions on catalysis and chemical engineering not included in this thesis are listed below. Papers
S. Nassos, S. Lögdberg, S.G. Järås, B. Gevert, Iron-based catalysts prepared by microemulsion for synthesis of Fischer-Tropsch diesel from gasified biomass, Submitted to Appl. Catal. A (2007-05-01).
D. Tristantini, S. Lögdberg, B. Gevert, Ø. Borg, A. Holmen, Direct use of H2-
poor bio-syngas model in Fischer-Tropsch synthesis over unpromoted and rhenium promoted alumina-supported cobalt catalysts, Prepr. Symp. - Am. Chem. Soc., Div. Fuel Chem., 51:68-72, 2006.
F. Huber, Y. Zhixin, S. Lögdberg, M. Rønning, D. Chen, H. Venvik, A. Holmen, Remarks on the passivation of reduced Cu-, Ni-, Fe-, Co-based catalysts, Catal. Lett. 110 (2006) 211.
T. Ekbom, N. Berglin, S. Lögdberg, High efficient motor fuel production from
biomass via black liquor gasification, Proceedings of the 15th International Symposium on Alcohol Fuels, 26 – 28 September 2005, San Diego, USA.
T. Ekbom, N. Berglin, S. Lögdberg, Black Liquor Gasification with Motor Fuel
Production – BLGMF II, Final report for Contract No. P21384-1 in the Swedish Energy Agency programme “Forsknings och Utvecklingsprogrammet för Alternativa Drivmedel 2003 – 2006 (FALT)”, December 2005.
Presentations
S. Lögdberg, Ø. Borg, M. Boutonnet, S. Järås, A. Holmen, Preparation of cobalt-based Fischer-Tropsch catalysts by the microemulsion technique. Poster presentation, 2nd World Conference and Technological Exhibition on Biomass for Energy, Industry and Climate Protection, 10 – 14 May 2004, Rome, Italy.
S. Lögdberg, Ø. Borg, M. Boutonnet, S. Järås, A. Holmen, Preparation of
cobalt-based Fischer-Tropsch catalysts by the microemulsion technique. Poster presentation, 11th Nordic Symposium on Catalysis, 23 – 25 May 2004, Oulu, Finland.
ix

S. Lögdberg, M. Boutonnet, S. Järås, Cobalt nanoparticles for Fischer-Tropsch catalysts. Poster presentation, COST D15 4th workshop "Interfacial Chemistry and Catalysis”, 20 – 23 October 2004, La Colle sur Loup, France.
S. Lögdberg, M. Boutonnet, A. Holmen, S. Järås, Co/alumina catalysts: the
influence of the cobalt phase on the activity and selectivity in the Fischer-Tropsch reaction for production of synthetic diesel. Poster presentation, SYNBIOS: Second-Generation Automotive Biofuels, 18 – 20 May 2005, Stockholm, Sweden.
D. Tristantini, S. Lögdberg, B. Gevert, Ø. Borg, A. Holmen, A study of
hydrocarbon production via Fischer-Tropsch (FT) synthesis from different model bio-syngases over un-promoted and rhenium-promoted alumina supported cobalt catalysts. Poster presentation, SYNBIOS: Second-Generation Automotive Biofuels, 18 – 20 May 2005, Stockholm, Sweden.
S. Lögdberg, M. Boutonnet, A. Holmen, S. Järås, Co/alumina catalysts
prepared by the microemulsion technique for production of Fischer-Tropsch diesel. Poster presentation, Europacat-VII, 28 August – 1 September 2005, Sofia, Bulgaria.
D. Tristantini, S. Lögdberg, B. Gevert, Ø. Borg, A. Holmen, Effect of water
addition on hydrocarbon production via Fischer-Tropsch synthesis from different model bio-syngases over unpromoted and rhenium-promoted alumina-supported cobalt catalysts. Poster presentation, Europacat-VII, 28 August – 1 September 2005, Sofia, Bulgaria.
S. Lögdberg, Ø. Borg, V. Frøseth, E.A. Blekkan, M. Boutonnet, S. Järås, A.
Holmen, Cobalt particle size effects in α- and γ-Al2O3 supported catalysts for Fischer-Tropsch synthesis. Oral presentation, Gas-Fuel 05, 14 – 16 November 2005, Brugge, Belgium.
D. Tristantini, S. Lögdberg, B. Gevert, Ø. Borg, A. Holmen, Direct use of H2-
poor bio-syngas model in Fischer-Tropsch synthesis over unpromoted and rhenium promoted alumina-supported cobalt catalysts. Oral presentation, 231st ACS National Meeting, 26 – 30 March 2006, Atlanta, USA.
S. Lögdberg, Ø. Borg, M. Boutonnet, A. Holmen, S. Järås, Study of cobalt
particle size effects on selectivity in the Fischer-Tropsch synthesis. Oral presentation, 12th Nordic Symposium on Catalysis, 28 – 30 May 2006, Trondheim, Norway.
D. Tristantini, S. Lögdberg, Ø. Borg, B. Gevert, A. Holmen, Hydrocarbon
production via Fischer-Tropsch synthesis from CO-rich syngas over different Fe-Co/Al2O3 bimetallic catalysts: the effect of water. Poster presentation, 12th Nordic Symposium on Catalysis, 28 – 30 May 2006, Trondheim, Norway.
x

Contents 1 Introduction................................................................................................... 1
1.1 Setting the scene...................................................................................... 1 1.2 Objective of the thesis .............................................................................. 2
2 Background................................................................................................... 3
2.1 Drivers for biofuels ................................................................................... 3 2.1.1 Energy consumption and fossil CO2 emissions ................................. 3 2.1.2 The Kyoto Protocol and the EU’s strategy on climate change........... 6 2.1.3 Biomass as a means to reduce CO2 emissions................................. 7
2.1.3.1 Energy use in the transport sector and the introduction of biofuels .................................................................................................... 7 2.1.3.2 Biomass potential ...................................................................... 10
2.2 Gasification of biomass and the production of biosyngas...................... 16 2.2.1 Introduction ...................................................................................... 16 2.2.2 Gasification of solids ........................................................................ 17
2.2.2.1 Basics in gasification ................................................................. 17 2.2.2.2 Coal vs biomass gasification ..................................................... 18 2.2.2.3 Gasification options ................................................................... 19
2.2.3 Production of biosyngas................................................................... 21 2.2.3.1 Background................................................................................ 21 2.2.3.2 Composition of gasified biomass............................................... 22 2.2.3.3 Cleaning and upgrading of product gas to syngas .................... 23 2.2.3.4 Conditioning of the syngas ........................................................ 25 2.2.3.5 Routes to competitiveness of fuels from gasified biomass........ 26
2.3 The Fischer-Tropsch synthesis .............................................................. 28 2.3.1 Introduction ...................................................................................... 28
2.3.1.1 Drivers for Fischer-Tropsch ....................................................... 28 2.3.1.2. Existing Fischer-Tropsch plants ............................................... 29
2.3.2 FT product distribution ..................................................................... 30 2.3.3 FT synthesis from hydrogen-deficient feedstocks ........................... 31 2.3.4. FT catalysts and kinetics................................................................. 31
2.3.4.1. Metals active for FT .................................................................. 31 2.3.4.2 Definition of H2/CO usage ratio.................................................. 32 2.3.4.3 FT kinetics ................................................................................. 33
2.3.5 Different FT reactor types and reaction conditions .......................... 34 2.3.5.1. High-temperature FT (HTFT).................................................... 35 2.3.5.2 Low-temperature FT (LTFT) ...................................................... 35
2.3.6 Upgrading of FT products to FT fuels .............................................. 37 3 Collection and treatment of data presented in Papers I – IV.................. 40
3.1 Fischer-Tropsch experiments................................................................. 40 3.2 Calculation of conversion and selectivities............................................. 41
xi

4 Study of the Fischer-Tropsch synthesis with a H2-poor syngas (Papers I and II) .............................................................................................................. 43
4.1 Background ............................................................................................ 43 4.1.1 Possible advantages with direct conversion of H2-poor syngas into FT fuels ..................................................................................................... 43 4.1.2 Studies of the Fischer-Tropsch synthesis with a H2-poor syngas (Papers I and II) ........................................................................................ 44
4.2 Results ................................................................................................... 46 4.2.1 The effect of synthesis gas composition on the Fischer-Tropsch synthesis over Co/γ-Al2O3 and Co-Re/γ-Al2O3 catalysts (Paper I)............ 46 4.2.2 Hydrocarbon production via Fischer-Tropsch synthesis from H2-poor syngas over different Fe-Co/γ-Al2O3 bimetallic catalysts (Paper II).......... 48
5 Development of an alternative preparation technique for Co-based Fischer-Tropsch catalysts (Papers III and IV)............................................. 52
5.1 Background ............................................................................................ 52 5.1.1 Catalyst preparation techniques ...................................................... 52
5.1.1.1 Conventional techniques for preparation of supported metal catalysts................................................................................................. 52 5.1.1.2 Preparation of monodisperse metal particles ............................ 54
5.1.2 The microemulsion (ME) technique ................................................. 57 5.1.2.1 Definition, characteristics and examples ................................... 57 5.1.2.2 Preparation of Co particles via the w/o microemulsion technique............................................................................................................... 61
5.2 Preparation of supported Co catalysts via the w/o microemulsion technique...................................................................................................... 64 5.3 Results ................................................................................................... 67
5.3.1 Performance of a Co/TiO2 catalyst prepared by the ME technique in the FT synthesis........................................................................................ 67
6 Study of the selectivity-governing parameters in the Co-catalysed Fischer-Tropsch reaction (Paper IV)............................................................ 73
6.1 Background ............................................................................................ 73 6.2 Results ................................................................................................... 74
6.2.1 Effect of Co particle size on FT selectivity for particles larger than 8 – 10 nm (Paper IV)....................................................................................... 74 6.2.2 Effect of crystallinity of the Co phase on FT selectivity.................... 75
7 Conclusions ................................................................................................ 78
7.1 FT synthesis with H2-poor syngas.......................................................... 78 7.2 Co particle-size effect on the FT selectivity............................................ 79
8 Acknowledgements.................................................................................... 81 9 References .................................................................................................. 82
xii

xiii

1
Introduction
1.1 Setting the scene Recently, mankind has become aware of the fact that it is facing the largest challenge ever – to secure the energy supply for an increasing population and at the same time to limit the damage to Earth, so that future generations may continue to live on a healthy planet with the biodiversity most of the human beings of today take for granted. The largest threat is that of climate change as a result of anthropogenic emissions of greenhouse gases, primarily CO2. The use of fossil fuels is the major contributor to these emissions. Fossil fuels are also the energy sources that stand for the majority of the world’s primary energy supply, mainly due to their high energy density and hitherto vast concentrated reserves, making their conversion into heat, electricity and transportation fuels simple and economic compared to other feedstocks. In order to cope with the impending problems, immediate action is necessary. This includes reducing the energy consumption (at least per capita), increasing the energy conversion efficiency, fuel switching (e.g. switching to lower carbon-content fuels (from coal to natural gas in power plants)) and using renewable energy (e.g. biofuels). The fossil CO2 emissions would be reduced by these means. Especially the use of renewable energy sources, optimally the direct conversion of sunlight into heat and electricity, is very dependent on R&D. Another method under development for reducing the CO2 emissions is CO2 capture and storage. If a secure and reliable method were developed for this purpose, it would theoretically be possible to use all fossil energy resources without increasing the CO2 concentration in the atmosphere. Being the only renewable energy possible to convert into liquid fuels, biomass, as a means for reducing the CO2 emissions from the transport sector, will play an important role in the near future. Much attention is directed to the so-called second-generation biofuels, which mainly comprise methanol, DME (di-methyl-ether) and Fischer-Tropsch (FT) diesel produced via gasification of woody biomass.
1

1.2 Objective of the thesis The objective of this thesis is to present the laboratory work performed in 2003 – 2007 at the Department of Chemical Technology, KTH, and at the Department of Chemical Engineering, NTNU (the Norwegian University of Science and Technology) in Trondheim. Part of the work has been performed in close cooperation with the
Department of Chemical and Biological Engineering at Chalmers University of Technology. The work has focused on the development of catalysts for the FT reaction with gasified biomass. In order to make the biofuels competitive with the fossil-derived fuels, improvement in for instance yield is important. In the FT process a wide range of hydrocarbons are produced. However, the most valuable product is the diesel achieved upon hydrocracking of the longest hydrocarbons (wax). The highest yield of diesel is obtained by maximising the wax yield. It is therefore a key issue to produce a catalyst with very high selectivity to wax at the same time having a high activity per gram of active metal. It is still not fully understood what parameters of the catalyst are the most important in governing the FT selectivity, whereas it is generally accepted that a highly dispersed active metal gives a higher activity. The research has been focused on investigating if the particle size of the active metal (cobalt) has a major impact on the FT selectivity or not, and also on developing a FT catalyst with higher activity and selectivity to the desired long-chain hydrocarbons. By increasing the overall productivity to desired products per gram of active metal, the catalyst volume may be reduced and hence also the reactor volumes. If the cleaned gas obtained from the gasification of biomass, which has a very low H2/CO ratio, could be used directly for FT synthesis without a water-gas-shift (WGS) unit for adjusting the H2/CO ratio, the efficiency of the BTL (Biomass-To-Liquids) process could theoretically be improved. This concept however needs substantial enhancement of the combined WGS and FT activity of existing catalyst formulations. For the study of the direct conversion of the H2-poor gas obtained upon gasification of biomass, the research in this project has focused on the use of iron as a WGS-active compound.
2
2
Background For clarity, the background has been divided into the following parts:
1. Drivers for biofuels 2. Gasification of biomass and the production of biosyngas 3. The Fischer-Tropsch synthesis
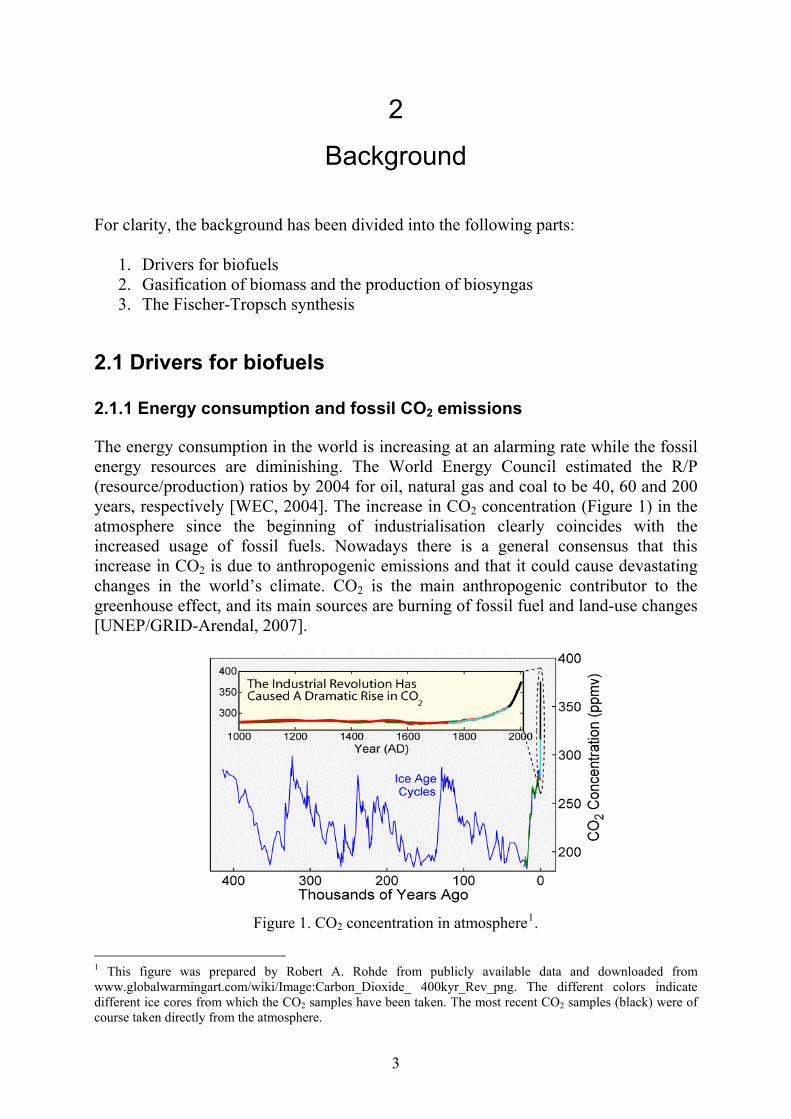
2.1 Drivers for biofuels 2.1.1 Energy consumption and fossil CO2 emissions The energy consumption in the world is increasing at an alarming rate while the fossil energy resources are diminishing. The World Energy Council estimated the R/P (resource/production) ratios by 2004 for oil, natural gas and coal to be 40, 60 and 200 years, respectively [WEC, 2004]. The increase in CO2 concentration (Figure 1) in the atmosphere since the beginning of industrialisation clearly coincides with the increased usage of fossil fuels. Nowadays there is a general consensus that this increase in CO2 is due to anthropogenic emissions and that it could cause devastating changes in the world’s climate. CO2 is the main anthropogenic contributor to the greenhouse effect, and its main sources are burning of fossil fuel and land-use changes [UNEP/GRID-Arendal, 2007].
Figure 1. CO2 concentration in atmosphere1.
1 This figure was prepared by Robert A. Rohde from publicly available data and downloaded from www.globalwarmingart.com/wiki/Image:Carbon_Dioxide_ 400kyr_Rev_png. The different colors indicate different ice cores from which the CO2 samples have been taken. The most recent CO2 samples (black) were of course taken directly from the atmosphere.
3

Fossil energy still accounts for the majority of the energy sources used in the world and in the EU (Figure 2). In Sweden, however, nuclear power dominates. The share of renewable energy sources such as biofuels, wastes, hydroelectric and geothermal/solar/wind power is also much larger in Sweden compared to the world or EU-25 (Figure 2). Sweden takes a second place among the EU member states in the share of renewables of the total primary energy supply per country (29.6 % in 2005) [ECa, 2007]. Latvia comes first with a share of 40 % [ECa, 2007]. Black liquor, a by-product from the kraft pulping process (the sulphate process), is the most important source of biomass energy in countries like Sweden and Finland with large pulp and paper industry [Ekbom, 2005].
World
Gas
Figure 2. Total primary energy supply in 2004 [IEA, 2006]. 1 Mtoe = 0.0419 EJ.
Today, the dependence on imported energy is 50 % in EU-25 and 40 % in Sweden [ECb, 2007]. This share will definitely increase if nothing is done, which is viewed as economically and strategically unacceptable. The transport sector is the one most dependent on fossil energy, mainly oil. In EU-25 and Sweden, transportation stands for 30 % and 24 % of the total final energy consumption, respectively. Figure 3 shows that the CO2 concentration in the atmosphere will continue to increase even if the CO2 emissions were stabilised at today’s level. In order to limit the temperature increase to approximately 2 ºC as compared to pre-industrial times, which is the target set up by the EU in order not to cause irrevocable consequences to the world’s climate, a substantial reduction in CO2 emissions compared to today’s value is required. The mean ground-level air temperature has increased by 0.6 ºC during the last 100 years due to the increased anthropogenic emissions of greenhouse gases (GHG), and the increase during the coming 100 years, if no climate protection
20,6%
clear6,4%
Coal24,7%
Oil35,2%
Hydro2,2%
Comb. renew. & waste10,5%
Geothermal/solar/wind
0,5%
Nu
EU-25
Oil37,6%
Gas23,5%
Geothermal/solar/wind
0,6%
Nuclear14,6%
Comb. renew. & waste
4,1%Hydro1,4% Coal
18,1%
SwedenGeothermal/solar/wind
0,7%Comb. renew. &
waste16,7%
Hydro9,6%
Coal5,4%
Oil28,6%
Gas1,6%
Nuclear37,3%
10,700 Mtoe 1,700 Mtoe 52 Mtoe
World
Gas6%
clear6,4%
Coal24,7%
Oil35,2%
Hydro2,2%
Comb. renew. & waste10,5%
Geothermal/solar/wind
0,5%
20,
Nu
EU-25
Oil37,6%
Gas23,5%
Geothermal/solar/wind
0,6%
Nuclear14,6%
Comb. renew. & waste
4,1%Hydro1,4% Coal
18,1%
SwedenGeothermal/solar/wind
0,7%Comb. renew. &
waste16,7%
Hydro9,6%
Coal5,4%
Oil28,6%
Gas1,6%
Nuclear37,3%
10,700 Mtoe 1,700 Mtoe 52 Mtoe
4

measures are taken into consideration, is estimated by the IPCC (International Panel on Climate Change) to be between 1.4 and 5.8 ºC depending on mankind’s behavior [WBGU, 2004].
0
2
4
6
8
10
12
2000 2100 2200 2300300
400
500
600
700
800
900
2000 2100 2200 23000,0
0,5
1,0
1,5
2,0
2,5
3,0
3,5
2000 2100 2200 2300
CO2 emissions [Gt C/year] CO2 conc. in atmosphere [ppm] Temperature change [ºC]
Constant CO2 emissions at year 2000 level
Emissions path to stabilize CO2 concentration at 550 ppm
Constant CO2 emissions at year 2000 level
Emissions path to stabilize CO2 concentration at 550 ppm Figure 3. Impact of stabilising emissions versus stabilising concentrations of CO2 [IPCC, 2007]. According to a forecast made by the EU Directorate-General for Energy and Transport [ECc, 2007], the world’s population will increase from 6.1 billions (year 2000) to 8.2 billions by 2030. In just Asia, the population is projected to increase by one billion during the same period. The world’s energy consumption is projected to increase from 10 000 Mtoe (year 2000) to 17 000 Mtoe by 2030 if a so-called Baseline scenario is assumed. In the Baseline scenario, a world of abundant oil and gas resources and a relatively moderate economic growth 2000 – 2030 is assumed. During the same time, there would be a threefold increase in fossil CO2 emissions in Asia. In the Baseline scenario, the CO2 emissions in 2030 will be more than twice as high as in 1990. CO2 emissions grow more rapidly than primary energy consumption since a change in the energy mix to more carbon-intensive fuels is forecast. The increased carbon intensity is mainly due to the projected growth of coal use in Asia, and to the projected low growth of nuclear (due to decommissioning) and renewable energies in the world. In the Baseline scenario, the traditional usage of biomass in developing countries will be replaced by commercial energies, and overall a decline in the renewables’ share of the world energy supply is forecast. The World Energy Council [WEC, 2004] projects a substantial increase of non-hydro renewables, but only a total share of renewables of 5 % in 2030 (with wind and bioenergy the leading actors), compared to approximately 13 % in 2004 (see Figure 2). This indicates that strong policy action is needed in order to increase the usage of renewable energies in the world. In the forecast by the EU Directorate-General for Energy and Transport [ECc, 2007], it is clear that primarily the developing countries will be responsible for the increase in world primary energy consumption in the horizon to 2030. In 2000, the energy consumption in Asia represented 26 % of the world’s energy consumption, while it is projected to amount to 37 % by 2030.
5

2.1.2 The Kyoto Protocol and the EU’s strategy on climate change The Kyoto Protocol to the United Nations Framework Convention on Climate Change (UNFCCC) was adopted in December 1997 in Kyoto, Japan. Most Annex II countries (developed countries) agreed to legally binding reductions in GHG emissions of 6 – 8 % below the 1990 levels between the years 2008 – 2012. If they maintain or increase emissions of these gases they are obliged to engage in emissions trading. Sweden’s commitment to the Kyoto Protocol is not to increase the GHG emissions more than 4 % compared to the 1990 level according to the internal agreement in the EU. The Swedish government has however put up a national target of reducing the GHG emissions with 4 %, compared to 1990, during the same period [STEMa, 2007]. The EU has expressed its strategy on climate changes in the following two goals [European Parliament, 2007]:
1. The average world temperature must not increase with more than 2 ºC compared to pre-industrial time.
2. Before 2020, the emissions of CO2 from the developed countries in the world should be reduced with 30 % compared to the level of 1990, and with 60 – 80 % before 2050 (globally, a reduction of 50 % is the goal).
The means by which these goals are to be fulfilled are an increased energy efficiency and therefore a reduction in energy use of 20 % by 2020, and an increased usage of renewable energies, as suggested by the Commission in January 2007. The EU has already undertaken to reduce its energy use with 20 % by 2020, and also to reduce the GHG emissions with 20 % by 2020 compared to the levels of 1990. The EU has also agreed on reducing its GHG emissions with 30 % as part of a satisfactory global agreement on reducing the global emissions after 2012. In March 2007, it was decided that the renewable part of the energy consumption in the EU should increase from 7 % today to 20 % in 2020 [Svebio, 2007]. Since the transport sector stands for most of the CO2 emissions in the EU, it was also decided in March 2007 that by 2020 10 % of the transportation fuels should be renewable. It was also recently decided that the EU will work to stimulate the USA, China, India and the rest of the world to reduce their energy consumption and GHG emissions as well, since the EU only stands for 14 % of the global GHG emissions. This will be implemented by a continuation of the Kyoto Protocol whose targets expire in 2012 [Svebio, 2007]. The current EU Council Directive on biofuels’ share of total amount of sold transportation fuels is 5.75 % by the year 2010 (2003/30/EC).
6
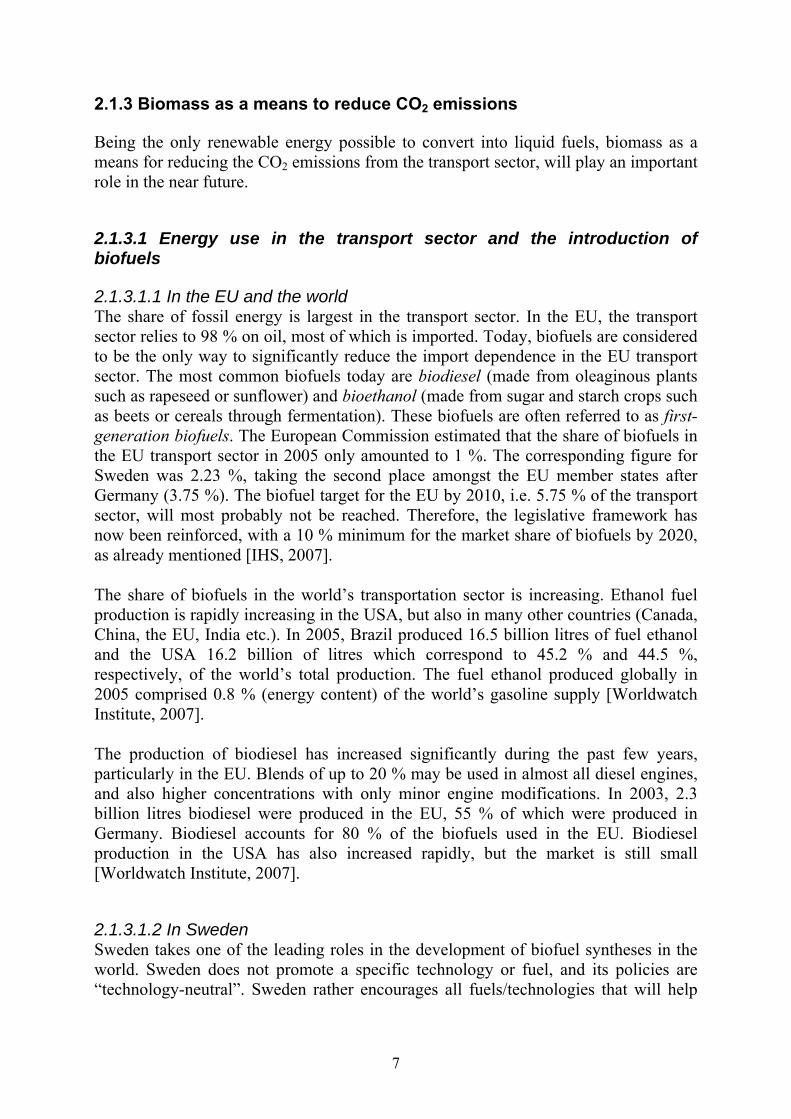
2.1.3 Biomass as a means to reduce CO2 emissions Being the only renewable energy possible to convert into liquid fuels, biomass as a means for reducing the CO2 emissions from the transport sector, will play an important role in the near future. 2.1.3.1 Energy use in the transport sector and the introduction of biofuels 2.1.3.1.1 In the EU and the world The share of fossil energy is largest in the transport sector. In the EU, the transport sector relies to 98 % on oil, most of which is imported. Today, biofuels are considered to be the only way to significantly reduce the import dependence in the EU transport sector. The most common biofuels today are biodiesel (made from oleaginous plants such as rapeseed or sunflower) and bioethanol (made from sugar and starch crops such as beets or cereals through fermentation). These biofuels are often referred to as first-generation biofuels. The European Commission estimated that the share of biofuels in the EU transport sector in 2005 only amounted to 1 %. The corresponding figure for Sweden was 2.23 %, taking the second place amongst the EU member states after Germany (3.75 %). The biofuel target for the EU by 2010, i.e. 5.75 % of the transport sector, will most probably not be reached. Therefore, the legislative framework has now been reinforced, with a 10 % minimum for the market share of biofuels by 2020, as already mentioned [IHS, 2007]. The share of biofuels in the world’s transportation sector is increasing. Ethanol fuel production is rapidly increasing in the USA, but also in many other countries (Canada, China, the EU, India etc.). In 2005, Brazil produced 16.5 billion litres of fuel ethanol and the USA 16.2 billion of litres which correspond to 45.2 % and 44.5 %, respectively, of the world’s total production. The fuel ethanol produced globally in 2005 comprised 0.8 % (energy content) of the world’s gasoline supply [Worldwatch Institute, 2007]. The production of biodiesel has increased significantly during the past few years, particularly in the EU. Blends of up to 20 % may be used in almost all diesel engines, and also higher concentrations with only minor engine modifications. In 2003, 2.3 billion litres biodiesel were produced in the EU, 55 % of which were produced in Germany. Biodiesel accounts for 80 % of the biofuels used in the EU. Biodiesel production in the USA has also increased rapidly, but the market is still small [Worldwatch Institute, 2007]. 2.1.3.1.2 In Sweden Sweden takes one of the leading roles in the development of biofuel syntheses in the world. Sweden does not promote a specific technology or fuel, and its policies are “technology-neutral”. Sweden rather encourages all fuels/technologies that will help
7

the transition from existing systems to future systems, also alternative fossil transportation fuels such as natural gas and synthetic diesel (from natural gas). The final energy consumption in 2002 of the transport sector in Sweden was 8 Mtoe (0.33 EJ), of which 6.8 Mtoe (0.28 EJ) from road transport [ECd, 2004]. The use of alternative fuels, i.e. fuels other than gasoline and diesel (fossil-based), in the transport sector amounted to 0.19 Mtoe (0.0078 EJ, 7.8 PJ) in 2005. The alternative fuels used were ethanol (6.0 PJ), natural gas (0.88 PJ), biogas (0.56 PJ) and FAME (fatty acid methyl esther, “biodiesel”) (0.36 PJ). The gaseous fuels are mainly used in public transport buses. Ethanol is used as a low-blend component (5 %) in almost all 95-octane gasoline sold in Sweden; 5 % ethanol in gasoline is the highest amount permitted according to the European gasoline standard. Ethanol is also available as E85 (85 % ethanol and 15 % gasoline) that may be used in flexifuel vehicles. Domestic ethanol is mainly made from corn in Agroetanol’s plant in Norrköping. Sekab in Örnsköldsvik also produces ethanol, but from by-products from the pulp industry [STEMb, 2006]. FAME is used as a low-blend component (2 %) in diesel, but also as pure FAME. Of the total diesel supply in 2005, 10.5 % contained 2 % FAME [STEMb, 2006]. Since August 2006, a low-blend of 5 % FAME is permitted according to the Swedish diesel standard [Statoil, 2007]. Lately, Sweden has imported large amounts of bioethanol from Brazil, France, Italy and Norway in order to reach the national and the EU targets of renewables’ share of transportation [STEMc, 2006]. The production potential for biofuels in Sweden in 2005 would only amount to 1.1 % of the transportation sector [Ekbom, 2005]. In January 2006, the EU charged duty on bioethanol. The duty is approximately 1.8 SEK/litre, and in Sweden this has resulted in a significant reduction of the import from Brazil while increasing the imports from Southern Europe. The environmental effect of this is considered to be negative since the European-produced ethanol has much lower energy efficiency and greenhouse gas reduction potential than the Brazilian sugarcane ethanol. The biofuels in Sweden are supported by full tax exemption until 2008. Both the Swedish National Environmental Protection Agency and the Swedish Energy Agency believe that tax exemption is not the instrument of control to be used in order to favour Swedish bioethanol production or increase the national competence in biofuel production. Tax exemptions rather tend to favor import of tropical ethanol (in the case of no EU duty on ethanol) with much lower production costs, and also tend to favour bioethanol mixed gasoline more than other biofuels. The Swedish Energy Agency is more positive to the use of market-based instruments of control, and suggests green certificates for biofuels to be used after 2008 [STEMc, 2006].
8

2.1.3.1.3 Next-generation biofuels Many of the first-generation biofuels are not environmentally friendly because plants are used which are grown with too much pesticides and fertilisers that give rise to water and air pollution. The clearing of unspoiled habitats in tropical countries to give way for palm oil plantations is another example of a negative environmental impact. The first-generation biofuels often require considerable energy both to grow the plants and for production [EEB, 2005]. Second-generation biofuels are made from woody biomass instead of agricultural biomass, and mainly via gasification of the biomass. The yield per ha and year is approximately 5 times higher for wood plantations (short rotation forestry) compared to oilseeds [EEB, 2005] and 1.6 times higher compared to cereals [WtW, 2007]. Therefore, the potential for biofuels to make up a significant share of the transport sector is much higher with the second-generation biofuels. The second-generation biofuels also have a significantly higher yield from feedstock into biofuel. Sugarcane for ethanol production, planted in tropical regions, however seems to be a first-generation biofuel competitive with the second-generation ones [Moreira, 2006]. Gasification is a thermal process operated at high temperatures and is described in more detail in 2.2 Gasification of biomass and the production of biosyngas. Since the product from gasification is synthesis gas (syngas), the final liquid fuel depends on the choice of synthesis process down-stream the gasifier. Examples of possible fuels are methanol, ethanol, DME, diesel, gasoline etc. The advantages with the gasification route are the high flexibility in selection of raw material and final product, and that the fuel does not contain sulphur or other heteroatoms that have to be removed up-stream the synthesis in order not to poison the catalyst. Furthermore, the theoretical energy yield, calculated as energy content in fuel divided by energy content in feedstock, is higher compared to the other conversion routes [Agroetanol, 2007]. A restriction with the gasification route is that it will always produce a large amount of steam, both from the gasifier and from the fuel synthesis reactor, and therefore it is necessary to find applications for this heat in the vicinity of the plant. Electricity may be made from high-pressure steam, but for lower steam qualities, a demand for heat must be found in order to make the plant economic and to achieve an acceptably high overall energy efficiency. In a feasibility study [BAL, 1997] a biomass-to-methanol energy efficiency of approximately 46 - 49 % (LHV) was reported for a free-standing self-sufficient methanol plant using gasified woody biomass as feedstock; 12 – 21 % of the biomass energy was converted into heat suitable for district heating, whereas 32 – 39 % was energy losses. Higher biomass-to-methanol efficiencies may be reached by replacing the conventional “wet” low-temperature gas cleaning (i.e. scrubbing) with a so-called advanced “hot gas” cleaning. In the MINO process developed at the Royal Institute of Technology (KTH) and at the Lund University (Faculty of Engineering, LTH) in the late 1970’s, a filter operating at about 400 - 700 ºC for removal of ash and particulates was proposed, up-stream a catalytic reformer converting the tars and CH4 into CO and H2 [Engström, 1981]. Removal of sulphur and CO2 was then performed,
9

after a WGS unit (see 2.2.3.4 Conditioning of the syngas), by standard “wet” low-temperature gas cleaning. For a free-standing self-sufficient MINO process the biomass-to-methanol energy efficiency was estimated to be 54 % (HHV) [Engström, 1981]. Ekbom et al. [2003, 2005] showed in two feasibility studies that integration of a fuel plant with a pulp mill actually increases the biomass-to-fuel energy efficiency to up to 66 – 67 % (LHV) for methanol and DME, and to 65 % (LHV) for total Fischer-Tropsch (FT) products (diesel 43 % and naphtha 22 %). In this case, it is the black liquor from the pulping process that is gasified and converted to fuels. Black liquor is a lignin-rich by-product that contains the cooking chemicals, and it is at present fired in recovery boilers to create the heat and electricity needed in the mill, at the same time as the chemicals are recovered. If transportation fuels are made from the gasified black liquor, some extra biomass must be burnt in a boiler to cover the steam need of the mill, and some electricity will have to be imported (or produced on site by burning more biomass). In the integrated case, the biomass-to-fuel energy efficiencies are based on the extra biomass needed to cover the steam and electricity needs of the pulp mill and fuel plant, and also the extra biomass needed to produce the same excess of electricity as the reference pulp mill which invests in a new recovery boiler instead of a new gasification plant. The higher yields (biomass-to-biofuel) for a biofuel plant integrated with a pulp mill are due to the advantages with integration, so that the different steam qualities produced in the fuel synthesis unit find outlets in the vicinity. The integration with a paper mill is also the reason for why the biomass-to-biofuel yield is similar for methanol/DME and synthetic diesel plus naphtha, while the direct gasification to the FT products (or the yield from black liquor to FT products) is lower. The lower yield from feedstock to gasifier into FT products (50 %) compared to the yields to methanol/DME (56 %) depends on the larger steam production in the FT synthesis unit due to the larger amount of heat released in the synthesis [Ekbom, 2005]. 2.1.3.2 Biomass potential 2.1.3.2.1 In the world and the EU The total biomass production (by photosynthesis) in the world is approximately 4500 EJ/year [WEC, 2004]. Of this, the bioenergy potential is estimated to 2900 EJ/year. Bioenergy embraces woodfuels, agrofuels and fuels derived from urban waste, and hence does not include biomass used for non-energy purposes (food, paper, building timber etc.). Of these 2900 EJ/year only a fraction (approximately 270 EJ/year) could be used in a sustainable and economically competitive way. The current world primary energy utilisation amounts to 450 EJ/year. The World Energy Council reported that estimates of the future potential contribution from bioenergy range between 28 to 450 EJ/year by 2025 – 2050 depending on a research focus scenario (higher) or a demand driven scenario (lower).
10

A recent study (IPCC-TAR, 2001) estimates the global primary bioenergy potential from plantations at 440 EJ/year. It assumes that all agricultural lands not needed for food production would be used for forest plantations (1280 Mha) [WEC, 2004]. In a study by Moreira [2006], it was estimated that with the use of 143 Mha in Latin America and Africa for sugarcane production, which are available unexploited lands with convenient warm weather and rainfall, it is possible to produce 164 EJ/year (1147 GJ/ha and year on average) of primary energy and 90 EJ/year of final energy in the form of liquid fuel (alcohol) and electricity. In this estimate, agricultural productivities near the best ones already achievable and biomass gasification technologies, were assumed. According to Smeets and Faaij [2007] the problem is not the availability of the bioenergy, but the sustainable management, and the competitive and affordable delivery of this energy to the end-users. The Biofuels Research Advisory Council [ECe, 2006] calculated that with an estimated mean conversion factor of 55 % (using future technology), the potential amount of biofuels in the EU by 2030 would be up to 174 Mtoe (7.3 EJ, 7300 PJ). A total amount of available primary bioenergy of 316 Mtoe in 2030 was assumed. The comparable estimated demand for liquid transportation fuels in the EU in 2030 is projected by the European Commission to 437 Mtoe. The EU vision on biofuels is that by 2030, at least 25 % of the fuels used in the EU road transport should be biofuels, a substantial part being produced in the EU, but also imported from countries using the sustainable and innovative European technologies for production. In a Well-to-Wheel study [WtW, 2007] performed by the European Commission’s Joint Research Centre, the European Council for Automotive Research (EUCAR) and the oil companies’ co-operation agency CONCAWE, the estimation of the potential of biofuels in Europe is much less optimistic. In this report, the importance of scale in the biofuel production was emphasised. The availability of waste biomass for energy was stated to be much higher than that for conversion to transportation fuels. Heat and combined heat and power plants are economic already on small scales and thus can make use of dispersed resources. Plants for biofuel synthesis, however, are complex and expensive and need to be large to benefit from the economies of scale. The large scale (100 – 200 MWth at least) implies significant logistical problems and transport costs in order to bring enough biomass to the plant. Hence, the conclusion was that only biomass available with a high area density is suited for an economic biofuel production. In case of biofuel production via black liquor gasification, as discussed earlier, the raw material (black liquor) for the fuel synthesis is already in place and hence presents a bioenergy source with very high “area” density. In the Well-to-Wheel study referred to above, it was estimated that the potential for conventional biofuel production (ethanol and biodiesel) in EU by 2010 is 4.2 % of the road fuels market (on an energy basis). However, this would only correspond to a fossil energy save of 2.2 % since these fuels are only partly renewable. The estimation was based on the existing agricultural land available and the potential surplus of cereals and sugar beets, and the assumption that the demand for food crops remain at the level of 2005. If second or third-generation biofuels were produced instead,
11

assuming wood plantations (short rotation crops) instead of cereals surplus (1.57 tons of wood per ton of cereal assumed), and a conservative estimation of wood waste available for biofuel production (only 50 % of the estimated existing wood waste was considered economically viable for biofuel production), the potential for substituting fossil fuels is significantly higher. In all cases, the sugar beet surplus by 2005 was still assumed to be used for conventional bio-ethanol, and the wheat straw (i.e. a cellulosic waste from food crops) to be converted into second-generation ethanol, in total amounting to 113 PJ/year of ethanol for all cases. If the production were aimed at maximum cellulosic ethanol (914 PJ/year), replacing conventional fossil gasoline, 7.1 % of the total EU road market could be covered, saving 5.4 % of the fossil energy used. Aiming the production at maximum synthetic diesel (863 PJ/year) or maximum DME (1339 PJ/year), replacing conventional fossil diesel fuel, 6.8 % or 10.7 % of the total EU road market, respectively, could be covered (including 113 PJ ethanol per year). This would correspond to 6.3 % or 10.1 % saving of the fossil energy used, respectively. The maximum utilisation of hydrogen (1608 PJ/year), a third-generation biofuel, in internal combustion engines (ICE) has the potential to cover 13.7 % of the total EU road market (including 113 PJ ethanol per year), saving 11.4 % of the fossil energy used. If the hydrogen would be used in fuel cells (FC) instead, it has the potential to cover 23.8 % of the total EU road market, saving 21.5 % of the fossil energy used. Figure 4 illustrates the estimation of the Well-to-Wheel study. For some of the second-generation biofuels (synthetic diesel and DME) it was assumed that 50 % of the available wood wastes would be used through the black liquor route (mainly in Scandinavian paper mills). It should be mentioned that each of these scenarios, concentrating on a single fuel, represents an extreme case, and also that the data in Figure 4 do not reflect the overall system energy efficiencies.
12

0
5
10
15
20
25
Fraction of total road fuels market replaced(energy basis for constant distance driven)
Fraction of WtW fossil energy avoided
Conventional biofuels
Max ethanol Max synthetic diesel
Max DME Max hydrogen (ICE)
Max hydrogen (FC)
%
0
5
10
15
20
25
Fraction of total road fuels market replaced(energy basis for constant distance driven)
Fraction of WtW fossil energy avoided
Conventional biofuels
Max ethanol Max synthetic diesel
Max DME Max hydrogen (ICE)
Max hydrogen (FC)
%
Figure 4. Potential of biomass for fossil fuel substitution in the EU [WtW, 2007]. The lower potential of synthetic diesel as compared to DME is mainly due to an inevitable co-production of naphtha in the former case. This naphtha has a very low octane number and was hence not expected be used as is in the transportation sector. Possible outlets for the naphtha are discussed in 2.3.6. Upgrading of FT products to FT fuels. If not used in transportation, the naphtha would substitute fossil energy in another sector. Biogas was not included as an alternative in Figure 4. The reason is that the feedstocks suitable for biogas were considered to be mainly manure, municipal waste and sewage. Also in this case, the availability of the feedstocks was claimed much higher for energy use than the availability for making transport fuels. The potential biogas production for road fuels in EU was estimated to 200 PJ/year. It is also possible to produce biogas from farmed crops, but in the Well-to-Wheel report it was concluded that the high costs of such feedstocks would probably make this option uneconomic compared to other alternatives. Swedish studies [SGC, 2006] show a high potential of biogas from farmed crops or willow measured as energy efficiency. However, biogas plants were reported to be capital intensive relative to their output [WtW, 2007], especially when upgraded gas is required, as is the case for use in transportation. Hence, it was claimed that these plants cannot afford high feedstock costs as may be associated with long-distance transport. Another challenge when it comes to biogas is the fact that this fuel is a gas, which would require significant changes in the fuel distribution net in order to make biogas available for a large part of a country’s vehicle fleet. Generally, the routes that save more fossil fuel are more expensive, why the continuing R&D concerning the second and third-generation biofuels is very important. As mentioned above, the third-generation biofuel hydrogen used in fuel-cell
13

vehicles, is a combination with a very high potential for replacing fossil fuels and hence reducing CO2 emissions. This is mainly due to the significantly higher efficiency of a fuel cell and an electric engine, at least in lab-scale, compared to a combustion engine [WtW, 2007]. 2.1.3.2.2 Activities and possibilities in Sweden The Swedish biofuel research is at present focused on woody biomass as feedstock. The reason is that half of Sweden’s area is covered by forests, whereas only 6 – 7 % by agricultural land. Agriculture is much more energy intensive than forestry. For instance, much more fossil energy is required in agriculture, especially in the plantation, manuring and harvesting, than in forestry. Furthermore, in agriculture large amounts of artificial fertilisers and pesticides are used, which have negative environmental impacts [STEMd, 2004]. Sweden currently has three pilot plants for the development of the production of second-generation biofuels: Chemrec’s black liquor gasification in Piteå [Chemrec, 2007], the EU CHRISGAS project (co-ordinated by Växjö University) aiming at studying the production of DME/methanol or hydrogen from gasified biomass in Värnamo [CHRISGAS, 2007] and ethanol produced from cellulose in Örnsköldsvik (SEKAB E-Technology) [SEKAB, 2007]. There are plans for a commercial demonstration plant producing up to 100 tons of DME/methanol per day from gasified black liquor [Chemrec, 2007]. There are also plans for a commercial demonstration ethanol plant in Örnsköldsvik. The aim of the CHRISGAS project is to create a European biomass gasification research centre. The CHRISGAS project is based on the successful operation of a pilot plant converting biomass into syngas via the MINO process mentioned earlier. This pilot plant was located in Studsvik and operated in 1983 – 1985 [Sjöström, 2007]. Today, the annual bioenergy utilisation in Sweden amounts to 108 TWh (including 44 TWh in spent liquors in the pulp industry) [Oljekommissionen, 2006]. The woody bioenergy (excluding the black liquor) amounts to 63 TWh while that from agricultural land only comprises 1 TWh. The woody bioenergy mainly comprises wastes from forest industries used for heating. The largest biomass resource for energy use in Sweden, and the resource with the highest potential for expansion in the future, is however the wooden remains obtained upon felling, i.e. the tops and branches of the trees, and wood from thinning and clearing as well as wood with no industrial use. The annual bioenergy utilisation in Sweden is expected to grow to 154 TWh by 2020 and 228 TWh by 2050. This would be accomplished by increasing the productivity of the forestry (+ 30 TWh/year by 2050), and by intensive growing of certain species (+ 27 TWh/year by 2050) e.g. thinning-free spruce with a rotation period of 45 years, and by switching some of the agricultural production towards energy crops. The annual agricultural bioenergy potential is estimated to increase from 1 TWh to 32 TWh by 2050, which would be accomplished by cultivating corn, sugar beets, rape seed, Salix, hybrid poplar and aspen (short rotation crops) etc. Also wastes from agriculture such as manure, straw and animal wastes are very suitable for production of biogas via anaerobic digestion [Oljekommissionen, 2006].
14

If all black liquor in Sweden were gasified and converted to transportation fuel, approximately 30 TWh per year of extra biomass would be needed to cover the energy need of the pulp mills and fuel plants. The CO2-neutral black-liquor based fuels could replace approximately 25 – 30 % of the fossil transportation fuels used in Sweden [Ekbom, 2005]. Finally, it should be emphasised that it is not realistic to use the whole of the potential increase in woody bioenergy for biofuels, since the most cost and energy-efficient way to reduce the fossil CO2 emissions is through the use of bioenergy primarily where it may be directly transformed into energy (e.g. in power production and heating/cooling) [EEB, 2005].
15

2.2 Gasification of biomass and the production of biosyngas
2.2.1 Introduction The combustion of biomass to provide heat and power is widely practiced around the world. The technology is commercially available, but the power production from biomass combustion is only economically competitive for inexpensive biomass such as waste from forest industry and agriculture. The overall efficiency from biomass to electricity tends to be rather low, up to 30 % for large-scale units [Bridgwater, 2003]. The gasification of biomass for power production or for synthesis gas (syngas) production is still in the developing stage. By gasifying a solid fuel, such as biomass or coal, a gas turbine in combination with a steam turbine may be used, which allows higher overall electricity efficiencies than when just using a steam turbine. The reason is that by allowing a higher temperature of the gas in a gas turbine than of the steam in a steam turbine, due to material constraints, the Carnot efficiency is improved. Overall electricity efficiencies of up to 50 % may be achieved in large-scale combined-cycle plants [Bridgwater, 2003]. The successful removal of alkali metals from the gasified biomass is the most critical step towards demonstration of pressurised gasifiers, since alkali (e.g. K and Na) may condense on the rotor blades of the gas turbine leading to detrimental corrosion [Sjöström, 2007]. For atmospheric gasifiers, also the removal of tars is critical. Tars are condensable organic compounds with boiling points between 80 and 350 ºC that contain a high degree of aromatic rings [Boerrigter, 2004]. Bridgwater [2003] concluded that atmospheric circulating fluidised-bed (CFB) gasifiers are the ones closest to commercialisation for biomass gasification, since they have proven reliable for a variety of feedstocks and are relatively easily scaled up (to capacities above 100 MWth). Pressurised gasifiers are more complex but have advantages both in combined-cycle applications and in fuel synthesis applications. Entrained-flow (EF) gasifiers were considered the least proven technology and the gasifiers having the lowest market attractiveness. The energy research institute ECN in The Netherlands however considers the pressurised entrained-flow gasifiers the most suitable for biofuel synthesis applications [FT, 2005]. A pressurised biomass gasification demonstration plant (CFB, 18 bar, 18 MW biomass) with a combined cycle for heat and power production was successfully operated in Värnamo 1996 – 2000 [Ståhl, 1999].
16

Currently, the largest interest in biomass gasification is for electricity production. This is due to an easy distribution of the product and also that the product has exactly the same quality as the conventionally produced electricity. Furthermore, the incentives in the EU for renewable electricity are a stimulus. Co-firing of biomass with fossil fuels for power production in conventional power stations is a suitable solution which takes advantage of the economy of scale and reduces the risks and uncertainties. Of course, also biofuels production via biomass gasification is gaining interest, however, facing a more difficult introduction of the products on the conventional fuel market [Bridgwater, 2003].
In 2001, for the first time in the world, ECN successfully produced FT liquids from gasified biomass (willow) up-graded to syngas quality [Boerrigter, 2004]. This was done in a lab-scale reactor. The first pilot plant for producing gasified biomass of fuel synthesis grade was started in 2003 in Freiburg, Germany, by Choren and SüdChemie. The syngas is converted to FT products (mainly diesel) at a capacity of 7.5 bpd (barrels per day). Currently (2007), Choren and Shell are erecting a demo/commercial-scale BTL (biomass-to-liquid) plant in Freiburg, the first in the world, with an expected capacity of 340 bpd (280 bpd SunDiesel, biomass gasifier capacity 50 MWth) [Ekbom, 2005; Choren, 2007]. The Choren FT diesel is currently being introduced to the public arena in collaboration with DaimlerChrysler and Volkswagen. In Güssing in Austria, there is another pilot plant for BTL production [FT, 2005]. In 2005, the black liquor gasification pilot plant in Piteå (see 2.1.3.2.2 Activities and possibilities in Sweden) was inaugurated. The owner of the technology, Chemrec (partly owned by Volvo Technology Transfer), has plans for two demonstration-scale black liquor gasification plants, one of which combined with MeOH/DME synthesis [Chemrec, 2007]. The CHRISGAS gasification project (see 2.1.3.2.2 Activities and possibilities in Sweden) aims at improving the efficiency from biomass to biofuel by performing the gas cleaning with a high-temperature filter (a working temperature of 900 ºC is the target) [Sjöström, 2007]. Recently (March 2007), Finland’s Neste Oil and Stora Enso - an integrated paper, packaging, and forest products company – announced their plans to develop technology for producing biofuels from wood residues. The first step will be to design and build a demonstration plant at Stora Enso’s pulp mill in Varkaus in Finland, and the production is expected to start in 2008 [Stora Enso, 2007].
2.2.2 Gasification of solids 2.2.2.1 Basics in gasification In gasification processes, the conversion of feedstock into product gas is usually not catalysed. However, the fluidised bed material often catalyses the breakdown of the tars formed during the gasification. Gasification of biomass is similar to the gasification of coal, in the sense that it includes the same process steps. Coal and biomass are both mixtures of organic and inorganic compounds. When the solid material is heated to 1000 – 2000 K, thermal cracking reactions take place and radicals form. The organic matter is converted into gases (H2, CH4, aromatics), higher hydrocarbons and a solid residue (char), a process called pyrolysis. The char residue mostly contains carbon and ash. The volatile products undergo secondary gas-phase
17

reactions with the reactive gases to form a complex mixture of organic compounds and syngas components. The ash is formed from mineral matter in case of coal gasification, and from ash-forming compounds in case of biomass. The ash is released as solid or liquid (slag), depending on the temperature [Sjöström, 2007; Moulijn, 2001]. 2.2.2.2 Coal vs biomass gasification The main difference between coal and biomass gasification is the amount of char formed during the pyrolysis. For coal, at least 50 wt% of the feed (moisture and ash-free) is converted into char, while the corresponding figure for biomass is 15 – 20 wt%. The coal char has a very low reactivity and requires a high temperature in order to be gasified. Water is also necessary in the gasification of that char, and a high temperature is required in order to speed up this slow reaction. Due to the smaller amount and higher reactivity of char formed in the pyrolysis of biomass, a lower gasification temperature may be used, which implies that the energy yield (energy content in product gas / energy content of feedstock) is higher for biomass than for coal. The conversion of the biomass char requires a temperature of 800 – 850 ºC. The lower temperature however implies that the product gas contains higher concentration of CH4 and tars compared with coal-derived product gas [Sjöström, 2007]. The typical differences between gasification feedstocks are shown in Table 1. Coal has significantly higher sulphur content than biomass. Increasing the temperature to 1300 – 1400 ºC in the gasifier would reduce the tar concentration significantly. This is however not applicable for biomass gasification since these high temperatures result in sintering of the ash leading to a bed collapse (in case of a fluidised-bed gasifier). The biomass ash sinters at lower temperatures than the coal ash due to a higher content of alkali in the former [Engström, 1981; Sjöström, 2007]. A catalytic reformer / tar cracker is used for converting both the tars and the CH4 into syngas at 900 ºC. The catalytic reformer requires much less oxygen than does the thermal cracking of tars and CH4, why the biomass gasification still attains a higher energy yield than the coal gasification [Sjöström, 2007].
18

Table 1. Typical characteristics of wood, straw and coal [Engström, 1981].
Properties Wood (Salix) Straw Coal Fraction devolatilized at 800 ºC (20 ºC/min) [wt%a]
82
80
30
Heating value (HHV) [MJ/kgb]
19.4 18.6 28.0
Elemental composition [wt%b]
C 48.4 45.2 73.4 H 6.2 5.9 4.8 O 43.0 41.1 10.5 N 1.0 2.6 1.4 S
0.035 0.14 0.22
Ash content [wt%b] 1.4 5.1 9.8 a Moisture/ash-free b Moisture-free
2.2.2.3 Gasification options There are different types of gasifiers (e.g. moving-beds, fluidised-beds, entrained-flow) and different modes of operation (e.g. atmospheric/pressurised, directly/indirectly heated, air/oxygen blown, steam addition or not etc.). For large-scale (> 100 MWth) biomass gasifiers for biofuels production the following is preferred; a fluid bed or entrained-flow pressurised gasifier, directly heated and oxygen-blown [FT, 2005; Tijmensen, 2002]. At atmospheric gasification the product gas must be compressed before it is fed to the combustion chamber in the turbine, or to the fuel synthesis plant. In order to decrease the gas volume and to avoid a too high temperature at compression, the product gas from the atmospheric gasifier is cooled down to about 40 ºC prior to compression. In case of power production, the need for cooling of the gas reduces the exergy efficiency. By using pressurised gasification in power production, the compression of product gas is avoided and hence no cooling is needed and the system obtains higher exergy efficiency. Pressurised gasification also reduces the down-stream equipment size, which is favourable for large-scale applications [Sjöström, 2007]. The usage of oxygen instead of air minimises the amount of inerts in the system, and keeps the partial pressures of CO and H2 high. This is important in fuel synthesis applications since high partial pressure of reactants is needed for a high reaction rate in the FT synthesis (more correctly, a high H2 partial pressure) and also for a high selectivity to C5+ [Tijmensen, 2002]. Low concentration of inerts is also required if
19

recycling of the un-reacted syngas is needed. Oxygen instead of air also minimises the equipment size. The high cost of an air separation unit (ASU) however requires a large-scale biofuel plant. The direct heating, i.e. partial oxidation of biomass by introduction of oxygen (or air) into the gasifier, results in less tar formation [FT, 2005]. The higher the temperature used in the gasifier, the higher the concentration of H2 and CO, and the lower the CH4 concentration. The formation of tars is also lower at a higher temperature. In the EF gasifier, the most “feedstock-flexible” gasifier, the space time is very short and hence a high temperature (1100 – 1400 ºC) is needed in order for the biomass to react. The reactor is of a plug-flow type and the coal/biomass particles react co-currently with steam and oxygen. The high temperature however also gasifies the alkali metals in the biomass, i.e. the ash is melted, why there is a risk of slagging on the heat-transferring surfaces of the gasifier. The EF gasifier requires a very finely ground feedstock (< 1 mm). The temperature in the CFB gasifier is lower (800 – 900 ºC), with higher tar content in the product gas as a result. In the CFB, there is also a risk that the ash sinters, hence making the bed material particles sticky leading to agglomeration [FT, 2005]. Typical H2/CO ratios in product gases from biomass gasifiers range between 0.45 and 1.5 [Tijmensen, 2002]. The composition of the product exiting the gasifier depends on all the parameters presented above. Chaudhari et al. [2001] obtained molar H2/CO ratios of up to 6 upon steam gasification of char produced from pyrolysis of biomass. However, the introduction of a large excess of steam into the gasifier is not efficient from an energy point of view [Moulijn, 2001]. Furthermore, the WGS equilibrium is favoured at low temperatures, and hence a separate WGS unit down-stream the gasifier, to increase the H2/CO ratio, is preferred. Gasification of solid fuels is preceded by size reduction, screening, heat treatment, grinding, drying etc. Woody biomass has a moisture content of approximately 45 %, which needs to be lowered to approximately 10 %. The drying operation is the most important pre-treatment since it improves the cold gas efficiency at gasification. The drying may be performed with either flue gases or steam. Since the biofuel synthesis (FT, methanol, DME) produces large amounts of low-quality steams, the steam option is suitable. Drying with steam also eliminates the risks of explosion, and simplifies the purification of the waste streams [FT, 2005]. Drying by torrefaction is an alternative technique applicable for EF gasifiers. It converts the biomass to a form much like coal. This reduces the need of electricity for grinding, which is particularly important for the EF gasifiers as they require very fine particle sizes of the feed. The energy need for drying is reduced by 50 %. Torrefaction implies heat treatment at 200 – 300 ºC, in which the biomass is dried in super-heated steam in the absence of air or oxygen. The steam is formed from the water in the biomass. Torrefaction also makes transportation less expensive [FT, 2005].
20

The pressurised gasification of solid biomass requires a gas in order to pressurise the system. Often, CO2 from the gasification (or WGS) is used, at least in biofuel synthesis applications in which the CO2 is removed from the product gas. One form of biomass that is easily pressurised is black liquor. The black liquor gasification process (EF, 32 bar, 950 – 1000 ºC), combined with the necessary recovery of cooking chemicals, has been developed by Chemrec. The black liquor contains approximately half of the organic material initially present in the wood, and all inorganic chemicals that have been added in the cooking/delignification process. Inorganic salts used in the pulping process exist as smelt droplets entrained in the product gas from the gasifier. These are recovered by a quench in the bottom of the gasifier, in which the product gas is rapidly cooled from 950 ºC to 220 ºC by injection of condensate from the cooling tower down-stream the gasifier. The inorganic salts are solidified and separated from the product gas, and subsequently dissolved in the condensate and then treated further to be returned to the pulping process [Ekbom, 2005]. 2.2.3 Production of biosyngas 2.2.3.1 Background The gas obtained upon gasification may be further treated into syngas, i.e. a gas suitable for synthesis of chemicals such as ammonia, methanol, DME, FT fuels etc. The most common processes for syngas production in the world at present are the following [Moulijn, 2001]:
- Steam reforming of natural gas or light hydrocarbons, sometimes in the presence of oxygen (autothermal reforming) or CO2.
- Partial oxidation of heavy hydrocarbons with steam and oxygen. - Partial oxidation of coal with steam and oxygen (gasification).
Reforming of natural gas stands for 84 % of the production of syngas, and the rest is produced from coal; 55 % of the syngas is used in the ammonia synthesis (as feedstock for fertilisers), 24 % in the production of hydrogen used in the oil refineries, and 12 % is used in methanol production. Approximately 8 % of the world’s syngas production is used in the FT plants in South Africa (Sasol) and in the FT plant in Malaysia (Shell) [Boerrigter, 2004]. When producing syngas from natural gas or light hydrocarbons, steam reforming over a catalyst (with indirect heating) is often the preferred route if a high H2/CO ratio is desired. Steam reforming may, however, be performed in the presence of either oxygen or CO2. As indicated above, a combination of steam reforming and partial oxidation is called autothermal reforming, in which the endothermic and exothermic reactions are coupled [Moulijn, 2001]. The high hydrogen content in natural gas naturally gives a higher H2/CO ratio in the syngas compared to that prepared from coal or biomass. This high ratio is often close to 2, as required by for instance the cobalt-catalysed FT synthesis.
21
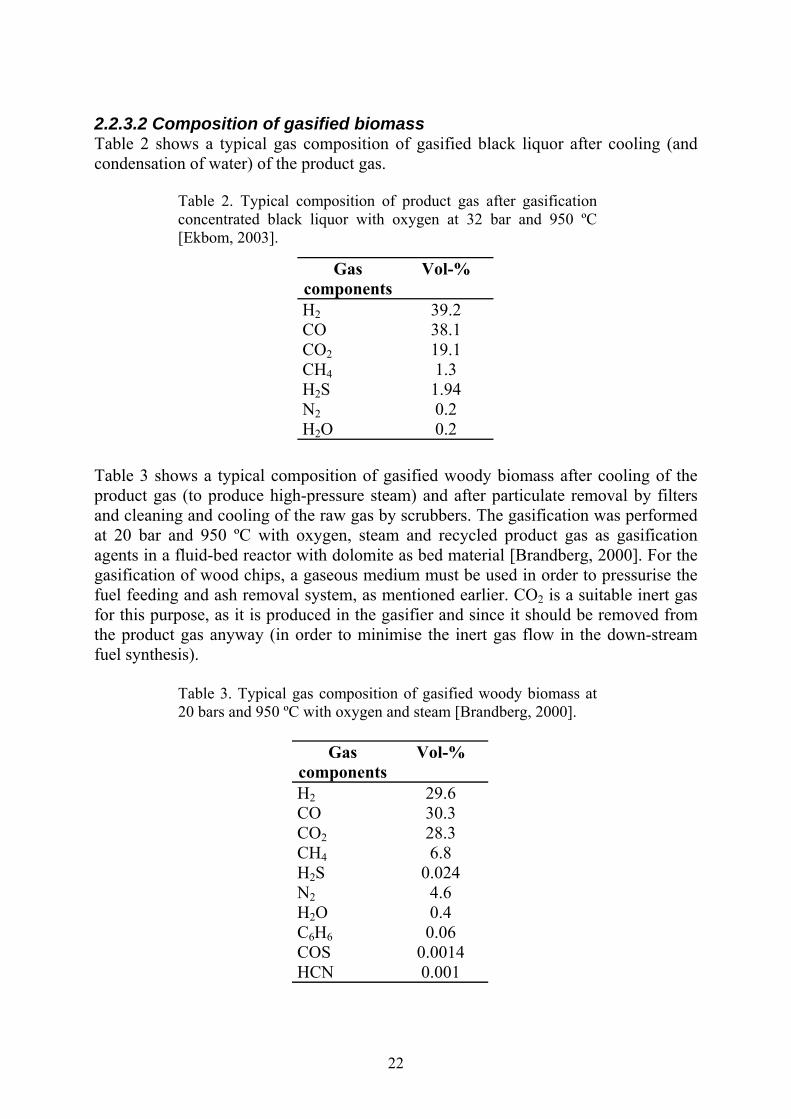
2.2.3.2 Composition of gasified biomass Table 2 shows a typical gas composition of gasified black liquor after cooling (and condensation of water) of the product gas.
Table 2. Typical composition of product gas after gasification concentrated black liquor with oxygen at 32 bar and 950 ºC [Ekbom, 2003].
Gas
componentsVol-%
H2 39.2 CO 38.1 CO2 19.1 CH4 1.3 H2S 1.94 N2 0.2 H2O 0.2
Table 3 shows a typical composition of gasified woody biomass after cooling of the product gas (to produce high-pressure steam) and after particulate removal by filters and cleaning and cooling of the raw gas by scrubbers. The gasification was performed at 20 bar and 950 ºC with oxygen, steam and recycled product gas as gasification agents in a fluid-bed reactor with dolomite as bed material [Brandberg, 2000]. For the gasification of wood chips, a gaseous medium must be used in order to pressurise the fuel feeding and ash removal system, as mentioned earlier. CO2 is a suitable inert gas for this purpose, as it is produced in the gasifier and since it should be removed from the product gas anyway (in order to minimise the inert gas flow in the down-stream fuel synthesis).
Table 3. Typical gas composition of gasified woody biomass at 20 bars and 950 ºC with oxygen and steam [Brandberg, 2000].
Gas
componentsVol-%
H2 29.6 CO 30.3 CO2 28.3 CH4 6.8 H2S 0.024 N2 4.6 H2O 0.4 C6H6 0.06 COS 0.0014 HCN 0.001
22

The sulphur-containing black liquor of course results in much higher sulphur content in the gasifier product gas, while the pressurising with CO2 of the wood chip gasifier results in a higher CO2 content of the product gas. The H2/CO ratio is however close to 1.0 for both cases. The contaminants present in gasified biomass will of course much depend on the feedstock. For instance, crops which have been fertilised with KCl, may contain elevated amounts of chlorine, and sewage sludge contains elevated levels of sulphur compared to straw and wood [Wei, 2005]. 2.2.3.3 Cleaning and upgrading of product gas to syngas Compared to coal ash, biomass ash has a high amount of potassium and chlorine [Wei, 2005]. During combustion or gasification of biomass, significant amounts of chlorine and alkali metals are released into the gas phase, such as HCl, KCl, KOH and NaCl. Gasified biomass also contains for instance H2S, NH3, HCN, COS, condensable tars, and particulates [Tijmensen, 2002]. As mentioned earlier, in the case of atmospherically gasified biomass being used for heat and power generation, the most critical contaminants are the tars. The tars must be removed since they would otherwise condense upon the above-mentioned cooling of the product gas. The state-of-the-art gas cleaning for this purpose includes de-dusting in cyclones, aqueous scrubbers to quench the gas and remove the remaining dust, alkalis, NH3, HCl and to condense most of the tars, and a wet electrostatic precipitator to remove the tar aerosols and dust fines [Boerrigter, 2004]. Removal efficiencies for NH3 and HCl are well above 99 %, while that of tars is approximately 60 %. H2S and COS are not removed. According to Boerrigter et al. [2004] this relatively high tar content is possible to handle for a gas engine as long as the temperature is held above the dew point of the tars in the gas mixture. Such high tar concentrations would not be manageable in a gas turbine since it requires a higher compression [Sjöström, 2007]. In the case of power production via pressurised gasification of biomass, the formed tars do not present any significant problem as they are readily combusted in the turbine combustion chamber [Sjöström, 2007]. The critical contaminants are instead alkali and particulates. Since significant cooling of the product gas is not necessary, as it is already compressed, it is preferable to avoid conventional “wet” low-temperature cleaning. By cooling the product gas down to approximately 400 ºC after the cyclone, the gaseous alkalis will condense on the remaining particulates, which may be removed by a high-temperature filter. The gas is then clean enough to enter the combustion chamber [Sjöström, 2007]. This concept has been demonstrated in the Värnamo plant [Ståhl, 1999], mentioned earlier. The syngas requirements are much more stringent for chemical synthesis than for power generation applications. This is because the active phases of the catalysts used in the fuel synthesis are very sensitive to poisoning. Table 4 shows the concentration of contaminants in gasified wood (poplar) and the maximum values acceptable for FT synthesis.
23

Table 4. Contaminant concentrations and their maximum values for FT synthesis [Tijmensen, 2002].
Contaminant present in dry feedstock
(in product gas)
Poplar wood[wt%]
Assumed cleaning requirements for FT
[ppb]
Ash (particulates) 1.33 0 N (HCN + NH3) 0.47 20 S (H2S + COS) 0.01 10 Alkalis 0.1 10 Cl (HCl) 0.1 10 Pb and Cu 0 Not known Tars -a 0
a Not known, but order of magnitude is g/Nm3.
Many of the required cleaning steps for up-grading gasified biomass to syngas are already performed today for cleaning of reformed natural gas. Typically, solid particles such as dust, ash, soot and volatile alkali metals are removed in a quench. H2S, NH3, HCl, HCN, COS are typical contaminants formed from nitrogen and sulphur in the fuel. The NH3 is removed together with the halides (HCl, HBr, HF) in a water wash. H2S is removed by absorption (if in high concentrations) and in guard beds (ZnO) if in low concentrations. COS and HCN are removed in the guard bed. If they are present in high concentrations, however, it is economic to install a hydrolysis unit to convert them to H2S and NH3. Remaining traces of inorganic contaminants (HCN, COS, HCl, NH3 etc.) are removed by active carbon filters. Although not intentionally, organic compounds such as BTX (benzene, toluene, xylenes) will also be captured by the active carbon filters. This is not wanted since these filters would have to be frequently regenerated. Therefore, it is preferred to remove all organic compounds up-stream the guard beds / filters even though it is not required by the FT synthesis. It has been stated that the removal of BTX, and not the tars, should be the criterion for gas cleaning, as tars are readily removed under the conditions for BTX removal [Boerrigter, 2004]. In the biofuel synthesis it is important to maximise the syngas production. Hence, tars and CH4 should be converted into syngas, preferably in a catalytic reformer with a nickel catalyst. This catalyst works at high temperatures (~ 900 ºC), and it is therefore desirable not to lower the temperature of the product gas out from the gasifier below the temperature of the reformer. However, remaining particulates and ash in the gas after de-dusting in the cyclone must be removed before allowing the gas to enter the catalytic reformer. As with power production by pressurised gasification, a high-temperature filter would be the optimal solution. As alkalis are not harmful to the reformer catalyst, it is not necessary to lower the temperature of the gas to 400 ºC prior to the filter, as is required in the case of power production. The alkalis will pass the
24
filter as long as they are gaseous. The maximum temperature is limited by the temperature tolerance of the filter [Sjöström, 2007]. Down-stream the catalytic reformer the additional cleaning steps mentioned above are performed. Depending on the sulphur content of the gas, the sulphur removal is made before or after the WGS unit. A standard “wet” low-temperature process such as a quench or scrubber could also be used for removal of the remaining particulates (together with other contaminants). This would however result in removal of tars as well, and hence a lower syngas yield. Tijmensen et al. [2002] concluded that the advanced “hot gas” cleaning is an emerging technology that may be economic up-stream of a reformer or WGS unit which both work at rather high temperatures, but not up-stream of a FT reactor since its working temperature is comparably low. Hot gas cleaning after atmospheric gasification is not economic since the gas has to be cooled anyway. CO2 is not a contaminant for the catalysts, but an inert gas diluting the syngas, which in some cases (see 2.2.3.5 Routes to competitiveness of fuels from gasified biomass) is highly undesirable. In the most common CO2 removal processes, sulphur is removed simultaneously. The most common and least expensive process for sulphur and CO2 removal is the absorption in amine solutions (chemical absorbents). This process implies a large CO2 slip, which is acceptable if no recycling of the off-gas from the fuel synthesis reactor is needed. For a more complete sulphur and CO2 removal, more expensive processes are required such as the Selexol or Rectisol process, which include physical absorbents [FT, 2005]. The cleaning system developed for gasified black liquor as described by Ekbom et al. [2005] comprises cooling of the gas and removal of particles/solids in a counter current water scrubber. Then the tars are removed in a pre-wash with methanol from the acid gas removal unit down-stream the pre-wash. In the acid gas removal unit, CO2, H2S and COS are removed by absorption in cold methanol (-60 ºC), the Rectisol process. Due to the high sulphur content of gasified black liquor, the Rectisol unit is needed up-stream of the WGS unit in order to protect the WGS catalyst. The Rectisol process makes it possible to separate the acid gases into a CO2 stream and a H2S/COS-rich stream, which is important since it facilitates the recycling of the sulphur to the pulp mill. The sulphur content is approximately around 1 ppm after the Rectisol unit, which is much too high for a FT catalyst. Therefore a ZnO guard bed prior to the FT reactor is needed to lower the sulphur content to acceptable levels [Ekbom, 2005]. 2.2.3.4 Conditioning of the syngas The main gases in gasified biomass are CO, H2, CH4 and CO2. Their relative concentrations may be adjusted to the application by CH4 reforming, WGS and/or CO2 removal. The reforming of CH4 is made in order to increase the yield of biofuel from the biomass by maximising the syngas yield. The CH4 reforming is typically made in the same reactor as the tar conversion (i.e. in a thermal or catalytic tar cracker/reformer). WGS is performed in order to adjust the H2/CO ratio, an important parameter discussed in Chapter 4, and CO2 removal is crucial if recycling of the un-
25

reacted syngas is performed. For instance in methanol synthesis, the reaction is limited by the equilibrium, and hence only a moderate conversion of the syngas is possible per pass. This implies that recycling of the unreacted syngas is necessary in order to reach a higher total methanol yield. This is a typical case in which CO2 from the gasifier (and possibly also WGS unit) has to be removed prior to the synthesis reactor in order to minimise the bleed-off. The FT synthesis, however, is not limited by equilibrium. Therefore, for Co-based catalysts a very high conversion per pass is possible which essentially removes the need of recycling. However, reforming of the formed lower hydrocarbons and then recycling can still increase the yield to desirable FT products, which implies that CO2 should be removed anyway. Also, if no recycling is made, it is preferred to keep the concentration of inerts low in order to minimise the reactor/equipment size, and in order to avoid the effects of dilution of H2 and CO on the catalyst activity and selectivity. Fe-based FT catalysts are however limited by the reaction product water, why only a moderate conversion per pass is applicable. After water knock-out, the tail-gas is recycled, and hence the concentration of inerts should be low. 2.2.3.5 Routes to competitiveness of fuels from gasified biomass In order to be competitive with the first-generation biofuels, stand-alone (i.e. not integrated with pulp mills) biofuel synthesis plants must benefit from economy of scale, since FT plants are relatively capital intensive. The benefit of economy of scale was reported to be achieved for plants > 1000 MWth [Boerrigter, 2004], while others claim that 400 MWth would be enough [Sjöström, 2007]. The benefit of economy of scale implies that the plant must maximise its biofuel production and minimise its by-products (electricity, heat). According to feasibility studies [Boerrigter, 2004; Engström, 1981], tars and methane should be converted into syngas (H2 + CO) and then fed to the fuel synthesis reactor. Also the lower hydrocarbons formed in the FT synthesis should be reformed back to syngas and recycled to the FT reactor. This implies that the concentrations of inerts (N2 and CO2) are kept low in the system by means of oxygen-blown gasifiers and CO2 removal units. A “soft” maximum of inerts in the syngas introduced to the FT reactor lies around 15 %, assuring that the dilution does not negatively affect the catalyst activity and selectivity to desired products to such an extent that the economy of the overall process is lowered [Boerrigter, 2004]. Boerrigter et al. [2004] reported several suitable system configurations for large-scale biomass-based FT plants. If the low-temperature CFB gasifier is used (900 ºC), a high-temperature tar cracker (1300 ºC) is suitable for converting tars and recycled short hydrocarbons. Another alternative is to perform the actual gasification at a higher temperature (1300 ºC). In that case, fluidised beds are not possible to use, but an entrained-flow gasifier is suitable. In a high-temperature gasifier the lower hydrocarbons produced in the FT reactor could be converted back to syngas directly in the gasifier. As mentioned earlier, another alternative is to use the CFB gasifier followed by a catalytic reformer. In case of a catalytic reformer, the particulates and ash remaining in the gas after the cyclone must first be removed [Sjöström, 2007], which was described 2.2.3.3 Cleaning and upgrading of product gas to syngas.
26

For biofuel production it is desirable to operate the gasifier at higher pressures. This is because the fuel syntheses (FT, DME, methanol) operate at elevated pressures, and hence a pressurised syngas removes the cost of compressing. Furthermore, plants operating at elevated pressures may have higher capacities due to their smaller gas volumes, which in turn means lower investment costs. Tijmensen et al. [2002] also showed a higher overall energy efficiency for pressurised gasifiers, due to the higher electricity consumption of the syngas compressors after atmospheric gasification. Steam for electricity production and heat (for internal needs) are produced at the gasifier when cooling the gas, and also at the possible tar cracker. Only the small part of the off-gas that is not recycled is burned and used for electricity production.
27

2.3 The Fischer-Tropsch synthesis 2.3.1 Introduction 2.3.1.1 Drivers for Fischer-Tropsch The Fischer-Tropsch (FT) synthesis, in which syngas (CO + H2) is converted to liquid fuels such as gasoline and diesel, is also called Gas-To-Liquids (GTL). The FT reactions are often simplified by reaction 2.1.
CO + 2 H2 “-CH2-“ + H2O ΔHR,298K = -165 kJ/mol (2.1) Feedstocks for the syngas can be coal, natural gas, biomass etc. The FT process was discovered in the early 1920’s and has been used from time to time at places short of petroleum, such as Germany during WW2, and in South Africa during the oil embargo. In the last ten years, the FT process has a new gained world-wide interest due to the forecasts about diminishing petroleum reserves, and due to the more stringent emission legislations coming up mainly because of the greenhouse effect. For instance, large new oil fields are often associated with high levels of natural gas, the flaring of which has been charged with taxes due to energy saving politics and CO2-emission legislation. This methane must thus be taken care of in order to recover the crude oil reserves. One possible way is to install a FT plant to convert the methane into liquid [Dry, 2002; Schulz, 1999]. The possibility to convert a gaseous fuel into a more-easy-to-transport liquid fuel by means of the FT process is considered as being an important complement to the LNG (liquefied natural gas) for recovery of newly discovered remote natural-gas reserves. Long-distance transportation of gaseous fuel would otherwise make the recovery of such reserves non-economical. FT fuels also give lower emissions of SOx, NOx and particulates than petroleum-based fuels since they are essentially free from sulphur, nitrogen and aromatics. The FT process is particularly suitable for the production of high-quality diesel, since the products are mainly straight-chain paraffins that possess a high cetane number. A high cetane number results in a cleaner burning of the diesel with reduced harmful emissions [Ekbom, 2005]. In Table 5, the Swedish standard for diesel (Environmental Class 1) and the European and US diesel standards are compared with the properties of a typical FT diesel. The lower density of typical FT diesel results in a slightly lower engine power if no measures are taken. .
28

Table 5. Properties of FT diesel compared with diesel specifications
Property Unit Swedish
diesel (EC 1)a
European diesel
(EN 590:2004)b
US diesel
(S15 (ULSD))d
FT diesele
Sulphur, max
ppm, mg/kg 10 10/50c 15 0
Aromatics, volume, max
% 5 - 35 0
Polycyclic aromatics, mass, max
% - 11 - 0
Cetane number, min
- 51 51 - 70
Cetane index, min
- 50 46 40 -
Density, max
kg/m3 820 845 876 790
a Environmental Class 1 [SPI, 2007] b Euro IV [Hydrocarbon Publishing Company, 2005] c 50 ppm until end of 2008 d Ultra Low Sulfur Diesel [Hydrocarbon Publishing Company, 2005] e [Hydrocarbon Publishing Company, 2005] As mentioned in earlier, there has recently been an increasing interest for the Biomass–To-Liquids (BTL) technology, due to the possibility of producing CO2-neutral liquid fuels. The main advantage of FT diesel as compared to other second-generation biofuels is that it can be blended with conventional diesel in any proportion (0 – 100 %). Furthermore, there is no need for any modifications in the diesel engines or for a new infrastructure system. 2.3.1.2. Existing Fischer-Tropsch plants The commercial-scale FT plants existing in the world today are three coal-based plants in South Africa (150 000 bpd, Sasol), one natural gas-based plant in South Africa (23 000 bpd, PetroSA), and one natural gas-based plant in Malaysia (15 000 bpd, Shell). Within the next few years there will be several commercial-scale natural gas-based FT plants set up in Qatar, a country with huge natural gas resources. The companies active in this country are Qatar Petroleum/Sasol Chevron, Shell, ExxonMobile and ConocoPhillips [Ekbom, 2005].
29

2.3.2 FT product distribution Mainly straight-chain saturated hydrocarbons from CH4 up to heavy waxes may be produced. Some olefins and oxygenates are also produced. The reaction mechanism is a polymerisation process in which the building block, or monomer, is the CH2 unit. Due to the step-wise growth mechanism, the hydrocarbon products will always be a range of products of C1+, described by the ASF (Anderson, Schulz, Flory) distribution, shown in Figure 5 [Dry, 2002]. The chain growth probability, α, is a parameter commonly used to characterise a FT product distribution. A higher α means that the product contains more long-chain hydrocarbons, and hence less CH4. The selectivity of a catalyst to long-chain hydrocarbons is often given as the selectivity to C5+ (SC5+). It is known that the higher the pressure, and the lower the temperature and inlet H2/CO ratio, the higher the α. The chain growth probability is also dependent on the characteristics of the catalyst (e.g. pellet size, pore size, degree of reduction of the active metal, promoters, possibly the active metal particle size etc.). It is commonly accepted that the highest yield to diesel is achieved by first making wax, which is then hydrocracked into the diesel fraction (C12 – C20). In this way the formation of shorter by-products is minimised, especially CH4. Hence, the world-wide FT research is today focused on how to prepare catalysts that give high α [Dry, 2002] A normal α today is around 0.9 for a wax-producing FT process, which roughly corresponds to a C-atom selectivity to C5+ and C10+ of 78 % and 74 %, respectively [Ekbom, 2005; Eilers, 1990].
Figure 5. The ASF distribution.
30

2.3.3 FT synthesis from hydrogen-deficient feedstocks In a FT plant the preparation of purified syngas (CO + H2) accounts for 60 – 70 % of the total capital and running costs. If available, methane is preferred to coal since the capital cost of the methane conversion unit is 30 % lower than that of a coal conversion unit. Furthermore, the methane conversion is more efficient; only 20 % of the C is converted into CO2, while the same figure for coal is 50 % due to the much lower hydrogen content [Dry, 2002]. As already discussed in 2.2.3.2. Composition of gasified biomass, also biomass is deficient in hydrogen. In the case of natural gas as feedstock for the FT synthesis, most of the CO2 produced in the process is due to combustion of part of the natural gas in order to release the heat needed for the endothermal steam-reforming reaction. Coal or biomass as feedstocks for liquid fuels are associated with lower conversion efficiencies (energy in fuel / energy in feedstock). This is mainly due to a deficiency in hydrogen (as compared to carbon) when it comes to building hydrocarbon chains, which implies that much of the carbon must be released as CO2 and hence a large part of the energy content in the feedstock is released as heat during the hydrocarbon synthesis processes (gasification, shift reaction etc.). In order to achieve a high overall plant efficiency, this released heat should find an outlet, which is most easily accomplished if the plant is integrated with an energy-demanding industry, e.g. a pulp mill. Another reason for the lower conversion efficiencies for coal and biomass as opposed to natural gas is the extensive and hence more energy-demanding syngas cleaning. 2.3.4. FT catalysts and kinetics 2.3.4.1. Metals active for FT Fe, Ni, Co and Ru are the only metals that have the FT activity required for commercial applications. If the price of Fe is 1.0, the price of Ni is 250, that of Co is 1000 and that of Ru is 50 000. Ni has too high selectivity to CH4, the price of Ru is far too high and furthermore the availability of this metal is too low for large-scale applications. This means that the Fe and Co are the only feasible metals for FT synthesis. As opposed to Fe, Co is only suitable in the low-temperature FT (LTFT), as higher temperatures result in too high selectivity to CH4 [Dry, 2002]. Because of the much higher price of Co compared to Fe, a high metal utilisation is critical in the case of Co. The Co is therefore dispersed on high-surface area stable supports such as Al2O3, SiO2 or TiO2, typically by impregnating the supports with aqueous solutions of Co salt [Dry, 2002]. These supports are chemically and physically stable in the environments of catalyst preparation, catalyst activation/regeneration and FT reaction. The metal loading is approximately between 10 and 30 g per 100 g support. Usually, the Co catalysts are also promoted with small amounts of platinum-group metals such as Pt, Ru or Re. The promoters are claimed to enhance the reduction process and also to keep the Co metal clean during the FT
31

process. Co catalysts are FT active in their reduced state and therefore in situ reduction in hydrogen is performed prior to the FT synthesis [Dry, 2002]. For Fe-based FT catalysts, the metal dispersion is not critical, due to the lower price of Fe. Fe catalysts suitable for high-α production (i.e. used in LTFT) are obtained through precipitation from nitrate solutions [Schulz, 1999]. The Fe is promoted with Cu and K2O and typically bound with SiO2 or Al2O3. A typical composition of the catalyst is 5 g K2O, 5 g Cu and 25 g SiO2 per 100 g Fe [Dry, 2002; Schulz, 1999]. The “support material” SiO2 is important in order to provide the required mechanical strength, and not added for the sake of increasing metal dispersion [Schulz, 1999]. The Fe catalyst needs alkali promotion in order to be active and stable. Cu may be added in order to promote reduction. Some Mn may be added for increasing the selectivity to olefins. In order to be active the Fe catalysts are often reduced in H2 or in mixtures of H2 and CO. It is not until several iron carbide phases and elemental C are formed that the catalyst is actually working for the FT synthesis. Still, there is iron oxide and some metallic Fe present on the catalyst as well [Schulz, 1999]. The main deactivation reasons for Co and Fe-based FT catalysts are reoxidation of the active phase by water, and poisoning by sulphur. Water has a stronger effect on Fe-based catalysts [Espinoza, 1999], whereas Co is more sensitive to sulphur compounds [FT, 2005]. The rate of oxidation of supported Co catalysts is a function of e.g. the operating temperature, partial pressure of water and crystallite size. Smaller crystallites will oxidise faster than larger ones. This means, as mentioned above, that higher dispersions, which will result in higher surface metal areas and higher activity, will also result in catalysts that are more easily reoxidised. The higher resistance towards reoxidation for Co-based catalysts as compared to Fe-based catalysts allows for longer runs (probably years, in the case of LTFT fixed bed reactors). This means that the removal of sulphur from the synthesis gas feed must be more efficient when using Co catalysts than when using Fe catalysts. For Fe-based catalysts, it was recommended that the amount of S in the synthesis gas should not exceed 0.2 ppm. For Co catalysts, the maximum amount of sulphur in the feed is expected to be much lower. Shell uses a zinc oxide sulphur removal step for their fixed bed reactor-based plant in Malaysia [Espinoza et al., 1999]. 2.3.4.2 Definition of H2/CO usage ratio Over a Co-based catalyst, approximately 2.1 H2 molecules react with 1 molecule of CO to form 1 hydrocarbon unit (-CH2-) and 1 H2O (see reaction (2.1)). This is often referred to as the molar H2/CO usage ratio being 2.1. For Fe-based catalysts, the water-gas-shift (WGS) reaction (reaction 2.2) takes place simultaneously with reaction 2.1 in the reactor, hence lowering the usage ratio, which makes it possible to feed the FT reactor with a molar inlet ratio of H2/CO of less than 2.1. Such hydrogen-poor synthesis gas is obtained from gasified coal or biomass [Dry, 2002].
CO + H2O ↔ CO2 + H2 ΔHR,298K = -41 kJ/mol (2.2)
32
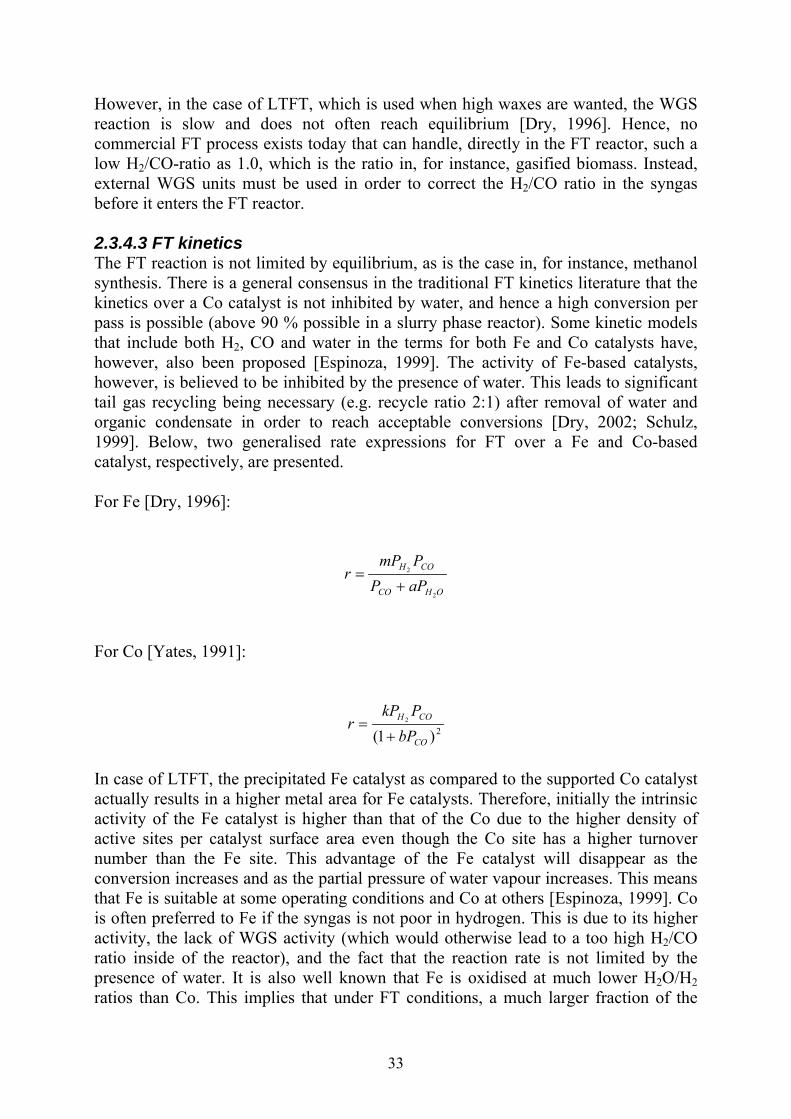
However, in the case of LTFT, which is used when high waxes are wanted, the WGS reaction is slow and does not often reach equilibrium [Dry, 1996]. Hence, no commercial FT process exists today that can handle, directly in the FT reactor, such a low H2/CO-ratio as 1.0, which is the ratio in, for instance, gasified biomass. Instead, external WGS units must be used in order to correct the H2/CO ratio in the syngas before it enters the FT reactor. 2.3.4.3 FT kinetics The FT reaction is not limited by equilibrium, as is the case in, for instance, methanol synthesis. There is a general consensus in the traditional FT kinetics literature that the kinetics over a Co catalyst is not inhibited by water, and hence a high conversion per pass is possible (above 90 % possible in a slurry phase reactor). Some kinetic models that include both H2, CO and water in the terms for both Fe and Co catalysts have, however, also been proposed [Espinoza, 1999]. The activity of Fe-based catalysts, however, is believed to be inhibited by the presence of water. This leads to significant tail gas recycling being necessary (e.g. recycle ratio 2:1) after removal of water and organic condensate in order to reach acceptable conversions [Dry, 2002; Schulz, 1999]. Below, two generalised rate expressions for FT over a Fe and Co-based catalyst, respectively, are presented. For Fe [Dry, 1996]:
OHCO
COH
aPPPmP
r2
2
+=
For Co [Yates, 1991]:
2)1(2
CO
COH
bPPkP
r+
=
In case of LTFT, the precipitated Fe catalyst as compared to the supported Co catalyst actually results in a higher metal area for Fe catalysts. Therefore, initially the intrinsic activity of the Fe catalyst is higher than that of the Co due to the higher density of active sites per catalyst surface area even though the Co site has a higher turnover number than the Fe site. This advantage of the Fe catalyst will disappear as the conversion increases and as the partial pressure of water vapour increases. This means that Fe is suitable at some operating conditions and Co at others [Espinoza, 1999]. Co is often preferred to Fe if the syngas is not poor in hydrogen. This is due to its higher activity, the lack of WGS activity (which would otherwise lead to a too high H2/CO ratio inside of the reactor), and the fact that the reaction rate is not limited by the presence of water. It is also well known that Fe is oxidised at much lower H2O/H2 ratios than Co. This implies that under FT conditions, a much larger fraction of the
33

exposed Fe surface is covered by oxygen at any instant, which results in a loss of active sites as the conversion (and hence the H2O/H2 ratio) increases along the reactor length. This gives Co a large activity advantage over Fe [Dry, 2002]. What limits the conversion per pass over a Co-based catalyst is actually the ability of heat removal in the reactor since the FT reaction is strongly exothermic. An efficient heat removal is a key point in the design of FT reactors, due to the risk of run-away, and also due to the temperature sensitivity of the product selectivity. Several different reactor solutions have been developed for FT during the years. They will be briefly described in the next section. 2.3.5 Different FT reactor types and reaction conditions Economy of scale is very important for syngas production, and therefore the down-stream FT reactors must also have a high capacity. Therefore, the ease of up-scaling is very important when making the selection of type of FT reactor [Dry, 2002]. The LTFT synthesis takes place in a three-phase system. The gas phase contains the reactants and water vapour and gaseous hydrocarbon products. The higher hydrocarbons compose the liquid phase, and the catalyst is the solid phase. During high-temperature FT (HTFT), all products are often vaporised under reaction conditions and hence there are only two phases present [Sie, 1999]. A nearly isothermal reactor, i.e. a reactor in which the temperature control is good, is possible to operate at a slightly higher average temperature than a non-isothermal reactor in which there is risk for hot spots and hence run-away. A slightly higher temperature gives a slightly higher reaction rate, and therefore a higher productivity [Schulz, 1999]. Hence, a reactor with a good temperature control can have a higher productivity per gram catalyst, or put in another way, can host a more active catalyst. High heat exchange rates are today accomplished by forcing the syngas at high linear velocities through long narrow tubes packed with catalyst particles (tubular fixed-bed reactor, TFBR) to achieve turbulent flow with each tube being cooled by boiling water, or by using a slurry phase reactor (SPR) in which the catalyst is dispersed in the liquid products and in which very high heat transfer rates are achieved. For HTFT in which α < 0.71, fluidised catalytic bed reactors are used which have very good heat transfer and temperature equalisation characteristics. Due to the risk of heavy products depositing on the catalyst pellets, fluidised beds cannot be used when high waxes are produced [Dry, 2002; Sie, 1999].
34

There are currently two FT operating modes [Dry, 2002; Wender, 1996]:
1. High-temperature FT (HTFT): 300 – 350 ºC, Fe-based catalysts, production of gasoline and linear low molecular-mass olefines. Significant amounts of oxygenates are also produced. Diesel may be produced by oligomerisation of the olefins.
2. Low-temperature FT (LTFT): 200 – 240 ºC, either Fe- or Co-based catalysts, production of high amounts of paraffins and linear products, the selectivity to high molecular-mass linear waxes can be very high. The primary diesel cut and the hydrocracking of the waxes yield excellent diesel fuels. The primary gasoline cut needs further treatment to obtain a high octane number.
The reactor operating conditions also depend on the reactor type. Typical reactor pressures range between 20 and 45 bar. 2.3.5.1. High-temperature FT (HTFT) In all three Sasol plants the syngas is produced from coal gasification in Lurgi dry-ash gasifiers. The product gas is purified from H2S and excess CO2 is removed. The purified syngas contains ca. 11 % methane due to the high temperature and pressure during gasification. The H2/CO ratio is about 1.8. At the higher temperatures used in the HTFT process, the WGS reaction is rapid and goes to equilibrium, which allows CO2 to be converted to FT products as well. This is accomplished by the reverse WGS followed by the FT reaction. Hence, if the syngas has a H2/(2CO + 3CO2) ratio of 1.05, all of the H2, CO and CO2 may be converted into FT products. Such a gas composition is obtained by catalytically reforming methane (both from the gasifier and from the FT synthesis) in autothermal reactors, and to mix this H2-rich gas with the Lurgi gas. Modern HTFT reactors used in Sasol’s FT plants are of the fixed fluidised bed (FFB) type. The FFB reactors have higher performance than the traditional circulating fluidised beds (CFBs) [Dry, 2002]. For the fluidised HTFT reactors, the catalyst pellets can be small (< 100 μm), and hence internal diffusion limitations are expected to be absent even though the catalyst pores be filled with wax [Dry, 1996]. 2.3.5.2 Low-temperature FT (LTFT) The LTFT process usually has a H2/CO usage ratio of 1.7 if a Fe catalyst is used. The H2/CO ratio from the Lurgi coal gasifiers used by Sasol is about 1.8, so this gas is suitable as feedgas to the wax-producing LTFT units. The Shell plant produces syngas from methane by non-catalytic partial oxidation at high pressure and high temperature (1400 ºC). The H2/CO ratio is about 1.7 which is below the 2.1 required for Co-based catalysts. The ratio is raised by adding the H2-rich
35

gas produced by steam-reforming of the tailgas of the FT reactors (after the removal of water and heavier FT hydrocarbons) [Dry, 2002]. In top-fed multitubular fixed-bed reactors (TFBRs), the waxes trickle down and out of the catalyst bed. In slurry phase reactors (SPRs) the waxes accumulate inside the reactors and so the net wax produced needs to be continuously removed from the reactor [Dry, 2002]. In LTFT, waxes are present in the pores of the catalyst. It is therefore very important to make sure that the reaction rate is not limited by diffusion of the reactants to the active catalyst sites inside the pores, as this would lower the capacity of the catalyst. For reactor configurations that can handle small catalyst pellets, the fact that the pores are filled with wax often does not affect the overall reaction rate since the diffusion distance in small pellets is short. In the SPR, the catalyst pellets can be smaller than in the fixed bed, since they are dispersed in the liquid phase and hence there are essentially no pressure drop constraints [Dry, 1996]. The smaller catalyst pellets prevent internal diffusion limitations on the overall rate. In case of fixed-bed reactors, the catalyst pellet diameter is often larger than 1 mm [Sie, 1999], in order to avoid pressure drop and due to mechanical strength considerations. In this case, egg-shell impregnation is suitable in order to minimise the diffusion distance and hence make use of all impregnated metal [Espinoza, 1999]. The SPR consists of a shell in which cooling coils are present for steam generation. The syngas is fed to the bottom of the reactor and it rises through the slurry. The slurry consists of liquid products (mainly waxes) with catalyst particles suspended in it. The reactant gases diffuse through the liquid phase to the catalyst particles. The heavy products form part of the slurry and the lighter gaseous products and water diffuse through the liquid. The gaseous products and un-reacted reactants pass through the slurry to the freeboard above the slurry bed and then to the gas outlet [Espinoza, 1999]. The slurry phase LTFT process is by many regarded as the most efficient process for FT diesel production today. The following list presents some advantages of the SPR over the TFBR [Dry, 2002; Wender, 1996; Espinoza, 1999]:
- The cost of the reactor is only 25 % of the cost of a multitubular reactor. - The pressure drop over the reactor is four times lower which results in lower
gas compression costs.
- Lower complexity, easier scale-up. - A lower catalyst loading is possible, which results in a four times lower catalyst
consumption per tonne of product.
- The slurry bed may operate at higher temperatures and hence obtain higher average conversions due to the temperature profile being closer to isothermal. A good temperature control makes it easier to control the product selectivities.
36

The SPR can handle catalysts with higher activities than the multitubular fixed-bed reactor can.
- On-line removal/addition of catalyst allows longer reactor runs due to frequent
catalyst renewal, which is necessary in order to obtain a steady selectivity profile for a single reactor.
2.3.6 Upgrading of FT products to FT fuels Hydrocracking is a catalytic oil refinery process where heavy gas oils and vacuum gas oils are converted into lighter products, for example naphtha, kerosene and diesel oil. The process involves the cracking of a relatively heavy oil fraction into lighter products, during which C-C bond breaking takes place, in the presence of hydrogen. Hydrocracking is a very flexible process, which can be aimed at the production of naphtha or at the production of middle distillates, for example diesel fuel. Hydrocracking can be viewed as a combination of hydrogenation and catalytic cracking, and the overall hydrocracking process is exothermic. The hydrogenation requires a hydrogenation catalyst, while the cracking reactions occur via carbenium ions and therefore require an acidic catalyst [Moulijn, 2001]. Isomerisation is another catalytic oil refinery process which involves rearrangement of the atoms within the hydrocarbon molecules. The most important reaction in the isomerisation plant is branching of straight hydrocarbons to increase the octane number. For the sake of upgrading FT products, Shell has developed the Heavy Paraffin Conversion (HPC) that is somewhat of a combined hydrocracker and isomerisation unit, over the same catalyst [Eilers, 1990]. The long, waxy components in the hydrocarbon mixture are hydrocracked selectively to the desired products. Simultaneously, isomerisation occurs to some extent to improve the cold flow properties of the product. An advantage with the HPC is the possibility to use only one catalyst. In the HPC unit in the Shell Middle Distillate Synthesis (SMDS), the operating pressure is 30 – 50 bar and the temperature is 300 - 350 °C [Eilers, 1990]. A suitable catalyst for this process is a 3 wt% platinum catalyst on an alumina-silica support [Barker, 1996]. By varying the severity of the conditions in the HPC and/or the conversion per pass, different product compositions are obtained (Figure 6).
37

0
1
2
3
4
5
6
7
8
9
10
0 10 20 30 40
Carbon number
Pro
duct
com
posi
tion
[wt%
]High-severity hydrocracking
Medium-severity hydrocracking
FT product
0
1
2
3
4
5
6
7
8
9
10
0 10 20 30 40
Carbon number
Pro
duct
com
posi
tion
[wt%
]High-severity hydrocracking
Medium-severity hydrocracking
FT product
Figure 6. Distribution of a Fischer-Tropsch product before and after a selective hydrocracking [Eilers, 1990]. There are different alternatives for the production of the H2 that is needed in the HPC unit. The H2 may be produced by shifting part of the CO in the syngas with steam in a WGS unit prior to the FT reactor, which is suitable if a WGS unit is used anyway in order to correct the H2/CO ratio of the syngas. Or, it may be produced by reforming the C1-C4 fraction from the FT reactor in a separate reformer. The separation of H2 from other gases may be accomplished with for instance a pressure swing adsorption (PSA) unit. There are several alternative outlets for the C1-C4 fraction from the FT reactor. Methane is often not regarded as a product, especially not if natural gas is the feedstock. Therefore, methane is often reformed back to syngas and then fed to the FT reactor again, as described in 2.2.3.5 Routes to competitiveness of fuels from gasified biomass. Olefins of C2 and C3, however, have a high market value since they can be used as feedstocks in the polymer chemistry for production of e.g. polyethylene and polypropylene, respectively, and are therefore often recovered. C3 and C4 hydrocarbons may be oligomerised into gasoline or diesel [Wender, 1996]. In case of a
38

maximum yield of FT fuels, the C1 – C4 fraction may be recycled and reformed/gasified back to syngas, either in a separate reformer or, in case of a high-temperature gasifier, directly in the gasifier or in a tar cracker. The gaseous hydrocarbons and CO2 are typically separated from each other by cryogenic separation [Wender, 1996]. It is also possible to burn part of the FT off-gas to produce power if needed internally. However, as discussed in 2.2.3.5 Routes to competitiveness of fuels from gasified biomass, co-production of FT fuels, heat and excess power is probably not the most economic solution when biomass is the feedstock. This is of course due to the costly syngas conditioning and upgrading - processes necessary for the fuel synthesis but not for heat and power production. The naphtha fraction (C5 – C11) has a very low octane number and hence cannot be used as is in gasoline engines. It is however possible to upgrade it to gasoline, as Sasol does. This requires extensive isomerisation (C5 – C6) and Pt reforming (C7 – C10) [Wender, 1996; Eilers, 1990]. The untreated naphtha could possibly be used as a very low-blending gasoline component [Ekbom, 2005]. Due to the complexity of upgrading the naphtha fraction to gasoline, the biomass-based naphtha will instead probably find use as a “green” chemical feedstock primarily to ethylene and propylene production, and could possibly be used as a green feed to on-board reformers for fuel-cell vehicles due to its high purity [WtW, 2007].
39

3
Collection and treatment of data presented in Papers I – IV
3.1 Fischer-Tropsch experiments The FT synthesis experiments reported in this thesis were carried out in a 0.93 cm i.d. stainless steel fixed bed reactor. A drawing of the experimental set-up is given in Figure 7. Approximately 1 – 1.5 g of calcined Co catalyst (53 – 90 μm) was diluted with inert solid SiC (75 - 150 μm) to achieve a close to isothermal bed temperature profile, the total weight of the bed being 5 g for γ-Al2O3 and above 10 g for TiO2. The larger amount of SiC for the TiO2-supported catalysts was used since these catalysts were more prone to form hot spots in the bed. Reduction of catalyst was made in situ in a H2 flow of 250 Ncm3/min at atmospheric pressure at 623 K or 673 K for 16 hours with a heating rate of 1 K/min from ambient temperature. The catalyst was then cooled to 443 K in flowing H2 and flushed with He for another hour before the reactor system was pressurised to 20 bar. Then a syngas flow of 250 Ncm3/min was introduced with a H2/CO molar ratio of 2.1. The feed also contained 3 mol% of N2 as internal standard. The reactor temperature was then slowly increased to the desired value of 483 K. Product gases were analysed on line by a HP 5890 gas chromatograph equipped with a thermal conductivity detector (TCD) and a flame ionisation detector (FID). A Carbosieve packed column prior to the TCD separated N2, CO, H2, CO2 and H2O, and a GS-Q capillary column prior to the FID separated Cn-hydrocarbons (n = 1 to 9). Initial reactant flow (period I) was 250 Ncm3/min (or gas hourly space velocity (GHSV) 12000 - 15000 Ncm3/gcat.h depending on amount of catalyst) and held for approximately 24 hours. Then the GHSV was lowered to achieve a higher CO conversion (30 % or 40 %) (period II) and held for another 24 hours. The reason for the last step is to be able to compare the product selectivities at similar conversion. In Paper II, however, the GHSV in period II was set to 3000 Ncm3/gcat.h for all catalysts in the study. In period III, 20 % of the feed was water vapour, keeping the syngas flow at the same rate as in period II. In period IV, the water vapour content in the feed was increased to 33 %. In the final period, V, the feed was dry again, and hence the conditions were similar to those in period II. Water is added to the feed in order to simulate the higher water pressures existing in a slurry phase reactor, in order to investigate possible kinetic effects as well as deactivation effects. The introduction of water in the feed, keeping the total pressure constant at 20 bar, implies that the reactant pressures are reduced, and hence a certain decrease in the reaction rate is expected even if water would have no kinetic effect.
40
3.2 Calculation of conversion and selectivities The CO conversion was calculated by comparing the CO/N2 ratio in the outlet gas with that of the inlet (on the TCD). The selectivities given in this thesis are all of “C-atom” type. For instance, a SC5+ (CO2-free) of 80 % indicates that 80 % of the carbon atoms in the CO reacting to hydrocarbons ends up in the C5+ fraction. A total carbon atom SC5+ of 80 % indicates that 80 % of the carbon atoms in the converted CO ends up in the C5+ fraction. The SC5+ (total carbon atom) was calculated according to the following formula:
2415100 COCCC SSS −−= −+
The relative carbon atom selectivities for C1 – C4 hydrocarbons are obtained from the FID analysis. By analysing the concentration of CH4 in the outlet gas on the TCD (by means of the internal standard N2) the absolute selectivities for C1 – C4 hydrocarbons may be calculated.
41

Figure 7. Experimental set-up used for Fischer-Tropsch experiments. Two reactors were run in parallel.
42

4
Study of the Fischer-Tropsch synthesis with a H2-poor syngas (Papers I and II)
4.1 Background 4.1.1 Possible advantages with direct conversion of H2-poor syngas into FT fuels Syngas produced from gasified biomass typically gives a molar H2/CO ratio around 1.0. The stoichiometric ratio needed for the FT reaction is 2.1. There are mainly two options for converting this gas into hydrocarbons (HCs) via the LTFT process:
1. To shift the syngas to a H2/CO ratio of 2.1 in an external WGS unit up-stream the FT reactor, and to use a Co-based FT catalyst (which possesses very low WGS activity). Alternatively, only shift to a H2/CO ratio of 1.8 and use a Fe-based catalyst.
2. To use the H2-poor syngas directly in the FT reactor. This requires development of a catalyst formulation with a very high WGS activity at low temperatures and low water partial pressures, i.e. a catalyst that quickly reacts the formed water from the FT reaction with CO and creates H2 that is used in the FT reaction.
In Papers I and II the direct conversion of a H2-poor syngas into FT products is studied. Examples of potential advantages of internal WGS in the FT reactor, when using H2-poor syngas, are:
- No need for a separate WGS unit and CO2-removal unit up-stream the FT reactor, which is needed if the catalyst has a poor WGS activity.
- Higher thermal efficiency with internal WGS than external.
- If a once-through process is considered, i.e. no recycling needed due to a
high conversion per pass, the separation of CO2 from the tail gas is not necessary. A high conversion per pass would be possible if the water partial pressure is kept low in order to minimise the deactivation and the negative effect on the kinetics for the Fe catalyst. A high WGS activity, as that required for an inlet H2/CO ratio of 1.0, would keep the water partial pressure relatively low in the reactor.
43
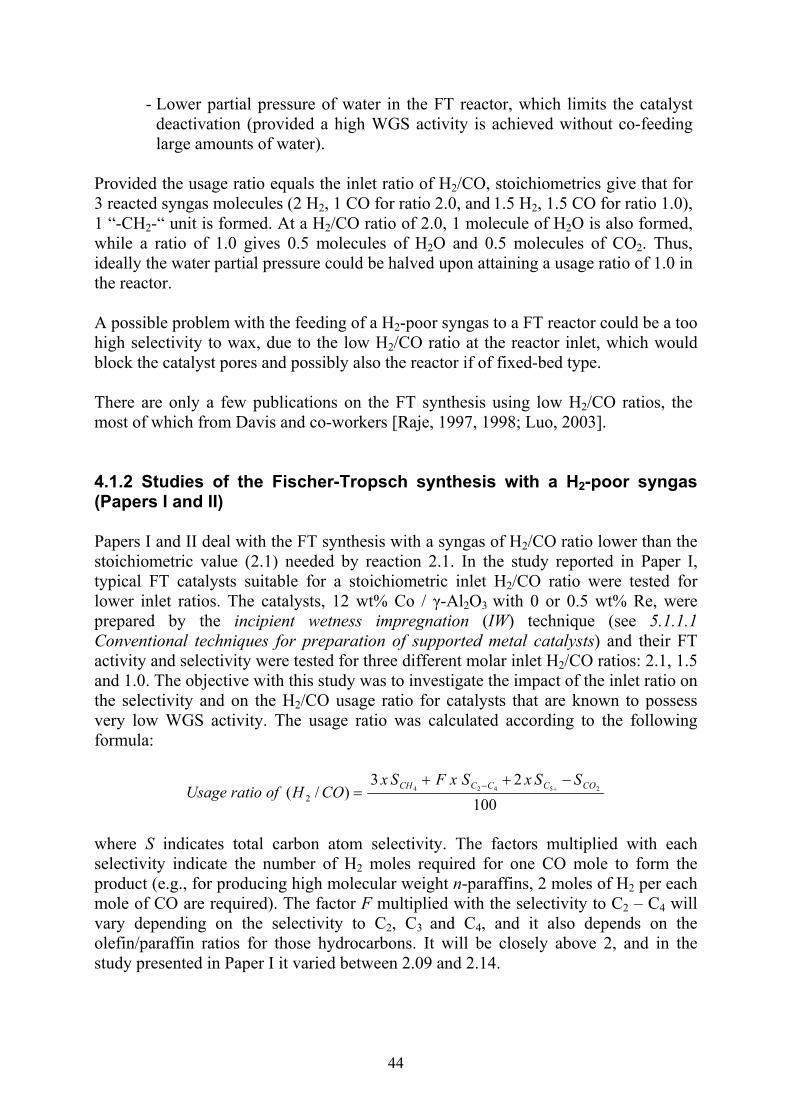
- Lower partial pressure of water in the FT reactor, which limits the catalyst deactivation (provided a high WGS activity is achieved without co-feeding large amounts of water).
Provided the usage ratio equals the inlet ratio of H2/CO, stoichiometrics give that for 3 reacted syngas molecules (2 H2, 1 CO for ratio 2.0, and 1.5 H2, 1.5 CO for ratio 1.0), 1 “-CH2-“ unit is formed. At a H2/CO ratio of 2.0, 1 molecule of H2O is also formed, while a ratio of 1.0 gives 0.5 molecules of H2O and 0.5 molecules of CO2. Thus, ideally the water partial pressure could be halved upon attaining a usage ratio of 1.0 in the reactor. A possible problem with the feeding of a H2-poor syngas to a FT reactor could be a too high selectivity to wax, due to the low H2/CO ratio at the reactor inlet, which would block the catalyst pores and possibly also the reactor if of fixed-bed type. There are only a few publications on the FT synthesis using low H2/CO ratios, the most of which from Davis and co-workers [Raje, 1997, 1998; Luo, 2003]. 4.1.2 Studies of the Fischer-Tropsch synthesis with a H2-poor syngas (Papers I and II) Papers I and II deal with the FT synthesis with a syngas of H2/CO ratio lower than the stoichiometric value (2.1) needed by reaction 2.1. In the study reported in Paper I, typical FT catalysts suitable for a stoichiometric inlet H2/CO ratio were tested for lower inlet ratios. The catalysts, 12 wt% Co / γ-Al2O3 with 0 or 0.5 wt% Re, were prepared by the incipient wetness impregnation (IW) technique (see 5.1.1.1 Conventional techniques for preparation of supported metal catalysts) and their FT activity and selectivity were tested for three different molar inlet H2/CO ratios: 2.1, 1.5 and 1.0. The objective with this study was to investigate the impact of the inlet ratio on the selectivity and on the H2/CO usage ratio for catalysts that are known to possess very low WGS activity. The usage ratio was calculated according to the following formula:
10023
)/( 254242
COCCCCH SSxSxFSxCOHofratioUsage
−++= +−
where S indicates total carbon atom selectivity. The factors multiplied with each selectivity indicate the number of H2 moles required for one CO mole to form the product (e.g., for producing high molecular weight n-paraffins, 2 moles of H2 per each mole of CO are required). The factor F multiplied with the selectivity to C2 – C4 will vary depending on the selectivity to C2, C3 and C4, and it also depends on the olefin/paraffin ratios for those hydrocarbons. It will be closely above 2, and in the study presented in Paper I it varied between 2.09 and 2.14.
44
In order to reach the highest once-trough conversion of the syngas (theoretically 100 %), the H2/CO usage ratio should be equal to the inlet H2/CO ratio [Hamelinck, 2003]. If a FT catalyst shows no WGS activity, its usage ratio is equal to the FT-stoichiometric one, i.e. 2.1. The lower the usage ratio, the higher the “relative” WGS activity, i.e. the WGS activity compared to the FT activity. The lowest theoretically possible usage ratio if no external water is added to the reactor is approximately 0.5. This occurs for the case when all water produced in the FT reaction is consumed in the WGS reaction, as illustrated below: CO + 2H2 “-CH2-“ + H2O CO + H2O CO2 + H2 -------------------------------- 2CO + H2 “-CH2-“ + CO2 usage ratio = 1H2 / 2CO = 0.5 In case of no external water added, the WGS reaction can only take place with the water formed indigenously in the reactor via the FT reaction, and hence the formation of CO2 is only possible if the FT reaction has taken place. In this case, the calculated usage ratio directly provides a measure of how well the combination of the two reactions (FT and WGS) works. Still, in order to be useful commercially for low H2/CO ratio syngases, also a high syngas conversion (see below) and a FT productivity (gHCs/gcat,h) comparable to the productivities obtained with a stoichiometric H2/CO ratio should be attained, or else a separate WGS unit up-stream the FT reactor would probably be preferred. In case of externally added water, CO2 might form without the FT reaction taking place, making a large negative usage ratio theoretically possible. However, also in the case of external water addition, the usage ratio of a catalyst should equal the inlet ratio in order to have a potential of maximising the syngas conversion. The syngas conversion into hydrocarbons is a suitable basis for comparison of catalyst activities as to different inlet H2/CO ratios, since CO conversion then does not make any practical sense. The formula below is based on the number of moles of syngas required to form the FT products. It is assumed that all CH2 units are built from three moles of syngas, except for CH4 that requires four moles of syngas.
syngasofmolesinletxCHofmolesxCHofmolesHCstoconversionSyngas 34 24 +
=
In Paper II, the addition of Fe to a Co catalyst is studied since iron is known to possess a higher WGS activity compared to Co. From the data obtained in the studies presented in Papers I and II it is not possible to elucidate whether the H2 formed in the WGS reaction was used in the FT reaction or not. The usage ratio gives an indication of the WGS activity, but at low syngas conversions there is no proof for that the formed H2 is actually incorporated into the hydrocarbon products, which of course is the goal. The increasing dependency of the FT synthesis on the H2 formed in the WGS
45

reaction with increasing conversion was discussed by Raje et al. [1998]. One test to see if a catalyst with high WGS activity actually is capable of converting the H2-poor syngas into hydrocarbons is to lower the space velocity until the syngas conversion into hydrocarbons is higher than what would be possible without incorporating the H2 formed in the WGS reaction. For instance, it can be calculated that the maximum theoretical conversion of syngas to HCs at a usage ratio of about 2 (i.e. no WGS activity) will decrease from ~100 % at inlet ratio 2.1, to 90 % at inlet ratio 1.5, and finally to 75 % at inlet ratio 1.0. If the H2 produced from the WGS reaction is not made use of in the FT reaction, this would be indicated by difficulties in reaching higher syngas conversions upon lowering of the space velocity. It would also be noticed by that the usage ratio goes below the inlet ratio upon lowering the space velocity (i.e. upon trying to increase the syngas conversion). For the catalysts and reaction conditions studied in Papers I and II, however, a too low usage ratio was never observed. To sum up, a low usage ratio does not necessarily indicate a successful combination of WGS and FT. A successful combination would instead be visible from both a usage ratio close to the inlet ratio, and a high syngas conversion. Moreover, the higher the FT productivity, the better the catalyst.
4.2 Results 4.2.1 The effect of synthesis gas composition on the Fischer-Tropsch synthesis over Co/γ-Al2O3 and Co-Re/γ-Al2O3 catalysts (Paper I) FT synthesis with syngas feeds with H2/CO molar ratios of 2.1, 1.5 and 1.0 were tested over Co/γ-Al2O3 (A) and Co-Re/γ-Al2O3 (B) (12 wt% Co, 0 or 0.5 wt% Re). With lower H2/CO ratios in the feed, the CO conversion and the CH4 selectivity decreased, while generally the C5+ selectivity and olefin/paraffin ratio for C2-C4 increased slightly. The SC5+ is shown in Figure 8.
46

Figure 8. Selectivity (C-atom) to C5+ (CO2-free) for different inlet H2/CO ratios at high and low GHSV. As expected, the WGS activity was low for both catalysts, resulting in high molar usage ratios of H2/CO (close to 2.0), even at the lower inlet ratios (i.e. 1.5 and 1.0). However, there was a trend in the usage ratios to follow the inlet ratios as shown in Figure 9.
Figure 9. Molar H2/CO usage ratio for different GHSVs and inlet molar H2/CO ratios of syngas for Co/Al2O3 (A) and Co-Re/Al2O3 (B). Due to the low WGS activity, the partial pressure of H2 inside the FT reactor was low in comparison with that for a stoichiometric syngas feed (i.e. H2/CO = 2.1), hence lowering the FT rate according to the kinetics described for Co catalysts in 2.3.4.3 FT kinetics. Since the usage ratios all were very high, a satisfactorily high syngas
47

conversion would never be possible with these catalysts. However, it is possible to utilise the advantages of an inlet ratio of 1.0 (higher SC5+, lower SCH4, no water-gas shifting of the bio-syngas needed prior to the FT reactor) if a low syngas conversion is
accepted, as discussed in Paper I.
Catalyst Fe:Co BET surface
area [m2/g catalyst]
Total CO adsorption (first
isotherm) [μmol CO/g
catalyst]
CO chemisorption (first - second
isotherm) [μmol CO/g
catalyst]
Degree of reduction
[%]
(a) 0:100 174 114 74 47 (b) 5:95 156 68 37 48 (c) 15:85 145 65 35 51 (d) 20:80 149 33 13 50 (e) 50:50 153 32 8 49 (f) 80:20 157 38 7 41 (g) 100:0 162 40 7 40
Al2O3 support 195 - - -
4.2.2 Hydrocarbon production via Fischer-Tropsch synthesis from H2-poor syngas over different Fe-Co/γ-Al2O3 bimetallic catalysts (Paper II) In this study, the FT synthesis with a syngas of H2/CO molar ratio of 1.0 was performed over γ-Al2O3-supported catalysts with various ratios of Fe:Co (12 wt% bimetal) prepared by co-impregnation. The higher the Fe content, the lower the SC5+ and C3 olefin/paraffin ratio. It has been reported that Fe needs promotion by alkali in order to reach high α-values [Schulz, 1999]. Water addition increased the SC5+ and C3 olefin/paraffin ratio and reduced the SCH4. The characterisation results are shown in Table 6. Table 6. Characterisation results (BET surface area, CO adsorption and degree of reduction) for the catalysts. An interesting feature of the Fe-Co bimetallic catalysts could be deduced from the CO adsorption results in Table 6. The reason for the distinct decrease in CO uptake with an increased Fe content is believed to be a failure in measuring the number of active sites in the Fe-containing catalysts, since catalysts (a) – (d) all had similar activities at dry conditions and then reasonably should have similar number of active sites. A probable explanation for the low CO uptake is that the Fe is oxidised by traces of H2O or O2 from the ambient air upon evacuation at high temperatures [Guczi, 1981] and that the evacuation time between the two isotherms was too long. Anyhow, the CO adsorption results indicate that Fe is effectively covering the Co sites, reaching full coverage of the Co sites between 20 – 50 % Fe (catalysts d – e). A surface enrichment of Fe in
48

supported Co-Fe bimetallic catalysts was also reported by Duvenhage and Coville [1997]. Also for the Fe-containing catalysts the WGS activity was low, hence resulting in low productivities (per gram catalyst) due to the low partial pressure of H2. A higher Fe:Co ratio in the catalyst generally resulted in higher relative WGS activity, but did not lower the H2/CO usage ratio to the desired value of 1.0, as shown in Figure 10. Although the replacement of Co by small amounts of Fe (5 %) seemed to improve the FT activity for dry conditions (i.e. at no external water addition), it is believed that this is not due to an improved WGS activity but rather due to a slightly higher (site) FT activity of the Co-Fe alloy as reported by Duvenhage and Coville [1997, 2005]. This could be deduced from the Co-Fe catalyst actually having a higher usage ratio than the pure Co catalyst.
25
20
15
10
5
0
Dry feed Reduced GHSV 20% water 33% water Dry feed
2.1
2.0
1.9
1.8
1.7
20
15
10
5
0
0.30
0.20
0.10
0.00
CO
con
vers
ion,
%U
sage
ratio
Sele
ctiv
ity to
CO
2, %
0Fe-100Co; 5Fe- 95Co 15Fe- 85Co; 20Fe-80Co
50Fe-50Co80Fe-20Co
100Fe-0Co
HC fo
rmat
ion
rate
[g
HC
/gca
t..h]
Figure 10. Average hydrocarbon formation rate, CO2 selectivity, usage ratio and CO conversion for the catalysts in different periods. Fe:Co ratio increases to the right in each period.
49

External water was also added in order to boost the WGS reaction. For the Fe-containing catalysts, the hydrocarbon formation rate decreased with increased partial pressure of water or reduced space velocity (see Figures 10 and 11), indicating an inhibition of water on the FT activity, most often resulting in low FT productivity under the conditions with highest relative WGS activity (usage ratios closest to the inlet H2/CO ratio). The catalysts with the highest Fe content (e – g) had significantly lower FT productivities, probably due to a lower site activity of Fe as compared to Co [Li, 2002].
0,00
0,05
0,10
0,15
0,20
0,25
0,30
D
ry (1)
R
educe
d GHSV (2
)
20% H2O in
feed
(3)
33% H2O in
feed
(4)
D
ry (5)
Hyd
roca
rbon
form
atio
n ra
te, g
HC
/gca
t.h (a) 0Fe-100Co(b) 5Fe-95Co(c) 15Fe-85Co(d) 20Fe-80Co(e) 50Fe-50Co(f) 80Fe-20Co(g) 100Fe-0Co
Figure 11. Average hydrocarbon formation rate for the catalysts in different periods.
Interestingly, both FT and WGS activities rapidly decreased at high partial pressure of water. It is well known that water present in the FT reactor readily oxidises the FT active iron species into inactive iron oxides. However, it is believed that the formed phase upon re-oxidation is Fe3O4, which according to Gottschalk and Hutchings [1989] is the active compound for the WGS reaction. Still, the WGS activity rapidly decreases upon high water partial pressures. Since deactivation of the WGS activity
50

due to sintering of active phase is unlikely, as discussed in Paper II, it is proposed that a surface oxidation of WGS-active Fe3O4 into inactive γ-Fe2O3 takes place. The WGS reaction is thermodynamically favoured at low temperatures. However, the WGS kinetics over the tested catalysts is far too slow at the FT reaction temperature used in typical low-temperature FT (LTFT) applications, with diesel as the desired product. In conclusion, for the studied catalysts external water is needed for boosting the WGS, but it also rapidly deactivates the WGS-active sites, resulting in an overall reduction of FT productivity as compared to the productivity for dry conditions. The high usage ratio for dry conditions would however never allow a sufficiently high syngas conversion per pass, as discussed earlier. The fact that different oxidation states of iron are active for either FT or WGS is not convenient, since it will always require the presence of them both. Since some amounts of Fe3O4 is always existing in a reduced Fe-based FT catalyst [Schulz, 1999; Lox 1988] it is always possible to achieve some WGS activity. However, for such a low H2/CO ratio as in gasified biomass, a significant WGS activity is necessary, which would require a much larger fraction of the iron in the Fe3O4 state. If this were achieved, the fraction of iron active for FT would be limited. Hence there is a need for a FT catalyst in which the FT and WGS-active phases can work independently of each other. To sum up, the direct conversion of H2-poor syngas into FT products at low-temperature conditions is in need of development of new catalyst formulations with higher WGS and FT activities and higher stability against re-oxidation by water. Fe-based catalysts probably need promotion by Cu or K to obtain a high WGS activity. Finally, it should be mentioned that the mixing of Fe and Co is questionable since Fe catalysts are known to deactivate much faster than Co catalysts. Promising results for precipitated iron catalysts promoted with small amounts of K have been reported. Luo et al. [2003] attained usage ratios equal to inlet molar H2/CO ratios of 0.7 at 230 ºC at a conversion (of both CO and H2 which is the case for usage ratio = inlet ratio) of about 40 % in a slurry reactor.
51

5
Development of an alternative preparation technique for Co-based Fischer-Tropsch catalysts
(Papers III and IV)
5.1 Background 5.1.1 Catalyst preparation techniques In most catalytic processes, a metal utilisation as high as possible is desirable since it minimises the need for the active metal, and hence reduces the cost. A high utilisation of active metal is accomplished by dispersing the metal into small particles. For most commercial-scale catalytic processes performed at moderate to high temperatures this often implies that the metal particles are supported on an essentially inert carrier material. In general, the smaller the active metal particles, i.e. the larger the fraction of surface active-metal sites, the higher the metal utilisation. For structure sensitive reactions, however, there might be a smallest crystallite size of the active phase that is needed, or a largest crystallite size that is accepted, in order for the desired reaction to occur. Generally, only in crystallites/particles smaller than 4 nm, various sizes result in different active sites exposed [Bezemer, 2006]. However, in the Co-catalysed FT reaction, it is believed that the lower limit in Co particle size is around 6 – 8 nm, smaller particles giving both lower site activities and lower C5+ selectivities [Bezemer, 2006; Barbier, 2001]. For Co particles larger than 10 nm, Storsæter et al. [2005] and Iglesia et al. [1993] found that site activity is independent of particle size. Hence, the conclusion is that small active metal particles most often are desirable, if there is no negative “small-size” influence on site activity or selectivity. In case of FT synthesis, as long as the Co particle size is larger than 8 – 10 nm, smaller Co particles are preferred to larger since they result in a higher activity. The possible FT selectivity dependence of Co particle size above 10 nm is dealt with in Chapter 6. 5.1.1.1 Conventional techniques for preparation of supported metal catalysts The most common techniques for preparation of supported catalysts are the impregnation techniques, in which, typically, a porous support material is impregnated with an aqueous solution of the active metal precursor. If the amount of liquid used for impregnation equals the pore volume of the support, the technique is referred to as incipient wetness impregnation (IW). When using the impregnation techniques, the final metal particle size will inevitably be governed by the morphology, primarily the pore size, of the support material. Large pores result in large metal particles and vice
52

versa. Of course, the final active metal particle size can be affected by using different metal precursors [van de Loosdrecht, 1997], different drying and calcination conditions [Borg, 2007a], different solvents for impregnation etc. The metal loading achievable in one impregnation is limited to the solubility of the metal precursor. However, several impregnations may be made with intermediate drying [Pinna, 1998]. The impregnation may also be in the “wet” mode, i.e. with much more liquid than the pore volume of the support. In this case, the impregnation is often affected by the type and/or concentration of adsorption sites on the surface of the support, if the mixture of support and metal precursor solution is allowed to age for some time. By adjusting the pH of the solution, the surface charge of the support can be modified so as to achieve an opposite charge to that of the metal precursor ions, thereby accomplishing adsorption. OH- and H+ will naturally adsorb on the surface of a positively and negatively charged support, respectively. The exchange between these ions and the added metal precursor ions will in turn be dependent on the pH. Ion-exchange is a kind of ionic adsorption used in the preparation of zeolites or hydrous oxide ion exchangers, in which cations (usually NH4
+ and Na+) are involved in the exchange instead of protons. The loading achievable using wet impregnation is limited to an adsorbed monolayer. However, several layers may be added if intermediate calcination is performed. The wet impregnation technique is most often used for preparation of low-loading precious metal catalysts, with very small metal particles (i.e. high metal dispersion). The distribution of the metal precursor will depend on the concentration of the adsorption sites on the surface of the support [Pinna, 1998]. In the co-precipitation technique, the support and the active phase are formed at the same time. The metal salt and the salt of a compound that will be converted to the support material are dissolved typically in water and precipitated as hydroxides or carbonates by adding a base under stirring. The precursors are then washed and calcined to form the corresponding oxides. Co-precipitation is preferred for metal loadings of 10 – 15 % [Pinna, 1998]. Precipitation may also be used in case of an already existing support. This technique is referred to as deposition-precipitation. In this method, the active phase is prepared by controlled precipitation of the metal precursor, as an hydroxide or carbonate, in a solution containing the support material by slowly adding a base. In order to minimise the final metal particle size, it is desirable that the precipitation occurs in the pores of the support particles, rather than in the bulk of the solution. Urea is preferred as the base as it slowly hydrolyses upon warming to 90 ºC, forming ammonium hydroxide homogeneously distributed in the solution. The rate of precipitation is higher than the rate of hydrolysis, which keeps the pH in the solution constant. After precipitation, the catalyst precursor is washed, dried and calcined to form the corresponding metal oxide supported on the carrier material. One example is the preparation of highly dispersed Co particles onto a porous support, as reported by Lok [2004]. The precipitation is accomplished by heating of a cobalt ammine complex solution in the presence of carbonate ions. As the ammonia is evaporated, cobalt carbonate precipitates on the internal surface of the porous support. The particle size may be altered for instance by
53

varying the temperature and hence the rate of precipitation, the number of depositions, heat treatment etc. A high Co loading was achieved, which is reported to be a difficult task when using the deposition-precipitation technique [Pinna, 1998]. One inherent problem with the conventional preparation techniques mentioned above is that the metal particle-size distribution often is very broad.
5.1.1.2 Preparation of monodisperse metal particles In case of a structure sensitive reaction it may be important to achieve metal particles with a narrow size distribution (ideally particles of monodisperse size). This is also the case in studies of possible particle-size effects on activity and selectivity for a catalytic reaction. Colloidal metal particles are usually small and have a very narrow size distribution. Colloidal means that the particle size is in the range of 1 to 1000 nm. In the field of catalysis, metal colloids have most often been used for catalysis carried out under mild conditions (in solutions) due to the inherent instability of the colloids at high temperatures. Typical reactions catalysed by metal colloids include hydrogenation and isomerisation of olefins (monoenes and dienes) and hydration of acrylonitrile [Yu, 2006]. The colloidal particles are often protected by surfactants/stabilisers which actually may improve the selectivity of a chemical reaction [Bönnemann, 1996]. Metal colloids may be prepared in a number of ways as described by for instance Bönnemann [2004] and Cushing et al. [2004]. Generally, the basis in forming metal colloids is the reduction of metal ions by reducing agents such as formaldehyde, alcohols, CO, H2, H2O2, hydrazine (N2H4
.H2O or N2H4.2HCl), NaBH4 etc. [Cushing,
2004; Schwarz, 1995]. Metal particles in water solutions have a surface charge that may accomplish electrostatic stabilisation of the colloidal dispersion. Such colloids are destabilised by electrolytes, whereas addition of a synthetic polymer may protect the dispersion from coagulation. The polymer may be added before or after the reduction. The simplest method for preparing metal colloids comprises the refluxing of metal salts dissolved in alcohol in the presence of a polymer [Schwarz, 1995]. Metal colloids may also be prepared in non-aqueous solutions. Often, the reducing and stabilising agents may emanate from the same compound. One example is the production of transition metal nanopowders/colloids (e.g. Co), from the metal halides (e.g. CoCl2) by for instance using alkali hydrotriorganoborates, e.g. Na(BR3H) where R is an alkyl group, as reducing agents instead of alkaliborohydrides, such as NaBH4. The BR3 part makes the hydride part (NaH) soluble in organic solvents. Since BR3 is only a “neutral complexing agent” not taking part in the reduction, it is possible to reduce CoCl2 to a nanopowder of metallic Co without any formation of Co2B, which is a problem when using NaBH4. If exchanging the alkali ion for NR4
+, a stable Co colloid will form instead of the un-stabilised Co nanopowder. The reason is that the sterically bulky NR4Cl acts as a colloidal stabiliser right at the reduction centre, hence preventing particle agglomeration and giving monodisperse colloidal metal particles [Bönnemann, 2004]. The NR4Cl salt is easily removed by washing, resulting in clean metal surfaces available for low-temperature catalysis.
54

Another example in which the reducing and stabilising agents emanate from the same compound is the modified ethylene glycol (EG) process. Qiu et al. [2006] reduced cobalt salts with EG in basic solutions, resulting in stable Co colloids. During the reduction, the EG is oxidised into carboxylic acid, which is present in the COO- form at high pH. The COO- adsorbs to the Co particle surfaces thus stabilising the colloid. Bönnemann et al. [1996] showed that it is possible to prepare both organosols and hydrosols of several transition metals. Organosols are colloidal particles dispersed in organic solvents, whereas the colloidal particles in hydrosols are dispersed in water. In which media a colloid is dispersible depends on the characteristics of the stabilising agents (lipophilic or hydrophilic). There are many alternative ways to prepare metal colloids, for instance metal vapour synthesis, electrochemical reduction in the presence of a stabiliser (e.g. a tetra-alkylammonium salt), radiation-assisted (UV-light or γ-radiation) reduction, microwave-assisted co-precipitation and thermal decomposition of metallorganic compounds, all in the presence of a stabilising agent [Cushing, 2004]. Bönnemann et al. [2005] prepared air stable Co-Fe bimetallic particles of a few nanometers by thermolysis of the metal carbonyls in an organic solvent in the presence of aluminium trialkyl. By gentle oxidation of the outmost shell of the particles, an air-stable colloidal solution was achieved. The relatively vast literature on noble-metal colloids is not a coincidence. These metals (Ag, Au, Ru, Rh, Pd, Os, Ir, Pt) have higher reduction potentials than for instance the iron-group metals Co, Fe and Ni, which implies that the ions of the former are more easily reduced into the metals. Furthermore, due to the rather low noble-metal loadings used in catalysis (typically 1 – 2 wt%), the deposition of colloidal noble metals on a support material is not as problematic as the deposition of for instance colloidal Co particles. While the ions of the noble metals are readily reduced by hydrogen or hydrazine, the ions of the iron-group metals require stronger reducing agents such as NaBH4 in order to be reduced at room-temperature [Cushing, 2004]. The immobilisation of metal colloids on a support material may minimise the agglomeration of the colloidal particles, hence conserving the initial catalytic activity in the typical low-temperature processes for a longer time. Yu et al. [1999] performed low-temperature hydrogenation reaction with Pt colloids supported on Al2O3, MgO and TiO2. Bönnemann et al. [1996] reported successful adsorption of Rh, Pd and Pt colloidal particles in aqueous solution onto charcoal simply by mixing the colloid and support and stirring for several hours. The stabilising agent, NR4
+, remained on the surface of the metal particles but did not lower the hydrogenation activity, as compared to an impregnated counterpart (without the stabilisers present). The colloidal particles were located at the outer surface of the support material (“the most exposed sites of the support”).
55

In order to be useful at higher temperatures and on larger scales, as in the FT process, the active metal particles must however be well distributed over the internal surface area of the support material. This is necessary as it would not be possible to reach a high enough metal loading at the same time as conserving the high dispersion of the colloidal particles, if all particles were located at the external surface of the support pellets. It is also important to maximise the use of this internal area for distribution of active metal in order to minimise the catalyst volume and thereby reactor volumes. However, the deposition of colloidal particles into the pores of a porous support material is troublesome [Maksimova, 2004]. Often the stabiliser hinders the sorption of the metal particles to the support material, or the resulting catalyst is inactive due to the stabilizing molecule, or its decomposition products, covering the surface of the active metal. Alternative stabilisers such as polyoxymetalates (e.g. Mo7O24
6- or V10O28
6-) are being developed. Maksimova et al. [2004] prepared noble metal colloids stabilised by polyoxymetalates that were adsorbed onto high surface-area carbon (420 m2/g) simply by mixing the colloidal solution with carbon and stirring for a few hours. The Co colloid reported by Qiu et al. [2006] could be deposited on carbon nanofibers (CNFs) by lowering the pH and then by heating the mixture of colloid and CNFs to 100 ºC. The reduction in pH would convert COO- to COOH (a un-ionised condition) thus lowering the adsorption strength to the Co particles. The heating enabled deposition on the CNFs due to decomposition of the carboxylic acid. In the current study, the microemulsion (ME) technique was used to prepare colloidal Co particles. The ME technique was chosen as an alternative preparation technique to the incipient wetness (IW) technique, in order to prepare small, monodisperse Co particles the size of which is independent of the pore size of the support material. The initial idea was to study a possible effect of different Co particle sizes on the FT selectivity. As the preparation of supported Co catalysts via the ME technique was complicated, the initially intended extensive size-effect study has been limited to the development of a procedure for depositing ME-prepared Co particles mainly onto large-pore support materials.
56

5.1.2 The microemulsion (ME) technique 5.1.2.1 Definition, characteristics and examples A ME is a thermodynamically stable and optically isotropic system of water, oil and surfactant. A surfactant is a compound with both a hydrophobic part and a hydrophilic part, which is added in order to lower the interfacial tension between two insoluble phases. The internal structure of the ME is determined by the relative fractions of these three constituents. The ME either consists of nanometer-sized spherical droplets of the dispersed phase (micelles) in the continuous phase, or of a bicontinuous phase, as shown in Figure 12. At a constant wt% of surfactant in the ME the following is valid; at high water concentrations, spherical oil droplets are dispersed in a continuous water phase – a o/w ME, whereas at high oil concentrations, spherical water droplets are dispersed in a continuous oil phase – a w/o ME (also called reverse micelle system). Figure 12 also indicates the high sensitivity to temperature of the ME [Eriksson, 2004].
Figure 12. The microscopic structure of a microemulsion at a given concentration of surfactant as a function of temperature and water concentration [Eriksson, 2004].
The ME is only formed for certain ratios of the constituents, outside which a two-phase system is formed. The ratios for which the ME exists depend on the system used. A ternary phase diagram is the most common way to illustrate a certain system. Figure 13 shows a section of a ternary phase diagram for the system NP-5 (polyoxyethylene (5) nonylphenyl ether)/cyclohexane/water, which is very similar to the system that was used to prepare Co particles for the studies described in Papers III and IV. ME (1) and ME (2) in Figure 13 represent the compositions of the two MEs studied in Papers III and IV. Especially for non-ionic surfactants (e.g. NP-5), the location/extension of the ME area in the three-component diagram varies with temperature.
57

Water
Oil: Cyclohexane
Surfactant: NP-5
3
15
9
21
3
27
9 15 21 27
wt% water
wt% NP-5
wt% cyclohexane
97
91
85
79
73
ME (1)
ME (2)•
•Water
Oil: Cyclohexane
Surfactant: NP-5
3
15
9
21
3
27
9 15 21 27
wt% water
wt% NP-5
wt% cyclohexane
97
91
85
79
73
Water
Oil: Cyclohexane
Surfactant: NP-5
3
15
9
21
3
27
9 15 21 27
wt% water
wt% NP-5
wt% cyclohexane
97
91
85
79
73
ME (1)
ME (2)•
•
Figure 13. Section of a ternary phase diagram valid at 22 ºC in which the w/o microemulsion area is shaded [Arriagada, 1999]. For the sake of catalyst preparation, the ME technique is viable for producing monodisperse metallic particles of a few nanometers, which have been reported for Pd, Pt, Ru, Rh, Fe, Co etc. [Boutonnet, 1980, 1987, 1991; Touroude, 1992; Ohde, 2002; Kishida, 1996, 1998; Kim, 1997; Hayashi, 2002; Pocoroba, 2001; Agrell, 2001; Zhang, 2004; Nagy, 1989; Chen, 1994]. Another advantage of the ME technique is the possibility of achieving mixing of two or more components on the nanometer scale. This is achievable since each micelle can act as a nano-reactor and by adding a precipitating agent in the form of a ME or as is, to the ME with the metal precursors, the precipitating reactions occur at the same time in all micelles, preserving the high-level mixing of the initial ionic aqueous solutions. Pt-Pd alloys have been prepared at room-temperature in this way [Touroude, 1992]. The ME technique has been used for catalyst preparation in for instance the following areas; hydrogenation of olefins, hydrogenolysis and isomerisation of hydrocarbons, methanol synthesis, CO and CO2 hydrogenation, CO oxidation, electrocatalytic applications etc. [Eriksson, 2004]. Typically, the metal precursor salt is dissolved in the water cores of the reverse micelles, after which the metal ions are reduced into metallic particles by means of adding a reducing agent (H2, hydrazine, NaBH4 etc.). Since bubbled H2 gas results in slow reduction kinetics for many metals at room-temperature, hydrazine and NaBH4 are most commonly used [Cushing, 2004]. The final metallic particle size will depend on several parameters such as water/surfactant ratio (w), the nature of the surfactant
58

and the reducing agent, the use of co-surfactant, metallic ion concentration in the reverse micelles etc. Generally, at a constant wt% of surfactant in the ME, the lower the w the smaller the diameter of the reverse micelles, and the higher the number of micelles. Keeping w constant, an increase in metal-ion concentration increases the number of metal ions in each micelle. The metal-ion concentration may however also affect the number of micelles. Keeping the total number of metal ions in a ME constant, an increase in water content in the ME increases the number of metal ions in each micelle [Nagy, 1989]. The reduction (or precipitation) process is divided into nucleation (slow) followed by particle growth (fast). In order to form a stable nucleus, a minimum number of atoms is required. The nucleus is formed by collision of these atoms (nucleation), a phenomenon the probability of which is much lower than the probability of a collision between an atom and an already formed nucleus (particle growth). Upon reduction, the nucleation can only take place in micelles with enough metal ions to form a nucleus. The nucleation occurs at the very beginning of the reduction. Since MEs are dynamic, the water cores of the micelles rapidly rearrange and are exchanged between the micelles. This implies that metal ions from micelles without nuclei will be brought in contact with the already formed nuclei and thereby participate in their particle growth (aggregation). Since the particle growth is faster than the initial nucleation, no further nucleation will occur after the start of the rearrangement, and as all the nuclei are formed at the same time and grow at the same rate, metal particles of monodisperse size are obtained. Hence, the final particle size will depend on the number of nuclei formed in the beginning of the reduction. The number of nuclei formed, in turn, is determined by the number of micelles containing enough metal ions to form a stable nucleus, and that are reached by the reducing agent before the rearrangement starts. The higher the water content, the faster the rearrangement takes place [Nagy, 1989]. When a ME is reduced, a sol (dispersion of solid particles in a liquid) is formed the stability of which is often not as high as that of the initial ME. This is due to the agglomeration of the formed particles. In the sol, the surfactant molecules adsorb to the surface of the particles. The degree of the agglomeration is much dependent on the ability of the surfactant molecules to keep the particles separated from each other. The final particle size is hence governed both by the number of nuclei formed, and by the surrounding surfactant molecules that govern the degree/rate of agglomeration [Eriksson, 2004; Nagy, 1989]. In order to fix the colloidal metal particles to a porous support material, i.e. immobilisation of the particles, which is necessary for their use in high-temperature commercial-scale catalytic processes, there are a few possibilities. One way is to prepare the support material from a precursor material, typically by a sol-gel or precipitation method, in situ in the presence of the ME or sol. This procedure has shown successful results for Pt, Pd, Ru and Fe supported on SiO2 for CO hydrogenation reactions [Kishida, 1996; Herranz, 2006]. However, one inherent problem with this immobilisation technique is that the metal particles are partly
59

embedded in the support, hence reducing the metal area in contact with the gaseous reactants. Another way to support the small metal particles is by electrostatic deposition. This requires that the metal particles can be re-dispersed in a suitable solution after preparation, and by adjusting the pH of the solution, the surface charge of the support and the particles should be the opposite, thereby attracting each other [Härelid Ingelsten, 2002]. If a low loading of active metal on the support is sufficient, pipetting of the sol onto the support material followed by evaporation of the solvent and washing might be a viable route for immobilisation, as reported by Zhang et al. [2004], who deposited Co-Pt colloids prepared with the ME technique on carbon electrodes for the electrocatalytic oxidation of methanol in an alkaline electrolyte. Another alternative, which also implies deposition of the colloidal metal particles directly onto an already prepared support without first removing them from their initial “solution”, is destabilisation [Boutonnet, 1991]. This is done, for instance, by adding a compound to the sol in which the surfactant is soluble (e.g. tetrahydrofuran (THF) or acetone), in the presence of the support material. By removing the surfactant molecules from the metal particles, the suspension (sol) will become instable and the particles will begin to settle [Eriksson, 2004]. The idea is that the metal particles then stick to the surface of the support material. This method has shown sometimes to be successful, and sometimes not. A successful deposition results in a homogeneous distribution of the metal particles throughout the pores of the support material. A completely failed deposition is visible by the eye, in that the support material (often a white powder) still is white after the destabilisation and stirring, and the metal particles appear as a dark separate phase settled to the bottom of the flask together with the white support powder. The success of the procedure is probably very dependent on the properties of the support material and of the stability of the sol. Barkhuizen et al. [2006] reported the successful deposition of precipitated iron-containing particles prepared in w/o ME onto the support material γ-Al2O3 by destabilisation of the formed sol with acetone. The iron was precipitated by mixing two MEs; one containing aqueous iron nitrate and the other ammonium carbonate. As mentioned above, colloidal metal particles have been made via the ME technique and used in CO hydrogenation (e.g. FT or synthesis of C2+ oxygenates). The active metals used comprise Rh, Pd and Fe [Tago, 2000; Ojeda, 2004; Hayashi, 2002; Kim, 1997; Herranz, 2006]. No publications on the use of colloidal Co particles prepared via the ME technique for FT synthesis applications have been found. Co and Fe are the most suitable metals for FT synthesis (considering activity, selectivity and price) but require rather high metal loadings due to their lower activity compared to for instance Ru. Especially for Co, being about thousand times more expensive than Fe [Dry, 2002], a high utilisation of the metal is desirable. The fact that
60

Co is an iron-group metal and requires high loading (10 – 30 wt% in FT) on a support of course makes the ME preparation route troublesome, but also an interesting challenge! Supporting the colloidal Co particles on a carrier material is necessary in order to keep the high Co utilisation during reaction conditions, in order to avoid pressure drop in case of a fixed-bed reactor (catalyst pellets need to be around 1 mm [Sie, 1999]), and in order to accomplish the separation of the catalyst particles from the FT liquid products in case of a slurry phase reactor (catalyst pellets should be around 30 – 100 μm [Krishna, 2000]). 5.1.2.2 Preparation of Co particles via the w/o microemulsion technique Co-containing particles from Co2+ may be prepared by using CoCl2 and NaBH4 [Chen, 1995; Lu, 1997]. Unfortunately, Co(NO3)2 is not compatible with NaBH4, which is why the chloride must be used, although being a well known catalyst poison. Co2B, which is formed upon reduction of CoCl2 with NaBH4, catalyses the reduction of nitrate to ammonia at room temperature [Pratt, 1969]. The fact that Co(NH3)6
2+ is a stable complex might lead to dissolution of the precipitated Co2B and to formation of this complex. The systems used for Co microemulsions found in literature include H2O/AOT/isooctane (AOT = sodium di-2-ethyl hexylsulfosuccinate, an anionic surfactant) [Chen, 1994], DDAB/toluene (DDAB = didodecyldimethylammonium bromide, a cationic surfactant) [Chen, 1994], H2O/CTAB/hexan-1-ol (CTAB = cetyltriammonium bromide, a cationic surfactant) [Nagy, 1989] and H2O/CTAB(n-butanol)/n-octane [Zhang, 2006]. Nagy [1989] carefully investigated the H2O/CTAB/hexan-1-ol system for Co2+ in the reversed micelles reduced with NaBH4. A molar BH4
-/Co ratio of 3 was used since it was claimed that larger Co-containing particles were formed for lower ratios. The particles formed were thought to consist of Co2B. Some of the results obtained in that study are shown in Figure 14.
61

20
30
40
50
60
70
0 5 10 15
Co2+ concentration * 102 [molal]
Parti
cle
diam
eter
[Å]
A
B
CTAB / hexanol / water
A : 37 % / 45 % / 18 %
B : 40 % / 50 % / 10 %
20
30
40
50
60
70
0 5 10 15
Co2+ concentration * 102 [molal]
Parti
cle
diam
eter
[Å]
A
B
CTAB / hexanol / water
20
30
40
50
60
70
0 5 10 15
Co2+ concentration * 102 [molal]
Parti
cle
diam
eter
[Å]
A
B
CTAB / hexanol / water
A : 37 % / 45 % / 18 %
B : 40 % / 50 % / 10 %
Figure 14. Variation in the average diameter of the Co2B particles as a function of Co2+ molal concentration and of microemulsion composition [Nagy, 1989]. Figure 14 shows the Co2B particle size as a function of ME composition and Co2+ concentration in the ME (molal = mol/kg ME). System (A) has higher w, which reasonably would result in larger micelles than system (B). The Co2+ molal concentration is the same in both systems for each position on the x-axis, which implies that the Co2+ concentration in the water phase is lower in system (A) compared to (B). From this information we cannot draw any conclusion about which system has the highest number of ions in each micelle. The reason for the larger Co2B particles obtained in system (A) is the faster rearrangement due to the higher water content, which in turn results in that the reducing agent reaches fewer micelles before the rearrangement starts and hence fewer nuclei form. The reason for the shapes of the curves for both system (A) and (B), i.e. a minimum in size at intermediate Co2+ concentrations, is that at very low Co2+ concentrations only a few of the water cores in the micelles contain enough ions to form stable nuclei. At higher Co2+ concentrations, more nuclei will be able to form due to a higher number of ions in each water core, hence smaller Co2B particles are formed. At high Co2+ concentrations, when more than 80 % of the micelles contain two or more ions, the increase in number of formed nuclei has leveled out and hence the size of the particles increases again. The lower the water content of the ME, the lower the Co2+ molal concentration at which the Co2B particle size is minimised. In order to form metallic Co particles (and not Co2B), Chen et al. [1995] found that the molar water/surfactant ratio (w) must be low (probably below 1.5). Under these conditions the water molecules are fixed by the hydrophilic end of the surfactant, and cannot participate in the reduction of Co2+, and in that case only Co was obtained. However, the Co2B formed at higher water contents is readily decomposed into Co and B2O3 at room-temperature (sacrifical oxidation) [Glavee, 1992]. The B2O3 may be removed by reaction with water (reaction 4.3) and then by washing with water. Lu et al. [1997] claimed that Co2B is actually not formed, but rather metallic Co and boron,
62

which often is referred to as boride since its composition is similar to that of Co2B. According to Chen et al. [1995], at molar water/surfactant ratios (w) above 1.5, both metallic Co and Co2B are formed. For some noble metals such as silver and gold, the reduction products are pure metals and the boron ends up mainly in H3BO3 [Lu, 1997]. The reactions for formation of Co2B, “sacrifical oxidation” and washing with water may be written as follows [Glavee, 1992]:
2 CoCl2 + 4 NaBH4 + 9 H2O Co2B + 4 NaCl + 12.5 H2 + 3 H3BO3 (4.1)
4 Co2B + 3 O2 8 Co (s) + 2 B2O3 (s) (4.2)
B2O3 + 3 H2O 2 H3BO3 (aq) (4.3) The NaBH4 will react with water, according to reactions 4.4 and 4.5, if it is left for some time before it is added to the ME [Glavee, 1993a].
NaBH4 + 2 H2O NaBO2 + 4 H2 (4.4)
NaBO2 + 2 H2O ↔ NaOH + H3BO3 (4.5)
When the Co2+ is added, it will react with NaBO2 to form Co(BO2)2 instead of Co2B. For the sake of preparation of Co-containing particles of monodisperse size, the actual form of the Co compound is of minor importance as long as the catalyst precursor will be calcined in air, and as long as the boron compound may be removed by washing. As Co2B will be oxidised to Co and B2O3 at room temperature, and the B2O3 reacts with water to form the water soluble H3BO3, a water wash may be performed before the calcination. The formation of Co(BO2)2 might be troublesome if it is not possible to remove the boron from it at room-temperature. The pH of a pure NaBH4 aqueous solution in equilibrium diverges towards 10.7 upon increasing the NaBH4 concentration [Glavee, 1993a]. If NaBH4 reacts with Co2+ before it has the chance to form NaOH, the final pH after complete reaction will be lower than 10.7. An excess of NaBH4, as compared to Co2+, of course results in a final pH closer to 10.7 in the water phase. Since an excess of NaBH4 is needed in order to fully reduce all Co2+ [Glavee, 1993a], it is important that the surfactant can tolerate a high pH. It should be mentioned that only a few reports on supported Co particles prepared via the ME technique have been found in literature. Kleinsorge et al. [2004] prepared Co particles of 2 – 4 nm supported on Si wafer, via a reversed ME with CoCl2 dissolved in the water cores of the micelles, reduced by NaBH4. The colloid was flocculated by addition of an oxygen-free solvent in inert atmosphere and washed from excess surfactant, and finally re-dispersed prior to covering the Si wafer and allowing the solvent to evaporate. All steps were performed under inert atmosphere. Successful deposition of the Co particles onto mesoporous SiO2 powder was also reported, however not in detail [Raja, 2005].
63

5.2 Preparation of supported Co catalysts via the w/o microemulsion technique In Papers III and IV, the FT-related properties of a TiO2-supported Co catalyst prepared via the ME technique are reported. The system H2O/Berol 02/cyclohexane (Berol 02 = polyoxyethylene (6) nonylphenyl ether, a non-ionic surfactant) was used to prepare a ME according to the recipe given in Table 7 (ME(1)). Berol 02 is known to be stable against alkali and other ions [KEMI, 2007]. CoCl2 and HReO4 were dissolved in the water phase and reduced with NaBH4 (molar BH4
-/Co ratio = 3). The BH4
- was added in the form of a fresh (maximum 1 minute old) 10 M aqueous solution of NaBH4 [Chen, 1995]. The reduction step was performed in a N2 atmosphere in a glove bag. The ME was first deoxygenated by flowing N2 through it for a couple of minutes, prior to the dropwise addition of NaBH4 solution. Under the NaBH4 addition, the beaker containing the ME was put in a cold water (10 ºC) bath. Upon exposure to air, the reduced ME changed color from black to brown in approximately one hour, indicating that the metallic Co was oxidised, probably to CoO [Glavee, 1993b].
Table 7. ME (1): w = 13.9 (14.4 if including water added by the 10 M NaBH4 solution).
Composition [wt%]
Co2+ conc. in water phase
[M]
Re7+ conc. in water phase
[mM] Cyclohexane 69.8 Berol 02 19.9 Water phase 10.3 0.12 1.6
Although the support material for the ME-prepared Co particles (or more correctly the Co2B particles) described in Papers III and IV is TiO2, the starting point of the project was to use γ-Al2O3 as support material. The method developed for the successful deposition of Co particles from a sol onto a porous support material, as described in Papers III and IV, is based on efforts with γ-Al2O3 as support and includes the mixing of the support and sol together with the destabilisation agent, acetone. As to the efforts with γ-Al2O3 as support for the ME-prepared Co particles, various composition of the ME and concentrations of Co2+ in the water phase were tested. However, only by following the recipe in Table 7 (ME (1)), the Co phase formed in the ME could be reasonably uniformly deposited onto the γ-Al2O3 support. Higher Co2+ concentrations in the water phase gave less stable sols (after reduction) and upon destabilisation with acetone, no adhesion of the Co phase to the alumina was visible. Lower Co2+ concentrations gave a more stable sol (after reduction), but still the
64

adhesion of the Co phase to the alumina was not satisfactory. By changing the ratio of the three phases (oil/surfactant/water), it should be possible to obtain various particle sizes, as previously reported by Nagy [1989]. However, it was not possible to draw such conclusions from TEM (transmission electron microscopy) analyses of the prepared sols. Anyhow, the recipe of the ME given in Table 7 (ME (1)) seemed to be the most suitable ME for deposition onto γ-Al2O3, in terms of being sufficiently stable not to form agglomerates of Co quickly after reduction with NaBH4, and also in terms of not being too stable which would make the deposition by destabilisation troublesome. One extreme case, though, in which CoCl2 was dissolved in the mixture of Berol 02 and cyclohexane (i.e. not in water) so as to minimise w, actually resulted in clearly visibly (by TEM) smaller Co particles. This sol was very stable and hence a successful deposition of the Co particles onto a support was not accomplished using the conventional destabilisation route. A key step in the preparation of the supported Co catalysts via ME (1) was to add the support material followed by the destabilising agent (acetone) to the sol directly after the reduction of the ME, i.e. when the sol was fresh. Also the addition of all acetone at once, i.e. as opposed to dropwise, seemed crucial for a successful deposition of the particles onto the support. As mentioned earlier, NaBH4 is a very powerful reducing agent, and it has been reported to react with surfactants [Cushing, 2004]. This is probably the reason for why the sol prepared from ME (1) in Table 7 was rather instable. It was naturally destabilised after approximately 2 – 3 h without the addition of a destabilising agent. Due to this instability after addition of the NaBH4 solution, it was found crucial to add both the support material and the acetone quickly (within a couple of min) after the reduction. Otherwise, the sol destabilised due to particle agglomeration rather than due to surfactant removal from the particles, resulting in that no particles stuck to the support material. It is possible that the H2O/NaBH4 ratio in the water cores of the ME affects the stability of the formed sol. At a high H2O/NaBH4 ratio, probably a higher fraction of the BH4
- ions reacts with water according to reactions 4.4 and 4.5, than at lower H2O/NaBH4 ratios. This could theoretically result in a higher pH in the water phase of the sol, hence making it less stable. A higher BH4
- concentration in the water phase (i.e. lower H2O/NaBH4 ratio) probably implies that a larger fraction of the BH4
- ions react with Co2+ according to reaction 4.1 before they have the chance to react with water. It was actually found that, as mentioned earlier, using less water in forming of the ME, according to the recipe in Table 8 (ME (2)), the corresponding sol is much more stable, but also much more problematic to deposit onto a support. By adding an amount of water to the stable sol, approximately giving it the same water/oil/surfactant ratio as in the sol prepared from ME (1), this initially stable sol becomes less stable
65

and hence is much easier to destabilise with acetone. In this way the deposition of the Co particles formed in ME (2) onto TiO2 was made successful. This way of performing the deposition of ME (2) onto γ-Al2O3 has not yet been tested.
Table 8. ME (2): w = 0.8 (2.3 if including water added by the 10 M NaBH4 solution).
Composition
[wt%]
Co2+ conc. in water phase
[M]
Re7+ conc. in water phase
[mM] Cyclohexane 78.9 Berol 02 20.5 Water phase 0.6 6.3 84
As shown in the TEM pictures in Figure 15, the Co particles obtained with recipe ME (2) are smaller than those obtained with ME (1). This was expected due to the much lower w and due to the much higher metal-ion concentration in the water phase for ME (2), resulting in more micelles containing enough metal ions for nucleation. Probably, the higher stability of the sol prepared from ME (2) is mainly due to the smaller particles. It should be made clear that the recipe of ME (2) implies that the metal salt, CoCl2, is dissolved in the mixture of Berol 02 and cyclohexane, i.e. not in water, in order to attain the low w.
20 nm 20 nm
ME (1) ME (2)
20 nm20 nm 20 nm20 nm
ME (1) ME (2)
Figure 15. TEM pictures of the sols obtained upon reduction of ME (1) and ME (2).
After deposition of the Co particles onto a support, careful washing is necessary in order first to remove residual surfactant (washing with ethanol and then acetone), and then to remove the formed NaCl and boron compounds (washing with water). The wash is critical for the final performance of the catalyst as Cl is a severe poison to Co in the FT reaction, and as too much B makes the Co non-reducible and hence not active in FT.
66

5.3 Results Paper III, which is a patent application, focuses on the properties of the above-mentioned TiO2-supported catalyst that might have commercial interest, i.e. high activity and selectivity to desired products etc. Paper IV, however, focuses on the scientifically interesting feature of the same catalyst – its possession of rather small Co particles comprised in large pores, which is not easily managed with conventional preparation techniques. The results of Paper IV are presented in Chapter 6. 5.3.1 Performance of a Co/TiO2 catalyst prepared by the ME technique in the FT synthesis In the following, ME indicates that the catalyst has been prepared via the microemulsion route, and IW indicates the use of the incipient wetness technique. Paper III compares the FT activity and selectivity of three IW catalysts, all with the same metal composition (12 wt% Co, 0.5 wt% Re), on different support materials, with the activity and selectivity of a ME (12 wt% Co, < 0.5 wt% Re) catalyst supported on TiO2 (prepared according to recipe ME (1) with six depositions). For the IW catalysts, Co(NO3)2
.6H2O was used as precursor, while for the ME catalyst CoCl2
.6H2O was chosen as explained in 5.1.2.2 Preparation of Co particles via the w/o microemulsion technique. The catalyst preparation is described in detail in Paper III. The three different support materials used were; γ-Al2O3, α-Al2O3 and TiO2, the properties of which are shown in Table 9. The ME technique showed to be particularly feasible with TiO2 as support, which is why this support was chosen in both papers III and IV.
67

Table 9. Physical properties of the pure support materials.
Support
Pore diameter at largest dVol/dD
[nm]a
Average pore
diameter [nm]b
Surface area (A) [m2/g]
Pore volume (V) [cm3/g]
γ-Al2O3 7.4c 10.4 193c 0.50c α-Al2O3 65d 68 11.1d,e 0.19d,f TiO2 100d 257 23.2d,e 1.49d,f
a The pore diameter at which the absolute value of the derivative (d(cumulative pore volume)/d(pore diameter)) is largest. This implies that the sizes of the interstices between the support particles (~ 5 - 120 μm for both α-Al2O3 and TiO2) that are measured with Hg intrusion are not considered. b The average pore diameter (dp) estimated from surface area (A) and pore
volume (V) according to: AVd p⋅
=4
c Calculated from N2 adsorption measurements. d Calculated from Hg porosimetry measurements. e The area for the interstices is negligible. f The Hg volume penetrated into the interstices between the support particles was subtracted from the total Hg intrusion volume.
As pointed out in 5.1.1 Catalyst preparation techniques, the overall activity of a Co-based FT catalyst is mainly determined by the number of active sites exposed on the surface of the Co particles, i.e. the Co dispersion, as long as the Co particles are larger than approximately 8 – 10 nm. Table 10 shows some physicochemical properties of the four catalysts. It is obvious that when using the IW technique, the final Co particle size is partly governed by the pore size of the support material, larger pores generally resulting in larger particles. As discussed in Paper IV, the average Co particle size, as measured by XRD (X-ray diffraction), obtained for the IW-prepared α-Al2O3 is larger than that of the IW-prepared TiO2, despite the latter having larger average pore size. This could probably be explained by the much higher Co2+ concentration in the impregnating solution of α-Al2O3 as compared to that of TiO2, due to the much lower pore volume of the former. The Co dispersion values for the TiO2-supported catalysts are most probably underestimated with respect to the other catalysts. This is due to that the Co particles are partly decorated with overlayers of TiOx at reduction temperatures above 573 K [Li, 2003]. The larger Co particle-size estimation by XRD compared to that by H2 chemisorption for γ-Al2O3 and α-Al2O3 supported catalysts may be due to the smallest crystallites not being measured by XRD [Niemandsverdriet, 2000].
68

Table 10. Physicochemical properties of the catalysts.
Catalyst Reduction
temp-erature
[K]a
Degree of reduction
[%]b
Co dispersion
[%]c
Co dispersion corrected
for reducibility
[%]d
Co particle
size (from disp.) [nm]e
Co particle size (from corr. disp.)
[nm]f
Co particle
size (XRD) [nm]g
12CoRe(gamma)IW 623 63 9.7 15.4 10 6 12
12CoRe(alpha)IW 623 67 3.5 5.2 27 18 37
12CoRe(TiO2)IW 623 66 3.0 4.5 32 21 26
12CoRe(TiO2)ME 673 64 5.5 8.6 17 11 12 a The ME catalyst was reduced at a higher temperature than the IW catalysts. b Determined by oxygen titration of reduced catalyst at 673 K. c Determined by H2 chemisorption at 313 K, assuming adsorption on Co atoms only (12 wt% Co assumed). d Co dispersion divided by degree of reduction. e Co metal particle size calculated from Co dispersion, using d(Co) = 96/D [Jones, 1988]. f Co metal particle size calculated from corrected Co dispersion, using d(Co) = 96/Dcorr. g Co metal particle size estimated from XRD data for calcined catalyst, using the Scherrer equation [Lemaitre, 1984] and d(Co) = 0.75⋅d(Co3O4) [Schanke, 1995]. The data in Table 10 illustrate the improved Co dispersion of the ME catalyst as compared to its impregnated counter part, which is due to the smaller Co particles in the former but still a comparable degree of reduction. Hence, almost a doubling of the FT activity is expected. Figure 16 shows TEM (transmission electron microscopy) or STEM (scanning transmission electron microscopy) pictures of the four catalysts (reduced and passivated). It is obvious that the ME-prepared Co particles in the TiO2 catalyst are smaller than the Co particles in the corresponding IW catalyst.
69

Figure 16. TEM (STEM) images of A. 12CoRe(gamma)IW (TEM), B. 12CoRe(alpha)IW (STEM), C. 12CoRe(TiO2)IW (TEM), D. 12CoRe(TiO2)ME (TEM). Scale bars indicate 100 nm for A, C and D, but 0.2 μm for B. Figure 17 shows the formation rate of hydrocarbons (gHC/gcat,h) during five days on stream for the four catalysts. The experiment was divided in five periods as described in Chapter 3. As expected, the ME catalyst shows a much improved activity compared to its impregnated counterpart. The typical low activities of the impregnated large-pore supports (α-Al2O3 and TiO2), as a result of the larger Co particles and thus lower Co dispersion, are clearly illustrated in Figure 17, as well as the typical high activity of an impregnated small-pore support (γ-Al2O3). The higher activity of 12CoRe(TiO2)ME compared with 12CoRe(gamma)IW, although having similar Co particle size, is probably due to residual boron from the preparation route of the former [Ionkina, 2004].
70

0
0,1
0,2
0,3
0,4
0,5
0,6
0,7
0,8
0,9
0 20 40 60 80 100 120Time on stream [h]
Rat
e of
HC
form
atio
n [g
/gca
t,h]
12CoRe(gamma)IW12CoRe(alpha)IW12CoRe(TiO2)IW12CoRe(TiO2)ME
SV = 12000 –15000 Nml/g, h
Reduced SV,
40 % CO conversion
20 % H2O in feed
33 % H2O in feed
Dry again
31 %
25 %
13 %
13.5 %
0
0,1
0,2
0,3
0,4
0,5
0,6
0,7
0,8
0,9
0 20 40 60 80 100 120Time on stream [h]
Rat
e of
HC
form
atio
n [g
/gca
t,h]
12CoRe(gamma)IW12CoRe(alpha)IW12CoRe(TiO2)IW12CoRe(TiO2)ME
SV = 12000 –15000 Nml/g, h
Reduced SV,
40 % CO conversion
20 % H2O in feed
33 % H2O in feed
Dry again
31 %
25 %
13 %
13.5 %
Figure 17. Hydrocarbon (HC) formation rate in five different periods. The CO conversion in period I is given in the figure for each catalyst. Interestingly, also the formation rate of the most desirable fraction, C5+, is significantly improved for the TiO2 catalyst when prepared by the ME route, as shown in Figure 18. Part of the high selectivity to C5+ for the ME catalyst, although being lower than its impregnated counterpart (see Paper IV), could be explained by the residual boron [Li, 1999].
71

0
0,1
0,2
0,3
0,4
0,5
0,6
0,7
0,8
0,9
0 20 40 60 80 100 120
Time on stream [h]
Rat
e of
C5+
form
atio
n [g
/gca
t,h]
12CoRe(gamma)IW
12CoRe(alpha)IW
12CoRe(TiO2)IW
12CoRe(TiO2)ME
SV = 12000 –15000 Nml/g, h
Reduced SV,
40 % CO conversion
20 % H2O in feed 33 % H2O in feed
Dry again
31 %
25 %
13 %
13.5 %
Figure 18. Formation rate of C5+ in five different periods. The CO conversion in period I is given in the figure for each catalyst. After five days on stream, the productivity of C5+ hydrocarbons of the ME catalyst is still 60 % higher than that of the impregnated TiO2 and γ-Al2O3. It is however obvious that the smaller Co particles in 12CoRe(TiO2)ME compared to its impregnated counterpart are deactivated more rapidly, which is a well known phenomenon [van Steen, 2005]. In conclusion, by following the detailed preparation procedure in Paper III, it is possible to obtain a Co/TiO2 catalyst with Co loadings comparable to those used in commercial FT catalysts, with a very narrow Co particle-size distribution. The productivity of a Co/TiO2 may be significantly improved by using the ME technique as a means for reducing Co particle size, hence increasing the Co dispersion.
72

6
Study of the selectivity-governing parameters in the Co-catalysed Fischer-Tropsch reaction (Paper IV)
6.1 Background There are many reports on larger pores in the support favoring the selectivity to higher hydrocarbons [Khodakov, 2002; Schanke, 2004; Griboval-Constant, 2002; Borg, 2007b]. The existence of a pure Co particle-size effect on selectivity is however widely disputed. There are publications claiming that the Co particle size affect the selectivity to C5+ (SC5+). Most results point in the direction of smaller Co particles giving lower SC5+ [Khodakov, 2002; Reuel, 1984; Barbier, 2001; Bezemer, 2006], but also a higher SC5+ was reported for smaller Co particles [Khassin, 1998]. According to Khodakov et al. [2002], smaller Co particles give higher selectivity to shorter hydrocarbons since they have a lower reducibility than large particles. Bezemer et al. [2006] recently reported a Co particle-size effect on SC5+ for particle sizes below approximately 10 nm, smaller particles giving lower SC5+. The Co particles were supported on carbon nanofibers and the cobalt was completely reducible. The particle size effect on selectivity was reported to level out above 10 nm. The catalysts had Co loadings ranging between 0.8 and 22 wt%, which is somewhat risky since the loading might in turn affect the selectivity. It is well known that a support with larger pores naturally gives larger Co crystallites than a support with smaller pores [Storsæter, 2005; Khodakov, 2002; Griboval-Constant, 2002], when the catalyst is prepared by conventional impregnation techniques, such as IW. As already mentioned, there are many reports on larger pores in the support favoring the selectivity to higher hydrocarbons. The difficulty is to ascribe the high SC5+ to the large pores or to the large Co particles. By using the ME technique, it was found possible to prepare relatively small Co particles in large pores (Papers III and IV), thereby giving the possibility to study the presence or absence of a Co particle size effect in the FT synthesis. Unfortunately, the ME-prepared catalyst has minor impurities that may affect the selectivity as well. It also has a lower Re content. Therefore, it was also necessary to investigate the effect of the contaminant present at the highest concentration, boron, and the effect of Re. The effect of the amount of boron present in the ME catalyst was found to increase the selectivity to C5+, and therefore the selectivity results attained for the ME catalyst had to be corrected for this promoting effect, as well as for the lower amount of Re, which is described in Paper IV.
73

In Paper IV, the four catalysts described in 5.3.1 Performance of a Co/TiO2 catalyst prepared by the ME technique in the FT synthesis, are further discussed, i.e. three IW catalysts all with the same metal composition (12 wt% Co, 0.5 wt% Re) on different support materials (TiO2, α-Al2O3 and γ-Al2O3) and one ME catalyst (12 wt% Co, < 0.5 wt% Re) supported on TiO2 (prepared according to recipe ME (1) with six depositions).
6.2 Results 6.2.1 Effect of Co particle size on FT selectivity for particles larger than 8 – 10 nm (Paper IV) Figure 19 shows the SC5+ for the four catalysts, and also for the Re-free counterparts of the IW catalysts. It is clear that, at least for Co particles larger than 10 nm, it is not the Co particle size that is the principal parameter determining the selectivity of the catalyst, but rather the physical and/or chemical properties of the support. The high SC5+ for all three TiO2-supported catalysts (IW with/without Re and ME) indicates the absence of a clear Co particle-size effect. It also suggests that TiO2 possesses inherent properties, e.g. large pores, that are favourable for a high SC5+. The ME catalyst supported on TiO2 had similar Co particle size as a conventionally (IW) prepared γ-Al2O3 supported catalyst, but significantly higher selectivity to C5+, also after correction for the promoting effect of B.
77
79
81
83
85
87
89
1 10 100 1000
Average pore diameter of pure support [nm]
(12 nm)
(12 nm)
(12 nm)
(20 nm)
(26 nm)
(37 nm)
(34 nm)γ-Al2O3
α-Al2O3
TiO2
77
79
81
83
85
87
89
1 10 100 1000
Average pore diameter of pure support [nm]
(12 nm)
(12 nm)
(12 nm)
(20 nm)
(26 nm)
(37 nm)
(34 nm)γ-Al2O3
α-Al2O3
TiO2 ]]
[% [%
ree)
ree)
Figure 19. Selectivity (C-atom) to C5+ (CO2-free) at a CO conversion of 35 % versus the average pore diameter of the pure support for the following catalysts: ♦ 12CoReIW, ◊ 12CoIW, ■ 12CoReME. The Co particle diameters, as determined by XRD, are given in brackets for each catalyst. The experimental error (±2σ) for the C5+ selectivity is estimated to ±0.8 %.
SC
5+ (C
O2-
fS
C5+
(CO
2-f
74

6.2.2 Effect of crystallinity of the Co phase on FT selectivity As mentioned earlier, it was found that a successful deposition of the colloidal Co-containing particles prepared by the ME technique was accomplished when using TiO2 as support material. The deposition was also possible on γ-Al2O3, but in that case the Co particles could not enter the pores of the support, resulting in agglomeration of the Co particles on the outer surface of the γ-Al2O3 pellets, as shown in Figure 20. The reason for the Co particles not being able to enter the small pores of the γ-Al2O3 (10 nm) is probably that they are sterically hindered by adsorbed surfactants on the Co particle surface.
IW ME
γ-Al2O3
γ-Al2O3Co
Co
IW ME
γ-Al2O3
γ-Al2O3Co
Co
Figure 20. Comparison of IW and ME (1) - prepared catalysts supported on a narrow-pore carrier, γ-Al2O3. The scale bars indicate 0.2 μm. A successful attachment/deposition of the Co particles to the internal surface of a support material is most probably also governed by the surface properties of the support material; deposition of the Co particles on α-Al2O3 failed, although this support has significantly larger pores than γ-Al2O3. Only a very low loading of Co was attained on α-Al2O3, possibly due to the much lower concentration of surface OH-groups compared to γ-Al2O3. Interestingly, Co particles prepared from ME (1) (see Table 7) and deposited on γ-Al2O3 showed a very poor activity and selectivity to C5+ during the first days of FT experiment. The reason could be the low degree of reducibility and the XRD-amorphous Co phase (visible as Co “fringes” in the right picture in Figure 20). However, after five days on stream, the SC5+ was significantly improved. In Figure 21, TEM pictures of the fresh and used catalyst are shown.
75
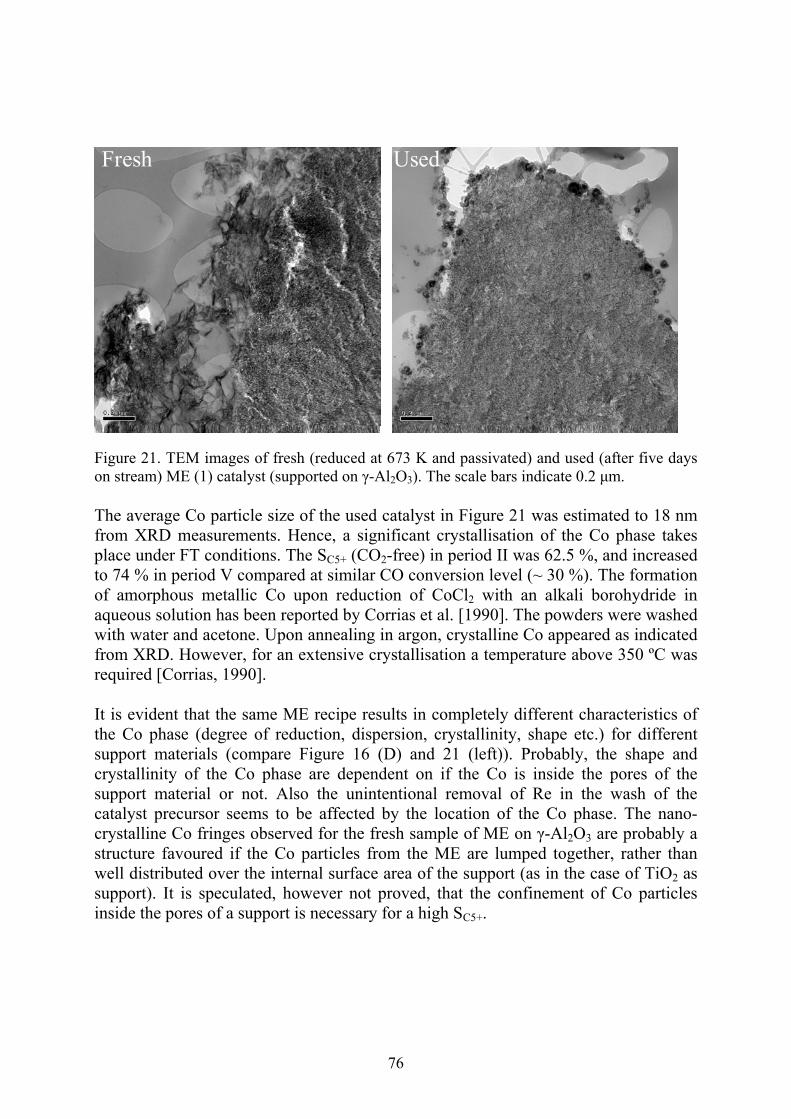
Fresh UsedFresh Used
Figure 21. TEM images of fresh (reduced at 673 K and passivated) and used (after five days on stream) ME (1) catalyst (supported on γ-Al2O3). The scale bars indicate 0.2 μm. The average Co particle size of the used catalyst in Figure 21 was estimated to 18 nm from XRD measurements. Hence, a significant crystallisation of the Co phase takes place under FT conditions. The SC5+ (CO2-free) in period II was 62.5 %, and increased to 74 % in period V compared at similar CO conversion level (~ 30 %). The formation of amorphous metallic Co upon reduction of CoCl2 with an alkali borohydride in aqueous solution has been reported by Corrias et al. [1990]. The powders were washed with water and acetone. Upon annealing in argon, crystalline Co appeared as indicated from XRD. However, for an extensive crystallisation a temperature above 350 ºC was required [Corrias, 1990]. It is evident that the same ME recipe results in completely different characteristics of the Co phase (degree of reduction, dispersion, crystallinity, shape etc.) for different support materials (compare Figure 16 (D) and 21 (left)). Probably, the shape and crystallinity of the Co phase are dependent on if the Co is inside the pores of the support material or not. Also the unintentional removal of Re in the wash of the catalyst precursor seems to be affected by the location of the Co phase. The nano-crystalline Co fringes observed for the fresh sample of ME on γ-Al2O3 are probably a structure favoured if the Co particles from the ME are lumped together, rather than well distributed over the internal surface area of the support (as in the case of TiO2 as support). It is speculated, however not proved, that the confinement of Co particles inside the pores of a support is necessary for a high SC5+.
76

Also the deposition of Co colloidal particles prepared from ME (2) (see Table 8), i.e. with smaller particle size, on TiO2 results in a low initial FT activity and SC5+, just as in the case with Co particles prepared from ME (1) deposited on γ-Al2O3. After five days on stream, however, the selectivity improves and reaches the same level as that of the catalyst prepared from ME (1) (supported on TiO2). This is discussed in more detail in Paper III. The reason for the improved SC5+ could be a Co crystallite growth upon water exposure in the FT reactor, due to the removal of most of the boron contaminating the catalyst (from NaBH4 used in the reduction of the ME). The catalyst prepared from ME (2) had a significantly higher initial boron content as compared to that prepared from ME (1). After five days on stream both catalysts had similar boron contents. As mentioned earlier, small amounts of boron actually improve the SC5+, which is reported in Paper IV.
77

7
Conclusions
7.1 FT synthesis with H2-poor syngas The combined FT and WGS reactions with H2-poor syngas have been tested for 12 wt% Co and 12 wt% Co – 0.5 wt% Re catalysts supported on γ-Al2O3. Lower H2/CO ratios in the feed reduced the syngas conversion and the CH4 selectivity, while the C5+ selectivity and olefin/paraffin ratio for C2-C4 were slightly increased. The WGS activity was low for all catalysts, implying a H2/CO usage ratio close to the stoichiometric one (2.1), even for inlet H2/CO ratios of 1.5 and 1.0. However, there was a trend in the usage ratios to follow the inlet ratios. By replacing 20 % of the Co by Fe in the Co catalyst referred to above (by co-impregnation) in order to achieve a 12 wt% bimetal loading on γ-Al2O3, a slightly lower usage ratio was obtainable (1.92) for an inlet ratio of 1.0 for dry conditions. Different Fe:Co ratios ranging from 100 % Fe to 100 % Co (12 wt% bimetal) were tested for an inlet H2/CO ratio of 1.0. The characterisation results indicated that Fe was enriched at the surface, hence covering the more FT-active Co sites, even at low percentage Fe. Not even upon significant replacement of Co by Fe (≥ 20 %) were the usage ratios for dry conditions lowered to any significant extent in comparison with the pure Co catalyst. However, a higher Fe content generally resulted in higher selectivity to CO2 and higher WGS activity. The reason for the rather invariable usage ratio for the catalysts in the dry periods is therefore a result of an increased selectivity to shorter hydrocarbons, mainly CH4, for an increased Fe content. It may be concluded that Fe probably needs promotion by K or Cu to attain a higher WGS activity. Although the replacement of Co by small amounts of Fe (5 %) seemed to improve the FT activity for dry conditions (i.e. at no external water addition), it is believed that this is not due to an improved WGS activity but rather due to a slightly higher (site) activity of the Co-Fe alloy. This could be deduced from the Co-Fe catalyst actually having a higher usage ratio than the pure Co catalyst. Experiments showed that the WGS activity at the low temperature used could be increased by addition of external water. However, as the catalysts with the highest WGS activity had surface enrichment of Fe or consisted mostly of Fe, high water partial pressures negatively affect the FT rate and also lead to rapid deactivation by re-oxidation of the FT-active iron phases (iron carbides) or by sintering. Surprisingly, also the WGS activity rapidly decreased at high partial pressures of water, although it is believed that Fe3O4 is the WGS-active phase. Possibly, surface oxidation of Fe3O4 into γ-Fe2O3 may take place during these water-rich conditions.
78
The WGS reaction is thermodynamically favoured at low temperatures. However, the WGS kinetics over the tested catalysts is far too slow at the FT reaction temperature used in typical low-temperature FT (LTFT) applications, with diesel as the desired product. If the problems discussed above cannot be overcome, an external WGS unit up-stream the FT reactor would be preferred, in which the H2/CO ratio of the biosyngas would be adjusted to the FT catalyst/process. The main challenges seem to be the development of a suitable catalyst composition that possesses a high enough WGS activity at these low temperatures, so that the need for external water addition may be minimised (and hence the rapid deactivation due to high water pressures would not be an issue) and to combine this composition with a highly active FT metal, without covering the active sites of the latter. It is however probable that some external water will be necessary at these low temperatures, and in that case, a WGS-active composition stable against oxidation by water would be needed, and Co would be preferred as the FT-active phase. Probably, direct conversion of H2-poor syngas in a FT reactor is more suitable for high-temperature FT (HTFT) in which the temperature is 300 – 350 ºC. This process is however not suited for diesel production but rather for production of gasoline and olefins.
7.2 Co particle-size effect on the FT selectivity An alternative catalyst preparation technique, the microemulsion (ME) technique, was adjusted for the sake of preparation of Co particles of a few nanometers (with a narrow size distribution) and the successive deposition of these onto a porous support material. By using the ME technique it was possible to prepare relatively small Co particles in a large-pore support such as TiO2, which is not an easy task using the conventional impregnation (IW) technique. The development of the technique mostly comprised innovative solutions to the problematic deposition of particles from an organosol onto a porous support material, and also upgrading the as-prepared catalyst precursor to a useful FT catalyst. Especially the washing of the precursor powder after deposition of Co-containing particles seemed crucial for a successful catalyst preparation, as several contaminants were present from the preparation. Especially the B content seemed to have a very strong impact on the final crystallinity of the Co phase, and hence on the performance of the catalyst in FT. The FT synthesis with the Co-based catalysts was performed with stoichiometric H2/CO feed. It is possible to prepare very small (< 2 - 3 nm) Co-containing particles in the ME by minimising the water/surfactant ratio in the ME. However, preliminary results indicate that such small Co particles give both lower site activities and lower C5+ selectivities.
79

This is partly due to a lower degree of reducibility of the Co phase. After a few days on stream in the FT reactor, especially after externally added water, the selectivity to C5+ for such a catalyst is remarkably improved. The reason is believed to be crystallite growth due to removal of most of the B. Small amounts of B however showed to promote the selectivity to C5+. In order to improve the activity of such a catalyst, it is believed that a re-reduction in hydrogen is necessary. A ME catalyst was prepared with a relatively high water/surfactant ratio supported on TiO2. The resulting Co particles (~ 12 nm) were smaller than for the impregnated counterpart (the IW catalyst). Thus it was possible to study the effect of Co particle size on FT selectivity irrespective of the pore size of the support. It was found that, at least for Co particles above 10 nm, it is not the Co particle size that is the principal parameter determining the selectivity of the catalyst, but rather the physical and/or chemical properties of the support. The ME catalyst supported on TiO2 had similar Co particle size as a conventionally (IW) prepared γ-Al2O3 supported catalyst, but significantly higher selectivity to C5+, also after correction for the promoting effect of B. Due to the smaller Co particle size (~ 12 nm) of the ME-TiO2 catalyst as compared to a corresponding IW catalyst (~ 26 nm) supported on TiO2, the FT activity of the former was 100 % higher as fresh catalyst. After 120 h on stream the ME catalyst still gave 60 % higher rate to C5+ (expressed as gC5+/gcat,h) compared to both an IW-TiO2 and an IW-γ-Al2O3 catalyst, all catalysts having the same composition (12 wt% Co, 0.5 wt% Re). The ME technique is a viable tool for metal particle-size control, which is desirable when studying particle-size effects on activity and selectivity. However, contamination by the surfactants and reducing agents could be troublesome. Furthermore, due to the requirement for large amounts of organic solvents for a small amount of catalyst there is need for process development in order to make the ME technique practical on a larger scale.
80

8
Acknowledgements The work presented in this thesis was performed in 2003 – 2007 under Contract No. 20705-1 – ”Framställning av CO2-neutral bensin och diesel via Fischer-Tropsch-processen” - within the Swedish Energy Agency programme “Forsknings och Utvecklingsprogrammet för Alternativa Drivmedel 2003 – 2006 (FALT)”. The Swedish Energy Agency is gratefully acknowledged for the financial support. I want to thank professor Sven Järås and associate professor Magali Boutonnet for giving me the opportunity to perform graduate studies at the Department of Chemical Technology, and for your confidence in me. I want to thank Dewi Tristantini at the Department of Chemical and Biological Engineering, Chalmers, for close friendship and for cooperation in Trondheim. Börje Gevert is acknowledged for his help with the publications. I also want to thank the Catalysis group at the Department of Chemical Engineering (IKP), NTNU (the Norwegian University of Science and Technology) in Trondheim: Many thanks go to professor Anders Holmen for treating me as one of his own students, and for offering me both experimental resources as well as supervision and guidance in the Fischer-Tropsch science. I would also like to thank Øyvind Borg for much help in the beginning of my PhD studies and for close friendship. I am also very grateful to professor Edd Blekkan for guidance and fruitful discussions, and to all other people at IKP for their friendship and for being very helpful and supportive. Warm thanks to Odd Asbjørn Lindvåg and Rune Myrstad, SINTEF Materials and Chemistry in Trondheim, for always giving me a helping hand when needed! John Walmsley is gratefully acknowledged for enlightening discussions on the “nano-level”. Jan-Morten Roel, NTNU, is acknowledged for technical support. Thank you Krister Sjöström, KTH, for your invaluable comments on the gasification part of this thesis! Thank you Otto von Krusenstierna for fruitful discussions on the WGS reaction and for being a source of inspiration! Thank you Tomas Ekbom for collaboration and friendship! Thank you Inga Groth for technical support with the characterization equipment and for your concern. Christina Hörnell is acknowledged for assistance with the language in this thesis, and Massoud Pirjamali for always being helpful! I want to thank present and former colleagues at Chemical Technology, KTH, for friendship and support in good and bad times! Special thanks go to you Katarina Persson, Erik Elm Svensson and Stelios Nassos for being great friends and for your crazy frolics! Finally I want to thank Mamma and Pappa for always being supportive!
81

9
References
J. Agrell, K. Hasselbo, K. Jansson, S.G. Järås, M. Boutonnet, Appl. Catal. A 211 (2001) 239. Agroetanol, www.agroetanol.se, 2007-03 F.J. Arriagada, K. Osseo-Asare, J. Colloid Interface Sci. 211 (1999) 210. BAL, ”Feasibility phase project for biomass-derived alcohols for automotive and industrial uses”, Final report for the ALTENER ”BAL-Fuels Project” Contract No. XVII/4. 1030/Z/95-124, 1031/Z/95-124, September 1997, available on www.nykomb.se/pdf/bal-fuels.pdf. (2007-05) A. Barbier, A. Tuel, I. Arcon, A. Kodre, G.A. Martin, J. Catal. 200 (2001) 106. C. Barker, Kirk-Othmer Encyclopedia of Chemical Technology, vol. 18, fourth edition, p. 344, John Wiley & Sons, 1996 D. Barkhuizen, I. Mabaso, E. Viljoen, C. Welker, M. Claeys, E. van Steen, J.C.Q. Fletcher, Pure Appl. Chem. 78 (2006) 1759. G.L. Bezemer, J.H. Bitter, H.P.C.E Kuipers, H. Oosterbeek, J.E. Holewijn, X. Xu, F. Kapteijn, A.J. van Dillen, K.P. de Jong, J. Am. Chem. Soc. 128 (2006) 3956. H. Boerrigter, H.P. Calis, D.J. Slort, H. Bodenstaff, A.J. Kaandorp, H. den Uil, L.P.L.M. Rabou, “Gas cleaning for integrated biomass gasification (BG) and Fischer-Tropsch (FT) systems – Experimental demonstration of two BG-FT systems (“Proof-of-Principle”)”, ECN-C-04-056, December 2004, available on www.ecn.nl (2006) Ø. Borg, E.A. Blekkan, S. Eri, D. Akporiaye, B. Vigerust, E. Rytter, A. Holmen, Topics in Catal. (2007a), DOI: 10.1007/s11244-002007-0237-1. Ø. Borg, S. Eri, E.A. Blekkan, S. Storsæter, H. Wigum, E. Rytter, A. Holmen, J. Catal. (2007b), doi:10.1016/j.jcat.2007.03.008. M. Boutonnet, C. Andersson, R. Larsson, Acta Chem. Scand. A 34 (1980) 639. M. Boutonnet, J. Kizling, V. Mintsa-Eya, A.Choplin, R. Touroude, G. Maire, P. Stenius, J. Catal. 103 (1987) 95.
82
M. Boutonnet, J. Kizling, R. Touroude, G. Maire, P. Stenius, Catal. Lett. 9 (1991) 347. Å. Brandberg, H. Hjortsberg, B. Sävbark, T. Ekbom, C.J. Hjerpe, I. Landälv, “BioMeet – Planning of biomass-based methanol energy combine – Trollhättan region”, Project report for EU/ALTENER Contract No. XVII/4.1030/Z/98-368, March 2000, available on www.nykomb.se/pdf/final-biomeet.pdf (2007-05) A.V. Bridgwater, Chem. Eng. J. 91 (2003) 87. H. Bönnemann, G. Braun, W. Brijoux, R. Brinkmann, A. Schulze Tilling, K. Seevogel, K. Siepen, J. Organometal. Chem. 520 (1996) 143. H. Bönnemann, Appl. Organometal. Chem. 18 (2004) 566. H. Bönnemann, R.A. Brand, W. Brijoux, H.-W. Hofstadt, M. Frerichs, V. Kempter, W. Maus-Friedrichs, N. Matoussevitch, K.S. Nagabhushana, F. Voigts, V. Caps, Appl. Organometal. Chem. 19 (2005) 790. S.T. Chaudhari, S.K. Bej, N.N. Bakhshi, A.K. Dalai, Energy Fuels 15 (2001) 736. Chemrec, www.chemrec.se, 2007-04 J.P. Chen, K.M. Lee, G.M. Sorensen, K.J. Klabunde, G.C. Hadjipanayis, J. Appl. Phys. 75 (1994) 5876. J.P. Chen, C.M. Sorensen, K.J. Klabunde, G.C. Hadjipanayis, Phys. Rev. B: Condens. Matter 51 (1995) 11527. Choren, www.choren.com/en, 2007-04 CHRISGAS, www.chrisgas.com, 2007-03 A. Corrias, G. Ennas, G. Licheri, G. Marongiu, G. Paschina, Chem. Mater. 2 (1990) 363. B.L. Cushing, V.L. Kolesnichenko, C.J. O’Connor, Chem. Rev. 104 (2004) 3893.
D.J. Duvenhage, N.J. Coville, Appl. Catal. A 153 (1997) 43. D.J. Duvenhage, N.J. Coville, Appl. Catal. A 289 (2005) 231. M.E. Dry, Appl. Catal. A 138 (1996) 319. M. E. Dry, Catal. Today 71 (2002) 227.
ECa, European Commission, http://ec.europa.eu/energy/res/index_en.htm, 2007-04
83

ECb, European Commission, Directorates-General Energy and Transport, http://ec.europa.eu/dgs/energy_transport, 2007-04 ECc, European Commission, Directorate-General for Energy and Transport, “European Energy and Transport – Trends to 2030”, available on http://ec.europa.eu/dgs/energy_transport/figures/trends_2030/2_chap1_en.pdf (2007-04) ECd, European Commission, Directorate-General for Energy and Transport, “European Union Energy and Transport in figures, 2004 edition, Part 2: Energy”, 2004, up-dated version available on http://ec.europa.eu/dgs/energy_transport/figures/pocketbook/doc/2006/2006_general_en.pdf (2007-04) ECe, European Commission, Directorate-General for Research Sustainable Energy Systems, “Biofuels in the European Union - A vision for 2030 and beyond”, EUR 22066, 2006, available on http://cordis.europa.eu/documents/documentlibrary/2720EN.pdf (2007-05) EEB, European Environmental Bureau, “EEB position on Biomass and Biofuels: the need for well defined sustainability criteria”, December 2005, available on www.eeb.org/activities/agriculture/EEB-position-on-bioenergy-191205.pdf (2007-05) J. Eilers, S.A. Posthuma, S.T. Sie, Catal. Lett. 7 (1990) 253. T. Ekbom, M. Lindblom, N. Berglin, P. Ahlvik, “Technical and Commercial Feasibility Study of Black Liquor Gasification with Methanol/DME Production as Motor Fuels for Automotive Uses – BLGMF”, Project report for EU/ALTENER Contract No. 4.1030/Z/01-087/2001, 2003 T. Ekbom, N. Berglin, S. Lögdberg, “Black Liquor Gasification with Motor Fuel Production – BLGMF II”, Final report for Contract No. P21384-1in the Swedish Energy Agency programme “Forsknings och Utvecklingsprogrammet för Alternativa Drivmedel 2003 – 2006 (FALT)”, December 2005 S. Engström, N. Lindman, E. Rensfelt, L. Waldheim, ”A new synthesis gas process for biomass and peat”, Presentation at “Energy from biomass and wastes V”, 26 – 30 January 1981, Lake Buena Vista, Florida S. Eriksson, U. Nylén, S. Rojas, M. Boutonnet, Appl. Catal. A 265 (2004) 207. R. Espinoza, A. Steynberg, B. Jager, A. Vosloo, Appl. Catal. A 186 (1999) 13. European Parliament, www.europarl.europa.eu, 2007-03
84

FT, FramTidsbränslen AB, “Sundsvall demonstration plant – En förstudie av en pilotanläggning för tillverkning av Fischer-Tropsch diesel av biomassa”, 2005, available from www.framtidsbranslen.se G.N. Glavee, K.J. Klabunde, C.M. Sorensen, G.C. Hadjipanayis, Langmuir 8 (1992) 771. G.N. Glavee, K.J. Klabunde, C.M. Sorensen, G.C. Hadjipanayis, Z.X. Tang, L. Yiping, Nanostructured Mater. 3 (1993a) 391. G.N. Glavee, K.J. Klabunde, C.M. Sorensen, G.C. Hadjipanayis, Inorg. Chem. 32 (1993b) 474. F.M. Gottschalk, G.J. Hutchings, Appl. Catal. 51 (1989) 127. A. Griboval-Constant, A.Y. Khodakov, R. Bechara, V.L. Zholobenko, Stud. Surf. Sci. Catal. 144 (2002) 609. L. Guczi, Catal. Rev. Sci. Eng. 23 (1981) 329. C.N. Hamelink, A.P.C. Faaij, H. den Uil, H. Boerrigter, “Production of FT Transportation Fuels from Biomass; Technical Options, Process Analysis and Optimization, and Development Potential”, Universiteit Utrecht, Copernicus Institute, March 2003 H. Hayashi, L.Z. Chen, T. Tago, M. Kishida, K. Wakabayashi, Appl. Catal. A 231 (2002) 81. T. Herranz, S. Rojas, F.J. Pérez-Alonso, M. Ojeda, P. Terrero, J.L.G. Fierro, Appl. Catal. A 308 (2006) 19. Hydrocarbon Publishing Company, “Worldwide Refinery Processing Review, Third Quarter 2005”, 2005 H. Härelid Ingelsten, J.C. Béziat, K. Bergkvist, A. Palmqvist, M. Skoglundh, H. Quihong, L. Falk, K. Holmberg, Langmuir 18 (2002) 1811. IEA, International Energy Agency, www.iea.org, 2006-02 / 2007-03 E. Iglesia, S.C. Reyes, R.J. Madon, S.L. Soled, Adv. Catal. 39 (1993) 221. IHS, IHS Automotive Standards, http://auto.ihs.com/news/eu-en-biofuels-1-07.htm, 2007-03 O. Ionkina, W. Chao, M.A. Subramanian, L.E. Manzer, K.M. Makar, A.P. Raje, US Patent 6 727 289 B2 (2004), to ConocoPhillips Company, USA
85
IPCC, Intergovernmental Panel on Climate Change, www.ipcc.ch/present/graphics.htm, 2007-03 R.D. Jones, C.H. Bartholomew, Appl. Catal. 39 (1988) 77. KEMI, Swedish Chemicals Agency, www.kemi.se, 2007-04 A.A. Khassin, T.M. Yurieva, V.N. Parmon, React. Kinet. Catal. Lett. 64 (1998) 55. A.Y. Khodakov, A. Griboval-Constant, R. Bechara, V.L. Zholobenko, J. Catal. 206 (2002) 230. W.Y. Kim, T. Hanaoka, M. Kishida, K. Wakabayashi, Appl. Catal. A 155 (1997) 283. M. Kishida, K. Umakoshi, J. Ishiyama, H. Nagata, K. Wakabayashi, Catal. Today 29 (1996) 355. M. Kishida, K. Ichiki, T. Hanaoka, H. Nagata, K. Wakabayashi, Catal. Today 45 (1998) 203. B. Kleinsorge, V.B. Golovko, S. Hofmann, J. Geng, D. Jefferson, J. Robertson, B.F.G. Johnson, Chem. Commun. (2004) 1416. R. Krishna, S. Sie, Fuel Proc. Tech. 64 (2000) 73. J.L. Lemaitre, P. Govind Menon, F. Delannay, in: F. Delannay (Ed.), “Characterization of Heterogeneous Catalysts”, vol. 15, Marcel Dekker, New York, 1984, pp. 299. J. Li, N.J. Coville, Appl. Catal. A 181 (1999) 201. S. Li, S. Krishnamoorthy, A. Li, G.D. Meitzner, E. Iglesia, J. Catal. 206 (2002) 202. Y. Li, Y. Fan, H. Yang, B. Xu, L. Feng, M. Yang, Y. Chen, Chem. Phys. Lett. 372 (2003) 160. C.M. Lok, Stud. Surf. Sci. Catal. 147 (2004) 283. E.S. Lox, G.B. Marin, E.D.E. Grave, P. Bussière, Appl. Catal. 40 (1988) 197. J. Lu, D.B. Dreisinger, W.C. Cooper, Hydrometallurgy 45 (1997) 205. M. Luo, R.J. O’Brian, S. Bao, B.H. Davis, Appl. Catal. A 239 (2003) 111. G.M. Maksimova, A.L. Chuvilin, E.M. Moroz, V.A. Likholobov, K.I. Matveev, Kinet. Catal. 45 (2004) 870.
86

J.R. Moreira, Mitigation and Adaptation Strategies for Global Change 11 (2006) 313. J. Moulijn, M. Makkee, A. van Diepen, “Chemical Process Technology”, John Wiley & Sons Ltd, England, 2001 J.B. Nagy, Colloids Surfaces 35 (1989) 201. J.W. Niemandsverdriet, “Spectroscopy in Catalysis”, Wiley-VCH, Weinheim, 2000. H. Ohde, C.M. Wai, H. Kim, J. Kim, M. Ohde, J. Am. Chem. Soc. 124 (2002) 4540. M. Ojeda, S. Rojas, M. Boutonnet, F.J. Pérez-Alonso, F. Javier Garcia-Garcia, J.L.G. Fierro, Appl. Catal. A 274 (2004) 33. Oljekommissionen, “På väg mot ett oljefritt Sverige”, June 2006, available on www.regeringen.se/sb/d/6316/a/66280 (2007-05) F. Pinna, Catal. Today 41 (1998) 129. E. Pocoroba, L.J. Pettersson, J. Agrell, M. Boutonnet, K. Jansson, Top. Catal. 16/17 (2001) 407. J.M. Pratt, G. Swinden, Chem. Commun. (1969) 1321. J. Qiu, H. Zhang, C. Liang, J. Li, Z. Zhao, Chem. Eur. J. 12 (2006) 2147. R. Raja, V.B. Golovko, J.M. Thomas, A. Berenguer-Murcia, W. Zhou, S. Xie, B.F.G. Johnson, Chem. Commun. (2005) 2026. A.P. Raje, J.R. Inga, B.H. Davis, Fuel 76 (1997) 273. A.P. Raje, R.J. O’Brien, B.H. Davis, J. Catal. 180 (1998) 36. R.C. Reuel, C.H. Bartholomew, J. Catal. 85 (1984) 78. D. Schanke, S. Vada, E.A. Blekkan, A.-M. Hilmen, A. Hoff, A. Holmen, J. Catal. 156 (1995) 85. D. Schanke, S. Eri, E. Rytter, C. Aaserud, A.-M. Hilmen, O.A. Lindvåg, E. Bergene, A. Holmen, Stud. Surf. Sci. Catal. 147 (2004) 301. J.A. Schwarz, C. Contescu, A. Contescu, Chem. Rev. 95 (1995) 477. SEKAB, www.sekab.com, 2007-04 SGC, Svenskt Gastekniskt Center, “Biogas – basdata om biogas”, 2006, available on www.sgc.se (2006-10)
87
S. Sie, R. Krishna, Appl. Catal. A 186 (1999) 55. K. Sjöström, associate professor, Chemical Technology, School of Chemical Science and Engineering, Royal Institute of Technology (KTH), Stockholm, personal communication, May 2007 E. Smeets, A. Faaij, Climatic Change, doi: 10.1007/s10584-006-9163-x, 2007. SPI, Svenska Petroleum Institutet, www.spi.se, 2007-04 Statoil, www.statoil.no, 2007-03 STEMa, Statens Energimyndighet, www.energimyndigheten.se, 2007-03 STEMb, Statens Energimyndighet, “Energiförsörjningen i Sverige, kortsiktsprognos 2006-08-15”, ER2006:22, ISSN 1403-1892, 2006, available on www.energimyndigheten.se (2007-03) STEMc, Statens Energimyndighet, “Ekonomiska styrmedel i miljöpolitiken”, Report from Naturvårdsverket and Statens Energimyndighet (STEM), ER2006:34, ISSN 1403-1892, 2006, available on www.energimyndigheten.se (2007-03) STEMd, Statens Energimyndighet, “Etanol som biodrivmedel”, ET 11:2004, May 2004, available at www.stem.se (2007-03)
Stora Enso, www.storaenso.com, 2007-04
S. Storsæter, Ø. Borg, E.A. Blekkan, A. Holmen, J. Catal. 231 (2005) 405. K. Ståhl, M. Neergaard, J. Nieminen, “Progress report: Varnamo Biomass Gasification Plant”, presented at 1999 Gasification Technologies Conference, San Francisco, October 17 – 20, 1999, available on www.gasification.org/Docs/1999_Papers/GTC99290.pdf (2007-05) Svebio, Svenska Bioenergiföreningen, Bioenerginytt, no. 1 2007, available on www.svebio.se T. Tago, T. Hanaoka, P. Dhupatemiya, H. Hayashi, M. Kishida, K. Wakabayashi, Catal. Lett. 64 (2000) 27. M. Tijmensen, A. Faaij, C. Hamelinck, M. Van Hardeveld, Biomass Bioenergy 23 (2002) 129. R. Touroude, P. Girard, G. Maire, J. Kizling, M. Boutonnet-Kizling, P. Stenius, Colloid Surf. 67 (1992) 9.
88
UNEP/GRID-Arendal, United Nations Environment Program, www.grida.no/climate/ipcc_tar/, 2007-04 J. van de Loosdrecht, M. van der Haar, A.M. van der Kraan, A.J. van Dillen, J.W. Geus, Appl. Catal. A 150 (1997) 365. E. van Steen, M. Claeys, M.E. Dry, J. van de Loosdrecht, E.L. Viljoen, J.L. Visagie, J. Phys. Chem. B 109 (2005) 3575. WBGU, German Advisory Council on Global Change, “World in transition – Towards sustainable energy systems”, WBGU report 2003, Berlin, 2003, available on www.wbgu.de/wbgu_jg2003_kurz_engl.html (2007-03) WEC, World Energy Council, “Survey of Energy Resources 2004”, London, 2004, available on www.worldenergy.org/wec-geis/publications/reports/ser04 (2007-04). X. Wei, U. Schnell, K. Hein, Fuel 84 (2005) 841. I. Wender, Fuel Proc. Technol. 48 (1996) 189. Worldwatch Institute, www.worldwatch.org, 2007-04 WtW, “Well-to-Wheels analysis of future automotive fuels and powertrains in the European context”, WELL-to-WHEELS Report, Version 2c, March 2007, available on http://ies.jrc.ec.europa.eu/WTW (2007-03) I.C. Yates, C.N. Satterfield, Energy Fuels 5 (1991) 168. W. Yu, H. Liu, X. An, X. Ma, Z. Liu, L. Qiang, J. Mol. Catal. A 147 (1999) 73. W.W. Yu, H. Liu, J. Mol. Catal. A 243 (2006) 120. D.-E. Zhang, X.-M. Ni, X.-J. Zhang, H.-G. Zheng, J. Magn. Magn. Mater. 302 (2006) 290. X. Zhang, K.-Y. Tsang, K.-Y. Chan, J. Electroanal. Chem. 573 (2004) 1.
89

Author’s contribution to the papers Paper I: Main responsibility for interpreting data and writing the paper Paper II: Main responsibility for interpreting data and writing the paper Paper III: This is a patent application, written by a patent engineer (Awa Patent). I have had the main responsibility of providing the information required for writing the patent application, and I have designed and performed all experiments upon which the invention is based. Paper IV: Full responsibility for experimental work, interpretation of results and writing of paper.
90


