DEVELOPMENT OF EXPERT SYSTEM FOR FUEL MONITORING …
9
DEVELOPMENT OF EXPERT SYSTEM FOR FUEL MONITORING AND ANALYSIS IN WWER-1000 UNITS V.V. Likhanskii, I.A. Evdokimov * , A.A. Sorokin, V.D. Kanukova, V.G. Zborovskii, T.N. Aliev SRC RF TRINITI 142190, Troitsk, Moscow reg., Russia * Tel:+7 498 5405256, Fax: +7 498 5405158, E-mail: [email protected] N.B. Sokolov, A.A. Shishkin JSC “TVEL”, Moscow, Russia. Abstract: At present, an expert system (software package) for fuel monitoring in WWER units is under development in Russia. It comprises several modules which cover analysis of coolant activity, detection of failures and estimation of failure parameters, predictions of activity level and some aspects of PCI analysis. This paper outlines the current version of the fuel monitoring system, its basic features and user interface. Advances in development of computer modules for PCI analysis are reported. At present two levels of PCI analysis are used. The first is estimation of probability for pellets to get in contact with cladding in fuel rods. Estimations are made with taking into account specifications and tolerances for fuel fabrication as well as fuel operation conditions. The second level of PCI analysis implies a simplified approach for on-line calculations of stresses in cladding depending on power ramping rates. The model for PCI calculations and its application within the computer system is demonstrated. Keywords: on-line fuel monitoring; fuel failures; PCI analysis; WWER units.
Transcript of DEVELOPMENT OF EXPERT SYSTEM FOR FUEL MONITORING …
DEVELOPMENT OF EXPERT SYSTEM FOR FUEL
MONITORING AND ANALYSIS IN WWER-1000 UNITS
V.V. Likhanskii, I.A. Evdokimov*, A.A. Sorokin,
V.D. Kanukova, V.G. Zborovskii, T.N. Aliev
SRC RF TRINITI
142190, Troitsk, Moscow reg., Russia *Tel:+7 498 5405256, Fax: +7 498 5405158, E-mail: [email protected]
N.B. Sokolov, A.A. Shishkin
JSC “TVEL”, Moscow, Russia.
Abstract: At present, an expert system (software package) for fuel monitoring in WWER units is under development in Russia. It comprises several modules which cover analysis of coolant activity, detection of failures and estimation of failure parameters, predictions of activity level and some aspects of PCI analysis. This paper outlines the current version of the fuel monitoring system, its basic features and user interface. Advances in development of computer modules for PCI analysis are reported. At present two levels of PCI analysis are used. The first is estimation of probability for pellets to get in contact with cladding in fuel rods. Estimations are made with taking into account specifications and tolerances for fuel fabrication as well as fuel operation conditions. The second level of PCI analysis implies a simplified approach for on-line calculations of stresses in cladding depending on power ramping rates. The model for PCI calculations and its application within the computer system is demonstrated.
Keywords: on-line fuel monitoring; fuel failures; PCI analysis; WWER units.
1. INTRODUCTION
The primary concern of nuclear power industry is a progressive improvement of fuel performance and more efficient and safe power generation from nuclear fuel. These goals are attained by advancing fuel design, introduction of new fuel cycles and better fuel control during operation of power units. Current trend in fuel operation control lies in development of comprehensive computer systems integrated with in-core data acquisition equipment which provide on-line information on fuel behavior on rod-by-rod basis. By detailed fuel characterization it is possible to avoid excessively conservative limits during fuel operation and thus enhance the unit power output. The state-of-the-art fuel monitoring systems (Kim, 2010, Alapour, 2010) combine possibilities of analyzing fuel behavior for current or upcoming fuel campaigns, assessment of PCI risks, detection of fuel failures and predictions of activity evolution in primary circuit.
At present, an expert system (software package) for fuel monitoring is under development in Russia. It comprises several modules which cover analysis of coolant activity, detection of failures and estimation of failure parameters (number of failed rods, burnup, defect size), predictions of activity level and some aspects of pellet cladding interaction (PCI) analysis. Methods used in the system for failure diagnosis and results of its applications in operating WWER units have been reported recently (Likhanskii, 2009). In 2009-2010 the first computer version of the system has been installed in several WWER-1000 units.
This paper outlines the current version of the fuel monitoring system, its basic features and user interface. Advances in development of computer modules for PCI analysis are reported. At present two levels of PCI analysis are used. The first one is estimation of probability for pellets to get in contact with cladding in fuel rods. Estimations are made with taking into account specifications and tolerances for fuel fabrication as well as fuel operation conditions. The second level of PCI analysis implies a simplified approach for on-line calculations of stress levels in cladding depending on power ramping rates. The model for PCI calculations and its application within the computer system is demonstrated.
2. EXPERT SYSTEM: BASIC FEATURES
Conception of the fuel monitoring system for WWER units, as reported by Likhanskii, 2009, is based on general idea to combine the in-core instrumentation system (ICIS) with advanced computational tools for immediate analysis of the incoming data.
The fuel monitoring system assumes two subsystems for analysis of both defective and intact fuel. Each subsystem contains two levels: monitoring of the current state of the core and the possibility of predictive estimations for the planned conditions of power unit operation. The structure of the whole system is as follows.
Subsystem 1 – Defective fuel. – Analysis of data on primary coolant activity for assessment of the core contamination
level with tramp uranium, detection of failures and evaluation of failure parameters. – Prediction of coolant activity and fuel degradation after the failure has occurred.
Subsystem 2 – Intact fuel. – Monitoring and analysis of the current state of the intact fuel (control of design limits,
PCI occurrence, mechanical stresses in cladding, etc.). – Predictive calculations for behavior of intact fuel under the scheduled conditions of
operation (scheduled power ramps, load-follow modes, etc.).
These modules has been developed as a software package to be used by personnel of a nuclear power plant (NPP). Below we give a brief description of the system in its current version with some demonstration of the user interface.
2.1. CORE INSPECTION WINDOW
The program for the fuel monitoring system starts working with opening the Data Loading Wizard. For current campaign it helps to load the ICIS data and data on coolant activity. For future campaigns it manages loading of data from the corresponding neutronic calculations which define the scheduled patterns for power evolution in fuel assemblies (FAs) and separate fuel rods.
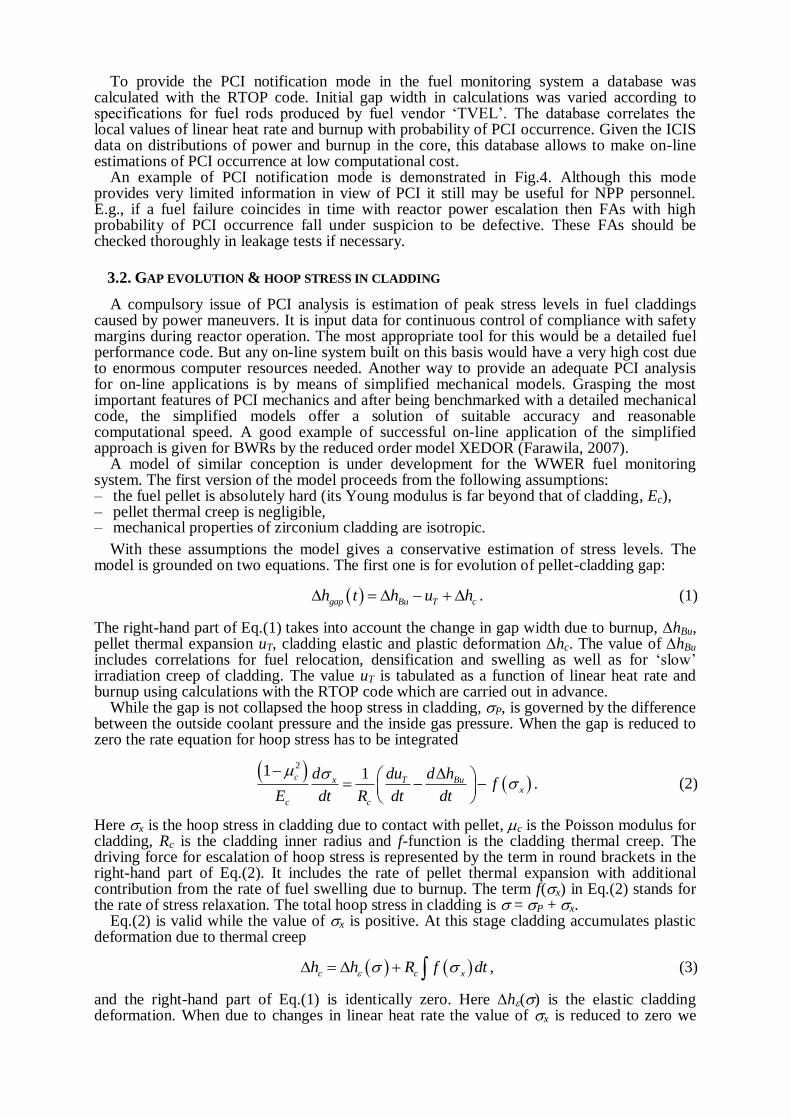
After the Wizard, the main window of the program is opened. It is the Core Inspection
window (Fig.1) designated to visualize the ICIS data. The centre image here is the core map. By default, color and numbers indicate the average heat rate (per fuel rod) in different FAs for the moment of time shown by a vertical red line in the graph below. In the graph, evolution in time of the core-averaged heat rate is plotted. Average axial profile of the core power is shown in the schematic FA image to the left from the core map.
More detailed data may be displayed by selecting a specific FA in the core map and/or specifying an axial layer in the schematic FA image. Power profile data as well as time-evolution data in the below graph are replotted, accordingly. The data may be scrolled in time with the help of the horizontal slider in the lower part of the window.
In the same manner, data may be displayed for fuel burnup, power inhomogeneity in FAs, inlet and outlet coolant temperature, etc. The list of available parameters is shown in the Control Panel, left part of the window.
Handling of the rod-by-rod data is also possible. It is demonstrated in section 3.
2.2. FAILURE DETECTION & EVALUATIONS
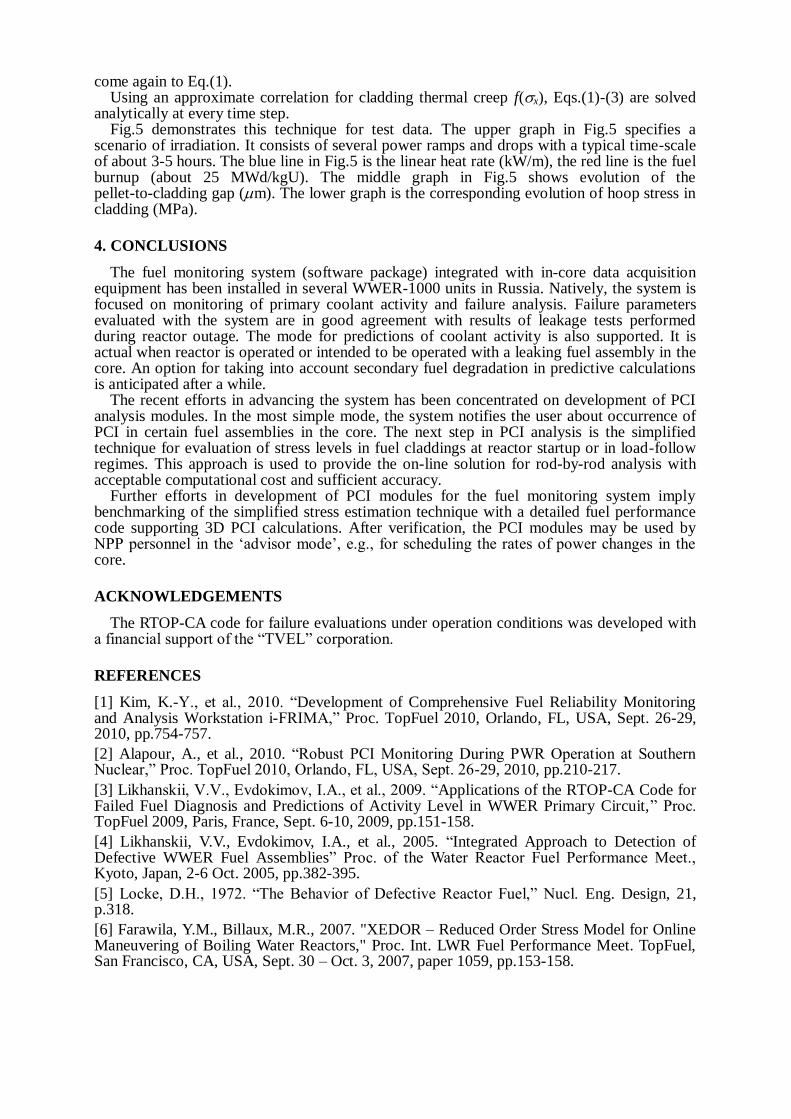
While monitoring coolant activity during reactor operation, contamination of the core with tramp uranium is estimated. When a failure occurs it is revealed by detecting spikes in activity of long-lived radionuclides and by increase in ratio of
131I to
134I specific activities. In
case of severe failures the rate of fuel washout into coolant is determined. An example of such analysis in shown in Fig.2.
In the left Control Panel it is possible to choose different type of graphs and different radionuclides for showing data on their activities. Zooming of graphs is also possible to display the data in more detail.
Further evaluations of failure parameters are available in additional tabs of the window. Defective fuel burnup is evaluated by correlation on the ratio of
134Cs and
137Cs activities in
spikes. Additional burnup evaluations are made using the ratios between activities of noble gases Kr and Xe. For this, time intervals are selected when reactor is operated at a steady power level. Finally, the number of leaking fuel rods in the core and defect sizes are estimated. All evaluations are performed with the certified code RTOP-CA (Likhanskii, 2005, 2009). The ICIS data are taken into account in analysis to narrow the range of uncertainties for evaluated parameters.
Basing on calculations, several suspect FAs are chosen by the program which may be failed with high probability. Positions of these FAs in the core are displayed in the core map. During leakage testing after reactor shutdown the suspect FAs must be checked most carefully.
Results of analysis are summarized in a final report which is automatically generated by the program. Several file formats are supported including the most common MS Word and PDF. The report is editable and may be immediately used by NPP personnel in routine activities.
These preliminary estimations during reactor operation are aimed to reduce the risk of missing the defective FA at subsequent procedures of leakage testing. They also give the opportunity, beforehand, to find a suitable substitution for the failed FA, so saving the outage time.
2.3. ACTIVITY PREDICTIONS
The developed system also provides a tool to estimate the consequences of continued reactor operation with a failed FA in the core. Two possibilities are considered.
First, in the current WWER practice, the leaking FAs still may be reloaded into the core for the next campaign if the certain limits were not exceeded in the leakage tests during reactor outage. For such cases, the RTOP-CA code integrated in the fuel monitoring system is capable of calculating the anticipated activity level in primary coolant. Predictions are carried out with taking into account the effective defect size estimated in leakage tests with pressure cycling technique (Likhanskii, 2005).
To run predictive calculations the user must do the following: – load the neutronics data for the upcoming fuel cycle into the system, – select the cell in the core map into which the leaking FA is intended for reload, – specify several parameters in the Control Panel textboxes such as defect size, time of the
failure and coolant flow rate through the cleaning filters.
Axial defect position in fuel rod may be varied in order to get the most conservative estimation in view of activity level. After clicking the „Calculate‟ button, the real-time show of calculation results is started in the main window. The progress bar is available in the Control Panel (see Fig.3 for example). One calculation takes about 5-10 min in standard PC.
Activity predictions of this kind are performed to support NPP personnel in making the decision whether unload or reload the leaking FA into the specified cell in the core.
The second important situation demanding activity predictions is when a drastic increase in coolant activity occurs in course of the campaign long before the end of the fuel cycle. Such a case entails series of questions like that: – Should we believe that the activity escalation may stop or it will continue growing? – Is there anything to do to avoid violation of safety margins for coolant activity with
ensuing unscheduled reactor shutdown?
A dramatic increase in coolant activity after the primary failure may be due to severe secondary hydriding of Zr cladding. According to Locke, 1972, leaking FAs may be operated successfully at low heat rates. Limited experimental data indicate that the mitigating measures do not necessarily imply maintaining the decreased reactor power until the end of the fuel cycle. A single power drop soon after the occurrence of primary failure, followed by a return to full power, may be sufficient to prevent secondary fuel degradation.
In the current version of the fuel monitoring system the processes of secondary degradation are not taken into account in activity predictions. This option will be added as soon as reliable criteria of secondary hydriding failures for WWER fuel are established. This work is expected.
3. PCI ANALYSIS
The state-of-the-art approach to fuel monitoring lies in fuel analysis on the rod-to-rod basis. It is getting urgent since FAs of different designs with different fuel types and fabricated by different manufacturers may be operated into the core simultaneously. New fuel cycles with higher burnups aggravate PCI problems bearing the risks of higher failure rates. To provide safe and effective operation of power units it becomes important to have detailed information on the in-rod processes: fuel and cladding thermal mechanics, release of fission gas, change of fuel microstructure (rim-structure formation).
The fuel monitoring system for WWERs supports fuel analysis in the rod-by-rod mode. At present two levels of PCI analysis are used. The first one is limited by the detection of PCI occurrence. The second level implies a simplified approach for on-line calculations of hoop stress in claddings.
3.1. PCI OCCURRENCE
The first and the most simple model which was implemented into the fuel monitoring system is aimed on notifying the user that PCI has occurred in certain FAs in the core.
If nuclear reactor is operated in nominal power regime throughout the fuel cycle and power maneuvers are rare
1 then fuel thermal mechanics is not sensitive to irradiation history. It may
be considered as a function of only two parameters: the current linear heat rate and burnup. If it is so, the express estimation of PCI occurrence may be done using a database which is calculated beforehand with a fuel performance code.
Additional uncertainty in PCI estimation originates from tolerances specified for manufacturing of pellets and cladding tubes. Due to deviations in initial geometry a contact between pellets and cladding in different fuel rods of the equivalent design may occur at various times. It is one of the reasons of data spread when pellet-to-cladding gap is measured in post-irradiation examinations. That is why at any time PCI occurrence bears a probabilistic nature. Only in the extreme cases of low or high burnup the situation is quite clear. For low burnups the probability for pellets to get in contact with cladding is negligible (under nominal operation conditions). For high burnups it is close to 100%.
1 This mode of operation is common for WWER units.
To provide the PCI notification mode in the fuel monitoring system a database was calculated with the RTOP code. Initial gap width in calculations was varied according to specifications for fuel rods produced by fuel vendor „TVEL‟. The database correlates the local values of linear heat rate and burnup with probability of PCI occurrence. Given the ICIS data on distributions of power and burnup in the core, this database allows to make on-line estimations of PCI occurrence at low computational cost.
An example of PCI notification mode is demonstrated in Fig.4. Although this mode provides very limited information in view of PCI it still may be useful for NPP personnel. E.g., if a fuel failure coincides in time with reactor power escalation then FAs with high probability of PCI occurrence fall under suspicion to be defective. These FAs should be checked thoroughly in leakage tests if necessary.
3.2. GAP EVOLUTION & HOOP STRESS IN CLADDING
A compulsory issue of PCI analysis is estimation of peak stress levels in fuel claddings caused by power maneuvers. It is input data for continuous control of compliance with safety margins during reactor operation. The most appropriate tool for this would be a detailed fuel performance code. But any on-line system built on this basis would have a very high cost due to enormous computer resources needed. Another way to provide an adequate PCI analysis for on-line applications is by means of simplified mechanical models. Grasping the most important features of PCI mechanics and after being benchmarked with a detailed mechanical code, the simplified models offer a solution of suitable accuracy and reasonable computational speed. A good example of successful on-line application of the simplified approach is given for BWRs by the reduced order model XEDOR (Farawila, 2007).
A model of similar conception is under development for the WWER fuel monitoring system. The first version of the model proceeds from the following assumptions: – the fuel pellet is absolutely hard (its Young modulus is far beyond that of cladding, Ec), – pellet thermal creep is negligible, – mechanical properties of zirconium cladding are isotropic.
With these assumptions the model gives a conservative estimation of stress levels. The model is grounded on two equations. The first one is for evolution of pellet-cladding gap:
gap Bu T ch t h u h . (1)
The right-hand part of Eq.(1) takes into account the change in gap width due to burnup, hBu, pellet thermal expansion uT, cladding elastic and plastic deformation hc. The value of hBu includes correlations for fuel relocation, densification and swelling as well as for „slow‟ irradiation creep of cladding. The value uT is tabulated as a function of linear heat rate and burnup using calculations with the RTOP code which are carried out in advance.
While the gap is not collapsed the hoop stress in cladding, P, is governed by the difference between the outside coolant pressure and the inside gas pressure. When the gap is reduced to zero the rate equation for hoop stress has to be integrated
21 1с x T Bu
x
c c
d du d hf
E dt R dt dt
. (2)
Here x is the hoop stress in cladding due to contact with pellet, c is the Poisson modulus for cladding, Rc is the cladding inner radius and f-function is the cladding thermal creep. The driving force for escalation of hoop stress is represented by the term in round brackets in the right-hand part of Eq.(2). It includes the rate of pellet thermal expansion with additional contribution from the rate of fuel swelling due to burnup. The term f(x) in Eq.(2) stands for the rate of stress relaxation. The total hoop stress in cladding is = P + x.
Eq.(2) is valid while the value of x is positive. At this stage cladding accumulates plastic deformation due to thermal creep
c c xh h R f dt , (3)
and the right-hand part of Eq.(1) is identically zero. Here h() is the elastic cladding deformation. When due to changes in linear heat rate the value of x is reduced to zero we
come again to Eq.(1). Using an approximate correlation for cladding thermal creep f(x), Eqs.(1)-(3) are solved
analytically at every time step. Fig.5 demonstrates this technique for test data. The upper graph in Fig.5 specifies a
scenario of irradiation. It consists of several power ramps and drops with a typical time-scale of about 3-5 hours. The blue line in Fig.5 is the linear heat rate (kW/m), the red line is the fuel burnup (about 25 MWd/kgU). The middle graph in Fig.5 shows evolution of the pellet-to-cladding gap (m). The lower graph is the corresponding evolution of hoop stress in cladding (MPa).
4. CONCLUSIONS
The fuel monitoring system (software package) integrated with in-core data acquisition equipment has been installed in several WWER-1000 units in Russia. Natively, the system is focused on monitoring of primary coolant activity and failure analysis. Failure parameters evaluated with the system are in good agreement with results of leakage tests performed during reactor outage. The mode for predictions of coolant activity is also supported. It is actual when reactor is operated or intended to be operated with a leaking fuel assembly in the core. An option for taking into account secondary fuel degradation in predictive calculations is anticipated after a while.
The recent efforts in advancing the system has been concentrated on development of PCI analysis modules. In the most simple mode, the system notifies the user about occurrence of PCI in certain fuel assemblies in the core. The next step in PCI analysis is the simplified technique for evaluation of stress levels in fuel claddings at reactor startup or in load-follow regimes. This approach is used to provide the on-line solution for rod-by-rod analysis with acceptable computational cost and sufficient accuracy.
Further efforts in development of PCI modules for the fuel monitoring system imply benchmarking of the simplified stress estimation technique with a detailed fuel performance code supporting 3D PCI calculations. After verification, the PCI modules may be used by NPP personnel in the „advisor mode‟, e.g., for scheduling the rates of power changes in the core.
ACKNOWLEDGEMENTS
The RTOP-CA code for failure evaluations under operation conditions was developed with a financial support of the “TVEL” corporation.
REFERENCES
[1] Kim, K.-Y., et al., 2010. “Development of Comprehensive Fuel Reliability Monitoring and Analysis Workstation i-FRIMA,” Proc. TopFuel 2010, Orlando, FL, USA, Sept. 26-29, 2010, pp.754-757.
[2] Alapour, A., et al., 2010. “Robust PCI Monitoring During PWR Operation at Southern Nuclear,” Proc. TopFuel 2010, Orlando, FL, USA, Sept. 26-29, 2010, pp.210-217.
[3] Likhanskii, V.V., Evdokimov, I.A., et al., 2009. “Applications of the RTOP-CA Code for Failed Fuel Diagnosis and Predictions of Activity Level in WWER Primary Circuit,” Proc. TopFuel 2009, Paris, France, Sept. 6-10, 2009, pp.151-158.
[4] Likhanskii, V.V., Evdokimov, I.A., et al., 2005. “Integrated Approach to Detection of Defective WWER Fuel Assemblies” Proc. of the Water Reactor Fuel Performance Meet., Kyoto, Japan, 2-6 Oct. 2005, pp.382-395.
[5] Locke, D.H., 1972. “The Behavior of Defective Reactor Fuel,” Nucl. Eng. Design, 21, p.318.
[6] Farawila, Y.M., Billaux, M.R., 2007. "XEDOR – Reduced Order Stress Model for Online Maneuvering of Boiling Water Reactors," Proc. Int. LWR Fuel Performance Meet. TopFuel, San Francisco, CA, USA, Sept. 30 – Oct. 3, 2007, paper 1059, pp.153-158.
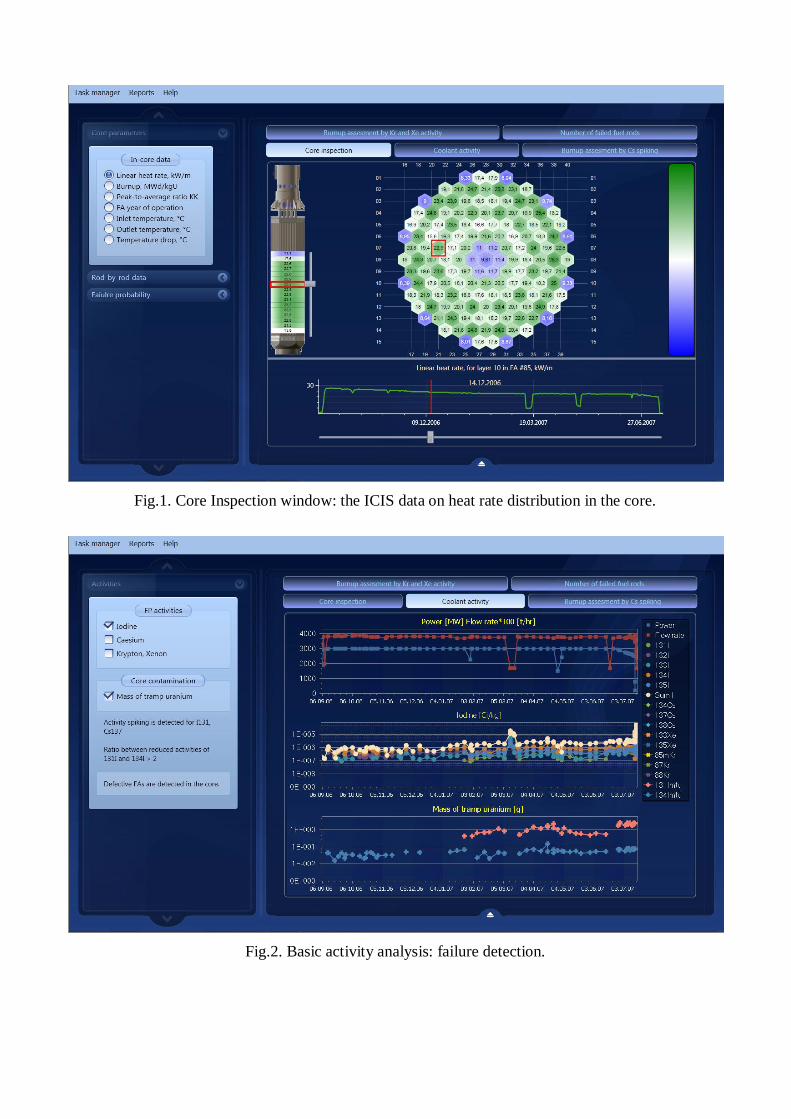
Fig.1. Core Inspection window: the ICIS data on heat rate distribution in the core.
Fig.2. Basic activity analysis: failure detection.
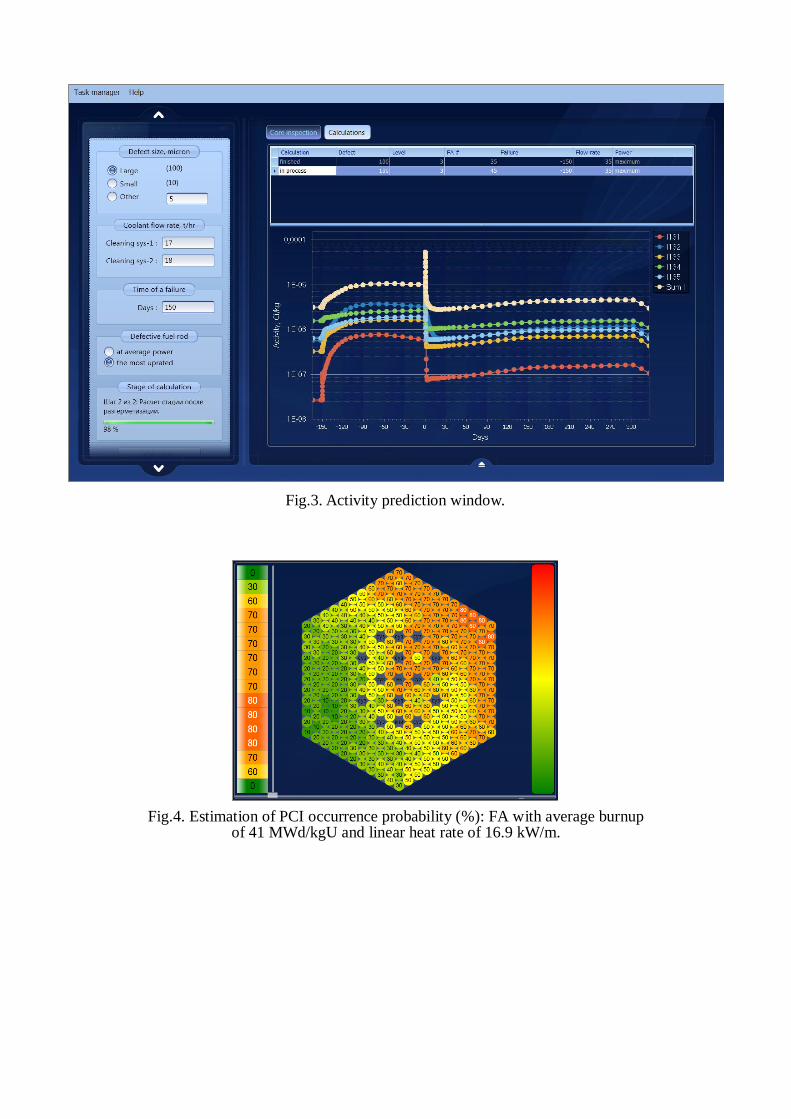
Fig.3. Activity prediction window.
Fig.4. Estimation of PCI occurrence probability (%): FA with average burnup of 41 MWd/kgU and linear heat rate of 16.9 kW/m.

Fig.5. Demonstration of the simplified PCI model on the test data. See text for legend.