Development of crop wild relative conservation strategies...
210
DEVELOPMENT OF CROP WILD RELATIVE CONSERVATION STRATEGIES FOR NORWAY by Jade Phillips A thesis submitted to The University of Birmingham for the degree of DOCTOR OF PHILOSOPHY School of Biosciences College of Life and Environmental Sciences The University of Birmingham April 2017
-
Upload
phungtuyen -
Category
Documents
-
view
215 -
download
1
Transcript of Development of crop wild relative conservation strategies...

DEVELOPMENT OF CROP WILD RELATIVE
CONSERVATION STRATEGIES
FOR NORWAY
by
Jade Phillips
A thesis submitted to The University of Birmingham for the degree of
DOCTOR OF PHILOSOPHY
School of Biosciences
College of Life and Environmental Sciences
The University of Birmingham
April 2017

University of Birmingham Research Archive
e-theses repository This unpublished thesis/dissertation is copyright of the author and/or third parties. The intellectual property rights of the author or third parties in respect of this work are as defined by The Copyright Designs and Patents Act 1988 or as modified by any successor legislation. Any use made of information contained in this thesis/dissertation must be in accordance with that legislation and must be properly acknowledged. Further distribution or reproduction in any format is prohibited without the permission of the copyright holder.
Abstract
Climate change and anthropogenic activities threaten our global food security. One area of
research that may help combat a future food crisis is the utilization of the genetic diversity
available in wild plants. Crop wild relatives (CWR) are one such resource. They are the wild
taxa most closely related to crops and from which diverse traits could be transferred to the
crop. This project uses Norway as an example, to contribute towards methodologies to
identify those CWR populations that are most important for conservation and use. This
involves the creation of a priority list of CWR for Norway, in situ and ex situ diversity
analysis of CWR populations, gap analysis and ecogeographic land characterization
methodologies, predictive climate change analysis for CWR distributions and genetic
diversity studies of taxa using Amplified Fragment Length Polymorphisms (AFLPs).
Comprehensive in situ and ex situ national recommendations for the conservation of CWR in
Norway are detailed. These include the incorporation of management plans for CWR
populations within the Færder national park in Norway, the first instance of such
conservation activities in Scandinavia. The scientific methods used and developed will help
Norway meet its international obligations for conservation and use of genetic diversity of
CWR and will contribute to the regional and global efforts to systematically conserve and
utilize the diversity found in CWR.

For Grandad,
enjoy your long walk amongst the flowers.

Acknowledgements
I am indebted to both Åsmund Asdal and Dr. Nigel Maxted who believed in me from the
outset and without whom this PhD would not have been possible, thank you. Dr Joana
Magos Brehm has always provided invaluable knowledge and advice throughout this project.
Shelagh Kell and Professor Ford Lloyd for sharing their in-depth expertise with me. Morten
Rasmussen for the ongoing support of myself and this project and for the persistent push for
the continued conservation and use of CWR within Norway.
Thank you to the many Norwegian and Scandinavian colleagues who I had the pleasure to
work with across Norway over the last three and a half years, including: Karen Jordal, Dag
Endresen, Oddvar Peterson, Tore Berg, Bob van Oort, Vegar Bakkestuen, Heli Fitzgerald,
Anna Palmè, I look forward to many more years of collaboration.
I am grateful to Kirsten Skøt and Matthew Hegarty from IBERS for providing this project
with their expertise and Caroline Pollock and Jamie Carr from the IUCN for their helpful
advice. I would like to thank Mauricio Parra-Quijano for his continued guidance and
willingness to answer my many questions about CAPFITOGEN.
Thank you to Hannah Fielder and Holly Vincent for passing on their PhD wisdom as well as
Maria João Almeida and Aremi Contreras Toledo for keeping me smiling in the office.
I am especially grateful to the Norwegian Ministry of Agriculture and Food for funding this
project.
Finally, I would like to thank my family and friends for always believing in me, more than I
ever could myself.
Thank you.
Table of contents
CHAPTER 1. Introduction ..................................................................................................... 1
1.1 What is a crop wild relative? ............................................................................................ 3
1.2 Aim of in situ and ex situ CWR conservation .................................................................. 7
1.3 International legislation for PGR conservation .............................................................. 13
1.4 Threats to CWR .............................................................................................................. 15
1.5 Floristic background to Norway ..................................................................................... 19
1.5.1 Threats to CWR in Norway ..................................................................................... 21
1.5.2 Current in situ and ex situ conservation actions in Norway .................................... 23
1.6 Background to methods .................................................................................................. 26
1.6.1 Checklist and inventory ........................................................................................... 26
1.6.2 Ecogeographic study ................................................................................................ 27
1.6.3 Predicted distribution ............................................................................................... 29
1.6.4 Climate change analysis .......................................................................................... 31
1.6.5 CAPFITOGEN tools................................................................................................ 33
1.6.6 Genetic diversity analyses ....................................................................................... 34
1.7 Aim and objectives ......................................................................................................... 36
1.8 Overview of thesis .......................................................................................................... 37
CHAPTER 2. Methodology................................................................................................... 41
2.1 National CWR checklist ................................................................................................. 41
2.2 Prioritization and Inventory ........................................................................................... 42
2.3 Ecogeographic study ...................................................................................................... 43
2.4 Diversity analyses .......................................................................................................... 44
2.4.2 Species richness and occurrence data bias .............................................................. 47
2.4.3 Predicted distribution and gap analysis ................................................................... 47
2.4.3.1 In situ gap analysis ............................................................................................... 49
2.4.3.2 Ex situ gap analysis............................................................................................... 49
2.4.4 Complementarity analysis ....................................................................................... 50
2.4.5 Climate change assessment ..................................................................................... 51
2.4.5.1 Climate change diversity analyses ........................................................................ 52
2.5 Genetic diversity studies ................................................................................................ 53
2.5.1 Molecular marker genotyping ................................................................................. 57
2.5.2 Analysis of the AFLP electropherograms ............................................................... 58
2.5.3 Statistical analysis.................................................................................................... 59
CHAPTER 3. In situ and ex situ diversity analysis of priority crop wild relatives in
Norway .................................................................................................................................... 61
3.1 Abstract .......................................................................................................................... 62
3.2 Introduction .................................................................................................................... 63
3.3 Methods .......................................................................................................................... 66
3.3.1 National CWR checklist and inventory ................................................................... 66
3.3.2 In situ diversity analyses.......................................................................................... 67
3.3.3 Potential distribution modelling .............................................................................. 68
3.3.4 Ecogeographic Land Characterization maps ........................................................... 69
3.3.5 Ex situ diversity analyses ......................................................................................... 70
3.4 Results ............................................................................................................................ 71
3.4.1 CWR checklist, inventory and ecogeographic study ............................................... 71
3.4.2 In situ diversity analysis .......................................................................................... 72
3.4.3 ELC map .................................................................................................................. 82
3.4.4 Ex situ diversity analyses ......................................................................................... 84
3.5 Discussion ...................................................................................................................... 86
3.5.1 In situ diversity analysis .......................................................................................... 88
3.5.2 Ex situ diversity analysis ......................................................................................... 92
3.5.3 In situ conservation priorities .................................................................................. 93
3.5.4 Ex situ conservation priorities ................................................................................. 93
3.6 Conclusion ...................................................................................................................... 94
CHAPTER 4. Climate change and national crop wild relative conservation planning .. 96
4.1. Abstract ......................................................................................................................... 97
4.2 Introduction .................................................................................................................... 97
4.3 Methods ........................................................................................................................ 101
4.3.1 Species data sources .............................................................................................. 101
4.3.2 Species distribution modelling .............................................................................. 101
4.3.3 Species richness, turnover and threat level ............................................................ 103
4.4 Results .......................................................................................................................... 104
4.5 Discussion .................................................................................................................... 115
4.6 Conclusion .................................................................................................................... 119

CHAPTER 5. Genetic diversity studies of priority crop wild relatives in Norway using
AFLPs: Implications for conservation ............................................................................... 121
5.1 Abstract ........................................................................................................................ 122
5.2 Introduction .................................................................................................................. 122
5.3 Methods ........................................................................................................................ 125
5.3.1 Sample collection .................................................................................................. 125
5.3.2 Molecular marker genotyping ............................................................................... 129
5.3.3 Statistical analysis.................................................................................................. 130
5.4 Results .......................................................................................................................... 131
5.4.1 Genetic distinctness among populations................................................................ 136
5.4.2 Environmental diversity and genetic diversity ...................................................... 137
5.5 Discussion .................................................................................................................... 139
5.5.1 Issues with the use of AFLP data .......................................................................... 144
5.6 Conclusion .................................................................................................................... 146
CHAPTER 6. Discussion ..................................................................................................... 148
6.1 The process of CWR diversity planning for Norway ................................................... 148
6.1.1 In situ diversity analysis ........................................................................................ 150
6.1.2 Ex situ diversity analysis ....................................................................................... 153
6.1.3 What have we achieved in Norway? ..................................................................... 156
6.1.4 The Nordic Project ................................................................................................. 158
6.2 Project limitations ........................................................................................................ 160
6.3 Further work ................................................................................................................. 162
6.4 Conclusion .................................................................................................................... 165
REFERENCES…………………………………………………………………………….167

List of figures
Figure 1.1: An example of the Harlan and de Wet Genepool concept (1971). GP1: Fragaria
x ananassa Duchesne ex Rozier (crop), GP1B: F. chiloensis (L.) Mill, GP2: F. cascadensis
K. E. Hummer, GP3 F. vesca L. (Vincent et al. 2013)………………………………………..5
Figure 2.1: Schematic of the main procedures used in creating SDM and predictive climatic
models in this study………………………………………………………………………......45
Figure 2.2: Location of the 26 collecting sites (see Table S2.4 for more details) for the ten
CWR in Norway. The PA network is shown. Multiple points at each site represent the
breadth of the locations visited within one site to collect the ten species……………………56
Figure 3.1: Taxa richness of 201 priority CWR in Norway. All grid cells are equivalent to 10
km2 at the equator. Map drawn to geographic coordinate system WGS 1984……………....73
Figure 3.2: Sampling bias of observation data obtained from GBIF. All grid cell are
equivalent to 10 km2 at the equator. Map drawn to geographic coordinate system WGS
1984………………………………………………………………………………………..…74
Figure 3.3: The grid cell complementary network of 19 areas (4 x 8 km2) which conserve
201 priority CWR in Norway. A) Southern Norway, B) Northern Norway. Numbers refer to
priority cell order (number one is higher priority than number two). Letters refer to reserves
with the same number of additional taxa but different numbers of total taxa, with ‘a’
containing more taxa than ‘b’ etc. Created using the Complementa tool from CAPFITOGEN.
Map drawn to geographic coordinate system WGS 1984……………………………………76
Figure 3.4: The PA complementarity network of 23 reserves (shaded) for 181 priority CWR
taxa in Norway. A) Southern Norway, B) Northern Norway. Numbers refer to priority order
(number one is the first reserve location with the highest number of taxa, number two has the
highest number of additional taxa et.). Letters refer to reserves with the same number of
additional taxa but different numbers of total taxa, with ‘a’ containing more than ‘b’ etc.
Created using the Complementa tool in CAPFITOGEN. Map drawn to geographic coordinate
system WGS 1984…………………………………………………………………………...78
Figure 3.5: The predicted distribution of 187 priority CWR in Norway under the current
climatic conditions. Red areas indicate taxon-rich areas with up to 124 taxa found there, and
green areas indicate low taxon richness. All grid cells equal to 4 x 8 km2………………......80
Figure 3.6: The ELC map for Norway composed of 27 ELC zones each representing a
unique combination of environmental variables. See table S3.6 for average values in each
zone. Zone 0 refers to those areas where information for some of the components making up
the map are missing. Created in CAPFITOGEN using the ELC mapas tool. Cell size is
equivalent to 4 x 8 km2 and is drawn to geographic coordinate system WGS 1984………...83
Figure 3.7: The number of taxa and priority level (class one is the highest priority level) for
collecting within the ELC zones, for a total of 23 taxa that currently have ex situ accessions.
(Asparagus only had three ex situ accessions which were located in areas of the ELC map
which did not contain environmental data; therefore in this analysis it was assumed the taxa
had no ex situ collections)……………………………………………………………………86

Figure 4.1: The average predicted taxon richness of 187 priority CWR in Norway under RCP
2.6 for the years a) 2030, b) 2050, c) 2070, d) 2080. Raster grid cell size 0.0416,
approximately equal to 4 x 8 km2…………………………………………………………...106
Figure 4.2: The average predicted taxon richness of 187 priority CWR in Norway under RCP
6.0 for the years a) 2030, b) 2050, c) 2070, d) 2080. Raster grid cell size 0.0416,
approximately equal to 4 x 8 km2…………………………………………………………...107
Figure 4.3: The average turnover of taxa per grid cell under RCP 2.6 for year a) 2030, b)
2050, c) 2070, d) 2080. Value is in percent, with 100 representing a complete turnover of all
taxa within that cell. Zero means the taxa within the cell stay the same. Raster grid cell size
0.0416, approximately equal to 4 x 8 km2…………………………………………………..109
Figure 4.4: The average turnover of taxa per grid cell under RCP 6.0 for year a) 2030, b)
2050, c) 2070, d) 2080. Value is in percent with 100 representing a complete turnover of all
taxa within that cell. Zero means the taxa within the cell stay the same. Raster grid cell size,
approximately equal to 4 x 8 km2………………………………………………………..….110
Figure 4.5: Percentage of taxa that lose area. Modelled under unlimited migration and no-
migration scenarios and RCP 2.6 and RCP 6.0……………………………………………..111
Figure 4.6: Percentage of taxa that gain area under unlimited migration and RCP 2.6 and
RCP 6.0. Taxa under no-migration gain no area as they are unable to expand from their
current distribution……………………………………………………………………….…112
Figure 4.7: The predicted number of threatened taxa as determined by the IUCN category
A3(c). For the full list of threatened taxa see Table S4.2…………………………………..113
Figure 4.8: The number of taxa threatened per year under a) no-migration and b) unlimited
migration for RCP 2.6 and RCP 6.0 (diagonal line bars), as determined by the area lost based
upon IUCN criterion A3(c)………………………………………………………………....114
Figure 5.1: Location of the 26 collecting sites (see Table 5.1 for further site information) and
the PA network in Norway. The green highlighted PAs are those in the PA complementary
network and the red cells are those from the grid cell complementary network. See Phillips et
al. (2016) for detailed information about the PA and grid cell complementary
network…………………………………………………………………………………...…128
Figure 5.2: Principal coordinates analysis for T. repens (a and b), T. pratense (c and d) and
C. carvi (e and f). a), c) and e) represent PCoA for individuals b), d) and f) represent PCoA
for populations………………………………………………………………………………134
Figure 5.3: Mantel tests for the C. carvi, T. pratense and T. repens showing the relationship
between genetic distance (FST) and geographic distance…………………………………...135
List of tables
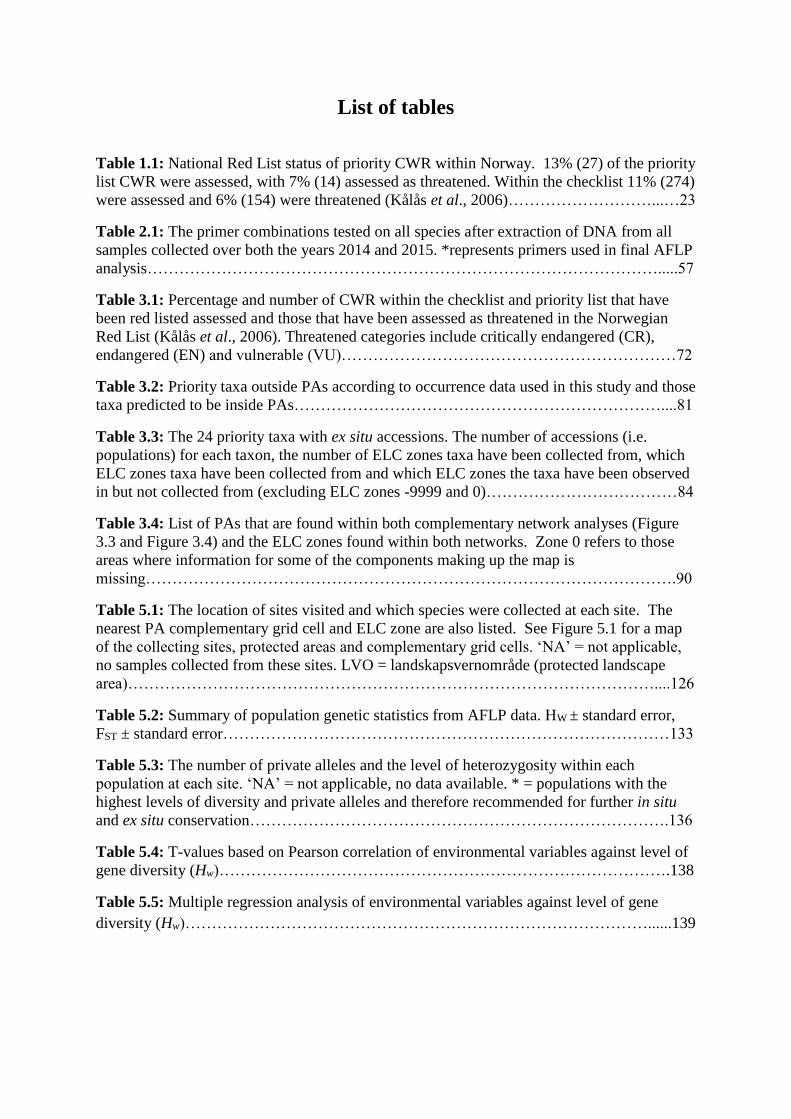
Table 1.1: National Red List status of priority CWR within Norway. 13% (27) of the priority
list CWR were assessed, with 7% (14) assessed as threatened. Within the checklist 11% (274)
were assessed and 6% (154) were threatened (Kålås et al., 2006)………………………...…23
Table 2.1: The primer combinations tested on all species after extraction of DNA from all
samples collected over both the years 2014 and 2015. *represents primers used in final AFLP
analysis…………………………………………………………………………………….....57
Table 3.1: Percentage and number of CWR within the checklist and priority list that have
been red listed assessed and those that have been assessed as threatened in the Norwegian
Red List (Kålås et al., 2006). Threatened categories include critically endangered (CR),
endangered (EN) and vulnerable (VU)………………………………………………………72
Table 3.2: Priority taxa outside PAs according to occurrence data used in this study and those
taxa predicted to be inside PAs……………………………………………………………....81
Table 3.3: The 24 priority taxa with ex situ accessions. The number of accessions (i.e.
populations) for each taxon, the number of ELC zones taxa have been collected from, which
ELC zones taxa have been collected from and which ELC zones the taxa have been observed
in but not collected from (excluding ELC zones -9999 and 0)………………………………84
Table 3.4: List of PAs that are found within both complementary network analyses (Figure
3.3 and Figure 3.4) and the ELC zones found within both networks. Zone 0 refers to those
areas where information for some of the components making up the map is
missing……………………………………………………………………………………….90
Table 5.1: The location of sites visited and which species were collected at each site. The
nearest PA complementary grid cell and ELC zone are also listed. See Figure 5.1 for a map
of the collecting sites, protected areas and complementary grid cells. ‘NA’ = not applicable,
no samples collected from these sites. LVO = landskapsvernområde (protected landscape
area)………………………………………………………………………………………....126
Table 5.2: Summary of population genetic statistics from AFLP data. HW ± standard error,
FST ± standard error…………………………………………………………………………133
Table 5.3: The number of private alleles and the level of heterozygosity within each
population at each site. ‘NA’ = not applicable, no data available. * = populations with the
highest levels of diversity and private alleles and therefore recommended for further in situ
and ex situ conservation…………………………………………………………………….136
Table 5.4: T-values based on Pearson correlation of environmental variables against level of
gene diversity (Hw)………………………………………………………………………….138
Table 5.5: Multiple regression analysis of environmental variables against level of gene
diversity (Hw)……………………………………………………………………………......139

Supplementary data Supplementary data is available on the CD at the back of this thesis.
CHAPTER 1.
Table S1.1: The number of accessions stored in the Nordic Genetic Resources Centre
SESTO database.
CHAPTER 2.
Table S2.1: The Norwegian CWR checklist.
Table S2.2: The Norwegian priority CWR inventory.
Table S2.3: The full list of ecogeographic variables available to use for the predicted
distributions and ecogeographic analyses. Which analysis variables used in: a = predicted
distribution, b = ELC map, c = variables resulting from collinearity test, d = variables used in
climate change analysis.
Box S2.1: R script to test for collinearity.
Box S2.2: Parameters used in CAPFITOGEN tool Representa.
Box S2.3: Parameters used in the CAPFITOGEN tool Complementa for both the grid cell
analysis and PA analysis.
Table S2.4: Collecting site details for the 26 sites visited across Norway. Latitude, longitude
and altitude are average values over the whole site for the multiple populations collected.
Table S2.5: The semi-wild/cultivated populations used in the genetic diversity study.
Twenty individuals from each population were utilised.
CHAPTER 3.
Figure S3.1: Taxa richness within the PA network in Norway. All grid cells are equivalent
to 10 km2 at the equator. Map drawn to Geographic Coordinate System: WGS 1984.
Table S3.1: The grid cell complementary network for in situ reserves using CAPFITOGEN
complementa tool. 19 grid cells at 10km2 conserved 201 priority CWR taxa. The letters
were used to differentiate complementary cells with the same number of additional taxa but
different numbers of total taxa.
Table S3.2: Number of populations conserved within the CAPFITOGEN grid cell
complementary network and the PA complementary network.
Table S3.3: The PA complementary network for in situ reserves using CAPFITOGEN
complementa tool. 23 PA conserved 181 priority taxa. The letters were used to differentiate
complementary cells with the same number of additional taxa but different numbers of total
taxa.
Table S3.4: Area Under the Receiver Operating Curve (AUC) scores.
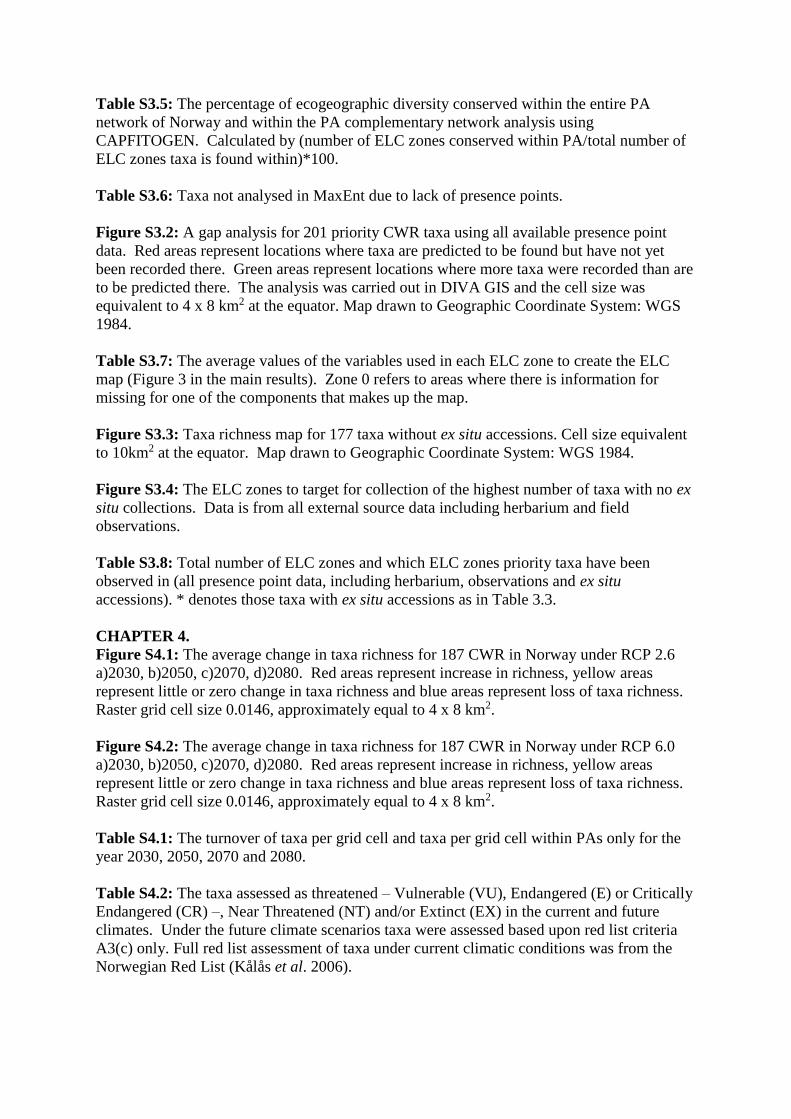
Table S3.5: The percentage of ecogeographic diversity conserved within the entire PA
network of Norway and within the PA complementary network analysis using
CAPFITOGEN. Calculated by (number of ELC zones conserved within PA/total number of
ELC zones taxa is found within)*100.
Table S3.6: Taxa not analysed in MaxEnt due to lack of presence points.
Figure S3.2: A gap analysis for 201 priority CWR taxa using all available presence point
data. Red areas represent locations where taxa are predicted to be found but have not yet
been recorded there. Green areas represent locations where more taxa were recorded than are
to be predicted there. The analysis was carried out in DIVA GIS and the cell size was
equivalent to 4 x 8 km2 at the equator. Map drawn to Geographic Coordinate System: WGS
1984.
Table S3.7: The average values of the variables used in each ELC zone to create the ELC
map (Figure 3 in the main results). Zone 0 refers to areas where there is information for
missing for one of the components that makes up the map.
Figure S3.3: Taxa richness map for 177 taxa without ex situ accessions. Cell size equivalent
to 10km2 at the equator. Map drawn to Geographic Coordinate System: WGS 1984.
Figure S3.4: The ELC zones to target for collection of the highest number of taxa with no ex
situ collections. Data is from all external source data including herbarium and field
observations.
Table S3.8: Total number of ELC zones and which ELC zones priority taxa have been
observed in (all presence point data, including herbarium, observations and ex situ
accessions). * denotes those taxa with ex situ accessions as in Table 3.3.
CHAPTER 4.
Figure S4.1: The average change in taxa richness for 187 CWR in Norway under RCP 2.6
a)2030, b)2050, c)2070, d)2080. Red areas represent increase in richness, yellow areas
represent little or zero change in taxa richness and blue areas represent loss of taxa richness.
Raster grid cell size 0.0146, approximately equal to 4 x 8 km2.
Figure S4.2: The average change in taxa richness for 187 CWR in Norway under RCP 6.0
a)2030, b)2050, c)2070, d)2080. Red areas represent increase in richness, yellow areas
represent little or zero change in taxa richness and blue areas represent loss of taxa richness.
Raster grid cell size 0.0146, approximately equal to 4 x 8 km2.
Table S4.1: The turnover of taxa per grid cell and taxa per grid cell within PAs only for the
year 2030, 2050, 2070 and 2080.
Table S4.2: The taxa assessed as threatened – Vulnerable (VU), Endangered (E) or Critically
Endangered (CR) –, Near Threatened (NT) and/or Extinct (EX) in the current and future
climates. Under the future climate scenarios taxa were assessed based upon red list criteria
A3(c) only. Full red list assessment of taxa under current climatic conditions was from the
Norwegian Red List (Kålås et al. 2006).

List of abbreviations
AFLP Amplified fragment length polymorphism
AMOVA Analysis of molecular variance
CBD Convention on Biological Diversity
CCAFS Climate Change, Agriculture and Food Security
CCVA Climate Change Vulnerability Analysis
CWR Crop wild relative
ELC Ecogeographic Land Characterisation
ESPC European Strategy for Plant Conservation
EURISCO European Search Catalogue for Plant Genetic Resources
GBIF Global Biodiversity Information Facility
GCM Global Circulation Model
GIS Geographical Information System
GP Gene Pool
GRS Geographical representativeness score
GSPC Global Strategy for Plant Conservation
IBERS Institute of Biological, Environmental and Rural Sciences
ICARDA International Center for Agricultural Research in the Dry Areas
INDC Intended Nationally Determined Contribution
IPCC Intergovernmental Panel on Climate Change
IPGRI International Plant Genetic Resources Institute
ITPGRFA International Treaty on Plant Genetic Resources for Food and Agriculture
IUCN International Union for the Conservation of Nature
LVO Landskapsvernområde
NGS Next-generation sequencing
NP National Park
PA/s Protected area/s
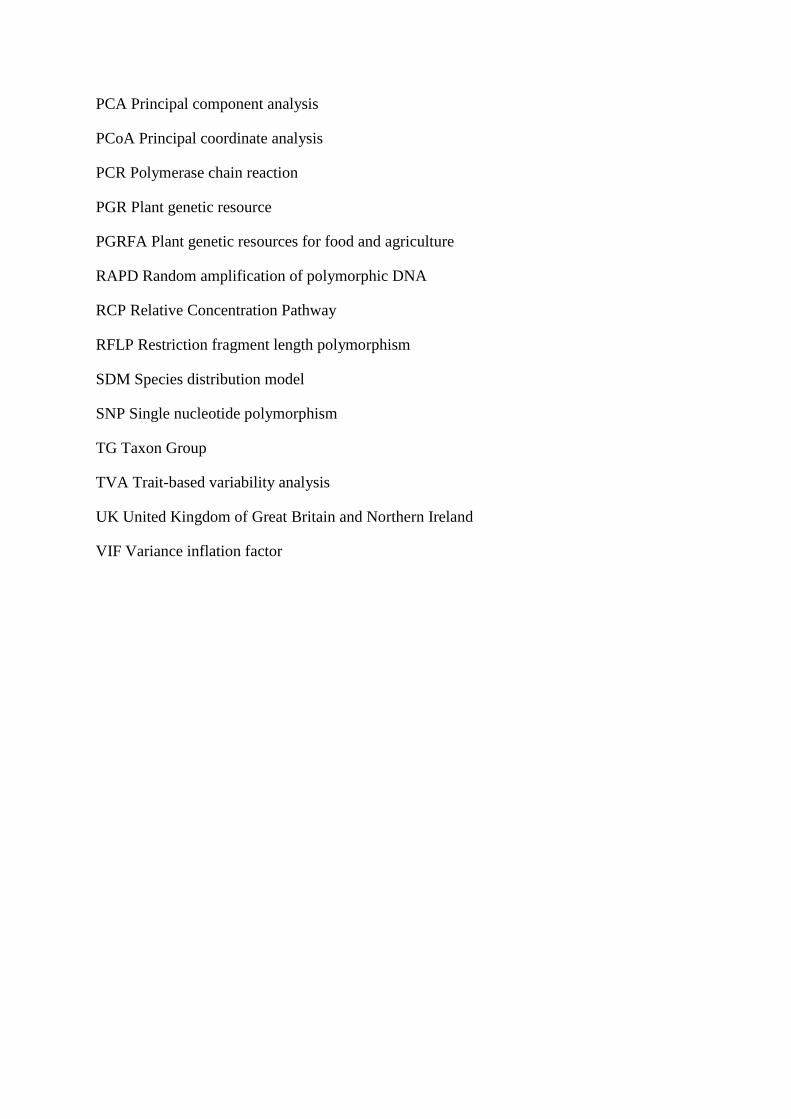
PCA Principal component analysis
PCoA Principal coordinate analysis
PCR Polymerase chain reaction
PGR Plant genetic resource
PGRFA Plant genetic resources for food and agriculture
RAPD Random amplification of polymorphic DNA
RCP Relative Concentration Pathway
RFLP Restriction fragment length polymorphism
SDM Species distribution model
SNP Single nucleotide polymorphism
TG Taxon Group
TVA Trait-based variability analysis
UK United Kingdom of Great Britain and Northern Ireland
VIF Variance inflation factor

1
CHAPTER 1.
Introduction
Every species is worth conserving, every species has a value and place in the global ecosystem,
however, the conservation of a resource only becomes important if the resource has or acquires
recognized value (Hoisington et al., 1999). Biodiversity is a key component of our planet and
vital for a range of ecosystem services that are essential to the human population. Throughout
the globe there are 25 biodiversity hotspots containing high concentrations of endemic species,
including 44% of vascular plants yet covering only 1.4% of land surface area (Myers et al.,
2000). The agricultural landscape (including arable land, permanent crops and permanent
pastures) covers over 37% of global land area (FAO, 2016). Undoubtedly, our food is one of
the resources of highest value to us as a species. We depend on fewer than a dozen of the
approximately 300,000 species of flowering plants for 80% of our calorific intake (McCouch et
al., 2013). Just four crops, rice, wheat, maize and potato, provide more than 60% of our food.
In addition, more and more wheat and maize are being grown as feed for our animals (Keyzer
et al., 2005; Shiferaw et al., 2011) further increasing the pressures on our agricultural system.
With a population that is expected to increase by 34% to 9.1 billion by 2050 (FAO, 2009a) we
will need to increase food production by up to 70‒100% to meet these demands (Royal Society
of London, 2009; World Bank, 2008).
Resources are already limited, therefore conserving and utilising the materials we have
available to help ensure our food security is becoming more urgent. Agrobiodiversity is an
important concept in terms of bridging the research and implementation gaps between food
security and conservation. It refers to species and varieties of crops and livestock as well as
their wild relatives that contribute to agriculture (Qualset et al., 1995). Understanding,

2
conserving and harnessing this diversity is essential if we are to sustainably continue producing
food and feeding the population.
The loss of flora and fauna is well documented but much less is widely known about the loss of
genetic diversity (Nabham, 2009). We capitalize on only a fraction of the genetic diversity that
resides within each of the species used to feed us (McCouch et al., 2013). Yet food production
and food security depend on the wise use and conservation of agricultural biodiversity and
genetic resources (Esquinas-Alcazar, 2005). Unexploited genetic material from landraces, rare
breeds and wild relatives will be [and have been] important in allowing plant pre-breeders and
breeders to respond to new challenges (Godfray et al., 2010). For example, 90% of wheat
varieties worldwide are susceptible to the Ug 99 race of fungus, however transfer of resistance
genes from wheat relatives into cultivars is already underway and proving successful (Singh et
al., 2011). This use of wild genetic diversity can not only help to combat diseases and pests
but can also improve productivity and adapt crops to climatic changes.
Genetic diversity is needed as global food supplies have become more similar in composition
meaning there is a heightened interdependence between countries upon food and plant genetic
resources (PGR; Khoury et al., 2014). This also implies that attention needs to be focused on
the stable and long-term production of these staple crops to match the foreseeable increase in
demand (Khoury et al., 2014). This global demand has created a situation where high
production, which is based on uniform crops, has been given priority over more reliable,
diversified methods (Esquinas-Alcazar, 2005). Industrialised large-scale farming meets the
immediate hunger needs of the population but risks long-term security due to low adaptability
of crops to environmental fluctuations. The dangers of having monocultures are highlighted
most notably by the Irish potato famine in 1845 where the crops were attacked by the spores of
Phytophthora infestans, leading to large scale famine. Other crops such as banana are also at

3
risk as they are genetically restricted leading to only a few cultivated varieties which are
particularly susceptible to diseases, pests and ecological changes (Perrier et al., 2011).
Increasing the genetic diversity of our crops will also provide wider ecosystem service benefits
both in the present and the future (Jackson et al., 2007). It is the underlying genetic diversity
of these wild species, and others that is vital for playing a role in enhancing the provision of
many services concurrently in multifunctional and sustainable agriculture (Hajjar and Hodgkin,
2007). For example, drought tolerant varieties will increase productivity of crops but also
prevent soil erosion and increase soil organic matter (Millennium Ecosystem Assessment
2005). Furthermore, a study by Isbell et al. (2011) has shown that many species will be needed
to maintain ecosystem multifunctionality at large spatial-temporal scales in a changing world.
Ecosystem-based approaches to adaptation also harness the capacity of nature to buffer human
communities against the adverse impacts of climate change (Jones et al., 2012) as well as being
shown to be the most cost-effective defence against a varying climate (Martin and Watson,
2016).
Making use of and maintaining agricultural biodiversity can help improve food security
(Millennium Ecosystem Assessment, 2005) for which PGR are essential as they contain useful
traits for adapting our crops to future challenges. To help do this we should be moving from
species conservation to conservation of genetic diversity.
1.1 What is a crop wild relative?
Crop wild relatives (CWR) are a PGR that have an indirect use derived from their relatively
close genetic relationship to a crop. This is a broad definition of a CWR and as such includes a
broad number of species. For example, using this definition Maxted and Kell (2009) estimate
there are around 50 to 60,000 CWR globally, with Kell et al. (2008) finding that 80% of the

4
European and Mediterranean Flora contains CWR. In such a case, a more specific definition
can be used:
A crop wild relative is a wild plant taxon that has an indirect use derived from its relatively
close genetic relationship to a crop; this relationship is defined in terms of the CWR belonging
to Gene Pools 1 or 2, or Taxon Groups 1 to 4 of the crop (Maxted et al., 2006).
This takes account of the main reason to conserve CWR, i.e. for their use as plant breeding
material. The Harlan and de Wet (1971) Gene Pool (GP) concept referred to in the above
definition, is used to determine a wild species’ relatedness to a crop. This is done by
establishing the relative crossing ability between the crop itself and the wild relative within the
primary, secondary or tertiary GP (see Figure 1.1). CWR in the primary GP (GP1b) can be
easily transferred to the crop, which belongs to GP1a. This primary genepool is often
composed of landrace material. CWR in the secondary GP (GP2) can be crossed with some
limited success and those in the tertiary GP (GP3) require biotechnological approaches to
facilitate gene transfer (Harlan and de Wet, 1971). However, it is only possible to define CWR
by the GP concept when extensive information is available on patterns of genetic diversity and
relative crossing ability (Maxted et al., 2006), which is only known for the well-studied crops
(Heywood, 2008). For CWR taxa in which we have little or no genetic diversity data, the
Taxon Group (TG) concept can be used to assist in setting conservation priorities (Maxted et
al., 2006). This follows traditional taxonomic relationships between taxa, with TG1a
representing the crop, TG1b including the CWR belonging to the same species as the crop,
TG2 includes CWR in the same section as the crop, TG3 contains CWR in the same subgenus
and TG4 represents those CWR in the same genus as the crop. These methods of defining
CWR are now commonplace and have been used to prioritize CWR for individual species, as
well as CWR for conservation at national and global levels (Vincent et al., 2013).

5
Figure 1.1: An example of the Harlan and de Wet Genepool concept (1971). GP1: Fragaria x
ananassa Duchesne ex Rozier (crop), GP1B: F. chiloensis (L.) Mill, GP2: F. cascadensis K. E.
Hummer, GP3 F. vesca L. (Vincent et al. 2013).
CWRs are found throughout the globe, from the Arctic Circle to the southern tip of South
America. Key areas of CWR richness are found in those regions where cultivation of wild
species is said to have originated. For example, cultivation of wheat, barley and oats first took
place in the near east, which is one of the most species rich locations for these and other
important grains (Vavilov, 1949; Vincent et al., 2013). Nikolai Vavilov is widely
acknowledged as the person to first make this link and identify the centres of origin of
cultivated plants (Vavilov, 1949). He also made the link between high levels of species
diversity and the potentially high levels of genetic diversity within the wild species. In present
day St Petersburg, Russia, the Vavilov Institute of Plant Genetic Resources conserves and
utilises the seeds that he helped to collect. Vavilov began utilising wild species related to
wheat (Aegilops L., Secale L., Agropyron Gaertn.) to improve the cultivated crop in Russia.
Norman Borlaug continued this work and is said to have initiated the Green Revolution by
GP1a Fragaria x ananassa
F. chiloensis
F. cascadensis
F. vesca
GP1b
GP2
GP3

6
incorporating genes from wild wheat relatives for dwarfing and pest and disease resistance into
cultivated wheat in the 1940s and 1950s (World Food Prize, 2016). Building on the work of
Vavilov, a more recent study looking at 173 crop complexes has shown that West Asia has the
most CWR present (Vincent et al., 2013). However, when country size and number of CWR
are considered, the highest concentration of CWR are in Lebanon, Israel, Greece and the
Mediterranean islands which are also likely to contain high numbers of endemic CWR
compared to the mainland countries (Vincent et al., 2013).
From these early examples, the use of CWR in breeding has continued to rise, with the number
of publications detailing use of CWR in breeding increasing from 2% in 1970 to 38% in 1999
(Maxted and Kell, 2009). CWR have had extensive periods of interaction between their
environment (IPGRI, 1994) and because of this these species have outstanding characteristics
in climatic and edaphic adaptation (Harlan, 1975). Plant breeders acknowledge that there is a
wide range of useful genetic diversity available in CWR (Feuillet et al., 2008) with the most
widespread use of CWR for pest and disease resistance (Maxted and Kell, 2009). For example,
oat wild relatives have been used for rust resistance (Prescott-Allen and Prescott Allen, 1986)
and a gene from the potato wild relative Solanum venturii Hawkes & Hjert. was introduced to a
cultivated variety conferring blight-resistance (Jones et al., 2014). Other traits, including
improvement of drought tolerance in cultivated barley from wild barley (Hordeum vulgare L.
subsp. spontaneum (K. Koch) Thell.) (Lakew et al., 2011), size and shape of fruit in tomato
(Tanksley and McCouch, 1997) and yield improvement in sorghum (Hajjar and Hodgkin,
2007) have also been harnessed from CWR. There is also widespread use of wild forage
species in improvement of pasture lands (Pecetti et al., 2008; Abberton, 2011; Helgadóttir et
al., 2016). Hajjar and Hodgkin (2007) and Maxted and Kell (2009) have compiled an
extensive list of other such traits being used from CWR for crop improvement. Furthermore,

7
technological advances are meaning that CWR are becoming more available for use (Meilleur
and Hodgkin, 2004; Jones et al., 2014) which will be essential to open up the wild genepool to
plant pre-breeders and breeders helping to feed our growing population in the future.
The value of CWR in helping to increase crop yields has been estimated at $115 billion per
year globally (Pimentel et al., 1997) and we should assume that this has increased since. A
more recent estimate values the wild genepools of 29 priority crops, identified by the
Millennium Seed Bank, Kew, to be potentially worth $120 billion, with a current value of $42
billion (PwC, 2013). Furthermore, the cost of pest and diseases to crops is huge, with annual
worldwide potato losses due to blight being conservatively estimated at $6.7 billion (Fry,
2008). With the recent transfer of blight resistance from a potato wild relative to the cultivar
(Jones et al., 2014) the cost of this loss to farmers will be reduced. There are also the indirect
values associated with CWR including their role as ecosystem services (De Groot et al., 2002;
Ford-Lloyd et al., 2011; Jaradat, 2015), as mentioned above, therefore we can only assume that
these global valuations are under estimates of the true value of such resources.
1.2 Aim of in situ and ex situ CWR conservation
Conservation of CWR can be undertaken in two complementary processes as defined by the
Convention on Biological Diversity (UN, 1992): in situ, ‘the conservation of ecosystems and
natural habitats and the maintenance and recovery of viable populations of species in their
natural surroundings where they have developed their distinctive properties’ and ex situ
conservation, ‘the protection of components of biological diversity outside their natural
habitats.’ Complete and effective conservation of PGR cannot be successful without utilising
both methods.
8
In situ conservation tends to be targeted within current protected areas (PAs), such as nature
reserves or national parks (NP). However, often CWR tend to be conserved only passively
within these areas (Iriondo et al., 2008; Maxted et al., 1997a) i.e. they are protected only
because of incidentally being present within the reserve. The CWR populations are unlikely to
be actively managed unless they are threatened species, or they are the reason why the reserve
was set up in the first place. For in situ conservation to be effective, active conservation of
CWR populations needs to take place. This would include the management and monitoring of
CWR within the PA to ensure the populations are maintaining appropriate sizes and meet the
guidelines set out by Iriondo et al. (2012). These guidelines allow the definition of a genetic
reserve, in which active long-term conservation involving the management and monitoring of
genetic diversity takes place (Maxted et al., 1997a).
However, there are problems with targeting current PAs for in situ conservation of CWR.
Firstly, many PAs were designated on areas of land that contain climax vegetation or have
important landscape value, not CWR value. Furthermore, the management of PAs does not
address the conservation of genetic variation in individual species (Hunter et al., 2012), the
main aim of CWR conservation. Jain (1975) stressed that none of the progenitors of major
food crops occur as climax vegetation, thus increasing the need to identify conservation
solutions for disturbed ecosystems. Allem (1997) and Jarvis (2015) also identified the
importance of disturbed areas and road verges as major suppliers of biological diversity and
PGR to society. Conservation of agrobiodiversity needs to be taken up by local landowners
and communities, with agreements and management plans drawn up to maintain the current
populations (Maxted et al., 1997a). Most traditional farmers prefer to maintain varieties within
their fields so they can evolve within their environment and along with changing management
practises (Nabham, 2009). Furthermore, under climate change a static approach of establishing
9
isolated reserves surrounded by highly unnatural landscape is not effective (Ramirez-Villegas
et al., 2014). Hence, identifying areas and/or populations outside of PAs for conservation
action will also be a major part of in situ conservation of CWR.
The designation of the most appropriate crop wild relative populations (MAWPs; Maxted et
al., 2015) could be an alternative (or indeed work within the traditional genetic reserve
designation) to conserve populations. These MAWPs are the most valuable in terms of
containing distinct or complementary genetic diversity or specific traits of interest and
therefore allow conservation efforts to be directly targeted upon specific populations (Maxted
et al., 2015). This level of conservation will require more detailed information upon
populations of interest and therefore may be more appropriately applied once PAs have been
identified as containing important populations.
In situ conservation not only benefits the target species but also the ecosystem as it allows the
populations to continue to thrive in their natural habitats and adapt to changing environmental
conditions, which ex situ conservation alone cannot achieve (Maxted et al., 2015). It also
allows the generation of new variation which may be important with the future effects of a
changing climate. There are only a few examples of active in situ conservation of CWR (see
Maxted et al., 2016 for more examples) for example: Teosinte (Zea diploperennis Iltis,
Doebley & R. Guzm) in the MAB Sierra de Manatlan Biosphere Reserve in Mexico (Sánchez-
Velásquez, 1991), wild Solanum species in the Laguna de los Pozuelos Natural Monument and
Los Cardones NP in Argentina (Marfil et al., 2015) and Beta patula Aiton species in Maderia
(Pinheiro de Carvalho et al., 2012). However there is the scientific background laid for the
establishment of further in situ genetic reserve networks in Cyprus (Phillips et al., 2014),
England (Fielder et al., 2015), Finland (Fitzgerald, 2013), Jordan (Magos Brehm et al., 2016),
Norway (Phillips et al., 2016), Oman (Al Lawati et al., in press), Portugal (Magos Brehm,
10
2009), Spain (Rubio Teso et al., 2013) among other countries (see Iriondo et al., 2016). There
is also work on regional (Maxted et al., 2015; Weibull et al., 2016; Kell et al., in prep) and
global networks (Maxted and Kell, 2009) of in situ genetic reserves for PGR.
There are still fundamental questions around in situ conservation, such as how many reserves
or populations would be optimal to protect the entire genetic diversity of the taxon in question.
This may vary depending upon the life history of the species or the potential diversity that may
be present within the total area of study. For example, Schoen and Brown (1993) noted that
one out-breeding population contained over 80% of species genetic variation whilst Neel and
Cummings (2003) found that 67-85% of alleles were conserved in five populations if they were
selected randomly without knowledge of genetic diversity patterns. Dulloo et aland
collaborators (2008) recommended a minimum of five in situ populations conserved whilst
Fielder et al. (2015) expanded on this and recommended five populations conserved that
represent the full ecogeographic range. We suggested (Phillips et al. 2016) that a minimum of
five populations should be protected within a PA complementary network, with Heywood
(2008) stating that once taxa are found in five actively managed reserves, population genetic
theory suggests there would be little need of further duplication. Both Fielder et al. (2015) and
Phillips et al. (2016) agree that the guidelines set out by Iriondo et al. (2012) should be
followed for effective in situ conservation which includes ensuring that minimum standard
population sizes are large enough to sustain long-term population viability. In addition, Iriondo
et al. (2012) stresses that reserves must capture as much genetic diversity of each target taxon
as possible, conserving at least the alleles that are common, widespread and localized sensu
Marshal and Brown (1975), but they stop short of suggesting a number of populations or
reserves required.

11
Ex situ conservation offers long-term, secure conservation and allows plant pre-breeders and
breeders full control and access to the PGR resources they require. However, this form of
conservation involves removal of the species from its natural habitat and therefore halts the
evolution of the taxa which will limit the future beneficial impact of the species upon the
ecosystem as a whole (Ford-Lloyd et al., 2013). Ex situ conservation most notably takes the
form of seed storage under cool dry environments but it can also involve in vitro conservation
and botanical garden conservation and depends upon the nature of the seed being conserved
(i.e. orthodox seeds or recalcitrant seeds).
The Svalbard Global Seed Vault is one of the largest seed banks with its main aim being to:
“provide insurance against both incremental and catastrophic loss of crop diversity held in
traditional seed banks around the world” (The Crop Trust, 2016). The seeds within this vault
are duplicates from collections in other seed banks worldwide and the vault acts as a store or
back-up of seeds in-case of complete loss of the collections elsewhere. A recent example of
the importance of such a seed bank is when the International Center for Agricultural Research
in the Dry Areas (ICARDA) requested that it remove some of its seed deposits from the vault
due to loss of collections at its seed bank in Aleppo, Syria. They hope to replace the seeds in
Svalbard once they have been duplicated in the field (Norwegian Ministry of Agriculture and
Food, 2015).
One global project which is helping to conserve CWR ex situ is the ‘Adapting Agriculture to
Climate Change project’ (Dempewolf et al., 2014) which includes the creation of the Harlan
and de Wet inventory (Vincent et al., 2013). This is focused on the conservation and use of the
wild relatives of 29 crops of major importance to food security which are included in Annex 1
of the International Treaty on Plant Genetic Resources for Food and Agriculture (ITPGRFA;
FAO, 2001). The project will identify CWR of these priority crops that are missing from ex situ

12
collections, collect them from the wild, evaluate this material for use in crop improvement
programmes and make the products and results available to users (Dempewolf et al., 2014).
The project will improve the levels of CWR represented within seed banks which currently
makes up only up 10% of accessions within Europe as recorded in EURISCO (Dias et al.,
2011). More recent analysis of collections suggests that of 1076 globally important CWR, 71%
are high priority for collecting and 29% of those taxa assessed have no germplasm accessions
at all (Castañeda-Álvarez et al., 2016). Furthermore over 95% are insufficiently represented in
gene banks in regard to their full range of geographic and ecological variation (Castañeda-
Álvarez et al., 2016).
The number of populations to conserve ex situ to capture the full range of genetic diversity is
still undecided and may vary species by species. Marshall and Brown (1995) propose a
minimum of 50 sites are sampled to adequately conserve the genetic diversity of a taxon ex
situ, however this is rarely achieved as shown by Vincent et al. (2013). In this study over 74%
(1247) of 1667 taxa had 50 or less ex situ accessions and of these over 75% (939) had less than
ten ex situ accessions. Parra-Quijano et al. (2011) have suggested another method that involves
ensuring ex situ collections are representative of the full ecogeographic range of a taxon which
can be used a proxy for genetic diversity. This is picked up by Phillips et al. (2016) who
propose for each taxon the conservation of populations from five different ecogeographic zones
as a minimum (see Parra-Quijano et al. 2012b) for more information on ecogeographic zones).
By ensuring that the full range of ecogeographic diversity is conserved ex situ we should
confident that any important adaptive traits that may be potentially useful are under long term
protection.
The Second FAO report on the State of Food and Agriculture (FAO, 2016) highlights the use
of ex situ methods to act as a backup of material that can be harnessed in the face of climate
13
change, whilst in situ conservation is important for allowing ‘evolution to keep step with
environmental changes’. The Millennium Ecosystem Assessment (2005) highlights that there
are benefits gained through the better integration of both ex situ and in situ conservation
methods. The positive and negatives of both methods are complementary to each other and
therefore conservation of PGR will not be successful without the integration of both into
national, regional and global conservation strategies. Clearly ex situ conservation has been
more widely implemented than in situ conservation activities for PGR, as illustrated by the
wide network of agricultural centres and seed banks worldwide, including the CGIAR network
(www.cgiar.org) and the Svalbard Global Seed Vault. This is surprising considering the high
cost associated with continued duplication and germination testing and the resources required
to conserve these seeds outside their natural environment (van Hintum, 2002). Yet the benefits
of being able to easily access the resources to utilise them in breeding projects outweighs these
negatives and is the main purpose of conservation of PGR. In situ conservation is less
developedthan ex situ conservation (Maxted et al., 2016) but by establishing an in situ network
of genetic reserves, they could act in the same way as the gene bank network and be managed
by those gene banks that have a vested interest in the resources present within the reserves. In
this way, in situ resources will be just as easy to access as those in ex situ storage.
1.3 International legislation for PGR conservation
The conservation of PGR is widely recognized at the international level and numerous
initiatives have been set out to try and protect these resources for future food security. The
Convention on Biological Diversity (CBD; UN, 1992) is the most important international
political instrument dealing with biodiversity loss and although genetic diversity is clearly
included in the convention, practical implementation has failed to recognize this sufficiently
(Laikre et al., 2010). The CBD Strategic Plan (2010 Strategic Plan for Biodiversity 2011-

14
2020) states that “By 2020, the loss of genetic diversity of cultivated plants and domestic farm
animals in agricultural ecosystems and of wild relatives is halted and strategies have been
developed and implemented for safeguarding the genetic diversity of other priority socio-
economically valuable species as well as selected wild species of plants and animals”. The
convention has been ratified by 196 parties who must now prepare national reports on their
progress towards meeting the CBD strategic plan. Furthermore, the Nagoya Protocol
(https://www.cbd.int/abs/about/default.shtml/), an additional agreement to the CBD, ensures
the fair and equitable sharing of benefits arising from the utilization of genetic resources and
came into force in 2014.
The Global Strategy for Plant Conservation (GSPC; UN, 2012) is also part of the CBD and
specifically mentions CWR conservation within Target 9: “70 percent of the genetic diversity
of crops including their wild relatives and other socio-economically valuable plant species
conserved.” This target is aimed to be completed by signatories by 2020. Furthermore, as part
of the ITPGRFA (FAO, 2001) a proposed list of crops of global significance under Annex 1,
will require collection and protection to guarantee food security. Although some major crops
are missing from this list, such as Soybean (Glycine max (L.) Merr) it is a major step forward in
conserving those globally important priority PGR.
PGR are not only important to conserve as part of the specific targets above but they can also
help to contribute to other global goals. The Sustainable Development goals (2015-2030) (UN,
2015b) build on the Millennium Development goals (2005-2015; UN, 2005) and highlight the
need to eradicate extreme poverty and hunger and to protect and enhance food security, for
which PGR play major roles. Food security is an international commitment with the legislation
above aiming to ensure that it remains a priority on the international agenda. It is not only the
15
work of one country that will help to secure our food but the collaboration and cooperation of
all nations which will determine the future of our food security.
At a regional level within Europe the Biodiversity Strategy (EU, 2011) aims to stop global
biodiversity loss by 2020, with Action 9 and Action 10 encouraging the protection of genetic
resources by farmers and foresters and the development of the conservation of genetic
resources.
1.4 Threats to CWR
The implications ofnot conserving PGR are perhaps much larger than not conserving other wild
species. General threats to species are caused by the conflict between supply and demand for
natural resources (Stuart and Adams, 1990). This includes, but is not limited to
industrialization, urbanization, deforestation, pollution, intensive agriculture, invasive alien
species, over exploitation, habitat destruction, changes in agricultural practices and climate
change (Bilz et al., 2011; Kell et al., 2011). In a recent analysis by Maxwell et al. (2016) it
was found that overexploitation and intensive agriculture were the biggest threats to
biodiversity with over 70% of threatened or near-threatened study species at risk. Change in
agricultural practises is also one of the most cited threats to CWR (Kell et al., 2011) with
intensification and unsustainable farming of both livestock and arable land the greatest threat to
CWR in Europe (Bilz et al., 2011). Furthermore, due to human development and population
growth, overexploitation and agricultural expansion will also increase (Maxwell et al., 2016).
In general, 44.9% of 1826 vascular plant species are assessed as threatened at the European
level (Bilz et al., 2011). For CWR, 11.5% of 572 species are threatened at the European level
(Kell et al., 2011). Furthermore, CWR tend to be found in disturbed, pre-climax communities,
habitats not traditionally conserved and yet habitats that are the most affected by increasing

16
levels of anthropogenic change (Jain, 1975; Jarvis et al., 2015). CWR are therefore likely to be
disproportionately impacted by threats to biodiversity (Maxted and Kell, 2009).
These threats contribute to the main problem facing CWR which is genetic erosion (Maxted et
al., 2002). Along with the loss of species there will be a loss of genetic diversity which will be
faster than the loss of the former as there will be genetic erosion from the extant species
(Maxted et al., 1997b). As well as other contributing factors, fragmented populations may
result from this loss of species resulting in negative effects such as inbreeding, genetic drift and
limited geneflow contributing to genetic erosion (Bijlsma et al., 2000; Bijlsma and Loeschcke,
2012). The fewer populations lost today the more resilient they will be in the future (Sætersdal
et al., 1998). The Millennium Ecosystem Assessment (2005) already recognises that genetic
diversity has declined globally; particularly among domesticated species. This makes
domesticated species more vulnerable to stochastic changes in their surrounding environment,
thus threatening food productivity. Furthermore, the narrowing of the food commodities that
are being consumed globally (FAO, 2009a; Khoury et al., 2014) means that threats to one crop
could exasperate the global food crisis.
Climate change is likely to be the greatest threat in many, if not most regions (Thomas et al.,
2004) and predicting such effects upon terrestrial plant communities is crucial because of the
ecosystem services vegetation provides (Franklin et al., 2016). Projections show that even
under the most optimistic emission scenarios, climate change impacts on biodiversity will be
increasingly severe over the next century and beyond (IPCC, 2014). Surface temperature and
precipitation are expected to increase at northern latitudes (Solomon, 2007) and an already
poleward range expansion across many species is being seen (Thomas et al., 2012). The IPCC
predicts that in the short-term (2016-2035) the global mean surface temperature change is
expected to be between 0.3-0.7˚C with the highest prediction set at 4.8˚C for the year 2100
17
(Prather et al., 2013). These climatic changes will influence agricultural production as well as
leading to fragmentation of populations which may cause further genetic problems as
mentioned above.
Many regions throughout the world are projected to experience climate change-induced
reductions in crop yields and additional challenges are mounting (for example, pests, water
supply and soil degradation) (Müller & Robertson, 2014; Rosenzweig et al., 2014). In a recent
global study from 1980-2008, maize and wheat exhibited negative impacts due to climate
change for several major producers and a global net loss of 3.8% and 5.5% respectively (Lobell
et al., 2011). Furthermore, climate change may be contributing to ~10% stagnation in wheat
and barley production since the 1990s (Moore & Lobell, 2014) and yield gains from
technological advances are likely to have been offset by warming from 1981‒2002 (Lobell &
Field, 2007). In a specific study on the CWR of peanut (Arachis L.), potato (Solanum) and
cowpea (Vigna L.), it was found that 16‒22% of species are predicted to go extinct by 2055
with most species losing over 50% of their range sizes (Jarvis et al., 2008). However, climate
change may not have negative impacts on agriculture everywhere. Burke et al. (2015b)
showed that agricultural activity peaked at an average annual temperature of 13˚C, therefore
Europe could benefit as warming tends to harm productivity in countries which already have
high average temperatures. Extreme weather events, such as the El Niño Oscillation
(Rosenzweig et al., 2001) and storm damage may result in the destruction of crops and will
have implications for food production. We should be looking to adapt to a more uncertain
world where, in particular regions the risk of crop failure on a year-to-year basis is likely to
increase (Parry et al., 2005; Ford-Lloyd et al., 2013).
CWR represent one of the most critical assets to address climate change, because they hold so
much promise for crop improvement now and in the future (Ford-Lloyd et al., 2011). Genetic

18
diversity improves resilience in species (FAO, 2016) but must be properly conserved and
utilised. The effects of climate change will have direct consequences for how in situ and ex
situ management of CWR is undertaken and will require a more dynamic approach. Dispersal
is likely to be the most important factor for plants needing to migrate under climate change
(Mokany et al., 2013) therefore to accommodate these changing plant distributions in situ
conservation will need to adopt new strategies. This may include upgrading the current, highly
static PA system to satisfy targets for both current and future projected occurrences (Midgley et
al., 2003). Ramirez et al. (2014) propose a shift from a static PA approach to a landscape
development strategy with improved connectivity between reserves across the Andean
countries. Corridors between reserves could be created which follow temperature gradients
ensuring that species always have a suitable climatic habitat to move through (Nuñez et al.,
2013) as well as increasing the heterogeneity in vegetation structure which favours species
richness at local and landscape levels (Zapata & Robledano, 2014). In situ conservation sites
should be established in areas where CWR habitats are likely to remain suitable under climate
change (Magos Brehm et al., 2016). Maintenance of large populations should also remain a
key conservation priority as they support higher levels of genetic diversity and genetic
variation (Christmas et al., 2016). For ex situ conservation of seeds, the effect of climate
change may mean targeting collection of populations at the trailing edge of species
distributions to try and capture the genetic diversity that is under threat. These populations
could be prioritised following the methods described by Magos Brehm et al. (2016) which
incorporate both the conservation of ecogeographic diversity and climatically vulnerable
populations. Further ex situ measures such as relocation may also be an option but the
problems associated with this such as identifying suitable habitat, pollinator and edaphic
conditions may be an issue (Barber et al., 2016). Targeted ex situ conservation will also have

19
to focus upon the needs of plant pre-breeders and breeders and the material and traits that they
will require to adapt our crops to climate change.
At the Paris climate change talks in 2015 an agreement was made between 195 countries to
curb global warming to below 2.0˚C above pre-industrial levels with a specific aim to limit the
temperature increase to 1.5˚C (UNFCCC, 2015). Countries have submitted Intended National
Determined Contributions (INDCs) that set out measures to help meet this temperature target.
Some of the measures proposed include the development of new crop varieties that will allow
for a decrease in the use of pesticides and varieties that can withstand water stress (UNFCCC,
2015). Such developments in crop improvement will no doubt benefit from increased
conservation and use of PGR. The actions proposed by these plans are not yet enough to meet
the 2.0˚C limit (UNFCCC, 2015) but do pave the way to achieving this target.
Although the precise effect of climate change upon biodiversity is unknown, we should be
looking to adapt to a more uncertain world where in particular regions the risk of crop failure
on a year-to-year basis is likely to increase (Parry et al., 2005). The above threats will be
acting simultaneously upon biodiversity therefore by attempting to maintain diversity within
the ecosystem we can also help ensure we have a robust and sustainable food system.
1.5 Floristic background to Norway
The population of Norway is just over five million people with the mainland of Norway
stretching from 58˚ north to 71˚ north and covering an area of 304, 148 km2 (Norway Statistics,
2016). Climatic and solar conditions as well as day length vary significantly from the south to
the north which tends to favour thermophylious species having their northern distribution limit
and cold-loving species having their southern limits within Norway. The country has
substantial north-south and east-west climate gradients, with the inland areas having a typical
20
continental climate and the coastline characterised by a maritime climate (Norwegian Ministry
for Agriculture and Food, 2008). The country has been ice-free for less than 10,000 years
therefore there tends to be few endemics present (Kålås et al., 2006), however this may also
mean that species tend to have a restricted occurrence and therefore may harbour important and
unique genetic adaptations or traits due to in situ glacial refugia (Eidesen et al., 2013). The
topography of Norway is dominated by mountains and glaciers with a coastline that is defined
by islands and fjords (Norwegian Environment Agency, 2015). Although Norway is not a
traditional centre of diversity for crop species its location on the north western periphery of
Europe may mean that the species present there harbour unique genetic diversity and adaptive
traits.
Floristically, Norway has 3148 recorded wild plant species and subspecies of which 1463
(46.5%) are native with the rest regarded as introduced and 43.5% of those introduced taxa
being persistent i.e. they have reproducing populations (Kålås et al., 2006). The number of
introduced species is estimated to be 1719 species (Gederaas et al., 2012) of which 135 are
listed on the Norwegian black list of species. Norway has an online species observation system
(www.artsdatabanken.org) that allows people to register sightings of species throughout the
country. This is helping to document biodiversity within Norway with currently over 11.5
million taxon records (Valland, 2014). Furthermore, in Norway the Nature Types index
attempts to classify the ecological variation found throughout the country which has helped to
create a red list for the ecosystem and habitats (Lindgaard & Henriksen, 2011). Many of the
most urban areas are the richest in botanical terms, with the highest concentrations of rare and
vulnerable species found around Oslofeltet and south of Østfold in Kristiansand and Stavanger,
due to the calcareous nature of the soils (Kålås et al., 2006). The soil and topography also
impacts agriculture with the main regions for field crops such as cereals, potatoes and
21
vegetables, found around Oslofjord, in the south east and far south western regions. Forage
production however, can be found in all parts of the country where soil conditions are
favourable to growing grass (Norwegian Ministry for Agriculture and Food, 2008) and in
northern Norway grassland occupies more than 90% of cultivated land (Volden et al., 2002).
Agricultural activities take up 3.4% of land area, with mountain and mountain plateaus making
up 45.2% and forests covering 37.4% of the Norwegian mainland (Norway Statistics, 2016).
1.5.1 Threats to CWR in Norway
CWR in Norway are subject to much the same threats as mentioned previously. In a study by
the Norwegian Directorate for Nature Management as part of compiling the Nature Index
(Nybø et al., 2011) to measure the level of biodiversity within Norway, it was noted that of all
the major ecosystems, open lowland and forest are, overall, in a poor state (NI =0.43-0.44).
These two habitats are the location of priority CWRs including Carum carvi L. and Rubus
chamaemorus L., amongst others. The red list for ecosystems and habitat types (Lindgaard &
Henriksen, 2011) in Norway shows that changes in management practices i.e. disappearance of
grazing and therefore allowing the land to become overgrown, plus the use of more fertilizer
and new cultivation methods, is one of the most serious threats to semi-natural grassland
(classified as vulnerable) and hay meadow habitats (endangered). For hay meadow habitats
there is now a specific action plan for their management (Svalheim & Asdal, 2011) which will
go some way to improve the condition of this ecosystem. This is important for conservation of
CWR in Norway as many tend to be found in lowland areas associated with agricultural
practises (Kålås et al., 2006). Furthermore, these lowland agricultural systems also contain
35% of the threatened red list assessed species (Kålås et al., 2006) with the largest numbers of
red listed plant species found in dry grasslands and long-established pastures (Nybø et al.,
2011; see Table 1.1 for list of CWR assessed by red list). The majority of threatened or near-

22
threatened species are found in south eastern Norway, mainly Oslo, Vestfold, Telemark,
Ostfold and Buskerud. This may be because more thermophilous species are found in south
eastern Norway, which is also where the greatest diversity of habitat types that are quite rare in
Norway is found. This is also the most populous region, however findings show that this has
little influence on the main pattern of wild species distribution (Kålås et al., 2006) in Norway.
Invasive species are also a problem for the Norwegian flora and have shown an increase of
54% over the last ten years (Nordic Gene Bank, 2006). The predicted change in climate within
Norway to increased precipitation, a longer growing season as well as shorter and milder
winters is expected to benefit alien species as the majority come from warmer climates
(Gederaas et al., 2012). Northern, alpine and continental native species will be at a
disadvantage (Gederaas et al., 2012). Furthermore, mountainous species will also be
negatively affected as they occupy small niches and are adapted to extreme climatic conditions
which may make them especially vulnerable if they are exposed to additional impacts (Nybø et
al., 2011). However, the effects of climate change on agriculture in Northern areas is expected
to be positive (Olesen and Bindi, 2002). The effect of temperature rise will likely be a longer
growing season with higher mean temperatures allowing farmers to increase harvest and yields
(Uleberg et al., 2014). This in turn could lead to an estimated 250% increase in GDP per capita
by 2100 for Norway as the annual average temperature increases due to climate change (Burke
et al., 2015b). However, farmers will need to adapt to this change by ensuring their crops are
robust enough to withstand climatic changes which will require the harnessing of all available
genetic variation, for which the gene pool of wild populations and landraces is important
(Uleberg et al., 2014). Although the overall effect for agriculture in Norway may be positive
there will still be challenges in the short term such as unstable winters, increased precipitation
and more weeds and diseases (Uleberg et al., 2014).

23
Table 1.1: National Red List status of priority CWR within Norway. 13% (27) of the priority
list CWR were assessed, with 7% (14) assessed as threatened. Within the checklist 11% (274)
were assessed and 6% (154) were threatened (Kålås et al., 2006).
Taxa National Red List status
Allium fistulosum L. EN B2ab(i,ii,iii,iv,v)
Allium scorodopraum L. NT
Allium senescens montanum (F.W.Schmidt)
Holub
EN B1ab(i, ii, iii, iv, v)+2ab(i,ii,iii,iv,v)
Alopecurus pratensis alpestris (Wahlenb.)
Selander
NT
Arnica montana L. VU A2bc+3c;B2ab(ii,iii,iv,v)
Artemisia maritima L. NT
Elymus fibrosus (Schrenk) Tzvelev EN B1ab(ii,iii,iv,v)+2ab(ii,iii,iv,v)
Lactuca sibirica (L.) Benth. Ex Maxim NT
Lathyrus palustris L. VU A4bc
Phleum phleoides L. EN B1ab(I,ii,iii,iv,v)+2ab(I,ii,iii,iv,v)
Poa arctica caespitans NT
Poa bulbosa L. EN B2ab(iii)
Poa lindebergii Tzvelev VU A2abc+3c
Poa x jemtlandica (Almq) K Richt NT
Rorippa islandica (Oeder ex Murray) Borbas EN B1b(iii)c(v)+2b(iii)c(v)
Rosa pimpinellifolia L. EN B1ab(ii,iii,iv)+2ab(ii,iii,iv)
Rosa pseudoscabriuscula (R.Keller) Henker
& G. Schulz
DD
Rosa rubiginosa L. NT
Rubus caesius L. NT
Rubus hallandicus NT
Rubus septrentrionalis W.C.R.Watson NT
Trifolium campestre Schreb NT
Trifolium fragiferum L. EN B2ab(ii,iii,iv,v)+2ab(ii,iii,iv,v)C1
Trifolium montanum L. VU D2
Vicia lathyroides L. EN B2ab(i,ii,iii,iv,v)
Vicia orobus DC. NT
Vicia pisiformis L. EN B1ab(ii,iii,iv,v)+2ab(ii,iii,iv,v)
1.5.2 Current in situ and ex situ conservation actions in Norway
As Norway is a signatory to the previously mentioned legislative initiatives it has a
responsibility to undertake appropriate actions to meet such targets. These actions will take
place at the national level and have been incorporated into the Nature Diversity Act (2001-12-
24
21 nr 1525) which is the most important instrument for expanding protection of the natural
environment. Under this Act it states:
‘Management objectives for species are to maintain their genetic diversity for the long
term…the genetic diversity of domesticated species shall be managed in such a way that it
helps to secure the future resources base.’ (Chapter 2, Section 5)
‘Ex situ conservation measures shall be implemented if this will promote the species’ survival
in the natural environment.’ (Chapter 3, Section 27)
‘That protected areas shall promote the conservation of... (b) species and genetic diversity...(f)
natural environments that reflect human use through the ages (cultural landscapes) and
facilitation of forms of use that help to maintain biological, geological and landscape
diversity.’ (Chapter 5, Section 33)
These explicit goals can be achieved through the identification of gaps in current in situ and ex
situ CWR conservation combined with improved recognition of CWR in national and regional
policy, ultimately leading to systematic CWR diversity conservation (Maxted et al., 2015).
The legislation also designates different types of protected areas which encompass about 17%
of mainland Norway (Norwegian Environment Agency, 2016) including NPs, nature reserves,
natural monuments and landscape protected areas as well internationally defined areas such as
Ramsar sites (www.ramsar.org). The landscape protected areas are particularly interesting in
the CWR context as these sites tend to cover areas of traditionally managed agricultural land
associated with anthropogenic influences, a habitat which has been shown to favour CWR
(Maxted & Kell, 2009, Jarvis et al., 2015). Although Norway has no formal in situ CWR
conservation these taxa are conserved passively in the above mentioned protected areas, but
25
this ‘is not enough to guarantee the continuation of these populations’ (Maxted et al., 1997a,
Hunter et al., 2012) hence the proposal for the establishment of a network genetic reserves with
active management guidelines for CWR. Furthermore, according to the Norwegian
Environment Agency (2016) about 30% of the total number of PAs are under threat, hence
establishment of genetic reserves and the surveying associated with these may help to improve
this situation.
Ex situ conservation is done between the Nordic Genetic Resources Centre (NordGen) and the
National Programme for Plant Genetic Resources managed by the Norwegian Genetic
Resource Centre. NordGen is responsible for the conservation of seed propagated crops and
the potato collection, whilst vegetatively propagated crops are the responsibility of the
Norwegian Genetic Resource Centre which coordinates activities regarding the conservation
and utilisation of national genetic resources. Seed storage is within freezers at -18ºC and is
situated in Alnarp, Sweden and duplicated in Arslev, Denmark and in the Svalbard Global Seed
Vault. Information about the conserved germplasm is managed through the SESTO database
(www.nordgen.org/SESTO). There are 2291 accessions stored that originate from Norway with
1512 which are CWR (Table S1.1). Of the priority CWR there are 1457 accessions stored in
NordGen (Table S1.1). Use of ex situ material is coordinated by Graminor AS, a company
jointly owned by private and governmental institutions. Current breeding programmes include
cereals, forage grasses and clovers, potato,fruit and berries (Norwegian Ministry for
Agriculture and Food, 2008). The Norwegian government also owns and manages the
Svalbard Global Seed Vault with the Crop Trust providing the funding. The vault is a back-up
for seed collections from around the world which can be deposited free-of-charge in the vault.
The CWR taxa present within Norway are nationally and globally important due to numerous
reasons including: the climatic gradients found across the country which vary from north to

26
south and east to west (Norwegian Ministry for Agriculture and Food, 2008); the location of
the country on the north west of Europe meaning many species may find themselves at the
limits of their distributional ranges; the relatively recent glacial periods within Norway which
may lead to important populations found within glacial refugia (Eidesen et al., 2013) and the
distribution and presence of important temperate forage species such as Trifolium L., Festuca
L. and Lolium L. across the country. Furthermore, Norway is obligated under the international
treaties mentioned above to increase protection and use of their genetic resources which can
only begin with national level strategies.
1.6 Background to methods
The preparation of a national strategy for PGR conservation is one tool to help ensure future
food security by meeting the targets set out in the above legislation. A strategy will always
need to involve local stakeholders who will ensure its appropriateness and effectiveness
(Magos Brehm et al., 2016). Furthermore, the results from any strategy must be dynamic and
should be updated as and when new data become available.
1.6.1 Checklist and inventory
Checklists and inventories are the foundation for the formulation of conservation strategies
(Maxted et al., 2013) and provide the data for monitoring and allowing us to determine what
exists, where and how to conserve it. Countries will always need to establish their own CWR
lists of taxa that are most relevant to their own crops, floras, national capacities and priorities
(Meilleur & Hodgkin, 2004). A checklist is a list of CWR taxa present within a country whilst
the inventory is created after prioritization and provides extra information on these taxa such as
nomenclature and ecogeography (Maxted et al., 2013).
27
Due to limited resources for conservation of PGR, prioritization is a key component to help in
the focusing of resources to where they are most needed, therefore it is usually necessary to
reduce the list of taxa within the checklist to a more manageable number. Maxted et al.
(1997b) propose numerous measures that can be applied to aid prioritization with Kell et al.
(2015) and Vincent et al. (2013) highlighting the three most commonly used criteria: relative
socio-economic importance of the related crop, potential use for crop improvement and
threatened status. Other criteria may include whether the area of interest is a center of diversity
for specific CWR (Phillips et al., 2014), recent change in population range (Fielder et al., 2015)
native status of the crop (Magos Brehm et al. 2008; Taylor et al., 2013; Fitzgerald, 2013;
Landucci et al., 2014) and more. Iriondo et al. (2016) reviews the criteria used for
prioritization in numerous national strategies and concludes that even commonly used criteria
can be different in the way in which they are conceived and implemented, highlighting that
there is no right or wrong way to creating an inventory of CWR.
1.6.2 Ecogeographic study
Ecogeographic studies are recognized as the basic planning tools for in situ and ex situ CWR
conservation (Hodgkin & Guarino, 1997; Maxted et al., 1997b). An ecogeographic study is the
process of gathering and synthesizing taxonomic, geographic and ecological data, the results of
which are predictive and can be used to assist in the formulation of collecting and conservation
priorities (Maxted et al., 1995). This may involve, amongst others, the identification of the
target taxa, delimitation of the study area and the identification of data sources. The
ecogeographic study can then utilize Geographic Information Systems (GIS) to formulate in
situ and ex situ conservation needs.
One key step within the ecogeographic study is the gathering of occurrence data for the priority
taxa. This requires the collecting of location information from herbaria, gene banks, online
28
resources and others to capture as fully as possible the distribution of the taxa. Increasingly,
online resources such as the Global Biodiversity Information Facility (GBIF; www.gbif.org)
are providing easier access to a range of location data sources. This data can then be utilized
for spatial analysis which can contribute significantly to improved understanding and
monitoring of biodiversity (Scheldeman & van Zonneveld, 2010). Species distribution models
(SDM) can be created to identify areas that may be suitable for populations to persist in and
prioritise areas for conservation. This analysis can be conducted using GIS tools (Guarino et
al., 2002) which use the conditions at points where the species has been found in order to
construct a statistical model of its adaptation ranges, based on a set of user-defined
environmental variables (Guisan & Zimmermann, 2000). The models can help identify the
bioclimatic space where species could persist (Pacifici et al., 2015) both currently and in the
future.
The accuracy and predictive ability of the spatial analyses can be dependent upon the reliability
of location data that is available. There is no minimum defined number of presence points
needed to create species distribution models, but it is generally accepted that the more the
better the predictions will be. For example van Zonneveld et al. (2009) used a minimum of 50
presences for widely distributed species whereas Scheldeman et al. (2007) used 10 presences
for rare species and Phillips et al. (2014) used a minimum of 10 presences for CWR taxa within
Cyprus. Specifically, for studies using MaxEnt a minimum of 30 records should be used for a
stable performance but MaxEnt can still be used for exploratory modelling when sample size
varies between 10 and 30 occurrences (Wisz et al., 2008). Hernandez et al. (2006) found that
model accuracy does increase with larger sample sizes but useful models could still be
produced with as few as 5-10 observations, therefore the appropriate number of presences to
use will depend upon the amount of data available and the needs of the project in question.
29
Preliminary spatial analyses include determining the spread of taxa richness (i.e. the number of
different taxa) within the area of interest. This can help give an overview of where the
diversity is located. However, this depends upon the number and spread of location points
used, therefore it is also necessary to create a sampling bias map to determine how this may be
affecting the results. Further analyses include a complementarity analysis to create an effective
reserve network for in situ conservation. This will not only optimize conservation at levels
from landscape to individual species, but also is cost effective and practical to implement
(Bolliger et al., 2011). This can be partly achieved through the use of an iterative approach to
select reserves (Rebelo, 1994). The cell with the highest taxon number is selected first, then
these taxa are excluded from the analysis as it is repeated until all taxa have been selected
(Rebelo, 1994). Hence both species richness and difference in species composition at each site
is considered and therefore locations are identified that conserve a high number of different
species between sites (Scheldeman & van Zonneveld, 2010). A consideration to be made here
concerns the size of the potential reserves in the complementary network. Phillips et al. (2014)
use a 5 km2 area for reserves in Cyprus whereas Maxted et al. (2008a) use 100 km2 grids for
analysis at the regional level in Africa. The size of reserves will also depend upon who is
planning to implement the network and their available resources. The grid cell approach to
complementarity analysis allows the determination of a complementary network that can
include all taxa regardless of their location within or outside of a PA, whereas the PA approach
restricts the analysis to within PAs. Establishing complementary in situ conservation within
the current PA network is more cost effective and may only require minimal adjustments to
existing management plans (Maxted & Kell, 2009). It is possible to do these analyses using
tools in the CAPFITOGEN package (Parra-Quijano et al., 2016) and see section 1.6.5).
1.6.3 Predicted distribution
30
The predictive capacity of SDM can be harnessed to undertake a gap analysis study (Margules,
1989). This may be used to identify in situ locations where species are predicted to occur but
are not yet actively conserved, and populations/areas that are underrepresented in ex situ
collections. The potential distribution maps are created from ecogeographic variables such as
climatic, edaphic and geophysical factors which are used to predict where a species may be
located. Such data are feely available from sources such as WorldClim (Hijmans et al., 2005)
and CCAFS (http://www.ccafs-climate.org/data/ -see ‘Baseline data’) with national experts
often able to provide more local and detailed data.
MaxEnt (maximum entropy) software is one approach used to create a predictive distribution
map for the species under current and future climatic conditions by calculating the species
realized niche and probability of occurrence using an algorithm for maximum entropy (Phillips
et al., 2004; et al2006). MaxEnt has fared well in evaluations in comparison to other
programmes (Anderson et al., 2006; Elith et al., 2011), has been widely applied in predicting
species distributions (Elith et al., 2011; Costa et al., 2010) and for use with wild relatives from
single crop studies such as sweet potato (Khoury et al., 2015) and bean (Ramirez-Villegas et
al., 2010) to global analysis of multiple CWR (Jarvis et al., 2008; Conolly et al., 2012;
Castañeda-Álvarez et al., 2016). However, it can be sensitive to the number of environmental
predictors used (Phillips & Dudík, 2008). Therefore prior to analysis it is necessary to carefully
select the environmental variables. This can be done using bibliographic searches, expert
opinion or through purely statistical methods (although the latter is not recommended without
expert involvement; Parra-Quijano et al., 2016). Other modelling algorithms may also be used
including, but not limited to: Domain (Carpenter et al., 1993), Bioclim (Booth et al., 2014),
Generalized Linear Models (GLM) and Generalized Additive Model (GAM) (Guisan et al.,

31
2002) and Random Forest (Bradter et al., 2013). Once predictions are made it is desirable to
ground-truth the areas of interest to confirm the presence of the taxa.
1.6.4 Climate change analysis
Potential distribution maps can also be created for future climatic scenarios which is
particularly important for the long-term conservation of CWR. There is an established strong
correlation between climate and the distribution of both flora and fauna from the equator to the
poles (von Humboldt & Bonpland, 1807; Woodward & Williams, 1987). As climate changes
the distribution of species will change, thus knowing how and where species may move to is
essential if we are to create a robust conservation strategy. The most recent IPCC report
(IPCC, 2014) provides detailed future climatic data that can be accessed through CCAFS and
WorldClim and can be used in climate modelling. General Circulation Models (GCM) form
the basis of these future predictions with multiple models and scenarios to select from. The
Representative Concentration Pathway (RCP) scenarios are from the most recent IPCC report
and represent emission, concentration and land-use trajectories to the year 2100 (Van Vuuren et
al., 2011). RCP 2.6 is the scenario which relates most closely to the agreed maximum
temperature rise set out by the Paris Agreement (UNFCCC, 2016) of 1.5°C. Whilst RCP 6.0
represents a temperature rise of 2.5-3.5°C which is predicted to be reached if the INDC
proposals are followed (UNFCCC, 2015). Climatic models are specific statistical predictions
regarding the details of how the climate may change and are also used along with the RCP
scenarios (Flato et al., 2013). Models can be used independently (although this is not
recommended if you do not account for uncertainties within the model) or combined in an
ensemble approach (Meehl et al., 2007) which generates more uncertainty in predictions but
without which could greatly under estimate the severity of worst-case scenarios (Burke et al.,
32
2015a). Consultation with experts is recommended when choosing the appropriate model/s to
use.
When modelling the potential species distribution we can use a correlative model which
assumes that species distributions are in equilibrium with their climate and which have worked
well in predicting taxon range shifts (Guisan & Thuiller, 2005). However, this method ignores
the roles of inter-specific interactions, habitat, geomorphology and human interactions (Guisan
& Thuiller, 2005). Other methods that can be used include Trait-based Vulnerability
Assessments (TVAs) which combine sensitivity, adaptive capacity and exposure assessments
for taxa and Mechanistic models which require detailed information upon physiological,
demographic and distribution data of taxa (Foden & Young, 2016).
When determining how taxa will be affected by climate change the IUCN recommends that a
Climate Change Vulnerability analysis (CCVA) is carried out (Foden et al., 2013; Foden and
Young, 2016). This involves measuring the sensitivity, exposure and low adaptive capacity of a
species (Foden et al., 2013) to determine which species are most vulnerable to extinction. This
method requires detailed information upon a species’ ecology, biology and physiological traits
(Foden et al., 2013) which can often be hard to gather, especially when needing to assess a
wide range of different species. Population changes for species can be inferred from projected
changes in suitable habitat (Nenzén & Araújo, 2011) which in the absence of more specific
information is deemed an allowable assumption when assessing a species’ vulnerability in the
face of climate change (Foden & Young, 2016). An essential step is to consider whether
habitat patches are large enough to support viable subpopulations and whether patches are
likely to be colonised by individuals in the future with such considerations being species
specific (Foden & Young, 2016).
33
1.6.5 CAPFITOGEN tools
The CAPFITOGEN tools were developed to help strengthen the capabilities of national PGR
programs (Parra-Quijano et al., 2016). The tools bring together a range of statistical analyses
and GIS functions aimed at enabling the conservation and efficient use of PGR (Parra-Quijano
et al., 2016). The CAPFITOGEN tools utilise the “R” software (R CoreTeam, 2012) which is
freely available and open-source allowing continued development of the tools. The tools can
be used to help formulate both in situ and ex situ conservation targets. This includes, but is not
limited to, the identification of complementary networks of in situ reserves both selecting grid
cell areas and specific PAs (using the Complementa tool), the use of the Representa tool for the
establishment of gaps within ex situ collections and the creation of ecogeographic maps to
study the ecogeographic diversity within the area of interest (Parra-Quijano et al., 2016).
Ecogeographic Land Characterization (ELC) maps (Parra-Quijano et al., 2012b) can be used to
study potential plant adaptation ranges, allowing the identification of distinct populations for
conservation. Ecogeographic diversity can be used as a proxy for genetic diversity (Greene &
Hart, 1999) with the assumption being that the conservation of maximum ecogeographic
diversity will result in the conservation of maximum genetic diversity (Maxted et al., 2013)
both in situ and ex situ. ELC maps also have the advantage of being low cost, easy-to-use and
appropriate for large numbers of species and populations (Parra-Quijano et al., 2012b). If
populations are conserved in each of the different ELC zones it is possible to assume that a
wide range of genetic diversity is also conserved (Parra-Quijano et al., 2012c). ELC maps can
be created as generalist maps for a range of different species with one study showing that ELC
maps for some species i.e. leguminous species, perform better than other species i.e. grasses
(Parra-Quijano et al., 2012b). Parra-Quijano et al. (2012b) concluded that the maps provided a
satisfactory rendition of adaptive scenarios, but they suggest specific maps should be created

34
for individual species as efficiency at detecting favourable and marginal environments varies
per plant species. This is more important if the map is not validated by experts and
ecogeographic variables are not properly selected (Parra-Quijano et al., 2016). An ELC map
has also been used for assigning conservation priorities within Jordan (Magos Brehm et al.,
2016) in which 20 species were studied and in situ and ex situ conservation priorities for
populations were determined. The ELC map can be used within the Complementa and
Representa tools. In the latter, the tool can help identify gaps relating to the ecogeographic
diversity within germplasm collections, thus allowing collectors to target those ecogeographic
and hence genetic diversity gaps within their collections. Within the Complementa tool the
complementary network can be selected to target both species and ecogeographic diversity for
conservation within the proposed network.
1.6.6 Genetic diversity analyses
Although ELC maps are thought to act as a proxy for genetic diversity (Greene & Hart, 1999) it
is still useful to undertake detailed genetic studies of populations. These can help determine a
genetic baseline against which change can be measured and enable the establishment of the
number and location of populations in which to conserve and identify traits of importance for
crop improvement (Maxted et al., 2013). Genetic diversity studies are also a requirement for
the establishment of a genetic reserve network (Iriondo et al., 2012).
The selection of populations for genetic diversity studies will depend upon the aims of the
conservation strategy but should utilise all previous diversity analyses and expert knowledge to
assist. The number of populations to study can vary dependent upon needs but the number of
individuals per population will need to be a balance between gathering enough reliable
information and the resources available. In a study by Khanlou et al. (2011) they used 75
individuals per sample of white clover, but the authors acknowledge that this is more than the

35
norm in genetic diversity studies of white clover. In another white clover study, Hargreaves et
al. (2010) used between 12-32 individuals per population in order to determine diversity
between island and mainland populations. Other genetic diversity studies tend to use 20
individuals per population as the norm (Guthridge et al., 2001; Fjellheim & Rognli, 2005;
Johnson et al., 2011; Magos Brehm et al., 2012; Fielder, 2015).
For studying the genetic diversity within and between populations a range of molecular
markers can be used depending upon the needs of the study and resources available. AFLPs
(Amplified Fragment Length Polymorphisms) are frequently used in conservation planning
(Maxted et al., 2006; Watson-Jones et al., 2006; Collins et al., 2012; Hargreaves et al., 2010;
Magos Brehm et al., 2012). They are neutral dominant markers that can amplify many loci at a
time and they tend to be more reliable than other markers such as RAPDs (Random Amplified
Polymorphic DNA) and SSRs (Simple Sequence Repeat). They are cheap, relatively easy to
use, and can be used on a range of species without prior knowledge of the genome. However,
they only allow the study of neutral genetic diversity which is not affected by natural selection
and does not provide any evolutionary ability to the individual. Furthermore, as AFLPs include
both coding and non-coding regions a higher level of genetic diversity may be recorded
(Dagher-Kharrat et al., 2007). Microsatellites (or SSRs) are highly polymorphic and co-
dominant meaning a high level of allelic diversity can be identified. However, these markers
have not been identified in the majority of CWR (Schlötterer, 2004) and therefore may not be
appropriate for multi-species analyses. Single nucleotide polymorphisms (SNPs) allow us to
focus upon adaptive genetic diversity within populations as they may be found within coding
and non-coding regions of genes. However, the best approach for large scale SNP
identification requires a fully-sequenced genome which is not available for the majority of crop
plants (Ganal et al., 2009) let alone their wild relatives.

36
Although markers that detect neutral genetic diversity (AFLPs, SSRs) are used it is important
to determine how this diversity may or may not relate to adaptive traits within the individual.
Schoen and Brown (1993) tentatively suggest that some variation which is potentially useful
may be identified. Studies by Johnson et al. (2011) on Poa L. species and Richardson et al.
(2009) on Pinus L. species found that there is a potential correlation between AFLP diversity
and adaptive traits that may be linked to climate. Reed and Frankham (2003) go further and
show there is a significant correlation between heterozygosity and fitness through its link with
population size but they also suggest that this correlation may not be strong due to the neutral
nature of markers. Furthermore, in an earlier study Reed and Frankham (2001) found there
was no correlation between heritability and molecular heterozygosity, therefore interpretations
of genetic diversity and adaptive ability need to be made cautiously. Neutral markers can still
provide information on the level of genetic diversity between populations, which may allow us
to determine which populations contain the highest levels of diversity. If those populations are
targeted for conservation, then we should be confident that the majority of genetic diversity is
protected. With a lack of information on the adaptive traits conferred from genetic diversity it
will be better to conserve more genetic diversity as it will allow populations a larger capacity to
adapt (Reed & Frankham, 2003).
1.7 Aim and objectives
The project will develop the scientific background and the methodologies needed for
conservation of PGRs at the national level, including GIS techniques and genetic diversity
studies, to produce a clear and focused strategy for the conservation of CWR in Norway. The
strategy is a set of suggestions that will require the support and involvement of local
stakeholders to implement. The methods used here can be applied to other countries and at the

37
regional and global levels. This is the first such national strategy and is a starting block in the
future of sustainable and effective, in situ and ex situ CWR conservation in Norway.
The following objectives will help achieve this:
• A detailed diversity analysis of both in situ and ex situ conservation priorities for CWR
to assist in the creation of a conservation strategy for CWR in Norway.
• A climate change analysis for priority CWR which will contribute to a long-term
conservation strategy for Norway.
• Genetic diversity studies of a subset of the priority CWR species to help inform
conservation priorities for Norway.
1.8 Overview of thesis
Chapter 2: Methodology
The methodology used in chapters 3, 4 and 5 is described in detail here. The criteria and
processes used to prioritise the CWR in Norway is detailed first. Following this the use of GIS
to create species distribution models both in the present and future predicted climate is
described. The assessment process of how populations may shift and decline or increase in
distribution is described. Along with this the IUCN Red List categories are applied to help
prioritise those taxa that may require urgent conservation. Next a description of the field work
that was conducted to collect leaf samples from CWR populations around Norway for use in
genetic diversity studies is described. The laboratory methods used for the AFLP procedure
and the statistical methods used to determine the levels of genetic diversity are detailed.
38
Chapter 3: In situ and ex situ diversity analysis of priority crop wild relatives in Norway
(Phillips et al., 2016).
Norway has both national and international commitments to the systematic, long-term
conservation of CWR. This can be achieved by ensuring both in situ and ex situ protection and
utilisation of the broad range of genetic diversity of CWR present within the country. The
creation of a CWR checklist and subsequently a priority list of CWR within Norway is
detailed. The diversity analysis procedure is then described and involved predictive species
distribution modelling in MaxEnt, the use of CAPFITOGEN software to undertake in situ
complementarity analyses and identify ex situ collecting priorities, as well as the creation of
ELC maps. This resulted in a priority list of 204 CWR within Norway. Recommendations for
both in situ and ex situ conservation are described based upon the results of the diversity
analyses. The priority taxa are important at both national and global levels for food security
and the methodology used can be applied at national, regional and global levels for similar in
situ and ex situ diversity analyses. The recommendations put forward will help Norway to
meets its international obligations for conservation and use of the genetic diversity of CWR.
Chapter 4: Climate change and national crop wild relative conservation planning
(Phillips et al., 2017).
Climate change is likely to be one of the key factors affecting our future food security. To
mitigate any potential negative impacts, we will require our crops to more genetically diverse.
Such diversity is available in CWR, the wild taxa relatively closely related to crops and from
which diverse traits can be transferred to the crop. Conservation of such genetic diversity
resides within the nation where they are found therefore, national level conservation
recommendations are fundamental to global food security. In this chapter, the potential impact
39
of climate change on CWR richness in Norway is studied. A predicted 1.5°C and 3.0˚C
temperature rise was modelled for the years 2030, 2050, 2070 and 2080. The application of the
IUCN red list criterion A3(c) to priority CWR diversity in Norway was used to indicate the
potential threat level of taxa. Based on these climate change predictions recommendations for
conservation and management of in situ and ex situ priority CWR are suggested. The methods
developed here can be applied within other countries and at global levels to improve the
effectiveness of long-term conservation actions and help ensure global food security in
changing environments.
Chapter 5: Genetic diversity studies of priority crop wild relatives in Norway using
AFLPs: Implications for conservation (Phillips et al., submitted)
CWR are an essential source of genetic diversity due to their close relationship to cultivated
crops and the relative ease of trait transfer. Understanding the genetic diversity of CWR will
allow us to better manage and sustain our natural resources. Genetic diversity studies were
carried out upon three CWR taxa C. carvi, T. repens and T. pratense using Amplified Fragment
Length Polymorphisms (AFLPs). Descriptive statistics were calculated to help determine the
patterns of genetic diversity within and amongst populations. Management plans for the in situ
and ex situ conservation of the broadest range and most important genetic diversity were
suggested. The creation of management plans for priority CWR in Færder NP and its potential
for being designated the first genetic reserve in Norway are discussed.
Chapter 6: Discussion
Collation of the results and recommendations from the previous chapters are discussed. In situ
and ex situ priorities for CWR conservation in Norway are highlighted. Achievements of the
project including the progress made in Færder NP and the initiation of the Nordic initiative for

40
conservation of CWR are detailed. Limitations of the project are discussed and proposals for
solving these and improving upon the work are explored. Further areas of research are
suggested that will help to improve conservation of CWR in Norway. Conclusions are drawn
with a focus upon the essential need for stakeholder engagement throughout the project and the
broader impact of the national strategy for Norway on CWR conservation and use.

41
CHAPTER 2.
Methodology
To help meet the needs and aims for the conservation of CWR both in situ and ex situ within
Norway a targeted national strategy was developed. The Resource book for the preparation of
national plans for conservation of CWR (Maxted et al., 2013) contains a detailed description of
the process and methodology required for the CWR conservation planning. The format
suggested in the resource book helped inform the creation of the national strategy for Norway.
Other resources that have been used here include the Training Manual on Spatial Analysis of
Plant Diversity and Distribution (Scheldeman & van Zonneveld, 2010) and the CAPFITOGEN
manual (Parra-Quijano et al., 2016). It was important to use both objective (statistical analysis)
and subjective (expert opinion) methods for the creation and validation of the Norwegian
national strategy. Local stakeholders were involved at each stage of the process which added
value and improved the likelihood of the strategy being implemented, as suggested by Magos
Brehm et al. (2016) and Phillips et al. (2014). The methodology used is a scientific baseline
for further work and as such the results are dynamic and can be updated as and when new data
become available. Furthermore, the national strategy and methodology used can and should be
incorporated into both regional and global objectives for conservation of CWR.
2.1 National CWR checklist
A complete CWR checklist [with taxa names and authorities] was created for Norway (Table
S2.1). This was initially derived from the Crop Wild Relative Catalogue for Europe and the
Mediterranean (Kell et al., 2008). The checklist was updated and harmonized with the Flora of
Norway (Lid & Lid, 2005) and cross checked with national experts to ascertain the commonly
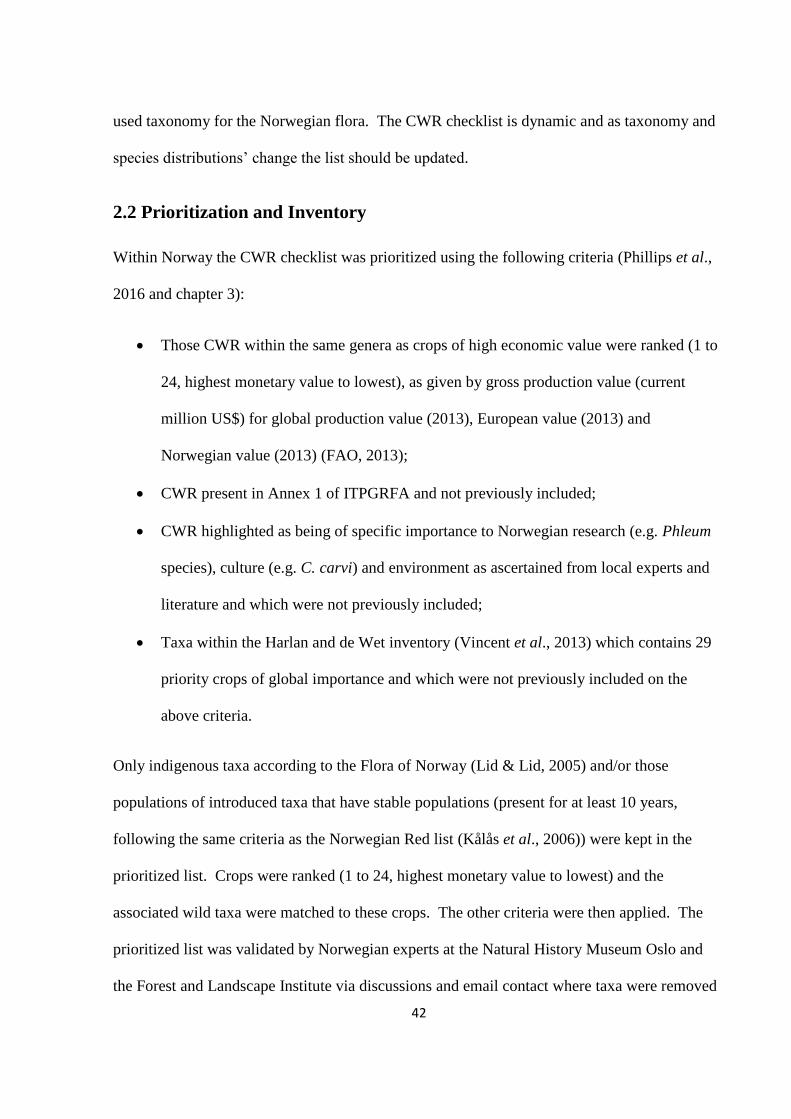
42
used taxonomy for the Norwegian flora. The CWR checklist is dynamic and as taxonomy and
species distributions’ change the list should be updated.
2.2 Prioritization and Inventory
Within Norway the CWR checklist was prioritized using the following criteria (Phillips et al.,
2016 and chapter 3):
• Those CWR within the same genera as crops of high economic value were ranked (1 to
24, highest monetary value to lowest), as given by gross production value (current
million US$) for global production value (2013), European value (2013) and
Norwegian value (2013) (FAO, 2013);
• CWR present in Annex 1 of ITPGRFA and not previously included;
• CWR highlighted as being of specific importance to Norwegian research (e.g. Phleum
species), culture (e.g. C. carvi) and environment as ascertained from local experts and
literature and which were not previously included;
• Taxa within the Harlan and de Wet inventory (Vincent et al., 2013) which contains 29
priority crops of global importance and which were not previously included on the
above criteria.
Only indigenous taxa according to the Flora of Norway (Lid & Lid, 2005) and/or those
populations of introduced taxa that have stable populations (present for at least 10 years,
following the same criteria as the Norwegian Red list (Kålås et al., 2006)) were kept in the
prioritized list. Crops were ranked (1 to 24, highest monetary value to lowest) and the
associated wild taxa were matched to these crops. The other criteria were then applied. The
prioritized list was validated by Norwegian experts at the Natural History Museum Oslo and
the Forest and Landscape Institute via discussions and email contact where taxa were removed

43
or added if deemed appropriate and now forms the basis of the Norwegian Inventory of CWR
(Table S2.2).
2.3 Ecogeographic study
The flora of Norway (Lid & Lid, 2005) was used as the taxonomic classification for the
national strategy. Some common synonyms are included in the inventory to help with
identification and ease of use. Microsoft Excel and Microsoft Access were used to create the
basic database for all accession information gathered from the ecogeographic study. All
passport information was gathered from GBIF (GBIF, 2013), which includes herbaria,
observational and gene bank data. Data for ex situ accessions were initially gathered from the
SESTO database (August 2015; www.nordgen.org/sesto/; see Table S1.1). This data was
cross-checked with the GBIF database to ensure that all ex situ data was being utilised and was
then used to produce an ex situ database of the priority CWR (Table S1.1). Only geo-
referenced passport data was collected which included the longitude and latitude locations
using the decimal degrees (D.D) WGS 1984 coordinate system. Over 96% of occurrence
records were accurate to three or more decimal places with the remaining 4% of data that had
two or less decimal places (Phillips et al. 2016). This was deemed appropriate to use in
distribution modelling for this study as removal of such data would have resulted in the loss of
large amounts of information, including the removal of some taxa from the study altogether
(Phillips et al., 2016).
Only unique records were kept and those presence points which were the same species and the
same coordinates were deleted. In the case of duplicate data collected at different times, the
most recent observations were kept. Erroneous data such as incomplete entries and ambiguous
species names, for each taxon were removed before proceeding with the analysis. DIVA-GIS

44
(Hijmans et al., 2004) software was used to check for outlier occurrence data by locating those
presence points outside the country boundaries of Norway which were then consequently
removed from further analysis.
2.4 Diversity analyses
Figure 2.1 is a representation of the main processes that were conducted in the creation of the
species distribution models (SDM) and resulting conservation strategy for Norway. Species
distribution modelling required the use of specific software including the commonly used,
freely available, DIVA-GIS, CAPFITOGEN and MaxEnt. Arcmap 10.2 (ESRI, 2011) was also
used but is not freely available. All maps created were in the geographic projection WGS 1984
World Mercator. This geographic projection was used due to being widely recognised as the
standard system in navigation and is the reference coordinate system for the Global Positioning
System. The distances measured by this projection are true along the equator but area
measurements become distorted at the poles, however angles and shapes are essentially true to
their measures when studying at small scales. Due to the small size of areas which are used in
this study (4 x 8 km2) this coordinate system is still valuable and with agreement from
Norwegian stakeholders was deemed appropriate to use here.
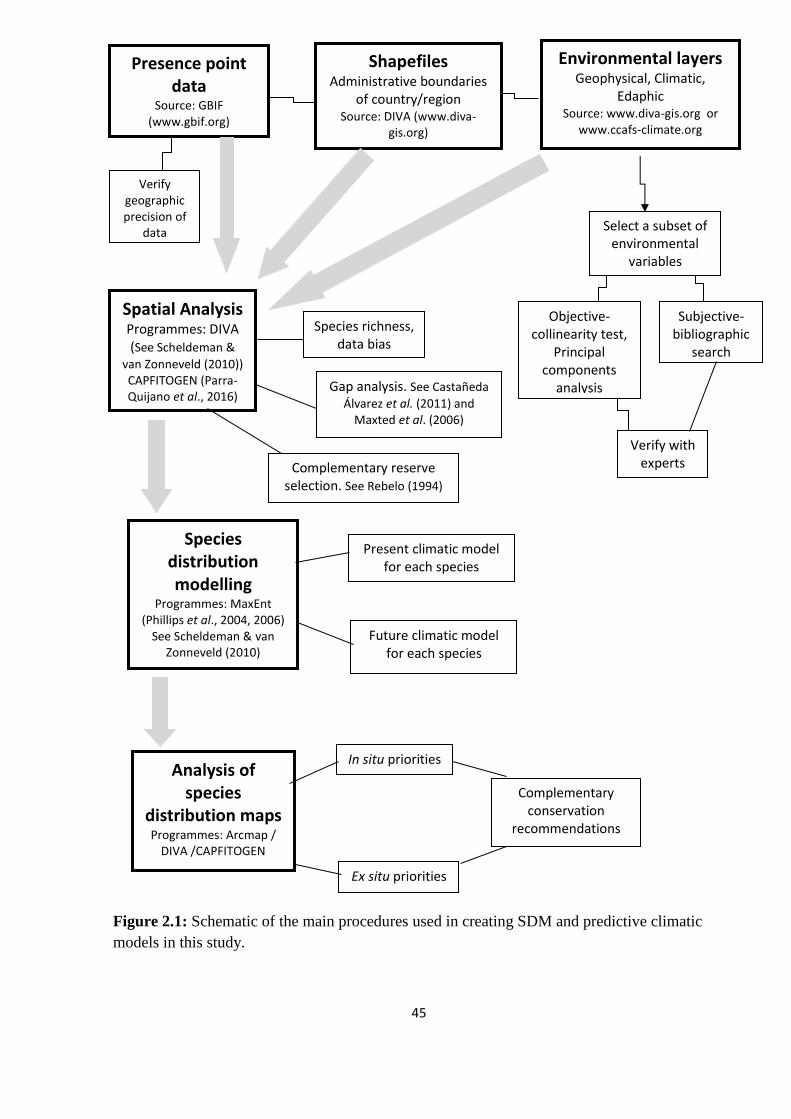
45
Presence point data
Source: GBIF (www.gbif.org)
Shapefiles
Administrative boundaries of country/region
Source: DIVA (www.diva-gis.org)
Subjective- bibliographic
search
Objective-collinearity test,
Principal components
analysis
Select a subset of environmental
variables
Environmental layers
Geophysical, Climatic, Edaphic
Source: www.diva-gis.org or www.ccafs-climate.org
Verify geographic precision of
data
Verify with experts
Spatial Analysis Programmes: DIVA (See Scheldeman &
van Zonneveld (2010)) CAPFITOGEN (Parra-Quijano et al., 2016)
Species richness, data bias
Gap analysis. See Castañeda
Álvarez et al. (2011) and Maxted et al. (2006)
Complementary reserve selection. See Rebelo (1994)
Future climatic model for each species
Analysis of species
distribution maps Programmes: Arcmap /
DIVA /CAPFITOGEN
In situ priorities
Present climatic model for each species
Species distribution modelling
Programmes: MaxEnt (Phillips et al., 2004, 2006)
See Scheldeman & van Zonneveld (2010)
Complementary conservation
recommendations
Ex situ priorities
Figure 2.1: Schematic of the main procedures used in creating SDM and predictive climatic
models in this study.
46
2.4.1. Ecogeographic Land Characterization maps
The ELC mapas tool of the CAPFITOGEN package (Parra-Quijano et al., 2016) was utilised to
create a generalist ELC map for the priority CWR. This generalist map can be applied to
several plant species occurring in a territory based on a single, initial effort i.e. generation of
the map (Parra-Quijano et al., 2012b). Experts on plant distribution within Norway were
consulted on which variables most contributed to plant adaptation within the landscape
(specifically the priority CWR), therefore validating the use of such a generalist map.
To create the ELC map, first a subset of variables from bioclimatic, geophysical and edaphic
components was selected from an initial 103 variables (Table S2.3). These variables
represented the main factors related to abiotic adaptation according to Lobo et al. (2001). This
was done by using a combination of objective and subjective methods to decide upon the
variables to use (Cowling et al., 2003). The environmental data was combined with the
presence point data for the priority taxa in Norway and the environmental values at each point
were extracted in R using packages rgdal (Bivand et al., 2014) and raster (Hijmans & van
Etten, 2014). The bioclimatic variables and geophysical variables were analyzed separately,
standardized in R and a test for collinearity (Dormann et al., 2013) between the variables was
done (Box S2.1). This was necessary to remove redundant variables because multi-collinearity
may violate statistical assumptions and may alter model predictions (Dormann et al., 2013).
The collinearity test removed variables with high (>5) variance inflation factors (VIF) and
resulted in a subset of bioclimatic variables (Table S2.3) and all the geophysical variables.
Edaphic variables were not run through collinearity due to large amounts of missing data as not
all edaphic variables selected had measurements made across the whole of Norway (i.e. some
coastal areas and islands were missing data). The resulting bioclimatic and geophysical
variables and all the edaphic variables were run separately through a principal components
47
analysis (PCA) in SPSS 22 (IBM Corp, 2013) where variables were tentatively selected based
on the highest loadings (>0.3) (Tabachnick & Fidell, 2001). Experts in Norway from the
Forest and Landscape Institute in Ås and Natural History Museum in Oslo, were consulted via
email contact on which of the resulting variables were thought to most likely affect adaptation
of plant species in Norway. Eight variables were used to create the ELC map (Table S2.3)
along with the following parameters in the ELC mapas tool: 8 clusters as a maximum number
of clusters allowed by component (bioclimatic, edaphic and geophysical); elbow method as it
can process large amounts of data and is recommended for large countries; latitude, and a
resolution of 2.5 arc-minutes (equivalent to approximately 4 x 8 km2).
The resulting ELC map was used to inform both in situ and ex situ conservation priorities. The
total number of ELC categories that each taxon was found in and predicted to be found within
was calculated. ELC categories within PAs were determined for in situ conservation and the
CAPFITOGEN tool Representa was used for identifying ex situ conservation needs. See below
for further details.
2.4.2 Species richness and occurrence data bias
A species richness map was created for the priority CWR in Norway. The map was created in
DIVA-GIS following the procedure set out by Scheldeman and von Zonneveld (2010). Each
grid cell was equivalent to approximately 4 x 8 km2 at the equator. The richness for those
presence points inside PAs was also studied and followed the same procedure. Sampling bias
was mapped following Scheldeman and von Zonneveld (2010) with each grid cell equivalent to
4 x 8 km2 at the equator.
2.4.3 Predicted distribution and gap analysis

48
The predicted distribution maps for the priority CWR within Norway used GIS layers
composed of climatic, edaphic and geophysical variables that were obtained from freely
available data sources (Table S2.3). The data and methods used to select the variables were the
same as those used in the creation of the ELC map. However, when experts were consulted on
the appropriateness of the resulting variables they were asked to validate the variables on which
they thought were the most important for predicting plant distribution. This therefore resulted
in a different selection of final variables to the ELC map (Table S2.3).
The presence point data in ‘.csv’ format for the priority taxa and the environmental layers
selected by the above method in ‘ASCII’ format were run in MaxEnt. All environmental layers
had the same extent and grid size (2.5 arc-map minutes). In MaxEnt the following settings
were used: Jack-knife was selected to measure variable importance; random test percentage
was set at 30, meaning 30% of records were used to ‘test’ the model and 70% were used to
‘train’ the model; Equal training sensitivity and specificity was used as the threshold rule
meaning the proportion of presences incorrectly predicted was the same as the proportion of
absences incorrectly predicted as it is an accurate threshold for predictive accuracy (Liu et al.,
2005); all other settings remained as default.
The models were evaluated by the area under the receiver operating curve (ROC), commonly
known as AUC. This measures the ability of a model to discriminate between sites where a
species is present versus those where it is absent (Hanley & McNeil, 1982). Models with an
AUC >0.7 are considered acceptable and such predictions based on presence-only data can be
sufficiently accurate to be used in conservation planning (Pearce & Ferrier, 2000). AUC <0.5
indicates performance is worse than random (Anderson et al., 2006). For taxa with AUC <0.7
their SDM should be treated with extra caution.
49
2.4.3.1 In situ gap analysis
A gap analysis was undertaken that used the results from the observed species richness and the
predicted distribution. In DIVA-GIS the predicted distribution of species richness was
subtracted from the observed species richness to produce a new grid file showing those areas
where there are gaps in the current observation data. For in situ conservation the predicted
distribution map was compared with the current PA system (UNEP, WCMA and IUCN, 2015)
to determine which taxa were predicted to be passively conserved. Passive conservation refers
to those taxa that coincidentally occur within an established PA and are therefore protected but
not necessarily managed. To determine how well the ecogeographic diversity of the priority
CWR was passively conserved in situ, the ELC categories within PAs were determined. The
values of the points that corresponded to the ELC categories were extracted from the PA layer
to create a table with corresponding PAs and ELC category points. A visual inspection was
carried out on the map as points were located in the centre of the grid cells, therefore if some
PAs contained only a section of a grid cell this may have been excluded from the analysis. For
each taxon the percentage of ELC diversity conserved within the entire PA network was also
calculated by comparing the total number of ELC categories the taxon was present in to the
number of ELC categories in PAs that the taxon was found in.
2.4.3.2 Ex situ gap analysis
A priority CWR richness map and a predicted distribution map was created for those taxa with
ex situ data. A gap analysis map was created for those taxa with ex situ accessions, following
the methodology of Maxted et al. (2008a) and Parra-Quijano et al. (2011). A separate CWR
richness map and predicted distribution map was created for those taxa without ex situ
accessions. For each taxon the number of ELC zones the taxon was observed within, predicted
to be within and collected from was studied. The percentage of ecogeographic diversity

50
conserved per taxon with ex situ accessions was calculated. The ELC zones where the species
was predicted to be found but had not yet been collected from were determined. Further gap
analysis for those taxa with ex situ accessions was then undertaken using the CAPFITOGEN
tool Representa (Box S2.2). A comparison was made between the ex situ accession data only
and all other data collected from GBIF, including herbarium and observational data which
indicated the presences of populations that had not been collected. The frequency of both these
sources of data within the ELC zones in Norway was also compared. ELC zones for which
there were no germplasm collections but for which the herbarium and observational data
suggested species presences, were gaps in the ex situ collections and should be targeted
immediately for collection. ELC zones were then classified according to this and given a
priority level for collection, where class 1 is the highest priority and class 13 is the lowest (see
Parra-Quijano et al., 2016). The ELC zones with the highest number of species portioned by
class were identified to ascertain which ELC zones to target for collecting a high number of
underrepresented taxa. The ELC zones that contained the highest number of taxa with no ex
situ accessions were also determined.
2.4.4 Complementarity analysis
The CAPFITOGEN tool Complementa (Box S2.3) was used to perform complementarity
analysis to create a network of sites for potential genetic reserves which followed the Rebelo
(1994) approach. This was done for all taxa presence points across mainland Norway creating
a grid cell complementary network, which used an area of 4 x 8 km2 per grid cell (i.e. reserve).
A separate analysis was carried out for only those presence points located within the current
PA network in Norway and created a PA complementary network.
A further analysis was performed to determine how many populations of each taxon were
conserved within the grid cell complementary network and the PA complementary network.

51
The point information within each of the aforementioned areas was extracted to determine
which taxa were located there and thus how many populations could potentially be actively
conserved. The ELC zones covered by the PA complementarity analysis were also extracted to
determine if the complementary network can conserve both species richness and ecogeographic
diversity.
2.4.5 Climate change assessment
For the climate change studies the same methods used in section 2.4.3 to create species
distribution models were followed, including the same environmental variables and the same
settings in MaxEnt. We consulted with experts within Norway from the Natural History
Museum, Oslo and the Forest and Landscape Institute, to determine the environmental
variables which would commonly affect all the priority CWR and thus create multispecies’
climate change maps. Future climatic layers were used instead of present climatic variables,
and were obtained from CCAFS (http://www.ccafs-climate.org/data/) where the data is based
upon the most recent IPCC report (IPCC, 2014) up to the year 2080. Geophysical and edaphic
variables are not expected to change under future climate therefore no data was available for
them; hence only bioclimatic variables were used. These included: Isothermality, maximum
temperature of warmest month, minimum temperature of coldest month, annual precipitation
and precipitation seasonality (Table S2.3).
The Delta Method IPCC AR5 empirical statistical downscaling was used for the most recent
Relative Concentration Pathway (RCP) climate scenarios under the years 2030, 2050, 2070,
2080 so that both short and long-term effects of climate change could be studied. The
Norwegian Earth System Model, NorESM1-M (Bentsen et al., 2013) which was based upon
the Community Climate System Model version 4 (CCSM4; Gent et al., 2011) was used due to
its specificity to climatic processes that are particularly important at northern latitudes (Bentsen

52
et al., 2013). Data was used for two RCP scenarios, RCP 2.6 and RCP 6.0, which represent the
agreed maximum temperature rise set out by the Paris agreement (1.5˚C) and the more likely
temperature rise from the INDC proposals of 2.5-3.5˚C (UNFCCC, 2015), respectively. Once
data for each of the four study years was obtained, models were created separately for each
taxon in MaxEnt following a similar procedure to that in section 2.4.3. All layers had the same
extent and resolution of 2.5 arc-map minutes.
Evaluation of the model accuracy was done using the average Area under the ROC (Receiver
Operating Characteristic) Curve of the test data (AUCTest) and standard deviation of the
AUCTest data (STAUC; Ramirez-Villegas et al., 2010) for each taxon. Models with an AUCTest
> 0.7 and STAUC < 0.15 are considered accurate and stable (Ramirez-Villegas et al., 2010).
2.4.5.1 Climate change diversity analyses
Taxa richness maps were created for taxa under both unlimited migration, where taxa can move
unrestricted to where the climate is suitable and no migration scenarios, where taxa are unable
to expand from their current distribution. This was done for both RCP scenarios and the four
study years. Analyses were undertaken in ArcMap 10.2 using Python scripting to automate and
streamline the process. Change in taxa richness was studied by comparing present predicted
distribution and future predicted distribution to create a new map showing where taxa
distribution has changed.
Taxon loss and gain was calculated for each grid cell where the number of taxa found per grid
cell was compared to the current taxa richness per grid cell for both migration scenarios. The
turnover rate for each climate scenario and each year was calculated following the method set
out by Thuiller et al. (2005) and Thomas et al. (2004) where:
Taxa turnover = 100 x L + G

53
SR + G
SR is the current taxa richness, L is loss of taxa per grid cell and G is gain of taxa per grid cell.
This was calculated for both RCP scenarios per study year and the average was calculated for
each year.
To determine the threat level of the taxa we compared the number of grid cells where a taxon
was present under both no migration and unlimited migration and present and future climatic
scenarios. The level of threat for the priority taxon was then assessed using the IUCN red list
criterion A3(c) (IUCN, 2001; Thuiller et al., 2005). This used the projected geographic range
loss of a taxon as a proxy for population reduction to assign a threat category by the following
parameters: Extinct (EX) is a taxon with a projected range loss of 100 %, Critically Endangered
(CR) has a projected range loss of >80%, Endangered (EN) has a range loss of >50% and
Vulnerable (V) had a range loss of >30% (IUCN, 2001). The remaining taxa were considered
Least Concern (LC) in terms of climate change impacts.
2.5 Genetic diversity studies
Genetic diversity studies were conducted to assess the extent of genetic diversity of ten priority
CWR in Norway. The taxa selected were: Allium ursinum L., Brassica rapa subsp. campestris
L., C. carvi, Festuca pratensis (Huds.) P. Beauv., Phleum pratense L., Ribes uva-crispa L., R.
chamaemorus, Rubus idaeus L., Trifolium pratense L., Trifolium repens L. Taxa were chosen
based upon consultation with Norwegian stakeholders at the Forest and Landscape Institute and
the Natural History Museum Oslo who selected a broad range of taxa that were of interest to
their work. For example, P. pratense is one of the most widely used forage species in Norway
and Scandinavia and R. chamaemorus is a traditionally used wild species important in
Norwegian food. The species chosen are also widely distributed across the length of Norway

54
so the difference in genetic diversity between wide ranging populations could be studied. A.
ursinum and B. rapa were not distributed across the length of Norway but they are important
species in global agriculture and have had their genetic diversity studied in other similar studies
(for example Fielder, 2015).
From June to August 2014 and in May and July 2015, sampling was carried out for the above
ten CWR. Twenty-six sites were visited which ranged from islands in the south of Norway to
the Arctic in the north (Figure 2.2 and Table S2.4). Not all ten CWR taxa were collected from
each site. These sites were chosen firstly based upon the results of the grid cell
complementarity analysis (see chapter 3) as this analysis was based upon known occurrences
and meant it was likely that the species would be found at these locations. Once these locations
were known we then targeted collecting within PAs near these grid cell sites (at this point in
the project the CAPFITOGEN Complementa tool had not been adequately developed to use the
PA complementary network to identify our collection sites within PAs). We chose sites that
were spread across the length and breadth of Norway and were deemed suitable by local
experts. We also had to consider the accessibility of sites, which was particularly important in
the north of Norway. Here we tried to focus collecting upon areas within different ELC zones,
not necessarily within PAs as these were often difficult and impractical to access.
The sites covered a wide range of geographical variation in longitude, latitude and altitude
(Table S2.4). From each site one leaf sample was collected (approximately 100 mg fresh
weight minimum) from 20 different individuals within a population for each species (if that
species was present at the site). As the sites varied in size individuals were collected from
different populations within that site to try and get a representation of the range of genetic
diversity within the area. The different sites were deemed far enough away from each other
that geneflow would be limited between them. Leaf samples were immediately stored in
55
airtight plastic bags containing drying indicator silica gel (Chase & Hills, 1991). A total of
2289 individual samples were collected from the wild.
The genetic diversity between wild and cultivated/semi-wild populations of T. pratense was
also analysed, to determine if there was a difference in the levels of genetic diversity between
cultivated and wild populations. The cultivated populations were grown out in glasshouses at
Bioforsk, Grimstad, Norway. Twenty cultivars were grown and leaf samples from twenty
individuals per cultivar were sampled, resulting in 400 samples (Table S2.5). These leaf
samples were stored and handled in the same way as the wild samples were above. Ten percent
of all samples, wild and cultivated were replicated following the guidelines from Bonin et al.
(2004). The total number of samples for genetic diversity analysis was 3034.

56
Figure 2.2: Location of the 26 collecting sites (see Table S2.4 for more details) for the ten
CWR in Norway. The PA network is shown. Multiple points at each site represent the breadth
of the locations visited within one site to collect the ten species.

57
2.5.1 Molecular marker genotyping
Molecular work was undertaken at IBERS, Aberystwyth University. Genomic DNA was
extracted from the dried leaves using the DNeasy 96 Plant Kit (Qiagen, 2012). The AFLP
method was completed according to IBERS standard protocol (Skøt et al., 2005), based on Vos
et al. (1995). AFLP reactions were run on the ABI 3730X1 capillary sequencer. Pre-
amplification was done to identify appropriate primers that produced markers distributed
throughout the genome of each individual species.
Three primer combinations were initially tested on samples from each species that were
collected during 2014, the primers used were: ACG-CTG, AGC-CGC and ATC-CAC. The
results from these samples were ‘good’ except ACG-CGC did not work with R. chamaemorus
(K. Skøt, 2016, personal communication). After this initial testing the extracted DNA from
these samples was stored in the freezer until the following year when all samples had been
collected. Following extraction of the DNA from the collections made in summer 2015, further
primer testing was carried out, see Table 2.1 for results.
Table 2.1: The primer combinations tested on all species after extraction of DNA from all
samples collected over both the years 2014 and 2015. *represents primers used in final AFLP
analysis.
Primer Result
ACG-CTG* GOOD
AGC-CGC POOR
ATC-CAC GOOD
AAC-CAC POOR
ACA-CTA* GOOD
AGA-CGA POOR
ATG-CAG AVERAGE
ATG-CAT POOR
ACG-CAT GOOD
AAG-CTC POOR
AGT-CAC POOR
ATC-CTA AVERAGE
ACA-CAT POOR
58
ACT-CTA AVERAGE
Initial analysis of the AFLP electropherograms and the calculation of the dataset error rates
(see section 2.5.2 for details on how this was done) showed that the AFLP procedure had not
been successful. Dataset error rates were >50% for all species samples. Due to budget
limitations, in autumn 2016 three species samples were reanalysed, these included T. pratense,
T. repens and C. carvi. For T. pratense new pre-amplifications were used. For T. repens and
C. carvi the original pre-amplifications were used. For all three species and two primer
combinations, 3μl of pre-amplification product was used for the selective amplifications and
the same PCR protocol above was used with 25 cycles. 1μl of selective amplification product
was mixed with 10μl formamide/size standard and run on the ABI3730.
2.5.2 Analysis of the AFLP electropherograms
AFLP electropherograms were visualised for the three species in the freely available software
Peak Scanner (Applied Biosystems, 2006). The size and fluorescence of AFLP peaks was
detected using an ‘Analysis Method’ with the following settings as described by Arrigo et al.
(2009): light smoothing of electropherograms was selected; default parameters for the ‘sliding
window’ analysis were selected; peaks were filtered using 50 relative fluorescent units (rfu) as
a minimum; and the size standard used was GS500(-250)LIZ. The resulting Peak Scanner
table was imported into RawGeno (Arrigo et al., 2009), where peaks were automatically scored
as present (1) or absent (0). In RawGeno the scoring of peaks was limited to blue dye only and
samples were analysed separately for each species and each primer. The binning parameters
were optimized prior to analysis with samples analysed using a maximum bin width of both 2.0
and 1.5. Using a larger bin width increased the likelihood of technical homoplasy (Arrigo et
al., 2009), therefore a maximum bin width of 1.5 and a minimum bin width of 1.0 were used.

59
The scoring range for the peaks was from 50 to 500 base pairs with low fluorescence bins set at
100 rfu. After peak scoring, replicates were separated from the samples and the dataset and
loci error rates were calculated.
Approximately 10% of samples for each species were manually checked for quality of binning
to ensure peaks were being correctly scored. These were then compared to the RawGeno
output. RawGeno detected a higher number of peaks and a lower dataset error rate. The
automated scoring process using RawGeno has been shown to provide results that are as
accurate as those scored manually or within commercial software such as Genemapper (Arrigo
et al., 2009; Herrmann et al., 2010). Furthermore, the automated procedure can increase
reproducibility of the dataset and limit genotyping errors to technical factors (Arrigo et al.,
2009)
For each taxon 10% of the collected samples were replicated randomly. Error rates were
calculated separately for each taxon based upon the replicates resulting in a locus and dataset
error rate (Bonin et al., 2004; Pompanon et al., 2005). This procedure followed that of Bonin
et al. (2004, 2007) where the loci error rates were calculated based upon the ratio of the total
number of mismatches between samples and replicates to the number of replicated individuals
and for the dataset by the number of mismatches between sample and replicate divided by the
number of peaks per sample (shown as a percentage).
2.5.3 Statistical analysis
Genetic diversity and population structure metrics were calculated at species level using AFLP-
SURV (Vekemans et al., 2002) and GenAlEx software (Peakall & Smouse, 2006; Peakall &
Smouse, 2012). Allele frequencies were calculated using AFLP-SURV’s Bayesian method
with non-uniform prior distribution of allele frequencies (Zhivotovsky, 1999) due to the

60
dominant nature of AFLP markers. The following descriptive statistics were calculated in
AFLP-SURV: proportion of polymorphic loci at the five percent confidence level expressed as
a percentage (PLP), expected heterozygosity (HE), mean expected heterozygosity within
populations (HW) and Wright’s fixation index (FST) (Lynch and Milligan, 1994). Principal
coordinate analysis (PCoA) was performed in GenAlEx 6.5 to determine patterns of variation
between individuals based on pairwise genetic data and between populations based upon Nei’s
genetic distance. An Analysis of Molecular Variance (AMOVA) using 999 permutations was
also undertaken in GenAlEx to determine the distribution of genetic variation within and
among populations. A Mantel test was carried out in GenAlEx to assess if genetic diversity
was correlated with geographic distance. Pairwise FST values (transformed to FST/(1-FST)) were
compared to log-transformed geographic distances with 999 permutations. The geographic
distance was calculated in GenAlEx using latitude and longitude decimal degree coordinates
and utilising a modification of the Haversine formula developed by R. W. Sinnott (1984). This
closely approximates the output of Garmin GPS software and the distances calculated are
returned in km’s (see Peakall and Smounse 2012). SPSS 24 was used to perform correlation
analyses between the environmental variables in the ELC zones (Table S2.3) and the level of
heterozygosity for each population per species. Stepwise Regression analysis was also
undertaken in SPSS for each species to determine if the environmental variables had any
significant predictive relationship with the level of heterozygosity within populations. Finally,
the number of private (unique) alleles within each population was calculated in SPSS, to help
determine how distinct populations were from each other.
61
CHAPTER 3.
In situ and ex situ diversity analysis of priority crop wild
relatives in Norway
The work presented in this chapter has been published in Diversity and Distributions
(Phillips, J., Asdal, Å., Magos Brehm, J., Rasmussen, M. & Maxted, N. (2016) In situ and ex situ diversity
analysis of priority crop wild relatives in Norway. Diversity and Distributions, 22, 1112-1126.)
Jade Phillips, Åsmund Asdal, Joana Magos Brehm, Morten Rasmussen, Nigel
Maxted
Author contributions:
Conceived and designed the study: J.P., A.A., N.M.
Data collation and preparation: J.P., A.A.
Performed analysis: J.P.
Interpreted results: J.P., A.A., J.M.B.
Wrote the paper: J.P.
Critically reviewed the paper: J.P., A.A., J.M.B., M.R., N.M.

62
3.1 Abstract
This study aims to contribute directly to Norway’s national and international commitments to
systematic, long term conservation of CWR by ensuring both the in situ and ex situ protection
and availability of a broad range of CWR genetic diversity within the country. We created a
priority list of CWR within Norway based upon four main criteria including economic value
from national to global level of associated crops and inclusion in Annex 1 of the ITPGRFA.
Species presence data was gathered from GBIF and used for predictive species distribution
modelling in MaxEnt. CAPFITOGEN software was utilised to create an ELC map and to
identify complementary in situ genetic reserves and ex situ collecting priorities which target the
full range of ecogeographic diversity of taxa. An inventory of 204 priority CWR within
Norway was compiled. A grid cell complementary network of 19 in situ areas (4 x 8 km2)
conserved 201 priority CWR and a separate analysis identified a PA complementary network
of 23 reserves that conserved 181 priority taxa. For ex situ conservation, 177 taxa did not have
ex situ accessions and of the 24 with accessions, 15 had the minimum of five populations
conserved throughout their ecogeographic range. We present the first comprehensive national
recommendations for in situ and ex situ conservation of 204 priority CWR in Norway.
Proposals target the conservation of the ecogeographic diversity of the priority CWR and hence
their genetic diversity. Both the priority taxa and the methodology used are applicable at
regional and global scales with the recommendations not only helping Norway to meet its
international obligations for conservation of genetic diversity of CWR but also ensuring this
genetic diversity is available for use in tackling global food security.
63
3.2 Introduction
The global population is expected to reach 9.3 billion by 2050 (UN, 2015b). This will intensify
the strain on existing agricultural systems and the environment through a need for higher food
productivity which the FAO (2009b) states will need to increase by 70% globally before 2050.
In combination with an increase in population there is evidence of increased homogeneity of
the world’s food supplies (Flores-Palacios, 1998) and of a decrease in genetic diversity
(Hoisington et al., 1999; Esquinas-Alcazar, 2005; Gepts, 2006; van de Wouw et al., 2009) this
will be a threat to food security at the national, regional and global levels due to mal-adaptation
of crops to the changing environment. CWR are a PGR pre-breeders and breeders are looking
towards to help tackle this food security challenge.
CWR are wild plant taxa that have an indirect use derived from their relatively close genetic
relationship to a crop. These wild taxa are located throughout the world, with particularly
species rich areas found near the Vavilov centres of diversity (Vincent et al., 2013). However,
those populations in more peripheral locations within less favourable habitats are also
important as they will have developed unique adaptive genetic diversity. This broad range of
genetic diversity has been utilised in modern plant breeding with the most common use of wild
relatives as a source of pest and disease resistance along with other characteristics such as
drought and salt tolerance, also being harnessed (Prescott-Allen & Prescott Allen, 1986; Hajjar
& Hodgkin, 2007; Maxted & Kell, 2009).
Pimentel et al. (1997) estimates that 30% of the increase in crop yields since 1945 has been
made through crossing with wild relatives, representing a worldwide value of US$115 billion
per year and we can only assume that this has increased by today’s standards. The future value
of benefits from CWR has also been estimated at potentially $196 billion for the wild

64
genepools of 32 major crops (PwC, 2013). Furthermore, the direct and indirect uses of CWR
through the ecosystem services they provide will increase their value for the economy. Despite
the high value attributed to CWR and our dependence on fewer than a dozen of the
approximately 300,000 species of flowering plants for crops (McCouch et al., 2013) they still
lack concerted conservation efforts. Policy initiatives are being put in place with the CBD
(UN, 1992), the ITPGRFA (FAO, 2001; www.planttreaty.org) and the GSPC
(www.biodiv.org/programmes/cross-cutting/plant/) stressing the need for effective
conservation of PGR. Although these goals have been set out at an international level, ‘food
security is a national responsibility’ (FAO, 2009b) and therefore they must be implemented at
the national level if conservation actions are to be effective. National CWR priorities have
been developed for Cyprus (Phillips et al., 2014), England (Fielder et al., 2015), Finland
(Fitzgerald, 2013), Italy (Panella et al., 2014), Jordan (Magos Brehm et al., 2016), Portugal
(Magos Brehm et al., 2008), Spain (Rubio Teso et al., 2013), the USA (Khoury et al., 2013),
among other countries.
Norway is also seeking to act upon such international legislation to develop national CWR
conservation priorities. The CWR taxa present within their borders are nationally and globally
important due to the position of the country on the north western periphery of Europe. The
country has a substantial north-south and east-west climate gradient (Norwegian Ministry for
Agriculture and Food, 2008) and has been ice-free for less than 10,000 years (Kålås et al.,
2006). This means that species tend to have a restricted occurrence which may lead to unique
genetic adaptations or traits due to in situ glacial refugia (Eidesen et al., 2013).
Norway has 3,148 recorded plant species of which 2,250 are described as native (Kålås et al.,
2006). The most botanically rich areas are found in the calcareous areas around Oslofeltet and
south east Norway. The country is composed of 37% mountains whereas the global average is
65
27% (Nybø et al., 2011). This is important in the context of climate change, as it is likely to be
the greatest threat in many, if not most regions (Thomas et al., 2004) with mountainous species
likely to have higher rates of species loss (Thuiller et al., 2005). In Norway the annual mean
temperature is expected to rise 2.3-4.6 ˚C by 2100 and the growing season is expected to
become 1-2 months longer in lowland and 2-4 months longer in high mountain areas
(www.environment.no). These changes may increase crop yields at high latitudes (Olesen and
Bindi, 2002) and species diversity from the south but could negatively impact populations at
their northern limit which may become restricted in their distribution.
In Norway, national conservation legislation is implemented through the Nature Diversity Act
(2009) and is the most important instrument for expanding protection of the natural
environment. Under this Act it designates different types of PAs which encompass about 17%
of mainland Norway (www.environment.no) including NPs, nature reserves and landscape
protected areas. The latter is particularly interesting in the CWR context as these sites include
areas of agricultural land which tends to be associated with CWRs (Maxted & Kell, 2009;
Jarvis et al., 2015). Although Norway has no formally recognised in situ CWR conservation
these taxa are conserved passively in the above mentioned PAs, but this ‘is not enough to
guarantee the continuation of these populations’ (Maxted et al., 1997a; Hunter et al., 2012)
hence the need to assess the suitability of a system of complementary in situ genetic reserves
with active management guidelines and ex situ collecting needs.
The aim of this research is to contribute directly to Norway’s national and international
commitments to systematic, long term conservation of CWR by ensuring both the in situ and ex
situ protection and availability of a broad range of CWR diversity within the country. The
specific objectives include the recommendation for a network of in situ genetic reserves to
conserve taxa richness and ecogeographic diversity, as well as identification of areas outside

66
formal PAs for in situ conservation actions. Proposals are made for where and what ex situ
material should be collected to ensure the full range of ecogeographic diversity is conserved
and available for use. The methodology is based on freely available and open source software
and can be applied to CWR conservation efforts in other nations as well as at regional and
global scales.
3.3 Methods
3.3.1 National CWR checklist and inventory
CWR checklists and inventories are the foundation for the formulation of conservation
strategies (Maxted et al., 2015). A CWR checklist was created for Norway (Table S2.1) that
was initially derived from the Crop Wild Relative Catalogue for Europe and the Mediterranean
(Kell et al., 2008), updated and harmonized with the Flora of Norway (Lid & Lid, 2005) and
subsequently prioritized using the following criteria:
• Those CWR within the same genera as crops of high economic value were ranked (1 to
24, highest monetary value to lowest), as given by gross production value (current
million US$) (from FAO stat, http://faostat3.fao.org/home/E) for global production
value (2013), within Europe (2013) and within Norway (2013);
• CWR present in Annex 1 of ITPGRFA and not previously included;
• CWR highlighted as being of specific importance to Norwegian research (e.g. Phleum
species), culture (e.g. C. carvi) and environment as ascertained from local experts and
literature and which were not previously included;Taxa within the Harlan and de Wet
inventory (Vincent et al., 2013) which contains 29 priority crops of global importance
and which were not previously included on the above criteria.

67
Only indigenous taxa according to the Flora of Norway (Lid & Lid, 2005) and/or those
populations of introduced taxa that have stable populations (present for at least 10 years,
following the same criteria as the Norwegian Red list (Kålås et al., 2006)) were kept in the
prioritized list. Crops were ranked (1 to 24, highest monetary value to lowest) and the
associated wild taxa were matched to these crops. The other criteria were then applied. The
prioritized list was validated by Norwegian experts via discussions and email contact where
taxa were removed or added if deemed appropriate and now forms the basis of the Norwegian
Inventory of CWR (Table S2.2).
3.3.2 In situ diversity analyses
For all the taxa in the CWR inventory geo-referenced occurrence records were gathered from
GBIF (GBIF, 2013). Spatial duplicates, in other words, records from the same species with the
same coordinates, were deleted (most recent records were kept when these were collected at
different times). Erroneous data such as incomplete entries and ambiguous species names were
removed before proceeding with the analysis. Over 96% of occurrence records were accurate
to three or more decimal places. DIVA GIS (Hijmans et al., 2004) software was used to check
for outlier observations, those locations outside the mainland boundaries of Norway, and such
points were removed from further analysis.
Taxon richness and sampling bias maps were created for the priority CWR in Norway, for the
entire distributional range of taxa and for the PA network using DIVA-GIS. For in situ
conservation the CAPFITOGEN tool (version 2.0; Parra-Quijano et al., 2016) Complementa
was used to perform a grid cell complementarity analysis to create a network of sites (at 4 x 8
km2 each) for potential genetic reserves for active in situ conservation using the Rebelo (1994)
approach (see Box S2.3 for settings used in Complementa). The 4 x 8 km2 size of sites was
deemed effective for this study by Norwegian stakeholders due to the heterogeneity of the
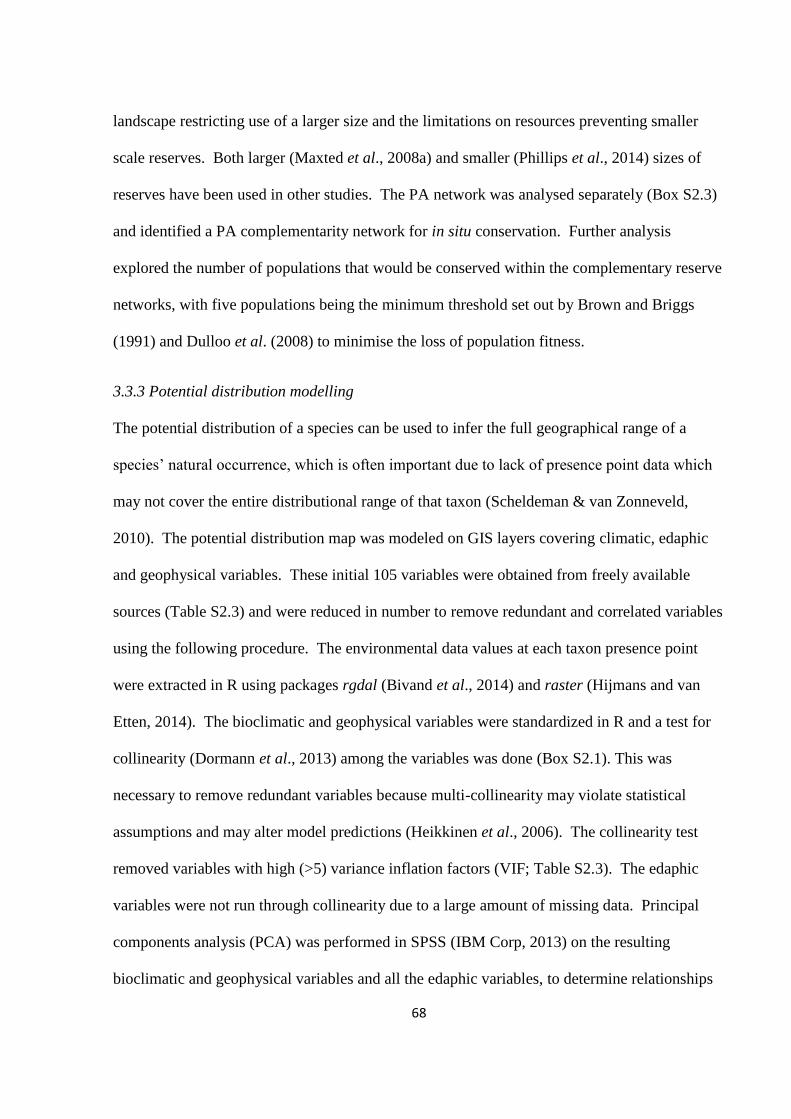
68
landscape restricting use of a larger size and the limitations on resources preventing smaller
scale reserves. Both larger (Maxted et al., 2008a) and smaller (Phillips et al., 2014) sizes of
reserves have been used in other studies. The PA network was analysed separately (Box S2.3)
and identified a PA complementarity network for in situ conservation. Further analysis
explored the number of populations that would be conserved within the complementary reserve
networks, with five populations being the minimum threshold set out by Brown and Briggs
(1991) and Dulloo et al. (2008) to minimise the loss of population fitness.
3.3.3 Potential distribution modelling
The potential distribution of a species can be used to infer the full geographical range of a
species’ natural occurrence, which is often important due to lack of presence point data which
may not cover the entire distributional range of that taxon (Scheldeman & van Zonneveld,
2010). The potential distribution map was modeled on GIS layers covering climatic, edaphic
and geophysical variables. These initial 105 variables were obtained from freely available
sources (Table S2.3) and were reduced in number to remove redundant and correlated variables
using the following procedure. The environmental data values at each taxon presence point
were extracted in R using packages rgdal (Bivand et al., 2014) and raster (Hijmans and van
Etten, 2014). The bioclimatic and geophysical variables were standardized in R and a test for
collinearity (Dormann et al., 2013) among the variables was done (Box S2.1). This was
necessary to remove redundant variables because multi-collinearity may violate statistical
assumptions and may alter model predictions (Heikkinen et al., 2006). The collinearity test
removed variables with high (>5) variance inflation factors (VIF; Table S2.3). The edaphic
variables were not run through collinearity due to a large amount of missing data. Principal
components analysis (PCA) was performed in SPSS (IBM Corp, 2013) on the resulting
bioclimatic and geophysical variables and all the edaphic variables, to determine relationships

69
among variables and define the final selection. The resulting uncorrelated variables were used
in consultation with experts in Norway to validate the final selection of variables they felt were
most important for predicting plant distribution. Consequently, thirteen environmental
variables were used in creating the predicted distribution map (Table S2.3).
The maximum entropy (MaxEnt) algorithm (Phillips et al., 2004;et al 2006) was used to create
the potential distributions for each priority taxon with the observational data (see chapter 2,
section 2.4.3 for MaxEnt settings). Models were evaluated by the area under the receiver
operating curve (ROC), known as AUC. Models with an AUC >0.7 are considered acceptable
and such predictions based on presence-only data can be accurate to be used in conservation
planning (Pearce & Ferrier, 2000). A value of < 0.5 indicates a model performance worse than
random (Anderson et al., 2006). The potential distribution map was used with the observed
distribution map for individual taxa, to undertake a gap analysis that determined how many
taxa were predicted to be conserved in situ within the current PA network in Norway.
3.3.4 Ecogeographic Land Characterization maps
An ELC map can be used to identify useful ecogeographic zones which represent adaptive
scenarios for plants (Parra-Quijano et al., 2012b). By helping to ensure conservation of the full
range of ecogeographic diversity it is assumed that the full extent of genetic diversity will also
be captured (Maxted et al., 1995, Thomson et al., 2001). The ELC mapas tool of
CAPFITOGEN (Parra-Quijano et al., 2016) was used to create the ecogeographic map. Eight
variables were selected (Table S2.3) following the methodology used in the above potential
distribution modelling, with the following parameters selected in the ELC mapas tool: 8
clusters as a maximum number of clusters allowed by component (bioclimatic, edaphic and
geophysical); elbow method, as it can process large amounts of data and is recommended for
large countries; latitude; and a resolution of 2.5 arc-minutes (equivalent to 4 x 8 km2). To

70
determine how well the ecogeographic diversity was passively conserved in situ and the
likelihood of active conservation measures being taken, the ELC zones within PA were
determined. The ELC zones covered by both the complementarity analyses were also extracted
to determine if the complementary network can conserve both species richness and
ecogeographic diversity.
3.3.5 Ex situ diversity analyses
Georeferenced accession data was obtained from the SESTO database at NordGen (August
2015; www.nordgen.org/sesto/; Table S1.1) and cross-checked with the GBIF data. This
confirmed that all the ex situ data was recorded within the GBIF database which then allowed
the identification of taxa with and without ex situ accessions. A priority CWR richness map
was created for those taxa without ex situ collections to determine where collections should
take place to target a high number of taxa in minimal visits. A gap analysis map was created
following the methodology of Maxted et al. (2008a) and Parra-Quijano et al. (2012c) for those
taxa with ex situ accessions. This highlighted the areas where the species was likely to be
found but had not yet been collected from.
The CAPFITOGEN tool Representa (Parra-Quijano et al. (2016) and Box S2.2 for parameters
selected) was used to undertake a gap analysis of ex situ collections. A comparison was made
between the ex situ accession data only and all other data indicating presences of populations.
The frequency of both these sources of data within the ELC zones was also compared. For
each taxon with ex situ accessions the ELC zones to collect from were prioritised into classes,
following the methods described by Parra-Quijano et al. (2016). The ELC zones with the
highest number of species portioned by class were identified to ascertain which ELC zones to
target to collect the highest number of underrepresented taxa. This was also done for taxa
without ex situ accessions.

71
3.4 Results
3.4.1 CWR checklist, inventory and ecogeographic study
A complete CWR checklist containing 2538 CWR was created for Norway (Table S2.1). This
list is dynamic and as taxonomies and species distribution changes the list should be updated.
The priority list was composed of 204 CWR taxa (Table S2.2) of which 44% were forage and
43% were food. The ‘other’ category contained 13% of taxa that were related to medicinal
taxa, ornamentals, forestry taxa, materials etc. Some taxa were classed in more than one
category of CWR, for example some Brassica L. and Fabaceae L. species.
For the 204 priority CWR taxa 382,605 presence points were collected from GBIF (Table
S2.2). After removal of erroneous data and duplicates 304,461 unique presence points were
used. These were for 201 of the priority CWR as the following three taxa did not have any
presence points in mainland Norway: Rosa inodora Fries, Poa arctica L. subsp. microglumis
Nannf, Festuca rubra L. subsp. megastachys Gaudin. These taxa were recorded within the
Flora of Norway as found on the mainland and were therefore prioritized for immediate
recording and conservation actions. The majority of CWR have not been assessed within the
Norwegian Red List (Kålås et al., 2006), but of those assessed within the checklist at least 55%
are threatened (Table 3.1).

72
Table 3.1: Percentage and number of CWR within the checklist and priority list that have been red
listed assessed and those that have been assessed as threatened in the Norwegian Red List (Kålås et
al., 2006). Threatened categories include critically endangered (CR), endangered (EN) and vulnerable
(VU).
Total number
of taxa
Norwegian Red List
% assessed
(number)
% threatened as CR,
EN, VU (number)
Checklist
(2538) 11% (274) 6% (154)
Priority list
(204) 10% (27) 7% (14)
3.4.2 In situ diversity analysis
The areas with the highest taxa richness were found around Oslo and the south east coast of
Norway, with up to 131 different taxa present (Figure 3.1). The areas with the lowest taxa
richness included the coast around Alesund and the Nordland and Finnmark regions where only
one priority taxon was found. The most taxa rich PAs were those in the Oslo and Østfold
region, Kristiansand and the islands in Vestfold. The PAs that showed the lowest taxa richness
tended to be in Finnmark and Troms (Figure S3.1). The 10 km2 area in the city of Oslo had the
highest number of observations with 1881 (Figure 3.2). Much of mainland Norway had low
numbers of observations, notably in Nordland and Finnmark. The pattern of observations
matched with the pattern of species richness, which was not unsurprising but may have
implications for interpretation of the diversity analysis results.

73
Figure 3.1: Taxa richness of 201 priority CWR in Norway. All grid cells are equivalent to 10
km2 at the equator. Map drawn to geographic coordinate system WGS 1984.

74
Figure 3.2: Sampling bias of observation data obtained from GBIF. All grid cells are
equivalent to 10 km2 at the equator. Map drawn to geographic coordinate system WGS 1984.

75
Complementary reserve analysis using the Complementa tool in CAPFITOGEN produced a
grid cell network of 19 areas (4 x 8 km2) that conserved all 201 priority taxa (Figure 3.3). Of
these 19 grid cells, 13 contained PAs (Table S3.1). Complementary cell one was located in the
county of Oslo and contained 131 taxa. The second complementary cell was found in the Vest-
Agder region and conserved 20 taxa that were different to those found in cell one, with 130
taxa conserved in total. Fifty-four percent (109 taxa) of the priority taxa had five or more
populations within the complementary network (Table S3.2). Within the 19 complementary
grid cells, 18 of 27 ELC zones were conserved (Table S3.1).
76
Figure 3.3: The grid cell complementary network of 19 areas (4 x 8 km2) which conserve 201
priority CWR in Norway. A) Southern Norway, B) Northern Norway. Numbers refer to
priority cell order (number one is higher priority than number two). Letters refer to reserves
with the same number of additional taxa but different numbers of total taxa, with ‘a’ containing
more taxa than ‘b’ etc. Created using the Complementa tool from CAPFITOGEN. Map drawn
to geographic coordinate system WGS 1984.
A
B

77
The PA complementarity analysis (Figure 3.4) identified 23 PAs that conserved 181 taxa (the
remaining 20 taxa are not found within a PA). The top priority PA that conserved 105 (58%)
of the 181 taxa was Kristiansand kommuneskog in the Vest-Agder region (Table S3.3) and
Hardangervidda NP was the second priority reserve, which conserved 21 taxa that were
different to the first reserve, with 101 taxa conserved in total. Fifty percent (91 taxa) of the 181
taxa had more than five populations conserved within the PA complementary network (Table
S3.2). The PA complementary network covered 17 of the 27 ELC zones (Table S3.3) and
conserved an average of 23% of ecogeographic diversity per taxon (Table S3.5).

78
Figure 3.4: The PA complementarity network of 23 reserves (shaded) for 181 priority CWR
taxa in Norway. A) Southern Norway, B) Northern Norway. Numbers refer to priority order
(number one is the first reserve location with the highest number of taxa, number two has the
highest number of additional taxa et.). Letters refer to reserves with the same number of
additional taxa but different numbers of total taxa, with ‘a’ containing more than ‘b’ etc.
Created using the Complementa tool in CAPFITOGEN. Map drawn to geographic coordinate
system WGS 1984.
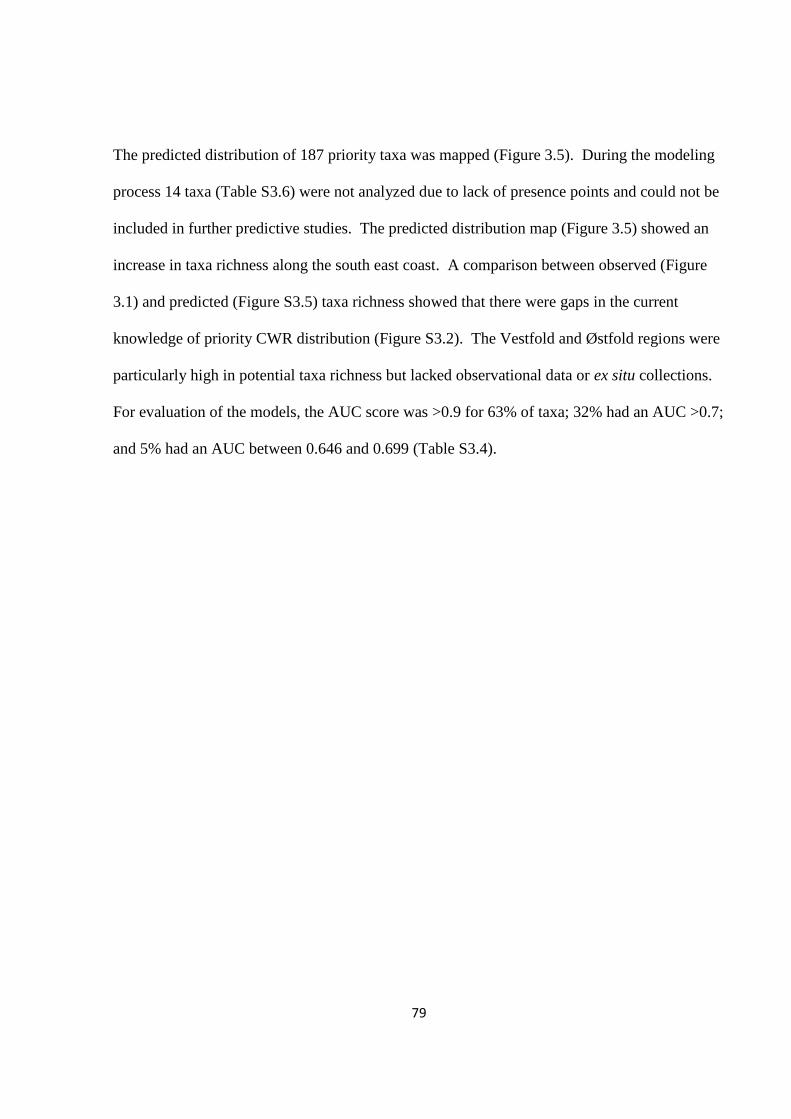
79
The predicted distribution of 187 priority taxa was mapped (Figure 3.5). During the modeling
process 14 taxa (Table S3.6) were not analyzed due to lack of presence points and could not be
included in further predictive studies. The predicted distribution map (Figure 3.5) showed an
increase in taxa richness along the south east coast. A comparison between observed (Figure
3.1) and predicted (Figure S3.5) taxa richness showed that there were gaps in the current
knowledge of priority CWR distribution (Figure S3.2). The Vestfold and Østfold regions were
particularly high in potential taxa richness but lacked observational data or ex situ collections.
For evaluation of the models, the AUC score was >0.9 for 63% of taxa; 32% had an AUC >0.7;
and 5% had an AUC between 0.646 and 0.699 (Table S3.4).

80
Figure 3.5: The predicted distribution of 187 priority CWR in Norway under the current
climatic conditions. Red areas indicate taxon-rich areas with up to 124 taxa found there, and
green areas indicate low taxon richness. All grid cells equal to 4 x 8 km2.
81
There were 34 908 (11%) presence points inside an existing PA with 181 (90%) of the 201
priority CWR found within at least one of 898 different PA in Norway. The remaining 20 taxa
are listed in Table 3.2 and were not located within any protected areas analyzed. From the
predicted distribution maps for the missing taxa, there were nine that were predicted to be in a
PA, although they have not been observed there (Table 3.2). For the remaining taxa there was
not enough data available to produce a predicted distribution map.
Table 3.2: Priority taxa outside PAs according to occurrence data used in this study and those
taxa predicted to be inside PAs.
Taxa outside PA Number of
presence
points
Predicted to be
inside a PA
Allium victorialis L. 12 Yes
Elymus fibrosus(Schrenk) Tzvelev 8 Yes
Festuca baffinensis Polunin 1 n/a
Festuca brachyphylla Schult 1 n/a
Festuca hyperborea Holmen ex Fred 1 n/a
Festuca rubra L. commutata Gaudin 30 yes
Peucedanum ostruthium(L.)
W.D.J.Koch
32 Yes
Poa abbreviata R.Br. 1 n/a
Poa lindebergii Tzvelev 0 n/a
Poa arctica R. Br. Tromsensis Nannf 2 n/a
Poa bulbosa L. 9 n/a
Poa arctica R. Br. caespitans
Simmons ex Nannf.
1 n/a
Rosa balsamica Besser 2 n/a
Rosa corymbifera Borkh. 6 Yes
Rubus dissimulans Lindeb 16 Yes
Rubus fissus Lindl 18 n/a
Rubus norvegicus A.Pedersen 28 n/a
Rubus scissus W.C.R.Watson 24 Yes
Rubus septentrionalis
W.C.R.Watson
12 Yes
Vicia tenuifolia Roth 15 Yes
82
3.4.3 ELC map
The ELC map contained 27 zones based on the eight variables selected (Table S2.3). The
average values within each ELC zone are found in Table S3.6. All ELC zones apart from zone
four were found within the PA network. The average ecogeographic diversity conserved
within the entire PA network per taxon was 48% and the PA complementary network
conserved an average ecogeographic diversity per taxon of 23% (Table S3.5). Two taxa were
not found within any ELC zones (Festuca brachyphylla Schult and Rubus hallandicus (Gabr.
Ex Aresch.) Neuman) due to their area of distribution lacking ecogeographic information at the
scale used here.

83
Figure 3.6: The ELC map for Norway composed of 27 ELC zones each representing a unique
combination of environmental variables. See Table S3.6 for average values in each zone. Zone
0 refers to those areas where information for some of the components making up the map are
missing. Created in CAPFITOGEN using the ELC mapas tool. Cell size is equivalent to 4 x 8
km2 and is drawn to geographic coordinate system WGS 1984.
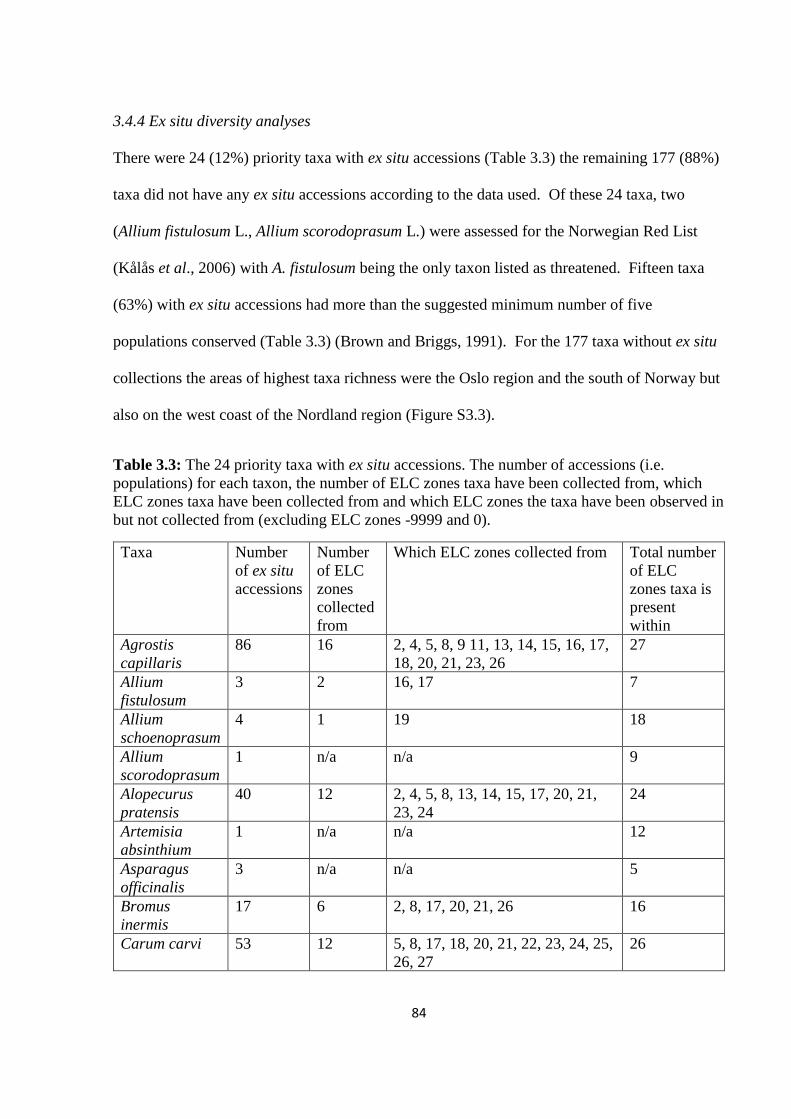
84
3.4.4 Ex situ diversity analyses
There were 24 (12%) priority taxa with ex situ accessions (Table 3.3) the remaining 177 (88%)
taxa did not have any ex situ accessions according to the data used. Of these 24 taxa, two
(Allium fistulosum L., Allium scorodoprasum L.) were assessed for the Norwegian Red List
(Kålås et al., 2006) with A. fistulosum being the only taxon listed as threatened. Fifteen taxa
(63%) with ex situ accessions had more than the suggested minimum number of five
populations conserved (Table 3.3) (Brown and Briggs, 1991). For the 177 taxa without ex situ
collections the areas of highest taxa richness were the Oslo region and the south of Norway but
also on the west coast of the Nordland region (Figure S3.3).
Table 3.3: The 24 priority taxa with ex situ accessions. The number of accessions (i.e.
populations) for each taxon, the number of ELC zones taxa have been collected from, which
ELC zones taxa have been collected from and which ELC zones the taxa have been observed in
but not collected from (excluding ELC zones -9999 and 0).
Taxa Number
of ex situ
accessions
Number
of ELC
zones
collected
from
Which ELC zones collected from Total number
of ELC
zones taxa is
present
within
Agrostis
capillaris
86 16 2, 4, 5, 8, 9 11, 13, 14, 15, 16, 17,
18, 20, 21, 23, 26
27
Allium
fistulosum
3 2 16, 17 7
Allium
schoenoprasum
4 1 19 18
Allium
scorodoprasum
1 n/a n/a 9
Alopecurus
pratensis
40 12 2, 4, 5, 8, 13, 14, 15, 17, 20, 21,
23, 24
24
Artemisia
absinthium
1 n/a n/a 12
Asparagus
officinalis
3 n/a n/a 5
Bromus
inermis
17 6 2, 8, 17, 20, 21, 26 16
Carum carvi 53 12 5, 8, 17, 18, 20, 21, 22, 23, 24, 25,
26, 27
26

85
Cichorium
intybus
1 n/a n/a 9
Dactylis
glomerata
163 18 2, 7, 8, 9, 11, 12, 14, 16, 17, 18,
19, 20, 21, 22, 23, 24, 26, 27
23
Daucus carota 2 1 17 10
Festuca ovina 9 4 2, 8, 9, 17 27
Festuca
pratensis
95 17 2, 4, 5, 8, 9, 14, 16, 17, 18, 20, 21,
22, 23, 24, 25, 26, 27
24
Festuca rubra 115 17 2, 3, 5, 8, 9, 13, 14, 15, 16, 17, 18,
20, 21, 22, 23, 26, 27
27
Lactuca
serriola
1 1 18 6
Lolium
perenne
5 3 8, 9, 16 15
Pastinaca
sativa
1 1 9 8
Phalaris
arundinacea
55 15 1, 2, 8, 9, 11, 12, 16, 17, 18, 19,
20, 21, 23, 25, 26
26
Phleum
pratense
189 21 2, 4, 5, 8, 9, 11, 12, 13, 14, 15, 16,
17, 18, 20, 21, 22, 23, 24, 25, 26,
27
27
Poa pratensis 123 18 2, 4, 5, 7, 8, 9, 11, 12, 13, 14, 15,
17, 18, 20, 21, 22, 23, 26
27
Trifolium
hybridum
13 5 8, 16, 17, 18, 20 24
Trifolium
pratense
88 15 2, 8, 9, 11, 12, 14, 17, 18, 20, 21,
23, 24, 25, 26, 27
26
Trifolium
repens
114 15 2, 8, 9, 11, 14, 15, 17, 18, 19, 20,
21, 22, 23, 24, 26
27
As shown in Figure 3.7, ELC zones three and 19 could be targeted first for ex situ collections
as they contained 14 taxa with the highest priority for collection (class 1). The ELC zone to
target for collection of the highest number of taxa without ex situ accessions was category 17
(Figure S3.4) with 153 taxa present. ELC zones four and ten had the lowest number of taxa (33
and 30 respectively) but should still be targeted for collection to ensure the full ecogeographic
range of populations is conserved.

86
Figure 3.7: The number of taxa and priority level (class one is the highest priority level) for
collecting within the ELC zones, for a total of 23 taxa that currently have ex situ accessions.
(Asparagus only had three ex situ accessions which were located in areas of the ELC map
which did not contain environmental data; therefore in this analysis it was assumed the taxa
had no ex situ collections).
Of the 15 taxa with ex situ accessions and more than five populations conserved, 13 are
conserved in five different ELC zones (Table S3.8). Festuca ovina L. and Lolium perenne L.
only have populations conserved within four and three ELC zones respectively (i.e. 14.8% and
20% of ecogeographic diversity conserved within ex situ accessions).
3.5 Discussion
The interdependence among countries for food supplies and plant genetic resources has long
been acknowledged and is now even more important due to increased homogeneity of staple
human food crops across the world (Flores-Palacios, 1998; Khoury et al., 2014). Therefore,
one of the primary criteria in creating the inventory of 204 CWR for Norway was to take a
global as well as national approach to the selection of priority taxa. Some taxa on the list are
particularly important to Norwegian stakeholders i.e. P. pratense, and Norwegian culture, such
as Arnica montana L. There are also taxa important at regional levels (R. chamaemorus) and at
87
the global scale such as Festuca and Brassica L. species which are important forage, fodder
and food crops.
The criteria used for prioritisation of Norwegian CWR are specific to Norway but include some
commonly cited criteria such as: economic value, presence in Annex 1 of the ITFGRFA and
importance to local and national stakeholders (Iriondo et al., 2016). These criteria are also
common to other national strategies such as Cyprus’ (Phillips et al., 2014) and Finland’s
(Fitzgerald, 2013). Finland’s strategy also used threat status as a criterion for prioritizing CWR
however as agreed with stakeholders this was not used here as threatened taxa are already
conserved by other means in Norway. This highlights the differences that may occur between
countries with respect to prioritising CWR for conservation and that there cannot be one
method that suits all.
All taxa presence points were obtained from GBIF as national stakeholders agreed this was the
most complete source of data for this project. Less than 4% of the occurrence data used was
accurate to two or less decimal places. This data was deemed appropriate to use, along with
the other 96% of data for these analyses, as removal of it would lead to a loss of information
due to elimination of species from the analyses. Other sources of data may complement this
and provide data for the three taxa that did not have any presence points on the mainland but
are included in the Flora of Norway. For these taxa it is a priority to confirm their existence in
situ as should be done for all other taxa to increase the coverage of observational data. The
accuracy of the GIS methods used in this analysis is only as reliable as the input data which
may not have been generated for the purpose of biogeographical studies (Chapman, 2005) and
may be subject to a sampling bias (Araujo & Guisan, 2006; Loiselle et al., 2008). Furthermore,
due to the common nature of CWR they may have been over looked in terms of botanical
recording.

88
The use of MaxEnt in species distribution modelling is now commonplace (Costa et al., 2010;
Ramirez-Villegas et al., 2010; Elith et al., 2011) and it has fared well in evaluations in
comparison to other programmes (Anderson et al., 2006). Species distribution modelling may
produce bias results if the data itself is biased, with MaxEnt being no exception to this (Merow
et al., 2013; Fourcade et al., 2014). Furthermore, MaxEnt uses presence only data which may
add to this bias, therefore any results in this study should be interpreted with this in mind. The
CAPFITOGEN tools have been developed to help strengthen the capabilities of national plant
genetic resource programmes and the use of these tools allowed multiple taxa to be assessed
over a short time frame (Parra-Quijano et al., 2016).
3.5.1 In situ diversity analysis
The Oslo region and the south have a naturally high level of floristic diversity (Nordic Gene
Bank, 2006) due to the limestone bedrock, unique environmental patterns and fertile soils
(Moen, 1998). Therefore, it is not unexpected from our results that this region has a high level
of CWR richness, as many of the priority CWR taxa are thermophilous species which tend to
be concentrated in this region of Norway. However, it is concerning that areas close to the city
contain important populations of CWR as it puts them under threats such as habitat
degradation. It also poses a difficulty for the establishment of genetic reserves, especially
considering climate change and the potential of species distributions to shift (Midgley et al.,
2003; Kelly & Goulden, 2008). The low levels of taxa richness in Northern Norway is due to
the high latitude and environmental conditions such as cooler temperatures and a shorter
growing season which limits growth of all plant taxa, including CWR. The low numbers of
people and difficult terrain may lead to a lack of surveying and hence a lack of knowledge on
the species present which could lead to sampling bias.

89
The predicted taxa richness map (Figure 3.5) could not be created for all taxa due to lack of
data, suggesting these taxa (Table S3.6) will need to be priorities for further surveying. The
predicted distribution map does not account for factors such as land use or taxon dispersal
ability therefore some areas of high or low species richness may be inaccurate. The Vestfold
region is highlighted as an area of potentially high species richness, yet our presence point data
does not show this. Consultation with national experts confirms this region is a hotspot of taxa
richness and should be targeted for surveying and consequent conservation actions. The 10%
of taxa not found within a PA should be targeted for further surveying and ex situ collection.
Populations of all conserved taxa will need to be large enough to meet the levels expected for
successful in situ conservation (see Iriondo et al. (2012)).
The importance of having a network of complementary reserves means that a fully
representative reserve system with maximum efficiency in terms of land and number of
different species can be achieved with minimal costs (Maxted et al., 2008b). Two different
genetic reserve networks are proposed. In terms of the PA complementary network, large PA
such as the Hardangervidda NP (number two priority in Figure 3.4) are highlighted as
priorities. Conservation throughout the whole area is not practical due to its large size (6500
km2), or necessary as taxa will not be distributed throughout the entire area due to inhospitable
environments such as glaciers. The proposed PA complementary network may be more
appropriate for in situ genetic reserve conservation than the proposed grid cell complementary
network of 19 (4 x 8 km2) areas which is not entirely focused upon current PAs. The former
will also avoid the high start-up cost of acquiring land for new reserves and may only require
minimal adjustments to existing management plans (Maxted and Kell, 2009).
From the two different complementary network approaches, there are six sites that overlap
(Table 3.4). These locations may be promising areas to initially target for in situ conservation
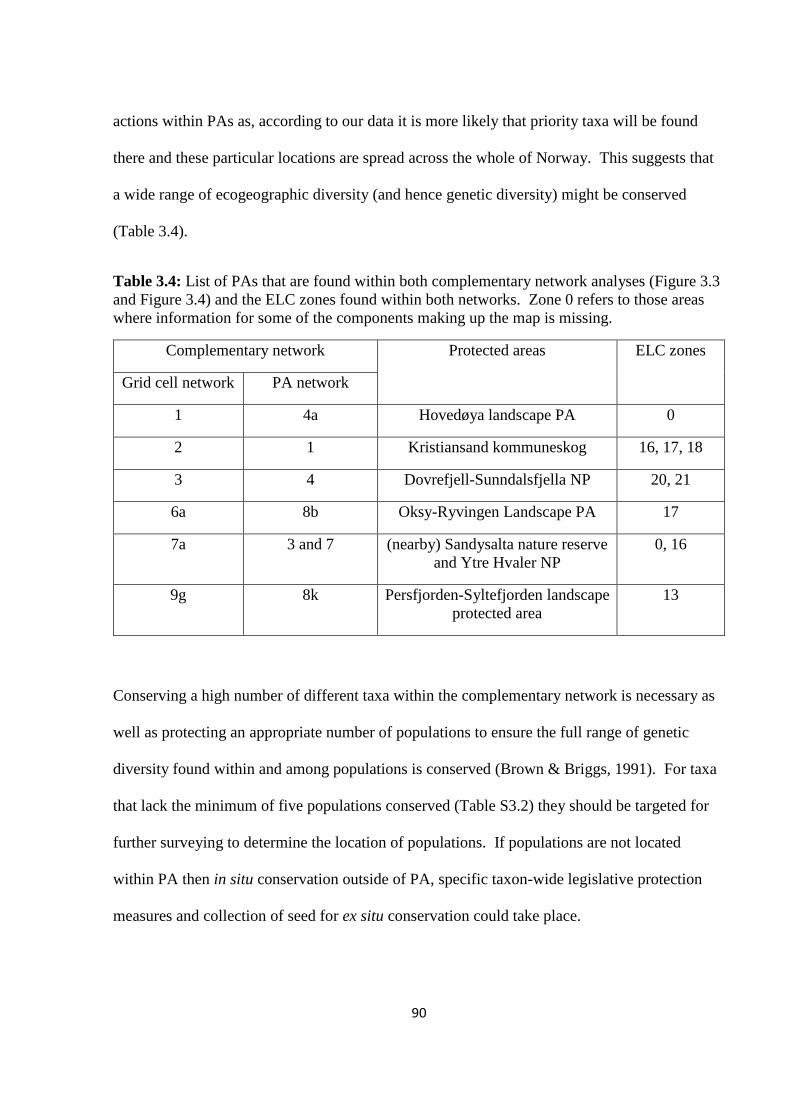
90
actions within PAs as, according to our data it is more likely that priority taxa will be found
there and these particular locations are spread across the whole of Norway. This suggests that
a wide range of ecogeographic diversity (and hence genetic diversity) might be conserved
(Table 3.4).
Table 3.4: List of PAs that are found within both complementary network analyses (Figure 3.3
and Figure 3.4) and the ELC zones found within both networks. Zone 0 refers to those areas
where information for some of the components making up the map is missing.
Complementary network Protected areas ELC zones
Grid cell network PA network
1 4a Hovedøya landscape PA 0
2 1 Kristiansand kommuneskog 16, 17, 18
3 4 Dovrefjell-Sunndalsfjella NP 20, 21
6a 8b Oksy-Ryvingen Landscape PA 17
7a 3 and 7 (nearby) Sandysalta nature reserve
and Ytre Hvaler NP
0, 16
9g 8k Persfjorden-Syltefjorden landscape
protected area
13
Conserving a high number of different taxa within the complementary network is necessary as
well as protecting an appropriate number of populations to ensure the full range of genetic
diversity found within and among populations is conserved (Brown & Briggs, 1991). For taxa
that lack the minimum of five populations conserved (Table S3.2) they should be targeted for
further surveying to determine the location of populations. If populations are not located
within PA then in situ conservation outside of PA, specific taxon-wide legislative protection
measures and collection of seed for ex situ conservation could take place.
91
The PA complementarity network analysis accounts for taxa richness and ecogeographic
diversity that may be used as a proxy for genetic diversity, which is required in the designation
of a CWR genetic reserve (Greene & Hart, 1999; Iriondo et al., 2012; Parra-Quijano et al.,
2012a). For taxa with narrow distributions such as Poa lindebergii Tzvelev, 100% of
ecogeographic diversity is conserved within the PA complementary network, whereas for a
common species with a wide distribution such as Deschampsia flexuosa (L.) Trin, 59% of
ecogeographic diversity is conserved. Vicia pisiformis L. has no ecogeographic diversity
conserved within the PA complementary network yet 100% of its ecogeographic diversity is
conserved within the entire PA network (Table S3.5). This means that for some taxa the
complementary network is not appropriate for conserving the full range of ecogeographic
diversity. There may be a need for in situ species specific conservation strategies within
Norway. Furthermore, there will need to be genetic diversity studies upon priority taxa to
determine the correlation with ecogeographic diversity and to inform specific management
strategies for populations.
Although PAs offer formal protection of species they may not be appropriate for all taxa in all
environments. CWR tend to be associated with pre-climax communities and areas
experiencing anthropomorphic change, such as field margins and road verges (Maxted & Kell,
2009; Jarvis et al., 2015), habitats which tend to be more common outside of PA. In Norway,
many of the PAs were set up to conserve unique environmental features such as glaciers or
fjords. Along with CWR populations near cities, common habitats may need less formal
conservation strategies that heavily involve local stakeholders and land owners. The need for
conservation outside of PAs may become increasingly important due to the effects of climate
change which is predicted to have a significant impact on the Arctic flora (McCarthy et al.,
2001; Arctic Climate Impact Assessment, 2004). Protection of the most appropriate CWR

92
populations (MAWPs; Maxted et al., 2015) may be a complementary approach that should be
taken for these taxa outside PAs. This will allow prioritization of the most valuable
populations whether inside or outside a PA which could then, for example, be protected via
separate legislation. The grid cell complementary network of 19 areas (Figure 3.3) could also
be used to locate important populations outside of the reserve network which could
complement those conserved within the proposed PA complementary network (Figure 3.4).
3.5.2 Ex situ diversity analysis
Ex situ accessions are considered a backup and complementary source of material which
should be representative of populations in situ (Maxted & Kell, 2008). This material should be
made available to plant pre-breeders and breeders for use in crop improvement which is
becoming increasingly important due to climate change. The gaps in the ex situ accessions for
the 201 priority CWR should be prioritized for immediate collection. The locations for
collecting may be based upon the taxa richness map (Figure S3.3) so a large number of taxa
can be collected in minimal visits. However, to collect the genetic diversity of taxa it would be
more appropriate to collect taxa from different ELC zones to ensure the full range of genetic
diversity is conserved (Figure S3.4 and Table S3.8). Priority ELC zones could initially be
those with high numbers of taxa richness for the missing ex situ accessions, such as category 17
which is predominantly distributed throughout the south east of Norway (Figure 3.6). This
collecting methodology was shown by Parra-Quijano et al. (2012c) to be an efficient method
for improving the representativeness of ex situ collections. Furthermore, to expand on this, the
use of the Representa tool in CAPFITOGEN enables the targeting of ELC zones with the
highest number of high priority taxa (Figure 3.7; Parra-Quijano et al., 2016). By guaranteeing
that a minimum number of five populations (Brown and Briggs, 1991) are conserved per

93
ecogeographic zone for each taxon, we ensure that the full range of naturally occurring genetic
diversity is conserved both within and between populations in ELC zones.
The following are conservation recommendations from this scientific assessment for in situ and
ex situ conservation of 204 priority CWR within Norway:
3.5.3 In situ conservation priorities:
• Target the three taxa without presence point records for immediate surveying efforts (R.
inodora, P. arctica subsp microglumis, F. rubra subsp megastachys).
• Assess the suitability of the six locations (Table 3.4) that overlap between the
complementarity analyses to become a CWR genetic reserve network. They should
include active in situ management and monitoring with subsequent establishment of
CWR genetic reserves according to Iriondo et al. (2012).
• Use the grid cell complementary network (Figure 3.3) to target locations for
conservation of CWR populations outside of PA.
• For the taxa found outside of PA (Table 3.2) increase surveying efforts to determine if
this is accurate. If so, conserve populations outside of PA, by creating a new PA if
appropriate and collect for ex situ conservation.
• Target the 90 taxa with less than five populations conserved within the PA
complementary network (Table S3.2), for further surveying.
• In situ conservation priorities should target areas that are gaps in taxa distribution data
for immediate surveying, such as Vestfold and Østfold regions (Figure S3.2).
3.5.4 Ex situ conservation priorities:

94
• Collect the 177 taxa without ex situ accessions. Figure S3.3 can be used to target
locations with high taxa richness for collecting and Figure S3.4 should be used to target
those ELC zones with the highest number of taxa. Table S3.8 should be used to ensure
the full range of ecogeographic diversity, with a minimum of five different ELC zones
are collected (where possible) and/or a minimum of five populations targeted.
• Ensure those 24 taxa with ex situ accessions have collections made from the full range
of ecogeographic diversity, with a minimum of five populations within each ELC zone
conserved where possible.
• All ex situ material should be duplicated as appropriate in national and/or regional
genebanks and a backup of material should be stored in the Svalbard Global Seed
Vault. Accessions should be regenerated as appropriate to ensure germination rates are
kept at correct levels. Accessions should be made available to plant pre-breeders and
breeders in accordance with the ITPGRFA so that the genetic diversity can be
harnessed for crop improvement.
Update and review the priority list of CWR and conservation recommendations every five
years or as deemed appropriate.
3.6 Conclusion
This study provides recommendations for in situ and ex situ conservation of 204 priority CWR
within Norway. The outcomes should be regarded as provisional and interim and therefore can
and should be updated when additional data and knowledge becomes available. There is an
intrinsic link between both in situ and ex situ conservation activities proposed and neither can
be done without the other, this is even more important due to climate change and the potential
95
of populations to move or become extinct. Furthermore, cooperation with local stakeholders
such as landowners, PA managers, plant breeders and policy makers is essential at all levels.
Both the priority taxa and the methodology used are applicable at regional and global scales
with the recommendations not only helping Norway to meet its international obligations for
conservation of genetic diversity of CWR but also ensuring this genetic diversity is available
for use in tackling global food security.
96
CHAPTER 4.
Climate change and national crop wild relative conservation
planning
The work presented in this chapter has been published in Ambio.
(Phillips, J., Brehm, J. M., Van Oort, B., Asdal, Å., Rasmussen, M. & Maxted, N. 2017. Climate change and
national crop wild relative conservation planning. Ambio, 1-14)
Jade Phillips, Joana Magos Brehm, Bob van Oort, Åsmund Asdal, Morten
Rasmussen and Nigel Maxted
Author contributions:
Conceived and designed the study: J.P., J.M.B.
Data collation and preparation: J.P.
Performed analysis: J.P.
Interpreted results: J.P., J.M.B., B.O.
Wrote the paper: J.P.
Critically reviewed the paper: J.P., J.M.B., B.O., A.A., M.R., N.M.

97
4.1. Abstract
Climate change is likely to be one of the principal factors affecting our future food security. To
mitigate negative impacts, we will require our crops to be more genetically diverse. Such
diversity is available in CWR, the wild taxa relatively closely related to crops and from which
diverse traits can be transferred to the crop. Conservation of such genetic resources resides
within the nation where they are found; therefore national-level conservation recommendations
are fundamental to global food security. We investigate the potential impact of climate change
on CWR richness in Norway. The consequences of a 1.5°C and 3.0˚C temperature rise was
studied for the years 2030, 2050, 2070, 2080 and then compared to the present climate. The
results indicate a pattern of shifting CWR richness from the south to the north, with increases
in taxa turnover and in the numbers of threatened taxa. Recommendations for in situ and ex
situ conservation actions over the short and long term for the priority CWR in Norway are
presented. The methods and recommendations developed here can be applied within other
nations and at regional and global levels to improve the effectiveness of conservation actions
and help ensure global food security.
4.2 Introduction
Many regions throughout the world are projected to experience climate change-induced
reductions in crop yields and additional associated challenges are mounting (e.g. pests, water
supply, and soil degradation) (Müller & Robertson, 2014; Rosenzweig et al., 2014). The IPCC
(2014) predicts that in the short-term (2016 to 2035) the global mean surface temperature
change is expected to be between 0.3-0.7˚C with the highest prediction set at 4.8˚C for the year
2100. At the Paris climate change conference (UNFCCC, 2016) a global action plan to limit
warming to below 2.0˚C increase was agreed. To help achieve this target Intended Nationally
98
Determined Contributions (INDCs) were submitted by individual countries and if followed are
predicted to limit global warming to approximately a 3.0˚C temperature increase (UNFCCC,
2015). While some locations may see crop yield increases (Olesen & Bindi, 2002; Uleberg et
al., 2014), the global average negative effects of climate change on many aspects of food
security (McCarthy et al., 2001) and the interdependence of most countries on imports and
exports of food (FAO, 2009a) mean it is becoming increasingly important to make our crops
more climate resilient.
CWR are a key resource in meeting this challenge as they are often found in a wide range of
habitats, under variable environmental conditions. They are wild taxa closely related to our
cultivated crops and, as such, tend to contain higher levels of genetic diversity (Tanksley &
McCouch, 1997; Buckler et al., 2001; Maxted & Kell, 2009). The value of CWR in climate
change adaptation is highlighted in a report by the FAO (2015) who recommend consolidating
collections of wild species, including CWR, because of an increased adaptive capacity inherent
in a greater genetic diversity, and the need to adapt agriculture to climate change. Some
examples of the use of CWR in cultivar development include the transfer of cold tolerance
from wild Malus baccata (L.) Borkh. to M. domestica Borkh. (Cummins & Aldwinckle, 1979)
and the improvement of drought tolerance in cultivated barley from wild barley (Hordeum
vulgare L. subsp. spontaneum (K. Koch) Thell. (Lakew et al., 2011; see Maxted & Kell (2009)
for more examples). Furthermore, the Second Global Plan of Action for Plant Genetic
Resources for Food and Agriculture (2011) stresses the importance of expanding the
programme on ex situ conservation to ensure maintenance of diversity of species including
those that are adapted to extreme conditions and from those areas expected to be highly
affected by climate change. The report also places emphasis on in situ conservation of

99
genetically diverse populations to allow evolution and thus permit the continued generation of
adaptive traits.
Specific studies on CWR have confirmed that they might be negatively affected by climatic
change, with a high proportion of the species studied losing over 50% of their range size by
2055 (Jarvis et al., 2008). Broader-scale studies on terrestrial species have identified trends for
distribution shifts to higher latitudes and elevations (Thomas et al., 2012) as well as increasing
IUCN threat level due to climate change (Thuiller et al., 2008). However, few if any, studies
have been done at a national level regarding the effects of climate change on the distribution of
CWR. Norway is particularly interesting in respect of climate change effects upon species
distribution as it is located on the periphery of Europe with the mainland stretching, from south
to north, from 50° N to 71° N as well as having notable north-south and east-west climate
gradients (Norwegian Ministry for Agriculture and Food, 2008). At northern latitudes surface
temperature and precipitation are expected to increase (Solomon, 2007), with the arctic
warming at a faster rate than the global average (Arctic Climate Impact Assessment, 2004).
Initially, these changes may increase crop yields at high latitudes (Olesen & Bindi, 2002), due
to an extension of the growing season, possibly up to 1-3 months (Hanssen-Bauer et al., 2009).
These effects of climate change will have important consequences for northern flora with areas
potentially experiencing an increase in species diversity (Sætersdal et al., 1998) but some
species populations may become restricted at their northern limit. Furthermore, currently well-
adapted northern species may be increasingly challenged by rising incidences of new pests and
diseases.
Recommendations were recently identified for the in situ and ex situ conservation of CWR at
the national level within Norway (Phillips et al., 2016). That study pinpointed 204 priority
CWR of which 44% were forage taxa, 43% were food taxa and 13% were ‘other’ taxa such as

100
medicinal or forestry species (Phillips et al., 2016). The Norwegian priority taxa are important
from the global to the national level, due to their economic value, presence within the
ITPGRFA (FAO, 2001; www.planttreaty.org) importance to Norwegian research and/or within
the Harlan and de Wet inventory of 173 globally important crops (Vincent et al., 2013). To
determine actions required to mitigate the negative effects of climate change, species
distribution models (SDM), which use environmental data to identify taxon-specific ecological
niches (Phillips et al., 2004; Phillips et al., 2006) that may be suitable for populations to persist
in, can be utilised. However, SDM assume that nature is static or on a linear path of change,
often ignoring fecundity, dispersal, soil specificity and preference (Midgley et al., 2003) and it
is therefore necessary to use the results with caution. Here we aim to contribute towards the
knowledge base on climate-smart conservation planning for CWR conservation by developing
methods to identify priority taxa and genetic diversity that may be under threat. Due to climate
change it will be important to consider both incremental (adjustments made enabling the
continuation of current practices) and transformational (fundamental changes in conservation
practices) (Walker et al., 2004; Nelson et al., 2007; Stafford Smith et al., 2011) adaptation
plans to ensure long term flexibility and effectiveness of conservation strategies. The current
PA system throughout the globe (including NPs and nature reserves) is static (Peters & Myers,
1991), often severely restricted in the future potential for expansion and may not have been
established with the future effects of climate change in mind. In addition it is highly likely that
the rate of climate change will exceed the potential of populations to track climate by natural
migration and adaptation (Midgley et al., 2003; Jump & Penuelas, 2005), therefore increasing
the need for ex situ conservation. Both in situ and ex situ conservation recommendations are
made to ensure that this diversity is available for use by plant pre-breeders to help develop
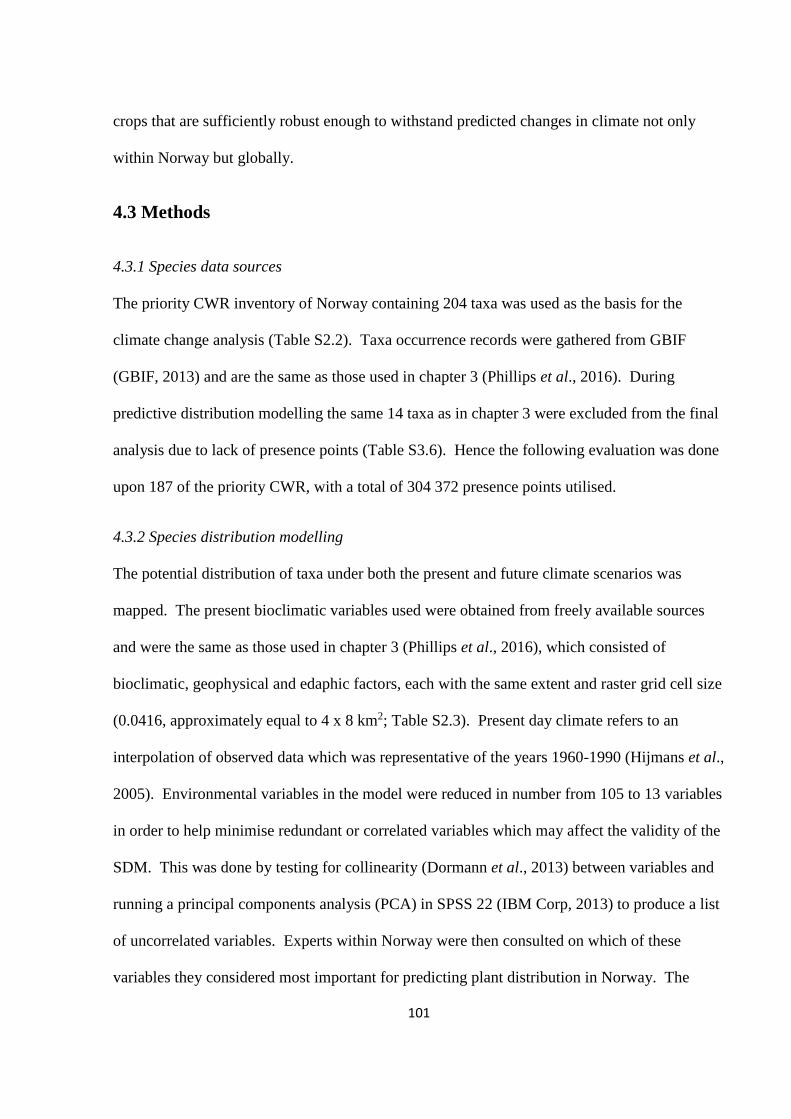
101
crops that are sufficiently robust enough to withstand predicted changes in climate not only
within Norway but globally.
4.3 Methods
4.3.1 Species data sources
The priority CWR inventory of Norway containing 204 taxa was used as the basis for the
climate change analysis (Table S2.2). Taxa occurrence records were gathered from GBIF
(GBIF, 2013) and are the same as those used in chapter 3 (Phillips et al., 2016). During
predictive distribution modelling the same 14 taxa as in chapter 3 were excluded from the final
analysis due to lack of presence points (Table S3.6). Hence the following evaluation was done
upon 187 of the priority CWR, with a total of 304 372 presence points utilised.
4.3.2 Species distribution modelling
The potential distribution of taxa under both the present and future climate scenarios was
mapped. The present bioclimatic variables used were obtained from freely available sources
and were the same as those used in chapter 3 (Phillips et al., 2016), which consisted of
bioclimatic, geophysical and edaphic factors, each with the same extent and raster grid cell size
(0.0416, approximately equal to 4 x 8 km2; Table S2.3). Present day climate refers to an
interpolation of observed data which was representative of the years 1960-1990 (Hijmans et al.,
2005). Environmental variables in the model were reduced in number from 105 to 13 variables
in order to help minimise redundant or correlated variables which may affect the validity of the
SDM. This was done by testing for collinearity (Dormann et al., 2013) between variables and
running a principal components analysis (PCA) in SPSS 22 (IBM Corp, 2013) to produce a list
of uncorrelated variables. Experts within Norway were then consulted on which of these
variables they considered most important for predicting plant distribution in Norway. The

102
maximum entropy (MaxEnt) algorithm (Phillips et al., 2004; et al2006) was used to model the
potential distributions for each priority taxon individually under both present and future
bioclimatic variables (see chapter 3, Phillips et al. (2016) for MaxEnt settings). MaxEnt has
been used robustly for predictions of climate modelling (Ramirez-Villegas et al., 2010; Warren
et al., 2013) and has performed well in comparison tests with similar programs (Anderson et
al., 2006; Elith et al., 2011).
The future bioclimatic variable data was obtained for the climatic variables only, as edaphic
and geophysical variables were unlikely to change with climate change. The climatic variables
used were: isothermality, maximum temperature of warmest month, minimum temperature of
coldest month, annual precipitation and precipitation seasonality (Table S2.3). These data were
gathered from CCAFS (www.ccafs-climate.org/data/) where climate data was available from
numerous models and scenarios based upon the most recent IPCC report (IPCC, 2014). The
Norwegian Earth System Model, NorESM1-M (Bentsen et al., 2013), which was based upon
the Community Climate System Model version 4 (CCSM4; Gent et al., 2011), was used due to
its specificity to climatic processes that are particularly important at northern latitudes (Bentsen
et al., 2013). These models were driven by the two relative concentration pathway scenarios
(RCP 2.6, RCP 6.0), representative of the potential future variability and pathways of
greenhouse gas emissions (Prather et al., 2013). RCP 2.6 was used in this study as it represents
the agreed maximum temperature rise set out by the Paris agreement (1.5˚C) (Rogelj et al.,
2012; UNFCCC, 2016). RCP 6.0 represents the more likely development from the
implementation of global INDC proposals of a 2.5-3.5˚C temperature increase by 2100 (Rogelj
et al., 2012; UNFCCC, 2015). Analysis was undertaken for the years 2030, 2050, 2070, 2080
and compared to the present to allow visualization of the long-term pattern of distribution
change of CWR.

103
Evaluation of the models’ accuracy was done using two validation metrics suggested by
Ramirez-Villegas et al. (2010), the Area under the ROC Curve of the test data (AUCTest) and
standard deviation of the AUCTest data (STAUC) for each taxon. Models with an AUCTest > 0.7
and STAUC < 0.15 are considered accurate and stable (Ramirez-Villegas et al., 2010).
4.3.3 Species richness, turnover and threat level
To determine the potential impacts of climate change upon the priority taxa they were assessed
under unlimited migration, with populations able to move to where the climate is suitable, and
no-migration scenarios, where populations cannot move from their present distribution, with
the reality being that species will likely fall between these extremes (Higgins et al., 2003).
Outcomes were analysed in ArcMap 10.2 (ESRI, 2011) using Python scripting to automate and
streamline the process.
Species richness was calculated under unlimited migration for the 187 taxa using DIVA-GIS
(Hijmans et al., 2004) and Spatial Analyst tools in Arc Map 10.2, for present and future climate
scenarios. The broad patterns of species richness throughout Norway were compared among
the years studied. Change in taxon richness was studied under unlimited migration by
comparing future with present potential taxon distributions, which allowed patterns in the
direction of taxon distributional changes to be analysed.
Species loss and gain were assessed by the number of species found per grid cell and compared
to the current species richness per grid cell for both unlimited and no-migration scenarios. The
turnover rate (T) was then calculated for the unlimited-migration scenario following Thuiller et
al. (2005):

104
T= 100 X (L+G)
(SR+G)
where SR was the current species richness, L was loss of taxa per grid cell and G was gain of
taxa per grid cell. Turnover rate was calculated for both RCP scenarios per study year.
Turnover was determined for mainland Norway (32241 grid cells), which excluded Jan Mayen
and Svalbard.
To determine the extent of taxon range we compared the number of grid cells where a taxon
was present under both no-migration and unlimited-migration and present and future climatic
scenarios. The level of threat for the priority taxa was then assessed using the IUCN Red List
criterion A3(c) (IUCN, 2001). This used the projected geographic range loss of a taxon as a
proxy for population reduction to assign a threat category by the following parameters: Extinct
(EX) is a taxon with a projected range loss of 100 %, Critically Endangered (CR) with a
projected range loss of >80%, Endangered (EN) with a range loss of >50% and Vulnerable (V)
with a range loss of >30% (IUCN, 2001). The remaining taxa were considered Least Concern
(LC) in terms of climate change impacts.
4.4 Results
The potential effects of climate change showed a change in distribution for 187 priority CWR
in Norway. Under the unlimited-migration scenario, taxon-richness increased across Norway
from a predicted richness of 124 taxa under the current climate (Figure 3.5) to a maximum of
150 taxa in the most taxon-rich areas for some of the scenarios (Figure 4.1, 4.2). Taxa tended
to spread from the south east of Norway towards the west and the north with the mountainous
regions preventing further westward dispersal. Taxon richness also increased from the west

105
coast and moved both eastwards and northwards, with the RCP 6.0 scenarios showing a larger
area of Norway with increased taxon richness. This pattern of distribution change was
reflected in Figure S4.1 and Figure S4.2, where gain in taxon richness tended to increase
further northwards under both RCP scenarios, from the year 2030 to 2080. There was also a
slight loss of taxon richness in the south east, which was more apparent in the RCP 6.0
scenarios, although this region was still the area with highest taxon richness overall.

106
Figure 4.1: The average predicted taxon richness of 187 priority CWR in Norway under RCP
2.6 for the years a) 2030, b) 2050, c) 2070, d) 2080. Raster grid cell size 0.0416, approximately
equal to 4 x 8 km2.

107
Figure 4.2: The average predicted taxon richness of 187 priority CWR in Norway under RCP
6.0 for the years a) 2030, b) 2050, c) 2070, d) 2080. Raster grid cell size 0.0416, approximately
equal to 4 x 8 km2.

108
The pattern of taxon turnover also reflected this distribution change (Figure 4.3, 4.4). From
2030 to 2080, under unlimited migration and RCP 2.6, the percentage turnover rate of taxa per
pixel increased, from 29% to 68% (Table S4.1). Under RCP 6.0 turnover of taxa per pixel
increased from 50% to 72% (Table S4.1). The area of Norway with a turnover of 100% tended
to increase from 2030 to 2080, with the south east and southern coast maintaining a low
turnover rate and a large proportion of the mainland showing an increased turnover rate (Figure
4.3, 4.4).
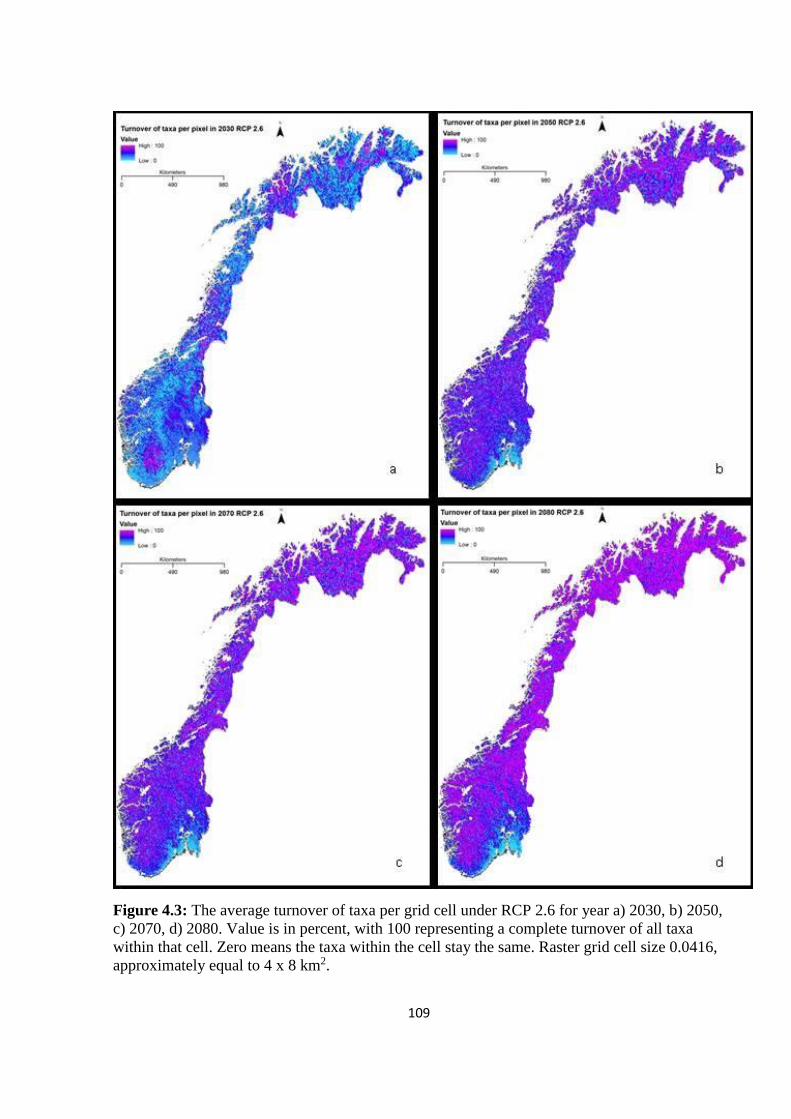
109
Figure 4.3: The average turnover of taxa per grid cell under RCP 2.6 for year a) 2030, b) 2050,
c) 2070, d) 2080. Value is in percent, with 100 representing a complete turnover of all taxa
within that cell. Zero means the taxa within the cell stay the same. Raster grid cell size 0.0416,
approximately equal to 4 x 8 km2.

110
Figure 4.4: The average turnover of taxa per grid cell under RCP 6.0 for year a) 2030, b) 2050,
c) 2070, d) 2080. Value is in percent with 100 representing a complete turnover of all taxa
within that cell. Zero means the taxa within the cell stay the same. Raster grid cell size,
approximately equal to 4 x 8 km2.

111
Climate change affected individual taxa under both unlimited-migration and no-migration
scenarios from the year 2030 to 2080. Under no migration, the number of taxa that lost area
decreased under both RCP scenarios from the year 2030 to 2080 (Figure 4.5). For unlimited
migration, the number of taxa that lost area under RCP 2.6 reduced from 25% in 2030 to 12%
in 2080, whereas under RCP 6.0 the number of taxa that lost area increased from 11% to 13%
(Figure 4.5). Under unlimited migration, there was an increase in the number of taxa gaining
area under RCP 2.6 but a decrease in the number of taxa gaining area in RCP 6.0 from 2030 to
2080 (Figure 4.6). Under no migration, none of the taxa gained area as they cannot expand
their distribution, only lose area or maintain their current distribution.
Figure 4.5: Percentage of taxa that lose area. Modelled under unlimited migration and no-
migration scenarios and RCP 2.6 and RCP 6.0.
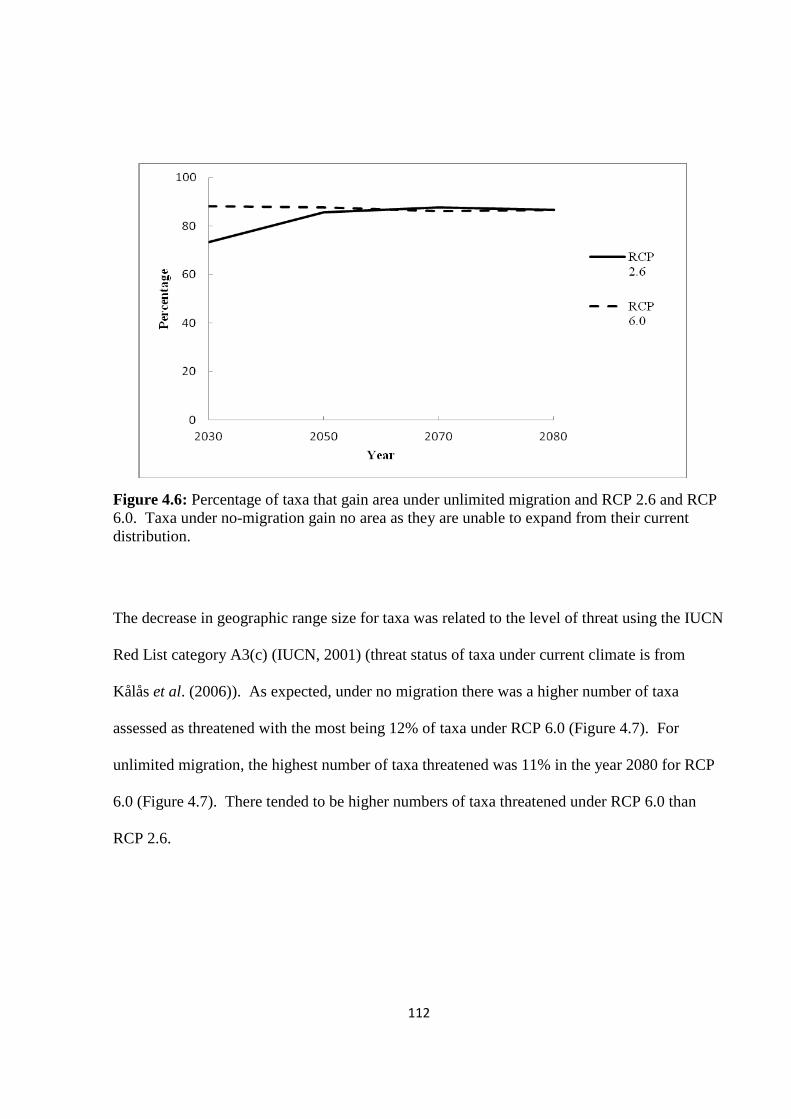
112
Figure 4.6: Percentage of taxa that gain area under unlimited migration and RCP 2.6 and RCP
6.0. Taxa under no-migration gain no area as they are unable to expand from their current
distribution.
The decrease in geographic range size for taxa was related to the level of threat using the IUCN
Red List category A3(c) (IUCN, 2001) (threat status of taxa under current climate is from
Kålås et al. (2006)). As expected, under no migration there was a higher number of taxa
assessed as threatened with the most being 12% of taxa under RCP 6.0 (Figure 4.7). For
unlimited migration, the highest number of taxa threatened was 11% in the year 2080 for RCP
6.0 (Figure 4.7). There tended to be higher numbers of taxa threatened under RCP 6.0 than
RCP 2.6.

113
Figure 4.7: The predicted number of threatened taxa as determined by the IUCN category
A3(c). For the full list of threatened taxa see Table S4.2.
Fourteen taxa have been assessed as threatened under current climatic conditions, with data for
further predictive modelling lacking for four taxa and fifteen taxa assessed as not threatened in
the future, according to this study (Table S4.2). Under both migration scenarios the severity of
threat to the taxa tended to increase along with the number of threatened taxa. The number of
Critically Endangered (CR) and Extinct (EX) taxa tended to increase (Figure 4.8) from 2030 to
2080 under both RCP scenarios. Furthermore, Alopecurus pratensis L. subsp alpestris
(Wahlenb.) Selander is predicted to go extinct in 2070 if there is no migration and in 2080 if
there is unlimited migration (Table S4.2). Thirty-one taxa were assessed as threatened under
the predicted climate change scenarios (Table S4.2).

114
Figure 4.8: The number of taxa threatened per year under a) no-migration and b) unlimited
migration for RCP 2.6 and RCP 6.0 (diagonal line bars), as determined by the area lost based
upon IUCN criterion A3(c).
a
b

115
For evaluation of the models’ performance, 93% of the SDM for each species had an AUC >
0.7 (average), 7% had an AUC > 0.5. All models had STAUC < 0.15 apart from one taxon
which had STAUC 0.1506 (Fragaria ananassa Duchesne) (Table S3.4).
4.5 Discussion
The climate change analysis of the priority CWR for Norway shows a trend of increasing CWR
richness under both RCP scenarios, from the present to the year 2080. Taxon richness appears
to spread from present areas of richness in the south east, to the inland regions of Norway and
northwards. This suggests that current limiting factors to plant growth in the north, such as all-
year-round low temperatures (Olesen & Bindi, 2002) and others are expected to become less
pronounced as the climate changes, leading to an increase in taxon richness. This is supported
by Sætersdal et al. (1998) and Parmesan and Yohe (2003), who find that in the northern
hemisphere temperate regions during cold periods, the geographic ranges of most species are
restricted to one or a few refugia in the south and with subsequent warming each species
expands its range with increasing species richness, mainly northward. This may also be
associated with a gradual lengthening of the growing season in the north due to increasing
temperatures, as well as increasing shrub abundance in the arctic (Tømmervik et al., 2004).
This could be positive for farmers, who may be able to extend and increase the production of
food and forage within Norway, thereby improving food security at national level.
Furthermore, the CWR populations that successfully migrate or adapt with climate change may
be key in aiding farmers to adapt their crops to future climatic changes. Leading-edge
populations (in this case, those populations spreading northwards) are expected to be stable or
increasing (Nekola, 1999) and show positive demographic rates (Foden et al., 2009). This is
compared to trailing-edge populations, which often have reduced genetic variation (Lesica &
Allendorf, 1995). Furthermore, the diversity found at the leading and trailing edges may be
116
unique (Hampe & Petit, 2005) and could help underpin efforts of plant breeders to develop
varieties adapted to new conditions (Jarvis et al., 2008).
When this pattern of shifting distributions is compared with the turnover of taxa per grid cell,
locations in the south tend to maintain low levels of taxon turnover. This suggests that species
composition in the south may remain stable in comparison with much of the mainland, where
the turnover rate increases. However, it is important to note the study does not model species
that may move into Norway from the south and east, but it should be expected that such taxa
will, provided they can reach the region (Henningsson & Alerstam, 2005; Huntley et al., 2008;
Hof et al., 2012), and monitoring of such changes should be undertaken. A high turnover rate
isseen in Thuiller et al. (2005), who show that the Boreal region (which covers southeast
Norway) and southern Fennoscandia (which incorporates southern Norway) could in principal
gain many species from further south. There appears to be a larger change in the turnover of
taxa per grid cell under the lower temperature increase of RCP 2.6 (29% to 68%), than RCP 6.0
(50% to 72%), perhaps suggesting that the 1.5˚C rise in temperature is more favourable to the
priority CWR taxa than a 3.0˚C increase.
This high turnover rate and change in taxon richness is important for how CWR populations
may be conserved in Norway. With such a dynamic change in taxa distribution predicted and
the expectation that the effects of climate change will be felt sooner (Stafford Smith et al.,
2011) it will be necessary to create flexible conservation strategies for CWR. This will mean
using both in situ and ex situ conservation actions for specific taxa as well as at larger multi-
taxa conservation scales. In terms of in situ conservation, the current PA network in Norway
encompasses large areas with unique landscape conservation value, such as mountain plateaus
which are often dominated by climax communities that do not tend to support CWR diversity
(Jarvis et al., 2015). These reserves may require incremental changes in management
117
strategies, such as increased levels of species monitoring to account for new CWR taxa that are
predicted to spread into the reserves. However, multiple authors suggest that new reserves may
be needed to purposely account for climate change impacts (Sætersdal et al., 1998,; Araújo et
al., 2004). This would require transformative management actions such as clustering reserves
in areas of temporal overlap (Araújo et al., 2004), creating reserves in hotspots of future
diversity (Heller & Zavaleta, 2009), conserving the ‘core’ of populations (Araújo et al., 2004)
and improving connectivity between reserves by creating corridors so species can migrate
(Halpin, 1997). Corridors and areas outside of formal PAs are important for CWRs (Jarvis et
al., 2015) as many are common taxa with wide distributions (for example Trifolium sp.,
Phleum sp., Rubus sp.). For widespread taxa with well-connected populations a reduction of
genetic diversity within populations is likely to contribute to population extinctions but is less
likely to threaten the existence of the species (Jump and Penuelas, 2005). Corridors could be
considered a short-term, incremental change, as connecting reserves could be flexible in their
design and management for the protection for CWR outside of formal PAs, an approach
suggested as critical in the face of climate change (Franklin et al., 1992; Lovejoy, 2005;
Thomas et al., 2012). Close cooperation with landowners and relevant stakeholders would be
essential if these situations were to arise. All CWR populations will benefit from an in situ
conservation approach as it allows continued evolution of traits that may be required in the
future. For all priority taxa but particularly for those predicted to lose many populations, ex
situ conservation will be a complementary tool to aid conservation actions.
Ex situ conservation will be a vital tool for the conservation of CWRs in Norway. If CWR
populations are monitored and changes in genetic diversity and/or population size are identified
(i.e. a reduction below 5000 individuals per population as the minimum number recommended
by Iriondo et al. (2012)), then collecting of seeds from these populations could be undertaken.
118
Taxa could be prioritized for ex situ conservation based upon their predicted level of threat
using the IUCN criteria. For example, Alopecurus pratensis subsp. alpestris (Table S4.2),
which is predicted to become extinct, could benefit from immediate collecting of seeds with
regeneration and translocation of populations also a possibility, meaning a more
transformational management plan will be required. The taxa that are predicted to lose area but
not become threatened will require monitoring and collecting of seeds incrementally, perhaps
on a less frequent timescale, when negative impacts are identified. It will also be necessary to
ensure that a range of genetic diversity is collected, perhaps targeting ecogeographically
diverse populations by using an ELC map, as done by Phillips et al. (2016). As well as
protecting threatened populations, ex situ conservation will ensure that the genetic material is
available for use by plant pre-breeders to adapt our crops to climate change.
The IUCN methodology used in this study only takes into account one red list criterion (A3(c)),
which assesses the population size reduction, for which we have used the percentage of area
lost as a proxy, following Thuiller et al. (2012). The use of the change in distribution extent as
a proxy for population changes is an allowable assumption according to the IUCN. However,
considerations such as whether the size of habitat patches can support viable populations must
also be taken into account (Foden & Young, 2016). An alternative to this method may be to use
the framework suggested by Foden et al. (2013;et al2016) for assessing three different
dimensions of climate change vulnerability of populations. This will aid in a more taxon-
specific management strategy allowing effective conservation of threatened populations.
Adaptation of populations as well as migration will be crucial for survival of CWRs in situ in
the long-term. There is little evidence that adaptation alone will be able to keep pace with
climatic changes (Jump & Penuelas, 2005; Thuiller et al., 2008). Furthermore, climate change
is also expected to exceed the potential of populations to track climate by migration (Midgley

119
et al., 2003). Uncertainty surrounding the capacity of populations to adapt or migrate in
response to climate change strengthens the need to apply both in situ and ex situ, as well as
incremental and transformational conservation strategies to CWR in Norway. As well as
uncertainties in how the taxa will respond there are uncertainties associated with the methods
used to create the predictions. The models used in this study do not account for the soil or
other habitat conditions that may remain unfavourable for the CWR taxa. It is also likely that
the presence points used do not reflect the entire geographic range of the CWRs and may be
subject to sampling bias (Araujo & Guisan, 2006; Loiselle et al., 2008). Maldonado et al.
(2015) found that often diversity patterns overestimate species richness when data from large
public databases is utilised. We tried to limit these effects by basing future predictions on a
predicted distribution, created in MaxEnt, of taxon richness under the current climate, not only
on the observed distribution data. Furthermore, over 96% of the GBIF records used had
coordinates accurate to three or more decimal places. However in further studies, the use of
ignorance maps (Rocchini et al., 2011; Ruete, 2015) as well as the use of tools such as
GeoQual in the CAFITOGEN package (Parra-Quijano et al., 2016) may allow the filtering out
of unreliable occurrence data.
4.6 Conclusion
For management strategies to be effective for CWR within Norway the continued monitoring
of populations will be required (Stafford Smith et al., 2011). A monitoring programme for
CWR within Norway should include thresholds that if met will mean taking the next course of
action. These thresholds could include monitoring of population sizes with a focus upon those
trailing-edge populations, for example if they fall below 5000 individuals (Iriondo et al., 2012)
then conservation action will be required; use of the IUCN categories as thresholds to prioritise
the collecting of threatened taxa (i.e. those that are predicted to become extinct or critically

120
endangered would be the first priorities to collect) and identifying leading-edge populations to
allow the planning of conservation areas that allow populations to migrate to the nearest
suitable location or PA. The strength of PAs is that they are already working now to protect
biodiversity and to passively conserve CWR that happen to occur within them. Therefore the
use of PAs in terms of climate change equates to a ‘no-regrets’ conservation decision (Stafford
Smith et al., 2011), especially if new PAs are created. Informal PAs for CWR such as those
acting as corridors (increasing connectivity from the south east to north west in Norway) in the
landscape should be flexible in their location, design and management to allow for the
uncertainties associated with the climate change predictions and species responses. Ex situ
conservation is likely to be essential as a back-up to in situ resources by making the genetic
diversity available to plant pre-breeders. Ex situ conservation can be used to incrementally
collect populations that are showing negative responses to climate change by meeting the
thresholds (including population size and IUCN threat level) set out in the monitoring
programme.
Pittock and Jones (2000) state that climate change will not be a new stable equilibrium but an
ongoing transient process that requires an ongoing adaptation process. This is clear from the
results and recommendations presented above, which can enhance the previous work on a
national CWR conservation strategy for Norway (Phillips et al., 2016). Although this study
was conducted at a national level the methodologies and recommendations have applicability at
regional and global levels. Furthermore, it is at the national level that such recommendations
will need to be implemented. Unless we increase our knowledge on the impact of climate
change upon CWR we will not be able to effectively conserve and utilise taxa to improve food
security in the face of climate change.
121
CHAPTER 5.
Genetic diversity studies of priority crop wild relatives in Norway
using AFLPs: Implications for conservation
The work presented in this chapter has been submitted to Conservation Genetics (April 2017)
Jade Phillips, Lindsey Leech, Joana Magos Brehm, Åsmund Asdal, Morten
Rasmussen, Nigel Maxted
Author contributions:
Conceived and designed the study: J.P., J.M.B., A.A., N.M.
Data collation and preparation: J.P., A.A.
Performed analysis: J.P.
Interpreted results: J.P., L.L., J.M.B.
Wrote the paper: J.P.
Critically reviewed the paper: J.P., L.L., J.M.B., A.A., M.R., N.M.
122
5.1 Abstract
Understanding the genetic diversity of species will allow us to better manage and sustain our
natural resources. CWR are an essential source of genetic diversity due to their close
relationship to cultivated crops and the relative ease of trait transfer. These wild species are
vital for improving the resilience of our cultivated crops and mitigating the impact of future
challenges. Few studies have used genetic diversity assessments to inform conservation of
CWR. Here we conduct genetic diversity studies using AFLPs for three priority CWR in
Norway. Leaf material for C. carvi, T. repens and T. pratense was sampled from populations
across 26 sites throughout Norway. RawGeno software was used to score the presence and
absence of peaks. Descriptive statistics were calculated in AFLP-SURV and GenAlEx to
determine genetic diversity patterns. Genetic diversity is partitioned mostly within rather than
amongst populations for all three taxa. PCoA showed no obvious geographic partitioning of
genetic diversity for either the individuals or populations. Southern populations contained a
higher number of private alleles and had higher levels of heterozygosity than northern
populations. The level of gene diversity differed between all ecogeographic zones. Based on
the results from the AFLP analysis, in situ and ex situ conservation of the three taxa should
initially focus on populations in the south of Norway due to the higher diversity and more
distinct populations found there. Management plans have already been put in place for
populations in the Færder NP, making it a potential candidate for the first CWR genetic reserve
in Norway.
5.2 Introduction
The loss of species is well documented but the loss of genetic diversity is much less understood
(Nabham, 2009). Understanding genetic diversity, how it is distributed and how we can utilise
123
it, is essential if we are to sustain resilient and robust food- and eco-systems. Such systems are
vital for the survival of the human population. Food security, for example, depends on the wise
use and conservation of genetic resources (Esquinas-Alcazar, 2005), yet we are only
capitalising on a fraction of the genetic diversity that is available within each species
(McCouch et al., 2013). Just four crops, rice, wheat, maize and potato provide us with more
than 60% of our food (FAO, 2015). With an increasing population and increasing political and
environmental instability we will need to make our food systems more robust. Harnessing the
full extent of genetic diversity available will help us to achieve this and ensure our future food
security.
Simply counting the number of species in an ecosystem does not account for how variable
species may be, therefore measurements of genetic diversity are more valuable (Millennium
Ecosystem Assessment, 2005). The characterisation of genetic variation and its distribution
within and amongst populations is important for plant breeding and conservation focused on
the management of genetic resources (Marshall & Brown, 1995; Nybom & Bartish, 2000;
Herrmann et al., 2005; Bonin et al., 2007). CWR are one such genetic resource. They are the
wild progenitors of our cultivated crops and often contain higher levels of genetic diversity as
they have not been through the bottleneck of domestication (Tanksley and McCouch, 1997;
Maxted et al., 2006). To make our crops more robust to environmental and human pressures
we will need to harness this genetic diversity.
Hajjar and Hodgkin (2007), Maxted and Kell (2009) and Dempewolf et al. (2017) give a broad
picture of how genetic material has been utilised for improving crops in response to both past
and future challenges such as biotic and abiotic resistance, and climatic changes. For example,
disease resistant genes from wild wheat relatives are already being transferred into wheat
cultivars, of which 90% are susceptible to the Ug 99 fungus (Singh et al., 2011). This genetic
124
diversity is valuable for crop improvement with one estimate placing a value of potentially
$120 billion, on the wild genepools of 29 globally important crops (PwC, 2013).
There are a few studies that have utilised genetic diversity assessments to inform conservation
planning for CWR. Watson-Jones et al. (2006) used AFLPs for genetic diversity studies of
Brassica species to establish a baseline level of diversity which can be monitored in the future.
Genetic diversity studies have also identified in situ conservation sites for Dianthus species in
Portugal (Magos Brehm et al., 2012), wild Brassica in Italy (Branca et al., 2012), Beta species
in Madeira (Pinheiro de Carvalho et al., 2012) and for establishing conservation measures for
multiple CWR in the UK (Fielder, 2015). Furthermore, there are standards in place for the
designation of genetic reserves which include regular genetic monitoring of species and the
identification of reserves that capture as much genetic diversity of target species as possible
(Iriondo et al., 2012).
The countries that are signatories to international agreements on protection of diversity, such as
the CBD (UN, 1992), the ITPGRFA (FAO, 2001; www.planttreaty.org) and the GSPC
(www.biodiv.org/programmes/cross-cutting/plant/), also have a responsibility to conserve
genetic diversity. Conservation of these resources in situ must begin at the national level to be
effective, because each population is located in a particular country and is subject to national
sovereignty. Norway has already begun to meet these targets with the creation of a national
strategy for the in situ and ex situ conservation of priority CWR (Phillips et al., 2016). This
strategy utilised ELC maps (Parra-Quijano et al., 2012b) as a proxy for identifying genetic
diversity within Norway. It is assumed that, unless there is evidence to the contrary, the
conservation of populations from the maximum diversity of locations will result in the most
genetically diverse sample, as genetic diversity is partitioned in relation to ecogeographic
diversity (Heywood, 2008). However, genetic diversity studies have not yet been conducted

125
for priority CWR in Norway to determine if this is the most appropriate approach. Plant
populations in Norway may have lower genetic diversity than other countries due to the long
migration distances for plants, but they may also be more distinct due to heavy glaciation in the
past which may have formed glacial refugia for certain arctic species (Eidesen et al., 2013).
Here we investigate the genetic diversity of three Norwegian priority CWR using AFLPs. We
aim to identify if genetic diversity is different within ecogeographical environments and how
this will affect conservation strategies. We study the levels of genetic diversity from
populations throughout Norway to identify locations suitable for in situ conservation and
populations that may require ex situ conservation. We aim to add to the previously published
recommendations for in situ and ex situ conservation of CWR in Norway (Phillips et al., 2016)
by establishing the baseline genetic diversity data required for an effective establishment of in
situ genetic reserves and continued genetic monitoring.
5.3 Methods
5.3.1 Sample collection
Genetic diversity studies were carried out for three priority CWR in Norway (see Table S2.2
for the full list of priority CWR) C. carvi (caraway), T. pratense (red clover) and T. repens
(white clover). The taxa were chosen based upon consultation with Norwegian stakeholders at
the Norwegian Forest and Landscape Institute and the Natural History Museum, Oslo. C. carvi
(2x=20) is a biennial, outcrossing species and is an important herb and medicinal plant. T.
pratense (2n=2x=14) is a perennial species and an obligate out-crosser with self-
incompatibility. T. repens (2n=4x=32) is an allotetraploid, perennial species which is
outbreeding and self-incompatible but also clonally propagated. Both Trifolium taxa are
important forage species in the temperate world.
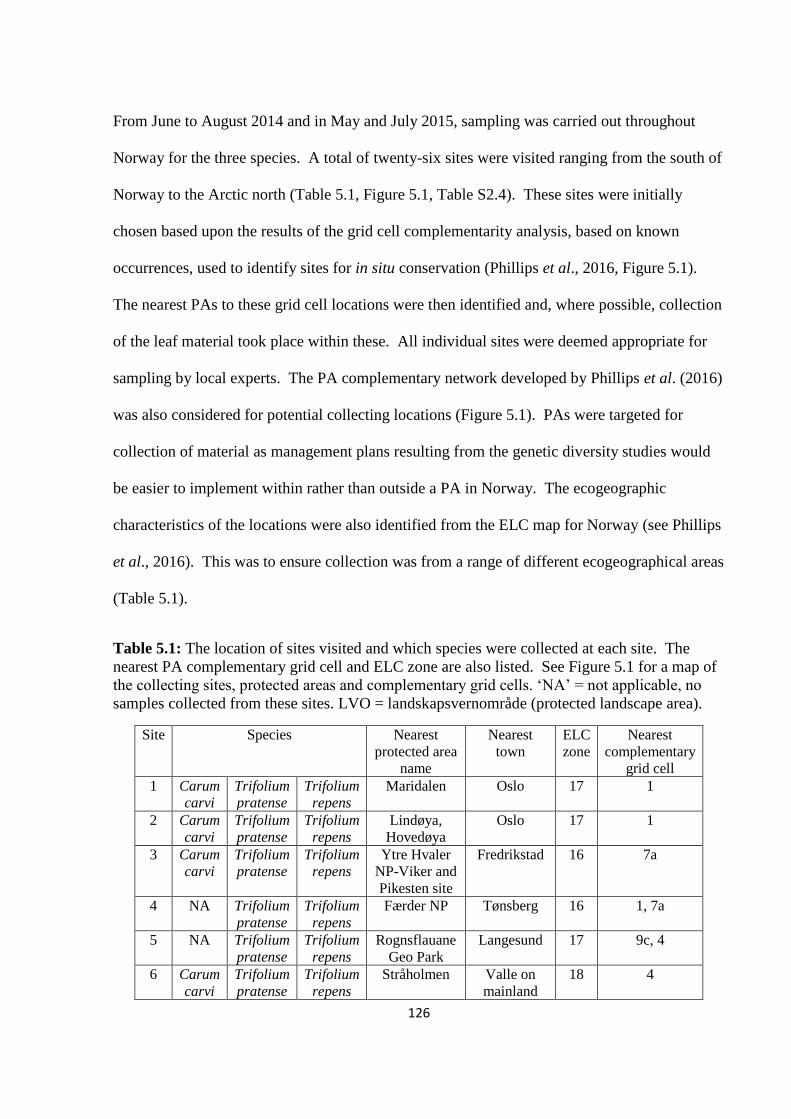
126
From June to August 2014 and in May and July 2015, sampling was carried out throughout
Norway for the three species. A total of twenty-six sites were visited ranging from the south of
Norway to the Arctic north (Table 5.1, Figure 5.1, Table S2.4). These sites were initially
chosen based upon the results of the grid cell complementarity analysis, based on known
occurrences, used to identify sites for in situ conservation (Phillips et al., 2016, Figure 5.1).
The nearest PAs to these grid cell locations were then identified and, where possible, collection
of the leaf material took place within these. All individual sites were deemed appropriate for
sampling by local experts. The PA complementary network developed by Phillips et al. (2016)
was also considered for potential collecting locations (Figure 5.1). PAs were targeted for
collection of material as management plans resulting from the genetic diversity studies would
be easier to implement within rather than outside a PA in Norway. The ecogeographic
characteristics of the locations were also identified from the ELC map for Norway (see Phillips
et al., 2016). This was to ensure collection was from a range of different ecogeographical areas
(Table 5.1).
Table 5.1: The location of sites visited and which species were collected at each site. The
nearest PA complementary grid cell and ELC zone are also listed. See Figure 5.1 for a map of
the collecting sites, protected areas and complementary grid cells. ‘NA’ = not applicable, no
samples collected from these sites. LVO = landskapsvernområde (protected landscape area).
Site Species Nearest
protected area
name
Nearest
town
ELC
zone
Nearest
complementary
grid cell
1 Carum
carvi
Trifolium
pratense
Trifolium
repens
Maridalen Oslo 17 1
2 Carum
carvi
Trifolium
pratense
Trifolium
repens
Lindøya,
Hovedøya
Oslo 17 1
3 Carum
carvi
Trifolium
pratense
Trifolium
repens
Ytre Hvaler
NP-Viker and
Pikesten site
Fredrikstad 16 7a
4 NA Trifolium
pratense
Trifolium
repens
Færder NP Tønsberg 16 1, 7a
5 NA Trifolium
pratense
Trifolium
repens
Rognsflauane
Geo Park
Langesund 17 9c, 4
6 Carum
carvi
Trifolium
pratense
Trifolium
repens
Stråholmen Valle on
mainland
18 4
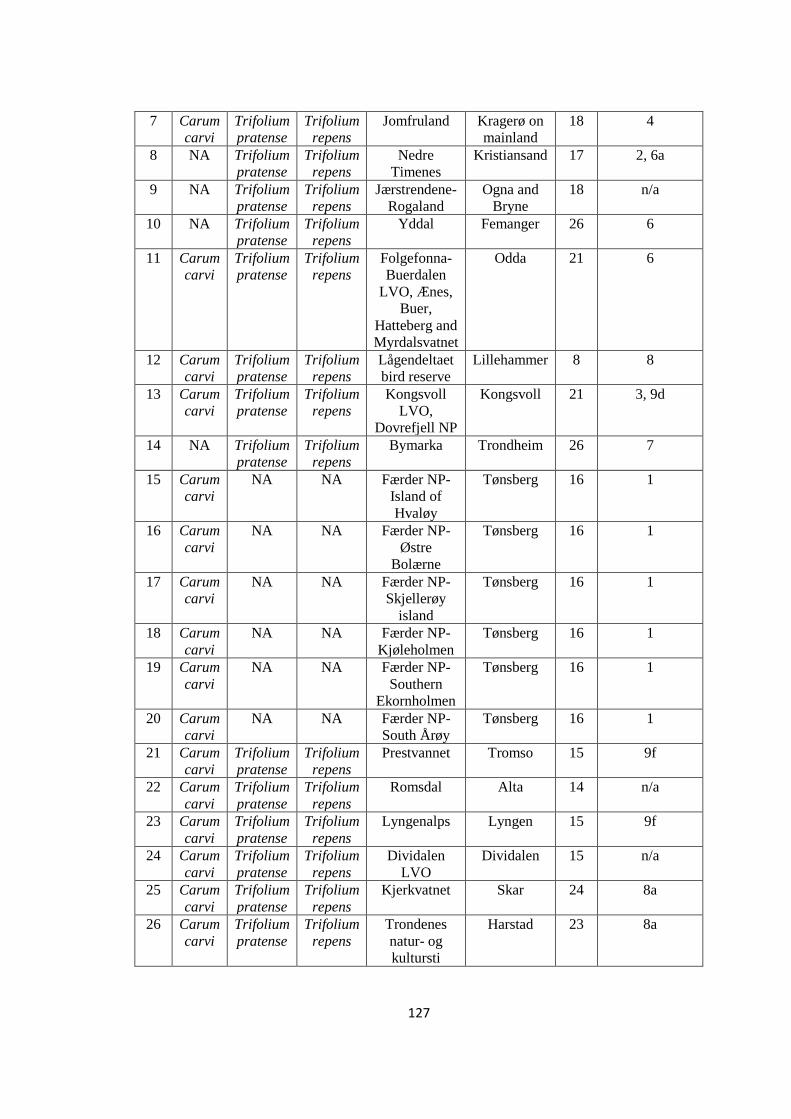
127
7 Carum
carvi
Trifolium
pratense
Trifolium
repens
Jomfruland Kragerø on
mainland
18 4
8 NA Trifolium
pratense
Trifolium
repens
Nedre
Timenes
Kristiansand 17 2, 6a
9 NA Trifolium
pratense
Trifolium
repens
Jærstrendene-
Rogaland
Ogna and
Bryne
18 n/a
10 NA Trifolium
pratense
Trifolium
repens
Yddal Femanger 26 6
11 Carum
carvi
Trifolium
pratense
Trifolium
repens
Folgefonna-
Buerdalen
LVO, Ænes,
Buer,
Hatteberg and
Myrdalsvatnet
Odda 21 6
12 Carum
carvi
Trifolium
pratense
Trifolium
repens
Lågendeltaet
bird reserve
Lillehammer 8 8
13 Carum
carvi
Trifolium
pratense
Trifolium
repens
Kongsvoll
LVO,
Dovrefjell NP
Kongsvoll 21 3, 9d
14 NA Trifolium
pratense
Trifolium
repens
Bymarka Trondheim 26 7
15 Carum
carvi
NA NA Færder NP-
Island of
Hvaløy
Tønsberg 16 1
16 Carum
carvi
NA NA Færder NP-
Østre
Bolærne
Tønsberg 16 1
17 Carum
carvi
NA NA Færder NP-
Skjellerøy
island
Tønsberg 16 1
18 Carum
carvi
NA NA Færder NP-
Kjøleholmen
Tønsberg 16 1
19 Carum
carvi
NA NA Færder NP-
Southern
Ekornholmen
Tønsberg 16 1
20 Carum
carvi
NA NA Færder NP-
South Årøy
Tønsberg 16 1
21 Carum
carvi
Trifolium
pratense
Trifolium
repens
Prestvannet Tromso 15 9f
22 Carum
carvi
Trifolium
pratense
Trifolium
repens
Romsdal Alta 14 n/a
23 Carum
carvi
Trifolium
pratense
Trifolium
repens
Lyngenalps Lyngen 15 9f
24 Carum
carvi
Trifolium
pratense
Trifolium
repens
Dividalen
LVO
Dividalen 15 n/a
25 Carum
carvi
Trifolium
pratense
Trifolium
repens
Kjerkvatnet Skar 24 8a
26 Carum
carvi
Trifolium
pratense
Trifolium
repens
Trondenes
natur- og
kultursti
Harstad 23 8a

128
Figure 5.1: Location of the 26 collecting sites (see Table 5.1 for further site information) and
the PA network in Norway. The green highlighted PAs are those in the PA complementary
network and the red cells are those from the grid cell complementary network. See Phillips et
al. (2016) for detailed information about the PA and grid cell complementary network.

129
From each site one leaf sample was collected (approximately 100 mg fresh weight minimum)
from 20 different individuals for each species. As the sites varied in size, individuals were
collected from different populations within that site to gather a representative range of genetic
diversity within the area. The sites were deemed far enough away from each other that gene
flow was expected to be very unlikely between them. Leaf samples from each individual were
stored in separate airtight plastic bags containing drying indicator silica gel (Chase and Hills,
1991). A total of 1201 samples were used for molecular work (C. carvi = 389, T. pratense =
392, T. repens = 420).
5.3.2 Molecular marker genotyping
Genomic DNA was extracted from the dried leaves using the DNeasy 96 Plant Kit (Qiagen,
2012). The AFLP method was completed in accordance with IBERS standard protocol (Skøt et
al., 2005) based on Vos et al. (1995) with the following adjustments: 3μl of pre-amplification
product was used for the selective amplifications; the PCR protocol was used with 25 cycles
and 1μl of selective amplification product was mixed with 10μl formamide/size standard. Pre-
amplification identified appropriate primers to use that produced markers distributed
throughout the genome of the individual species. Two primers were subsequently used in the
AFLP analysis: ACG-CTG and ACA-CTA (Table 2.2). AFLP reactions were run on the ABI
3730 capillary sequencer.
AFLP electropherograms were visualised and peaks were scored using the freely available
Peak Scanner (Applied Biosystems, 2006) software which detected the size and fluorescence of
the AFLP peaks and with RawGeno software (Arrigo et al., 2009), which is implemented as an
R CRAN package. In Peak Scanner the ‘Analysis method’ proposed by Arrigo et al. (2009)
was used as it has provided robust results in the past (Holland et al., 2008; Herrmann et al.,
2010). The Size Standard used was GS500(-250)LIZ. The resulting Peak Scanner table was
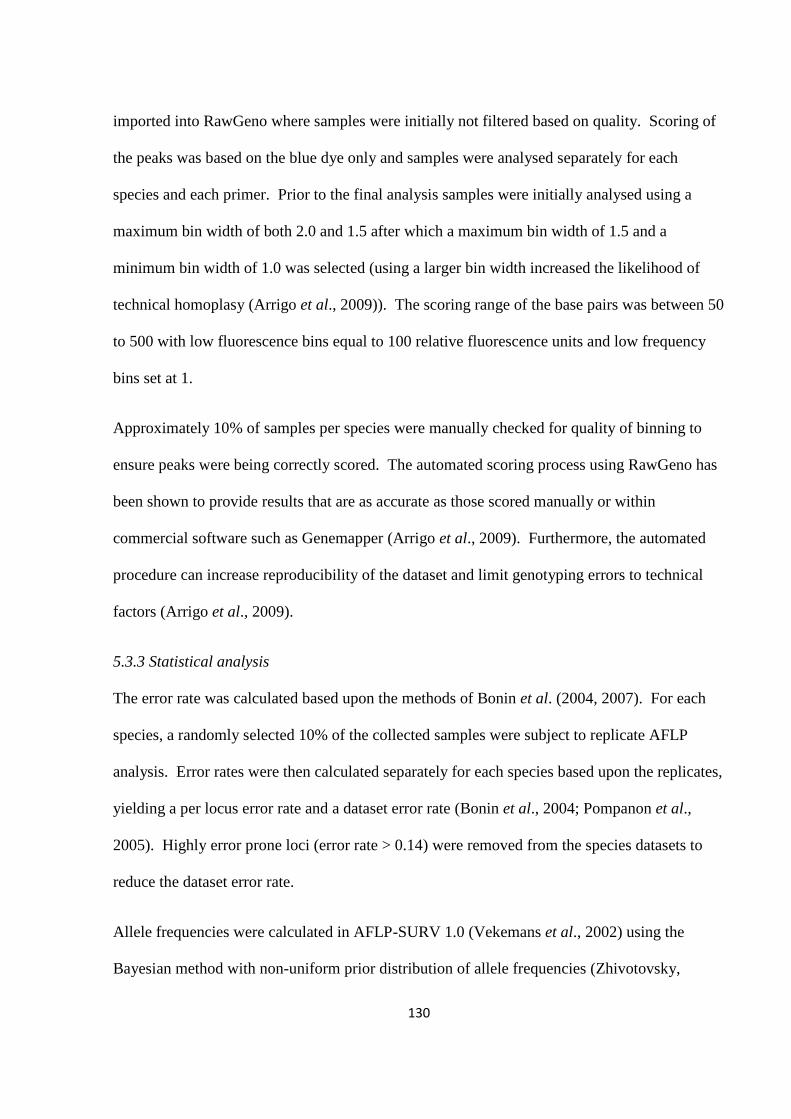
130
imported into RawGeno where samples were initially not filtered based on quality. Scoring of
the peaks was based on the blue dye only and samples were analysed separately for each
species and each primer. Prior to the final analysis samples were initially analysed using a
maximum bin width of both 2.0 and 1.5 after which a maximum bin width of 1.5 and a
minimum bin width of 1.0 was selected (using a larger bin width increased the likelihood of
technical homoplasy (Arrigo et al., 2009)). The scoring range of the base pairs was between 50
to 500 with low fluorescence bins equal to 100 relative fluorescence units and low frequency
bins set at 1.
Approximately 10% of samples per species were manually checked for quality of binning to
ensure peaks were being correctly scored. The automated scoring process using RawGeno has
been shown to provide results that are as accurate as those scored manually or within
commercial software such as Genemapper (Arrigo et al., 2009). Furthermore, the automated
procedure can increase reproducibility of the dataset and limit genotyping errors to technical
factors (Arrigo et al., 2009).
5.3.3 Statistical analysis
The error rate was calculated based upon the methods of Bonin et al. (2004, 2007). For each
species, a randomly selected 10% of the collected samples were subject to replicate AFLP
analysis. Error rates were then calculated separately for each species based upon the replicates,
yielding a per locus error rate and a dataset error rate (Bonin et al., 2004; Pompanon et al.,
2005). Highly error prone loci (error rate > 0.14) were removed from the species datasets to
reduce the dataset error rate.
Allele frequencies were calculated in AFLP-SURV 1.0 (Vekemans et al., 2002) using the
Bayesian method with non-uniform prior distribution of allele frequencies (Zhivotovsky,
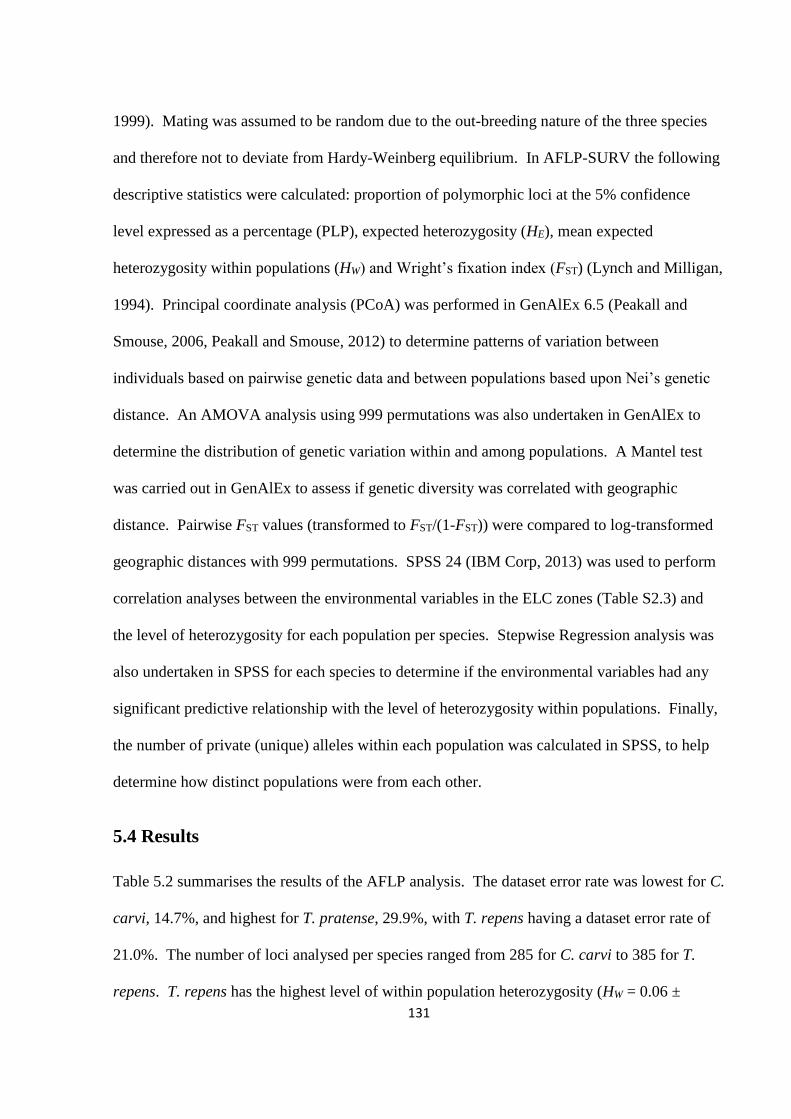
131
1999). Mating was assumed to be random due to the out-breeding nature of the three species
and therefore not to deviate from Hardy-Weinberg equilibrium. In AFLP-SURV the following
descriptive statistics were calculated: proportion of polymorphic loci at the 5% confidence
level expressed as a percentage (PLP), expected heterozygosity (HE), mean expected
heterozygosity within populations (HW) and Wright’s fixation index (FST) (Lynch and Milligan,
1994). Principal coordinate analysis (PCoA) was performed in GenAlEx 6.5 (Peakall and
Smouse, 2006, Peakall and Smouse, 2012) to determine patterns of variation between
individuals based on pairwise genetic data and between populations based upon Nei’s genetic
distance. An AMOVA analysis using 999 permutations was also undertaken in GenAlEx to
determine the distribution of genetic variation within and among populations. A Mantel test
was carried out in GenAlEx to assess if genetic diversity was correlated with geographic
distance. Pairwise FST values (transformed to FST/(1-FST)) were compared to log-transformed
geographic distances with 999 permutations. SPSS 24 (IBM Corp, 2013) was used to perform
correlation analyses between the environmental variables in the ELC zones (Table S2.3) and
the level of heterozygosity for each population per species. Stepwise Regression analysis was
also undertaken in SPSS for each species to determine if the environmental variables had any
significant predictive relationship with the level of heterozygosity within populations. Finally,
the number of private (unique) alleles within each population was calculated in SPSS, to help
determine how distinct populations were from each other.
5.4 Results
Table 5.2 summarises the results of the AFLP analysis. The dataset error rate was lowest for C.
carvi, 14.7%, and highest for T. pratense, 29.9%, with T. repens having a dataset error rate of
21.0%. The number of loci analysed per species ranged from 285 for C. carvi to 385 for T.
repens. T. repens has the highest level of within population heterozygosity (HW = 0.06 ±

132
0.005) and T. pratense has the lowest level (HW = 0.05 ± 0.005). Wright’s F statistic (FST)
shows that population differentiation for the three taxa is lowest for T. pratense (FST = 0.02 ±
0.117) and highest for C. carvi (FST = 0.10 ± 0.110). C. carvi and T. repens (FST = 0.06 ±
0.156) show moderate level of genetic differentiation among populations (Hartl and Clark,
1997). AMOVA supports this pattern of population differentiation with T. pratense containing
the highest within population diversity (96%) and C. carvi showing the lowest level (83%).
This high within population diversity is expected for outcrossing taxa such as the three studied
here.
PCoA supports the above findings and shows that there is no obvious geographic portioning of
genetic diversity for the three species (Figure 5.2). The Mantel tests show there is no
significant isolation by distance (IBD) for C. carvi and T. pratense (Figure 5.3), though there is
a significant level of IBD for T. repens (R2 = 0.0498, P = 0.032).
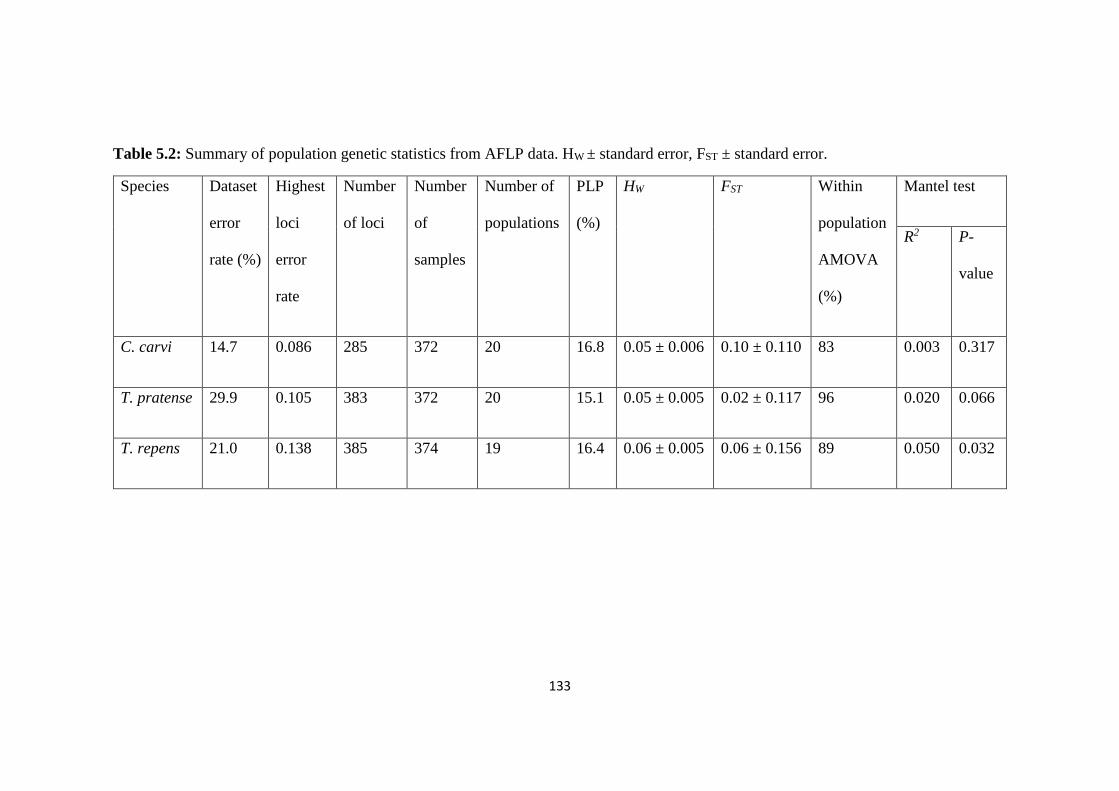
133
Table 5.2: Summary of population genetic statistics from AFLP data. HW ± standard error, FST ± standard error.
Species Dataset
error
rate (%)
Highest
loci
error
rate
Number
of loci
Number
of
samples
Number of
populations
PLP
(%)
HW FST Within
population
AMOVA
(%)
Mantel test
R2 P-
value
C. carvi 14.7 0.086 285 372 20 16.8 0.05 ± 0.006 0.10 ± 0.110 83 0.003 0.317
T. pratense 29.9 0.105 383 372 20 15.1 0.05 ± 0.005 0.02 ± 0.117 96 0.020 0.066
T. repens 21.0 0.138 385 374 19 16.4 0.06 ± 0.005 0.06 ± 0.156 89 0.050 0.032
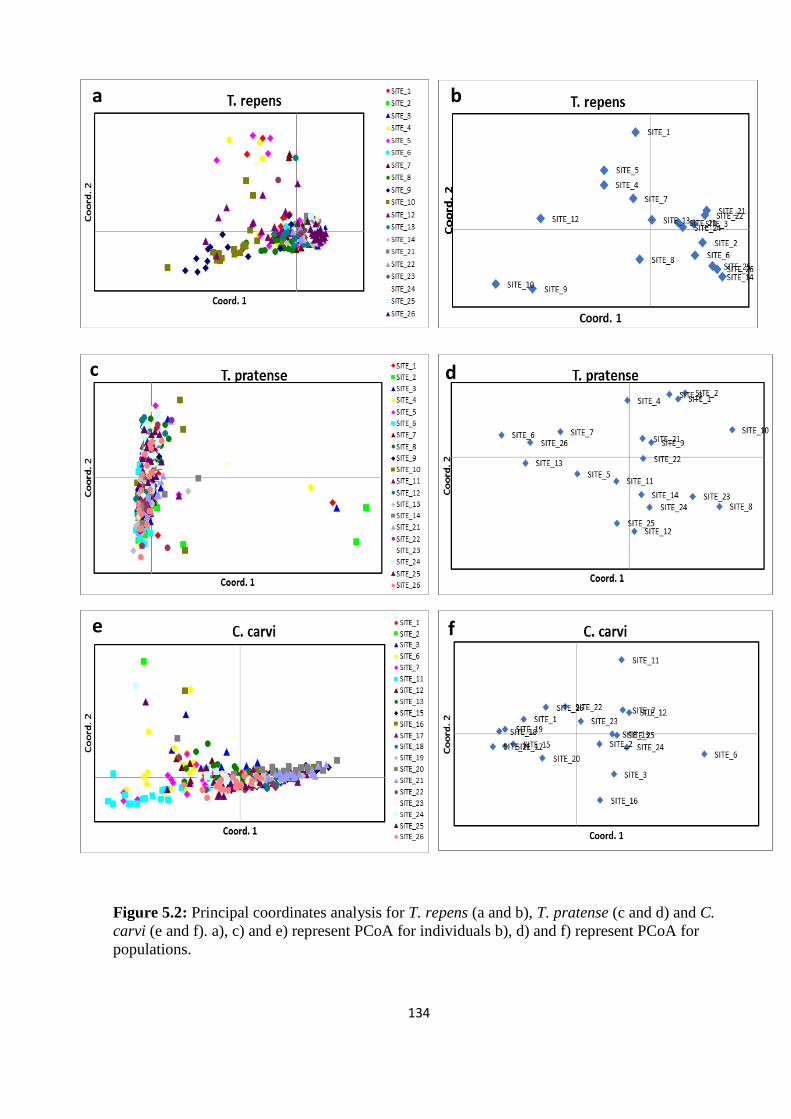
134
Figure 5.2: Principal coordinates analysis for T. repens (a and b), T. pratense (c and d) and C.
carvi (e and f). a), c) and e) represent PCoA for individuals b), d) and f) represent PCoA for
populations.
b a
c d
e f
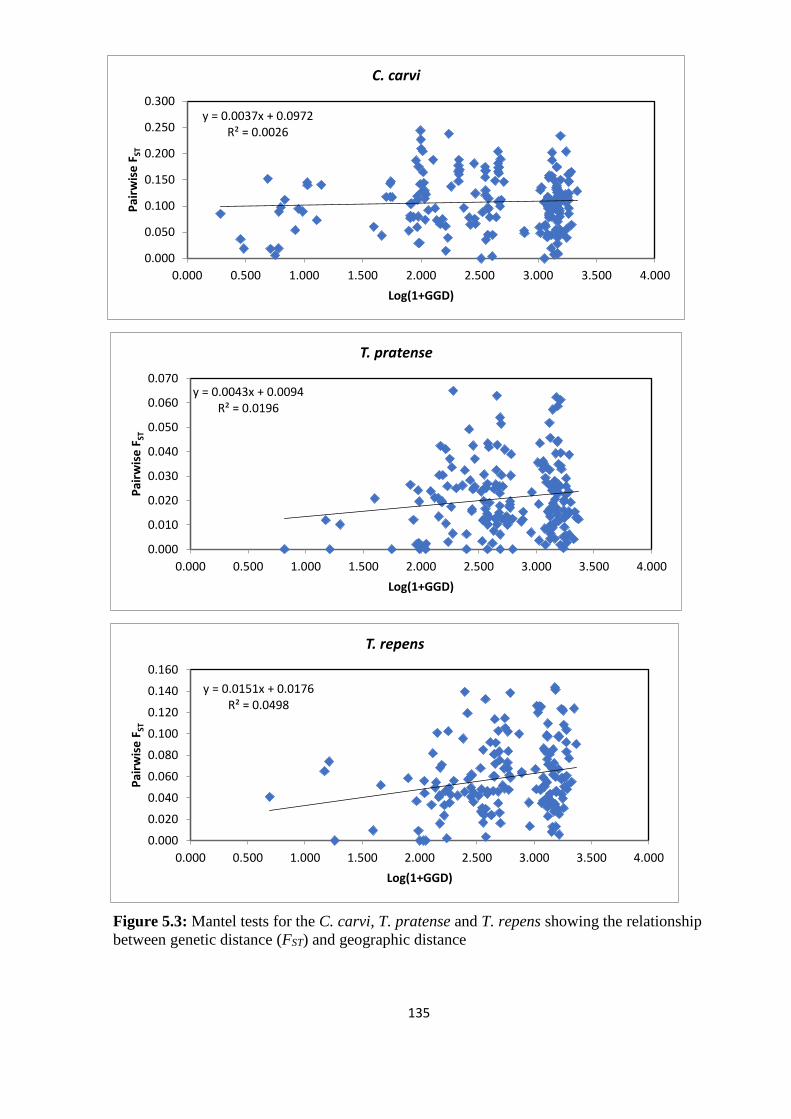
135
Figure 5.3: Mantel tests for the C. carvi, T. pratense and T. repens showing the relationship
between genetic distance (FST) and geographic distance
y = 0.0037x + 0.0972R² = 0.0026
0.000
0.050
0.100
0.150
0.200
0.250
0.300
0.000 0.500 1.000 1.500 2.000 2.500 3.000 3.500 4.000
Pai
rwis
e F
ST
Log(1+GGD)
C. carvi
y = 0.0043x + 0.0094R² = 0.0196
0.000
0.010
0.020
0.030
0.040
0.050
0.060
0.070
0.000 0.500 1.000 1.500 2.000 2.500 3.000 3.500 4.000
Pai
rwis
e F
ST
Log(1+GGD)
T. pratense
y = 0.0151x + 0.0176R² = 0.0498
0.000
0.020
0.040
0.060
0.080
0.100
0.120
0.140
0.160
0.000 0.500 1.000 1.500 2.000 2.500 3.000 3.500 4.000
Pai
rwis
e F
ST
Log(1+GGD)
T. repens

136
5.4.1 Genetic distinctness among populations
A study of the number of private alleles (Table 5.3) within populations for the three species
indicated southern populations (sites 1-20) were more distinct, with a higher number of private
alleles found within these populations. The relationship between the number of private alleles
and the level of heterozygosity is significant for all taxa (C. carvi F (1, 18) = 9.873, P <0.05; T.
repens F (1, 18) = 11.332, P <0.005; T. pratense F (1, 18) = 23.897, P <0.005).
Table 5.3: The number of private alleles and the level of heterozygosity within each population
at each site. ‘NA’ = not applicable, no data available. * = populations with the highest levels of
diversity and private alleles and therefore recommended for further in situ and ex situ
conservation.
C. carvi T. pratense T. repens ELC
zone
Number
of private
alleles
Level of
heterozygosity
Number
of private
alleles
Level of
heterozygosity
Number
of private
alleles
Level of
heterozygosity
SITE 1 1 0.02742 6* 0.07042* 15* 0.07926* 17
SITE 2 11* 0.06878* 14* 0.07733* 3 0.05048 17
SITE 3 7* 0.07627* 3 0.05583* 1 0.05804 16
SITE 4 NA NA 3 0.04776 18* 0.07517* 16
SITE 5 NA NA 7* 0.05028 14* 0.07136* 17
SITE 6 11* 0.08630* 1 0.03407 1 0.03766 18
SITE 7 10* 0.06791 1 0.03458 0 0.05170 18
SITE 8 NA NA 3 0.04393 0 0.06537 17
SITE 9 NA NA 0 0.04439 6* 0.10018* 18
SITE
10
NA NA 2 0.05230* 3 0.08415* 26
SITE
11
5 0.07548* 0 0.04275 NA NA 21
SITE
12
1 0.05065 1 0.03661 3 0.06988 8
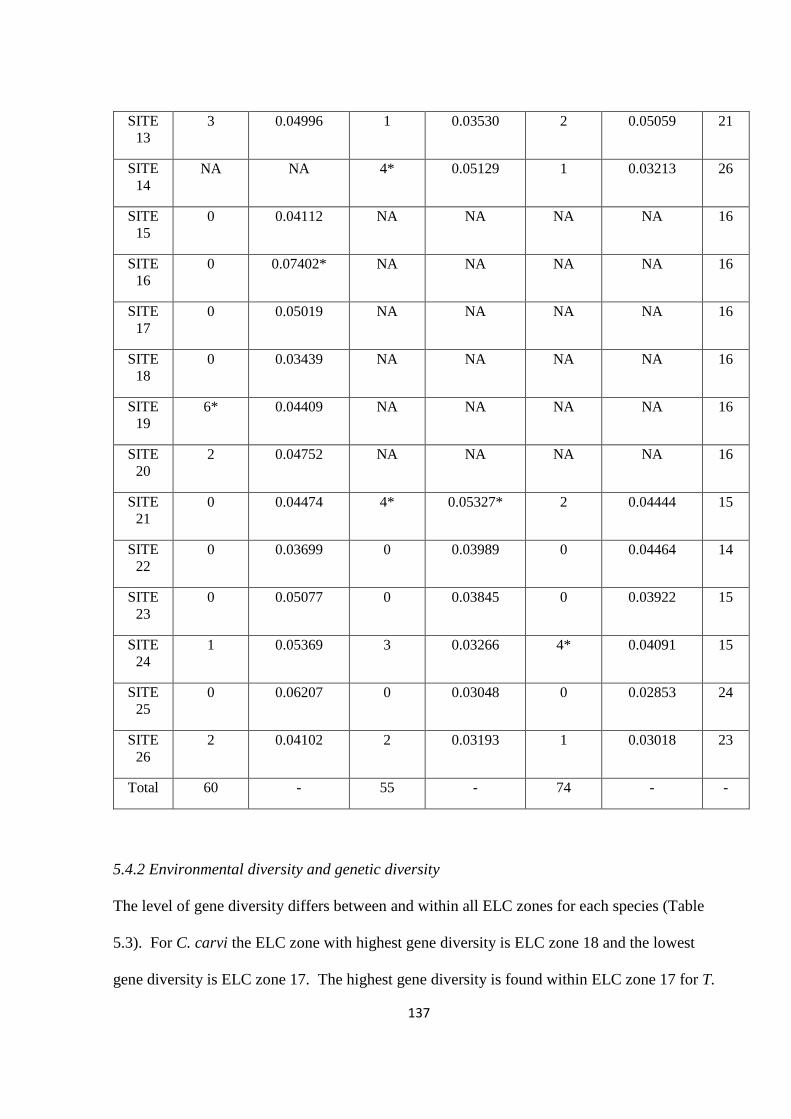
137
SITE
13
3 0.04996 1 0.03530 2 0.05059 21
SITE
14
NA NA 4* 0.05129 1 0.03213 26
SITE
15
0 0.04112 NA NA NA NA 16
SITE
16
0 0.07402* NA NA NA NA 16
SITE
17
0 0.05019 NA NA NA NA 16
SITE
18
0 0.03439 NA NA NA NA 16
SITE
19
6* 0.04409 NA NA NA NA 16
SITE
20
2 0.04752 NA NA NA NA 16
SITE
21
0 0.04474 4* 0.05327* 2 0.04444 15
SITE
22
0 0.03699 0 0.03989 0 0.04464 14
SITE
23
0 0.05077 0 0.03845 0 0.03922 15
SITE
24
1 0.05369 3 0.03266 4* 0.04091 15
SITE
25
0 0.06207 0 0.03048 0 0.02853 24
SITE
26
2 0.04102 2 0.03193 1 0.03018 23
Total 60 - 55 - 74 - -
5.4.2 Environmental diversity and genetic diversity
The level of gene diversity differs between and within all ELC zones for each species (Table
5.3). For C. carvi the ELC zone with highest gene diversity is ELC zone 18 and the lowest
gene diversity is ELC zone 17. The highest gene diversity is found within ELC zone 17 for T.
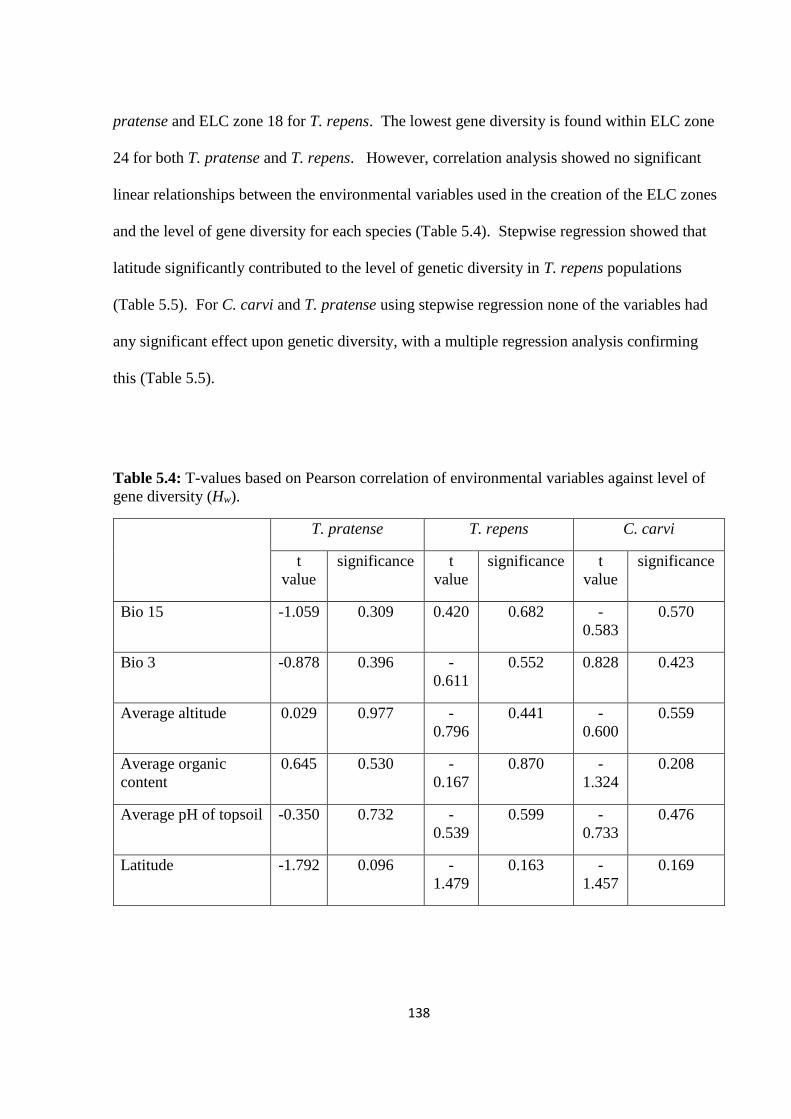
138
pratense and ELC zone 18 for T. repens. The lowest gene diversity is found within ELC zone
24 for both T. pratense and T. repens. However, correlation analysis showed no significant
linear relationships between the environmental variables used in the creation of the ELC zones
and the level of gene diversity for each species (Table 5.4). Stepwise regression showed that
latitude significantly contributed to the level of genetic diversity in T. repens populations
(Table 5.5). For C. carvi and T. pratense using stepwise regression none of the variables had
any significant effect upon genetic diversity, with a multiple regression analysis confirming
this (Table 5.5).
Table 5.4: T-values based on Pearson correlation of environmental variables against level of
gene diversity (Hw).
T. pratense T. repens C. carvi
t
value
significance t
value
significance t
value
significance
Bio 15 -1.059 0.309 0.420 0.682 -
0.583
0.570
Bio 3 -0.878 0.396 -
0.611
0.552 0.828 0.423
Average altitude 0.029 0.977 -
0.796
0.441 -
0.600
0.559
Average organic
content
0.645 0.530 -
0.167
0.870 -
1.324
0.208
Average pH of topsoil -0.350 0.732 -
0.539
0.599 -
0.733
0.476
Latitude -1.792 0.096 -
1.479
0.163 -
1.457
0.169

139
Table 5.5: Stepwise regression analysis of six environmental variables against level of gene
diversity (Hw) for T. repens and a multiple regression analysis for C. carvi and T. pratense*=
Predictor (constant) latitude.
Multiple regression
Species R R2 adjusted R df
(degrees
of
freedom)
F Significance
C. carvi 0.500 0.250 -0.096 (6, 13) 0.723 0.639
T. pratense 0.581 0.337 0.031 (6, 13) 1.102 0.412
T. repens 0.586* 0.236 0.194 (1, 19) 5.575 0.030*
5.5 Discussion
Knowledge of genetic diversity within and among species is indispensable to optimally
managing genetic resources for the improvement of cultivars as well as to maintain and restore
biodiversity (Herrmann et al., 2005). Nevo (1998), Watson-Jones et al. (2006) , Hargreaves et
al. (2010), Magos Brehm et al. (2012). and Fielder (2015) have shown how genetic diversity
data can be used to establish baseline data for future monitoring of populations for conservation
management. This investigation is the first genetic diversity study of three priority CWR
within Norway. By undertaking this study the first baseline level of genetic diversity data for
continued monitoring of these taxa has been established. This baseline data will be important
for identifying in situ and ex situ conservation planning priorities. The consequent management
of populations within potential genetic reserves as set out in the guidelines by Iriondo et al.
(2012) and the targeted collection of material for ex situ conservation, will be more effective
with knowledge on the genetic diversity of the populations to conserve.
140
The results of the AFLP analysis show that the genetic diversity is portioned mostly within
rather than amongst populations for all three taxa. For C. carvi the results in this study are in
contrast to Laribi et al. (2011) who showed that genetic diversity was lower within populations
despite the species being outcrossing. The study by Laribi et al. (2011) used populations from
three different countries and used RAPDs to analyse the genetic diversity, which may account
for the differences between their results and the results shown here. The high within
population diversity for C. carvi reflects the outbreeding life history of the species. The level
of population differentiation (FST) for C. carvi suggests there are moderate levels of gene flow
between populations and that the species can disperse widely. This knowledge of population
differentiation can be used as a baseline for future studies and population monitoring. For
example, Watson-Jones et al. (2006) suggests that if there is a higher FST than previously seen
then populations are becoming more differentiated, meaning they are adapting to the specific
environmental conditions around them and therefore the adaptive genetic diversity may be
changing. Laribi et al. (2011) suggests that to conserve C. carvi we should conserve as many
populations as possible as well as preserving the species’ natural grassland habitat to prevent
fragmentation and genetic drift. Due to most of the diversity being portioned within
populations it may not be necessary to conserve a large number of populations but it will be
important to conserve a large number of individuals within those populations due to the
outbreeding nature of the species (Hamrick & Godt, 1990; Marshall & Brown, 1995; Hamrick
& Godt, 1996; Hoban & Schlarbaum, 2014). Conserving, C. carvi populations across the
species ecogeographic range in Norway will be important, along with habitat protection and the
utilisation of PAs being one method to achieve this.
For the Trifolium species, studies on wild and cultivated populations have shown that the level
of genetic diversity is mostly portioned within rather than among populations (Kölliker et al.,
141
2001; Gustine et al., 2002; Kölliker et al., 2003; Ulloa et al., 2003; Herrmann et al., 2005; Dias
et al., 2008; Hargreaves et al., 2010; Ahsyee et al., 2014; Fielder, 2015) which is in
concordance with the results obtained in this study. This within population diversity suggests
that the conservation of large numbers of plants in a few populations would be most beneficial
(Rao & Hodgkin, 2002; Christmas et al., 2016). The levels of population differentiation in the
Trifolium species is lower in this study than that of others which also used AFLPs to study
genetic diversity (e.g. Hargreaves et al., 2010; Fielder, 2015). This result may be because the
populations found in Norway are far from their centres of diversity (in the Mediterranean)
which tends to reduce levels of genetic diversity in species (Chowdhury & Slinkard, 2000;
Grivet & Petit, 2003). There may also have been a bottleneck in the studied populations given
their location within Norway, which is located on the north western periphery of Europe
(Fjellheim & Rognli, 2005). In contrast, Williams (1987) describes both synthetic and natural
white clover populations as being highly genetically heterogeneous, with Wedderburn et al.
(2005) suggesting that this diversity may favour a genetic shift in response to environmental
factors. With the base line genetic data gathered in this study, this potential for genetic shift
can be monitored.
The homogenisation of populations is reflected in the PCoA which shows no obvious genetic
clustering of populations or individuals for any of the three CWR species. This is a similar
finding to Van Treuren et al. (2005) who found that there were low levels of population
structuring within wild grassland populations, a habitat in which C. carvi, T. repens and T.
pratense occur within. The results from the PCoA and Mantel tests suggest that site selection
for conservation may be made independently of geographic distance for the three CWR
species.
142
For the three species studied, results showed that the southern populations tended to be more
distinct and have higher levels of heterozygosity than northern populations. This agrees with
Beatty and Provan (2011) who found that the loss of southern populations may have deleterious
consequences on genetic diversity since southern populations tend to be more genetically
diverse. This pattern of genetic diversity may be due to the lack of physical barriers such as
large areas of glaciation in the past, which may have allowed gene flow between populations,
compared to those populations further north which experienced higher levels of glaciation
(Eidesen et al., 2013). For conservation measures, it is important to protect the highest neutral
genetic diversity as it may be the future target of natural selection (McKay & Latta, 2002).
Focusing conservation efforts on the most genetically diverse populations will therefore be
important. Tigerstedt (1994) found that the lowest levels of gene diversity were in wild white
clover populations from Iceland that were under extreme conditions and hypothesizes that traits
of high adaptive value may have been forced to uniformity by stabilizing selection. For
conservation purposes, it may be important to target alleles that are common in specific
populations because these may represent marginal populations harbouring alleles of adaptive
significance (Marshall & Brown, 1975; Allard, 1992). The chances of finding new and unique
alleles are the greatest in populations that are genetically distinct (Fjellheim & Rognli, 2005),
with Nevo (1998) emphasising the in situ conservation of unique alleles and allele
combinations. Furthermore, in a study by Gasi et al. (2016) it was found that a high percentage
of rare alleles indicated presence of a considerable genetic diversity among apple accessions.
In Norway, conservation of southern populations which contain higher genetic diversity and
more unique alleles than northern populations should be favoured, at least for the three species
studied.
143
It is generally assumed that genetic diversity is correlated with ecogeographic diversity
(Maxted et al., 1995; Thomson et al., 2001), hence the conservation of populations within each
ecogeographic zone and from all ecogeographic zones is required to ensure protection of the
full range of genetic diversity. The results from this study show that gene diversity is different
within each ELC zone, however there is no clear pattern of diversity within each zone for each
species. The level of genetic diversity for the species studied does not show any correlation
with specific environmental conditions, although for T. repens latitude had a significant effect
upon genetic diversity and may be interesting to study further. This supports Greene et al.
(2004) who found that RAPDs did not separate accessions into distinct classes that correspond
to environmental conditions in T. pratense. Kölliker et al. (2001) also found no correlation
between rainfall and altitude based on AFLP data for T. repens. Heaton et al. (1999) suggests
this lack of correlation may be due to the homogenising influence of long distance gene flow,
failure of primers to identify genetic differences due to limited sampling of the genome and
sampling of neutral markers that are not associated with adaptation. However, other studies,
including Nevo (1998), Hermann et al. (2005) and Watson-Jones et al. (2006) have found
correlations between environmental factors and genetic diversity.
Although genetic diversity studies can be useful for determining which populations to
conserve, we cannot use molecular marker data alone for identifying conservation units
(Pearman, 2001). Whilst collecting samples in the field in Norway it was noted that the
populations in the south and north had different phenotypic diversity, for example T. pratense
populations in the north had larger flowers and leaflet sizes than southern populations. This
has also been found when comparing wild and cultivated forms of clover from Iceland, Sweden
and the UK (Collins et al., 2012). However, this phenotypic difference was not reflected in the
populations genetic diversity (Collins et al., 2012), supporting the finding that plasticity can

144
allow genetically similar populations to occur in widely differing environments (Johns et al.,
1997; McNeilly, 1997).
5.5.1 Issues with the use of AFLP data and the statistical analyses used
Neutral genetic diversity, as measured by AFLPs in this study, reflects evolutionary forces such
as genetic drift, mutation and migration and is not under selection (Reed & Frankham, 2001;
McKay & Latta, 2002). Adaptive genetic diversity reflects the fitness and adaptive potential of
a species and is the process by which an organism will adapt to a new environment (Reed &
Frankham, 2001; McKay & Latta, 2002; Reed & Frankham, 2003). AFLPs may not enable us
to identify important traits for potential plant breeding but they allow us to establish a baseline
level of genetic diversity. This is important for conservation management as we can compare it
against future studies to determine if there are any changes or detrimental effects occurring
within the populations. Furthermore, in long-term conservation plans it is preferable to assess
neutral genetic diversity, as it is not possible to predict which adaptive genes will be required
(Luikart et al., 2003). In future studies it may be beneficial to utilise next generation DNA
sequencing (NGS) technologies, for example, to help understand crop genomes, identify useful
genetic diversity for plant breeding and for genotyping of germplasm collections (Edwards et
al., 2013). This is especially advantageous for crops and their wild relatives with complex and
large genomes such as wheat and brassica, which are also some of the most widely utilised
crops worldwide. This technology may also help with the identification and utilization of
CWR material for targeted ex situ conservation.
The error rates for the AFLP datasets in this study ranged from 14.7% for C. carvi to 29.9% for
T. pratense. Though procedures were put in place to minimize potential human and technical
errors (including automated laboratory procedures and pre-selective amplification (Vos et al.,
1995)), these error rates are higher than the level proposed by Bonin et al. (2004, 2007), Arrigo

145
et al. (2009) and Zhang and Hare (2012) of between 2% to 5% dataset error rates. Other
similar studies using AFLPs including Pompanon et al. (2005) and Holland et al. (2008) have
found high error rates of up to 15% and 18% respectively. Pompanon et al. (2005) suggests
this could be due to poor quality of DNA and Holland et al. (2008) cites small sample sizes
(<30 individuals) and the use of fully automated scoring being the cause of high error rates.
However, when parameter settings are chosen carefully, automated scoring is still preferred as
it removes subjectivity, is more time efficient, makes it easier to maintain consistency and
eliminates human biases as well as being more repeatable (Holland et al., 2008). Our results
showed that more alleles were scored and there was a lower dataset error rate using the
automated software, RawGeno, than scoring manually. Furthermore, both Holland et al.
(2008) and Zhang and Hare (2012) agree that it is not always best to choose the lowest error
rates or to use error free data as it could lead to datasets with low information content. This
may occur because to minimize the dataset error rate involves removing loci with high numbers
of mismatches from the analysis, thus at some point there will be too few loci to detect
population structure, which could also introduce a bias on Fst in either direction (Holland et al.,
2008; Zhang & Hare, 2012). Most AFLP studies report average mismatch error rates of around
2%, so using error free data is not necessary but determining a threshold for data error is
important (Zhang & Hare, 2012).
There are also controversies around the use of the Mantel test for analysing spatial patterns,
including isolation by distance (IBD) (Legendre and Fortin, 2010; Diniz-Filho et al., 2013;
Guillot and Rousset, 2013; Legendre et al., 2015). The Mantel test is less powerful than other
statistical techniques at detecting spatial relationships (Legendre and Fortin, 2010). IBD
predicts the presence of spatial autocorrelation in the response data and that prediction should
be tested using other methods such as multivariate correlogram analysis, regression or
146
canonical redundancy analysis (Legendre and Fortin, 2010). The non-significant results from
this study indicates that genetic variability is not structured, which deserves more research
using methods such as Spatial Eigenfunction Analyses (SEA) or Redundency Analysis (RDA)
(Legendre and Legendre, 2012), to see if a similar result as the Mantel test is produced (Diniz-
Filho et al., 2013). Both Hargreaves et al. (2010) and Watson et al. (2006) have used the
Mantel test to determine spatial patterns in CWR populations, therefore use of such a statistic
to help formulate potential conservation strategies can be appropriate. However, it would be
valuable for this study to develop this analysis following the previously mentioned methods.
With the comparisons to other studies described above and knowledge of the life histories of
the species we are content that with the data used, the conservation measures suggested are
both valuable and practical to the management of CWR in Norway.
5.6 Conclusion
In situ conservation of at least 5000 individuals, as proposed by Iriondo et al. (2008), across a
minimum of five populations (Brown & Briggs, 1991), selected from the most diverse
populations (Table 5.3), is proposed as the most effective method for genetic conservation of
C. carvi, T. repens and T. pratense in Norway. This is because the results show there is a
larger proportion of diversity contained within rather than amongst populations. The results do
not show a link between environmental conditions and genetic diversity. It may therefore be
better to conserve a broader range of genetic diversity in situ rather than sampling a fraction of
the population for ex situ conservation. As the southern populations for all three species show
higher levels of genetic diversity and distinctness then it will be appropriate to begin initial
conservation actions here. This is the case with the Færder NP, which covers an archipelago in
the Oslo Fjord in the south of Norway and where the Norwegian priority CWR have been
incorporated into management plans for that area (M. Rasmussen, 2017, pers. comms.). It will

147
still be necessary to conduct conservation on populations further north in Norway to cover the
full range of phenotypic and ecogeographic diversity, although there were comparatively low
levels of genetic diversity in northern populations. In all instances of in situ conservation the
focus can be upon those populations already located within PAs that are easy to access and
monitor.
Although ex situ conservation may not be the most effective conservation method for these
populations, it will still be necessary to collect a subset of material for ex situ storage. This will
enable easier access for plant breeders and will act as ex situ back-up which is a standard
adjunct to in situ conservation. Collections from the most genetically diverse populations (see
Table 5.3) in the south of Norway will ensure a broad range of diversity is captured in ex situ
collections. The number of individuals required for ex situ conservation will ultimately depend
upon the effective population size and resources available for conservation. Crossa et al.
(2011) suggest collecting samples from 25 individuals from the largest possible number of
sites, with Brown and Briggs (1991) suggesting a minimum of 10 individuals. However, due
to the outbreeding nature of the species and the high within population diversity the sample
should be as large as possible and should be adjusted and increased depending on the ease of
sampling material, the total distribution of the species and the project needs (Brown & Briggs,
1991). Ex situ conservation for these three species may benefit from further genetic diversity
studies targeting adaptive traits in species, or targeting those phenotypic traits that may be
beneficial for plant pre-breeders. Conservation of CWR should be focused upon capturing the
broadest range of genetic diversity possible using both in situ and ex situ approaches. The
methods used in this study will help achieve this along with the effective monitoring and
management of CWR in Norway which will be vital for future food security at national,
regional and global levels.
148
CHAPTER 6.
Discussion
The work presented in the previous chapters contributes towards both food security and
conservation needs in Norway, the wider Nordic region and globally. In the Adapting
Agriculture to Climate Change project (Dempewolf et al., 2014) of the 1667 CWR taxa
identified, Norway has 35 and the Nordic region has 46 CWR important for global food
security (Vincent et al., 2013). Wild forages such as timothy, festuca and berry species, such
as strawberry, are especially abundant in Norway and the Nordic region and are vital for global
food security (Weibull et al., 2016). Although Norway is far from the centres of diversity for
many staple crops its climatic and environmental variability may lead to important adaptations
for CWR populations. Furthermore, the effects of climate change are being felt more rapidly in
the Arctic region which has warmed at twice the rate of the global average over the last century
(IPCC, 2014). This puts Norway and the other Arctic countries in a unique position at the
forefront of climate change adaptation. This will involve not only developing crops to help
continue feeding the human population but also the development of adaptive and robust
conservation strategies to protect the diversity that underpins the food system.
6.1 The process of CWR diversity planning for Norway
As part of the diversity planning process for the conservation of CWR we need to gather
information about the resources we have available to us. This began with the creation of a
checklist of CWR within Norway which was completed with the close collaboration of local
stakeholders and experts from the Natural History Museum Oslo and the Forest and Landscape
149
Institute. Due to the well documented flora of Norway (Lid & Lid, 2005) taxa were identified
genus by genus to determine if they were classed as CWR, according to the definition used by
Maxted et al. ((2006); see chapter 3 for more information).
It was not feasible to plan conservation actions for all taxa on the checklist due to limited
resources and time, hence prioritisation of the species was necessary. Due to the dynamic
nature of Norway’s flora this process encountered some problems such as taxa that have
populations present but not currently persistent (i.e. Brassica rapa). These issues were
resolved with the help of local botanical experts who were able and willing to study the priority
list and make appropriate comments on the taxa. The prioritisation process has been
extensively covered by Maxted et al. (1997b) with Kell et al. (2015) identifying the three most
important criteria to prioritize CWR. These three criteria include the socio-economic value of
the associated crop, the potential for utilization of the CWR and the threat status of the CWR
(Kell et al., 2015). Numerous national, regional (Weibull et al., 2016; Kell et al., in prep) and
global (Dempewolf et al., 2014) studies have used a combination or subset of these criteria for
prioritisation, illustrating there is no one right way to select priority CWR. Within Norway the
prioritisation process is documented in chapter 3 and Phillips et al. (2016) and began by
initially selecting crops and their associated wild relatives that were present within Norway
which have the highest economic value in terms of global, European and Norwegian
production value (current million US$). Threat level and potential for utilization were not
considered in the prioritisation process as the number of CWR selected after application of the
criteria in Phillips et al. (2016) was deemed appropriate by stakeholders at the time. However,
future work could use the other criteria suggested by Vincent et al. (2013) and Kell et al.
(2015) to prioritise the list further and create a sub-set of priority taxa for more detailed studies.
Occurrence data was gathered from GBIF for the Norwegian CWR as this was deemed the
150
most complete source of presence information that was available for the taxa. Additional
information about the use of the CWR, the relationship to the cultivated crop, red list status and
more, was gathered to create the Norwegian Inventory of CWR (Table S2.2, chapter 3).
The conservation planning process for CWR can be separated out into in situ and ex situ
priorities. In Norway, the focus was upon multi-species CWR conservation as decided by
national stakeholders. One reason for this was that the CWR concept was still relatively little
understood in the wider conservation and policy maker community. Therefore, there was a
need to demonstrate a ‘value-for-money’ approach to conservation and to be more efficient
with the resources available. Recent research has suggested that instead of focusing upon
species level site selection for CWR, the focus should be upon the selection of the most
appropriate CWR populations, called MAWPs (Maxted et al., 2012The premise behind
MAWPs is that they are targeted for conservation regardless of their location inside or outside
of a PA. As discussed below, analyses were conducted across both the whole of Norway and
restricted to inside PAs only. The MAWPs were identified in the sense that these populations
occurred in locations that contained high levels of CWR richness (i.e. high numbers of multiple
taxa populations; Maxted et al. (2015)). As the focus was on multispecies conservation this
meant they were the most appropriate populations to conserve for Norway.
6.1.1 In situ diversity analysis
The in situ diversity analysis process is documented in chapter 3 and Phillips et al. (2016).
Perhaps the most valuable output for this project in terms of in situ analyses was the production
of the in situ complementary networks for the priority CWR in Norway. Two methods were
followed, a grid cell analysis (Figure 3.3) and a PA analysis (Figure 3.4). The grid cell analysis
meant that the MAWPs were identified regardless of their presence inside a PA. Both methods
were used so a comparison could be made between the complementary networks identified. In
151
this case six locations overlapped between both analyses (Table 3.4), suggesting that these
locations contain particularly high taxa richness and could be prioritised over other locations
for further in situ conservation actions. If resources and time are limited it may be appropriate
to focus only upon the PA network, as conservation will be easier to implement and by the
definition of a PA, conservation of the species is already taking place even if only passively
(Maxted et al., 2008). Furthermore, for Norway the PA complementary network still conserves
90% of priority taxa. Within heavily populated countries such as the UK, focusing upon the
PA network for conservation of CWR may initially be the only option to ensure conservation
of these taxa (Fielder, 2015). However, by focusing upon PAs only this suggests MAWPs are
not located outside of these areas. This will not be true, even in heavily populated areas and as
such, a response to this would be to increase conservation of populations in areas such as road
verges and field margins, habitats preferable for CWR (Jarvis et al., 2015). Within Norway,
protected landscapes are an important category of PA. They often cover agricultural
landscapes that are actively used and the maintenance of this is encouraged (Norwegian
Environment Agency, 2017). These will be important areas to focus the in situ conservation of
CWR upon, especially wild forage species which favour this habitat type in Norway.
Conservation outside formal PAs and a more dynamic approach to conservation activities will
become more important in the long term due to the effects of climate change and the increasing
environmental and anthropogenic impacts upon wild populations.
The climate change diversity analysis is essential for long term conservation planning, with the
results for Norway suggesting that CWR distribution may shift further northward in the future
(see chapter 4 and Phillips et al., 2017). Although there are uncertainties associated with these
predictions the information presented will be useful to inform management and monitoring
plans for the priority CWR. The climate change analysis lends itself to being utilised most

152
effectively in the creation of robust and long-term management plans. The results can be used
to create both incremental and transformative management plans for genetic reserves or for
particular taxa and particular populations (see chapter 4 and Phillips et al., 2017). In this way,
PA managers can be prepared for the future potential impacts of climate change without
needing to expend large amounts of resources upon the creation of new PAs. This is an area of
research that would benefit greatly from practical application and close collaboration between
scientists and conservation managers as well as policy makers.
The genetic diversity work carried out in chapter 5 showed that the south of Norway may be
more genetically diverse and contain more distinct genetic diversity than northern areas. This
suggests that initially focusing in situ conservation in the southern regions may be a good area
to target resources, which is also in accordance with the results of the complementarity
analysis. Five of the six locations that overlap from the complementarity analyses are located
in the south of Norway. It will still be necessary to conserve populations further north as they
contain different genetic diversity to that found in the south, as supported by the genetic
diversity results (Table 5.3), the ELC map (Figure 3.6) and complementarity analysis (Figure
3.3, 3.4) which identify several locations in the north for potential conservation actions. The
genetic diversity studies increase the knowledge of the structure of in situ populations and will
be valuable for PA managers who will need to create appropriate management plans for the
taxa. Due to the high costs associated with genetic diversity studies it may be best to conduct
this analysis once the populations and/or location of a genetic reserve have been established by
the diversity analysis methods described in chapters 3 and 4. The use of the ELC map (Figure
3.6) to target populations for conservation is a more readily available tool that may be used as a
proxy for genetic diversity when the latter information is not available (Parra-Quijano et al.,
2012b). The work in chapter 5 revealed that the levels of genetic diversity for the three species
153
studied was different across ELC zones, again with those zones in the south showing higher
levels of diversity than the north. Although this pattern of genetic diversity may not be
reflected in different countries it does suggest that the use of an ELC map to decide which
populations to conserve to capture the full range of diversity available is a valid assumption for
the species studied. The genetic studies also show that most of the diversity is found within
rather than between populations, with a similar pattern being found in meadow fescue
populations across Norway (Fjellheim and Rognli, 2005). This suggests the conservation of a
large number of individuals from a few populations would conserve the majority of genetic
diversity, favouring the use of in situ conservation over ex situ conservation for the three
species studied (C. carvi, T. pratense and T. repens). This may also be the case for other
priority CWR in Norway, especially forage related species which are abundant in the Nordic
countries. The most sustainable way of maintaining such diversity will be to promote their in
situ conservation (Batello et al., 2008) as forage species tend to have large, widely distributed
populations spread across a range of different environments.
6.1.2 Ex situ diversity analysis
For ex situ conservation, a gap analysis assessment is the priority as it gives an overview of the
extent of ex situ conservation currently taking place. Within Norway, the gap analysis (see
chapter 3 and Phillips et al., 2016) identified 88% of priority taxa without any ex situ
accessions. An extension of this analysis utilising the ELC map and the Representa tool from
CAPFITOGEN gave a more detailed assessment of the extent of diversity conserved ex situ.
This showed that of the 24 taxa conserved ex situ, 15 had more than five populations conserved
across their ecogeographic range. This shows that of the taxa conserved ex situ over half have
an acceptable ex situ representation of their in situ diversity (i.e. minimum of five
geographically distinct populations conserved according to Brown and Briggs (1991)). For the

154
taxa that did not have any ex situ accessions the most species rich areas to collect from are
those regions in the south (Figure S3.3). This information can be used to inform future
collecting missions to increase the representation of taxa conserved ex situ. Furthermore, the
results from the Representa tool in CAPFITOGEN (Figure 3.7) can be used to inform focused
collecting missions to increase the range of genetic diversity conserved ex situ by targeting
collection of populations from under represented ELC zones (Parra-Quijano et al., 2012c).
Predictive characterization methods can also use the environmental information from the ELC
zones to identify potentially useful traits that individuals may contain (Thormann et al., 2014).
This information can contribute towards enabling plant pre-breeders to select material for
further breeding work.
For ex situ conservation priorities, climate change studies within Norway (chapter 4) identified
taxa that may become threatened in the future. This threat level, based upon the IUCN
category A3(c) (IUCN, 2001), can be used to focus ex situ collecting activities on those
potentially threatened species. This can also be combined with the results from the gap
analysis to further prioritise which taxa require immediate collection (Magos Brehm et al.,
2016). The climate change results can allow the further prioritisation of ex situ collecting
activities which is essential if resources and time are limited.
The genetic diversity work in chapter 5 was conducted on wild populations collected in situ
and for which seeds were not collected for ex situ storage. AFLP studies were not conducted
upon ex situ material, therefore the level of genetic diversity currently conserved ex situ (as
measured by molecular markers) is unknown. However, the genetic results suggest that
focusing ex situ collecting efforts on populations in the south of Norway may be the most
efficient method of collecting the most genetically diverse and distinct populations. As
demonstrated by the AFLP results the level of genetic diversity is different across the ELC

155
zones. The results from the genetic diversity studies also show most of the diversity is within
populations rather than amongst. This favours the use of in situ conservation as large numbers
of individuals will need to be conserved. It may not be efficient to conserve such a large
number of individuals ex situ due to the high costs of traditional ex situ conservation methods
(A. Palmé, 2016, pers comms.; although Li and Pritchard (2009) argue against this) and the
need to regenerate material periodically which is time consuming and may have a negative
impact on the genetic integrity of material (Hamilton, 1994; van Hintum et al., 2002). Ex situ
conservation will require taking a sub sample of the in situ population to conserve, therefore it
is not possible for the ex situ material to capture the full range of genetic diversity present
within the population. If the recommendation by Brown and Briggs (1991) to conserve five
different populations ex situ is followed, it will likely protect 90-95% of common alleles and
represent the range of genetic diversity found in situ. However, Brown and Marshall (1975)
recommend targeting alleles that are locally common, as common alleles will likely be
represented within a collection. These locally common alleles will be found in populations
adapted to specific environments and may be represented by the private alleles found within the
populations (Slatkin & Takahata, 1985), strengthening the case for collection of accessions
from southern populations in Norway. Crossa et al. (2011) recommend collecting seeds from
at least 25 individuals of cross-fertilizing species (of which the three species studied are) but
also that seeds should be collected from the largest possible number of sites. These collecting
strategies will of course depend upon the resources available for conservation, which is
therefore why the Brown and Briggs (1991) recommendation to conserve five populations is
suggested as a minimum.
AFLPs were chosen for this study as they offered the most cost effective method of obtaining
information upon the genetic diversity for the three CWR chosen. It may be more efficient to

156
utilise different molecular methods such as SNPs or whole genome sequencing (Bruford et al.,
2017) that can identify adaptive genetic diversity within collections. SNPs were not available
for the CWR studied and whole genome sequencing was not within the means of this project.
These methods may help determine if there is a link between adaptive genetic diversity and the
ELC zones, which may be more beneficial to plant pre-breeders for targeting future collecting
missions.
6.1.3 What have we achieved in Norway?
For conservation priorities in Norway this study used a bottom-up approach (Maxted et al.,
2013) whereby priorities were identified at the national level by relevant stakeholders. These
national level priorities can now be incorporated into regional (Weibull et al., 2016), European
(Maxted et al., 2015) and global (Maxted et al., 2012) conservation strategies for CWR.
Due to the engagement of stakeholders from the beginning and the opportunity to be involved
with the creation of a new NP in Norway, the inclusion of the priority list of CWR into the
protected area management plan for Færder NP was achieved (M. Rasmussen., 2017, pers.
comm.). The process of collaboration began at the outset of this project (in 2013) before the
detailed scientific background had been established or the required policy instruments to create
a genetic reserve had been put in place. In conjunction with the creation of a Nordic CWR
conservation programme (Weibull et al., 2016), Norwegian PA managers for Færder were
involved in the first regional workshop held on Østre Bolærne in Færder NP (May 2015) for
which both the scientific and conservation communities collaborated (Weibull et al., 2016).
This example of stakeholder engagement from the outset meant conservation authorities could
see the value that the priority CWR taxa had, not only at the national level but also at the
regional level. Furthermore, PA managers were able to see that the level of work required to
maintain these populations in situ would be minimal as, in this instance, populations had
157
already been documented and just required continued monitoring, which can follow the
methods proposed by Iriondo et al. (2012).
Færder NP was selected as the first genetic reserve for CWR in Norway not directly based
upon the diversity analyses (chapters 3, 4) but based upon the practicability of instigating
conservation of such taxa. It happens that Færder NP shows up as a gap in the knowledge on
the current distribution of CWR in Norway (Figure S3.2) due to the lack of occurrence
information in GBIF at the time of data collection. Interestingly, local botanists have an in-
depth knowledge of the flora on the archipelago, but due to the common nature of the priority
CWR these taxa were often not included in survey notes. However, at workshops, local expert
knowledge highlighted the area as already being rich in species due to the calcareous nature of
the soils. Management plans include the reintroduction of grazing sheep on some of the islands
to limit the natural succession into forest that is beginning to take place. This will encourage
the priority CWR populations to increase as they tend to favour open grassland more than
complex forest habitat (Jarvis et al., 2015). The application of the MAWP methodology
(Maxted et al., 2012) can also be applied here. For a country as large and ecologically diverse
as Norway, initially focusing on population conservation (i.e. MAWPs) instead of species
conservation was not appropriate due to the large number of populations, but at the level of
specific management plans and establishment of genetic reserves this concept can be more
effectively applied. This population level management is emphasized by Iriondo et al. (2012),
Maxted et al. (2012) and Fielder (2015).
Policy wise, the scientific work on the proposed genetic reserve began with the knowledge that
issues regarding funding for the future monitoring of the taxa had not been addressed.
Furthermore, as the conserved genetic resources are a resource this means having access to the
material for use is a requirement. These issues have not yet been fully resolved in Norway
158
(although progress is being made; M. Rasmussen, 2017, pers. comms.) and until they are,
official status as a genetic reserve may not be possible. These policy obstacles are not specific
to Norway, with work on the UK CWR conservation strategy facing similar policy obstacles
(Fielder, 2015). Moreover, these issues could not be resolved within the scope of this PhD
thesis and will require collaboration between colleagues from the various ministries within
Norway.
In general, CWR diversity planning for Norway has identified some essential needs for further
work on the conservation of CWR. The increased surveying effort for species across Norway,
within and outside of PAs will be essential to give a broader picture of the populations that may
be important for future use. Climate change analysis supports the need for continued
monitoring of taxa distributions, where and which taxa to focus monitoring upon. It is also
important to note that selecting populations for conservation is always flexible and will change
as food security needs change. It is likely that these findings are not only applicable within
Norway but across other countries and regions. Simply increasing monitoring and surveying
efforts of CWR across Norway may be a simple approach to a greater understanding of where
and what CWR diversity is available. This knowledge can help to more fully identify
populations that will be the most important to our future food security.
6.1.4 The Nordic Project
In 2015 work began on initiating the conservation of CWR at the Nordic level (Weibull et al.,
2016). The project is focused on the in situ conservation of CWR as well as increasing
knowledge of both in situ and ex situ conservation of CWR across the Nordic region. The
project has identified 133 priority taxa based upon gross economic production values at the
global and Nordic levels, crop relatedness expressed as genepool or taxon group levels and
breeders estimates of wild forage value for use (Weibull et al., 2016).

159
The Nordic countries already have a regional collaboration since 1979 for the ex situ
conservation of PGR in the form of NordGen (www.nordgen.no), of which Norway contributes
material too. The new project aims to help integrate in situ conservation at the regional level
into this collaboration and encourage the creation of national level strategies and policy
framework to implement PGR conservation actions (Weibull et al., 2016). The Nordic project
has already identified six recommendations that will be delivered to policy makers to further
expand the conservation of CWR across the region (Nordgen, 2016). The Norwegian project
and national stakeholders have contributed greatly towards to the Nordic project with policy
actions one, three and four already being reached within Norway. This includes the creation of
a national strategy for conservation of CWR, the use of in situ conservation for safeguarding
CWR and the implementation of in situ conservation in at least one site (Færder NP). The
remaining recommendations include the need to develop policy instruments at the national
level for conservation and use of CWR and the establishment of complementary conservation
across multiple sites. The final recommendation relates to the development of a common
Nordic approach to CWR conservation and use.
This regional level project and the work being done at a national level in Norway are
complementary to each other and will help strengthen the voice for conservation and use of
CWR. These initiatives will also help towards meeting the CBD’s strategic plan for 2011-2020
to halt the loss of genetic diversity, as well as the GSPC target 9 to conserve 70% of genetic
diversity of crops including their wild relatives by 2020. Regarding the bigger picture, the
regional and national projects for conservation and use of CWR will help towards meeting the
Sustainable Development goals (UN, 2015a) to protect and enhance global food security.
160
6.2 Project limitations
There may never be a point at which we have enough data available to satisfy the needs of
scientific analysis. Data availability and reliability is almost always something that can be
improved upon. Within the Norwegian work, data was gathered from GBIF and filtered by
number of decimal places to remove inaccurate data. The reliability of this data could be
improved by utilising the CAPFITOGEN tool GEOQUAL (Parra-Quijano et al., 2016) which
assesses the consistency of the data more completely. More occurrence data could also be
gathered in the field to give a more complete view of the distribution of CWR across Norway.
The under recording of common species such as many CWR means that potentially useful traits
and genetic diversity within those populations are being missed by conservationists and plant
breeders. These problems are not restricted to this project and are common when using species
distribution modelling techniques (Anderson et al., 2006). The limits associated with the use of
species distribution modelling software has been well discussed in other literature (Anderson et
al., 2006; Araujo & Guisan, 2006).
In the climate change studies (chapter 4, and Phillips et al., 2017), there will be inherent
uncertainty of predictions due to the nature of such work. For the Norwegian work, which used
a single climatic model, the range of possible outcomes will be substantially underestimated
(Burke et al., 2015a). It may be more beneficial to use multiple models to create predictions
(see ‘6.3 Further work’ section below), which may provide a wider range of climatic
predictions but may be more credible to policy-makers (Burke et al., 2015b).
The genetic diversity studies proved to be the most challenging part of the project. Initially
genetic studies were to be carried out upon ten priority CWR taxa and material was collected
for all species. However, during the lab procedure and analysis of the AFLP outputs it was

161
apparent that the procedure had not been successful. This meant that we were only able to re-
run the analysis upon a smaller (three) number of species, therefore severely limiting the
breadth at which our analysis was done. The lack of reliable results (as illustrated by the high
dataset error rates) was the biggest limitation to the interpretation of our results. The main
source of error is as yet unidentified and could be isolated to the initial DNA quality being
poor, problems in the lab procedure or the final analysis of the results and the choice of
software. One solution to this could be to use larger samples sizes with Khanlou et al. (2011)
suggesting a minimum of 30 individuals per population. Perhaps the best option would be to
utilise different molecular techniques such as SNPs or by undertaking entire genome
sequencing of the species (Bruford et al., 2017). The latter has already been done for crops
such as Brassica rapa (Wang et al., 2011), barley (International Barley Genome Sequencing
Consortium, 2012) and soybean (Cannon et al., 2009), amongst others. It would be beneficial
in any future genetic diversity studies to focus research upon identifying adaptive diversity that
both conservationists and plant pre-breeders can harness.
The work done for the conservation of CWR in Norway was never seen as just an academic
exercise. This is illustrated by the successful incorporation of management plans for the taxa
into Færder NP as well as the initiation of the Nordic CWR project. However, a major
limitation for the continuation and further implementation of this work is the policy barriers
that are in place. The lack of clarity on which government departments should be responsible
for the conservation of CWR will prevent any further movement on this work. Within Norway
there is also differences between each region as the PAs are managed by different authorities.
Therefore, each region will have to decide if CWR conservation is a priority for them. With
the establishment of Færder NP as a genetic reserve for CWR and impetus from the Nordic

162
project and global initiatives this will encourage regional authorities and the national
government to act more decisively upon conservation of CWR.
6.3 Further work
• Species by species diversity analysis: specific in situ and ex situ conservation
recommendations for individual species, including diversity analysis (chapter 3), climate
change studies (chapter 4) and genetic diversity studies (chapter 5). Work on this has
already begun with a project on R. chamaemorus across Norway and the Czech Republic
(M. Rasmussen and V. Holubec, 2017, pers. comms.) which will identify the in situ and
ex situ conservation needs for the species so future conservation missions can take place.
The MAWPs can be identified for priority species and further climate change analysis
could be developed which should include undertaking climate change vulnerability
studies (CCVA; Foden et al., 2009). Species specific management plans can also be
created that account for both incremental and transformational management strategies
which will incorporate the potential effects of climate change. By creating species
specific strategies, conservation can be more targeted towards the needs of plant pre-
breeders who are looking for specific traits. This process could be done for other priority
CWR in Norway as and when the funding and opportunities become available.
• Develop ELC maps for the future climatic conditions: these could be used along with the
climate change analysis to help plant pre-breeders identify populations that they may
require specific traits from in the future i.e. predictive characterization. The future ELC
map could show how environmental conditions may change and whether this may
influence plant population distribution. This could help determine if genetic diversity for

163
specific environmental adaptations may be lost which allows the targeting of those at-
risk populations for conservation actions.
• Adaptive genetic diversity studies: although we have identified the levels of neutral
genetic diversity within and between populations the usefulness of such genetic diversity
remains unknown. We need to assay functional genes that matter for improving crops
and will benefit farmers, not just conservationists as neutral genetic diversity does
(Brown, 2008). As costs come down this could be done using SNPs or whole genome
sequencing.
• Genetic diversity comparisons between CWR and cultivars: a comparison between
cultivated and wild T. pratense was initially part of the original project, however due to
the problems with the AFLP analysis this data was not appropriate to utilise. By
determining how different wild and cultivated populations are it will help identify which
populations we should be conserving and utilising, as we may only want to conserve
those that are the most different from cultivars. This was the case with meadow fescue,
in which western and southern populations were targeted for conservation as they were
the most different to cultivars (Fjellheim and Rognli, 2005).
• Landscape protected areas: this type of PA could be very important for the establishment
of CWR conservation as well as the engagement of local stakeholders within Norway. In
landscape protected areas the maintenance of traditional agricultural activities are
encouraged which may favour the establishment of CWR populations. It may be
beneficial to carry out research on the occurrence of the priority CWR within these PAs.
164
A comparison between taxa richness as well as the levels of genetic diversity in such
landscapes may help to determine if these areas should be the focus of in situ conservation
actions in Norway.
• Policy changes: although outside the scope of this project, policy changes are an essential
area of research that needs to be pursued if further active conservation and use of CWR
is to take place. It would be beneficial to undertake studies on the economic value of
CWR and how they contribute towards ecosystem services and add value to PAs. Some
important aspects of policy research include: enabling the conservation and use of PGR
outside of PAs, perhaps through agri-environment schemes; the designation of PAs as
genetic reserves for PGR; the legislation required for the collecting of taxa from the wild
to be used for breeding purposes.
• Education: it is impossible to care for something if you know nothing about it, therefore
education will be an essential step in the continuation of PGR conservation and use. High
profile programs such as the Adapting Agriculture to Climate Change project and the
Svalbard Global Seed Vault are already engaging audiences about the value of PGR. At
local and national levels actions such as including information boards in PAs that
highlight the link between the wild ‘weeds’ and our food could be a simple but effective
step to get the food security message across.
165
6.4 Conclusion
Our food systems underpin the workings of the planet but the lack of understanding of where
our food comes from and how we should be effectively utilising the diversity available to us
may lead to a food crisis in the future. In northern Europe climate change may present new
opportunities for agriculture such as increased growing season length and crop productivity
(Uleberg et al., 2014; Burke et al., 2015b). However, climate change will also have negative
effects on ecosystem services and the distribution of wild species which will inevitably lead to
the loss of genetic diversity from wild populations. As discussed throughout this study, genetic
diversity underpins the resilience of our food system by allowing species to develop
adaptations to changing conditions. The genetic diversity most valuable to us is harnessed by
plant pre-breeders to enhance our food systems, however diversity is also lost through the
domestication of species by the selection of a few traits that are beneficial to us now.
The work presented above contributes towards the Norwegian strategy for the in situ and ex
situ conservation of CWR. The impending establishment of the first genetic reserve for CWR
in Norway has shown that there is an appetite amongst conservationists, not just academics, for
the protection of these resources. The link to plant pre-breeders will be established with
projects such as the Adapting Agriculture to Climate Change work which is developing the pre-
breeding of certain CWR. Once it is seen that harnessing the value of our natural genetic
diversity is accessible and beneficial then the call for conservation of such resources will
become that much stronger.
From the work above, by combining in situ and ex situ diversity analyses, climate change
studies and genetic diversity work, an effective conservation strategy and the groundwork for
further studies has been established. The project has helped increase the knowledge on

166
Norwegian CWR conservation and the potential availability of a rich source of breeding
material for plant pre-breeders. The study has also helped to further develop methodologies
needed to create national strategies in other countries and strategies at regional and global
levels. Working from the local level and engaging with stakeholders directly has made it
possible for this academic work to have a practical impact upon CWR conservation in Norway.
Although we face great challenges from both politics and climate change this project has
shown that there is an appetite for PGR conservation and use. This work is only the beginning
of a more effective strategy to protect national and international food security for the future.
167
References
Abberton, M. (2011). New opportunities for forage species. Available online:
http://www.dairyco.org.uk/resources-library/research-development/production-
system/newopportunities-for-forage-species/#.VFtd3HnivIV [Accessed 1 April 2017]
Ahsyee, R. S., Ćalić, I., Zorić, M., Karagić, Đ. & Šurlan-Momirović, G. (2014). Enetic
diversity in red clover (Trifolium pratense L.) using SSR markers. Genetika, 46, 949-
961.
Al Lawati, A. H., Al Saady, N., Ghaloub, H. A., Patzelt, A., Phillips, J., Maxted, N., Al
Balushi, A. H., Al-Maqbali, D., Al Naabi, A. S., Al Busaidi, K. A., Al Kharusi, M., Al
Shukaili, M. S., Al Jabri, A. A. & Al Nabhani, H. M. (2017). Plant Agrobiodiversity
Conservation Strategy for the Sultanate of Oman. Muscat, Sultanate of Oman: Oman
Animal and Plant Genetic Resources Center, the Research council of the Sultanate of
Oman. In press.
Allard, R. (1992). Predictive methods for germplasm identification. In: H. Stalker, and J. P.
Murphy, eds., Plant Breeding in the 1990s. Wallingford, UK: CAB International.
Allem, A. C. (1997). Roadside habitats: a missing link in the conservation agenda.
Environmentalist, 17, 7-10.
Alsos, I. G., Ehrich, D., Thuiller, W., Eidesen, P. B., Tribsch, A., Schonswetter, P., Lagaye, C.,
Taberlet, P. & Brochmann, C. (2012). Genetic consequences of climate change for
northern plants. Proceedings of the Royal Society B-Biological Sciences, 279, 2042-
2051.
Anderson, R. P., Dudík, M., Ferrier, S., Guisan, A., Hijmans, R. J., Huettmann, F., Leathwick,
J. R., Lehmann, A., Li, J. & Lohmann, L. G. (2006). Novel methods improve prediction
of species’ distributions from occurrence data. Ecography, 29, 129-151.
Applied Biosystems. (2006). Peak Scanner. 1.0 ed. Foster City, USA: Applied Biosystems.
Araujo, M. B. & Guisan, A. (2006). Five (or so) challenges for species distribution modelling.
Journal of Biogeography, 33, 1677-1688.
Araújo, M. B., Cabeza, M., Thuiller, W., Hannah, L. & Williams, P. H. (2004). Would climate
change drive species out of reserves? An assessment of existing reserve-selection
methods. Global Change Biology, 10, 1618-1626.
Arctic Climate Impact Assessment. (2004). Impacts of a warming Arctic. Cambridge, UK:
Cambridge University Press. Available at: https://www.amap.no/documents/doc/arctic-
arctic-climate-impact-assessment/796 [Accessed 6 April 2017]
168
Arrigo, N., Tuszynski, J. W., Ehrich, D., Gerdes, T. & Alvarez, N. (2009). Evaluating the
impact of scoring parameters on the structure of intra-specific genetic variation using
RawGeno, an R package for automating AFLP scoring. Bmc Bioinformatics, 10, 33.
Barber, Q. E., Nielsen, S. E. & Hamann, A. (2016). Assessing the vulnerability of rare plants
using climate change velocity, habitat connectivity, and dispersal ability: a case study in
Alberta, Canada. Regional Environmental Change, 16, 1433-1441.
Beatty, G. E. & Provan, J. (2011). Comparative phylogeography of two related plant species
with overlapping ranges in Europe, and the potential effects of climate change on their
intraspecific genetic diversity. BMC Evolutionary Biology, 11, 29.
Batello, C., Mannetje, L., Martinez, A., Suttie, J. (2008). Plant Genetic Resources of Forage
Crops, Pasture and Rangelands. Thematic Background Study. Rome, Ital. FAO Report.
Available at:
http://www.fao.org/fileadmin/templates/agphome/documents/PGR/SoW2/thematicstudy
_forage.pdf [Accessed 6 April 2017]
Bentsen, M., Bethke, I., Debernard, J. B., Iversen, T., Kirkevåg, A., Seland, Ø., Drange, H.,
Roelandt, C., Seierstad, I. A. and Hoose, C. (2013). The Norwegian earth system
model, NorESM1-M—Part 1: description and basic evaluation of the physical climate.
Geosci.Model Dev, 6, 687-720.
Bijlsma, R., Bundgaard, J. & Boerema, A. C. (2000). Does inbreeding affect the extinction risk
of small populations?: predictions from Drosophila. Journal of Evolutionary Biology,
13, 502-514.
Bijlsma, R. & Loeschcke, V. (2012). Genetic erosion impedes adaptive responses to stressful
environments. Evolutionary Applications, 5, 117-129.
Bilz, M., Kell, S. P., Maxted, N. and Lansdown, R. V. (2011). European Red List of Vascular
Plants. Luxembourg, European Commission.
Bivand, R., Keitt, T. & Rowlingson, B. (2014). rgdal: Bindings for the geospatial data
abstraction library. R package version 0.8-16.
Bolliger, J., Eggenberg, S., Ismail, S., Seidl, I. & Kienast, F. (2011). Balancing Forest‐
Regeneration Probabilities and Maintenance Costs in Dry Grasslands of High
Conservation Priority. Conservation Biology, 25, 567-576.
Bonin, A., Bellemain, E., Bronken Eidesen, P., Pompanon, F., Brochmann, C. & Taberlet, P.
(2004). How to track and assess genotyping errors in population genetics studies.
Molecular ecology, 13, 3261-3273.
Bonin, A., Ehrich, D. & Manel, S. (2007). Statistical analysis of amplified fragment length
polymorphism data: a toolbox for molecular ecologists and evolutionists. Molecular
ecology, 16, 3737-3758.

169
Booth, T. H., Nix, H. A., Busby, J. R. & Hutchinson, M. F. (2014). BIOCLIM: the first species
distribution modelling package, its early applications and relevance to most current
MAXENT studies. Diversity and Distributions, 20, 1-9.
Bradter, U., Kunin, W. E., Altringham, J. D., Thom, T. J. & Benton, T. G. (2013). Identifying
appropriate spatial scales of predictors in species distribution models with the random
forest algorithm. Methods in Ecology and Evolution, 4, 167-174.
Branca, F., Argento, S. & Tribulato, A. (2012). Assessing genetic reserves in Sicily (Italy): The
Brassica wild relatives case study. In: N. Maxted., M. E. Dulloo., B. V. Ford-Lloyd., L.
Frese., J. M. Iriondo & M. A. A. Pinheiro De Carvalho. eds., Agrobiodiversity
Conservation: Securing the Diversity of Crop Wild Relatives and Landraces.
Wallingford, UK: CAB International.
Brown, A. H. (2008). Indicators of genetic diversity, genetic erosion and genetic vulnerability
for plant genetic resources for food and agriculture. FAO, Rome.
Brown, A. H. D. and Briggs, J. D. (1991). Sampling strategies for genetic variation in ex situ
collections of endangered plant species. In: Falk, D. A. & Holsinger, K. E. (eds.)
Genetics and conservation of rare plants. New York: Oxford University Press.
Bruford, M. W., Davies, N., Dulloo, M. E., Faith, D. P. & Walters, M. (2017). Monitoring
Changes in Genetic Diversity. In: M. Walters. And R. J. Scholes. eds., The GEO
Handbook on Biodiversity Observation Networks. Cham: Springer International
Publishing.
Buckler, E. S., Thornsberry, J. M. & Kresovich, S. (2001). Molecular diversity, structure and
domestication of grasses. Genetics Research, 3, 213-218.
Burke, M., Dykema, J., Lobell, D. B., Miguel, E. & Satyanath, S. (2015a). Incorporating
climate uncertainty into estimates of climate change impacts. Review of Economics and
Statistics, 97, 461-471.
Burke, M., Hsiang, S. M. & Miguel, E. (2015b). Global non-linear effect of temperature on
economic production. Nature. 527, 235-239.
Cannon, S. B., May, G. D. & Jackson, S. A. (2009). Three sequenced legume genomes and
many crop species: rich opportunities for translational genomics. Plant Physiology, 151,
970-977.
Carpenter, G., Gillison, A. N. & Winter, J. (1993). DOMAIN: a flexible modelling procedure
for mapping potential distributions of plants and animals. Biodiversity & Conservation,
2, 667-680.
Castañeda-Álvarez, N. P., Khoury, C. K., Achicanoy, H. A., Bernau, V., Dempewolf, H.,
Eastwood, R. J., Guarino, L., Harker, R. H., Jarvis, A. & Maxted, N. (2016). Global
conservation priorities for crop wild relatives. Nature plants, 2, 16022.

170
Chapman, A. D. (2005). Principles of Data Quality, version 1.0. Report for the Global
Biodiversity Information Facility. Copenhagen.
Chase, M. W. & Hills, H. H. (1991). Silica Gel: An Ideal Material for Field Preservation of
Leaf Samples for DNA Studies. Taxon, 40, 215-220.
Chowdhury, M. A. & Slinkard, A. E. (2000). Genetic diversity in grasspea (Lathyrus sativus
L.). Genetic Resources and Crop Evolution, 47, 163-169.
Christmas, M. J., Breed, M. F. & Lowe, A. J. (2016). Constraints to and conservation
implications for climate change adaptation in plants. Conservation Genetics, 17, 305-
320.
Collins, R. P., Helgadottir, A., Frankow-Lindberg, B. E., Skøt, L., Jones, C. & Skøt, K. P.
(2012). Temporal changes in population genetic diversity and structure in red and white
clover grown in three contrasting environments in northern Europe. Annals of Botany,
110, 1341-1350.
Conolly, J., Manning, K., Colledge, S., Dobney, K. & Shennan, S. (2012). Species distribution
modelling of ancient cattle from early Neolithic sites in SW Asia and Europe. The
Holocene, 22, 997-1010.
Costa, G. C., Nogueira, C., Machado, R. B. & Colli, G. R. (2010). Sampling bias and the use of
ecological niche modeling in conservation planning: a field evaluation in a biodiversity
hotspot. Biodiversity Conservation, 19, 883-899.
Cowling, R. M., Pressey, R. L., Sims-Castley, R., Le Roux, A., Baard, E., Burgers, C. J. &
Palmer, G. (2003). The expert or the algorithm?—comparison of priority conservation
areas in the Cape Floristic Region identified by park managers and reserve selection
software. Biological Conservation, 112, 147-167.
Crossa, J. & Vencovsky, R. (2011). Basic sampling strategies: theory and practice. Collecting
plant genetic diversity: Technical guidelines.
Cummins, I. N. and Aldwinckle, H. S. (1979). Breeding tree crops. In: M. K. Harris. ed.,
Biology and breeding for resistance to anthropods and pathogens in agricultural
plants. Texas Agricultural Experiment Station: Texas A and M University.
Dagher-Kharrat, M. B., Mariette, S., Lefevre, F., Fady, B., Grenier-De March, G., Plomion, C.
& Savoure, A. (2007.) Geographical diversity and genetic relationships among Cedrus
species estimated by AFLP. Tree Genetics and Genomes, 3, 275-285.
De Groot, R. S., Wilson, M. A. & Boumans, R. M. (2002). A typology for the classification,
description and valuation of ecosystem functions, goods and services. Ecological
economics, 41, 393-408.
Dempewolf, H., Baute, G., Anderson, J., Kilian, B., Smith, C. & Guarino, L. (2017). Past and
Future Use of Wild Relatives in Crop Breeding. Crop Science.
171
Dempewolf, H., Eastwood, R. J., Guarino, L., Khoury, C. K., Mãlier, J. V. & Toll, J. (2014).
Adapting Agriculture to Climate Change: A Global Initiative to Collect, Conserve, and
Use Crop Wild Relatives. Agroecology and Sustainable Food Systems, 38, 369-377.
Dias, P. M. B., Julier, B., Sampoux, J.-P., Barre, P. & Dall’agnol, M. (2008). Genetic diversity
in red clover (Trifolium pratense L.) revealed by morphological and microsatellite
(SSR) markers. Euphytica, 160, 189-205.
Dias, S., Dulloo, M. E. & Arnaud, E. (2011). 33 The Role of EURISCO in Promoting Use of
Agricultural Biodiversity. Agrobiodiversity Conservation Securing the Diversity of
Crop Wild Relatives and Landraces, 270.
Diniz-Filho, J. A. F., Soares, T. N., Lima, J. S., Dobrovolski, R., Landeiro, V. L., Pires de
Campos Telles, M., Rangel, T. R., Bini, L. M. (2013) Mantel test in population
genetics. Genetic and Molecular Biology, 36, 4, 475-485.
Dormann, C. F., Elith, J., Bacher, S., Buchmann, C., Carl, G., Carré, G., Marquéz, J. R. G.,
Gruber, B., Lafourcade, B. & Leitão, P. J. (2013). Collinearity: a review of methods to
deal with it and a simulation study evaluating their performance. Ecography, 36, 27-46.
Dulloo, M. E., Labokas, J., Iriondo, J. M., Maxted, N., Lane, A., Laguna, E., Jarvis, A. & Kell,
S. P. (2008). Genetic reserve location and design. In: J. M. Iriondo., N. Maxted, & M.
E. Dulloo. eds., Conserving plant genetic diversity in protected areas. Wallingford:
CABI Publishing.
Edwards, D., Batley, J. & Snowdon, R. J. (2013). Accessing complex crop genomes with next-
generation sequencing. Theoretical and Applied Genetics, 126, 1-11.
Eidesen, P. B., Ehrich, D., Bakkestuen, V., Alsos, I. G., Gilg, O., Taberlet, P. & Brochmann, C.
(2013). Genetic roadmap of the Arctic: plant dispersal highways, traffic barriers and
capitals of diversity. New Phytologist, 200, 898-910.
Elith, J., Phillips, S. J., Hastie, T., Dudik, M., Chee, Y. E. & Yates, C. J. (2011). A statistical
explanation of MaxEnt for ecologists. Diversity and Distributions, 17, 42-57.
Esquinas-Alcazar, J. (2005). Protecting crop genetic diversity for food security: political,
ethical and technical challenges. Nature reviews. Genetics, 6, 946-953.
ESRI, (2011). ArcGIS Desktop Release 10.2. Redlands California: Environmental Systems
Research Institute.
EU, (2011). The EU Biodiversity Strategy to 2020. Belgium: European Union.
FAO, (2001). International Treaty on Plant Genetic Resources for Food and Agriculture. Rome,
Italy: Food and Agriculture Organization of the United Nations.
FAO, (2009a). How to Feed the World in 2050. Rome: Food and Agriculture Organization.
172
FAO, (2009b). Declaration of the world summit on food security. Rome: Food and Agricultural
Organization.
FAO, (2011). Second Global Plan of Action for Plant Genetic Resources for Food and
Agriculture. Rome: Food and Agriculture Organization of the United Nations.
FAO, (2015). Coping with climate change-the roles of genetic resources for food and
agriculture. Rome.
FAO. (2016). Agricultural Land [Online]. The World Bank. Available:
http://data.worldbank.org/indicator/AG.LND.AGRI.ZS [Accessed 29th March 2017].
FAO, (2016). The State of Food and Agriculture. Rome: Food and Agriculture Organization of
the United Nations.
FAO Stat, (2013). Food and Agriculture Organisation Statistics.
Feuillet, C., Langridge, P. & Waugh, R. (2008). Cereal breeding takes a walk on the wild side.
Trends in genetics, 24, 24-32.
Fielder, H. (2015). Developing methodologies for the genetic conservation of UK crop wild
relatives. PhD, University of Birmingham.
Fielder, H., Brotherton, P., Hosking, J., Hopkins, J. J., Ford-Lloyd, B. & Maxted, N. (2015).
Enhancing the conservation of crop wild relatives in England. PloS one, 10, e0130804.
Fitzgerald, H. (2013). The national crop wild relative strategy report for Finland. Jokioinen:
MTT.
Fjellheim, S. & Rognli, O. A. (2005). Molecular diversity of local Norwegian meadow fescue
(Festuca pratensis Huds.) populations and Nordic cultivars-consequences for
management and utilisation. Theoritically Applied Genetics, 640-650.
Flato, G., Marotzke, J., Abiodun, B., Braconnot, Chou, S. C., Collins, W., Cox, P., Driouech,
F., Emori, E., Eyring, V., Forest, C., Gleckler, P., Guilyardi, E., Jakob, C., Kattsov, V.,
Reason, C. & Rummukainen, M. (2013). Evaluation of Climate Models. In: Stocker, T.
F., D. Qin, D., Plattner, G. K., Tignor, M., Allen, S. K., Boschung, J., Nauels, A., Xia,
Y., Bex, V. & Midgley, P. M. eds., Climate Change 2013: The Physical Science Basis.
Contribution of Working Group I to the Fifth Assessment Report of the
Intergovernmental Panel on Climate Change. United Kingdom and New York, USA:
Cambridge University Press.
Flores-Palacios, X. (1998). Contribution to the Estimation of Countries' Interdependence in the
Area of Plant Genetic Resources. Rome: Food and Agriculture Organization of the
United Nations.
Foden, W. B., Butchart, S. H. M., Stuart, S. N., Vié, J.-C., Akçakaya, H. R., Angulo, A.,
Devantier, L. M., Gutsche, A., Turak, E. & Cao, L. (2013). Identifying the world's most

173
climate change vulnerable species: a systematic trait-based assessment of all birds,
amphibians and corals. PLoS One, 8, e65427.
Foden, W. B., Mace, G. M., Vié, J.-C., Angulo, A., Butchart, S. H. M., Devantier, L., Dublin,
H. T., Gutsche, A., Stuart, S. & Turak, E. (2009). Species susceptibility to climate
change impacts. Wildlife in a changing world–an analysis of the 2008 IUCN Red List of
threatened species, 77.
Foden, W. B. & Young, B. E. (2016). IUCN SSC Guidelines for Assessing Species'
Vulnerability to Climate Change, Cambridge, UK and Gland, Switzerland, IUCN
Species Survival Comission.
Ford-Lloyd, B., Engels, J. M. M., Jackson, M. & Parry, M. (2013). Genetic resources and
conservation challenges under the threat of climate change. Plant Genetic Resources
and Climate Change, 4, 16.
Ford-Lloyd, B. V., Schmidt, M., Armstrong, S. J., Barazani, O., Engels, J., Hadas, R., Hammer,
K., Kell, S. P., Kang, D. & Khoshbakht, K. (2011). Crop wild relatives—undervalued,
underutilized and under threat? Bioscience, 61, 559-565.
Fourcade, Y., Engler, J. O., Rödder, D. & Secondi, J. (2014). Mapping species distributions
with MAXENT using a geographically biased sample of presence data: a performance
assessment of methods for correcting sampling bias. PloS one, 9, e97122.
Franklin, J., Serra-Diaz, J. M., Syphard, A. D. & Regan, H. M. (2016). Global change and
terrestrial plant community dynamics. Proceedings of the National Academy of
Sciences of the United States of America, 113, 3725-3734.
Franklin, J. F., Swanson, F. J., Harmon, M. E., Perry, D. A., Spies, T. A., Dale, V. H., Mckee,
A., Ferrell, W. K., Means, J. E., Gregory, S. V., Lattin, J. D., Schowalter, T. D. &
Larsen, D. (1992). Effects of global climatic change on forests in northwestern North
America. In: Peters, R. L. & Lovejoy, T. E. (eds.) Global Warming and Biodiversity.
New Haven: Yale University Press.
Fry, W. (2008). Phytophthora infestans: the plant (and R gene) destroyer. Molecular plant
pathology, 9, 385-402.
Ganal, M. W., Altmann, T. & Röder, M. S. (2009). SNP identification in crop plants. Current
opinion in plant biology, 12, 211-217.
Gasi, F., Kanlić, K., Stroil, B. K., Pojskić, N., Asdal, Å., Rasmussen, M., Kaiser, C. & Meland,
M. (2016). Redundancies and Genetic Structure among ex situ Apple Collections in
Norway Examined with Microsatellite Markers. HortScience, 51, 1458-1462.
GBIF. (2013). Biodivesity occurrence data available through the GBIF Data Portal.
Gederaas, L., Loennechen Moen, T., Skjelseth, S. & Larsen, L. K. (2012). Alien species in
Norway-with the Norwegian Black List 2012. Norwegian Ministry of the Environment.

174
Gent, P. R., Danabasoglu, G., Donner, L. J., Holland, M. M., Hunke, E. C., Jayne, S. R.,
Lawrence, D. M., Neale, R. B., Rasch, P. J. & Vertenstein, M. (2011). The community
climate system model version 4. Journal of Climate, 24, 4973-4991.
Gepts, P. (2006). Plant genetic resources conservation and utilization. Crop Science, 46, 2278-
2292.
Godfray, H. C. J., Beddington, J. R., Crute, I. R., Haddad, L., Lawrence, D., Muir, J. F., Pretty,
J., Robinson, S., Thomas, S. M. & Toulmin, C. (2010). Food Security: The Challenge
of Feeding 9 Billion People. Science, 327, 812-818.
Greene, S., Gritsenko, M. & Vandemark, G. (2004). Relating Morphologic and RAPD marker
varlation to collection site environment in wild populations of Red Clover (Trifolium
pratense L.). Genetic resources and crop evolution, 51, 643-653.
Greene, S. L. & Hart, T. C. (1999). Implementing a geographic analysis in germplasm
conservation. In: S. L. Greene & L. Guarino. eds., Linking genetic resources and
geography: emerging strategies for conserving crop biodiversity. Madison, Wisconsin:
American Society of Agronomy and Crop Science Society of America.
Grivet, D. & Petit, R. J. (2003). Chloroplast DNA phylogeography of the hornbeam in Europe:
evidence for a bottleneck at the outset of postglacial colonization. Conservation
Genetics, 4, 47-56.
Guarino, L., Jarvis, A., Hijmans, R. J. & Maxted, N. (2002). 36 Geographic Information
Systems (GIS) and the Conservation and Use of Plant Genetic Resources. Managing
plant genetic diversity.
Guisan, A., Edwards, T. C. & Hastie, T. (2002). Generalized linear and generalized additive
models in studies of species distributions: setting the scene. Ecological Modelling, 157,
89-100.
Guisan, A. & Thuiller, W. 2005. Predicting species distribution: offering more than simple
habitat models. Ecology Letters, 8, 993-1009.
Guisan, A. & Zimmermann, N. E. (2000). Predictive habitat distribution models in ecology.
Ecological Modelling, 135, 147-186.
Guillot, G. & Rousset, F. (2012). Dismantling the Mantel tests. Methods in Ecology and
Evolution, 4(4), 336-344.
Gustine, D. L., Voigt, P. W., Brummer, E. C. & Papadopoulos, Y. A. (2002). Genetic variation
of RAPD markers for North American white clover collections and cultivars. Crop
science, 42, 343-347.

175
Guthridge, K. M., Dupal, M. P., Kölliker, R., Jones, E. S., Smith, K. F. & Forster, J. W. (2001).
AFLP analysis of genetic diversity within and between populations of perennial
ryegrass (Lolium perenne L.). Euphytica, 122, 191-201.
Hajjar, R. & Hodgkin, T. (2007). The use of wild relatives in crop improvement: A survey of
developments over the last 20 years. Euphytica, 156, 1-13.
Halpin, P. N. (1997). Global climate change and natural-area protection: management
responses and research directions. Ecological Applications, 7, 828-843.
Hamilton, M. B. (1994). Ex situ conservation of wild plant species: time to reassess the genetic
assumptions and implications of seed banks. Conservation Biology, 8, 39-49.
Hampe, A. & Petit, R. J. (2005). Conserving biodiversity under climate change: the rear edge
matters. Ecology Letters, 8, 461-467.
Hamrick, J. L. & Godt, M. (1996). Effects of life history traits on genetic diversity in plant
species. Philosophical Transactions of the Royal Society B: Biological Sciences, 351,
1291-1298.
Hamrick, J. L. & Godt, M. W. (1990). Allozyme diversity in plant species. Plant population
genetics, breeding, and genetic resources., 43-63.
Hanley, J. A. & Mcneil, B. J. (1982). The meaning and use of the area under a receiver
operating characteristic (ROC) curve. Radiology, 143, 29-36.
Hanssen-Bauer, I., Drange, H., Førland, E. J., Roald, L. A., Børsheim, K. Y., Hisdal, H.,
Lawrence, D., Nesje, A., Sandven, S., Sorteberg, A., Sundby, S., Vasskog, K. &
Ådlandsvik, B. (2009). Klima i Norge 2100. Bakgrunnsmateriale til NOU
Klimatilplassing. Oslo: Norsk klimasenter.
Hargreaves, S., Maxted, N., Hirano, R., Abberton, M., Skã¸T, L. & Ford-Lloyd, B. 2010.
Islands as refugia of Trifolium repens genetic diversity. Conservation Genetics, 11,
1317-1326.
Harlan, J. R. (1975). Geographic patterns of variation in some cultivated plants. Journal of
Heredity, 66, 182-191.
Harlan, J. R. & De Wet, J. M. (1971). Towards a rational classification of cultivated plants.
Taxon, 509-517.
Hartl, D. L. & Clark, A. G. (1997). Principles of population genetics, Sinauer associates
Sunderland.
Heaton, H., Whitkus, R. & Gómez‐Pompa, A. (1999). Extreme ecological and phenotypic
differences in the tropical tree chicozapote (Manilkara zapota (L.) P. Royen) are not
matched by genetic divergence: a random amplified polymorphic DNA (RAPD)
analysis. Molecular Ecology, 8, 627-632.
176
Heikkinen, R. K., Luoto, M., Araújo, M. B., Virkkala, R., Thuiller, W. & Sykes, M. T. (2006).
Methods and uncertainties in bioclimatic envelope modelling under climate change.
Progress in Physical Geography, 30, 751-777.
Helgadóttir, Á., Østrem, L., Collins, R., Humphreys, M., Marshall, A., Julier, B., Gastal, F.,
Barre, P. & Louarn, G. (2016). Breeding Forages to Cope with Environmental
Challenges in the Light of Climate Change and Resource Limitations. Breeding in a
World of Scarcity. Springer.
Heller, N. E. & Zavaleta, E. S. (2009). Biodiversity management in the face of climate change:
a review of 22 years of recommendations. Biological Conservation, 142, 14-32.
Henningsson, S. S. & Alerstam, T. (2005). Patterns and determinants of shorebird species
richness in the circumpolar Arctic. Journal of Biogeography, 32, 383-396.
Hernandez, P. A., Graham, C. H., Master, L. L. & Albert, D. L. (2006). The effect of sample
size and species characteristics on performance of different species distribution
modeling methods. Ecography, 29, 773-785.
Herrmann, D., Boller, B., Widmer, F. & Kolliker, R. (2005). Optimization of bulked AFLP
analysis and its application for exploring diversity of natural and cultivated populations
of red clover. Genome, 48, 474-486.
Herrmann, D., Poncet, B. N., Manel, S., Rioux, D., Gielly, L., Taberlet, P. & Gugerli, F.
(2010). Selection criteria for scoring amplified fragment length polymorphisms
(AFLPs) positively affect the reliability of population genetic parameter estimates.
Genome, 53, 302-310.
Heywood, V. H. (2008). Challenges of in situ conservation of crop wild relatives. Turkish
journal of Botany, 32, 421-432.
Higgins, S. I., Lavorel, S. & Revilla, E. (2003). Estimating plant migration rates under habitat
loss and fragmentation. Oikos, 101, 354-366.
Hijmans, R. J., Cameron, S., Parra, J., Jones, P. G. & Jarvis, A. (2005). WorldClim, version
1.3. Berkeley: University of California.
Hijmans, R. J., Guarino, L. & Mathur, P. (2004). DIVA-GIS.Version 7.5.A geographic
information system for the analysis of species distribution data.
Hijmans, R. J. & Van Etten, J. (2014). raster: Geographic data analysis and modeling. R
package version, 2, 15.
Hoban, S. & Schlarbaum, S. (2014). Optimal sampling of seeds from plant populations for ex-
situ conservation of genetic biodiversity, considering realistic population structure.
Biological Conservation, 177, 90-99.

177
Hodgkin, T. & Guarino, L. (1997). Ecogeographical surveys: a review. Bocconea, 7, 21-26.
Hof, A. R., Jansson, R. & Nilsson, C. (2012). Future climate change will favour non-specialist
mammals in the (sub) arctic. PloS one, 7, e52574.
Hoisington, D., Khairallah, M., Reeves, T., Ribaut, J. M., Skovmand, B., Taba, S. &
Warburton, M. (1999). Plant genetic resources: what can they contribute toward
increased crop productivity? Proceedings of the National Academy of Sciences of the
United States of America, 96, 5937-5943.
Holland, B. R., Clarke, A. C. & Meudt, H. M. (2008). Optimizing automated AFLP scoring
parameters to improve phylogenetic resolution. Systematic Biology, 57, 347-366.
Hunter, D., Maxted, N., Heywood, V., Kell, S. & Borelli, T. (2012). Protected Areas and the
Challenge of Conserving Crop Wild Relatives. PARKS. The International Journal of
Protected Areas and Conservation, 18.1, 87.
Huntley, B., Collingham, Y. C., Willis, S. G. & Green, R. E. (2008). Potential impacts of
climatic change on European breeding birds. PloS one, 3, e1439.
IBM Corp, (2013). IBM SPSS statistics for windows. Armonk, NY: IBM Corp.
International Barley Genome Sequencing Consortium. (2012). A physical, genetic and
functional sequence assembly of the barley genome. Nature, 491, 711-716.
IPCC, (2014). Climate Change 2014: Synthesis Report, Contribution of Working Groups l, ll
and lll to the Fifth Assessment Report of the Intergovernmental Panel on Climate
Change. In: R.K. Pachauri & L. A. Meyer. eds., Geneva, Switzerland.
IPGRI, (1994). In situ conservation of crop and agroforestry species. Prepared for the CGIAR
Mid-Term Meeting, 23-26 May. New Dehli, India.
Iriondo, J. M., Fielder, H., Fitzgerald, H., Kell, S. P., Labokas, J., Magos Brehm, J., Negri, V.,
Phillips, J., Rubio Teso, M. L., Sensen, S., Taylor, N. & Maxted, N. (2016). National
Strategies for the Conservation of Crop Wild Relatives. In: Maxted, N., Dulloo, M. E.
& Ford-Loyd, B. V. eds., Enhancing Crop Genepool Use: Capturing Wild Relative and
Landrace Diversity for Crop Improvement. Wallingford, UK: CAB International.
Iriondo, J. M., Maxted, N. & Dulloo, E. (2008). Conserving Plant Genetic Diversity in
Protcted Areas: Population Management of Crop Wild Relatives, Wallingford, UK,
CAB International.
Iriondo, J. M., Maxted, N., Kell, S. P., Ford-Lloyd, B. V., Lara-Romano, C., Labokas, J. &
Magos Brehm, J. (2012). Quality standards for genetic reserve conservation of crop
wild relatives. In: Maxted, N., Dulloo, M. E., Ford-Lloyd, B. V., Frese, L., Iriondo, J.
M. & Pinheiro De Carvalho, M. A. A. eds., Agrobiodiversity conservation: securing the
diversity of crop wild relatives and landraces. Wallingford: CABI Publishing.

178
Isbell, F., Calcagno, V., Hector, A., Connolly, J., Harpole, W. S., Reich, P. B., Scherer-
Lorenzen, M., Schmid, B., Tilman, D. & Van Ruijven, J. (2011). High plant diversity is
needed to maintain ecosystem services. Nature, 477, 199-202.
IUCN, (2001). IUCN Red List Categories and Criteria: Version 3.1. Gland, Switzerland and
Cambridge, UK: IUCN Species Survival Commission. IUCN.
Jackson, L. E., Pascual, U. & Hodgkin, T. (2007). Utilizing and conserving agrobiodiversity in
agricultural landscapes. Agriculture, Ecosystems & Environment, 121, 196-210.
Jain, S. K. (1975). Genetic reserves. Crop genetic resources for today and tomorrow, 379-396.
Jaradat, A. A. (2015). Beyond Biodiversity: Ecosystem Services of Crop Wild Relatives. In:
Redden, R., Yadav, S. S., Maxted, N., Dulloo, M. E., Guarino, L. & Smith, P. eds.,
Crop Wild Relatives and Climate Change. Hoboken, NJ, USA: John Wiley & Sons.
Jarvis, A., Lane, A. & Hijmans, R. J. (2008). The effect of climate change on crop wild
relatives. Agriculture Ecosystems & Environment, 126, 13-23.
Jarvis, S., Fielder, H., Hopkins, J., Maxted, N. & Smart, S. (2015). Distribution of crop wild
relatives of conservation priority in the UK landscape. Biological Conservation, 191,
444-451.
Johns, M. A., Skroch, P. W., Nienhuis, J., Hinrichsen, P., Bascur, G. & Munoz-Schick, C.
(1997). Gene pool classification of common bean landraces from Chile based on RAPD
and morphological data. Crop Science, 37, 605-613.
Johnson, R. C., Kisha, T. J., Pecetti, L., Romani, M. & Richter, P. (2011). Characterization of
Poa supina from the Italian Alps with AFLP Markers and Correlation with Climatic
Variables. Crop Science, 51, 1627-1636.
Jones, H. P., Hole, D. G. & Zavaleta, E. S. (2012). Harnessing nature to help people adapt to
climate change. Nature Climate Change, 2, 504-509.
Jones, J. D., Witek, K., Verweij, W., Jupe, F., Cooke, D., Dorling, S., Tomlinson, L., Smoker,
M., Perkins, S. & Foster, S. (2014). Elevating crop disease resistance with cloned
genes. Philosophical transactions of the Royal Society of London.Series B, Biological
sciences, 369, 20130087.
Jump, A. S. & Penuelas, J. (2005). Running to stand still: adaptation and the response of plants
to rapid climate change. Ecology Letters, 8, 1010-1020.
Kell, S., Qin, H., Chen, B., Ford-Lloyd, B., Wei, W., Kang, D. & Maxted, N. (2015). China’s
crop wild relatives: Diversity for agriculture and food security. Agriculture, Ecosystems
& Environment, 209, 138-154.
Kell, S. P., Knüpffer, H., Jury, S. L., Ford-Lloyd, B. V. & Maxted, N. (2008). Crops and wild
relatives of the Euro-Mediterranean region: making and using a conservation catalogue.

179
In: Maxted, N., Ford-Lloyd, B. V., Kell, S. P., Iriondo, J., Dulloo, E. & Turok, J. eds.,
Crop Wild Relative Conservation and Use. Wallingford, UK: CAB International.
Kell, S. P., Maxted, N. & Bilz, M. (2011). 28 European Crop Wild Relative Threat
Assessment: Knowledge Gained and Lessons Learnt. Agrobiodiversity Conservation
Securing the Diversity of Crop Wild Relatives and Landraces, 218.
Kelly, A. E. & Goulden, M. L. (2008). Rapid shifts in plant distribution with recent climate
change. Proceedings of the National Academy of Sciences of the United States of
America, 105, 11823-11826.
Keyzer, M. A., Merbis, M. D., Pavel, I. & Van Wesenbeeck, C. F. A. (2005). Diet shifts
towards meat and the effects on cereal use: can we feed the animals in 2030?
Ecological Economics, 55, 187-202.
Khanlou, K. M., Vandepitte, K., Asl, L. K. & Bockstaele, E. V. (2011). Towards an optimal
sampling strategy for assessing genetic variation within and among white clover
(Trifolium repens L.) cultivars using AFLP. Genetics and molecular biology, 34, 252-
258.
Khoury, C. K., Bjorkman, A. D., Dempewolf, H., Ramirez-Villegas, J., Guarino, L., Jarvis, A.,
Rieseberg, L. H. & Struik, P. C. (2014). Increasing homogeneity in global food supplies
and the implications for food security. Proceedings of the National Academy of
Sciences, 111, 4001-4006.
Khoury, C. K., Greene, S., Wiersema, J., Maxted, N., Jarvis, A. & Struik, P. C. (2013). An
inventory of crop wild relatives of the United States. Crop Science, 53, 1496-1508.
Khoury, C. K., Heider, B., Castãeda-ÃLvarez, N. P., Achicanoy, H. A., Sosa, C. C., Miller, R.
E., Scotland, R. W., Wood, J. R. I., Rossel, G., Eserman, L. A., Jarret, R. L., Yencho,
G. C., Bernau, V., Juarez, H., Sotelo, S., De Haan, S. & Struik, P. C. (2015).
Distributions, ex situ conservation priorities, and genetic resource potential of crop wild
relatives of sweetpotato Ipomoea batatas (L.) Lam., I. series Batatas]. Frontiers in Plant
Science, 6, 251.
Kålås, J. A., Viken, A. & Bakken, T. (2006). Norwegian Red List, Norway, Artsdatabaken.
Kölliker, R., Herrmann, D., Boller, B. & Widmer, F. (2003). Swiss Mattenklee landraces, a
distinct and diverse genetic resource of red clover (Trifolium pratense L.). Theoretical
and Applied Genetics, 107, 306-315.
Kölliker, R., Jones, E., Jahufer, M. & Forster, J. (2001). Bulked AFLP analysis for the
assessment of genetic diversity in white clover (Trifolium repens L.). Euphytica, 121,
305-315.
Laikre, L., Allendorf, F. W., Aroner, L. C., Baker, C. S., Gregovich, D. P., Hansen, M. M.,
Jackson, J. A., Kendall, K. C., Mckelvey, K., Neel, M. C., Olivieri, I., Ryman, N.,
Schwartz, M. K., Bull, R. S., Stetz, J. B., Tallmon, D. A., Taylor, B. L., Vojta, C. D.,

180
Waller, D. M. & Waples, R. S. (2010). Neglect of Genetic Diversity in Implementation
of the Convention on Biological Diversity. Conservation Biology, 24, 86-88.
Lakew, B., Eglinton, J., Henry, R. J., Baum, M., Grando, S. & Ceccarelli, S. (2011). The
potential contribution of wild barley (Hordeum vulgare ssp. spontaneum) germplasm to
drought tolerance of cultivated barley (H. vulgare ssp. vulgare). Field Crops Research,
120, 161-168.
Landucci, F., Panella, L., Lucarini, D., Gigante, D., Donnini, D., Kell, S., Maxted, N.,
Venanzoni, R. & Negri, V. (2014). A prioritized inventory of crop wild relatives and
wild harvested plants of Italy. Crop Science, 54, 1628-1644.
Laribi, B., Zoghlami, N., Lamine, M., Kouki, K., Ghorbel, A. & Mougou, A. (2011). RAPD
based assessment of genetic diversity among annual caraway (Carum carvi)
populations. Eurasia J.Biosci, 5, 37-47.
Legendre, P & Fortin, M.J. (2010) Comparison of the Mantel test and alternative approaches
for detecting complex multivariate relationships in the spatial analysis of genetic data.
Molecular Ecology Research, 10, 831-844.
Legendre, P. & Legendre, L. (2012) Numerical Ecology, 3rd edition. Elsevier, Amsterdam,
pp990.
Legendre, P., Fortin, M. J. , Borcard, D. (2015) Should the Mantel test be used in spatial
analysis? Methods in Ecology and Evolution, 6, 1239-1247.
Lesica, P. & Allendorf, F. W. (1995). When are peripheral populations valuable for
conservation? Conservation Biology, 9, 753-760.
Li, D.-Z. & Pritchard, H. W. (2009). The science and economics of ex situ plant conservation.
Trends in plant science, 14, 614-621.
Lid, J. & Lid, D. T. (2005). Norsk flora, Oslo, Det Norske Samlaget.
Lindgaard, A. & Henriksen, S. (2011). Norwegian red list for ecosystems and habitat types
2011. Norwegian Biodiversity Information Centre, Trondheim.
Liu, C., Berry, P. M., Dawson, T. P. & Pearson, R. G. (2005). Selecting thresholds of
occurrence in the prediction of species distributions. Ecography, 28, 385-393.
Lobell, D. B. & Field, C. B. (2007). Global scale climate–crop yield relationships and the
impacts of recent warming. Environmental research letters, 2, 014002.
Lobell, D. B., Schlenker, W. & Costa-Roberts, J. 2011. Climate trends and global crop
production since 1980. Science (New York, N.Y.), 333, 616-620.
181
Lobo, J. M., Castro, I. & Moreno, J. C. (2001). Spatial and environmental determinants of
vascular plant species richness distribution in the Iberian Peninsula and Balearic
Islands. Biological Journal of the Linnean Society, 73, 233-253.
Loiselle, B. A., Jørgensen, P. M., Consiglio, T., Jiménez, I., Blake, J. G., Lohmann, L. G. &
Montiel, O. M. (2008). Predicting species distributions from herbarium collections:
does climate bias in collection sampling influence model outcomes? Journal of
Biogeography, 35, 105-116.
Lovejoy, T. E. (2005). Conservation with a changing climate. In: T.E. Lovejoy and L. Hannah.
eds., Climate change and Biodiversity. New Haven: Yale University Press.
Luikart, G., England, P. R., Tallmon, D., Jordan, S. & Taberlet, P. (2003). The power and
promise of population genomics: from genotyping to genome typing. Nature reviews
genetics, 4, 981-994.
Lynch, M. & Milligan, B. G. (1994). Analysis of population genetic structure with RAPD
markers. Molecular ecology, 3, 91-99.
Magos Brehm, J. (2009). Conservation of wild plant genetic resources in Portugal. PhD,
University of Birmingham.
Magos Brehm, J., Ford-Lloyd, B. V., Maxted, N. & Martins-Loução, M. A. (2012). Using
neutral genetic diversity to prioritise crop wild relative populations: a Portuguese
endemic case study for Dianthus cintranus Boiss. & Reut. subsp. barbatus R. Fern. &
Franco. In: Maxted, N., Dulloo, M. E., Ford-Lloyd, B. V., Frese, L., Iriondo, J. M. &
Pinheiro De Carvalho, M. A. A. eds., Agrobiodiversity conservation: securing the
diversity of crop wild relatives and landraces. Wallingford, UK: CAB International.
Magos Brehm, J., Maxted, N., Ford-Lloyd, B. V. & Martins-Loução, M. A. (2008). National
inventories of crop wild relatives and wild harvested plants: case-study for Portugal.
Genetic Resources and Crop Evolution, 55, 779-796.
Magos Brehm, J., Saifan, S., Taifour, H., Abu Laila, K., Al-Assaf, A., Al-Oqlah, A., Al-
Sheyab, F., Bani-Hani, R., Ghazanfar, S., Haddad, N., Shibli, R., Abu Taleb, T., Bint-
Ali, B. & Maxted, N. (2016). Crop wild relatives, a priority in Jordan? Developing a
national strategy for the conservation of plant diversity in Jordan using a participatory
approach. In: N. Maxted., M.E. Dulloo., & B. V. Ford-Loyd. eds., Enhancing Crop
Genepool Use: Capturing Wild Relative and Landrace Diversity for Crop Improvement.
Wallingford, UK: CAB International.
Maldonado, C., Molina, C. I., Zizka, A., Persson, C., Taylor, C. M., Albán, J., Chilquillo, E.,
Rønsted, N. & Antonelli, A. (2015). Estimating species diversity and distribution in the
era of Big Data: to what extent can we trust public databases? Global Ecology and
Biogeography, 24, 973-984.
182
Marfil, C. F., Hidalgo, V. & Masuelli, R. W. (2015). In situ conservation of wild potato
germplasm in Argentina: Example and possibilities. Global Ecology and Conservation,
3, 461-476.
Margules, C. R. 1(989). Introduction to some Australian developments in conservation
evaluation. Biological Conservation, 50, 1-11.
Marshall, D. R. & Brown, A. H. D. (1975). Optimum sampling strategies in genetic
conservation. In: O. Frankel, & J. Hawkes. eds., Crop Genetic Resources for Today and
Tomorrow. Cambridge, UK.: Cambridge University Press.
Marshall, D. R. & Brown, A. H. D. (1995). A basic sampling strategy: theory and practice. In:
Guarino, V. L., Rao, R. & Reid, R. (eds.) Collecting Plant Diversity: Technical
Guidelines. Rome: CAB International.
Martin, T. G. & Watson, J. E. M. (2016). Intact ecosystems provide best defence against
climate change. Nature Climate Change, 6, 122-124.
Maxted, N., Van Slageren, M. W. & Rihan, J. R. (1995). Ecogeographic surveys. In:
Ramanatha Rao, V. & Reid, R. (eds.) Collecting plant genetic diversity. Technical
guidelines. Wallingford, UK: CAB International.
Maxted, N., Ford-Loyd, B. V. & Hawkes, J. G. (1997a). Plant Genetic Conservation. The in
situ approach, London, Chapman and Hall.
Maxted, N., Hawkes, J. G., Guarino, L. & Sawkins, M. (1997b). Towards the selection of taxa
for plant genetic conservation. Genetic Resources and Crop Evolution, 44, 337-348.
Maxted, N., Guarino, L., Myer, L. & Chiwona, E. A. (2002). Towards a methodology for on-
farm conservation of plant genetic resources. Genetic Resources and Crop Evolution,
49, 31-46.
Maxted, N., Ford‐Lloyd, B. V., Jury, S. L., Kell, S. P. & Scholten, M. A. (2006). Towards a
definition of a crop wild relative. Biodiversity and Conservation, 8, 2673-2685.
Maxted, N. & Kell, S. P. (2008). Linking in situ and ex situ conservation with use of crop wild
relatives. In: Maxted, N., Ford-Lloyd, B. V., Kell, S. P., Iriondo, J. M., Dulloo, M. E. &
Turok, J. (eds.) Crop wild relative conservation and use. Wallingford: CABI
Publishing.
Maxted, N., Dulloo, E., Ford-Lloyd, B. V., Iriondo, J. M. & Jarvis, A. (2008a). Gap Analysis:
A tool for complementary genetic conservation assessment. Diversity and Distributions,
14, 1018-1030.
Maxted, N., Iriondo, J. M., Dulloo, M. E. & Lane, A. (2008b). The integration of PGR
conservation with protected area management. In: Iriondo, J. M., Maxted, N. & Dulloo,
M. E. (eds.) Conserving plant genetic diversity in protected areas. Wallingford: CAB
International.
183
Maxted, N. & Kell, S. P. (2009). Establishment of a Global Network for the In Situ
Conservation of Crop Wild Relatives: Status and Needs. Rome, Italy: Food and
Agriculture Organisation.
Maxted, N., Kell, S., Ford‐Lloyd, B., Dulloo, E. & Toledo, A. (2012). Towards the Systematic
Conservation of Global Crop Wild Relative Diversity. Crop Science, 52, 1-12.
Maxted, N., Magos Brehm, J. & Kell, S. (2013). Resource Book for Preparation of National
Plans of Crop Wild Relatives and Landraces, Rome, Italy, Food and Agriculture
Organization of the UN.
Maxted, N., Avagyan, A., Frese, L., Iriondo, J. M., Margos Brehm, J., Singer, A. & Kell, S. P.
(2015). Concept for in situ conservation of crop wild relatives of crop wild relatives in
Europe. Wild species conservation in genetic reserves working group, European
Cooperative Programme for Plant Genetic Resources. Rome, Italy.
Maxted, N., Amri, A., Castañeda-Álvarez, N. P., Dias, S., Dulloo, M. E., Fielder, H., Ford-
Lloyd, B. V., Iriondo, J. M., Brehm, J. M. & Nilsen, L. B. (2016). 10 Joining Up the
Dots: A Systematic Perspective of Crop Wild Relative Conservation and Use.
Enhancing Crop Genepool Use: Capturing Wild Relative and Landrace Diversity for
Crop Improvement, 87.
Maxwell, S. L., Fuller, R. A., Brooks, T. M. & Watson, J. E. (2016). Biodiversity: The ravages
of guns, nets and bulldozers. Nature, 536, 143-145.
Mccarthy, J. J., Canziani, O. F., Leary, N. A., Dokken, D. J. & White, K. S. (2001). Climate
Change 2001: Impacts, Adaptation, and Vulnerability, Contribution of Working Group
II to the Intergovernmental Panel on Climate Change Third Assessment Report.
Cambridge.
Mccouch, S., Baute, G. J., Bradeen, J., Bramel, P., Bretting, P. K., Buckler, E., Burke, J. M.,
Charest, D., Cloutier, S., Cole, G., Dempewolf, H., Dingkuhn, M., Feuillet, C., Gepts,
P., Grattapaglia, D., Guarino, L., Jackson, S., Knapp, S., Langridge, P., Lawton-Rauh,
A., Lijua, Q., Lusty, C., Michael, T., Myles, S., Naito, K., Nelson, R. L., Pontarollo, R.,
Richards, C. M., Rieseberg, L., Ross-Ibarra, J., Rounsley, S., Hamilton, R. S., Schurr,
U., Stein, N., Tomooka, N., Van, D. K., Van Tassel, D., Toll, J., Valls, J., Varshney, R.
K., Ward, J., Waugh, R., Wenzl, P. & Zamir, D. (2013). Agriculture: Feeding the
future. Nature, 499, 23-24.
Mckay, J. K. & Latta, R. G. (2002). Adaptive population divergence: markers, QTL and traits.
Trends in Ecology & Evolution, 17, 285-291.
Mcneilly, T. (1997). Patterns of population differentiation. Bocconea, 7, 89-93.
Meehl, G. A., Covey, C., Taylor, K. E., Delworth, T., Stouffer, R. J., Latif, M., Mcavaney, B.
& Mitchell, J. F. B. (2007). The WCRP CMIP3 multimodel dataset: A new era in
184
climate change research. Bulletin of the American Meteorological Society, 88, 1383-
1394.
Meilleur, B. A. & Hodgkin, T. (2004). In situ conservation of crop wild relatives: status and
trends. Biodiversity & Conservation, 13, 663-684.
Merow, C., Smith, M. J. & Silander, J. A. (2013). A practical guide to MaxEnt for modeling
species’ distributions: what it does, and why inputs and settings matter. Ecography, 36,
1058-1069.
Midgley, G. F., Hannah, L., Millar, D., Thuiller, W. & Booth, A. (2003). Developing regional
and species-level assessments of climate change impacts on biodiversity in the Cape
Floristic Region. Biological Conservation, 112, 87-97.
Millennium Ecosystem Assessment. (2005). Ecosystems and human well-being. Washington,
DC.
Moen, A. (1998). Nasjonalatlas for Norge: Vegetasjon, Hønefoss, Statens Kartverk.
Mokany, K., Harwood, T. D. & Ferrier, S. (2013). Comparing habitat configuration strategies
for retaining biodiversity under climate change. Journal of Applied Ecology, 50, 519-
527.
Moore, F. & Lobell, D. B. (2014). The Fingerprint of Climate Trends on European Crop
Yields. AGU Fall Meeting Abstracts, 0713.
Myers, N., Mittermeier, R. A., Mittermeier, C. G., Da Fonseca, G. A. & Kent, J. (2000).
Biodiversity hotspots for conservation priorities. Nature, 403, 853-858.
Müller, C. & Robertson, R. D. (2014). Projecting future crop productivity for global economic
modeling. Agricultural Economics, 45, 37-50.
Nabham, G. P. (2009). Where our food comes from. Retracing Nikolay Vavulov's quest to end
famine, Washington DC, Island Press.
Neel, M. C. & Cummings, M. P. 2003. Effectiveness of conservation targets in capturing
genetic diversity. Conservation Biology, 17, 219-229.
Nekola, J. C. 1999. Paleorefugia and neorefugia: the influence of colonization history on
community pattern and process. Ecology, 80, 2459-2473.
Nelson, D. R., Adger, W. N. & Brown, K. 2007. Adaptation to environmental change:
contributions of a resilience framework. Annual review of Environment and Resources,
32, 395.
Nenzén, H. K. & Araújo, M. B. 2011. Choice of threshold alters projections of species range
shifts under climate change. Ecological Modelling, 222, 3346-3354.

185
Nevo, E. 1998. Genetic diversity in wild cereals: regional and local studies and their bearing on
conservation ex situ and in situ. Genetic Resources and Crop Evolution, 45, 355-370.
NORDGEN, (2016). Crop wild relatives-actions needed to assure conservation of an important
genetic resources.
Nordic Gene Bank, (2006). Spice and Medicinal Plants in the Nordic and Baltic Countries.
Conservation of Genetic Resources. Alnarp.
Norwegian Environment Agency, (2015). RE: Norway. Available at
http://www.miljodirektoratet.no/en/Areas-of-activity1/Species-and-ecosystems/
[Accessed 6 April 2016]
Norwegian Environment Agency. (2016). Protected Areas. Available at
http://www.miljodirektoratet.no/en/Areas-of-activity1/Conservation-
Areas/Management-of-protected-areas/ [Accessed 6 April 2017]
Norwegian Environment Agency. (2017). Categories of protected areas [Online]. Available:
http://www.miljodirektoratet.no/en/Areas-of-activity1/Conservation-Areas/Categories-
of-protected-areas/ [Accessed 1 April 2017].
Norwegian Ministry For Agriculture And Food. (2008). Country Report on the State of Plant
Genetic Resources for Food and Agriculture in Norway. Rome, Italy: FAO.
Norwegian Ministry Of Agriculture And Food. (2015). Svalbard Global Seed Vault returns
seeds to Syrian Gene Bank. Available at:
https://www.regjeringen.no/en/aktuelt/svalbard-globale-frohvelv-returnerer-fro-til-
genbank-i-syria/id2457931/ [Accessed 6 April 2017]
Nuñez, T. A., Lawler, J. J., Mcrae, B. H., Pierce, D., Krosby, M. B., Kavanagh, D. M.,
Singleton, P. H. & Tewksbury, J. J. (2013). Connectivity planning to address climate
change. Conservation Biology, 27, 407-416.
Nybom, H. & Bartish, I. V. (2000). Effects of life history traits and sampling strategies on
genetic diversity estimates obtained with RAPD markers in plants. Perspectives in plant
ecology, evolution and systematics, 3, 93-114.
Nybø, S., Certain, G. & Skarpaas, O. (2011). The Norwegian Nature Index 2010. Oslo:
Directorate of Nature.
Olesen, J. E. & Bindi, M. (2002). Consequences of climate change for European agricultural
productivity, land use and policy. European Journal of Agronomy, 16, 239-262.
Pacifici, M., Foden, W. B., Visconti, P., Watson, J. E. M., Butchart, S. H. M., Kovacs, K. M.,
Scheffers, B. R., Hole, D. G., Martin, T. G. & Akçakaya, H. R. (2015). Assessing
species vulnerability to climate change. Nature Climate Change, 5, 215-224.
186
Panella, L., Landucci, S., Torricelli, R., Gigante, D., Donnini, D., Venanzoni, R. & Negri, V.
(2014). The national crop wild relative strategy for Italy: first steps to be taken. PGR
Secure.
Parmesan, C. & Yohe, G. (2003). A globally coherent fingerprint of climate change impacts
across natural systems. Nature, 421, 37-42.
Parra-Quijano, M., Iriondo, J. M. & Torres, E. (2011). Chapter 6: Strategies for the collecting
of wild species. In: L. Guarino, V., Rao, R. & Reid, R. eds., Collecting Plant Genetic
Diversity: Technical Guidlines-update. Wallingford: CAB International.
Parra-Quijano, M., Iriondo, J. M., Frese, L. & Torres, E. (2012a). Spatial and Ecogeographic
Approaches for Selecting Genetic Reserves in Europe. In: Maxted, N. & et al. eds.,
Agrobiodiversity Conservation: Securing the Diversity of Crop Wild Relatives and
Landraces. CABI International.
Parra-Quijano, M., Iriondo, J. M. & Torres, E. (2012b). Ecogeographical land characterization
maps as a tool for assessing plant adaptation and their implications in agrobiodiversity
studies. Genetic Resources and Crop Evolution, 59, 205-217.
Parra-Quijano, M., Iriondo, J. M. & Torres, E. (2012c). Improving representativeness of
genebank collections through species distribution models, gap analysis and
ecogeographical maps. Biodiversity and Conservation, 21, 79-96.
Parra-Quijano, M., López, F., Iriondo, J. M., Torres, E. & Molina, A. (2016). CAPFITOGEN
Tools User Manual Version 2.0. FAO, Rome: International Treaty on Plant Genetic
Resources for Food and Agriculture.
Parry, M., Rosenzweig, C. & Livermore, M. (2005). Climate change, global food supply and
risk of hunger. Philosophical transactions of the Royal Society of London.Series B,
Biological sciences, 360, 2125-2138.
Peakall, R. & Smouse, P. E. (2006). GENALEX 6: genetic analysis in Excel. Population
genetic software for teaching and research. Molecular ecology notes, 6, 288-295.
Peakall, R. & Smouse, P. E. (2012). GenAlEx 6.5: genetic analysis in Excel. Population genetic
software for teaching and research—an update. Bioinformatics, 28, 2537-2539.
Pearce, J. & Ferrier, S. (2000). Evaluating the predictive performance of habitat models
developed Using Logistic Regression. Ecological Modelling, 133, 225-245.
Pearman, P. B. (2001). Conservation value of independently evolving units: Sacred cow or
testable hypothesis? Conservation Biology, 15, 780-783.
Pecetti, L., Romani, M., De Rosa, L. & Piano, E. (2008). Selection of grazing-tolerant lucerne
cultivars. Grass and Forage Science, 63, 360-368.
187
Perrier, X., De Langhe, E., Donohue, M., Lentfer, C., Vrydaghs, L., Bakry, F., Carreel, F.,
Hippolyte, I., Horry, J. P., Jenny, C., Lebot, V., Risterucci, A. M., Tomekpe, K.,
Doutrelepont, H., Ball, T., Manwaring, J., De Maret, P. & Denham, T. (2011).
Multidisciplinary perspectives on banana (Musa spp.) domestication. Proceedings of
the National Academy of Sciences of the United States of America, 108, 11311-11318.
Peters, R. L. & Myers, J. P. (1991). Preserving biodiversity in a changing climate. Issues in
Science and Technology;(United States), 8.
Phillips, J., Kyratzis, A., Christoudoulou, C., Kell, S. & Maxted, N. (2014). Development of a
national crop wild relative conservation strategy for Cyprus. Genetic Resources and
Crop Evolution, 61, 817-827.
Phillips, J., Asdal, Å., Magos Brehm, J., Rasmussen, M. & Maxted, N. (2016). In situ and ex
situ diversity analysis of priority crop wild relatives in Norway. Diversity and
Distributions, 22, 1112-1126.
Phillips, J., Brehm, J. M., Van Oort, B., Asdal, Å., Rasmussen, M. & Maxted, N. (2017).
Climate change and national crop wild relative conservation planning. Ambio, 1-14.
Phillips, S. J., Dudík, M. & Schapire, R. E. (2004). A maximum entropy approach to species
distribution modeling. Proceedings of the twenty-first international conference on
Machine learning. ACM, 83.
Phillips, S. J., Anderson, R. P. & Schapire, R. E. (2006). Maximum entropy modeling of
species geographic distributions. Ecological Modelling, 190, 231-259.
Phillips, S. J. & Dudík, M. (2008). Modeling of species distributions with Maxent: new
extensions and a comprehensive evaluation. Ecography, 31, 161-175.
Pimentel, D., Wilson, C., Mccullum, C., Huang, R., Dwen, P., Flack, J., Tran, Q., Saltman, T.
& Cliff, D. (1997). Economic and environmental benefits of biodiversity. Bioscience,
47, 747-757.
Pinheiro De Carvalho, M. Â. A., Nóbrega, H., Freitas, G., Fontinha, S. & Frese, L. (2012).
Towards the establishment of a genetic reserve for Beta patula Aiton. In: Maxted, N.,
Dulloo, M. E., Ford-Lloyd, B. V., Frese, L., Iriondo, J. M. & Pinheiro De Carvalho, M.
A. A. eds., Agrobiodiversity Conservation: Securing the Diversity of Crop Wild
Relatives and Landraces. Wallingford, UK: CAB International.
Pittock, A. B. & Jones, R. N. 2000. Adaptation to what and why? Environmental monitoring
and assessment, 61, 9-35.
Pompanon, F., Bonin, A., Bellemain, E. & Taberlet, P. 2005. Genotyping errors: causes,
consequences and solutions. Nature Reviews Genetics, 6, 847-846.
Prather, M., Flato, G., Friedlingstein, P., Jones, C., Lamarque, J. F., Liao, H. & Rasch, P.
(2013). IPCC 2013: Annex II: Climate System Scenario Tables. In: Stocker, T. F.,
Quin, D., Plattner, G. K., Tignor, M., Allen, S. K., Boschung, J., Nauels, A., Xia, Y.,

188
Bex, V. & Midgley, P. M. (eds.) Climate Change 2013: The Physical Science Basis.
Contribution of Working Group I to the Fifth Assessment Report of the
Intergovernmental Panel on Climate Change. Cambridge, United Kingdom and New
York, NY, USA.: Cambridge University Press.
Prescott-Allen, R. & Prescott Allen, C. (1986). The first resource: Wild species in the North
American economy, New Haven, CT, Yale University.
PWC, (2013). Crop wild relatives: A valuable resource for crop development. Price
Waterhouse Cooper.
QIAGEN, (2012). DNeasy Plant Handbook. US: Qiagen.
Qualset, C., Mcguire, P. & Warburton, M. (1995). In California:‘Agrobiodiversity’key to
agricultural productivity. California agriculture, 49, 45-49.
Ramirez-Villegas, J., Cuesta, F., Devenish, C., Peralvo, M., Jarvis, A. & Arnillas, C. A. (2014).
Using species distributions models for designing conservation strategies of Tropical
Andean biodiversity under climate change. Journal for Nature Conservation, 22, 391-
404.
Ramirez-Villegas, J., Khoury, C., Jarvis, A., Debouck, D. G. & Guarino, L. (2010). A gap
analysis methodology for collecting crop genepools: A case study with phaseolus beans.
PLoS ONE, 5, e13497.
Rao, V. R. & Hodgkin, T. (2002). Genetic diversity and conservation and utilization of plant
genetic resources. Plant cell, tissue and organ culture, 68, 1-19.
Rebelo, A. G. (1994). Iterative selection procedures: centres of endemism and optimal
placement of reserves. In: B.J. Huntley., eds., Botanical Diversity in Southern Africa.
Pretoria: National Botanic Institute.
Reed, D. H. & Frankham, R. (2001). How closely correlated are molecular and quantitative
measures of genetic variation? a meta‐analysis. Evolution, 55, 1095-1103.
Reed, D. H. & Frankham, R. (2003). Correlation between fitness and genetic diversity.
Conservation Biology, 17, 230-237.
Richardson, B. A., Rehfeldt, G. E. & Kim, M. S. (2009). Congruent Climate‐Related
Genecological Responses from Molecular Markers and Quantitative Traits for Western
White Pine (Pinus monticola). International journal of plant sciences, 170, 1120-1131.
Rocchini, D., Hortal, J., Lengyel, S., Lobo, J. M., Jimenez-Valverde, A., Ricotta, C., Bacaro,
G. & Chiarucci, A. (2011). Accounting for uncertainty when mapping species
distributions: the need for maps of ignorance. Progress in Physical Geography, 35,
211-226.

189
Rogelj, J., Meinshausen, M. & Knutti, R. (2012). Global warming under old and new scenarios
using IPCC Climate Sensitivity Range Estimates. Nature Climate Change, 2, 248-253.
Rosenzweig, C., Iglesias, A., Yang, X. B., Epstein, P. R. & Chivian, E. (2001). Climate change
and extreme weather events; implications for food production, plant diseases, and pests.
Global change and human health, 2, 90-104.
Rosenzweig, C., Elliott, J., Deryng, D., Ruane, A. C., Muller, C., Arneth, A., Boote, K. J.,
Folberth, C., Glotter, M., Khabarov, N., Neumann, K., Piontek, F., Pugh, T. A.,
Schmid, E., Stehfest, E., Yang, H. & Jones, J. W. (2014). Assessing agricultural risks of
climate change in the 21st century in a global gridded crop model intercomparison.
Proceedings of the National Academy of Sciences of the United States of America, 111,
3268-3273.
Royal Society Of London, (2009). Reaping the Benefits: Science and the Sustainable
Intensification of Global Agriculture, London, Royal Society.
Rubio Teso, M. L., Iriondo, J. M., Parra, M. & Torres, E. (2013). National strategy for the
conservation of crop wild relatives of Spain. PGR Secure.
Ruete, A. (2015). Displaying bias in sampling effort of data accessed from biodiversity
databases using ignorance maps. Biodiversity Data Journal.
Scheldeman, X. & Van Zonneveld, M. (2010). Training Manual on Spatial Analysis of Plant
Diversity and Distribution. Rome, Italy: Bioversity International.
Scheldeman, X., Willemen, L., D’eeckenbrugge, G. C., Romeijn-Peeters, E., Restrepo, M. T.,
Motoche, J. R., Jiménez, D., Lobo, M., Medina, C. I. & Reyes, C. (2007). Distribution,
diversity and environmental adaptation of highland papayas (Vasconcellea spp.) in
tropical and subtropical America. Biodiversity and Conservation, 16, 1867-1884.
Schlötterer, C. (2004). The evolution of molecular markers—just a matter of fashion? Nature
Reviews Genetics, 5, 63-69.
Schoen, D. J. & Brown, A. H. 1993. Conservation of allelic richness in wild crop relatives is
aided by assessment of genetic markers. Proceedings of the National Academy of
Sciences of the United States of America, 90, 10623-10627.
Shiferaw, B., Prasanna, B. M., Hellin, J. & Bänziger, M. (2011). Crops that feed the world 6.
Past successes and future challenges to the role played by maize in global food security.
Food Security, 3, 307-327.
Singh, R. P., Hodson, D. P., Huerta-Espino, J., Jin, Y., Bhavani, S., Njau, P., Herrera-Foessel,
S., Singh, P. K., Singh, S. & Govindan, V. (2011). The emergence of Ug99 races of the
stem rust fungus is a threat to world wheat production. Annual review of
phytopathology, 49, 465-481.

190
Skøt, L., Humphreys, M. O., Armstead, I., Heywood, S., Skøt, K. P., Sanderson, R., Thomas, I.
D., Chorlton, K. H. & Hamilton, N. R. S. (2005). An association mapping approach to
identify flowering time genes in natural populations of Lolium perenne (L.). Molecular
Breeding, 15, 233-245.
Slatkin, M. & Takahata, N. (1985). The average frequency of private alleles in a partially
isolated population. Theoretical Population Biology, 28, 314-331.
Solomon, S. (2007). Climate change 2007-the physical science basis: Working group I
contribution to the fourth assessment report of the IPCC, Cambridge University Press.
Stafford Smith, M., Horrocks, L., Harvey, A. & Hamilton, C. (2011). Rethinking adaptation for
a 4 degrees C world. Philosophical transactions.Series A, Mathematical, physical, and
engineering sciences, 369, 196-216.
Norway Statistics. (2016). Area of land and freshwater. Available at:
https://www.ssb.no/en/natur-og-miljo/statistikker/arealdekke/aar/2017-03-06 [Accessed
6 April 2017]
Stuart, S. N. & Adams, R. J. (1990). Biodiversity in SubSaharan Africa and its Islands:
Conservation, Management and Sustainable Use. Gland, Switzerland: International
Union for Conservation of Nature and Natural resources.
Svalheim, E. & Asdal, Å. (2011). Conservation of Biodiversity and Genetic Resources in Semi-
Natural Grasslands in Norway. In: Maxted, N., Dulloo, E. M., Ford-Lloyd, B. V., Frese,
L., Iriondo, J. & Pinheiro De Carvalho, M. A. A. eds., Agrobiodiversity Conservation:
Securing the Diversity of Crop Wild Relatives and Landraces. Wallingford, UK: CAB
International.
Sánchez-Velásquez, L. R. (1991). Zea diploperennis: mejoramiento genético del maíz, ecología
y la conservación de recursos naturales. Tiempos de Ciencia, 24, 1-8.
Sætersdal, M., Birks, H. J. & Peglar, S. (1998). Predicting changes in Fennoscandian vascular‐
plant species richness as a result of future climatic change. Journal of Biogeography,
25, 111-112.
Tabachnick, B. G. & Fidell, L. S. (2001). Using Multivariate Statistics, Boston, Allyn and
Bacon.
Tanksley, S. D. & McCouch, S. R. (1997). Seed banks and molecular maps: unlocking genetic
potential from the wild. Science (New York, N.Y.), 277, 1063-1066.
Taylor, N. G., Holubec, V., Chobot, K., Parra-Quijano, M., Maxted, N. & Kell, S. (2013).
Systematic crop wild relative conservation planning for the Czech Republic. Crop wild
relative, 5.
R Core Team. (2012). r: A language and environment for statistical computing. Vienna,
Austria: R Foundation for Statistical Computing.
191
The Crop Trust. (2016). FAQ About the Seed Vault. Available at:
https://www.croptrust.org/our-work/svalbard-global-seed-vault/faq-about-the-vault/
[Accessed 6 April 2017]
Thomas, C. D., Cameron, A., Green, R. E., Bakkenes, M., Beaumont, L. J., Collingham, Y. C.,
Erasmus, B. F. N., De Siqueira, M. F., Grainger, A. & Hannah, L. (2004). Extinction
risk from climate change. Nature, 427, 145-148.
Thomas, C. D., Gillingham, P. K., Bradbury, R. B., Roy, D. B., Anderson, B. J., Baxter, J. M.,
Bourn, N. A., Crick, H. Q., Findon, R. A., Fox, R., Hodgson, J. A., Holt, A. R.,
Morecroft, M. D., O'hanlon, N. J., Oliver, T. H., Pearce-Higgins, J. W., Procter, D. A.,
Thomas, J. A., Walker, K. J., Walmsley, C. A., Wilson, R. J. & Hill, J. K. (2012).
Protected areas facilitate species' range expansions. Proceedings of the National
Academy of Sciences of the United States of America, 109, 14063-14068.
Thomson, L., Graudal, L. & Kjaer, E. (2001). Selection and management of in situ gene
conservation areas for target species. In: FAO, DFSC & IPGRI. eds., Forest genetic
resources conservation and management, in Managed natural forest and protected
areas. Rome, Italy: International Plant Genetic Resources Institute.
Thormann, I., Parra-Quijano, M., Endresen, D. T. F., Rubio-Teso, M. L., Iriondo, M. J. &
Maxted, N. (2014). Predictive characterization of crop wild relatives and landraces.
Rome, Italy: Bioversity International.
Thuiller, W., Lavorel, S., Araújo, M. B., Sykes, M. T. & Prentice, I. C. (2005). Climate change
threats to plant diversity in Europe. Proceedings of the National Academy of Sciences of
the United States of America, 102, 8245-8250.
Thuiller, W., Alberta, C., Araujo, M. B., Berry, P. M., Cabez, M., Guisane, A., Hicklerf, T.,
Midgleyg, G. F., Paterson, J., Schurrh, F. M., Sykes, M. T. & Zimmerman, N. E.
(2008). Predicting global change impacts on plant species' distributions: Future
challenges. Perspectives in Plant Ecology, Evolution and Systematics, 9, 137-152.
Tigerstedt, P. (1994). Adaptation, variation and selection in marginal areas. Breeding Fodder
Crops for Marginal Conditions. Springer.
Tømmervik, H., Johansen, B., Tombre, I., Thannheiser, D., Høgda, K. A., Gaare, E. &
Wielgolaski, F. E. (2004). Vegetation changes in the Nordic mountain birch forest: the
influence of grazing and climate change. Arctic, Antarctic, and Alpine Research, 36,
323-332.
Uleberg, E., Hanssen-Bauer, I., Van Oort, B. & Dalmannsdottir, S. (2014). Impact of climate
change on agriculture in Northern Norway and potential strategies for adaptation.
Climatic Change, 122, 27-39.
192
Ulloa, O., Ortega, F. & Campos, H. (2003). Analysis of genetic diversity in red clover
(Trifolium pratense L.) breeding populations as revealed by RAPD genetic markers.
Genome, 46, 529-535.
UN, (1992). The Convention on Biological Diversity. United Nations.
UN, (2005). Investing in Development: A Practical Plan to Achieve the Millennium
Development Goals. New York: EarthScan.
UN, (2012). Global Strategy for Plant Conservation: The targets: 2011-2020. Montreal,
Canada: Secretariat of the Convention on Biological Diversity.
UN, (2015a). Sustainable Development Knowledge Platform. Available at:
https://sustainabledevelopment.un.org/ [Accessed 6 April 2017]
UN, (2015b). World Population Prospects: The 2015 Revision, Key Findings and Advance
Tables. Working Paper No. ESA/P/WP.241.
UNEP-WCMC and IUCN (2015), Protected Planet: The World Databse on Protected Areas
(WDPA) [On-line], Cambridge, UK: UNEP-WCMC and IUCN. Available at:
www.protectedplanet.net
UNFCCC, (2015). Synthesis Report on the Aggregate Effect of the Intended Nationally
Determined Contributions. Paris: United Nations.
UNFCCC, (2016). Report of the Conference of the Parties on its twenty-first session, held in
Paris from 30 November to 13 December 2015. Paris: United Nations.
Valland, N. (2014). RE: Ten million species observations in Norway. Available at:
http://artsdatabanken.no/Pages/166304 [Accessed 6 April 2017]
Van De Wouw, M., Kik, C., Van Hintum, T., Van Treuren, R. & Visser, B. (2009). Genetic
erosion in crops: concept, research results and challenges. Plant Genetic Resources:
Characterization and Utilization, 1, 1-15.
Van Hintum, T. J. L., Sackville Hamilton, N. R., Engels, J. M. M. & Van Treuren, R. (2002).
Accession Management Strategies: Splitting and Lumping. In: Engels, J. M. M.,
Ramanatha Rao, V., Brown, A. H. D. & Jackson, M. T. eds., Managing Plant Genetic
Diversity. IPGRI.
Van Treuren, R., Bas, N., Goossens, P., Jansen, J. & Van Soest, L. (2005). Genetic diversity in
perennial ryegrass and white clover among old Dutch grasslands as compared to
cultivars and nature reserves. Molecular Ecology, 14, 39-52.
Van Vuuren, D. P., Edmonds, J., Kainuma, M., Riahi, K., Thomson, A., Hibbard, K., Hurtt, G.
C., Kram, T., Krey, V. & Lamarque, J.F. (2011). The representative concentration
pathways: an overview. Climatic Change, 109, 5-31.

193
Van Zonneveld, M., Koskela, J., Vinceti, B. & Jarvis, A. (2009). Impact of climate change on
the distribution of tropical pines in Southeast Asia. Unasylva 60, 24-28.
Vavilov, N. I. (1949). The origin, variation, immunity and breeding of cultivated plants.
Chronika Botanica, 13, 1-54.
Vekemans, X., Beauwens, T., Lemaire, M. & Roldán‐Ruiz, I. (2002). Data from amplified
fragment length polymorphism (AFLP) markers show indication of size homoplasy and
of a relationship between degree of homoplasy and fragment size. Molecular ecology,
11, 139-151.
Vincent, H., Wiersema, J., Dobbie, S., Kell, S. P., Fielder, H., Castañeda Alvarez, N. P.,
Guarino, L., Eastwood, R., Leόn, B. & Maxted, N. (2013). A prioritised crop wild
relative inventory as a first step to help underpin global food security. Biological
Conservation, 167, 265-275.
Volden, B., Sveistrup, T. E., Jørgensen, M. & Haraldsen, T. K. 2002. Effects of traffic and
fertilization levels on grass yields in northern Norway.
Von Humboldt, A. & Bonpland, A. (1807). Essai sur la geographie des plantes. Paris.
Vos, P., Hogers, R., Bleeker, M., Reijans, M., Van De Lee, T., Hornes, M., Frijters, A., Pot, J.,
Peleman, J. & Kuiper, M. (1995). AFLP: a new technique for DNA fingerprinting.
Nucleic acids research, 23, 4407-4414.
Walker, B., Holling, C. S., Carpenter, S. R. & Kinzig, A. (2004). Resilience, adaptability and
transformability in social--ecological systems. Ecology and Society, 9, 5.
Wang, X., Wang, H., Wang, J., Sun, R., Wu, J., Liu, S., Bai, Y., Mun, J.-H., Bancroft, I. &
Cheng, F. (2011). The genome of the mesopolyploid crop species Brassica rapa. Nature
genetics, 43, 1035-1039.
Warren, R., Vanderwal, J., Price, J., Welbergen, J. A., Atkinson, I., Ramirez-Villegas, J.,
Osborn, T. J., Jarvis, A., Shoo, L. P. & Williams, S. E. (2013). Quantifying the benefit
of early climate change mitigation in avoiding biodiversity loss. Nature Climate
Change, 3, 678-682.
Watson-Jones, S. J., Maxted, N. & Ford-Loyd, B. V. (2006). Population baseline data for
monitoring genetic diversity loss for 2010: A case study for Brassica species in the UK.
Biological Conservation, 490-499.
Wedderburn, M., Barker, D. J., Chapman, D., Orr, S. & Dymock, N. (2005). Genetic
differentiation in white clover (Trifolium repens) populations during 8 years of
contrasting phosphorus supply in New Zealand hill country. New Zealand Journal of
Agricultural Research, 48, 63-74.
194
Weibull, J., Fitzgerald, H., Lund, B., Palme, A. & Porbjornsson, H. (2016). Conservation and
sustainable use of crop wild relatives: a Nordic initiative. Sveriges Utsadesforenings
Tidskrift, 53-58.
Williams, W. M. (1987). Genetics and breeding. In: Baker, M. J. & Williams, W. M. eds.,
White Clover. Wallingford, Oxon: CAB International.
Wisz, M. S., Hijmans, R., Li, J., Peterson, A. T., Graham, C. & Guisan, A. (2008). Effects of
sample size on the performance of species distribution models. Diversity and
Distributions, 14, 763-773.
Woodward, F. I. & Williams, B. G. (1987). Climate and plant distribution at global and local
scales. Vegetatio, 69, 189-197.
World Bank. (2008). World Development Report 2008: Agriculture for Development.
Washington, DC: World Bank. Available at:
https://siteresources.worldbank.org/INTWDR2008/Resources/WDR_00_book.pdf
[Accessed 6 April 2017]
World Food Prize. (2016). About Norman Borlaug. Available at:
https://www.worldfoodprize.org/en/dr_norman_e_borlaug/dr_borlaug__the_world_foo
d_prize/ [Accessed 6 April 2017]
Zapata, V. M. & Robledano, F. (2014). Assessing biodiversity and conservation value of forest
patches secondarily fragmented by urbanisation in semiarid southeastern Spain. Journal
for Nature Conservation, 22, 166-175.
Zhang, H. & Hare, M. P. (2012). Identifying and reducing AFLP genotyping error: an example
of tradeoffs when comparing population structure in broadcast spawning versus
brooding oysters. Heredity, 108, 616-625.
Zhivotovsky, L. A. (1999). Estimating population structure in diploids with multilocus
dominant DNA markers. Molecular ecology, 8, 907-913.